Investor Relations Contacts: | | Analyst Coverage: | | Analyst Coverage: |
| | | | |
Daniel R. Sink, Chief Financial Officer
Kite Realty Group Trust
30 South Meridian Street, Suite 1100
Indianapolis, IN 46204
(317) 577-5609
dsink@kiterealty.com
Financial Relations Board
Mr. John Waelti
(312) 640-6760
jwaelti@financialrelationsboard.com
Transfer Agent:
LaSalle Bank, National Association
135 South LaSalle Street
Chicago, IL 60603-3499
(312) 904-2000
Stock Specialist:
Van der Moolen Specialists USA, LLC
45 Broadway
32nd Floor
New York, NY 10006
(646) 576-2707 | | Cantor Fitzgerald
Mr. Philip J. Martin
(312) 469-7485
pmartin@cantor.com
Goldman, Sachs & Co.
Mr. Dennis Maloney
(212) 902-4351
dennis.maloney@gs.com
Harris Nesbitt
Mr. Paul E. Adornato, CFA
(212) 885-4170
paul.adornato@harrisnesbitt.com
Lehman Brothers
Mr. David Harris
(212) 526-1790
dharris4@lehman.com
Raymond James
Mr. Paul Puryear
(727) 567-2253
paul.puryear@raymondjames.com | | RBC Capital Markets
Mr. Rich Moore
(216) 378-7625
rich.moore@rbccm.com
Stifel, Nicholas & Company, Inc.
Mr. David M. Fick, CPA
(410) 454-5018
dmfick@stifel.com
Wachovia Securities
Mr. Jeffrey J. Donnelly, CFA
(617) 603-4262
jeff.donnelly@wachovia.com |

IMPORTANT NOTES
Interim Information
This Quarterly Financial Supplement contains historical information of Kite Realty Group Trust (the “Company” or “KRG”) and is intended to supplement the Company’s Quarterly Report on Form 10-Q for the quarter ended June 30, 2006, which should be read in conjunction with this package. The supplemental information is unaudited, although it reflects all adjustments which, in the opinion of management, are necessary for a fair presentation of operating results for the interim periods.
Forward-Looking Statements
This supplemental information package contains certain forward-looking statements within the meaning of Section 27A of the Securities Act of 1933 and Section 21E of the Securities Exchange Act of 1934. Such statements are based on assumptions and expectations that may not be realized and are inherently subject to risks, uncertainties and other factors, many of which cannot be predicted with accuracy and some of which might not even be anticipated. Future events and actual results, performance, transactions or achievements, financial or otherwise, may differ materially from the results, performance, transactions or achievements expressed or implied by the forward-looking statements. Risks, uncertainties and other factors that might cause such differences, some of which could be material, include, but are not limited to:
• | national and local economic, business, real estate and other market conditions; |
• | the ability of tenants to pay rent; |
• | the competitive environment in which the Company operates; |
• | financing risks; |
• | property ownership and management risks; |
• | the level and volatility of interest rates; |
• | financial stability of tenants; |
• | the Company’s ability to maintain its status as a REIT for federal income tax purposes; |
• | acquisition, disposition, development and joint venture risks; |
• | potential environmental and other liabilities; |
• | other factors affecting the real estate industry generally; and |
• | other risks identified in reports the Company files with the Securities and Exchange Commission (the “SEC”) or in other documents that it publicly disseminates, including, in particular, the section titled “Risk Factors” in our Annual Report on Form 10-K for the fiscal year ended December 31, 2005, and in our quarterly reports on Form 10-Q. |
The Company undertakes no obligation to publicly update or revise these forward-looking statements, whether as a result of new information, future events or otherwise.
Funds From Operations
Funds from Operations (“FFO”) is a widely used performance measure for real estate companies and is provided here as a supplemental measure of operating performance. We calculate FFO in accordance with the best practices described in the April 2002 National Policy Bulletin of the National Association of Real Estate Investment Trusts (NAREIT), which we refer to as the White Paper. The White Paper defines FFO as net income (determined in accordance with generally accepted accounting principles (“GAAP”)), excluding gains (or losses) from sales of property, plus depreciation and amortization, and after adjustments for unconsolidated partnerships and joint ventures.
Given the nature of our business as a real estate owner and operator, we believe that FFO is helpful to investors in measuring our operational performance because it excludes various items included in net income that do not relate to or are not indicative of our operating performance, such as gains (or losses) from sales of property and depreciation and amortization, which can make periodic and peer analyses of operating performance more difficult. FFO should not be considered as an alternative to net income (determined in accordance with GAAP) as an indicator of our financial performance, is not an alternative to cash flow from operating activities (determined in accordance with GAAP) as a measure of our liquidity, and is not indicative of funds available to satisfy our cash needs, including our ability to make distributions. Our computation of FFO may not be comparable to FFO reported by other REITs that do not define the term in accordance with the current NAREIT definition or that interpret the current NAREIT definition differently than we do.
Net Operating Income
Net operating income (“NOI”) is provided here as a supplemental measure of operating performance. NOI is defined as property revenues less property operating expenses, excluding depreciation and amortization, interest expense and other items. We believe this presentation of NOI is helpful to investors as a measure of our operational performance because it is widely used in the real estate industry to measure the performance of real estate assets without regard to various items, included in net income, that do not relate to or are not indicative of operating performance, such as depreciation and amortization, which can vary depending upon accounting methods and book value of assets. We also believe NOI helps our investors to meaningfully compare the results of our operating performance from period to period by removing the impact of our capital structure (primarily interest expense on our outstanding indebtedness) and depreciation of our basis in our assets from our operating results. NOI should not, however, be considered as an alternative to net income (determined in accordance with GAAP) as an indicator of our financial performance.
| |
|
p. 5 | Kite Realty Group Supplemental Financial and Operating Statistics – 6/30/06 |
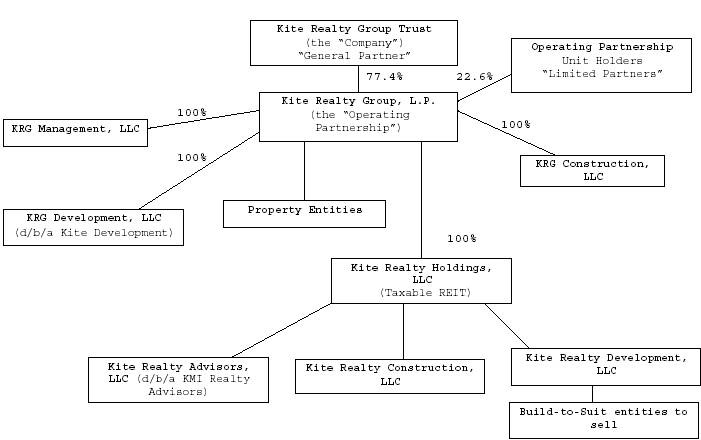
CORPORATE STRUCTURE CHART – JUNE 30, 2006
|
p. 6 | Kite Realty Group Supplemental Financial and Operating Statistics – 6/30/06 |
CONDENSED CONSOLIDATED BALANCE SHEETS (UNAUDITED)
| | June 30, 2006 | | December 31, 2005 | |
| |
|
| |
|
| |
Assets: | | | | | | | |
Investment properties, at cost: | | | | | | | |
Land | | $ | 169,513,693 | | $ | 172,509,684 | |
Land held for development | | | 61,341,811 | | | 51,340,820 | |
Buildings and improvements | | | 481,030,140 | | | 485,129,649 | |
Furniture, equipment and other | | | 5,426,138 | | | 5,675,980 | |
Construction in progress and other | | | 120,753,907 | | | 65,903,868 | |
| |
|
| |
|
| |
| | | 838,065,689 | | | 780,560,001 | |
Less: accumulated depreciation | | | (52,455,552 | ) | | (41,825,911 | ) |
| |
|
| |
|
| |
| | | 785,610,137 | | | 738,734,090 | |
Cash and cash equivalents | | | 10,750,083 | | | 15,208,835 | |
Tenant receivables, including accrued straight-line rent, net of allowance for bad debts | | | 14,898,601 | | | 11,302,923 | |
Other receivables | | | 13,961,902 | | | 6,082,511 | |
Investments in unconsolidated entities, at equity | | | 1,164,978 | | | 1,303,919 | |
Escrow deposits | | | 7,706,098 | | | 6,718,198 | |
Other assets | | | 23,424,530 | | | 19,879,330 | |
| |
|
| |
|
| |
Total Assets | | $ | 857,516,329 | | $ | 799,229,806 | |
| |
|
| |
|
| |
Liabilities and Shareholders’ Equity: | | | | | | | |
Mortgage and other indebtedness | | $ | 439,156,807 | | $ | 375,245,837 | |
Accounts payable and accrued expenses | | | 32,702,300 | | | 30,642,822 | |
Deferred revenue and accured liabilities | | | 27,109,721 | | | 25,369,152 | |
Minority interest | | | 4,431,111 | | | 4,847,801 | |
| |
|
| |
|
| |
Total Liabilities | | | 503,399,939 | | | 436,105,612 | |
Commitments and Contingencies | | | | | | | |
Limited Partners’ interests in operating partnership | | | 79,977,187 | | | 84,244,814 | |
Shareholders’ Equity: | | | | | | | |
Preferred shares, $.01 par value, 40,000,000 shares authorized, no shares issued and outstanding | | | — | | | — | |
Common shares, $.01 par value, 200,000,000 shares authorized, 28,808,483 shares and 28,555,187 shares issued and outstanding, respectively | | | 288,085 | | | 285,552 | |
Additional paid in capital | | | 290,623,080 | | | 288,976,563 | |
Unearned compensation | | | — | | | (808,015 | ) |
Accumulated other comprehensive income | | | 677,878 | | | 427,057 | |
Accumulated deficit | | | (17,449,840 | ) | | (10,001,777 | ) |
| |
|
| |
|
| |
Total shareholders’ equity | | | 274,139,203 | | | 278,879,380 | |
| |
|
| |
|
| |
Total Liabilities and Shareholders’ Equity | | $ | 857,516,329 | | $ | 799,229,806 | |
| |
|
| |
|
| |
|
p. 7 | Kite Realty Group Supplemental Financial and Operating Statistics – 6/30/06 |
CONSOLIDATED STATEMENTS OF OPERATIONS – T HREE AND SIX MONTHS (UNAUDITED)
| | Three Months Ended June 30, | | Six Months Ended June 30, | |
| |
|
|
|
|
| |
|
|
|
|
| |
| | 2006 | | 2005 | | 2006 | | 2005 | |
| |
|
| |
|
| |
|
| |
|
| |
Revenue: | | | | | | | | | | | | | |
Minimum rent | | $ | 16,509,839 | | $ | 13,346,462 | | $ | 32,244,511 | | $ | 25,877,090 | |
Tenant reimbursements | | | 4,417,611 | | | 2,871,856 | | | 8,113,484 | | | 5,495,044 | |
Other property related revenue | | | 944,966 | | | 407,589 | | | 1,996,667 | | | 1,356,089 | |
Construction and service fee revenue | | | 9,036,996 | | | 5,590,667 | | | 16,933,932 | | | 8,679,643 | |
Other income, net | | | 31,312 | | | 79,894 | | | 85,188 | | | 92,458 | |
| |
|
| |
|
| |
|
| |
|
| |
Total revenue | | $ | 30,940,724 | | $ | 22,296,468 | | $ | 59,373,782 | | $ | 41,500,324 | |
Expenses: | | | | | | | | | | | | | |
Property operating | | | 3,274,984 | | | 2,451,267 | | | 6,309,158 | | | 5,179,357 | |
Real estate taxes | | | 3,122,720 | | | 1,874,849 | | | 5,629,634 | | | 3,373,230 | |
Cost of construction and services | | | 7,899,325 | | | 4,390,955 | | | 15,084,689 | | | 7,299,339 | |
General, administrative, and other | | | 1,601,176 | | | 1,277,102 | | | 2,944,713 | | | 2,509,371 | |
Depreciation and amortization | | | 7,842,914 | | | 5,356,577 | | | 15,365,149 | | | 10,175,910 | |
| |
|
| |
|
| |
|
| |
|
| |
Total expenses | | $ | 23,741,119 | | $ | 15,350,750 | | $ | 45,333,343 | | $ | 28,537,207 | |
| |
|
| |
|
| |
|
| |
|
| |
Operating income | | $ | 7,199,605 | | $ | 6,945,718 | | $ | 14,040,439 | | $ | 12,963,117 | |
Interest expense | | | (4,615,175 | ) | | (4,742,869 | ) | | (9,185,167 | ) | | (8,501,303 | ) |
Loss on sale of asset | | | (764,008 | ) | | — | | | (764,008 | ) | | — | |
Income tax benefit of taxable REIT subsidiary | | | 150,303 | | | — | | | 137,016 | | | — | |
Minority interest in income of consolidated subsidiaries | | | (37,986 | ) | | (51,930 | ) | | (75,510 | ) | | (92,949 | ) |
Equity in earnings of unconsolidated entities | | | 61,749 | | | 126,556 | | | 149,722 | | | 202,351 | |
Limited Partners’ interests in the continuing operations of the Operating Partnership | | | (454,117 | ) | | (701,701 | ) | | (989,574 | ) | | (1,394,377 | ) |
| |
|
| |
|
| |
|
| |
|
| |
Income from continuing operations | | $ | 1,540,371 | | $ | 1,575,774 | | $ | 3,312,918 | | $ | 3,176,839 | |
Discontinued operations, net of Limited Partners’ interests | | | — | | | 175,166 | | | — | | | 388,760 | |
| |
|
| |
|
| |
|
| |
|
| |
Net income | | $ | 1,540,371 | | $ | 1,750,939 | | $ | 3,312,918 | | $ | 3,565,599 | |
| |
|
| |
|
| |
|
| |
|
| |
Income per common share – basic: | | | | | | | | | | | | | |
Continuing operations | | $ | 0.05 | | $ | 0.08 | | $ | 0.12 | | $ | 0.17 | |
Discontinued operations | | | — | | | 0.01 | | | — | | | 0.02 | |
| |
|
| |
|
| |
|
| |
|
| |
| | $ | 0.05 | | $ | 0.09 | | $ | 0.12 | | $ | 0.19 | |
| |
|
| |
|
| |
|
| |
|
| |
Income per common share - diluted: | | | | | | | | | | | | | |
Continuing operations | | $ | 0.05 | | $ | 0.08 | | $ | 0.12 | | $ | 0.17 | |
Discontinued operations | | | — | | | 0.01 | | | — | | | 0.02 | |
| |
|
| |
|
| |
|
| |
|
| |
| | $ | 0.05 | | $ | 0.09 | | $ | 0.12 | | $ | 0.19 | |
| |
|
| |
|
| |
|
| |
|
| |
Weighted average common shares outstanding - basic | | | 28,690,680 | | | 19,148,267 | | | 28,631,389 | | | 19,148,267 | |
| |
|
| |
|
| |
|
| |
|
| |
Weighted average common shares outstanding - diluted | | | 28,802,913 | | | 19,262,581 | | | 28,753,591 | | | 19,262,822 | |
| |
|
| |
|
| |
|
| |
|
| |
Dividends declared per common share | | $ | 0.1875 | | $ | 0.1875 | | $ | 0.3750 | | $ | 0.3750 | |
| |
|
| |
|
| |
|
| |
|
| |
|
p. 8 | Kite Realty Group Supplemental Financial and Operating Statistics – 6/30/06 |
FUNDS FROM OPERATIONS AND OTHER FINANCIAL INFORMATION – THREE AND SIX MONTHS
| | Three Months Ended June 30, | | Six Months Ended June 30, | |
| |
|
|
|
|
| |
|
|
|
|
| |
| | 2006 | | 2005 | | 2006 | | 2005 | |
| |
|
| |
|
| |
|
| |
|
| |
Funds From Operations: | | | | | | | | | | | | | |
Net income | | $ | 1,540,371 | | $ | 1,750,939 | | $ | 3,312,918 | | $ | 3,565,599 | |
Add: loss on sale of asset, net of tax | | | 458,405 | | | — | | | 458,405 | | | — | |
Add Limited Partners’ interests in income | | | 454,117 | | | 779,669 | | | 989,574 | | | 1,564,759 | |
Add depreciation and amortization of consolidated entities and discontinued operations, net of minority interest | | | 7,750,309 | | | 5,450,335 | | | 15,179,002 | | | 10,364,038 | |
Add depreciation and amortization of unconsolidated entities | | | 99,651 | | | 79,465 | | | 201,670 | | | 148,631 | |
| |
|
| |
|
| |
|
| |
|
| |
Funds From Operations of the Kite Portfolio1 | | | 10,302,853 | | | 8,060,408 | | | 20,141,569 | | | 15,643,027 | |
Less Limited Partners’ interests in FFO | | | (2,351,423 | ) | | (2,474,545 | ) | | (4,623,375 | ) | | (4,771,123 | ) |
| |
|
| |
|
| |
|
| |
|
| |
Funds From Operations allocable to the Company1 | | $ | 7,951,430 | | $ | 5,585,863 | | $ | 15,518,194 | | $ | 10,871,904 | |
| |
|
| |
|
| |
|
| |
|
| |
Basic FFO per share of the Kite Portfolio | | $ | 0.28 | | $ | 0.29 | | $ | 0.54 | | $ | 0.57 | |
| |
|
| |
|
| |
|
| |
|
| |
Diluted FFO per share of the Kite Portfolio | | $ | 0.28 | | $ | 0.29 | | $ | 0.54 | | $ | 0.57 | |
| |
|
| |
|
| |
|
| |
|
| |
Basic weighted average common shares outstanding | | | 28,690,680 | | | 19,148,267 | | | 28,631,389 | | | 19,148,267 | |
| |
|
| |
|
| |
|
| |
|
| |
Diluted weighted average common shares outstanding | | | 28,802,913 | | | 19,262,581 | | | 28,753,591 | | | 19,262,822 | |
| |
|
| |
|
| |
|
| |
|
| |
Basic weighted average common shares and units outstanding | | | 37,205,848 | | | 27,644,198 | | | 37,198,019 | | | 27,538,947 | |
| |
|
| |
|
| |
|
| |
|
| |
Diluted weighted average common shares and units outstanding | | | 37,318,081 | | | 27,758,512 | | | 37,320,221 | | | 27,653,503 | |
| |
|
| |
|
| |
|
| |
|
| |
Other Financial Information: | | | | | | | | | | | | | |
Recurring capital expenditures2 | | | | | | | | | | | | | |
Tenant improvements | | $ | 62,115 | | $ | 162,672 | | $ | 1,171,615 | 3 | $ | 162,672 | |
Leasing commissions | | | 249,747 | | | 14,627 | | | 523,596 | 4 | | 51,304 | |
Capital improvements | | | 37,719 | | | 339,072 | | | 57,426 | | | 346,157 | |
Scheduled debt principal payments | | | 596,007 | | | 658,244 | | | 1,227,281 | | | 1,277,003 | |
Straight line rent | | | 536,219 | | | 214,004 | | | 958,522 | | | 538,869 | |
Market rent amortization income from acquired leases | | | 1,241,775 | | | 863,459 | | | 2,119,611 | | | 1,801,488 | |
Market debt adjustment | | | 107,714 | | | 359,387 | | | 215,428 | | | 718,773 | |
Capitalized interest | | | 2,346,271 | | | 797,220 | | | 3,741,917 | | | 1,177,418 | |
|
1 | “Funds From Operations of the Kite Portfolio” represents 100% of the operating performance of the Operating Partnership’s real estate properties and construction and service subsidiaries in which the Company owns an interest. “Funds From Operations allocable to the Company” reflects a reduction for the Limited Partners’ diluted weighted average interests in the Operating Partnership. |
2 | Excludes tenant improvements and leasing commissions relating to development projects and first generation space. |
3 | Of this amount, $988,153 represents tenant improvements for Shoe Pavilion at Galleria Plaza and 24 Hour Fitness at Cedar Hill Village. |
4 | Of this amount, $198,404 represents leasing commissions for Shoe Pavilion at Galleria Plaza and 24 Hour Fitness at Cedar Hill Village. |
|
p. 9 | Kite Realty Group Supplemental Financial and Operating Statistics – 6/30/06 |
MARKET CAPITALIZATION AS OF JUNE 30, 2006
| | Percent of
Total Equity | | Total
Market
Capitalization | | Percent of
Total Market Capitalization | |
| |
|
| |
|
| |
|
| |
Equity Capitalization: | | | | | | | | | | |
Total Common Shares Outstanding | | | 77.4 | % | $ | 28,808,483 | | | | |
Operating Partnership (“OP”) Units | | | 22.6 | % | | 8,404,615 | | | | |
| |
|
| |
|
| | | | |
Combined Common Shares and OP Units | | | 100.0 | % | | 37,213,098 | | | | |
| |
|
| | | | | | | |
Market Price at June 30, 2006 | | | | | $ | 15.40 | | | | |
| | | | |
|
| |
|
| |
Total Equity Capitalization | | | | | $ | 573,081,716 | | | 56 | % |
Debt Capitalization: | | | | | | | | | | |
Company Outstanding Debt | | | | | $ | 439,156,807 | | | | |
Pro-rata Share of Joint Venture Debt | | | | | | 8,471,524 | | | | |
| | | | |
|
| |
|
| |
Total Debt Capitalization | | | | | | 447,628,331 | | | 44 | % |
| | | | |
|
| |
|
| |
Total Market Capitalization | | | | | $ | 1,020,710,047 | | | 100 | % |
| | | | |
|
| |
|
| |
|
p. 10 | Kite Realty Group Supplemental Financial and Operating Statistics – 6/30/06 |
SAME PROPERTY NET OPERATING INCOME
| | Three Months Ended June 30, | | Six Months Ended June 30, | |
| |
| |
| |
| | 2006 | | 2005 | | % Change | | 2006 | | 2005 | | % Change | |
| |
|
| |
|
| |
|
| |
|
| |
|
| |
|
| |
Number of Properties1 | | | 36 | | | 36 | | | | | | 36 | | | 36 | | | | |
Occupancy | | | 96.0 | % | | 95.4 | % | | | | | 96.0 | % | | 95.4 | % | | | |
Property revenues | | $ | 14,573,944 | | $ | 13,609,363 | | | | | $ | 27,569,494 | | $ | 25,975,026 | | | | |
Property operating expenses | | | 4,207,272 | | | 3,874,070 | | | | | | 7,938,683 | | | 7,009,508 | | | | |
| |
|
| |
|
| | | | |
|
| |
|
| | | | |
Net operating income - same properties (36 properties) | | | 10,366,672 | | | 9,735,294 | | | 6.5 | % | | 19,630,811 | | | 18,965,518 | | | 3.5 | % |
Net operating income – Galleria Plaza and Cedar Hill Village2 | | | — | | | — | | | | | | 234,257 | | | 451,545 | | | | |
Write-off of in-place lease liability at Eagle Creek3 | | | (458,306 | ) | | — | | | | | | (458,306 | ) | | — | | | | |
| |
|
| |
|
| | | | |
|
| |
|
| | | | |
Net operating income – including Galleria Plaza and Cedar Hill Village | | | 9,908,366 | | | 9,735,294 | | | 1.8 | % | | 19,406,762 | | | 19,417,063 | | | -0.1 | % |
Reconciliation to Most Directly Comparable GAAP Measure: | | | | | | | | | | | | | | | | | | | |
Net operating income - same properties2 | | | 10,366,672 | | | 9,735,294 | | | | | | 19,630,811 | | | 18,965,518 | | | | |
Net operating income - non-same properties | | | 4,968,234 | | | 2,609,608 | | | | | | 10,863,690 | | | 5,536,514 | | | | |
Less pro rata share of same property joint venture NOI | | | (305,556 | ) | | (333,631 | ) | | | | | (639,318 | ) | | (625,467 | ) | | | |
Net operating income - construction, service, general and administrative and other | | | 13,169 | | | 291,024 | | | | | | (449,595 | ) | | (737,538 | ) | | | |
| |
|
| |
|
| | | | |
|
| |
|
| | | | |
Total Company Net Operating Income | | | 15,042,519 | | | 12,302,295 | | | | | | 29,405,588 | | | 23,139,027 | | | | |
Total other income | | | 23,763 | | | 74,626 | | | | | | 74,212 | | | 109,402 | | | | |
Total other expenses | | | (12,307,786 | ) | | (10,099,446 | ) | | | | | (24,413,300 | ) | | (18,677,213 | ) | | | |
Loss on sale of asset | | | (764,008 | ) | | — | | | | | | (764,008 | ) | | | | | | |
Limited Partners’ interests in the continuing operations of the Operating Partnership | | | (454,117 | ) | | 701,701 | | | | | | 989,574 | | | 1,394,377 | | | | |
Operating income from discontinued operations, net of Limited Partners’ interests | | | — | | | 175,166 | | | | | | — | | | 388,760 | | | | |
| |
|
| |
|
| | | | |
|
| |
|
| | | | |
Net income | | $ | 1,540,371 | | $ | 1,750,939 | | | | | $ | 3,312,918 | | $ | 3,565,599 | | | | |
| |
|
| |
|
| | | | |
|
| |
|
| | | | |
|
1 Same property analysis excludes Glendale Mall as the Company pursues redevelopment of this property. |
|
2 Late in the first quarter of 2006, Shoe Pavilion and 24 Hour Fitness replaced Ultimate Electronics at Galleria Plaza and Cedar Hill Village, respectively. These properties have been excluded from the information presented for the first quarter of 2006 to provide for a more meaningful comparison of Same Property results. |
|
3 In May 2006, Winn-Dixie rejected its lease with the Company at Eagle Creek. In connection with this lease termination, the Company wrote off all related assets and liabilities, including the in-place lease liability to minimum rent. Also in May 2006, the Company acquired the Winn-Dixie lease for an acquisition cost of $1.35 million. |
The Company believes that Net Operating Income is helpful to investors as a measure of its operating performance because it excludes various items included in net income that do not relate to or are not indicative of its operating performance, such as depreciation and amortization and interest expense. The Company believes that Same Property NOI is helpful to investors as a measure of its operating performance because it includes only the NOI of properties that have been owned for the full period presented, which eliminates disparities in net income due to the redevelopment, acquisition or disposition of properties during the particular period presented, and thus provides a more consistent metric for the comparison of the Company’s properties. NOI and Same Property NOI should not, however, be considered as alternatives to net income (calculated in accordance with GAAP) as an indicator of the Company’s financial performance.
|
p. 11 | Kite Realty Group Supplemental Financial and Operating Statistics – 6/30/06 |
NET OPERATING INCOME BY QUARTER
| | Three Months Ended | |
| |
| |
| | June 30,
2006 | | March 31,
2006 | | December 31,
2005 | | September 30,
2005 | | June 30,
2005 | |
| |
|
| |
|
| |
|
| |
|
| |
|
| |
Revenue: | | | | | | | | | | | | | | | | |
Minimum rent | | $ | 16,509,839 | | $ | 15,734,672 | | $ | 14,931,419 | | $ | 14,176,125 | | $ | 13,346,462 | |
Tenant reimbursements | | | 4,417,611 | | | 3,695,873 | | | 4,054,644 | | | 2,401,869 | | | 2,871,856 | |
Other property related revenue | | | 944,966 | | | 1,051,701 | | | 2,027,454 | | | 2,409,900 | | | 407,589 | |
Other income, net | | | 31,312 | | | 53,876 | | | 65,205 | | | 57,759 | | | 79,894 | |
| |
|
| |
|
| |
|
| |
|
| |
|
| |
| | | 21,903,728 | | | 20,536,122 | | | 21,078,722 | | | 19,045,653 | | | 16,705,801 | |
Expenses: | | | | | | | | | | | | | | | | |
Property operating | | | 3,274,984 | | | 3,034,174 | | | 4,230,328 | | | 2,933,662 | | | 2,451,267 | |
Real estate taxes | | | 3,122,720 | | | 2,506,914 | | | 2,480,709 | | | 1,604,623 | | | 1,874,849 | |
| |
|
| |
|
| |
|
| |
|
| |
|
| |
| | | 6,397,704 | | | 5,541,088 | | | 6,711,037 | | | 4,538,285 | | | 4,326,116 | |
| |
|
| |
|
| |
|
| |
|
| |
|
| |
Net Operating Income – Properties | | | 15,506,024 | | | 14,995,034 | | | 14,367,685 | | | 14,507,368 | | | 12,379,685 | |
Other Income (Expense): | | | | | | | | | | | | | | | | |
Construction and service fee revenue | | | 9,036,996 | | | 7,896,936 | | | 12,823,385 | | | 4,916,773 | | | 5,590,667 | |
Cost of construction and services | | | (7,899,325 | ) | | (7,185,364 | ) | | (10,203,260 | ) | | (4,320,679 | ) | | (4,390,955 | ) |
General, administrative, and other | | | (1,601,176 | ) | | (1,343,537 | ) | | (1,706,050 | ) | | (1,112,314 | ) | | (1,277,102 | ) |
Depreciation and amortization | | | (7,842,914 | ) | | (7,522,235 | ) | | (6,175,623 | ) | | (5,439,606 | ) | | (5,356,577 | ) |
| |
|
| |
|
| |
|
| |
|
| |
|
| |
| | | (8,306,419 | ) | | (8,154,200 | ) | | (5,261,548 | ) | | (5,955,826 | ) | | (5,433,967 | ) |
| |
|
| |
|
| |
|
| |
|
| |
|
| |
Earnings Before Interest and Taxes | | | 7,199,605 | | | 6,840,834 | | | 9,106,137 | | | 8,551,542 | | | 6,945,718 | |
Interest expense | | | (4,615,175 | ) | | (4,569,992 | ) | | (4,411,460 | ) | | (5,176,657 | ) | | (4,742,869 | ) |
Loss on sale of asset1 | | | (764,008 | ) | | — | | | — | | | — | | | — | |
Income tax (expense) benefit of taxable REIT subsidiary | | | 150,303 | | | (13,287 | ) | | (809,178 | ) | | (232,285 | ) | | — | |
Minority interest in income of consolidated subsidiaries | | | (37,986 | ) | | (37,524 | ) | | (550,599 | ) | | (623,574 | ) | | (51,930 | ) |
Equity in earnings (loss) of unconsolidated entities | | | 61,749 | | | 87,973 | | | (26,225 | ) | | 76,385 | | | 126,556 | |
Limited partners’ interests in the continuing operations of the Operating Partnership | | | (454,117 | ) | | (535,457 | ) | | (886,925 | ) | | (798,844 | ) | | 701,654 | |
| |
|
| |
|
| |
|
| |
|
| |
|
| |
Income From Continuing Operations | | | 1,540,371 | | | 1,772,547 | | | 2,421,750 | | | 1,796,567 | | | 1,575,822 | |
Operating income from discontinued operations, net of Limited Partners’ interests2 | | | — | | | — | | | 5,466,250 | | | 185,674 | | | 175,117 | |
| |
|
| |
|
| |
|
| |
|
| |
|
| |
Net income | | $ | 1,540,371 | | $ | 1,772,547 | | $ | 7,888,000 | | $ | 1,982,241 | | $ | 1,750,939 | |
| |
|
| |
|
| |
|
| |
|
| |
|
| |
NOI/Revenue | | | 70.8 | % | | 73.0 | % | | 68.2 | % | | 76.2 | % | | 74.1 | % |
Recovery Ratio3 | | | 69.0 | % | | 66.7 | % | | 60.4 | % | | 52.9 | % | | 66.4 | % |
|
1 In June 2006, the Company sold Marsh Supermarkets, an asset in its Naperville Marketplace development property in Naperville, Illinois. |
2 In December 2005, the Company sold Mid-America Clinical Labs in Indianapolis, Indiana. |
3 “Recovery Ratio” is computed by dividing property operating and real estate tax expense by tenant reimbursements. |
|
p. 12 | Kite Realty Group Supplemental Financial and Operating Statistics – 6/30/06 |
SUMMARY OF OUTSTANDING DEBT1
TOTAL DEBT OUTSTANDING AS OF JUNE 30, 2006
| | Outstanding Amount | | Ratio | | Weighted Average Interest Rate | | Weighted Average Maturity
(in years) | |
| |
|
| |
|
| |
|
| |
|
| |
Fixed Rate Debt: | | | | | | | | | | | | | |
Consolidated | | $ | 228,291 | | | 51 | % | | 6.03 | % | | 7.4 | |
Unconsolidated | | | 8,471 | | | 2 | % | | 6.61 | % | | 6.0 | |
Floating Rate Debt (Hedged) 2 | | | 50,000 | | | 11 | % | | 5.57 | % | | 1.1 | |
| |
|
| |
|
| |
|
| |
|
| |
Total Fixed Rate Debt | | | 286,762 | | | 64 | % | | 5.97 | % | | 6.2 | |
Variable Rate Debt:3 | | | | | | | | | | | | | |
Construction Loans | | | 71,724 | | | 16 | % | | 6.99 | % | | 1.5 | |
Other Variable | | | 136,656 | | | 31 | % | | 6.79 | % | | 1.1 | |
Floating Rate Debt (Hedged) 2 | | | (50,000 | ) | | -11 | % | | -6.70 | % | | -1.1 | |
| |
|
| |
|
| |
|
| |
|
| |
Total Variable Rate Debt | | | 158,380 | | | 36 | % | | 6.91 | % | | 1.3 | |
Net Premiums | | | 2,486 | | | N/A | | | N/A | | | N/A | |
| |
|
| |
|
| |
|
| |
|
| |
Total | | $ | 447,628 | | | 100 | % | | 6.30 | % | | 4.5 | |
| |
|
| |
|
| |
|
| |
|
| |
SCHEDULE OF MATURITIES BY YEAR AS OF JUNE 30, 2006
| | Mortgage Debt | | Secured
Revolving
Credit
Facility | | Construction
Loans | | Total
Consolidated
Outstanding
Debt | | KRG Share Of
Unconsolidated
Mortgage Debt | | Total
Consolidated
and
Unconsolidated Debt | |
| |
| | | | | | |
| | Annual Maturity | | Term
Maturities | | | | | | |
| |
|
| |
|
| |
|
| |
|
| |
|
| |
|
| |
|
| |
2006 | | | 1,239 | | | 0 | | | 0 | | | 1,259 | | | 2,498 | | | 98 | | | 2,596 | |
2007 | | | 2,703 | | | 20,100 | | | 111,550 | | | 42,193 | | | 176,546 | | | 204 | | | 176,750 | |
2008 | | | 2,652 | | | 8,292 | | | 0 | | | 20,900 | | | 31,844 | | | 218 | | | 32,062 | |
2009 | | | 2,801 | | | 27,452 | | | 0 | | | 7,372 | | | 37,625 | | | 2,211 | | | 39,836 | |
2010 | | | 3,023 | | | 0 | | | 0 | | | 0 | | | 3,023 | | | 97 | | | 3,120 | |
2011 | | | 2,986 | | | 19,655 | | | 0 | | | 0 | | | 22,641 | | | 103 | | | 22,744 | |
2012 | | | 2,637 | | | 35,356 | | | 0 | | | 0 | | | 37,993 | | | 109 | | | 38,102 | |
2013 | | | 2,562 | | | 4,027 | | | 0 | | | 0 | | | 6,589 | | | 5,431 | | | 12,020 | |
2014 | | | 2,191 | | | 27,567 | | | 0 | | | 0 | | | 29,758 | | | 0 | | | 29,758 | |
2015 | | | 1,740 | | | 38,301 | | | 0 | | | 0 | | | 40,041 | | | 0 | | | 40,041 | |
2016 and beyond | | | 3,827 | | | 44,286 | | | 0 | | | 0 | | | 48,113 | | | 0 | | | 48,113 | |
Net Premiums | | | 0 | | | 0 | | | 0 | | | 0 | | | 2,486 | | | 0 | | | 2,486 | |
| |
|
| |
|
| |
|
| |
|
| |
|
| |
|
| |
|
| |
Total | | $ | 28,361 | | $ | 225,036 | | $ | 111,550 | | $ | 71,724 | | $ | 439,157 | | $ | 8,471 | | $ | 447,628 | |
| |
|
| |
|
| |
|
| |
|
| |
|
| |
|
| |
|
| |
|
1 Dollars in thousands. |
2 These debt obligations are hedged by interest rate swap agreements. |
3 Variable Rate Debt %, net of swap transactions: |
- Construction | | | 16 | % | $ | 71,724 | | | | | |
- Other Variable | | | 20 | % | | 86,656 | | (Includes debt on acquisition land held for development) |
| |
|
| |
|
| | | | | |
| | | 36 | % | $ | 158,380 | | | | | |
|
p. 13 | Kite Realty Group Supplemental Financial and Operating Statistics – 6/30/06 |
SCHEDULE OF OUTSTANDING DEBT1
CONSOLIDATED DEBT AS OF JUNE 30, 2006
Fixed Rate Debt: | | Lender/Servicer | | Interest Rate | | Maturity Date | | Balance as of
June 30, 2006 | | Monthly Debt
Service as of
June 30, 2006 | |
| |
|
| |
|
| |
|
| |
|
| |
|
| |
50th & 12th | | | Wachovia Bank | | | 5.67 | % | | 11/11/14 | | $ | 4,607 | | $ | 27 | |
176th & Meridian | | | Wachovia Bank | | | 5.67 | % | | 11/11/14 | | | 4,185 | | | 25 | |
Boulevard Crossing | | | Wachovia Bank | | | 5.11 | % | | 12/11/09 | | | 12,395 | | | 69 | |
Centre at Panola, Phase I | | | JP Morgan Chase | | | 6.78 | % | | 1/1/22 | | | 4,239 | | | 37 | |
Cool Creek Commons | | | Lehman Brothers Bank | | | 5.88 | % | | 4/11/16 | | | 18,000 | | | 91 | |
Corner Shops, The | | | Sun Life Assurance Co. | | | 7.65 | % | | 7/1/11 | | | 1,834 | | | 17 | |
Fox Lake Crossing | | | Wachovia Bank | | | 5.16 | % | | 7/1/12 | | | 12,029 | | | 69 | |
Indian River Square | | | Wachovia Bank | | | 5.42 | % | | 6/11/15 | | | 13,300 | | | 62 | |
Indiana State Motor Pool | | | Old National | | | 5.38 | % | | 3/24/08 | | | 4,064 | | | 19 | |
International Speedway Square | | | Lehman Brothers Bank | | | 7.17 | % | | 3/11/11 | | | 19,571 | | | 139 | |
Plaza at Cedar Hill | | | GECC | | | 7.38 | % | | 2/1/12 | | | 26,838 | | | 193 | |
Plaza Volente | | | Wachovia Bank | | | 5.42 | % | | 6/11/15 | | | 28,680 | | | 134 | |
Preston Commons | | | Wachovia Bank | | | 5.90 | % | | 3/11/13 | | | 4,559 | | | 28 | |
Ridge Plaza | | | Wachovia Bank | | | 5.15 | % | | 10/11/09 | | | 16,606 | | | 93 | |
Sunland Towne Centre | | | KeyBank | | | 6.01 | % | | 7/1/16 | | | 25,000 | | | 125 | |
Thirty South | | | CS First Boston | | | 6.09 | % | | 1/11/14 | | | 22,834 | | | 142 | |
Whitehall Pike | | | Banc One Capital Funding | | | 6.71 | % | | 7/5/18 | | | 9,550 | | | 77 | |
| | | | | | | | | | |
|
| |
|
| |
Subtotal | | | | | | | | | | | $ | 228,291 | | $ | 1,347 | |
| | | | | | | | | | |
|
| |
|
| |
Floating Rate Debt (Hedged): | | Lender | | Interest Rate | | Maturity Date | | Balance as of
June 30, 2006 | | Monthly Debt
Service as of
June 30, 2006 | |
| |
|
| |
|
| |
|
| |
|
| |
|
| |
Collateral Pool Properties2 | | | KeyBank | | | 5.65 | % | | 8/1/07 | | $ | 35,000 | | $ | 165 | |
Collateral Pool Properties2 | | | KeyBank | | | 5.38 | % | | 8/1/07 | | | 15,000 | | | 67 | |
| | | | | | | | | | |
|
| |
|
| |
Subtotal | | | | | | | | | | | $ | 50,000 | | $ | 232 | |
| | | | | | | | | | |
|
| |
|
| |
TOTAL CONSOLIDATED FIXED RATE DEBT | | | | | | | | | | | $ | 278,291 | | $ | 1,579 | |
| | | | | | | | | | |
|
| |
|
| |
TOTAL NET PREMIUMS | | | | | | | | | | | $ | 2,486 | | | | |
| | | | | | | | | | |
|
| | | | |
| | | | | | | | | | | | | | | | | |
Variable Rate Debt: Mortgages | | Lender | | Interest Rate3 | | Maturity Date | | Balance as of
June 30, 2006 | | | |
| |
|
| |
|
| |
|
| |
|
| | | | |
| Fishers Station Shops4 | | | National City Bank | | | LIBOR + 275 | | | 9/1/08 | | $ | 5,006 | | | | |
Traders Point5 | | | Wachovia Bank | | | LIBOR + 160 | | | 3/31/07 | | | 20,100 | | | | |
| | | | | | | | | | |
|
| | | | |
Subtotal | | | | | | | | | | | $ | 25,106 | | | | |
| | | | | | | | | | |
|
| | | | |
|
1 Dollars in thousands. |
2 The Company entered into $35 million and $15 million fixed rate swap agreements, which are designated as hedges against the revolving credit facility. |
3 At June 30, 2006, one-month LIBOR and Prime interest rates were 5.35% and 8.25%, respectively. |
4 The Company has a 25% interest in this property. This loan is guaranteed by Kite Realty Group, LP. |
5 The Company entered into a short-term variable rate loan used for the acquisition and completion of the Kedron Village project. |
|
p. 14 | Kite Realty Group Supplemental Financial and Operating Statistics – 6/30/06 |
SCHEDULE OF OUTSTANDING DEBT (CONTINUED)1
Variable Rate Debt:
Construction Loans | | Servicer | | Interest Rate 2 | | Maturity Date | | Total
Commitment | | Balance as of
June 30, 2006 | |
| |
|
| |
|
| |
|
| |
|
| |
|
| |
Beacon Hill Shopping Center3 | | | Fifth Third Bank | | | LIBOR + 150 | | | 9/30/07 | | $ | 34,800 | | $ | 5,665 | |
Bridgewater Marketplace | | | Home Federal Bank | | | LIBOR + 160 | | | 6/29/08 | | | 12,000 | | | 2,282 | |
Bridgewater Marketplace Walgreens | | | LaSalle Bank | | | LIBOR + 150 | | | 10/31/07 | | | 4,046 | | | 3,169 | |
Cobblestone Plaza4 | | | Wachovia Bank | | | LIBOR + 160 | | | 6/29/09 | | | 44,500 | | | 7,372 | |
Estero Town Center5 | | | Wachovia Bank | | | LIBOR + 165 | | | 4/1/08 | | | 20,460 | | | 9,916 | |
Gateway Shopping Center6 | | | Union Bank of California | | | LIBOR + 150 | | | 12/15/07 | | | 22,268 | | | 5,116 | |
Geist Pavilion | | | The National Bank of Indianapolis and Busey Bank | | | LIBOR + 165 | | | 5/1/07 | | | 10,057 | | | 8,684 | |
Naperville Marketplace | | | LaSalle Bank | | | LIBOR + 175 | | | 6/30/07 | | | 14,400 | | | 7,324 | |
Red Bank Commons | | | Huntington Bank | | | LIBOR + 165 | | | 3/31/07 | | | 4,960 | | | 4,715 | |
Sandifur Plaza7 | | | LaSalle Bank | | | LIBOR + 165 | | | 12/31/06 | | | 5,500 | | | 1,259 | |
Tarpon Springs Plaza | | | Wachovia Bank | | | LIBOR + 175 | | | 4/1/08 | | | 20,000 | | | 8,701 | |
Traders Point II | | | Huntington Bank | | | LIBOR + 165 | | | 6/28/07 | | | 9,587 | | | 7,521 | |
| | | | | | | | | | |
|
| |
|
| |
Subtotal | | | | | | | | | | | $ | 202,578 | | $ | 71,724 | |
| | | | | | | | | | |
|
| |
|
| |
Line of Credit | | Lender | | Interest Rate 2 | | Maturity Date | | Total Available
as of
June 30, 2006 | | Balance as of
June 30, 2006 | |
| |
|
| |
|
| |
|
| |
|
| |
|
| |
Collateral Pool Properties: 8,9,10 | | | Wachovia Bank | | | LIBOR + 135 | | | 8/31/07 | | $ | 125,947 | | $ | 111,550 | |
| | | | | | | | | | | | | |
|
| |
Floating Rate Debt (Hedged) | | | | | | | | | | | | | | | | |
Collateral Pool Properties9 | | | KeyBank | | | LIBOR + 135 | | | 8/1/07 | | | | | $ | (35,000 | ) |
Collateral Pool Properties9 | | | KeyBank | | | LIBOR + 135 | | | 8/1/07 | | | | | | (15,000 | ) |
| | | | | | | | | | | | | |
|
| |
Subtotal | | | | | | | | | | | | | | $ | (50,000 | ) |
| | | | | | | | | | | | | |
|
| |
Total Consolidated Variable Rate Debt | | | | | | | | | | | | | | $ | 158,380 | |
| | | | | | | | | | | | | |
|
| |
TOTAL DEBT PER CONSOLIDATED BALANCE SHEET | | | | | | | | | | | | | | $ | 439,157 | |
| | | | | | | | | | | | | |
|
| |
|
1 Dollars in thousands. |
2 At June 30, 2006, one-month LIBOR and Prime interest rates were 5.35% and 8.25%, respectively. |
3 The Company has a preferred return, then a 50% interest. This loan is guaranteed by Kite Realty Group, LP. |
4 The Company has a preferred return, then a 50% interest. This loan is guaranteed by Kite Realty Group, LP. |
5 The Company has a preferred return, then a 40% interest. This loan is guaranteed by Kite Realty Group, LP. |
6 The Company has a preferred return, then a 50% interest. This loan is guaranteed by Kite Realty Group, LP. |
7 The Company has a 80% interest in the Walgreens and 95% in the shops. This loan is guaranteed by Kite Realty Group, LP. |
8 There are currently 15 properties encumbered under the line of credit and 31 unencumbered properties and available to expand borrowings under the line. The major unencumbered properties include: 50 S. Morton, Bayport Commons, Bolton Plaza, Centre at Panola Phase II, Circuit City Plaza, Cornelius Gateway Shops, Delray Marketplace, Fishers Station Marsh, Frisco Bridges, Greyhound Commons, Kedron Village, Martinsville Shops, Pipeline Pointe, Shops at Otty, Sunland II, Wal-Mart Plaza, Weston Park, Zionsville Place. |
9 The Company entered into a $35 million and $15 million fixed rate swap agreement, which is designated as a hedge against the line of credit. |
10 The total amount available for borrowing under the line is $125,947, of which $111,550 was outstanding as of June 30, 2006. |
|
p. 15 | Kite Realty Group Supplemental Financial and Operating Statistics – 6/30/06 |
SCHEDULE OF OUTSTANDING DEBT (CONTINUED)1
UNCONSOLIDATED DEBT AS OF JUNE 30, 2006 2
| | Lender | | Interest Rate | | Maturity Date | | Balance as of
June 30, 2006 | | Monthly Debt
Service as of
June 30, 2006 | |
| |
|
| |
|
| |
|
| |
|
| |
|
| |
Fixed Rate | | | | | | | | | | | | | | | | |
The Centre | | | Sun Life | | | 6.99 | % | | 6/1/2009 | | $ | 4,065 | | $ | 40 | |
Spring Mill Medical | | | LaSalle Bank | | | 6.45 | % | | 9/1/2013 | | | 12,065 | | | 78 | |
| | | | | | | | | | |
|
| |
|
| |
TOTAL UNCONSOLIDATED DEBT | | | | | | | | | | | $ | 16,130 | | $ | 118 | |
| | | | | | | | | | |
|
| |
|
| |
JOINT VENTURE PARTNERS’ SHARE OF TOTAL UNCONSOLIDATED DEBT | | | | | | | | | | | | (7,659 | ) | | | |
| | | | | | | | | | |
|
| | | | |
KRG’s SHARE OF TOTAL UNCONSOLIDATED DEBT | | | | | | | | | | | $ | 8,471 | | | | |
| | | | | | | | | | |
|
| | | | |
TOTAL KRG CONSOLIDATED DEBT | | | | | | | | | | | $ | 439,157 | | | | |
TOTAL KRG UNCONSOLIDATED DEBT | | | | | | | | | | | | 8,471 | | | | |
| | | | | | | | | | |
|
| | | | |
TOTAL KRG DEBT | | | | | | | | | | | $ | 447,628 | | | | |
| | | | | | | | | | |
|
| | | | |
|
1 Dollars in thousands. |
2 The Company owns a 50% interest in Spring Mill Medical and a 60% interest in The Centre. |
|
p. 16 | Kite Realty Group Supplemental Financial and Operating Statistics – 6/30/06 |
JOINT VENTURE SUMMARY – UNCONSOLIDATED PROPERTIES
The Company owns the following two unconsolidated properties with joint venture partners:
Property | | Percentage Owned by the Company |
| |
|
The Centre | | 60% |
Spring Mill Medical | | 50% |
|
p. 17 | Kite Realty Group Supplemental Financial and Operating Statistics – 6/30/06 |
CONDENSED COMBINED BALANCE SHEETS OF UNCONSOLIDATED PROPERTIES
(THE CENTRE AND SPRING MILL MEDICAL)
(Unaudited)
| | June 30, 2006 | | December 31, 2005 | |
| |
|
| |
|
| |
Assets: | | | �� | | | | |
Investment properties, at cost | | | | | | | |
Land | | $ | 2,552,075 | | $ | 2,552,075 | |
Buildings and improvements | | | 14,577,215 | | | 14,566,616 | |
Furniture and equipment | | | 10,581 | | | 3,290 | |
| |
|
| |
|
| |
| | | 17,139,871 | | | 17,121,981 | |
Less: accumulated depreciation | | | (3,023,529 | ) | | (2,793,109 | ) |
| |
|
| |
|
| |
| | | 14,116,342 | | | 14,328,872 | |
Cash and cash equivalents | | | 800,488 | | | 902,443 | |
Tenant receivables, including accrued straight-line rent | | | 142,188 | | | 140,124 | |
Other receivables | | | — | | | — | |
Deferred costs, net | | | 641,680 | | | 670,319 | |
Prepaid and other assets | | | 325 | | | — | |
| |
|
| |
|
| |
Total Assets | | $ | 15,701,023 | | $ | 16,041,758 | |
| |
|
| |
|
| |
Liabilities and Accumulated Equity (Deficit): | | | | | | | |
Mortgage and other indebtedness | | $ | 16,129,993 | | $ | 16,299,855 | |
Accounts payable and accrued expenses | | | 558,355 | | | 524,792 | |
Due to affiliate | | | — | | | — | |
| |
|
| |
|
| |
Total Liabilities | | | 16,688,348 | | | 16,824,647 | |
Accumulated equity (deficit) | | | (987,325 | ) | | (782,889 | ) |
| |
|
| |
|
| |
Total Liabilities and Accumulated Equity (Deficit) | | $ | 15,701,023 | | $ | 16,041,758 | |
| |
|
| |
|
| |
|
p. 18 | Kite Realty Group Supplemental Financial and Operating Statistics – 6/30/06 |
CONDENSED COMBINED STATEMENTS OF OPERATIONS OF UNCONSOLIDATED PROPERTIES
(THE CENTRE AND SPRING MILL MEDICAL)
(Unaudited)
| | Three Months Ended June 30, | | Six Months Ended June 30, | |
| |
| |
| |
| | 2006 | | 2005 | | 2006 | | 2005 | |
| |
|
| |
|
| |
|
| |
|
| |
Total Revenue | | $ | 856,750 | | $ | 858,820 | | $ | 1,735,257 | | $ | 1,689,039 | |
Expenses: | | | | | | | | | | | | | |
Property operating | | | 217,478 | | | 190,712 | | | 418,761 | | | 424,684 | |
Real estate taxes | | | 68,569 | | | 55,670 | | | 129,888 | | | 111,344 | |
Depreciation and amortization | | | 129,310 | | | 148,979 | | | 262,550 | | | 280,794 | |
| |
|
| |
|
| |
|
| |
|
| |
Total expenses | | | 415,357 | | | 395,361 | | | 811,199 | | | 816,822 | |
| |
|
| |
|
| |
|
| |
|
| |
Operating income | | | 441,393 | | | 463,459 | | | 924,058 | | | 872,217 | |
Interest expense | | | 273,602 | | | 279,182 | | | 546,494 | | | 557,536 | |
| |
|
| |
|
| |
|
| |
|
| |
Net income | | $ | 167,791 | | $ | 184,277 | | $ | 377,564 | | $ | 314,681 | |
| |
|
| |
|
| |
|
| |
|
| |
|
p. 19 | Kite Realty Group Supplemental Financial and Operating Statistics – 6/30/06 |
TOP 10 RETAIL TENANTS BY GROSS LEASABLE AREA (GLA)
AS OF JUNE 30, 2006
This Table Includes the Following: |
| | |
| • | Operating Retail Properties |
| • | Operating Commercial Properties |
| • | Development Property Tenants open for business or ground lease tenants who commenced paying rent as of June 30, 2006 |
Tenant | | Number of
Locations | | Total
GLA | | Number
of Leases | | Company Owned
GLA2 | | Number of Anchor
Owned Locations | | Anchor Owned
GLA3 | |
| |
|
| |
|
| |
|
| |
|
| |
|
| |
|
| |
Lowe’s Home Improvement1 | | | 9 | | | 1,242,630 | | | 3 | | | 128,997 | | | 6 | | | 1,113,633 | |
Wal-Mart | | | 5 | | | 749,649 | | | 2 | | | 234,649 | | | 3 | | | 515,000 | |
Federated Department Stores | | | 1 | | | 237,455 | | | 1 | | | 237,455 | | | 0 | | | 0 | |
Circuit City | | | 4 | | | 132,352 | | | 4 | | | 132,352 | | | 0 | | | 0 | |
Dominick’s | | | 2 | | | 131,613 | | | 2 | | | 131,613 | | | 0 | | | 0 | |
Publix | | | 3 | | | 129,357 | | | 3 | | | 129,357 | | | 0 | | | 0 | |
Dick’s Sporting Goods | | | 2 | | | 126,672 | | | 2 | | | 126,672 | | | 0 | | | 0 | |
Marsh Supermarkets | | | 2 | | | 124,902 | | | 2 | | | 124,902 | | | 0 | | | 0 | |
Kmart | | | 1 | | | 110,875 | | | 1 | | | 110,875 | | | 0 | | | 0 | |
Burlington Coat Factory | | | 1 | | | 107,400 | | | 1 | | | 107,400 | | | 0 | | | 0 | |
| |
|
| |
|
| |
|
| |
|
| |
|
| |
|
| |
Total | | | 30 | | | 2,934,905 | | | 21 | | | 1,464,272 | | | 9 | | | 1,628,633 | |
|
1 | A ground lease with Lowe’s was entered into during the first quarter of 2006. An estimated 165,000 square feet is included in Anchor Owned GLA to account for this property. Also, a ground lease with Lowe’s was entered into during the second quarter of 2006. An estimated 158,000 square feet is included in Anchor Owned GLA to account for this property. |
2 | Excludes the estimated size of the structures located on land owned by the Company and ground leased to tenants. |
3 | Includes the estimated size of the structures located on land owned by the Company and ground leased to tenants. |
|
p. 20 | Kite Realty Group Supplemental Financial and Operating Statistics – 6/30/06 |
TOP 25 TENANTS BY ANNUALIZED BASE RENT1, 2
AS OF JUNE 30, 2006
This Table Includes the Following: |
| | |
| • | Operating Retail Properties |
| • | Operating Commercial Properties |
| • | Development Property Tenants open for business or ground lease tenants who commenced paying rent as of June 30, 2006 |
Tenant | | Type of
Property | | Number of
Locations | | Leased
GLA/NRA6 | | % of Owned
GLA/NRA of the
Portfolio | | Annualized Base Rent 1,2 | | Annualized
Base Rent
per Sq. Ft. | | % of Total Portfolio
Annualized Base
Rent | |
| |
|
| |
|
| |
|
| |
|
| |
|
| |
|
| |
|
| |
Lowe’s Home Center5 | | | Retail | | | 3 | | | 128,997 | | | 2.5 | % | $ | 2,564,000 | | $ | 5.67 | | | 4.2 | % |
Circuit City | | | Retail | | | 4 | | | 132,352 | | | 2.6 | % | $ | 1,930,190 | | $ | 14.58 | | | 3.2 | % |
State of Indiana | | | Commercial | | | 3 | | | 210,393 | | | 4.1 | % | $ | 1,663,733 | | $ | 7.91 | | | 2.7 | % |
Eli Lilly | | | Commercial | | | 1 | | | 99,542 | | | 1.9 | % | $ | 1,642,443 | | $ | 16.50 | | | 2.7 | % |
Marsh Supermarkets4 | | | Retail | | | 2 | | | 124,902 | | | 2.4 | % | $ | 1,633,958 | | $ | 13.08 | | | 2.7 | % |
Dominick’s | | | Retail | | | 2 | | | 131,613 | | | 2.5 | % | $ | 1,411,728 | | $ | 10.73 | | | 2.3 | % |
Dick’s Sporting Goods | | | Retail | | | 2 | | | 126,672 | | | 2.4 | % | $ | 1,220,000 | | $ | 9.63 | | | 2.0 | % |
HEB | | | Retail | | | 1 | | | 105,000 | | | 2.0 | % | $ | 1,155,000 | | $ | 11.00 | | | 1.9 | % |
Bed Bath & Beyond | | | Retail | | | 3 | | | 85,895 | | | 1.7 | % | $ | 1,056,866 | | $ | 12.30 | | | 1.7 | % |
Walgreens | | | Retail | | | 3 | | | 39,070 | | | 0.8 | % | $ | 1,031,023 | | $ | 26.39 | | | 1.7 | % |
Publix | | | Retail | | | 3 | | | 129,357 | | | 2.5 | % | $ | 989,361 | | $ | 7.65 | | | 1.6 | % |
Wal-Mart | | | Retail | | | 2 | | | 234,649 | | | 4.5 | % | $ | 930,927 | | $ | 3.97 | | | 1.5 | % |
Ross Stores | | | Retail | | | 3 | | | 87,656 | | | 1.7 | % | $ | 893,821 | | $ | 10.20 | | | 1.5 | % |
Office Depot | | | Retail | | | 3 | | | 84,372 | | | 1.6 | % | $ | 873,089 | | $ | 10.35 | | | 1.4 | % |
Kmart | | | Retail | | | 1 | | | 110,875 | | | 2.1 | % | $ | 850,379 | | $ | 7.67 | | | 1.4 | % |
UMDA3 | | | Commercial | | | 1 | | | 32,256 | | | 0.6 | % | $ | 844,402 | | $ | 26.18 | | | 1.4 | %3 |
Kerasotes5 | | | Retail | | | 2 | | | 43,050 | | | 0.8 | % | $ | 776,496 | | $ | 8.92 | | | 1.3 | % |
A & P | | | Retail | | | 1 | | | 58,732 | | | 1.1 | % | $ | 763,516 | | $ | 13.00 | | | 1.3 | % |
Old Navy | | | Retail | | | 3 | | | 64,868 | | | 1.3 | % | $ | 748,693 | | $ | 11.54 | | | 1.2 | % |
Shoe Pavilion | | | Retail | | | 1 | | | 31,396 | | | 0.6 | % | $ | 722,108 | | $ | 23.00 | | | 1.2 | % |
City Securities | | | Commercial | | | 1 | | | 34,949 | | | 0.7 | % | $ | 694,900 | | $ | 19.88 | | | 1.1 | % |
Indiana University Healthcare Associates3 | | | Commercial | | | 1 | | | 31,175 | | | 0.6 | % | $ | 622,201 | | $ | 19.96 | | | 1.0 | %3 |
Bealls | | | Retail | | | 2 | | | 79,611 | | | 1.5 | % | $ | 576,000 | | $ | 7.24 | | | 1.0 | % |
Petsmart | | | Retail | | | 2 | | | 50,909 | | | 1.0 | % | $ | 537,095 | | $ | 10.55 | | | 0.9 | % |
Michaels | | | Retail | | | 2 | | | 47,837 | | | 0.9 | % | $ | 527,416 | | $ | 11.03 | | | 0.9 | % |
| | | | | | | |
|
| |
|
| |
|
| |
|
| |
|
| |
Total | | | | | | | | | 2,306,128 | | | 44.4 | % | $ | 26,659,345 | | $ | 9.97 | | | 43.9 | % |
|
1 | Annualized Base Rent represents the monthly contractual rent for June 2006 for each applicable tenant, multiplied by 12. |
2 | Excludes tenants at development properties that are Build-to-Suits for sale. |
3 | Property held in unconsolidated joint venture. Annualized Base Rent is reflected at 100 percent. |
4 | Excludes the Marsh Supermarket at Geist Pavilion where the tenant has commenced payment of rent but has not opened for business. |
5 | Annualized Base Rent Per Sq. Ft. is adjusted to account for the estimated square footage attributed to structures on land owned by the Company and ground leased to tenants. |
6 | Excludes the estimated size of the structures located on land owned by the Company and ground leased to tenants. |
|
p. 21 | Kite Realty Group Supplemental Financial and Operating Statistics – 6/30/06 |
LEASE EXPIRATIONS – OPERATING PORTFOLIO1
| This Table Includes the Following: |
| | | |
| | • | Operating Retail Properties |
| | • | Operating Commercial Properties |
| | • | Development Property Tenants open for business or ground lease tenants who commenced paying rent as of June 30, 2006 |
| | Number of Expiring
Leases 2 | | Expiring
GLA/NRA 3 | | % of Total
GLA/NRA
Expiring | | Expiring Annualized
Base Rent 4 | | % of Total Annualized
Base Rent | | Expiring Annualized
Base Rent
per Sq. Ft. | | Expiring
Ground Lease
Revenue | |
| |
|
| |
|
| |
|
| |
|
| |
|
| |
|
| |
|
| |
2006 | | | 52 | | | 121,901 | | | 2.5 | % | $ | 1,183,508 | | | 2.1 | % | $ | 9.71 | | $ | 0 | |
2007 | | | 82 | | | 256,648 | | | 5.3 | % | $ | 3,213,514 | | | 5.6 | % | $ | 12.52 | | $ | 800,000 | |
2008 | | | 44 | | | 440,321 | | | 9.1 | % | $ | 3,272,454 | | | 5.7 | % | $ | 7.43 | | $ | 0 | |
2009 | | | 62 | | | 210,433 | | | 4.3 | % | $ | 3,190,314 | | | 5.6 | % | $ | 15.16 | | $ | 0 | |
2010 | | | 66 | | | 424,149 | | | 8.8 | % | $ | 5,192,785 | | | 9.1 | % | $ | 12.24 | | $ | 0 | |
2011 | | | 54 | | | 634,011 | | | 13.1 | % | $ | 6,086,759 | | | 10.7 | % | $ | 9.60 | | $ | 0 | |
2012 | | | 33 | | | 269,439 | | | 5.6 | % | $ | 3,714,267 | | | 6.5 | % | $ | 13.79 | | $ | 85,000 | |
2013 | | | 22 | | | 198,131 | | | 4.1 | % | $ | 2,896,224 | | | 5.1 | % | $ | 14.62 | | $ | 0 | |
2014 | | | 33 | | | 343,799 | | | 7.1 | % | $ | 4,245,360 | | | 7.4 | % | $ | 12.35 | | $ | 427,900 | |
2015 | | | 38 | | | 507,185 | | | 10.5 | % | $ | 6,295,171 | | | 11.0 | % | $ | 12.41 | | $ | 251,500 | |
Beyond | | | 50 | | | 1,441,759 | | | 29.6 | % | $ | 17,808,528 | | | 31.2 | % | $ | 12.35 | | $ | 2,139,980 | |
| |
|
| |
|
| |
|
| |
|
| |
|
| |
|
| |
|
| |
Total | | | 536 | | | 4,847,776 | | | 100.0 | % | $ | 57,098,884 | | | 100.0 | % | $ | 11.78 | | $ | 3,704,380 | |
|
1 | Excludes tenants at development properties that are Build-to-Suits for sale. |
2 | Lease expiration table reflects rents in place as of June 30, 2006 and does not include option periods; 2006 expirations include month-to-month tenants. This column also excludes ground leases. |
3 | Expiring GLA excludes estimated square footage attributable to non-owned structures on land owned by the Company and ground leased to tenants. |
4 | Annualized Base Rent represents the monthly contractual rent for June 2006 for each applicable tenant, multiplied by 12. Excludes ground lease revenue. |
|
p. 22 | Kite Realty Group Supplemental Financial and Operating Statistics – 6/30/06 |
LEASE EXPIRATIONS –RETAIL ANCHOR TENANTS1
| This Table Includes the Following: |
| | | |
| | • | Operating Retail Properties |
| | • | Development Property Tenants open for business or ground lease tenants who commenced paying rent as of June 30, 2006 |
| | Number of Expiring
Leases 2 | | Expiring
GLA 3 | | % of Total
GLA
Expiring | | Expiring Annualized
Base Rent 4 | | % of Total Annualized
Base Rent | | Expiring Annualized
Base Rent
per Sq. Ft. | | Expiring
Ground Lease Revenue | |
| |
|
| |
|
| |
|
| |
|
| |
|
| |
|
| |
|
| |
2006 | | | 1 | | | 34,212 | | | 0.7 | % | $ | 18,000 | | | 0.0 | % | $ | 0.53 | | $ | 0 | |
2007 | | | 7 | | | 104,126 | | | 2.2 | % | $ | 817,276 | | | 1.4 | % | $ | 7.85 | | $ | 800,000 | |
2008 | | | 3 | | | 342,049 | | | 7.1 | % | $ | 1,441,077 | | | 2.5 | % | $ | 4.21 | | $ | 0 | |
2009 | | | 3 | | | 69,389 | | | 1.4 | % | $ | 669,318 | | | 1.2 | % | $ | 9.65 | | $ | 0 | |
2010 | | | 11 | | | 284,459 | | | 5.9 | % | $ | 2,622,387 | | | 4.6 | % | $ | 9.22 | | $ | 0 | |
2011 | | | 7 | | | 407,087 | | | 8.4 | % | $ | 2,089,946 | | | 3.7 | % | $ | 5.13 | | $ | 0 | |
2012 | | | 5 | | | 135,399 | | | 2.8 | % | $ | 1,172,103 | | | 2.1 | % | $ | 8.66 | | $ | 0 | |
2013 | | | 1 | | | 11,960 | | | 0.3 | % | $ | 161,460 | | | 0.3 | % | $ | 13.50 | | $ | 0 | |
2014 | | | 6 | | | 126,986 | | | 2.6 | % | $ | 1,284,007 | | | 2.3 | % | $ | 10.73 | | $ | 0 | |
2015 | | | 11 | | | 374,987 | | | 7.6 | % | $ | 3,614,475 | | | 6.3 | % | $ | 9.54 | | $ | 0 | |
Beyond | | | 30 | | | 1,312,063 | | | 27.0 | % | $ | 14,962,977 | | | 26.2 | % | $ | 11.40 | | $ | 990,000 | |
| |
|
| |
|
| |
|
| |
|
| |
|
| |
|
| |
|
| |
Total | | | 85 | | | 3,202,717 | | | 66.0 | % | $ | 28,853,026 | | | 50.6 | % | $ | 9.01 | | $ | 1,790,000 | |
|
1 | Retail Anchor Tenants are defined as tenants that occupy 10,000 square feet or more. Excludes tenants at development properties that are Build-to-Suits for sale. |
2 | Lease expiration table reflects rents in place as of June 30, 2006 and does not include option periods; 2006 expirations include month-to-month tenants. This column also excludes ground leases. |
3 | Expiring GLA excludes estimated square footage attributable to non-owned structures on land owned by the Company and ground leased to tenants. |
4 | Annualized base rent represents the monthly contractual rent for June 2006 for each applicable property, multiplied by 12. Excludes ground lease revenue. |
|
p. 23 | Kite Realty Group Supplemental Financial and Operating Statistics – 6/30/06 |
LEASE EXPIRATIONS – RETAIL SHOPS
| This Table Includes the Following: |
| | | |
| | • | Operating Retail Properties |
| | • | Development Property Tenants open for business as of June 30, 2006 |
| | Number of Expiring
Leases1 | | Expiring GLA2 | | % of Total
GLA
Expiring | | Expiring Annualized
Base Rent3 | | % of Total
Annualized
Base Rent | | Expiring Annualized Base Rent
per Sq. Ft. | | Expiring
Ground Lease Revenue | |
| |
|
| |
|
| |
|
| |
|
| |
|
| |
|
| |
|
| |
2006 | | | 50 | | | 86,689 | | | 1.8 | % | $ | 1,165,258 | | | 2.0 | % | $ | 13.44 | | $ | 0 | |
2007 | | | 73 | | | 148,567 | | | 3.0 | % | $ | 2,318,878 | | | 4.1 | % | $ | 15.61 | | $ | 0 | |
2008 | | | 40 | | | 90,307 | | | 1.9 | % | $ | 1,671,440 | | | 2.9 | % | $ | 18.51 | | $ | 0 | |
2009 | | | 59 | | | 141,044 | | | 2.9 | % | $ | 2,520,996 | | | 4.4 | % | $ | 17.87 | | $ | 0 | |
2010 | | | 54 | | | 130,812 | | | 2.7 | % | $ | 2,390,619 | | | 4.2 | % | $ | 18.28 | | $ | 0 | |
2011 | | | 44 | | | 127,382 | | | 2.6 | % | $ | 2,354,370 | | | 4.1 | % | $ | 18.48 | | $ | 0 | |
2012 | | | 26 | | | 96,988 | | | 2.0 | % | $ | 1,951,456 | | | 3.4 | % | $ | 20.12 | | $ | 85,000 | |
2013 | | | 17 | | | 57,817 | | | 1.2 | % | $ | 1,145,133 | | | 2.0 | % | $ | 19.81 | | $ | 0 | |
2014 | | | 25 | | | 66,864 | | | 1.4 | % | $ | 1,573,003 | | | 2.8 | % | $ | 23.53 | | $ | 427,900 | |
2015 | | | 25 | | | 87,091 | | | 1.8 | % | $ | 1,901,075 | | | 3.3 | % | $ | 21.83 | | $ | 251,500 | |
Beyond | | | 18 | | | 66,265 | | | 1.4 | % | $ | 1,378,947 | | | 2.4 | % | $ | 20.81 | | $ | 1,149,980 | |
| |
|
| |
|
| |
|
| |
|
| |
|
| |
|
| |
|
| |
Total | | | 431 | | | 1,099,826 | | | 22.7 | % | $ | 20,371,175 | | | 35.6 | % | $ | 18.52 | | $ | 1,914,380 | |
|
1 | Lease expiration table reflects rents in place as of June 30, 2006 and does not include option periods; 2006 expirations include month-to-month tenants. This column also excludes ground leases. |
2 | Expiring GLA excludes estimated square footage attributable to non-owned structures on land owned by the Company and ground leased to tenants. |
3 | Annualized Base Rent represents the monthly contractual rent for June 2006 for each applicable property, multiplied by 12. Excludes ground lease revenue. |
|
p. 24 | Kite Realty Group Supplemental Financial and Operating Statistics – 6/30/06 |
LEASE EXPIRATIONS – COMMERCIAL TENANTS
| This Table Includes the Following: |
| | | |
| | • | Operating Commercial Properties |
| | Number of Expiring
Leases1 | | Expiring NRA | | % of Total
NRA
Expiring | | Expiring Annualized Base Rent2 | | % of Total Annualized
Base Rent | | Expiring Annualized Base Rent
per Sq. Ft. | |
| |
|
| |
|
| |
|
| |
|
| |
|
| |
|
| |
2006 | | | 1 | | | 1,000 | | | 0.0 | % | $ | 250 | | | 0.0 | % | $ | 0.25 | |
2007 | | | 2 | | | 3,955 | | | 0.1 | % | $ | 77,360 | | | 0.1 | % | $ | 19.56 | |
2008 | | | 1 | | | 7,965 | | | 0.2 | % | $ | 159,938 | | | 0.3 | % | $ | 20.08 | |
2009 | | | 0 | | | 0 | | | 0.0 | % | $ | 0 | | | 0.0 | % | $ | 0.00 | |
2010 | | | 1 | | | 8,878 | | | 0.2 | % | $ | 179,780 | | | 0.3 | % | $ | 20.25 | |
2011 | | | 3 | | | 99,542 | | | 2.1 | % | $ | 1,642,443 | | | 2.9 | % | $ | 16.50 | |
2012 | | | 2 | | | 37,052 | | | 0.8 | % | $ | 590,708 | | | 1.0 | % | $ | 15.94 | |
2013 | | | 4 | | | 128,354 | | | 2.7 | % | $ | 1,589,631 | | | 2.8 | % | $ | 12.38 | |
2014 | | | 2 | | | 149,949 | | | 3.0 | % | $ | 1,388,350 | | | 2.4 | % | $ | 9.26 | |
2015 | | | 2 | | | 45,107 | | | 0.9 | % | $ | 779,621 | | | 1.4 | % | $ | 17.28 | |
Beyond | | | 2 | | | 63,431 | | | 1.3 | % | $ | 1,466,603 | | | 2.6 | % | $ | 23.12 | |
| |
|
| |
|
| |
|
| |
|
| |
|
| |
|
| |
Total | | | 20 | | | 545,233 | | | 11.3 | % | $ | 7,874,684 | | | 13.8 | % | $ | 14.44 | |
|
1 | Lease expiration table reflects rents in place as of June 30, 2006 and does not include option periods; 2006 expirations include month-to-month tenants. This column also excludes ground leases. |
2 | Annualized Base Rent represents the monthly contractual rent for June 2006 for each applicable property, multiplied by 12. |
|
p. 25 | Kite Realty Group Supplemental Financial and Operating Statistics – 6/30/06 |
SUMMARY RETAIL PORTFOLIO STATISTICS
(INCLUDES JOINT VENTURE PROPERTIES)
Retail Portfolio | | 6/30/06 | | 3/31/06 | | 12/31/05 | | 9/30/05 | | 6/30/05 | |
| |
|
| |
|
| |
|
| |
|
| |
|
| |
Company Owned GLA1 – Operating Retail | | | 4,595,183 | | | 4,532,104 | | | 4,497,658 | | | 4,175,813 | | | 3,923,243 | |
Total GLA1 – Operating Retail | | | 6,698,265 | | | 6,650,386 | | | 6,160,940 | | | 5,685,320 | | | 5,356,973 | |
Projected Company Owned GLA Under Development2,4 | | | 581,281 | | | 696,896 | | | 690,161 | | | 628,100 | | | 946,700 | |
Projected Total GLA Under Development4 | | | 1,535,081 | | | 1,579,358 | | | 1,823,561 | | | 1,772,825 | | | 1,927,802 | |
| |
|
| |
|
| |
|
| |
|
| |
|
| |
Number of Operating Retail Properties | | | 43 | | | 42 | | | 40 | | | 37 | | | 36 | |
Number of Retail Properties Under Development4 | | | 11 | 4 | | 12 | | | 14 | | | 13 | | | 12 | |
| |
|
| |
|
| |
|
| |
|
| |
|
| |
Percentage Leased – Operating Retail | | | 93.0 | % | | 94.8 | % | | 95.3 | % | | 95.6 | % | | 93.8 | % |
| |
|
| |
|
| |
|
| |
|
| |
|
| |
Annualized Base Rent & Ground Lease Revenue - Retail Properties3 | | $ | 51,664,411 | | $ | 51,480,775 | | $ | 50,059,285 | | $ | 46,701,031 | | $ | 41,304,284 | |
|
1 | Company Owned GLA represents gross leasable area owned by the Company. Total GLA includes Company Owned GLA, plus square footage attributable to non-owned outlot structures on land owned by the Company and ground leased to tenants, and non-owned anchor space. |
2 | Projected Company Owned GLA Under Development represents gross leasable area under development that is projected to be owned by the Company. Projected Total GLA includes Projected Company Owned GLA, plus projected square footage attributable to non-owned outlot structures on land owned by the Company and ground leased to tenants, and non-owned anchor space that is existing or under construction. |
3 | Annualized Base Rent represents the monthly contractual rent for June 2006 for each applicable tenant, multiplied by 12. |
4 | Excludes Kedron Village, a property under construction with a completion commitment from the seller. Kedron Village contains 282,125 square feet of total GLA and 157,408 square feet of owned GLA. |
|
p. 26 | Kite Realty Group Supplemental Financial and Operating Statistics – 6/30/06 |
SUMMARY COMMERCIAL PORTFOLIO STATISTICS
(INCLUDES JOINT VENTURE PROPERTIES)
Commercial Portfolio | | 6/30/06 | | 3/31/06 | | 12/31/05 | | 9/30/05 | | 6/30/05 | |
| |
|
| |
|
| |
|
| |
|
| |
|
| |
Company Owned Net Rentable Area (NRA)1 | | | 562,652 | | | 562,652 | | | 562,652 | | | 662,652 | | | 662,652 | |
NRA under Development | | | — | | | — | | | — | | | — | | | — | |
| |
|
| |
|
| |
|
| |
|
| |
|
| |
Number of Operating Commercial Properties | | | 5 | | | 5 | | | 5 | | | 6 | | | 6 | |
Number of Commercial Properties under Development | | | — | | | — | | | — | | | — | | | — | |
| |
|
| |
|
| |
|
| |
|
| |
|
| |
Percentage Leased – Operating Commercial Properties | | | 96.9 | % | | 97.7 | % | | 97.3 | % | | 97.7 | % | | 97.7 | % |
Percentage Leased – Commercial Properties under Development | | | — | | | — | | | — | | | — | | | — | |
| |
|
| |
|
| |
|
| |
|
| |
|
| |
Annualized Base Rent – Commercial Properties2,3 | | $ | 7,874,683 | | $ | 7,959,366 | | $ | 7,909,489 | | $ | 9,624,510 | | $ | 9,624,510 | |
|
1 | Company Owned NRA does not include square footage of Union Station Parking Garage, a detached parking garage supporting the Thirty South property that includes 851 parking spaces. It is operated by Denison Parking, a third party, pursuant to a lease of the entire property. |
2 | Annualized Base Rent does not include approximately $500,000 in annualized income attributable to the Union Station Parking Garage. |
3 | Annualized Base Rent includes $779,621 from KRG and subsidiaries as of June 30, 2006. |
|
p. 27 | Kite Realty Group Supplemental Financial and Operating Statistics – 6/30/06 |
DEVELOPMENT PIPELINE
AS OF JUNE 30, 2006
2005 Deliveries/
2006 Stabilizations | | MSA | | Type of
Property | | Opening
Date1 | | Projected
Owned GLA2 | | Projected
Total GLA3 | | Percent
of Owned
GLA
Occupied9 | | Percent of
Owned
GLA Pre-Leased/
Committed5 | | Total
Estimated
Project
Cost4 | | Cost
Incurred
as of
June 30,
20064 | | Major Tenants
and Non-owned
Anchors | |
| |
|
| |
|
| |
|
| |
|
| |
|
| |
|
| |
|
| |
|
| |
|
| |
|
| |
Indiana | | | | | | | | | | | | | | | | | | | | | | | | | | | | | | | |
Geist Pavilion | | | Indianapolis, IN | | | Retail | | | Q1 – Q4 2005 11 Q4 2005 | | | 64,300 | | | 64,300 | | | 71.8 | % | | 84.0 | % | | 11,971 | | | 11,084 | | | Marsh Supermarkets/Party Tree | |
| | | | | | | | | | |
|
| |
|
| |
|
| |
|
| |
|
| |
|
| | | | |
Subtotal | | | | | | | | | | | | 64,300 | | | 64,300 | | | 71.8 | % | | 84.0 | % | $ | 11,971 | | $ | 11,084 | | | | |
| | | | | | | | | | |
|
| |
|
| |
|
| |
|
| |
|
| |
|
| | | | |
2006-2007 Deliveries | | MSA | | Type of
Property | | Opening
Date1 | | Projected
Owned GLA2 | | Projected
Total GLA3 | | Percent
of Owned
GLA Occupied9 | | Percent of
Owned
GLA Pre-Leased/
Committed5 | | Total
Estimated
Project
Cost4 | | Cost
Incurred
as of
June 30, 20064 | | Major Tenants
and Non-owned
Anchors | |
| |
|
| |
|
| |
|
| |
|
| |
|
| |
|
| |
|
| |
|
| |
|
| |
|
| |
Florida | | | | | | | | | | | | | | | | | | | | | | | | | | | | | | | |
Tarpon Springs Plaza | | | Naples, FL | | | Retail | | | Q1 2007 | | | 82,550 | | | 274,350 | | | 0.0 | % | | 96.6 | % | $ | 22,500 | | $ | 13,067 | | | Target (non-owned), Staples, Cost Plus, AC Moore | |
Estero Town Commons 6,7,8 | | | Naples, FL | | | Retail | | | Q3 2006 | | | 25,600 | | | 206,600 | | | 0.0 | % | | 92.9 | % | | 20,000 | | | 14,155 | | | Lowe’s Home Improvement | |
Indiana | | | | | | | | | | | | | | | | | | | | | | | | | | | | | | | |
Beacon Hill Shopping Center 7.8 | | | Crown Point, IN | | | Retail | | | Q3 2006 | | | 56,000 | | | 161,000 | | | 0.0 | % | | 27.5 | % | | 17,000 | | | 14,834 | | | Strack & VanTil’s (non-owned), Walgreens (non-owned) | |
Zionsville Place | | | Indianapolis, IN | | | Retail | | | Q3 2006 | | | 12,400 | | | 42,400 | | | 0.0 | % | | 51.6 | % | | 4,550 | | | 4,138 | | | | |
Stoney Creek Commons II | | | Indianapolis, IN | | | Retail | | | Q3 2006 | | | 49,330 | | | 219,530 | | | 61.4 | % | | 100.0 | % | | 6,000 | | | 4,979 | | | HH Gregg, Office Depot | |
Bridgewater Marketplace I | | | Indianapolis, IN | | | Retail | | | Q3 2006 | | | 40,879 | | | 50,879 | | | 0.0 | % | | 39.4 | % | | 15,000 | | | 6,283 | | | Walgreens (build-to-suit for sale) | |
Illinois | | | | | | | | | | | | | | | | | | | | | | | | | | | | | | | |
Naperville Marketplace | | | Chicago, IL | | | Retail | | | Q3 2006 | | | 100,000 | | | 170,000 | | | 0.0 | % | | 35.3 | % | | 16,500 | | | 10,392 | | | Caputo’s Fresh Market (non-owned, TJ Maxx) | |
Oregon | | | | | | | | | | | | | | | | | | | | | | | | | | | | | | | |
Cornelius Gateway Build-to-Suit For Sale7,8 | | | Portland, OR | | | Retail | | | Q2 2006 | | | 21,300 | | | 36,100 | | | 0.0 | % | | 5.7 | % | | 5,400 | | | 4,019 | | | Walgreens (non-owned) | |
Washington | | | | | | | | | | | | | | | | | | | | | | | | | | | | | | | |
Sandifur Plaza Build-to-Suit for Sale 6,7,8 | | | Tri-Cities, WA | | | Retail | | | Q4 2006 | | | 27,400 | | | 27,400 | | | 0.0 | % | | 80.3 | % | | 6,400 | | | 2,020 | | | Walgreens (build-to-suit for sale) | |
Gateway Shopping Center - Phase I & II6,7,8,10 | | | Seattle, WA | | | Retail | | | Q1 2007 | | | 76,522 | | | 282,522 | | | 0.0 | % | | 39.4 | % | | 24,300 | | | 9,023 | | | Kohl’s (non-owned), Winco (non-owned) | |
| | | | | | | | | | |
|
| |
|
| |
|
| |
|
| |
|
| |
|
| | | | |
Subtotal | | | | | | | | | | | | 491,981 | | | 1,470,781 | | | 6.2 | % | | 65.6 | % | $ | 137,650 | | $ | 82,910 | | | | |
| | | | | | | | | | |
|
| |
|
| |
|
| |
|
| |
|
| |
|
| | | | |
Total 12 | | | | | | | | | | | | 556,281 | | | 1,535,081 | | | 13.8 | % | | 67.2 | % | $ | 149,621 | | $ | 93,994 | | | | |
| | | | | | | | | | |
|
| |
|
| |
|
| |
|
| |
|
| |
|
| | | | |
|
1 | Opening Date is defined as the first date a tenant is open for business or a ground lease payment is made. |
2 | Projected Owned GLA represents gross leasable area the Company projects it will own. It excludes square footage that the Company projects will be attributable to non-owned outlot structures on land owned by the Company and expected to be ground leased to tenants. It also excludes non-owned anchor space. |
3 | Projected Total GLA includes Projected Owned GLA, projected square footage attributable to non-owned outlot structures on land that is owned by the Company, and non-owned anchor space that currently exists or is under construction. |
4 | Dollars in thousands. |
5 | Excludes land parcels owned by the Company and ground leased to tenants. Includes leases under negotiation for approximately 60,346 square feet for which the Company has signed non-binding letters of intent. |
6 | Opening Date and Total Estimated Cost based on preliminary siteplan. |
7 | Owned in a joint venture. |
8 | The Company owns the following development properties through joint ventures: Cornelius Gateway (80%); Sandifur Plaza (Walgreens 80%; small shops 95%); Beacon Hill (preferred return, then 50%); Gateway Shopping Center (preferred return, then 50% until internal rate of return threshold is reached and then 25%); and Estero Town Commons (preferred return, then 40%). |
9 | Includes tenants that have taken possession of their space or have begun paying rent. |
10 | In April 2006, the Company acquired Phase II, consisting of a 93,000 square-foot non-owned anchor, 45,000 square feet of small shops and two outlots. |
11 | The Phase I building opened Q1 2005. Phase II and Phase III buildings opened Q4 2005. |
12 | Excludes Kedron Village, a property under construction with a completion commitment from the seller. Kedron Village contains 282,125 square feet of total GLA and 157,408 square feet of owned GLA. |
|
p. 28 | Kite Realty Group Supplemental Financial and Operating Statistics – 6/30/06 |
GEOGRAPHIC DIVERSIFICATION – OPERATING PORTFOLIO1 | |
AS OF JUNE 30, 2006 | |
| | Number of
Operating
Properties | | Owned
GLA/NRA2 | | Percent of
Owned
GLA/NRA | | Total
Number of
Leases | | Annualized
Base Rent3 | | Percent of
Annualized
Base Rent | | Annualized
Base Rent per
Leased Sq. Ft. | |
| |
|
| |
|
| |
|
| |
|
| |
|
| |
|
| |
|
| |
Indiana | | | 21 | | | 2,182,678 | | | 42.3 | % | | 222 | | $ | 22,846,792 | | | 40.3 | % | $ | 11.78 | |
• Retail – Mall | | | 1 | | | 579,189 | | | 11.2 | % | | 37 | | $ | 2,115,079 | | | 3.7 | % | $ | 4.76 | |
• Retail | | | 15 | | | 1,040,837 | | | 20.2 | % | | 164 | | $ | 12,857,030 | | | 22.7 | % | $ | 13.49 | |
• Commercial | | | 5 | | | 562,652 | | | 10.9 | % | | 21 | | $ | 7,874,683 | | | 13.9 | % | $ | 14.44 | |
Texas | | | 8 | | | 1,136,250 | | | 22.0 | % | | 96 | | $ | 13,814,437 | | | 24.4 | % | $ | 12.23 | |
Florida | | | 9 | | | 1,001,206 | | | 19.4 | % | | 116 | | $ | 9,068,198 | | | 16.0 | % | $ | 9.81 | |
Illinois | | | 2 | | | 231,685 | | | 4.5 | % | | 35 | | $ | 3,079,366 | | | 5.4 | % | $ | 14.11 | |
New Jersey | | | 1 | | | 115,088 | | | 2.2 | % | | 17 | | $ | 1,785,570 | | | 3.2 | % | $ | 16.00 | |
Georgia | | | 2 | | | 142,707 | | | 2.8 | % | | 28 | | $ | 1,631,911 | | | 2.9 | % | $ | 11.44 | |
Washington | | | 3 | | | 102,146 | | | 2.0 | % | | 26 | | $ | 1,736,070 | | | 3.1 | % | $ | 17.16 | |
Ohio | | | 1 | | | 236,230 | | | 4.6 | % | | 7 | | $ | 2,353,767 | | | 4.2 | % | $ | 9.96 | |
Oregon | | | 1 | | | 9,845 | | | 0.2 | % | | 7 | | $ | 268,603 | | | 0.5 | % | $ | 27.28 | |
| |
|
| |
|
| |
|
| |
|
| |
|
| |
|
| |
|
| |
Total | | | 48 | | | 5,157,835 | | | 100.0 | % | | 554 | | $ | 56,669,396 | | | 100.0 | % | $ | 11.75 | |
| |
|
| |
|
| |
|
| |
|
| |
|
| |
|
| |
|
| |
|
1 | Excludes tenants at development properties that are Build-to-Suits for sale. |
2 | Owned GLA/NRA represents gross leasable area or net leasable area owned by the Company. It does not include 23 parcels or outlots owned by the Company and ground leased to tenants, which contain 23 non-owned structures totaling approximately 321,119 square feet. It also excludes the square footage of Union Station Parking Garage. |
3 | Annualized Base Rent excludes $2,954,380 in annualized ground lease revenue attributable to parcels and outlots owned by the Company and ground leased to tenants. It also excludes approximately $500,000 in 2006 annualized minimum rent attributable to Union Station Parking Garage as well as the leases on development properties. |
|
|
p. 29 | Kite Realty Group Supplemental Financial and Operating Statistics – 6/30/06 |
OPERATING RETAIL PROPERTIES – TABLE I |
|
AS OF JUNE 30, 2006 | |
Property 1,2 | | State | | MSA | | Year Built/
Renovated | | Year Added
to Operating
Portfolio | | Acquired,
Redeveloped, or
Developed | | Total
GLA2 | | Owned
GLA2 | | Percentage of
Owned GLA
Leased3 | |
| |
| |
| |
| |
| |
| |
|
| |
|
| |
|
| |
International Speedway Square | | FL | | Daytona | | 1999 | | 1999 | | Developed | | | 233,901 | | | 220,901 | | | 98.2 | % |
King’s Lake Square | | FL | | Naples | | 1986 | | 2003 | | Acquired | | | 85,497 | | | 85,497 | | | 97.5 | % |
Wal-Mart Plaza 4 | | FL | | Gainesville | | 1970 | | 2004 | | Acquired | | | 177,826 | | | 177,826 | | | 100.0 | % |
Waterford Lakes | | FL | | Orlando | | 1997 | | 2004 | | Acquired | | | 77,948 | | | 77,948 | | | 100.0 | % |
Shops at Eagle Creek | | FL | | Naples | | 1998 | | 2003 | | Acquired | | | 75,944 | | | 75,944 | | | 23.8 | %10 |
Eagle Creek Lowe’s | | FL | | Naples | | 2006 | | 2006 | | Developed | | | 165,000 | | | 0 | | | | * |
Circuit City Plaza | | FL | | Coral Springs | | 2004 | | 2004 | | Developed | | | 435,906 | | | 45,906 | | | 97.1 | % |
Indian River Square | | FL | | Vero Beach | | 1997/2004 | | 2005 | | Acquired | | | 379,246 | | | 144,246 | | | 100.0 | % |
Bolton Plaza | | FL | | Jacksonville | | 1986 | | 2005 | | Acquired | | | 172,938 | | | 172,938 | | | 93.5 | % |
Centre at Panola | | GA | | Atlanta | | 2001 | | 2004 | | Acquired | | | 73,079 | | | 73,079 | | | 100.0 | % |
Publix at Acworth | | GA | | Atlanta | | 1996 | | 2004 | | Acquired | | | 69,628 | | | 69,628 | | | 100.0 | % |
Silver Glen Crossing | | IL | | Chicago | | 2002 | | 2004 | | Acquired | | | 138,162 | | | 132,613 | | | 94.9 | % |
Fox Lake Crossing | | IL | | Chicago | | 2002 | | 2005 | | Acquired | | | 99,072 | | | 99,072 | | | 93.3 | % |
Glendale Mall | | IN | | Indianapolis | | 1958/2000 | | 1999 | | Redeveloped | | | 724,026 | | | 579,189 | | | 76.8 | % |
Cool Creek Commons | | IN | | Indianapolis | | 2005 | | 2005 | | Developed | | | 133,207 | | | 120,678 | | | 92.8 | % |
Boulevard Crossing | | IN | | Kokomo | | 2004 | | 2004 | | Developed | | | 214,696 | | | 124,696 | | | 93.2 | % |
Traders Point | | IN | | Indianapolis | | 2005 | | 2005 | | Developed | | | 328,278 | | | 252,501 | | | 94.3 | % |
Traders Point II | | IN | | Indianapolis | | 2005 | | 2005 | | Developed | | | 46,600 | | | 46,600 | | | 53.8 | % |
Hamilton Crossing | | IN | | Indianapolis | | 1999 | | 2004 | | Acquired | | | 87,424 | | | 82,424 | | | 100.0 | % |
Fishers Station 5 | | IN | | Indianapolis | | 1989 | | 2004 | | Acquired | | | 114,457 | | | 114,457 | | | 84.4 | % |
Whitehall Pike | | IN | | Bloomington | | 1999 | | 1999 | | Developed | | | 128,997 | | | 128,997 | | | 100.0 | % |
The Centre 6 | | IN | | Indianapolis | | 1986 | | 1986 | | Developed | | | 80,689 | | | 80,689 | | | 88.2 | % |
The Corner Shops | | IN | | Indianapolis | | 1984/2003 | | 1984 | | Developed | | | 42,545 | | | 42,545 | | | 100.0 | % |
Stoney Creek Commons I | | IN | | Indianapolis | | 2000 | | 2000 | | Developed | | | 140,197 | | | 0 | | | | * |
Greyhound Commons | | IN | | Indianapolis | | 2005 | | 2005 | | Developed | | | 153,187 | | | 0 | | | | * |
Weston Park Phase I | | IN | | Indianapolis | | 2005 | | 2005 | | Developed | | | 12,200 | | | 0 | | | | * |
Red Bank Commons | | IN | | Evansville | | 2005 | | 2006 | | Developed | | | 324,264 | | | 34,264 | | | 78.1 | % |
Martinsville Shops | | IN | | Martinsville | | 2005 | | 2005 | | Developed | | | 10,986 | | | 10,986 | | | 100.0 | % |
50 South Morton | | IN | | Indianapolis | | 1999 | | 1999 | | Developed | | | 2,000 | | | 2,000 | | | 100.0 | % |
Ridge Plaza | | NJ | | Oak Ridge | | 2002 | | 2003 | | Acquired | | | 115,088 | | | 115,088 | | | 96.9 | % |
Eastgate Pavilion | | OH | | Cincinnati | | 1995 | | 2004 | | Acquired | | | 236,230 | | | 236,230 | | | 100.0 | % |
Shops at Otty 7 | | OR | | Portland | | 2004 | | 2004 | | Developed | | | 154,845 | | | 9,845 | | | 100.0 | % |
Plaza at Cedar Hill | | TX | | Dallas | | 2000 | | 2004 | | Acquired | | | 299,847 | | | 299,847 | | | 100.0 | % |
Sunland Towne Centre | | TX | | El Paso | | 1996 | | 2004 | | Acquired | | | 312,539 | | | 307,563 | | | 99.5 | % |
Galleria Plaza 8 | | TX | | Dallas | | 2002 | | 2004 | | Acquired | | | 44,306 | | | 44,306 | | | 100.0 | % |
Cedar Hill Village | | TX | | Dallas | | 2002 | | 2004 | | Acquired | | | 139,092 | | | 44,262 | | | 94.2 | % |
Preston Commons | | TX | | Dallas | | 2002 | | 2002 | | Developed | | | 142,564 | | | 27,564 | | | 90.0 | % |
Burlington Coat Factory 9 | | TX | | San Antonio | | 1992/2000 | | 2000 | | Redeveloped | | | 107,400 | | | 107,400 | | | 100.0 | % |
Plaza Volente | | TX | | Austin | | 2004 | | 2005 | | Acquired | | | 160,308 | | | 156,308 | | | 100.0 | % |
Market Street Village | | TX | | Hurst | | 1970/2004 | | 2005 | | Acquired | | | 156,000 | | | 149,000 | | | 100.0 | % |
50th & 12th | | WA | | Seattle | | 2004 | | 2004 | | Developed | | | 14,500 | | | 14,500 | | | 100.0 | % |
176th & Meridian | | WA | | Seattle | | 2004 | | 2004 | | Developed | | | 14,560 | | | 14,560 | | | 100.0 | % |
Four Corner Square | | WA | | Seattle | | 1985 | | 2004 | | Acquired | | | 73,086 | | | 73,086 | | | 98.6 | % |
| | | | | | | | | | | |
|
| |
|
| |
|
| |
| | | | | | | | | | TOTAL | | | 6,698,265 | | | 4,595,183 | | | 93.0 | % |
| | | | | | | | | | | |
|
| |
|
| |
|
| |
|
(*) | Property consists of ground leases only, no Owned GLA. As of 6/30/06, the following were leased: Lowe’s at Eagle Creek – single ground lease property; Stoney Creek Commons – one outlot remains to be leased at this property, which will be merged with Stoney Creek II as shown on the Development Pipeline; Greyhound Commons – two of four outlots leased; and Weston Park Phase I – two of three outlots leased. |
| |
1 | All properties are wholly owned, except as indicated. Unless otherwise noted, each property is owned in fee simple by the Company. |
2 | Owned GLA represents gross leasable area that is owned by the Company. Total GLA includes Owned GLA, square footage attributable to non-owned anchor space and non-owned structures on ground leases. |
3 | Percentage of Owned GLA Leased reflects Owned GLA/NRA leased as of June 30, 2006 except for Stoney Creek Commons, Greyhound Commons, Weston Park Phase I (see *) and Eagle Creek Lowe’s Home Improvement. |
4 | The Company acquired a 99.9% interest in this property through a joint venture with a third party that manages the property. At the current time, The Company receives 85% of the cash flow from the property, a percentage that may decrease under certain circumstances. |
5 | This property is divided into two parcels: a grocery store and small shops. The Company owns a 25% interest in the small shops in a joint venture and a 100% interest in the grocery store. The joint venture partner is entitled to an annual preferred payment of $96,000. All remaining cash flow is distributed to the Company. |
6 | The Company owns a 60% interest in this property through a joint venture with a third party that manages the property. |
7 | The Company does not own the land at this property. It has leased the land pursuant to two ground leases that expire in 2017. The Company has six five-year options to renew this lease. |
8 | The Company does not own the land at this property. It has leased the land pursuant to a ground lease that expires in 2027. The Company has five five-year renewal options. |
9 | The Company does not own the land at this property. It has leased the land pursuant to a ground lease that expires in 2012. The Company has six five-year renewal options and a right of first refusal to purchase the land. |
10 | In May 2006, the Company acquired and terminated the Winn-Dixie lease. The space is being marketed to multiple potential retail tenants. |
|
|
p. 30 | Kite Realty Group Supplemental Financial and Operating Statistics – 6/30/06 |
OPERATING RETAIL PROPERTIES – TABLE II |
|
AS OF JUNE 30, 2006 | |
Property | | State | | MSA | | Annualized
Base Rent
Revenue | | Annualized
Ground
Lease
Revenue | | Annualized
Total Retail
Revenue 1 | | Percentage of
Annualized
Total Retail
Revenue | | Base Rent
Per Leased
Owned GLA2 | | Major Tenants and Non-Owned Anchors3 |
| |
| |
| |
|
| |
|
| |
|
| |
|
| |
|
| |
|
RETAIL OPERATING PROPERTIES | | | | | | | | | | | | | | | | | | | | | |
International Speedway Square 4 | | FL | | Daytona | | $ | 2,422,964 | | $ | 232,900 | | $ | 2,655,864 | | | 5.0 | % | $ | 11.17 | | SteinMart, Bed, Bath & Beyond, Circuit City |
King’s Lake Square | | FL | | Naples | | $ | 1,065,438 | | $ | 0 | | $ | 1,065,438 | | | 2.1 | % | $ | 12.78 | | Publix, Walgreens |
Wal-Mart Plaza4 | | FL | | Gainesville | | $ | 927,276 | | $ | 0 | | $ | 927,276 | | | 1.8 | % | $ | 5.21 | | Wal-Mart, Books-A-Million, Save A Lot |
Waterford Lakes | | FL | | Orlando | | $ | 915,834 | | $ | 0 | | $ | 915,834 | | | 1.8 | % | $ | 11.75 | | Winn-Dixie5 |
Shops at Eagle Creek | | FL | | Naples | | $ | 382,603 | | $ | 0 | | $ | 382,603 | | | 0.7 | % | $ | 21.14 | | |
Eagle Creek Lowe’s | | FL | | Naples | | $ | 0 | | $ | 800,000 | | $ | 800,000 | | | 1.6 | % | | | | Lowe’s Home Improvement |
Circuit City Plaza | | FL | | Coral Springs | | $ | 881,277 | | $ | 0 | | $ | 881,277 | | | 1.7 | % | $ | 19.78 | | Circuit City, Wal-Mart (non-owned), Lowe’s Home Improvement (non-owned) |
Indian River Square | | FL | | Vero Beach | | $ | 1,421,952 | | $ | 0 | | $ | 1,421,952 | | | 2.8 | % | $ | 9.86 | | Office Depot, Bealls, Ragshop, Lowe’s Home Improvement (non-owned), Target (non-owned) |
Bolton Plaza 4 | | FL | | Jacksonville | | $ | 1,050,853 | | $ | 0 | | $ | 1,050,853 | | | 2.0 | % | $ | 6.50 | | Wal-Mart |
Centre at Panola | | GA | | Atlanta | | $ | 834,312 | | $ | 0 | | $ | 834,312 | | | 1.6 | % | $ | 11.42 | | Publix |
Publix at Acworth | | GA | | Atlanta | | $ | 797,599 | | $ | 0 | | $ | 797,599 | | | 1.5 | % | $ | 11.46 | | Publix, CVS |
Silver Glen Crossing | | IL | | Chicago | | $ | 1,796,741 | | $ | 85,000 | | $ | 1,881,741 | | | 3.6 | % | $ | 14.28 | | Dominick’s, MC Sports |
Fox Lake Crossing | | IL | | Chicago | | $ | 1,282,625 | | $ | 0 | | $ | 1,282,625 | | | 2.5 | % | $ | 13.87 | | Dominick’s |
Glendale Mall | | IN | | Indianapolis | | $ | 2,115,079 | | $ | 148,500 | | $ | 2,263,579 | | | 4.4 | % | $ | 4.76 | | L.S. Ayres, Kerasotes Theatre, Lowe’s Home Improvement (non-owned) |
Cool Creek Commons | | IN | | Indianapolis | | $ | 1,705,404 | | $ | 155,500 | | $ | 1,860,904 | | | 3.6 | % | $ | 15.24 | | Fresh Market, Stein Mart |
Boulevard Crossing | | IN | | Kokomo | | $ | 1,541,705 | | $ | 0 | | $ | 1,541,705 | | | 3.0 | % | $ | 13.27 | | TJ Maxx, PETCO, Shoe Carnival, Kohl’s (non-owned) |
Traders Point | | IN | | Indianapolis | | $ | 3,271,770 | | $ | 635,000 | | $ | 3,906,770 | | | 7.5 | % | $ | 13.74 | | Dick’s Sporting Goods, Bed Bath & Beyond, Michaels, Marsh Supermarkets, Books-A-Million, Old Navy |
Traders Point II | | IN | | Indianapolis | | $ | 657,113 | | $ | 0 | | $ | 657,113 | | | 1.3 | % | $ | 26.22 | | |
Hamilton Crossing | | IN | | Indianapolis | | $ | 1,396,773 | | $ | 71,500 | | $ | 1,468,273 | | | 2.8 | % | $ | 16.95 | | Office Depot |
Fishers Station | | IN | | Indianapolis | | $ | 1,181,759 | | $ | 0 | | $ | 1,181,759 | | | 2.3 | % | $ | 12.24 | | Marsh Supermarket |
Whitehall Pike | | IN | | Bloomington | | $ | 1,014,000 | | $ | 0 | | $ | 1,014,000 | | | 2.0 | % | $ | 7.86 | | Lowe’s Home Improvement |
The Centre 4 | | IN | | Indianapolis | | $ | 904,671 | | $ | 0 | | $ | 904,671 | | | 1.8 | % | $ | 12.71 | | Osco |
The Corner Shops | | IN | | Indianapolis | | $ | 524,431 | | $ | 0 | | $ | 524,431 | | | 1.0 | % | $ | 12.33 | | Hancock Fabrics |
Stoney Creek Commons | | IN | | Indianapolis | | $ | 0 | | $ | 0 | | $ | 0 | | | 0.0 | % | | | | Lowe’s Home Improvement (non-owned) |
Greyhound Commons | | IN | | Indianapolis | | $ | 0 | | $ | 202,500 | | $ | 202,500 | | | 0.4 | % | | | | Lowe’s Home Improvement (non-owned) |
Weston Park Phase I | | IN | | Indianapolis | | $ | 0 | | $ | 190,000 | | $ | 190,000 | | | 0.4 | % | | | | |
Red Bank Commons | | IN | | Evansville | | $ | 379,784 | | $ | 0 | | $ | 379,784 | | | 0.7 | % | $ | 14.19 | | Wal-Mart (non-owned) Home Depot (non-owned) |
Martinsville Shops | | IN | | Martinsville | | $ | 147,620 | | $ | 0 | | $ | 147,620 | | | 0.3 | % | $ | 13.44 | | |
50 South Morton | | IN | | Indianapolis | | $ | 132,000 | | $ | 0 | | $ | 132,000 | | | 0.3 | % | $ | 66.00 | | |
Ridge Plaza | | NJ | | Oak Ridge | | $ | 1,785,570 | | $ | 0 | | $ | 1,785,570 | | | 3.5 | % | $ | 16.00 | | A&P, CVS |
Eastgate Pavilion | | OH | | Cincinnati | | $ | 2,353,767 | | $ | 0 | | $ | 2,353,767 | | | 4.6 | % | $ | 9.96 | | Dick’s Sporting Goods, Value City Furniture, Best Buy |
Shops at Otty | | OR | | Portland | | $ | 268,603 | | $ | 122,500 | | $ | 391,103 | | | 0.8 | % | $ | 27.28 | | Wal-Mart (non-owned) |
Plaza at Cedar Hill | | TX | | Dallas | | $ | 3,599,112 | | $ | 0 | | $ | 3,599,112 | | | 7.0 | % | $ | 12.00 | | Hobby Lobby, Linens ‘N Things, Marshall’s |
Sunland Towne Centre | | TX | | El Paso | | $ | 2,999,572 | | $ | 95,280 | | $ | 3,094,852 | | | 6.0 | % | $ | 9.80 | | Kmart, Circuit City, Roomstore |
Galleria Plaza | | TX | | Dallas | | $ | 1,081,717 | | $ | 0 | | $ | 1,081,717 | | | 2.1 | % | $ | 24.41 | | Shoe Pavilion |
Cedar Hill Village | | TX | | Dallas | | $ | 673,085 | | $ | 0 | | $ | 673,085 | | | 1.3 | % | $ | 16.14 | | 24 Hour Fitness, JCPenney (non-owned) |
Preston Commons | | TX | | Dallas | | $ | 590,338 | | $ | 0 | | $ | 590,338 | | | 1.1 | % | $ | 23.80 | | Lowe’s Home Improvement (non-owned) |
Burlington Coat Factory | | TX | | San Antonio | | $ | 510,150 | | $ | 0 | | $ | 510,150 | | | 1.0 | % | $ | 4.75 | | Burlington Coat Factory |
Plaza Volente | | TX | | Austin | | $ | 2,449,104 | | $ | 100,000 | | $ | 2,549,104 | | | 4.9 | % | $ | 15.67 | | H-E-B Grocery |
Market Street Village | | TX | | Hurst | | $ | 1,911,358 | | $ | 115,700 | | $ | 2,027,058 | | | 3.9 | % | $ | 12.83 | | Ross, Office Depot, JoAnn’s, Circuit City, Hancock Fabrics |
50th & 12th | | WA | | Seattle | | $ | 475,000 | | $ | 0 | | $ | 475,000 | | | 0.9 | % | $ | 32.76 | | Walgreens |
176th & Meridian | | WA | | Seattle | | $ | 433,000 | | $ | 0 | | $ | 433,000 | | | 0.8 | % | $ | 29.74 | | Walgreens |
Four Corner Square | | WA | | Seattle | | $ | 828,070 | | $ | 0 | | $ | 828,070 | | | 1.6 | % | $ | 11.49 | | Johnson Hardware Store |
| | | | | |
|
| |
|
| |
|
| |
|
| |
|
| | |
| | | | TOTAL | | $ | 48,710,031 | | $ | 2,954,380 | | $ | 51,664,411 | | | 100.0% | | $ | 11.40 | | |
| | | | | |
|
| |
|
| |
|
| |
|
| |
|
| | |
|
1 | Annualized Base Rent represents the contractual rent for June 2006 for each applicable property, multiplied by 12. This table does not include Annualized Base Rent from development property tenants open for business as of June 30, 2006. |
2 | Owned GLA represents gross leasable area that is owned by the Company. Total GLA includes Owned GLA, square footage attributable to non-owned anchor space and non-owned structures on ground leases. |
3 | Represents the three largest tenants that occupy at least 10,000 square feet of GLA at the property, including non-owned anchors. |
4 | A third party manages this property. |
5 | In February 2005, Winn-Dixie Stores, Inc. filed a petition for Chapter 11 bankruptcy to reorganize its business operations. As of June 30, 2006, Winn-Dixie had not announced plans to close the Waterford Lakes store, nor had it rejected the lease. In a public announcement, Winn-Dixie included the store at Waterford Lakes on its list of stores it intended to retain as of that date. |
|
|
p. 31 | Kite Realty Group Supplemental Financial and Operating Statistics – 6/30/06 |
OPERATING COMMERCIAL PROPERTIES |
|
AS OF JUNE 30, 2006 | |
Property | | MSA | | Year
Built/
Renovated | | Acquired,
Redeveloped,
or Developed | | Owned NRA | | Percentage of
Owned NRA
Leased | | Annualized
Base Rent1 | | Percentage of
Annualized
Commercial
Base Rent | | | Base Rent
Per Leased
Sq. Ft. | | Major Tenants |
| |
| |
| |
| |
|
| |
|
| |
|
| |
|
| |
|
| |
|
Indiana | | | | | | | | | | | | | | | | | | | | | | | |
Thirty South4 | | Indianapolis | | 1905/2002 | | Redeveloped | | | 298,346 | | | 95.7 | % | $ | 4,901,394 | | | 62.3 | % | $ | 17.45 | | Eli Lilly, City Securities, Kite Realty Group |
PEN Products | | Indianapolis | | 2003 | | Developed | | | 85,875 | | | 100.0 | % | | 813,236 | | | 10.3 | % | | 9.47 | | Indiana Department of Administration |
Spring Mill Medical2 | | Indianapolis | | 1998/2002 | | Redeveloped | | | 63,431 | | | 100.0 | % | | 1,466,603 | | | 18.6 | % | | 23.12 | | University Medical Diagnostic Associates; Indiana University Healthcare Associates |
Union Station Parking Garage3 | | Indianapolis | | 1986 | | Acquired | | | N/A | | | N/A | | | N/A | | | N/A | | | N/A | | Denison Parking |
Indiana State Motor Pool | | Indianapolis | | 2004 | | Developed | | | 115,000 | | | 100.0 | % | | 693,450 | | | 8.8 | % | | 6.03 | | Indiana Dept. of Administration |
| | | | | | | |
|
| |
|
| |
|
| |
|
| |
|
| | |
Total | | | | | | | | | 562,652 | | | 96.9 | % | $ | 7,874,683 | | | 100.0 | % | $ | 14.44 | | |
| | | | | | | |
|
| |
|
| |
|
| |
|
| |
|
| | |
|
1 | Annualized Base Rent represents the monthly contractual rent for June 2006 for each applicable property, multiplied by 12. |
2 | The Company owns a 50% interest in this property through a joint venture with one of the tenants at this property. |
3 | Annualized Base Rent for 2006 is approximately $500,000. |
4 | Annualized Base Rent includes $779,621 from KRG and subsidiaries as of June 30, 2006. |
|
|
p. 32 | Kite Realty Group Supplemental Financial and Operating Statistics – 6/30/06 |
RETAIL OPERATING PORTFOLIO – TENANT BREAKDOWN1 |
|
AS OF JUNE 30, 2006 | |
| | Owned Gross Leasable Area | | Occupancy |
| |
| |
|
Property | | State | | Anchors | | Shops | | Total | | Anchors | | Shops | | Total | |
| |
|
| |
|
| |
|
| |
|
| |
|
| |
|
| |
|
| |
ISS | | | FL | | | 200,401 | | | 20,500 | | | 220,901 | | | 100.0 | % | | 80.4 | % | | 98.2 | % |
King’s Lake Square | | | FL | | | 49,805 | | | 35,692 | | | 85,497 | | | 100.0 | % | | 94.0 | % | | 97.5 | % |
Wal-Mart Plaza | | | FL | | | 138,323 | | | 39,503 | | | 177,826 | | | 100.0 | % | | 100.0 | % | | 100.0 | % |
Waterford Lakes | | | FL | | | 51,703 | | | 26,245 | | | 77,948 | | | 100.0 | % | | 100.0 | % | | 100.0 | % |
Shops at Eagle Creek | | | FL | | | 51,703 | | | 24,241 | | | 75,944 | | | 0.0 | % | | 74.7 | % | | 23.8 | % |
Eagle Creek Lowe’s | | | FL | | | | | | | | | | | | | | | | | | | |
Circuit City Plaza | | | FL | | | 33,014 | | | 12,892 | | | 45,906 | | | 100.0 | % | | 89.5 | % | | 97.1 | % |
Indian River Square | | | FL | | | 116,342 | | | 27,904 | | | 144,246 | | | 100.0 | % | | 100.0 | % | | 100.0 | % |
Bolton Plaza | | | FL | | | 131,488 | | | 41,450 | | | 172,938 | | | 100.0 | % | | 73.0 | % | | 93.5 | % |
Centre at Panola | | | GA | | | 51,674 | | | 21,405 | | | 73,079 | | | 100.0 | % | | 100.0 | % | | 100.0 | % |
Publix at Acworth | | | GA | | | 37,888 | | | 31,740 | | | 69,628 | | | 100.0 | % | | 100.0 | % | | 100.0 | % |
Silver Glen Crossing | | | IL | | | 78,675 | | | 53,938 | | | 132,613 | | | 100.0 | % | | 87.4 | % | | 94.9 | % |
Fox Lake Crossing | | | IL | | | 65,977 | | | 33,095 | | | 99,072 | | | 100.0 | % | | 80.1 | % | | 93.3 | % |
Glendale Mall | | | IN | | | 437,702 | | | 141,487 | | | 579,189 | | | 86.5 | % | | 46.6 | % | | 76.8 | % |
Cool Creek Commons | | | IN | | | 53,600 | | | 67,078 | | | 120,678 | | | 100.0 | % | | 87.0 | % | | 92.8 | % |
Boulevard Crossing | | | IN | | | 74,440 | | | 50,256 | | | 124,696 | | | 100.0 | % | | 83.0 | % | | 93.2 | % |
Traders Point | | | IN | | | 211,664 | | | 40,837 | | | 252,501 | | | 100.0 | % | | 64.8 | % | | 94.3 | % |
Traders Point II | | | IN | | | 0 | | | 46,600 | | | 46,600 | | | | | | 53.8 | % | | 53.8 | % |
Hamilton Crossing | | | IN | | | 30,722 | | | 51,702 | | | 82,424 | | | 100.0 | % | | 100.0 | % | | 100.0 | % |
Fishers Station | | | IN | | | 57,000 | | | 57,457 | | | 114,457 | | | 100.0 | % | | 68.9 | % | | 84.4 | % |
Whitehall Pike | | | IN | | | 128,997 | | | 0 | | | 128,997 | | | 100.0 | % | | 100.0 | % | | | |
The Centre | | | IN | | | 18,720 | | | 61,969 | | | 80,689 | | | 100.0 | % | | 84.7 | % | | 88.2 | % |
The Corner Shops | | | IN | | | 12,200 | | | 30,345 | | | 42,545 | | | 100.0 | % | | 100.0 | % | | 100.0 | % |
Stoney Creek Commons I | | | IN | | | | | | | | | | | | | | | | | | | |
Greyhound Commons | | | IN | | | | | | | | | | | | | | | | | | | |
Weston Park Phase I | | | IN | | | | | | | | | | | | | | | | | | | |
Red Bank Commons | | | IN | | | 0 | | | 34,264 | | | 34,264 | | | | | | 78.1 | % | | 78.1 | % |
Martinsville Shops | | | IN | | | 0 | | | 10,986 | | | 10,986 | | | | | | 100.0 | % | | 100.0 | % |
50 South Morton | | | IN | | | 0 | | | 2,000 | | | 2,000 | | | | | | 100.0 | % | | 100.0 | % |
Ridge Plaza | | | NJ | | | 69,612 | | | 45,476 | | | 115,088 | | | 100.0 | % | | 92.3 | % | | 97.0 | % |
Eastgate Pavilion | | | OH | | | 231,730 | | | 4,500 | | | 236,230 | | | 100.0 | % | | | | | 100.0 | % |
Shops at Otty | | | OR | | | 0 | | | 9,845 | | | 9,845 | | | | | | 100.0 | % | | 100.0 | % |
Plaza at Cedar Hill | | | TX | | | 227,106 | | | 72,741 | | | 299,847 | | | 100.0 | % | | 100.0 | % | | 100.0 | % |
Sunland Towne Centre | | | TX | | | 277,220 | | | 30,343 | | | 307,563 | | | 100.0 | % | | 95.1 | % | | 99.5 | % |
Galleria Plaza | | | TX | | | 31,396 | | | 12,910 | | | 44,306 | | | 100.0 | % | | 100.0 | % | | 100.0 | % |
Cedar Hill Village | | | TX | | | 32,231 | | | 12,031 | | | 44,262 | | | 100.0 | % | | 78.8 | % | | 94.2 | % |
Preston Commons | | | TX | | | 0 | | | 27,564 | | | 27,564 | | | | | | 90.0 | % | | 90.0 | % |
Burlington Coat Factory | | | TX | | | 107,400 | | | 0 | | | 107,400 | | | 100.0 | % | | | | | 100.0 | % |
Plaza Volente | | | TX | | | 105,000 | | | 51,308 | | | 156,308 | | | 100.0 | % | | 100.0 | % | | 100.0 | % |
Market Street Village | | | TX | | | 136,746 | | | 12,254 | | | 149,000 | | | 100.0 | % | | 100.0 | % | | 100.0 | % |
50th & 12th | | | WA | | | 14,500 | | | 0 | | | 14,500 | | | 100.0 | % | | | | | 100.0 | % |
176th & Meridian | | | WA | | | 14,560 | | | 0 | | | 14,560 | | | 100.0 | % | | | | | 100.0 | % |
Four Corner Square | | | WA | | | 20,512 | | | 52,574 | | | 73,086 | | | 100.0 | % | | 98.1 | % | | 98.6 | % |
| | | | |
|
| |
|
| |
|
| |
|
| |
|
| |
|
| |
Total | | | | | | 3,300,051 | | | 1,295,132 | | | 4,595,183 | | | 96.7 | % | | 83.5 | % | | 93.0 | % |
| | | | |
|
| |
|
| |
|
| |
|
| |
|
| |
|
| |
| | Annualized Base Rent1 | | Annualized Base Rent per Occupied Sq. Ft. | |
| |
| |
| |
Property | | Anchors | | Shops | | Ground
Leases | | Total | | Anchors | | Shops | | Total | |
| |
|
| |
|
| |
|
| |
|
| |
|
| |
|
| |
|
| |
ISS | | $ | 2,118,321 | | $ | 304,643 | | $ | 232,900 | | $ | 2,655,864 | | $ | 10.57 | | $ | 18.49 | | $ | 11.17 | |
King’s Lake Square | | $ | 361,793 | | $ | 703,645 | | $ | 0 | | $ | 1,065,438 | | $ | 7.26 | | $ | 20.97 | | $ | 12.78 | |
Wal-Mart Plaza | | $ | 538,544 | | $ | 388,732 | | $ | 0 | | $ | 927,276 | | $ | 3.89 | | $ | 9.84 | | $ | 5.21 | |
Waterford Lakes | | $ | 408,452 | | $ | 507,382 | | $ | 0 | | $ | 915,834 | | $ | 7.90 | | $ | 19.33 | | $ | 11.75 | |
Shops at Eagle Creek | | $ | 0 | | $ | 382,603 | | $ | 0 | | $ | 382,603 | | | | | $ | 21.14 | | $ | 21.14 | |
Eagle Creek Lowe’s | | $ | 0 | | $ | 0 | | $ | 800,000 | | $ | 800,000 | | | | | | | | | | |
Circuit City Plaza | | $ | 594,252 | | $ | 287,025 | | $ | 0 | | $ | 881,277 | | $ | 18.00 | | $ | 24.88 | | $ | 19.78 | |
Indian River Square | | $ | 942,078 | | $ | 479,874 | | $ | 0 | | $ | 1,421,952 | | $ | 8.10 | | $ | 17.20 | | $ | 9.86 | |
Bolton Plaza | | $ | 621,444 | | $ | 429,409 | | $ | 0 | | $ | 1,050,853 | | $ | 4.73 | | $ | 14.20 | | $ | 6.50 | |
Centre at Panola | | $ | 413,388 | | $ | 420,924 | | $ | 0 | | $ | 834,312 | | $ | 8.00 | | $ | 19.66 | | $ | 11.42 | |
Publix at Acworth | | $ | 337,203 | | $ | 460,396 | | $ | 0 | | $ | 797,599 | | $ | 8.90 | | $ | 14.51 | | $ | 11.46 | |
Silver Glen Crossing | | $ | 812,916 | | $ | 983,825 | | $ | 85,000 | | $ | 1,881,741 | | $ | 10.33 | | $ | 20.88 | | $ | 14.28 | |
Fox Lake Crossing | | $ | 742,241 | | $ | 540,384 | | $ | 0 | | $ | 1,282,625 | | $ | 11.25 | | $ | 20.40 | | $ | 13.87 | |
Glendale Mall | | $ | 1,295,905 | | $ | 819,174 | | $ | 148,500 | | $ | 2,263,579 | | $ | 3.42 | | $ | 12.41 | | $ | 4.76 | |
Cool Creek Commons | | $ | 439,200 | | $ | 1,266,204 | | $ | 155,500 | | $ | 1,860,904 | | $ | 8.19 | | $ | 21.70 | | $ | 15.24 | |
Boulevard Crossing | | $ | 827,460 | | $ | 714,245 | | $ | 0 | | $ | 1,541,705 | | $ | 11.12 | | $ | 17.12 | | $ | 13.27 | |
Traders Point | | $ | 2,645,267 | | $ | 626,504 | | $ | 635,000 | | $ | 3,906,771 | | $ | 12.50 | | $ | 23.67 | | $ | 13.74 | |
Traders Point II | | $ | 0 | | $ | 657,113 | | $ | 0 | | $ | 657,113 | | | | | $ | 26.22 | | $ | 26.22 | |
Hamilton Crossing | | $ | 345,623 | | $ | 1,051,150 | | $ | 71,500 | | $ | 1,468,273 | | $ | 11.25 | | $ | 20.33 | | $ | 16.95 | |
Fishers Station | | $ | 575,000 | | $ | 606,759 | | $ | 0 | | $ | 1,181,759 | | $ | 10.09 | | $ | 15.34 | | $ | 12.24 | |
Whitehall Pike | | $ | 1,014,000 | | $ | 0 | | $ | 0 | | $ | 1,014,000 | | $ | 7.86 | | $ | 7.86 | | | | |
The Centre | | $ | 170,352 | | $ | 734,319 | | $ | 0 | | $ | 904,671 | | $ | 9.10 | | $ | 14.00 | | $ | 12.71 | |
The Corner Shops | | $ | 73,200 | | $ | 451,231 | | $ | 0 | | $ | 524,431 | | $ | 6.00 | | $ | 14.87 | | $ | 12.33 | |
Stoney Creek Commons I | | $ | 0 | | $ | 0 | | $ | 0 | | $ | 0 | | | | | | | | | | |
Greyhound Commons | | $ | 0 | | $ | 0 | | $ | 202,500 | | $ | 202,500 | | | | | | | | | | |
Weston Park Phase I | | $ | 0 | | $ | 0 | | $ | 190,000 | | $ | 190,000 | | | | | | | | | | |
Red Bank Commons | | $ | 0 | | $ | 379,784 | | $ | 0 | | $ | 379,784 | | | | | $ | 14.19 | | $ | 14.19 | |
Martinsville Shops | | $ | 0 | | $ | 147,620 | | $ | 0 | | $ | 147,620 | | | | | $ | 13.44 | | $ | 13.44 | |
50 South Morton | | $ | 0 | | $ | 132,000 | | $ | 0 | | $ | 132,000 | | | | | $ | 66.00 | | $ | 66.00 | |
Ridge Plaza | | $ | 986,556 | | $ | 799,014 | | $ | 0 | | $ | 1,785,570 | | $ | 14.17 | | $ | 19.04 | | $ | 16.00 | |
Eastgate Pavilion | | $ | 2,221,017 | | $ | 132,750 | | $ | 0 | | $ | 2,353,767 | | $ | 9.58 | | | | | $ | 9.96 | |
Shops at Otty | | $ | 0 | | $ | 268,603 | | $ | 122,500 | | $ | 391,103 | | | | | $ | 27.28 | | $ | 27.28 | |
Plaza at Cedar Hill | | $ | 2,183,961 | | $ | 1,415,152 | | $ | 0 | | $ | 3,599,113 | | $ | 9.62 | | $ | 19.45 | | $ | 12.00 | |
Sunland Towne Centre | | $ | 2,527,022 | | $ | 472,550 | | $ | 95,280 | | $ | 3,094,852 | | $ | 9.12 | | $ | 16.38 | | $ | 9.80 | |
Galleria Plaza | | $ | 722,108 | | $ | 359,609 | | $ | 0 | | $ | 1,081,717 | | | | | $ | 27.86 | | $ | 24.41 | |
Cedar Hill Village | | $ | 483,465 | | $ | 189,620 | | $ | 0 | | $ | 673,085 | | | | | $ | 20.00 | | $ | 16.14 | |
Preston Commons | | $ | 0 | | $ | 590,338 | | $ | 0 | | $ | 590,338 | | | | | $ | 23.80 | | $ | 23.80 | |
Burlington Coat Factory | | $ | 510,150 | | $ | 0 | | $ | 0 | | $ | 510,150 | | $ | 4.75 | | | | | $ | 4.75 | |
Plaza Volente | | $ | 1,155,000 | | $ | 1,294,104 | | $ | 100,000 | | $ | 2,549,104 | | $ | 11.00 | | $ | 25.22 | | $ | 15.67 | |
Market Street Village | | $ | 1,570,081 | | $ | 341,277 | | $ | 115,700 | | $ | 2,027,058 | | $ | 11.48 | | $ | 27.85 | | $ | 12.83 | |
50th & 12th | | $ | 475,000 | | $ | 0 | | $ | 0 | | $ | 475,000 | | $ | 32.76 | | | | | $ | 32.76 | |
176th & Meridian | | $ | 433,000 | | $ | 0 | | $ | 0 | | $ | 433,000 | | $ | 29.74 | | | | | $ | 29.74 | |
Four Corner Square | | $ | 126,672 | | $ | 701,398 | | $ | 0 | | $ | 828,070 | | $ | 6.18 | | $ | 13.60 | | $ | 11.49 | |
| |
|
| |
|
| |
|
| |
|
| |
|
| |
|
| |
|
| |
Total | | $ | 28,670,671 | | $ | 20,039,360 | | $ | 2,954,380 | | $ | 51,664,411 | | $ | 8.99 | | $ | 18.52 | | $ | 11.40 | |
| |
|
| |
|
| |
|
| |
|
| |
|
| |
|
| |
|
| |
|
1 | This table does not include annualized base rent from development property tenants open for business as of June 30, 2006. |
|
|
p. 33 | Kite Realty Group Supplemental Financial and Operating Statistics – 6/30/06 |
ACQUISITION OF OTHER PROPERTIES |
|
Name of Operating Property | | MSA | | Date
Acquired | | Purchase
Price | | Assumed/
Related Debt | | Total GLA | | Owned GLA | | Major Tenants
and Non-Owned Anchors |
| |
| |
| |
| |
| |
| |
| |
|
Kedron Village1 | | Atlanta | | 04/03/06 | | $ | 36,900,000 | | 0 | | 282,125 | | 157,408 | | Target (non-owned), Ross, Bed Bath & Beyond, PETCO |
|
1 | This property is currently under construction with a completion commitment from the seller. On April 3, 2006, the Company purchased the property with an initial funding of $22,000,000, and on July 31, 2006, the Company funded the remaining purchase price of $14,900,000. In accordance with the terms of the purchase agreement, the seller remains responsible for the completion of the development. Currently, the property is approximately 82% leased, the anchor tenants are open for business, and the shop space tenants will open throughout the remainder of 2006. |
|
|
p. 34 | Kite Realty Group Supplemental Financial and Operating Statistics – 6/30/06 |