NAREIT 2007 REITWEEK
June 5-7, 2007

DISCLAIMER
This presentation may include certain “forward-looking statements” within the meaning of the Private
Securities Litigation Reform Act of 1995. These forward-looking statements include, but are not
limited to, our plans, objectives, expectations and intentions and other statements contained in this
document that are not historical facts and statements identified by words such as “expects”,
“anticipates”, intends”, “plans”, “believes”, “seeks”, “estimates” or words of similar meaning. These
statements are based on our current beliefs or expectations and are inherently subject to significant
uncertainties and changes in circumstances, many of which are beyond our control. Actual results
may differ materially from these expectations due to changes in global political, economic, business,
competitive, market and regulatory risk factors. Information concerning risk factors that could affect
Kite Realty Group Trust’s actual results is contained in the Company’s reports filed from time to time
with the Securities and Exchange Commission, including its 2006 Annual Report on Form 10-K and
its quarterly reports on Form 10-Q. Kite Realty Group Trust does not undertake any obligation to
update any forward-looking statements contained in this document, as a result of new information,
future events or otherwise.
2

GROWTH METRICS
$1,414M
$21.26
As of 5/31/07
85% 1
Total Return Since IPO
156%
$552M
Enterprise Value
64%
$13.00
Share Price
% Growth
At IPO (8/11/04)
(1) Assuming reinvestment of cash dividends.
3

GROWTH METRICS
Source: National Association of Real Estate Investment Trusts, Inc.
Peer Group One Year Total Return Summary
(April 1, 2006 – March 31, 2007)
4

GROWTH METRICS
n/a
$270M
n/a
Visible Shadow Pipeline
6.3M
9.8M
65
$201M
As of 3/31/07
51%
43
Total Number of Properties
55%
$130M
Current Development
Pipeline
At IPO (8/11/04)
% Growth
Total GLA1
6.1M
61%
Owned GLA1
4.2M
50%
Maintained focus on growing development pipeline to complement development
deliveries
Aggressive, controlled portfolio growth yields leasing, operating and management
efficiencies
Combined development and redevelopment pipeline is approaching $500 million
(1) Includes development and operating properties.
5

SOUTHEAST STRATEGY - FLORIDA
First Florida development was over 10 years ago
Current portfolio includes 12 operating properties and 5 development projects
in 9 Florida markets
Florida comprises 22% of the operating portfolio annualized base rent and
32% of the operating portfolio total GLA
Four Florida projects comprise 60% of the current development pipeline’s
total estimated cost
Upon completion of the current development properties, KRG will control 8
properties totaling approximately 1.3 million square feet in the Naples area
Positive effects of baby boomer migration
Continued net migration of 1,000 people per day into Florida
Naples is the 7th fastest growing metro area in the US
Naples is 6th on Inc. Magazine’s list of best US cities for doing business
Information as of March 31, 2007
6

SOUTHEAST STRATEGY – NORTH CAROLINA
Information as of March 31, 2007
Acquired 100 acres in Cary, North Carolina for 750,000 square foot mixed-
use development
Acquired 105 acres in Apex, North Carolina for 345,000 square foot mixed-
use development
Together, these projects comprise 53% of the $270 million Visible Shadow
Pipeline
The Raleigh-Cary area was recently named by Forbes magazine as the best
metro area for jobs due to income growth, low unemployment, and low cost of
living
Raleigh-Cary is home to the second most educated workforce in the US
Research Triangle Park
40,000 workers
Educational institutions: Duke, NC State, UNC
Fidelity is projected to bring 5,000 white collar jobs over the next 5 years
7

EXPERIENCED MANAGEMENT
Proven Track Record: Timely resolution of issues with Ultimate Electronics,
Winn-Dixie, and Marsh Supermarkets
Dominick’s: Pursued early lease termination agreement followed by new
lease execution with Caputo’s at Silver Glen Crossing
Eli Lilly Early Lease Termination: Overcame 17% downtown Indianapolis
market vacancy to execute letter of intent with Indiana State Supreme Court
for 71,000 square feet
Glendale Town Center: Attracted Target as new anchor tenant and secured
city incentives
8
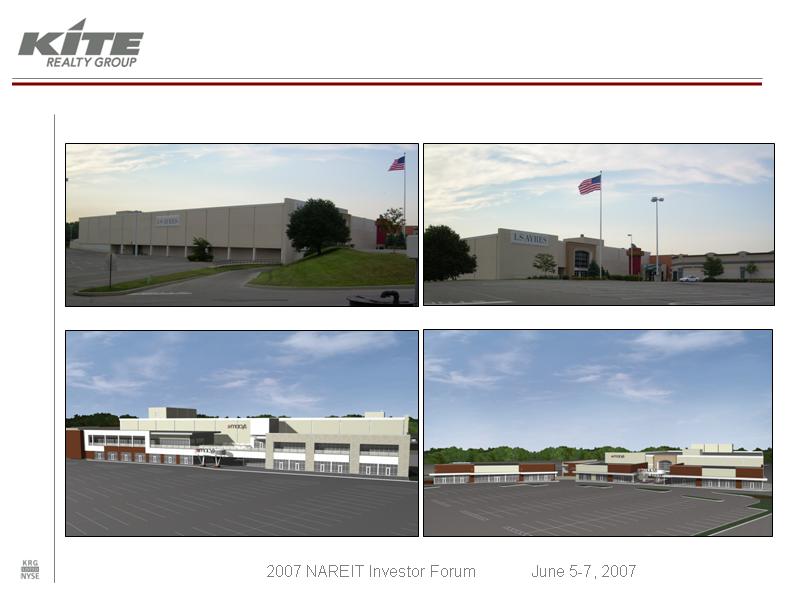
GLENDALE TOWN CENTER
Demolition of the enclosed mall area has commenced
Target Corporation purchased 10.5 acres in April and will anchor the
redevelopment with a projected store opening in summer 2008
Lowe’s Home Improvement, Macy’s, Kerasotes Theaters, Staples, and
Indianapolis-Marion County Public Library will remain open
Additional b-shops and professional office space will be constructed
Two new outlots will also be developed
The property will consist of 685,000 square feet of total GLA and
405,000 square feet of owned GLA upon completion
9

GLENDALE TOWN CENTER
10
GLENDALE TOWN CENTER
WEST ELEVATION
NORTH ELEVATION
11

DEVELOPMENT PROCESS
Doug
Pedersen
Pre-
Development
John
Fox
Market
Research
George
McMannis
Dan
Meador
Todd Oswald
& Jeff
Schroeder
Gregg
Poetz
Mark
Jenkins
JV
Structures
& Financing
Asset
Management
Construction
Leasing
Land
Procurement
&
Development
FULLY INTEGRATED TEAM
FULLY INTEGRATED DEVELOPMENT
PROCESS
12

DEVELOPMENT PIPELINE
VALUE CREATION EMBEDDED IN CURRENT DEVELOPMENT
PIPELINE
(1) Adjusted to account for the Company’s share of projects held in joint ventures.
(2) Reflects Parkside Town Commons being developed within the Prudential joint venture with the Company owning 20
percent upon commencement of construction.
(3) Based on 37,281,938 common shares and units outstanding as of March 31, 2007.
$3.14
Per Outstanding Shares/Units 3
$117M
Estimated Value Creation
(265M)
Less Cost
$382M
Value at 6.25% Cap Rate
$23.9M
Projected NOI
9.0%
Projected Yield
$265M
Total Pipeline Cost – KRG Share
$131M
Visible Shadow Pipeline 1,2
$134M
Current Development Pipeline 1
13

DEVELOPMENT PIPELINE
Information as of March 31, 2007
Whole Foods, Staples
$45,000
157,800
Ft. Lauderdale, FL
50%
Cobblestone Plaza 2
50%
95%
80%
100%
100%
100%
50%
60%
40%
100%
KRG
% Owned
Seattle, WA
Tri-Cities, WA
Portland, OR
Chicago, IL
Indianapolis, IN
Indianapolis, IN
Crown Point, IN
Tampa, FL
Naples, FL
Naples, FL
MSA
Project
Projected
Total GLA1
Total Estimated
Cost (000s)
Anchor Tenants
Tarpon Springs Plaza
276,350
$28,000
Target (non-owned), Staples,
Cost Plus, AC Moore
Estero Town
Commons 2
206,600
$20,000
Lowe's Home Center
Bayport Commons 2
281,100
$25,000
Target (non-owned), Michael’s,
PetSmart
Beacon Hill 2
162,700
$17,000
Strack & VanTil's (non-owned),
Walgreens (non-owned)
Bridgewater
Marketplace I
50,820
$11,000
Walgreens (non-owned)
54th & College
21,000
$2,500
Fresh Market
Naperville
Marketplace
169,600
$16,500
Caputo's Fresh Market (non-
owned), TJ Maxx
Cornelius Gateway 2
35,800
$5,400
Walgreens (non-owned)
Sandifur Plaza 2
27,400
$6,400
Walgreens
Gateway Shopping
Center 2
285,200
$24,300
Ross, PetSmart, Kohl’s (non-
owned), Winco (non-owned)
Total
1,673,466
$201,100
(1) Includes owned GLA, plus square footage attributable to non-owned outlot structures and non-owned outlot anchor space.
(2) Held in a joint venture entity.
14
VISIBLE SHADOW PIPELINE
Information as of March 31, 2007
TBD
$25,600
345,000
TBD
Raleigh, NC
100%
Peakway at 55
$269,600
$36,000
$90,000
$118,000
Est. Total
Cost 1
(000s)
100%
50%
40%
KRG %
Owned
Maple Valley
Delray
Marketplace 3
Parkside Town
Commons 2
Project
TBD
750,000
TBD
Raleigh, NC
Grocery, Theater
Jr. Boxes, Shops,
Restaurants
318,000
TBD
Delray Beach,
FL
1,569,000
Grocery, Hardware Store,
Shops, Restaurants
156,000
TBD
Seattle, WA
Potential Tenancy
Est. Total
GLA 1
Estimated
Start Date
MSA
(1) Total Estimated Cost and Estimated Total GLA based on preliminary siteplans.
(2) Acquired in a joint venture with Prudential Real Estate Investors. KRG’s ownership interest will change to
20% upon commencement of construction.
(3) Held in a joint venture entity.
15

MIXED-USE DEMAND
Land use planners are driven by “Smart Growth” and “New Urbanism”
approaches to development
Requires developers to create plans for combined uses – retail, hotel,
residential, and office
Internal experience across products types is a strong advantage
Kite Realty Group Mixed-Used Projects
Parkside Town Commons – Cary, North Carolina
Peakway at 55 – Apex, North Carolina
Delray Marketplace – Delray Beach, Florida
Eddy Street Commons – South Bend, Indiana (Notre Dame)
16
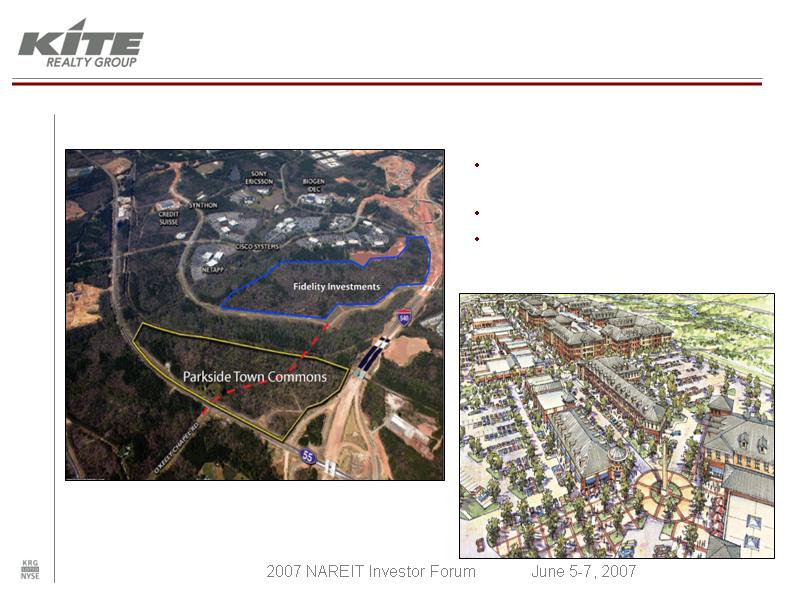
MIXED-USE DEMAND
Parkside Town Commons - Cary, NC
100 acres adjacent to the
Research Triangle Park
First project in Prudential JV
750,000 SF of Estimated Total
GLA1
(1)
Total Estimated Cost and Estimated Total GLA based on
preliminary site plans.
17
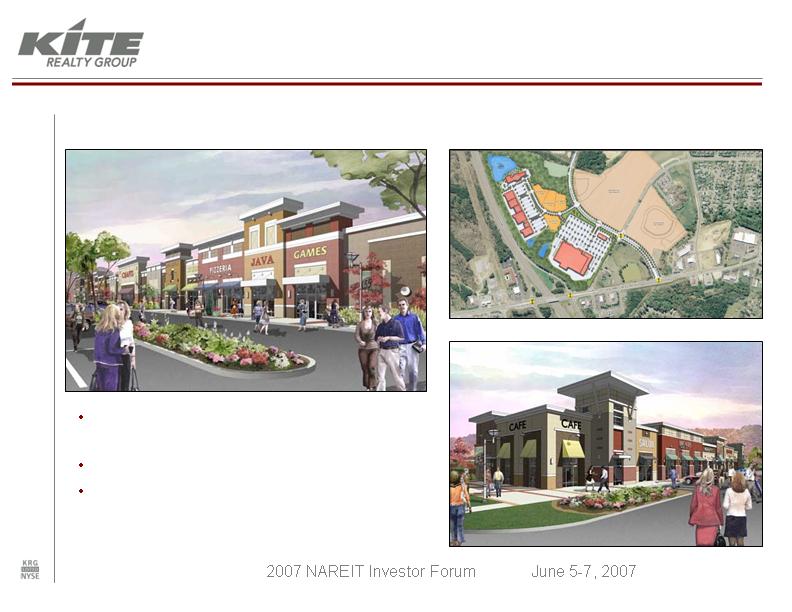
MIXED-USE DEMAND
Continuation of North Carolina growth
strategy
105 acres acquired 1st Quarter 2007
345,000 SF of Estimated Total GLA1
Peakway at 55 - Apex, NC
(1)
Estimated Total GLA based on preliminary site plans.
18
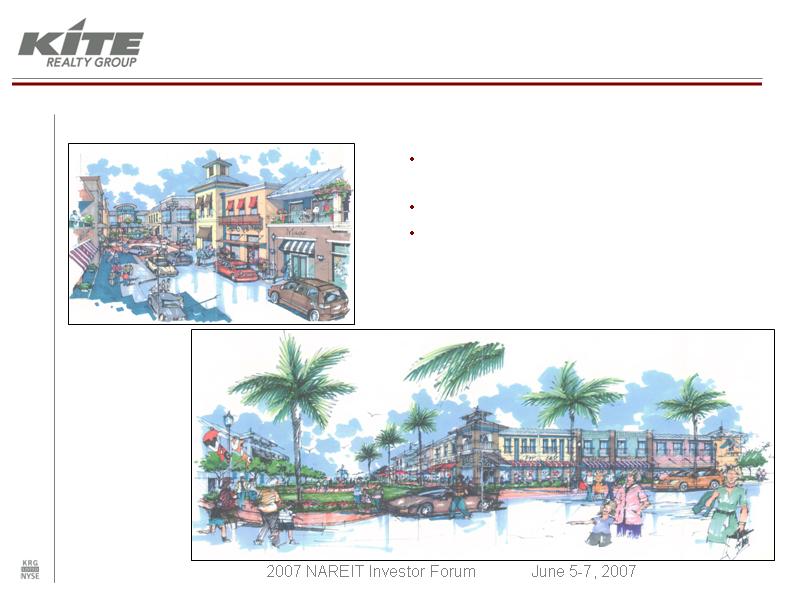
Potential retail tenants include grocery,
theater, jr. boxes, restaurants, and shops
318,000 SF of Estimated Total GLA1
$90,000,000 Total Estimated Cost1
Delray Marketplace – Delray Beach, FL
(1)
Total
Estimated Cost
and Estimated
Total GLA based
on preliminary
site plans.
MIXED-USE DEMAND
19

MIXED-USE DEMAND
Eddy Street Commons – South Bend, IN (Notre Dame)
20

PRUDENTIAL JOINT VENTURE
Efficient Capitalization – PREI’s balance sheet is expected to allow the joint
venture to achieve 100 percent financing on land acquisition and construction
costs
Development Accretion – KRG’s capital outflows are expected to be aligned
with FFO inflows
Risk Management – Encompasses developments and acquisitions with
projected costs in excess of $50 million
Flexibility – At KRG’s discretion, projects with estimated costs less than $50
million can be eligible for the joint venture
Scalability – Combined equity commitments of $500 million are expected to
be leveraged to approximately $1.25 billion of project costs
Enhanced Returns – KRG’s 20 percent share of the joint venture equity
commitment will be enhanced through leasing, construction, development and
management fees
Promote Upside – KRG’s share of joint venture increases as return hurdles
are met
21

BALANCE SHEET
Information as of March 31, 2007
Fixed charge coverage – 2.8x
Debt coverage ratio – 2.5x
Debt to total market capitalization – 46%
Approximately 126 acres of land held for future development in
excess of current and visible shadow pipelines
New $200 million unsecured line of credit with pricing ranging
from LIBOR plus 115 to 135 basis points
22

OPERATING METRICS
For the Three Months Ended March 31, 2007
3.2x
2.8x
Fixed Charge Coverage 2
7.3%
6.3%
G&A / Revenue from Rental
Properties
94.7%
94.9%
Portfolio % Leased
64%
67%
FFO Payout %
71.3%
72.6%
NOI / Revenue
Selected
Peer Group
Average 1
KRG
(1)
Peer Group consists of KIM, DDR, AKR, REG and RPT.
(2)
Defined as EBITDA divided by Interest Expense.
23

CORPORATE PROFILE
Kite Realty Group Trust is a full-service, vertically integrated real estate investment trust
engaged primarily in the ownership, operation, management, leasing, acquisition,
construction, expansion, and development of high quality neighborhood and community
shopping centers in selected growth markets in the United States. The Company owns
interests in a portfolio of operating retail properties, retail properties under development,
operating commercial properties, a related parking garage, commercial property under
development and parcels of land that may be used for future development of retail or
commercial properties.
Our strategy is to maximize the cash flow of its operating properties, successfully
complete the construction and lease-up of the development portfolio and identify
additional growth opportunities in the form of new developments and acquisitions. A
significant volume of growth opportunity is sourced through the extensive network of
tenant, corporate and institutional relationships that have been established over the last
four decades. Current investments are focused in the development and acquisition of
high quality, well located shopping centers.
24