DEVELOPMENT & REDEVELOPMENT PIPELINE
Information as of September 30, 2007
55.3%
82.9%
75.7%
79.0%
80.9%
80.3%
100.0%
17.3%
33.4%
70.3%
87.5%
89.2%
Percent
Committed3
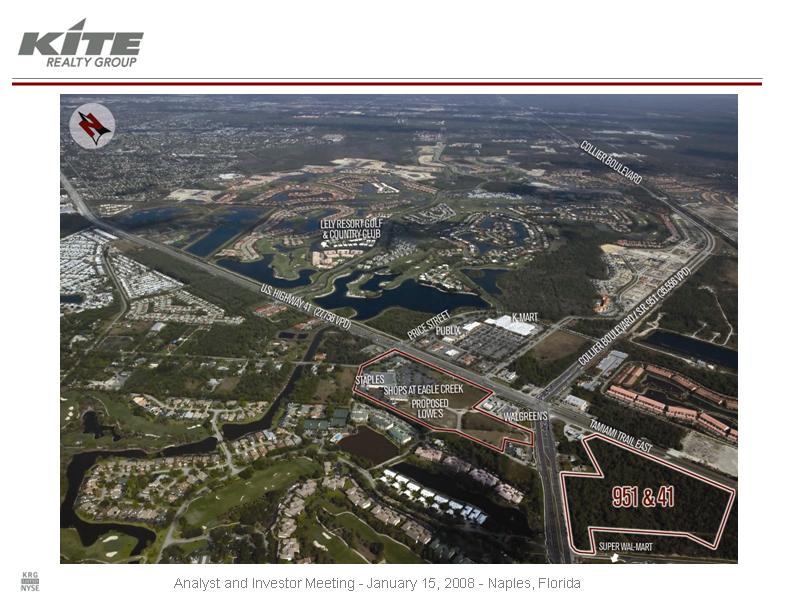
Staples
$3,500
72,271
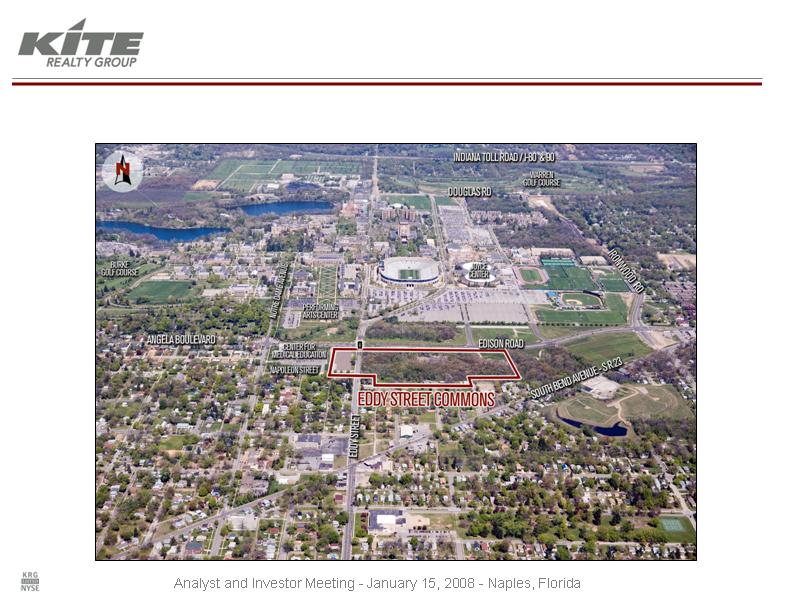
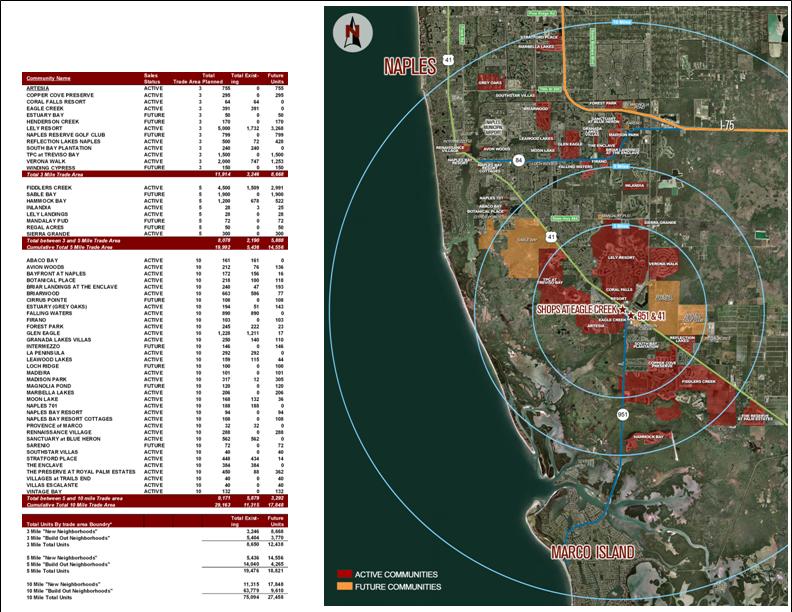
Naples, FL
Shops at Eagle Creek
$18,500
757,271
Sub-Total
Redevelopments
Target (non-owned), Lowe’s
$15,000
685,000
Indianapolis, IN
Glendale Town Center
$167,200
1,283,864
Sub-Total
Whole Foods, Staples
$47,000
163,600
Ft. Lauderdale, FL
Cobblestone Plaza 2
Seattle, WA
Tri-Cities, WA
Chicago, IL
Indianapolis, IN
Indianapolis, IN
Crown Point, IN
Tampa, FL
Naples, FL
MSA
Project
Projected
Total GLA1
Total Est.
Cost (000s)
Anchor Tenants
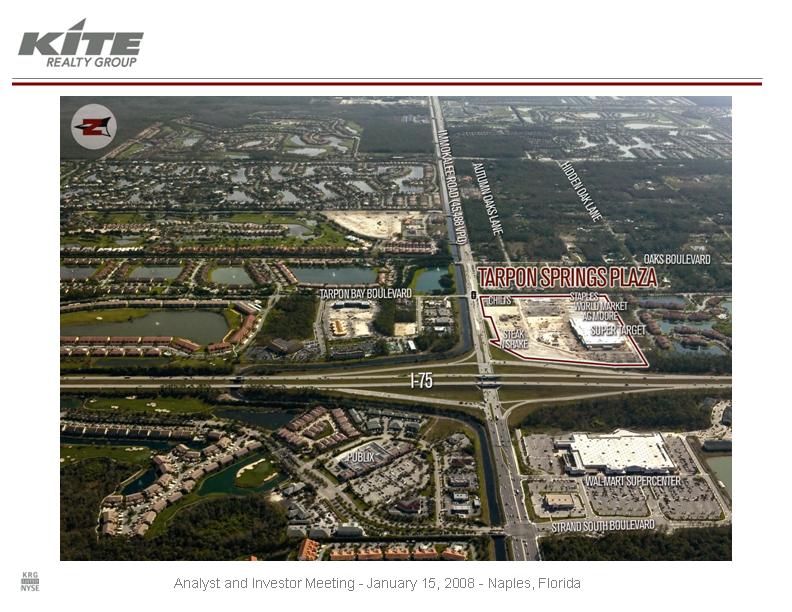
Tarpon Springs Plaza
276,346
$29,200
Target (non-owned), Staples,
Cost Plus, AC Moore
Bayport Commons 2
286,000
$25,000
Target (non-owned), Michael’s,
Best Buy, PetSmart
Beacon Hill Phase Il 2
19,160
$5,000
Strack & VanTil's (non-owned),
Walgreens (non-owned)
Bridgewater Marketplace I
50,820
$11,300
Walgreens (non-owned)
54th & College
20,100
$2,500
Fresh Market
Naperville Marketplace
151,607
$16,500
Caputo's Fresh Market (non-owned), TJ
Maxx
Sandifur Plaza 2
27,231
$6,400
Walgreens
Gateway Shopping Ctr 2
289,000
$24,300
Ross, PetSmart, Kohl’s (non-owned),
Winco (non-owned)
Total Dev. and Redev. Pipeline
2,041,135
$185,700
(1) Includes owned GLA, plus square footage attributable to non-owned outlot structures and non-owned outlot anchor space.
(2) Held in a joint venture entity.
(3) Percent Committed (as used in the table above and elsewhere in the presentation includes leases under negotiation for which the
company has signed non-binding letter of intent.
13