KITE REALTY GROUP TRUST
FIRST QUARTER 2008

DISCLAIMER
This presentation may include certain “forward-looking statements” within the meaning
of the Private Securities Litigation Reform Act of 1995. These forward-looking
statements include, but are not limited to, our plans, objectives, expectations and
intentions and other statements contained in this document that are not historical facts
and statements identified by words such as “expects”, “anticipates”, “intends”, “plans”,
“believes”, “seeks”, “estimates” or words of similar meaning. These statements are
based on our current beliefs or expectations and are inherently subject to significant
uncertainties and changes in circumstances, many of which are beyond our control.
Actual results may differ materially from these expectations due to changes in global
political, economic, business, competitive, market and regulatory risk factors.
Information concerning risk factors that could affect Kite Realty Group Trust’s actual
results is contained in the Company’s reports filed from time to time with the Securities
and Exchange Commission, including its 2006 Annual Report on Form 10-K and its
quarterly reports on Form 10-Q. Kite Realty Group Trust does not undertake any
obligation to update any forward-looking statements contained in this document, as a
result of new information, future events or otherwise.
2
COMPANY OVERVIEW
Internal Growth
Operational Efficiencies
Existing Vacancy
Development
Complete Current Development Pipeline
Financing Secured (76% funded)
Commence construction of Visible Shadow Pipeline
Execute capital plan
Continue to Manage Debt Maturities
Balance Sheet Management
PRIMARY OBJECTIVES FOR THE COMPANY
3
Consumer Behavior
Nationwide consumption levels will fluctuate, but a portion of the consumer’s behavior is derived from
necessity. Grocery-anchored centers and value-oriented retailers such as Target will continue to create
shopping center traffic.
COMPANY OVERVIEW
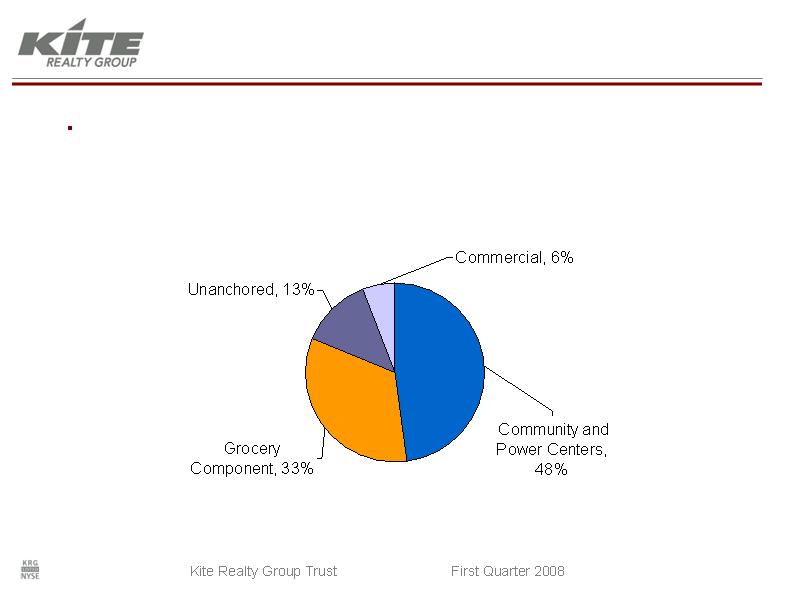
Information as of December 31, 2007
(1)
Includes Projected Total GLA for properties in the Current Development/Redevelopment Pipeline. Total GLA includes owned GLA, square footage attributable to non-owned outlot structures on land that the Company owns, and non-owned anchor space that currently exists or is under construction.
Property Type Allocation by Projected total GLA1
4
(1)
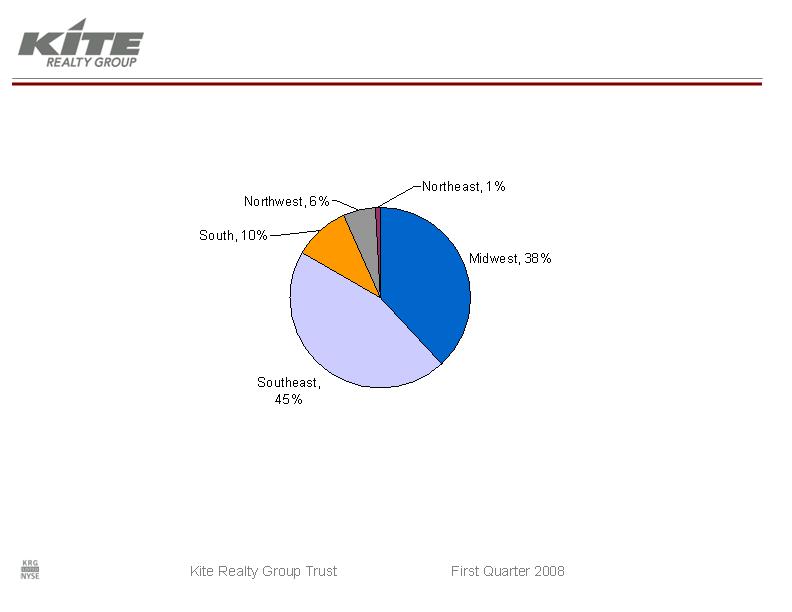
Total GLA includes owned GLA, square footage attributable to non-owned outlot structures on land that the Company owns, and non-owned anchor space that currently exists or is under construction.
(2)
Includes Projected Total GLA for properties in the Current Development, Redevelopment, and Visible Shadow Pipelines.
Projected Total GLA Including Pipelines1,2
GEOGRAPHIC DIVERSIFICATION
COMPANY OVERVIEW
Information as of December 31, 2007
5
6
Information as of December 31, 2007 except as noted
(1)
Subsequent to December 31, 2007, the Company successfully negotiated a lease termination with Circuit City at Sunland Towne
Center in El Paso, TX effective January 2008. This lease termination is reflected in the table above.
(2)
As of February 26, 2008.
COMPANY OVERVIEW
STRONG TENANT DIVERSITY
% of Portfolio
S&P
Annualized Base Rent
Credit Rating
2
1
Lowe's Home Improvement
3.5%
A+
2
Publix
2.5%
n/a
3
Marsh Supermarkets
2.2%
n/a
4
Circuit City
1
2.2%
n/a
5
Bed Bath & Beyond
1.8%
BBB
6
Petsmart
1.8%
BB
7
Staples
1.7%
BBB+
8
Dick's Sporting Goods
1.7%
n/a
9
Ross Stores
1.6%
BBB
10
HEB Grocery Company
1.6%
n/a
Total
20.6%
Top 10 Retail Tenants by Base Rent

GROWTH STRATEGY
STRONG UPSIDE
Only 27% occupied
Growth source for late 2008 and early 2009
23% remaining to be leased: 118,000 square feet of shops
LOW RISK PROFILE
77% leased or committed
76% funded, with additional costs covered via construction loans
Execute small shop leases and build out tenant spaces
Information as of December 31, 2007
EMBEDDED GROWTH: CURRENT DEVELOPMENTS
7
GROWTH STRATEGY
A CASE STUDY: RIVERS EDGE SHOPPING CENTER
Location: Keystone-Castleton, the most heavily traveled retail corridor in Indianapolis
Competitive Advantage: Off-market pricing, long-standing relationships
Capitalization: Partially funded by non-core, net-lease asset sale
Leasing Upside: Vacant space (80% leased) plus below market rents in place
Development Upside: Maximize site with potential additional GLA
Asset Management Upside: Improve access, visibility, sponsorship
SELECTIVE ACQUISITIONS
8
GROWTH STRATEGY
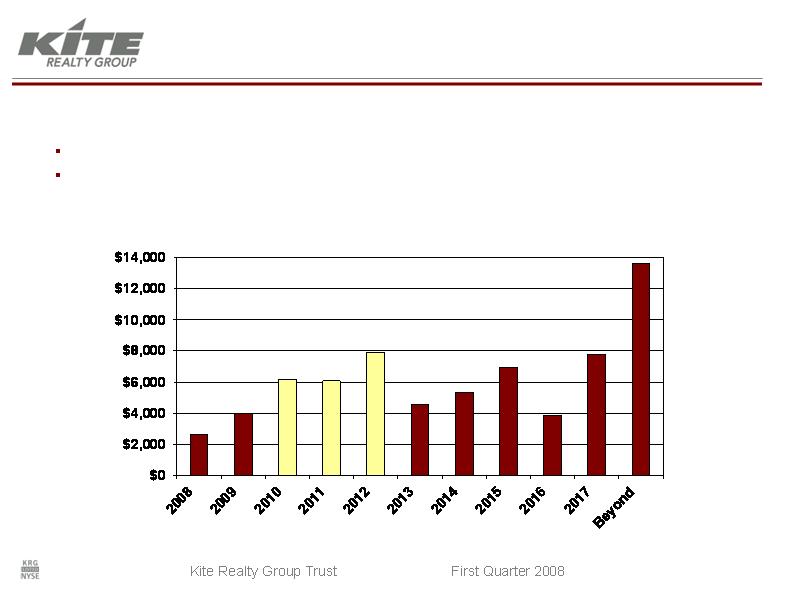
Nearly 30 percent ($20 million) of annualized base rent expires from 2010 to 2012
From 2010 to 2012, over 530,000 square feet per year will expire (compared to 250,000 per year from 2008
to 2009)
Information as of December 31, 2007
SAME STORE GROWTH VIA LEASE EXPIRATIONS
Dollars in thousands
Annual Base Rent Expiring Per Year
9
GROWTH STRATEGY
Existing Vacancy
Operating retail portfolio is a healthy 94.8 percent leased
246,000 square feet are available to be leased
Leasing one-quarter of this space at our portfolio average shop rent of $20 per square
foot could generate approximately $.03 per share of FFO
Operational Efficiencies
Leveraging bargaining power with national providers
Maintain class-A properties while managing to the CAM caps
Controlling variable costs – insurance and real estate taxes
Ancillary Income
3rd Party Construction and Service Fee Revenue
Leveraging our in-house construction company to generate FFO
Utilize current infrastructure to attract 3rd party contracts
Merchant building as a source of capital
Information as of December 31, 2007
EMPHASIZING INTERNAL GROWTH
10
PEER GROUP COMPARISON
11
At 8.6%, our FFO per share growth from 2006 to 2007 was 32% better than
our peer group average of 6.5%
2006
2007
%
Company
FFO/sh
FFO/sh
Growth
Kimco Realty Corporation
$2.21
$2.59
17.3%
Federal Realty
$3.26
$3.63
11.3%
Developers Diversified
$3.41
$3.79
11.1%
Acadia Realty Trust
$1.19
$1.30
9.2%
Regency Centers Corp
$3.88
$4.20
8.2%
Weingarten Realty
$2.83
$3.06
8.1%
Inland Real Estate Corp
$1.33
$1.43
7.5%
Cedar Shopping Centers
$1.21
$1.22
0.8%
Ramco Gershenson
$2.54
$2.56
0.8%
Equity One, Inc
$1.48
$1.34
-9.5%
Average
6.5%
Kite Realty Group
$1.16
$1.26
8.6%
PEER GROUP COMPARISON
12
(1)
Source: FirstCall mean estimate as of February 27, 2008.
Assuming a peer group average multiple of 12.6x, our stock is trading at a 23%
discount
Price
Consensus
Company
2/27/2008
Estimate
1
Multiple
Federal Realty
$74.14
$3.91
19.0x
Acadia Realty Trust
$23.19
$1.35
17.2x
Equity One, Inc
$21.83
$1.42
15.4x
Regency Centers Corp
$60.45
$4.59
13.2x
Kimco Realty Corporation
$35.32
$2.75
12.8x
Weingarten Realty
$32.74
$3.21
10.2x
Developers Diversified
$40.26
$3.97
10.1x
Inland Real Estate Corp
$14.04
$1.45
9.7x
Cedar Shopping Centers
$11.90
$1.26
9.4x
Ramco Gershenson
$22.76
$2.65
8.6x
Average
12.6x
Kite Realty Group
$13.27
$1.30
10.2x
Priced with Average Multiple
$16.33
12.6x
Current Discount
-23.1%
PEER GROUP COMPARISON
Our dividend yield remains attractive
13
(1)
Source: Company filings.
Current
Price
Annual
Company
2/27/2008
Dividend
1
Yield
Ramco Gershenson
$22.76
$1.85
8.1%
Cedar Shopping Centers
$11.90
$0.90
7.6%
Inland Real Estate Corp
$14.04
$0.98
7.0%
Developers Diversified
$40.26
$2.76
6.9%
Weingarten Realty
$32.74
$2.10
6.4%
Kite Realty Group
$13.27
$0.82
6.2%
Equity One, Inc
$21.83
$1.20
5.5%
Regency Centers Corp
$60.45
$2.90
4.8%
Kimco Realty Corporation
$35.32
$1.60
4.5%
Acadia Realty Trust
$23.19
$0.84
3.6%
Federal Realty
$74.14
$2.44
3.3%
PEER GROUP COMPARISON
Operating cash flow ensures a healthy fixed charge coverage ratio
(1)
Source: Company filings for period ended December 31, 2007.
(2)
Fixed Charge Coverage defined as EBITDA divided by Interest Expense plus Preferred Dividends.
14
Fixed Charge
Company
Coverage
Regency Centers Corp
3.4x
Federal Realty
2.9x
Acadia Realty Trust
2.9x
Developers Diversified
2.7x
Inland Real Estate Corp
2.6x
Equity One, Inc
2.3x
Kimco Realty Corporation
2.2x
Weingarten Realty
2.1x
Cedar Shopping Centers
2.0x
Ramco Gershenson
2.0x
Average
2.5x
Kite Realty Group
2.9x
DEVELOPMENT & REDEVELOPMENT PIPELINE
Information as of December 31, 2007
Medical Practice Groups
$8,500
100.0%
41,000
Indianapolis, IN
Spring Mill Medical II
55.3%
84.1%
76.9%
79.0%
82.5%
82.4%
100.0%
17.3%
33.4%
75.1%
87.3%
Percent
Committed3
Staples
$3,500
72,271
Naples, FL
Shops at Eagle Creek
$18,500
757,271
Sub-Total
Redevelopments
Target (non-owned), Lowe’s (non-
owned), Macy’s, Staples
$15,000
685,000
Indianapolis, IN
Glendale Town Center
$145,800
1,033,825
Sub-Total
Whole Foods, Staples
$47,000
163,600
Ft. Lauderdale, FL
Cobblestone Plaza2
Seattle, WA
Tri-Cities, WA
Chicago, IL
Indianapolis, IN
Indianapolis, IN
Crown Point, IN
Tampa, FL
MSA
Project
Projected
Total GLA1
Total Est.
Cost (000s)
Anchor Tenants
Bayport Commons2
286,000
$27,300
Target (non-owned), Michael’s,
Best Buy, PetSmart
Beacon Hill Phase Il2
19,160
$5,000
Strack & VanTil's (non-owned),
Walgreens (non-owned)
Bridgewater Marketplace I
50,820
$11,300
Walgreens (non-owned)
54th & College
20,100
$2,500
Fresh Market
Naperville Marketplace
151,607
$16,500
Caputo's Fresh Market (non-owned),
TJ Maxx
Sandifur Plaza2
12,538
$3,400
Small Shops, Walgreens
Gateway Shopping Ctr2
289,000
$24,300
Ross Stores, PetSmart, Kohl’s (non-
owned), Winco (non-owned)
Total Current Development and Redevelopment
1,791,096
$164,300
(1) Includes owned GLA, plus square footage attributable to non-owned outlot structures and non-owned outlot anchor space.
(2) Held in a joint venture entity.
(3) Percent Committed includes leases under negotiation for which the company has signed non-binding letter of intent.
15
VISIBLE SHADOW PIPELINE
Information as of December 31, 2007
Power Center
$26,200
308,000
Chicago, IL
100%
South Elgin Commons
$391,800
3,092,000
Total Visible Shadow
Pipeline
Retail, Apartments, Office
$70,000
465,000
South Bend, IN
100%
Eddy Street Commons, Ph I4
Power Center
$25,600
345,000
Raleigh, NC
100%
Broadstone Station (Apex)
$36,000
$100,000
$134,000
Est. Total
Cost1 (000s)
100%
50%
40%
KRG %
Owned
Maple Valley
Delray Marketplace3
Parkside Town Commons2
Project
Mixed Use Center
1,500,000
Raleigh, NC
Grocery, Theater
Jr. Boxes, Shops,
Restaurants
318,000
Delray Beach, FL
Grocery, Hardware,
Shops, Restaurants
156,000
Seattle, WA
Potential Tenancy
Est. Total
GLA1
MSA
(1)
Total Estimated Cost and Estimated Total GLA based on preliminary siteplans.
(2)
Acquired in a joint venture with Prudential Real Estate Investors. KRG’s ownership interest will change to 20% upon commencement of
construction.
(3)
Held in joint venture entity.
(4)
Total estimated cost of the initial phase includes retail, office, and multi-family. The Company intends to own 100% of the retail and office while utilizing a joint venture for the multi-family component.
16
Information as of December 31, 2007
DEVELOPMENT PIPELINE
A CASE STUDY IN RISK MITIGATION: EDDY STREET COMMONS
$200 million mixed-use development near the University of Notre Dame in South Bend, IN will be
completed in phases
$70 million Phase I, which will include retail, office and multifamily, was only recently added to
the Visible Shadow Pipeline
Three goals were set and accomplished before significant capital would be spent:
One, the land was fully entitled with a planned unit development designation
Two, final municipal and state approvals were received for significant TIF incentives
Three, negotiations with the University of Notre Dame on final deal structure were completed
Joint venture arrangements for multi-family and hotel components will be utilized to mitigate risk
and maximize expertise
Additional land for residential units will be acquired from the university at our discretion
and based solely on residential market demand
17
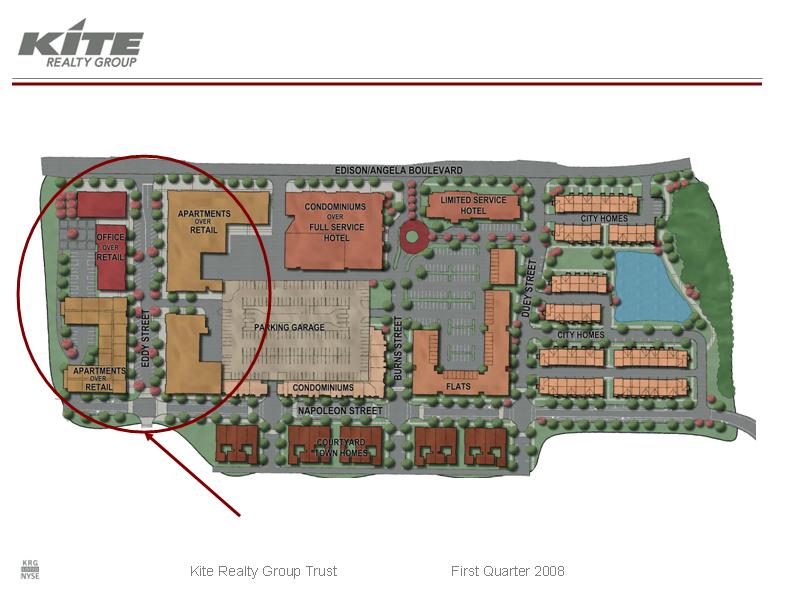
DEVELOPMENT PIPELINE
A CASE STUDY IN RISK MITIGATION: EDDY STREET COMMONS
Phase I – Retail, Office, Multi-family
18
DEVELOPMENT PIPELINE
VALUE CREATION EMBEDDED IN CURRENT DEVELOPMENT PIPELINE
(1)
Adjusted to account for the Company’s share of projects held in joint ventures.
(2)
Reflects Parkside Town Commons being developed within the Prudential joint venture with the Company owning 20 percent upon commencement of construction.
(3)
Based on 37,319,842 common shares and operating partnership units outstanding as of December 31, 2007.
$2.71
Per Outstanding Share/Unit 3
$101M
Estimated Value Creation
$(327M)
Less Cost
$428M
Value at 6.5% Cap Rate
$27.8M
Projected NOI
8.50%
Projected Yield
$327M
Total Pipeline Cost - KRG Share
$235M
Visible Shadow Pipeline 1,2
$92M
Current Development Pipeline 1
19
20
Source: Applied Geographic Solutions
DEVELOPMENT NOT DEPENDENT ON GROWTH
STRONG DEMOGRAPHICS
Operating Portfolio
3 Mile
5 Mile
Development Pipeline
3 Mile
5 Mile
2007 Est. Population
49,691
124,977
2007 Est. Population
44,549
118,951
2012 Est. Population
54,416
136,673
2012 Est. Population
51,023
133,272
Projected Annual Growth
1.8%
1.8%
Projected Annual Growth
2.8%
2.3%
Average HH Income
$77,012
$77,007
Average HH Income
$87,910
$84,716
Expenditure Potential
$186M
$466M
Expenditure Potential
$190M
$488M
Portfolio Demographic Comparison
Operating Portfolio vs. Development Pipeline
Radius
Radius
DEVEOPLMENT CAPITAL NEEDS
A CLEAR PLAN
Current Development Pipeline
76% funded as of year end 2007 with construction loans in place to fund remaining $36 million
Visible Shadow Pipeline
Parkside Town Commons
Current land loan to be converted to 100% LTC construction loan upon construction start
Delray Marketplace
Equity from line in project currently
Construction loan upon anchor lease signing and construction commencement
Maple Valley
Equity from line funded initial land acquisition
Construction loan upon anchor lease signing and construction commencement
Broadstone Station - Apex
Project equity funded via land sales to anchor tenants
Construction loan upon anchor lease signing and construction commencement
South Elgin
Financed with construction loans and sold at completion
Eddy Street Commons Phase I
Project equity via line of credit and sale of residential and condominiums
Construction loan financing in phased manner
Shadow Pipeline
Funded with JV partners, construction loans, sale of non-core assets, and line of credit
Information as of December 31, 2007
21

MANAGING DEBT MATURITIES
AGGRESSIVE REFINANCING, SOLID EXECUTION
AS OF SEPTEMBER 30, 2007
2008 Maturities: $118 million
$109.4 million construction/land loans
$8.6 million other variable and mini-perm loans
Current conditions and long-standing relationships have allowed us to hedge many of the recent
extensions with pricing preferable to the current permanent loan market
The result? Accretive transactions and maintained flexibility in a difficult credit environment
AS OF FEBRUARY 27, 2008
2008 Maturities: $21 million
$17.8 million construction loans
2 loans with late 2008 maturities
$3.2 million other variable and mini-perm loans
22
COMMITTED MANAGEMENT
Senior management owns approximately 22 percent of the Company and has
acquired over 400,000 shares and 800,000 units since the IPO at a cost of
approximately $21M
0.2%
8 years
EVP & CFO
Dan Sink
22.1%
7.1%
16 years
President & CEO
John Kite
4.1%
12 years
Sr. EVP & COO
Tom McGowan
10.7%
47 years
Executive Chairman
Al Kite
Ownership 1
Tenure with
Company
(1) As of December 31, 2007, and includes units of Operating Partnership.
23
OPERATING METRICS
For the Three Months Ended December 31, 2007
2.6x
2.9x
Fixed Charge Coverage2
5.4%
3.8%
G&A /Total Revenue
95.3%
94.3%
Portfolio % Leased
69%
60%
FFO Payout %
69.4%
74.1%
NOI / Revenue
Selected
Peer Group
Average1
KRG
(1)
Peer Group consists of KIM, DDR, AKR, REG and RPT.
(2)
Defined as EBITDA divided by Interest Expense plus Preferred Dividends.
24

A SOLID FOUNDATION
Healthy pay-out ratio
Strong fixed charge coverage
Capital available for development pipeline
‘A’ locations
High occupancy
Below market rents
IN CONCLUSION
A CLEAR STRATEGY
2008 – 2012 Growth initiatives
Shadow pipeline
Internal growth
Financial strength
Good real estate wins
25

CORPORATE PROFILE
Kite Realty Group Trust is a full-service, vertically integrated real estate investment
trust engaged primarily in the ownership, operation, management, leasing, acquisition,
construction, expansion, and development of high quality neighborhood and community
shopping centers in selected growth markets in the United States. The Company owns
interests in a portfolio of operating retail properties, retail properties under development,
operating commercial properties, a related parking garage, commercial property under
development and parcels of land that may be used for future development of retail or
commercial properties.
Our strategy is to maximize the cash flow of its operating properties, successfully
complete the construction and lease-up of the development portfolio and identify
additional growth opportunities in the form of new developments and acquisitions. A
significant volume of growth opportunity is sourced through the extensive network of
tenant, corporate and institutional relationships that have been established over the last
four decades. Current investments are focused in the development and acquisition of
high quality, well located shopping centers.
26