
SUPPLEMENTAL INFORMATION – MARCH 31, 2009
PAGE NO. |
| TABLE OF CONTENTS |
| ||
3 |
| Corporate Profile |
4 |
| Contact Information |
5 |
| Important Notes |
6 |
| Corporate Structure Chart |
7 |
| Condensed Consolidated Balance Sheets |
8 |
| Consolidated Statements of Operations for the Three Months Ended March 31 |
9 |
| Funds from Operations and Other Financial Information for the Three Months Ended March 31 |
10 |
| Market Capitalization |
11 |
| Same Property Net Operating Income for the Three Months Ended March 31 |
12 |
| Net Operating Income by Quarter |
13 |
| Summary of Outstanding Debt as of March 31, 2009 |
14 |
| Schedule of Outstanding Debt as of March 31, 2009 |
17 |
| Refinancing Update |
18 |
| Joint Venture Summary – Unconsolidated Properties |
19 |
| Condensed Combined Balance Sheets of Unconsolidated Properties |
20 |
| Condensed Combined Statements of Operations of Unconsolidated Properties for the Three Months Ended March 31 |
21 |
| Top 10 Retail Tenants by Gross Leasable Area |
22 |
| Top 25 Tenants by Annualized Base Rent |
23 |
| Lease Expirations – Operating Portfolio |
24 |
| Lease Expirations – Retail Anchor Tenants |
25 |
| Lease Expirations – Retail Shops |
26 |
| Lease Expirations – Commercial Tenants |
27 |
| Summary Retail Portfolio Statistics Including Joint Venture Properties |
28 |
| Summary Commercial Portfolio Statistics |
29 |
| Current Development Pipeline |
30 |
| Current Redevelopment Projects |
31 |
| Visible Shadow Pipeline |
32 |
| Geographic Diversification – Operating Portfolio |
33 |
| Operating Retail Properties |
37 |
| Operating Commercial Properties |
38 |
| Retail Operating Portfolio – Tenant Breakdown |
CORPORATE PROFILE
General Description
Kite Realty Group Trust is a full-service, vertically integrated real estate company engaged primarily in the development, construction, acquisition, ownership and operation of high-quality neighborhood and community shopping centers in selected markets in the United States. We are organized as a real estate investment trust ("REIT") for federal income tax purposes. As of March 31, 2009, we owned interests in 55 operating properties totaling approximately 8.5 million square feet, an additional 0.4 million square feet in three properties currently under development and another 0.5 million square feet in six properties under redevelopment.
Our strategy is to maximize the cash flow of our operating properties, successfully complete the construction and lease-up of our development portfolio and identify additional growth opportunities in the form of new developments and acquisitions. New investments are focused in the shopping center sector, although we may selectively pursue commercial development or acquisition opportunities in markets where we currently operate and where we believe we can leverage existing infrastructure and relationships to generate attractive risk-adjusted returns.
Company Highlights as of March 31, 2009
| Ø |
| Operating Retail Properties | 51 | |
| Ø |
| Operating Commercial Properties | 4 | |
| Ø |
| Total Properties Under Development | 3 | |
| Ø |
| Total Properties Under Redevelopment | 6 | |
| Ø |
| States | 9 | |
| Ø |
| Total GLA/NRA of Operating Properties | 8,497,744 | |
| Ø |
| Owned GLA/NRA of Operating Properties | 5,443,791 | |
| Ø |
| Owned GLA of Properties Under Development/Redevelopment | 906,026 | |
| Ø |
| Percentage of Owned GLA/NRA Leased – Total Portfolio | 90.8% | |
| Ø |
| Percentage of Owned GLA Leased – Retail Operating | 90.2% | |
| Ø |
| Percentage of Owned NRA Leased – Commercial Operating | 97.2% | |
| Ø |
| Total Full-Time Employees, including 70 home office employees | 100 | |
|
| |
|
|
|
Stock Listing: New York Stock Exchange symbol: KRG
CONTACT INFORMATION
Corporate Office
30 South Meridian Street, Suite 1100
Indianapolis, IN 46204
1-888-577-5600
317-577-5600
www.kiterealty.com
Investor Relations Contacts: |
| Analyst Coverage: |
| Analyst Coverage: |
|
|
|
|
|
Dan Sink, Chief Financial Officer |
| BMO Capital Markets |
| Keefe, Bruyette & Woods |
Adam Chavers, Director of Investor Relations |
| Mr. Paul E. Adornato, CFA |
| Stephen Swett |
Kite Realty Group Trust |
| (212) 885-4170 |
| (212) 887-3680 |
30 South Meridian Street, Suite 1100 |
| paul.adornato@bmo.com |
| sswett@kbw.com |
Indianapolis, IN 46204 |
|
|
|
|
(317) 577-5609 |
| Citigroup Global Markets |
| Raymond James |
dsink@kiterealty.com |
| Mr. Michael Bilerman |
| Mr. Paul Puryear |
achavers@kiterealty.com |
| (212) 816-1383 |
| (727) 567-2253 |
|
| michael.bilerman@citigroup.com |
| paul.puryear@raymondjames.com |
Transfer Agent: |
|
|
|
|
|
| Goldman, Sachs & Co. |
| RBC Capital Markets |
BNY Mellon Shareholder Services |
| Mr. Jonathan Haberman |
| Mr. Rich Moore |
Mr. James Balsan |
| (917) 343-4260 |
| (440) 715-2646 |
480 Washington Blvd., 29th Floor |
| jonathan.haberman@gs.com |
| rich.moore@rbccm.com |
Jersey City, NJ 07310 |
|
|
|
|
(800) 820-8521 |
| Janney Montgomery Scott |
| Stifel, Nicolaus & Company, Inc. |
|
| Stephie M. Krewson/Daniel P. Donlan |
| Mr. David M. Fick, CPA/Mr. Nathan Isbee |
|
| (215) 665-6385/(215) 665-6476 |
| (443) 224-1308/(443) 224-1346 |
Stock Specialist: |
| skrewson@jmsonline.com |
| dmfick@stifel.com |
|
| ddonlan@jmsonline.com |
| nisbee@stifel.com |
Barclays Capital |
|
|
|
|
45 Broadway |
|
|
| Wachovia Capital Markets |
20th Floor |
|
|
| Mr. Jeffrey J. Donnelly, CFA |
New York, NY 10006 |
|
|
| (617) 603-4262 |
(646) 333-7000 |
|
|
| jeff.donnelly@wachovia.com |
|
|
|
|
|
|
|
|
|
|
|
|
|
|
|
|
|
|
|
|
|
|
|
|
|
|
|
|
|
|
|
|
|
|
|
|
|
|
|
|
IMPORTANT NOTES
Interim Information
This Quarterly Financial Supplement contains historical information of Kite Realty Group Trust (“the Company” or “KRG”) and is intended to supplement the Company’s Quarterly Report on Form 10-Q for the three months ended March 31, 2009 to be filed on or about May 8, 2009, which should be read in conjunction with this supplement. The supplemental information is unaudited, although it reflects all adjustments which, in the opinion of management, are necessary for a fair presentation of operating results for the interim periods.
Forward-Looking Statements
This supplemental information package contains certain forward-looking statements within the meaning of Section 27A of the Securities Act of 1933 and Section 21E of the Securities Exchange Act of 1934. Such statements are based on assumptions and expectations that may not be realized and are inherently subject to risks, uncertainties and other factors, many of which cannot be predicted with accuracy and some of which might not even be anticipated. Future events and actual results, performance, transactions or achievements, financial or otherwise, may differ materially from the results, performance, transactions or achievements expressed or implied by the forward-looking statements. Risks, uncertainties and other factors that might cause such differences, some of which could be material, include, but are not limited to:
| • | national and local economic, business, real estate and other market conditions, particularly in light of the current recession and governmental action and policies; |
| • | financing risks; including access to capital at desirable terms |
| • | the level and volatility of interest rates; |
| • | financial stability of tenants; including their ability to pay rent; |
| • | the competitive environment in which the Company operates; |
| • | acquisition, disposition, development and joint venture risks; |
| • | property ownership and management risks; |
| • | the Company’s ability to maintain its status as a REIT for federal income tax purposes; |
| • | potential environmental and other liabilities; |
| • | other factors affecting the real estate industry generally; and |
| • | other risks identified in reports the Company files with the Securities and Exchange Commission (“the SEC”) or in other documents that it publicly disseminates, including, in particular, the section titled “Risk Factors” in our Annual Report on Form |
10-K for the fiscal year ended December 31, 2008 and in our quarterly reports on Form 10-Q.
The Company undertakes no obligation to publicly update or revise these forward-looking statements, whether as a result of new information, future events or otherwise.
Funds from Operations
Funds from Operations (FFO) is a widely used performance measure for real estate companies and is provided here as a supplemental measure of operating performance. We calculate FFO in accordance with the best practices described in the April 2002 National Policy Bulletin of the National Association of Real Estate Investment Trusts (NAREIT), which we refer to as the White Paper. The White Paper defines FFO as net income (determined in accordance with generally accepted accounting principles (GAAP)), excluding gains (or losses) from sales of depreciated property, plus depreciation and amortization, and after adjustments for unconsolidated partnerships and joint ventures.
Considering the nature of our business as a real estate owner and operator, we believe that FFO is helpful to investors in measuring our operational performance because it excludes various items included in net income that do not relate to or are not indicative of our operating performance, such as gains or losses from sales of depreciated property and depreciation and amortization, which can make periodic and peer analyses of operating performance more difficult. FFO should not be considered as an alternative to net income (determined in accordance with GAAP) as an indicator of our financial performance, is not an alternative to cash flow from operating activities (determined in accordance with GAAP) as a measure of our liquidity, and is not indicative of funds available to satisfy our cash needs, including our ability to make distributions. Our computation of FFO may not be comparable to FFO reported by other REITs that do not define the term in accordance with the current NAREIT definition or that interpret the current NAREIT definition differently than we do.
Net Operating Income
Net operating income (NOI) is provided here as a supplemental measure of operating performance. NOI is defined as property revenues less property operating expenses, excluding depreciation and amortization, interest expense and other items. We believe this presentation of NOI is helpful to investors as a measure of our operational performance because it is widely used in the real estate industry to measure the performance of real estate assets without regard to various items, included in net income, that do not relate to or are not indicative of operating performance, such as depreciation and amortization, which can vary depending upon accounting methods and book value of assets. We also believe NOI helps our investors to meaningfully compare the results of our operating performance from period to period by removing the impact of our capital structure (primarily interest expense on our outstanding indebtedness) and depreciation of the basis in our assets from our operating results. NOI should not, however, be considered as an alternative to net income (determined in accordance with GAAP) as an indicator of our financial performance.
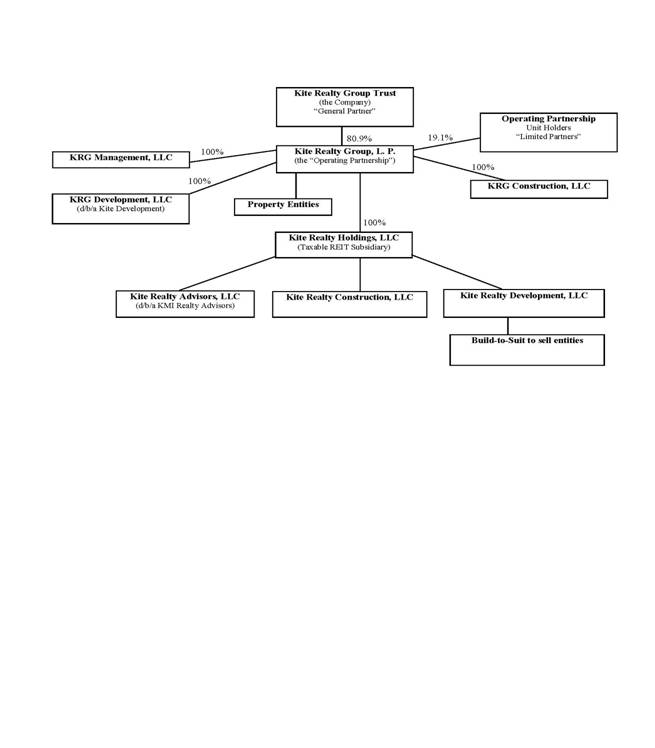
CORPORATE STRUCTURE CHART – MARCH 31, 2009
CONDENSED CONSOLIDATED BALANCE SHEETS (UNAUDITED)
|
| March 31, |
| December 31, |
| ||
|
|
|
| ||||
Assets: |
|
|
|
|
|
|
|
Investment properties, at cost: |
|
|
|
|
|
|
|
Land |
| $ | 228,369,439 |
| $ | 227,781,452 |
|
Land held for development |
|
| 23,074,389 |
|
| 25,431,845 |
|
Buildings and improvements |
|
| 698,951,428 |
|
| 690,161,336 |
|
Furniture, equipment and other |
|
| 5,041,033 |
|
| 5,024,696 |
|
Construction in progress |
|
| 195,067,908 |
|
| 191,106,309 |
|
|
|
|
|
|
| ||
|
|
| 1,150,504,197 |
|
| 1,139,505,638 |
|
Less: accumulated depreciation |
|
| (110,516,127 | ) |
| (104,051,695 | ) |
|
|
|
|
|
| ||
|
|
| 1,039,988,070 |
|
| 1,035,453,943 |
|
Cash and cash equivalents |
|
| 9,980,536 |
|
| 9,917,875 |
|
Tenant receivables, including accrued straight-line rent of $7,558,214 and $7,221,882, respectively, net of allowance for uncollectible accounts |
|
| 16,220,967 |
|
| 17,776,282 |
|
Other receivables |
|
| 8,733,645 |
|
| 10,357,679 |
|
Investments in unconsolidated entities, at equity |
|
| 11,090,328 |
|
| 1,902,473 |
|
Escrow deposits |
|
| 12,309,338 |
|
| 11,316,728 |
|
Deferred costs, net |
|
| 20,906,587 |
|
| 21,167,288 |
|
Prepaid and other assets |
|
| 4,585,162 |
|
| 4,159,638 |
|
|
|
|
|
|
| ||
Total Assets |
| $ | 1,123,814,633 |
| $ | 1,112,051,906 |
|
|
|
|
|
|
| ||
|
|
|
|
|
|
|
|
Liabilities and Equity: |
|
|
|
|
|
|
|
Mortgage and other indebtedness |
| $ | 704,676,288 |
| $ | 677,661,466 |
|
Accounts payable and accrued expenses |
|
| 43,038,827 |
|
| 53,144,015 |
|
Deferred revenue and other liabilities |
|
| 24,498,750 |
|
| 24,594,794 |
|
|
|
|
|
|
| ||
Total Liabilities |
|
| 772,213,865 |
|
| 755,400,275 |
|
Commitments and contingencies |
|
|
|
|
|
|
|
Redeemable noncontrolling interests in the Operating Partnership |
|
| 66,312,906 |
|
| 67,276,904 |
|
Equity: |
|
|
|
|
|
|
|
Kite Realty Group Trust Shareholders’ Equity: |
|
|
|
|
|
|
|
Preferred Shares, $.01 par value, 40,000,000 shares authorized, no shares issued and outstanding |
|
| — |
|
| — |
|
Common Shares, $.01 par value, 200,000,000 shares authorized 34,187,241 shares and 34,181,179 shares issued and outstanding at March 31, 2009 and December 31, 2008, respectively |
|
| 341,872 |
|
| 341,812 |
|
Additional paid in capital and other |
|
| 343,825,990 |
|
| 343,631,595 |
|
Accumulated other comprehensive loss |
|
| (7,504,706 | ) |
| (7,739,154 | ) |
Accumulated deficit |
|
| (55,788,074 | ) |
| (51,276,059 | ) |
|
|
|
|
|
| ||
Total Kite Realty Group Trust Shareholders’ Equity |
|
| 280,875,082 |
|
| 284,958,194 |
|
Noncontrolling Interests |
|
| 4,412,780 |
|
| 4,416,533 |
|
|
|
|
|
|
| ||
Total Equity |
|
| 285,287,862 |
|
| 289,374,727 |
|
|
|
|
|
|
| ||
Total Liabilities and Equity |
| $ | 1,123,814,633 |
| $ | 1,112,051,906 |
|
|
|
|
|
|
| ||
CONSOLIDATED STATEMENTS OF OPERATIONS – THREE MONTHS (UNAUDITED)
| Three Months Ended March 31, |
| ||||
|
| |||||
| 2009 |
| 2008 |
| ||
|
|
| ||||
Revenue: |
|
|
|
|
|
|
Minimum rent | $ | 17,985,844 |
| $ | 17,884,128 |
|
Tenant reimbursements |
| 4,695,681 |
|
| 5,018,938 |
|
Other property related revenue |
| 1,588,108 |
|
| 5,157,085 |
|
Construction and service fee revenue |
| 6,148,995 |
|
| 4,288,522 |
|
|
|
|
|
| ||
Total revenue |
| 30,418,628 |
|
| 32,348,673 |
|
Expenses: |
|
|
|
|
|
|
Property operating |
| 5,590,600 |
|
| 4,361,771 |
|
Real estate taxes |
| 2,793,765 |
|
| 3,054,349 |
|
Cost of construction and services |
| 5,559,316 |
|
| 3,764,234 |
|
General, administrative, and other |
| 1,343,470 |
|
| 1,709,950 |
|
Depreciation and amortization |
| 7,511,438 |
|
| 8,028,663 |
|
|
|
|
|
| ||
Total expenses |
| 22,798,589 |
|
| 20,918,967 |
|
|
|
|
|
| ||
Operating income |
| 7,620,039 |
|
| 11,429,706 |
|
Interest expense |
| (6,776,508 | ) |
| (7,253,566 | ) |
Income tax expense of taxable REIT subsidiary |
| (37,952 | ) |
| (1,153,228 | ) |
Other income |
| 48,899 |
|
| 65,232 |
|
Income from unconsolidated entities |
| 31,500 |
|
| 61,174 |
|
|
|
|
|
| ||
Income from continuing operations |
| 885,978 |
|
| 3,149,318 |
|
Income from discontinued operations |
| — |
|
| 330,823 |
|
|
|
|
|
| ||
Consolidated net income |
| 885,978 |
|
| 3,480,141 |
|
Net income attributable to noncontrolling interests |
| (184,736 | ) |
| (772,842 | ) |
|
|
|
|
| ||
Net income attributable to Kite Realty Group Trust | $ | 701,242 |
| $ | 2,707,299 |
|
|
|
|
|
| ||
|
|
|
|
|
|
|
Income per common share – basic & diluted |
|
|
|
|
|
|
Income from continuing operations attributable to Kite Realty Group Trust common shareholders | $ | 0.02 |
| $ | 0.08 |
|
Income from discontinued operations attributable to Kite Realty Group Trust common shareholders |
| — |
|
| 0.01 |
|
|
|
|
|
| ||
Net income attributable to Kite Realty Group Trust common shareholders | $ | 0.02 |
| $ | 0.09 |
|
|
|
|
|
| ||
|
|
|
|
|
|
|
Weighted average common shares outstanding - basic |
| 34,184,305 |
|
| 29,028,953 |
|
|
|
|
|
| ||
Weighted average common shares outstanding - diluted |
| 34,220,160 |
|
| 29,059,809 |
|
|
|
|
|
| ||
Dividends declared per common share | $ | 0.1525 |
| $ | 0.2050 |
|
|
|
|
|
| ||
|
|
|
|
|
|
|
Net income attributable to Kite Realty Group Trust common shareholders: |
|
|
|
|
|
|
Income from continuing operations | $ | 701,242 |
| $ | 2,450,250 |
|
Discontinued operations |
| — |
|
| 257,049 |
|
|
|
|
|
| ||
Net income attributable to Kite Realty Group Trust | $ | 701,242 |
| $ | 2,707,299 |
|
|
|
|
|
| ||
FUNDS FROM OPERATIONS AND OTHER FINANCIAL INFORMATION –THREE MONTHS
|
| Three Months Ended March 31, |
| ||||
|
|
| |||||
|
| 2009 |
| 2008 |
| ||
|
|
|
| ||||
Consolidated net income |
| $ | 885,978 |
| $ | 3,480,141 |
|
Deduct net (income) loss attributable to noncontrolling interests in properties |
|
| (20,247 | ) |
| 4,156 |
|
Add depreciation and amortization of consolidated entities, net of noncontrolling interests in properties |
|
| 7,380,243 |
|
| 7,983,114 |
|
Add depreciation and amortization of unconsolidated entities |
|
| 52,136 |
|
| 101,057 |
|
|
|
|
|
|
| ||
Funds From Operations of the Kite Portfolio1 |
|
| 8,298,110 |
|
| 11,568,468 |
|
Deduct redeemable noncontrolling interests in Funds From Operations |
|
| (1,576,641 | ) |
| (2,579,768 | ) |
|
|
|
|
|
| ||
Funds From Operations allocable to the Company1 |
| $ | 6,721,469 |
| $ | 8,988,700 |
|
|
|
|
|
|
| ||
|
|
|
|
|
|
|
|
Basic FFO per share of the Kite Portfolio |
| $ | 0.20 |
| $ | 0.31 |
|
|
|
|
|
|
| ||
Diluted FFO per share of the Kite Portfolio |
| $ | 0.20 |
| $ | 0.31 |
|
|
|
|
|
|
| ||
|
|
|
|
|
|
|
|
Basic weighted average Common Shares outstanding |
|
| 34,184,305 |
|
| 29,028,953 |
|
|
|
|
|
|
| ||
Diluted weighted average Common Shares outstanding |
|
| 34,220,160 |
|
| 29,059,809 |
|
|
|
|
|
|
| ||
Basic weighted average Common Shares and Units outstanding |
|
| 42,236,784 |
|
| 37,367,201 |
|
|
|
|
|
|
| ||
Diluted weighted average Common Shares and Units outstanding |
|
| 42,272,639 |
|
| 37,398,057 |
|
|
|
|
|
|
| ||
|
|
|
|
|
|
|
|
Other Financial Information: |
|
|
|
|
|
|
|
Recurring capital expenditures2 |
|
|
|
|
|
|
|
Tenant improvements – Retail |
| $ | 88,590 |
| $ | 43,085 |
|
Tenant improvements – Commercial3 |
|
| - |
|
| 94,417 |
|
Leasing commissions – Retail |
|
| 56,716 |
|
| 146,966 |
|
Leasing commissions – Commercial3 |
|
| - |
|
| 67,336 |
|
Capital improvements3 |
|
| 67,725 |
|
| 56,751 |
|
Scheduled debt principal payments |
|
| 867,111 |
|
| 705,616 |
|
Straight-line rent |
|
| 336,333 |
|
| 320,857 |
|
Market rent amortization income from acquired leases |
|
| 782,430 |
|
| 691,901 |
|
Market debt adjustment |
|
| 107,714 |
|
| 107,714 |
|
Capitalized interest |
|
| 2,064,743 |
|
| 2,589,858 |
|
Mark to market lease amount in Deferred Revenue and Other Liabilities on consolidated balance sheet |
|
| 14,885,222 |
|
|
|
|
Additional Construction in Progess not in development pipeline4 |
|
| 54,909,228 |
|
|
|
|
____________________ | |
1 | “Funds From Operations of the Kite Portfolio” measures 100% of the operating performance of the Operating Partnership’s real estate properties and construction and service subsidiaries in which the Company owns an interest. “Funds From Operations allocable to the Company” reflects a reduction for the redeemable noncontrolling weighted average diluted interest in the Operating Partnership. |
|
|
2 | Excludes tenant improvements and leasing commissions relating to development projects and first-generation space. |
|
|
3 | A portion of these capital improvements are reimbursed by tenants and are revenue producing. |
|
|
4 | Represents projects being developed in phases or in transition to operating portfolio. |
|
|
MARKET CAPITALIZATION AS OF MARCH 31, 2009
| As of March 31, 2009 |
|
| ||||||
|
|
| |||||||
|
|
| Total |
| Percent of |
|
| ||
| Percent of |
| Market |
| Total Market |
|
| ||
| Total Equity |
| Capitalization |
| Capitalization |
|
| ||
|
|
|
|
| |||||
Equity Capitalization: |
|
|
|
|
|
|
|
|
|
|
|
|
|
|
|
|
|
|
|
Total Common Shares Outstanding | 80.9 | % |
|
| 34,187,241 |
|
|
|
|
|
|
|
|
|
|
|
|
|
|
Operating Partnership ("OP") Units Outstanding | 19.1 | % |
|
| 8,052,479 |
|
|
|
|
|
|
|
|
|
|
|
|
|
|
|
|
|
|
|
|
| |||
Combined Common Shares and OP Units | 100.0 | % |
|
| 42,239,720 |
|
|
|
|
|
|
|
|
|
|
|
| ||
|
|
|
|
|
|
|
|
|
|
Market Price of Common Shares at March 31, 2009 |
|
|
| $ | 2.45 |
|
|
|
|
|
|
|
|
|
|
|
|
|
|
|
|
|
|
|
|
| |||
Total Equity Capitalization |
|
|
| $ | 103,487,314 |
| 14 | % |
|
|
|
|
|
|
|
|
|
|
|
|
|
|
|
|
|
|
|
|
|
Debt Capitalization: |
|
|
|
|
|
|
|
|
|
Company Outstanding Debt |
|
|
| $ | 704,676,288 |
|
|
|
|
|
|
|
|
|
|
|
|
|
|
Less: Partner Share of Consolidated Joint Venture Debt |
|
|
|
| (54,644,956 | ) |
|
|
|
|
|
|
|
|
|
|
|
| |
|
|
|
|
|
|
|
|
|
|
Company Share of Outstanding Debt |
|
|
|
| 650,031,332 |
|
|
|
|
|
|
|
|
|
|
|
|
|
|
Pro-rata Share of Unconsolidated Joint Venture Debt |
|
|
|
| 15,647,182 |
|
|
|
|
|
|
|
|
|
|
|
|
|
|
Less: Cash and Cash Equivalents |
|
|
|
| (9,980,536 | ) |
|
|
|
|
|
|
|
|
|
|
|
|
|
|
|
|
|
|
|
|
|
| |
Total Net Debt Capitalization |
|
|
| $ | 655,697,978 |
| 86 | % |
|
|
|
|
|
|
|
| |||
|
|
|
|
|
|
|
|
|
|
Total Market Capitalization |
|
|
| $ | 759,185,292 |
| 100 | % |
|
|
|
|
|
|
|
| |||
SAME PROPERTY NET OPERATING INCOME (NOI)
| Three Months Ended March 31 |
| ||||||
|
| |||||||
| 2009 |
| 2008 |
| % Change |
| ||
|
|
|
| |||||
Number of properties at period end1 |
| 47 |
|
| 47 |
|
|
|
|
|
|
|
|
|
|
|
|
Occupancy at period-end |
| 91.7% |
|
| 90.9% |
|
|
|
Minimum rent | $ | 14,891,523 |
| $ | 15,169,563 |
|
|
|
Tenant recoveries |
| 3,970,190 |
|
| 4,124,481 |
|
|
|
Other income |
| 521,974 |
|
| 475,361 |
|
|
|
Pro rata share of revenue – unconsolidated joint venture properties |
| 195,175 |
|
| 189,194 |
|
|
|
|
|
|
|
|
|
| ||
|
| 19,578,862 |
|
| 19,958,599 |
|
|
|
|
|
|
|
|
|
|
|
|
Property operating expenses |
| 3,562,051 |
|
| 3,610,956 |
|
|
|
Real estate taxes |
| 2,670,464 |
|
| 2,670,056 |
|
|
|
Pro rata share of expenses – unconsolidated joint venture properties |
| 68,726 |
|
| 61,908 |
|
|
|
|
|
|
|
|
|
| ||
|
| 6,301,241 |
|
| 6,342,920 |
|
|
|
|
|
|
|
|
|
|
|
|
|
|
|
|
|
|
| ||
Net operating income – same properties (47 properties)2 |
| 13,277,621 |
|
| 13,615,679 |
| -2.5 | % |
|
|
|
|
|
|
|
|
|
Reconciliation to Most Directly Comparable GAAP Measure: |
|
|
|
|
|
|
|
|
|
|
|
|
|
|
|
|
|
Net operating income – same properties | $ | 13,277,621 |
| $ | 13,615,679 |
|
|
|
Other income (expense), net |
| (12,576,379 | ) |
| (10,908,380 | ) |
|
|
|
|
|
|
|
|
|
|
|
|
|
|
|
|
|
| ||
Net income attributable to Kite Realty Group Trust | $ | 701,242 |
| $ | 2,707,299 |
|
|
|
|
|
|
|
|
|
| ||
____________________ | |
1 | Same Property analysis excludes properties acquired and under redevelopment. |
|
|
2 | Same Property net operating income is considered a non-GAAP measure because it excludes net gains from outlot sales, write offs of straight-line rent and lease intangibles, bad debt expense, lease termination fees and significant prior year expense recoveries and adjustments, if any. |
|
|
|
|
The Company believes that Net Operating Income is helpful to investors as a measure of its operating performance because it excludes various items included in net income that do not relate to or are not indicative of its operating performance, such as depreciation and amortization and interest expense. The Company believes that Same Property NOI is helpful to investors as a measure of its operating performance because it includes only the NOI of properties that have been owned for the full period presented, which eliminates disparities in net income due to the redevelopment, acquisition or disposition of properties during the particular period presented, and thus provides a more consistent metric for the comparison of the Company's properties. NOI and Same Property NOI should not, however, be considered as alternatives to net income (calculated in accordance with GAAP) as indicators of the Company's financial performance.
NET OPERATING INCOME BY QUARTER
|
| Three Months Ended | ||||||||||||||||||
|
| |||||||||||||||||||
|
| March 31, 2009 |
| December 31, 2008 |
| September 30, 2008 |
| June 30, 2008 |
| March 31, 2008 | ||||||||||
|
|
|
|
|
| |||||||||||||||
Revenue: |
|
|
|
|
|
|
|
|
|
|
|
|
|
|
|
|
|
|
| |
Minimum rent | $ | 17,985,844 |
|
| $ | 17,065,771 |
|
| $ | 18,608,247 |
|
| $ | 18,304,810 |
|
| $ | 17,884,129 |
| |
Tenant reimbursements |
| 4,695,681 |
|
|
| 3,559,921 |
|
|
| 4,587,383 |
|
|
| 4,569,309 |
|
|
| 5,018,938 |
| |
Other property related revenue1 |
| 1,204,737 |
|
|
| 1,646,976 |
|
|
| 3,422,002 |
|
|
| 2,645,119 |
|
|
| 4,763,860 |
| |
Parking revenue, net2 |
| 153,042 |
|
|
| 210,534 |
|
|
| 159,587 |
|
|
| (102,092 | ) |
|
| 210,336 |
| |
|
|
|
|
|
|
|
|
|
|
|
|
|
|
| ||||||
|
| 24,039,304 |
|
|
| 22,483,202 |
|
|
| 26,777,219 |
|
|
| 25,417,146 |
|
|
| 27,877,263 |
| |
Expenses: |
|
|
|
|
|
|
|
|
|
|
|
|
|
|
|
|
|
|
| |
Property operating – Recoverable5 |
| 4,025,757 |
|
|
| 3,451,487 |
|
|
| 3,181,635 |
|
|
| 3,161,482 |
|
|
| 3,634,230 |
| |
Property operating – Non-Recoverable5 |
| 1,424,442 |
|
|
| 1,152,311 |
|
|
| 782,226 |
|
|
| 623,177 |
|
|
| 604,909 |
| |
Real estate taxes |
| 2,727,801 |
|
|
| 2,110,448 |
|
|
| 3,440,433 |
|
|
| 2,978,696 |
|
|
| 3,018,058 |
| |
|
|
|
|
|
|
|
|
|
|
|
|
|
|
| ||||||
|
| 8,178,000 |
|
|
| 6,714,246 |
|
|
| 7,404,294 |
|
|
| 6,763,355 |
|
|
| 7,257,197 |
| |
|
|
|
|
|
|
|
|
|
|
|
|
|
|
| ||||||
Net Operating Income – Properties |
| 15,861,304 |
|
|
| 15,768,956 |
|
|
| 19,372,925 |
|
|
| 18,653,791 |
|
|
| 20,620,066 |
| |
|
|
|
|
|
|
|
|
|
|
|
|
|
|
|
|
|
|
|
| |
Other Income (Expense): |
|
|
|
|
|
|
|
|
|
|
|
|
|
|
|
|
|
|
| |
Construction and service fee revenue7 |
| 6,148,995 |
|
|
| 19,148,029 |
|
|
| 7,355,282 |
|
|
| 8,311,318 |
|
|
| 4,288,522 |
| |
Cost of construction and services7 |
| (5,559,316 | ) |
|
| (16,860,243 | ) |
|
| (6,139,131 | ) |
|
| (7,024,400 | ) |
|
| (3,764,234 | ) | |
General, administrative, and other |
| (1,343,470 | ) |
|
| (1,461,951 | ) |
|
| (1,452,845 | ) |
|
| (1,259,407 | ) |
|
| (1,709,949 | ) | |
|
|
|
|
|
|
|
|
|
|
|
|
|
|
| ||||||
|
| (753,791 | ) |
|
| 825,835 |
|
|
| (236,694 | ) |
|
| 27,511 |
|
|
| (1,185,661 | ) | |
|
|
|
|
|
|
|
|
|
|
|
|
|
|
| ||||||
|
|
|
|
|
|
|
|
|
|
|
|
|
|
|
|
|
|
|
| |
Earnings Before Interest, Taxes, Depreciation and Amortization |
| 15,107,513 |
|
|
| 16,594,791 |
|
|
| 19,136,231 |
|
|
| 18,681,302 |
|
|
| 19,434,405 |
| |
|
|
|
|
|
|
|
|
|
|
|
|
|
|
|
|
|
|
|
| |
Depreciation and amortization |
| (7,487,474 | ) |
|
| (10,874,765 | ) |
|
| (8,147,215 | ) |
|
| (8,324,040 | ) |
|
| (8,004,699 | ) | |
Interest expense |
| (6,776,508 | ) |
|
| (7,254,291 | ) |
|
| (7,512,825 | ) |
|
| (7,351,499 | ) |
|
| (7,253,566 | ) | |
Income tax expense of taxable REIT subsidiary |
| (37,952 | ) |
|
| (391,053 | ) |
|
| (131,691 | ) |
|
| (251,858 | ) |
|
| (1,153,228 | ) | |
Other income |
| 48,899 |
|
|
| 15,497 |
|
|
| 45,619 |
|
|
| 31,676 |
|
|
| 65,232 |
| |
Income from unconsolidated entities |
| 31,500 |
|
|
| 629,490 |
|
|
| 65,640 |
|
|
| 86,121 |
|
|
| 61,174 |
| |
Gain on sale of unconsolidated property3 |
| — |
|
|
| 1,233,338 |
|
|
| — |
|
|
| — |
|
|
| — |
| |
|
|
|
|
|
|
|
|
|
|
|
|
|
|
| ||||||
Income (loss) from continuing operations |
| 885,978 |
|
|
| (46,993 | ) |
|
| 3,455,759 |
|
|
| 2,871,702 |
|
|
| 3,149,318 |
| |
Discontinued operations4: |
|
|
|
|
|
|
|
|
|
|
|
|
|
|
|
|
|
|
| |
Operating income from discontinued operations |
| — |
|
|
| 132,626 |
|
|
| 320,424 |
|
|
| 305,041 |
|
|
| 330,822 |
| |
Loss on sale of operating property |
| — |
|
|
| (2,623,058 | ) |
|
| — |
|
|
| — |
|
|
| — |
| |
|
|
|
|
|
|
|
|
|
|
|
|
|
|
| ||||||
(Loss) income from discontinued operations |
| — |
|
|
| (2,490,432 | ) |
|
| 320,424 |
|
|
| 305,041 |
|
|
| 330,822 |
| |
|
|
|
|
|
|
|
|
|
|
|
|
|
|
| ||||||
Consolidated net income (loss) |
| 885,978 |
|
|
| (2,537,425 | ) |
|
| 3,776,183 |
|
|
| 3,176,743 |
|
|
| 3,480,140 |
| |
Net (income) loss attributable to noncontrolling interest |
| (184,736 | ) |
|
| 543,067 |
|
|
| (855,287 | ) |
|
| (717,454 | ) |
|
| (772,841 | ) | |
|
|
|
|
|
|
|
|
|
|
|
|
|
|
| ||||||
Net income (loss) attributable to Kite Realty Group Trust | $ | 701,242 |
|
| $ | (1,994,358 | ) |
| $ | 2,920,896 |
|
| $ | 2,459,289 |
|
| $ | 2,707,299 |
| |
|
|
|
|
|
|
|
|
|
|
|
|
|
|
| ||||||
|
|
|
|
|
|
|
|
|
|
|
|
|
|
|
|
|
|
|
| |
NOI/Revenue – Properties |
| 66.0% |
|
|
| 70.1% |
|
|
| 72.3% |
|
|
| 73.4% |
|
|
| 74.0% |
| |
Recovery Ratio – Properties5,6 |
| 69.5% |
|
|
| 64.0% |
|
|
| 69.3% |
|
|
| 74.4% |
|
|
| 75.4% |
| |
____________________ | |
1 | Other property related revenue for the three months ended March 31, 2009 includes net gains on land and outlot sales of $1.17 million. |
2 | Effective January 1, 2008, the Company changed the structure of the parking garage agreement at its Union Station property from a lease to a management agreement with a third party. During the three months ended June 30, 2008, the Company recorded the effects of a real estate tax reassessment of the parking garage property. |
3 | In December 2008, the Company sold its interest in its Spring Mill Medical Center commercial property, which was an unconsolidated entity owned in a 50% owned joint venture. |
4 | In December 2008, the Company sold its Silver Glen Crossing property. |
5 | Recoverable expenses include total management fee expense, a portion of which is recoverable. Non-recoverable expenses primarily include bad debt and legal expense. |
6 | “Recovery Ratio” is computed by dividing recoverable property operating expense and real estate tax expense into tenant reimbursements. |
7 | In December 2008, the Company sold its Spring Mill Medical build to suit asset. Construction revenue includes $10.6 million from this sale and Cost of construction and services includes $9.4 million from the sale. |
SUMMARY OF OUTSTANDING DEBT AS OF MARCH 31, 2009
SEE REFINANCING UPDATE ON PAGE 17
TOTAL OUTSTANDING DEBT |
|
|
|
|
|
|
|
| ||||
| Outstanding Amount |
| Ratio |
| Weighted Average Interest Rate |
| Weighted Average Maturity (in years) |
| ||||
|
|
|
|
| ||||||||
Fixed Rate Debt |
|
|
|
|
|
|
|
|
|
|
| |
Consolidated | $ | 330,552,030 |
|
| 47 | % |
| 6.00 | % |
| 5.8 |
|
Unconsolidated |
| 2,097,982 |
|
| 0 | % |
| 6.99 | % |
| 0.2 |
|
Floating Rate Debt (Hedged)1 |
| 189,700,000 |
|
| 26 | % |
| 5.64 | % |
| 2.3 |
|
|
|
|
|
|
|
|
|
| ||||
Total Fixed Rate Debt |
| 522,350,012 |
|
| 73 | % |
| 5.87 | % |
| 4.5 |
|
Variable Rate Debt:2 |
|
|
|
|
|
|
|
|
|
|
|
|
Construction Loans |
| 63,085,626 |
|
| 9 | % |
| 2.41 | % |
| 0.8 |
|
Other Variable |
| 309,737,719 |
|
| 42 | % |
| 2.28 | % |
| 2.0 |
|
Floating Rate Debt (Hedged)1 |
| (189,700,000 | ) |
| -26 | % |
| -2.54 | % |
| -2.3 | |
Unconsolidated |
| 13,549,200 |
|
| 2 | % |
| 3.50 | % |
| 1.9 | |
|
|
|
|
|
|
|
| |||||
Total Variable Rate Debt |
| 196,672,545 |
|
| 27 | % |
| 2.16 | % |
| 1.4 | |
Net Premiums on Fixed Rate Debt |
| 1,300,913 |
|
| N/A |
|
| N/A |
|
| N/A | |
|
|
|
|
|
|
|
| |||||
Total | $ | 720,323,470 |
|
| 100 | % |
| 4.86 | % |
| 3.6 | |
|
|
|
|
|
|
|
| |||||
SCHEDULE OF MATURITIES BY YEAR | ||||||||||||||
|
|
| SEE REFINANCING UPDATE ON PAGE 17 | |||||||||||
| Mortgage Debt |
|
|
|
|
| ||||||||
|
|
|
|
|
| |||||||||
| Annual Maturity | Term Maturities | Corporate Debt4 | Construction Loans | Total Consolidated Outstanding Debt | KRG Share of Unconsolidated Mortgage Debt | Total Consolidated and Unconsolidated Debt | |||||||
2009 | $ | 2,391,142 | $ | 31,563,980 | $ | — | $ | 40,792,247 | $ | 74,747,369 | $ | 2,097,982 | $ | 76,845,351 |
2010 |
| 3,144,734 |
| 48,215,133 |
| — |
| 15,784,636 |
| 67,144,503 |
| — |
| 67,144,503 |
20113 |
| 3,124,697 |
| 85,281,656 |
| 183,000,000 |
| 6,508,743 |
| 277,915,096 |
| 13,549,200 |
| 291,464,296 |
2012 |
| 3,549,537 |
| 35,355,396 |
| — |
| — |
| 38,904,933 |
| — |
| 38,904,933 |
2013 |
| 3,556,861 |
| 4,027,491 |
| — |
| — |
| 7,584,352 |
| — |
| 7,584,352 |
2014 |
| 3,262,898 |
| 32,374,217 |
| — |
| — |
| 35,637,115 |
| — |
| 35,637,115 |
2015 |
| 2,956,748 |
| 38,301,942 |
| — |
| — |
| 41,258,690 |
| — |
| 41,258,690 |
2016 and Beyond |
| 4,809,032 |
| 155,374,285 |
| — |
| — |
| 160,183,317 |
| — |
| 160,183,317 |
Net Premiums on Fixed Rate Debt |
| — |
| — |
| — |
| — |
| 1,300,913 |
| — |
| 1,300,913 |
|
|
|
|
|
|
|
| |||||||
Total | $ | 26,795,649 | $ | 430,494,100 | $ | 183,000,000 | $ | 63,085,626 | $ | 704,676,288 | $ | 15,647,182 | $ | 720,323,470 |
|
|
|
|
|
|
|
| |||||||
____________________ | |||||||||||
1 | These debt obligations are hedged by interest rate swap agreements which consist of the following: | ||||||||||
| Consolidated Debt | $ | 189,700,000 |
| |||||||
| KRG Share of Unconsolidated Debt |
| — |
| |||||||
|
|
|
| ||||||||
| Total | $ | 189,700,000 |
| |||||||
|
|
|
| ||||||||
|
| ||||||||||
2 | Variable rate debt, net of interest rate swap transactions: | ||||||||||
| - | Construction | $ | 43,385,626 |
| 6 | % |
| |||
| - | Other Variable |
| 139,737,719 |
| 19 | % | (includes debt on acquisition land held for development) | |||
| - | Unconsolidated |
| 13,549,200 |
| 2 | % | (includes debt on acquisition land held for development) | |||
|
|
|
|
|
|
| |||||
|
| Total | $ | 196,672,545 |
| 27 | % |
| |||
|
|
|
|
|
|
| |||||
|
| ||||||||||
3 | The Unsecured Credit Facility matures on February 11, 2011. A one-year extension is available if the Company remains in compliance with the Facility’s restrictive covenants. | ||||||||||
4 | Consists of the Unsecured Credit Facility and Unsecured Term Loan. | ||||||||||
SCHEDULE OF OUTSTANDING DEBT AS OF MARCH 31, 2009
CONSOLIDATED DEBT |
|
|
|
|
|
|
|
|
| ||||||||
|
|
|
|
|
|
|
|
|
|
| |||||||
Fixed Rate Debt |
|
|
| Interest |
| Maturity Date |
| Balance as of March 31, 2009 |
| Monthly Debt Service as of March 31, 2009 | |||||||
|
|
|
|
|
| ||||||||||||
50th & 12th |
|
|
| 5.67 | % |
| 11/11/14 |
| $ | 4,424,210 |
| $ | 27,190 | ||||
Boulevard Crossing |
|
|
| 5.11 | % |
| 12/11/09 |
|
| 11,853,928 |
|
| 68,815 | ||||
Centre at Panola, Phase I |
|
|
| 6.78 | % |
| 1/1/22 |
|
| 3,793,905 |
|
| 36,583 | ||||
Cool Creek Commons |
|
|
| 5.88 | % |
| 4/11/16 |
|
| 18,000,000 |
|
| 82,320 | ||||
Corner Shops, The |
|
|
| 7.65 | % |
| 7/1/11 |
|
| 1,636,093 |
|
| 17,111 | ||||
Fox Lake Crossing |
|
|
| 5.16 | % |
| 7/1/12 |
|
| 11,457,484 |
|
| 68,604 | ||||
Geist Pavilion |
|
|
| 5.78 | % |
| 1/1/17 |
|
| 11,125,000 |
|
| 50,013 | ||||
Indian River Square |
|
|
| 5.42 | % |
| 6/11/15 |
|
| 13,300,000 |
|
| 56,067 | ||||
International Speedway Square |
|
|
| 7.17 | % |
| 3/11/11 |
|
| 18,823,649 |
|
| 139,141 | ||||
Kedron Village |
|
|
| 5.70 | % |
| 1/11/17 |
|
| 29,700,000 |
|
| 131,670 | ||||
Pine Ridge Crossing |
|
|
| 6.34 | % |
| 10/11/16 |
|
| 17,500,000 |
|
| 86,349 | ||||
Plaza at Cedar Hill |
|
|
| 7.38 | % |
| 2/1/12 |
|
| 25,885,755 |
|
| 193,484 | ||||
Plaza Volente |
|
|
| 5.42 | % |
| 6/11/15 |
|
| 28,680,000 |
|
| 120,902 | ||||
Preston Commons |
|
|
| 5.90 | % |
| 3/11/13 |
|
| 4,363,991 |
|
| 28,174 | ||||
Ridge Plaza |
|
|
| 5.15 | % |
| 10/11/09 |
|
| 15,878,898 |
|
| 92,824 | ||||
Riverchase Plaza |
|
|
| 6.34 | % |
| 10/11/16 |
|
| 10,500,000 |
|
| 51,809 | ||||
Sunland Towne Centre |
|
|
| 6.01 | % |
| 7/1/16 |
|
| 25,000,000 |
|
| 116,861 | ||||
30 South |
|
|
| 6.09 | % |
| 1/11/14 |
|
| 21,947,578 |
|
| 142,257 | ||||
Traders Point |
|
|
| 5.86 | % |
| 10/11/16 |
|
| 48,000,000 |
|
| 218,773 | ||||
Whitehall Pike |
|
|
| 6.71 | % |
| 7/5/18 |
|
| 8,681,539 |
|
| 77,436 | ||||
|
|
|
|
|
|
|
|
|
|
|
| ||||||
Subtotal |
|
|
|
|
|
|
| $ | 330,552,030 |
| $ | 1,806,383 | |||||
|
|
|
|
|
|
|
|
|
|
| |||||||
|
|
|
|
|
|
|
|
|
|
| |||||||
Floating Rate Debt (Hedged) |
| Lender |
| Interest |
| Maturity Date |
| Balance as of March 31, 2009 |
| Monthly Debt Service as of March 31, 2009 | |||||||
|
|
|
|
| |||||||||||||
Unsecured Credit Facility1 |
| KeyBank (Admin. Agent) |
| 6.32 | % |
| 2/20/11 |
| $ | 50,000,000 |
| $ | 263,417 | ||||
Unsecured Credit Facility1 |
| KeyBank (Admin. Agent) |
| 6.17 | % |
| 2/18/11 |
|
| 25,000,000 |
|
| 128,438 | ||||
Unsecured Term Loan1 |
| KeyBank (Admin. Agent) |
| 5.92 | % |
| 7/15/11 |
|
| 55,000,000 |
|
| 271,104 | ||||
Bayport Commons |
| Bank of America |
| 4.48 | % |
| 12/27/11 |
|
| 19,700,000 |
|
| 73,547 | ||||
Gateway Shopping Center |
| Charter One Bank |
| 4.88 | % |
| 10/31/11 |
|
| 20,000,000 |
|
| 81,333 | ||||
Glendale Town Center |
| M&I Bank |
| 4.40 | % |
| 12/19/11 |
|
| 20,000,000 |
|
| 73,333 | ||||
|
|
|
|
|
|
|
|
|
|
|
| ||||||
Subtotal |
|
|
|
|
|
|
|
| $ | 189,700,000 |
| $ | 891,172 | ||||
|
|
|
|
|
|
|
|
|
|
|
| ||||||
TOTAL CONSOLIDATED FIXED RATE DEBT |
|
|
|
|
|
| $ | 520,252,030 |
|
| $ | 2,697,555 | |||||
|
|
|
|
|
|
|
|
|
|
| |||||||
TOTAL NET PREMIUMS |
|
|
|
|
|
|
|
| $ | 1,300,913 |
|
|
|
| |||
|
|
|
|
|
|
|
|
|
|
|
|
|
| ||||
|
|
|
|
|
|
|
|
|
|
|
|
|
| ||||
Variable Rate Debt: Mortgages |
| Lender |
| Interest |
| Maturity Date |
| Balance as of March 31, 2009 |
|
|
| ||||||
|
|
|
|
|
|
| |||||||||||
Bayport Commons3 |
| Bank of America |
| LIBOR + 275 |
| 12/27/11 |
| $ | 20,544,000 |
|
|
| |||||
Beacon Hill Shopping Center4 |
| Fifth Third Bank |
| LIBOR + 125 |
| 3/30/14 |
|
| 8,400,000 |
|
|
| |||||
Estero Town Commons5 |
| Wachovia Bank/Wells Fargo |
| LIBOR + 155 |
| 1/3/10 |
|
| 15,389,840 |
|
|
| |||||
Fishers Station6 |
| National City Bank/PNC |
| LIBOR + 150 |
| 6/6/09 |
|
| 4,163,175 |
|
|
| |||||
Gateway Shopping Center4 |
| Charter One Bank |
| LIBOR + 190 |
| 10/31/11 |
|
| 21,076,861 |
|
|
| |||||
Glendale Town Center |
| M&I Bank |
| LIBOR + 275 |
| 12/19/11 |
|
| 20,553,000 |
|
|
| |||||
Indiana State Motor Pool |
| Old National Bank |
| LIBOR + 135 |
| 2/4/11 |
|
| 3,785,550 |
|
|
| |||||
Rivers Edge |
| Huntington Bank |
| LIBOR + 125 |
| 2/3/10 |
|
| 14,940,000 |
|
|
| |||||
Tarpon Springs Plaza |
| Wachovia Bank/Wells Fargo |
| LIBOR + 155 |
| 1/3/10 |
|
| 17,885,293 |
|
|
| |||||
|
|
|
|
|
|
|
|
|
|
|
| ||||||
Subtotal |
|
|
|
|
|
|
|
| $ | 126,737,719 |
|
|
| ||||
|
|
|
|
|
|
|
|
|
|
|
|
| |||||
____________________ | |
1 | The Company entered into a fixed rate swap agreement, which is designated as a hedge against the Unsecured Credit Facility and Term Loan. |
|
|
2 | At March 31, 2009, one-month LIBOR was 0.50%. |
|
|
3 | The Company has a preferred return, then a 60% interest. The loan is guaranteed by Kite Realty Group, LP. |
|
|
4 | The Company has a preferred return, then a 50% interest. The loan is guaranteed by Kite Realty Group, LP. |
|
|
5 | The Company has a preferred return, then a 40% interest. The loan is guaranteed by Kite Realty Group, LP. |
|
|
6 | The Company has a 25% interest in this property. The loan is guaranteed by Kite Realty Group, LP. |
|
|
|
|
SCHEDULE OF OUTSTANDING DEBT AS OF MARCH 31, 2009 (CONTINUED)
SEE REFINANCING UPDATE ON PAGE 17
Variable Rate Debt: Construction Loans |
| Lender |
| Interest |
| Maturity Date |
| Total Commitment |
| Balance as of March 31, 2009 | ||
|
|
|
|
| ||||||||
Bridgewater Marketplace2 |
| Indiana Bank And Trust |
| LIBOR + 185 |
| 6/29/10 |
| $ | 12,000,000 |
| $ | 8,228,800 |
Cobblestone Plaza3 |
| Wachovia Bank/Wells Fargo |
| LIBOR + 160 |
| 6/29/09 |
|
| 44,500,000 |
|
| 31,367,247 |
Delray Marketplace3 |
| Wachovia Bank/Wells Fargo |
| LIBOR + 275 |
| 7/3/09 |
|
| 9,425,000 |
|
| 9,425,000 |
Eddy Street Commons |
| Bank of America |
| LIBOR + 230 |
| 12/30/11 |
|
| 29,460,000 |
|
| 6,508,743 |
South Elgin Commons |
| Charter One Bank |
| LIBOR + 190 |
| 9/30/10 |
|
| 11,550,000 |
|
| 7,555,836 |
|
|
|
|
|
|
|
|
|
|
| ||
Subtotal |
|
|
|
|
|
|
| $ | 106,935,000 |
| $ | 63,085,626 |
Corporate Debt |
| Lender |
| Interest |
| Maturity Date |
|
|
| Balance as of March 31, 2009 | ||
|
|
|
|
|
| |||||||
Unsecured Credit Facility4,5 |
| KeyBank (Admin. Agent) |
| LIBOR + 125 |
| 2/20/11 |
|
|
|
| $ | 128,000,000 |
Unsecured Term Loan5 |
| KeyBank (Admin. Agent) |
| LIBOR + 265 |
| 7/15/11 |
|
|
|
|
| 55,000,000 |
|
|
|
|
|
|
|
|
|
|
|
| |
|
|
|
|
|
|
|
|
|
|
|
| 183,000,000 |
Floating Rate Debt (Hedged) |
| Lender |
| Interest |
| Maturity Date |
|
|
|
| Balance as of March 31, 2009 | |
|
|
|
|
|
|
| ||||||
Unsecured Credit Facility5 |
| KeyBank (Admin. Agent) |
| LIBOR + 125 |
| 2/20/11 |
|
|
|
| $ | (50,000,000) |
Unsecured Credit Facility5 |
| KeyBank (Admin. Agent) |
| LIBOR + 125 |
| 2/18/11 |
|
|
|
|
| (25,000,000) |
Unsecured Term Loan5 |
| KeyBank (Admin. Agent) |
| LIBOR + 265 |
| 7/15/11 |
|
|
|
|
| (55,000,000) |
Bayport Commons |
| Bank of America |
| LIBOR + 275 |
| 12/27/11 |
|
|
|
|
| (19,700,000) |
Gateway Shopping Center |
| Charter One Bank |
| LIBOR + 190 |
| 10/31/11 |
|
|
|
|
| (20,000,000) |
Glendale Town Center |
| M&I Bank |
| LIBOR + 275 |
| 12/19/11 |
|
|
|
|
| (20,000,000) |
|
|
|
|
|
|
|
|
|
|
|
| |
Subtotal |
|
|
|
|
|
|
|
|
|
| $ | (189,700,000) |
|
|
|
|
|
|
|
|
|
|
|
| |
TOTAL CONSOLIDATED VARIABLE RATE DEBT |
|
|
|
|
|
|
|
| $ | 183,123,345 | ||
|
|
|
|
|
|
|
|
|
| |||
TOTAL DEBT PER CONSOLIDATED BALANCE SHEET |
|
|
|
|
|
| $ | 704,676,288 | ||||
|
|
|
|
|
|
|
| |||||
____________________ | |
1 | At March 31, 2009, the one-month LIBOR interest rate was 0.50%. |
|
|
2 | The loan has a LIBOR floor of 3.15%. |
|
|
3 | The Company has a preferred return, then a 50% interest. This loan is guaranteed by Kite Realty Group, LP. |
|
|
4 | The Company has 53 unencumbered properties and other assets of which 51 are wholly owned and used as collateral under the unsecured credit facility and two of which are owned in a joint venture. The major unencumbered properties include: Broadstone Station, Coral Springs Plaza, Courthouse Shadows, Eagle Creek Lowes, Eastgate Pavilion, Four Corner Square, Hamilton Crossing, King’s Lake Square, Market Street Village, Naperville Marketplace, PEN Products, Publix at Acworth, Redbank Commons, Shops at Eagle Creek, Traders Point II, Union Station Parking Garage, Wal-Mart Plaza and Waterford Lakes. |
|
|
5 | The Company entered into a fixed rate swap agreement which is designated as a hedge against the unsecured credit facility and term loan. |
|
|
|
|
|
|
SCHEDULE OF OUTSTANDING DEBT AS OF MARCH 31, 2009 (CONTINUED)
SEE REFINANCING UPDATE ON PAGE 17
UNCONSOLIDATED DEBT |
|
|
|
|
|
|
|
|
|
|
|
|
| ||||||||
Fixed Rate Debt |
| Servicer |
| Interest |
| Maturity Date |
|
|
| Balance as of March 31, 2009 |
| Monthly Debt Service as of March 31, 2009 | |||||||||
|
|
|
|
|
|
| |||||||||||||||
The Centre1 |
| Laureate Capital | 6.99 | % |
| 6/1/09 |
|
|
| $ | 3,496,637 |
| $ | 39,897 | |||||||
|
|
|
|
|
|
|
|
|
|
|
|
| |||||||||
Subtotal |
|
|
|
|
|
|
|
| $ | 3,496,637 |
| $ | 39,897 | ||||||||
|
|
|
|
|
|
|
|
|
|
|
|
| |||||||||
Joint Venture Partners’ Share |
|
|
|
|
|
|
|
|
| (1,398,655 | ) |
|
| ||||||||
|
|
|
|
|
|
|
|
|
|
|
|
| |||||||||
KRG SHARE |
|
|
|
|
|
|
| $ | 2,097,982 |
|
|
| |||||||||
|
|
|
|
|
|
|
|
|
|
|
| ||||||||||
|
|
|
|
|
|
|
|
|
|
|
|
|
|
|
| ||||||
|
|
|
|
|
|
|
|
|
|
|
|
| |||||||||
|
|
|
|
|
|
|
|
|
|
|
|
|
| ||||||||
|
|
|
|
|
|
|
|
|
|
|
|
|
|
|
| ||||||
Variable Rate Debt - Construction Loan |
| Lender |
| Interest |
| Maturity Date |
| Total Commitment |
| Balance as of March 31, 2009 |
|
|
| ||||||||
|
|
|
|
|
|
|
| ||||||||||||||
Parkside Town Commons2 |
| Bank of America | LIBOR + 300 |
| 2/8/11 |
| $ | 33,873,000 |
| $ | 33,873,000 |
|
|
| |||||||
Joint Venture Partners’ Share – 60% |
|
|
|
|
|
|
|
|
|
| (20,323,800 | ) |
|
| |||||||
|
|
|
|
|
|
|
|
|
|
|
|
|
| ||||||||
KRG SHARE |
|
|
|
|
|
|
|
|
|
|
| $ | 13,549,200 |
|
|
| |||||
|
|
|
|
|
|
|
|
|
|
|
|
|
|
|
| ||||||
|
|
|
|
|
|
|
|
|
|
|
|
|
| ||||||||
|
|
|
|
|
|
|
|
|
|
|
|
|
| ||||||||
|
|
|
|
|
|
|
|
|
|
|
|
|
|
| |||||||
TOTAL KRG UNCONSOLIDATED DEBT |
|
|
|
|
|
|
|
|
| $ | 15,647,182 |
|
|
| |||||||
TOTAL KRG CONSOLIDATED DEBT |
|
|
|
|
|
|
|
|
|
| 704,676,288 |
|
|
| |||||||
|
|
|
|
|
|
|
|
|
|
|
|
|
| ||||||||
TOTAL KRG DEBT |
|
|
|
|
|
|
|
|
|
|
| $ | 720,323,470 |
|
|
| |||||
|
|
|
|
|
|
|
|
|
|
|
|
|
|
|
| ||||||
____________________ | |
1 | The Company owns a 60% interest in The Centre. |
|
|
2 | The Company owns a 40% interest in Parkside Town Commons. This will change to a 20% ownership at the time of project specific construction financing. |
|
|
3 | At March 31, 2009, the one-month LIBOR interest rate was 0.50%. |
2009 REFINANCING UPDATE AS OF MARCH 31, 2009
Current Maturity Date | Property | Type of Loan |
Current Lender | Balance at March 31, 20091 | Existing Rate | New Maturity Date | Expected Closing | Comments |
|
|
|
|
|
|
|
|
|
2009 Maturities - Consolidated Entities |
|
|
|
|
|
| ||
|
|
|
|
|
|
|
|
|
6/6/09 | Fishers Station | Variable Rate | National City/ PNC | $ 4,163,175 | LIBOR + 150 |
| Q2 2009 | Received commitment letter from lender |
6/29/09 | Cobblestone Plaza | Construction | Wachovia/ Wells | 31,367,247 | LIBOR + 160 |
| Q2 2009 | Received commitment letter from lender |
7/3/09 | Delray Marketplace | Construction | Wachovia/ Wells | 9,425,000 | LIBOR + 275 |
| Q2 2009 | In discussions with lender on a construction loan |
10/11/09 | Ridge Plaza | Secured | Securitized Pool | 15,878,898 | 5.15% |
| Q3 2009 | Plan to negotiate 5 - 7 year loan in mid-2009 or utilize credit line to pay off while increasing total availability |
12/11/09 | Boulevard Crossing
| Secured | Securitized Pool | 11,853,928 | 5.11% |
| Q4 2009 | Plan to negotiate 5 - 7 year loan in mid-2009 or utilize credit line to pay off while increasing total availability |
|
|
|
|
|
|
|
| |
|
|
|
| 72,688,248 |
|
|
|
|
2009 Maturities - Unconsolidated Entities |
|
|
|
|
|
| ||
|
|
|
|
|
|
|
|
|
6/1/09 | The Centre | Secured | Sun Life Assurance | 2,097,982 | 6.99% |
| Q2 2009 | KRG’s share is 60% Negotiating an extension with existing lender |
|
|
|
|
|
|
|
| |
|
|
|
| 2,097,982 |
|
|
|
|
|
|
|
|
|
|
|
| |
|
|
|
|
|
|
|
|
|
| Total Debt Maturing |
|
| $74,786,230 |
|
|
|
|
|
|
|
|
|
|
|
| |
Subsequent Events |
|
|
|
|
|
| ||
|
|
|
|
|
|
|
|
|
Date Closed | Variable Rate Debt Mortgages | Lender |
Interest Rate |
Maturity Date |
| Balance at March 31, 2009 |
|
|
|
|
| ||||||
5/5/09 | Eastgate Pavilion2 | PNC Bank N.A. | LIBOR + 295 | 4/30/2012 |
| $15,400,000 |
| Previously unencumbered asset. Additional one-year extension available based on a 1.35x debt service coverage |
Refinancing Summary |
|
|
|
|
|
| ||
|
|
|
|
|
|
|
|
|
Total Debt Maturing in 2009 |
| $74,786,230 |
|
|
|
| ||
|
|
|
|
|
|
|
|
|
Less: loans for which extension commitments have been received (Fishers Station and Cobblestone Plaza) | (35,530,422) |
|
|
|
| |||
|
|
|
|
| ||||
|
|
|
|
|
|
|
|
|
Remaining 2009 Debt Maturities | $39,255,808 |
|
|
|
| |||
|
|
|
|
| ||||
____________________ | |
1 | Total debt maturing in 2009 excludes scheduled monthly principal payments for the remainder of 2009. |
|
|
2 | The Company intends to use the proceeds from this loan to further reduce near-term maturities. |
JOINT VENTURE SUMMARY – UNCONSOLIDATED PROPERTIES
The Company owns the following two unconsolidated properties with joint venture partners:
Property |
| Percentage Owned by the Company |
| ||
The Centre – Operating Property |
| 60% |
Parkside Town Commons – Development Property1 |
| 40% |
____________________ | |
|
|
1 | The Company’s 40% interest in Parkside Town Commons will change to 20% at the time of project specific construction financing. |
CONDENSED COMBINED BALANCE SHEETS OF UNCONSOLIDATED PROPERTIES
(The Centre and Parkside Town Commons)
(Unaudited)
|
| March 31, |
| December 31, |
| ||
|
|
|
| ||||
Assets: |
|
|
|
|
|
|
|
Investment properties, at cost: |
|
|
|
|
|
|
|
Land |
| $ | 1,310,561 |
| $ | 1,310,561 |
|
Buildings and improvements |
|
| 3,408,709 |
|
| 3,379,153 |
|
Construction in progress |
|
| 58,341,602 |
|
| 57,373,714 |
|
|
|
|
|
|
| ||
|
|
| 63,060,872 |
|
| 62,063,428 |
|
Less: accumulated depreciation |
|
| (1,978,504 | ) |
| (1,952,012 | ) |
|
|
|
|
|
| ||
|
|
| 61,082,368 |
|
| 60,111,416 |
|
Cash and cash equivalents |
|
| 481,336 |
|
| 852,270 |
|
Tenant receivables, including accrued straight-line rent |
|
| 582,446 |
|
| 792,359 |
|
Escrow deposits |
|
| 670,429 |
|
| 29,447 |
|
Deferred costs, net |
|
| 76,798 |
|
| 79,858 |
|
Prepaid and other assets |
|
| — |
|
| 27,163 |
|
|
|
|
|
|
| ||
Total Assets |
| $ | 62,893,377 |
| $ | 61,892,513 |
|
|
|
|
|
|
| ||
|
|
|
|
|
|
|
|
Liabilities and Shareholders’ Equity: |
|
|
|
|
|
|
|
Mortgage and other indebtedness |
| $ | 37,369,637 |
| $ | 58,554,548 |
|
Accounts payable and accrued expenses |
|
| 855,628 |
|
| 1,639,977 |
|
|
|
|
|
|
| ||
Total Liabilities |
|
| 38,225,265 |
|
| 60,194,525 |
|
Accumulated equity |
|
| 24,668,112 |
|
| 1,697,988 |
|
|
|
|
|
|
| ||
Total Liabilities and Accumulated Equity |
| $ | 62,893,377 |
| $ | 61,892,513 |
|
|
|
|
|
|
| ||
____________________ | |
1 | In December 2008, the Company sold its interest in its Spring Mill Medical Center commercial property, which was an unconsolidated entity in a 50% owned joint venture. |
CONDENSED COMBINED STATEMENTS OF OPERATIONS OF UNCONSOLIDATED PROPERTIES
(The Centre and Parkside Town Commons)
(Unaudited)
| Three Months Ended March 31 |
| |||||
|
| ||||||
| 2009 |
|
| 2008 |
| ||
|
|
|
| ||||
|
|
|
|
|
|
|
|
Revenue: |
|
|
|
|
|
|
|
Minimum rent | $ | 226,214 |
|
| $ | 239,634 |
|
Tenant reimbursements |
| 84,681 |
|
|
| 75,690 |
|
Other property related revenue |
| 14,396 |
|
|
| — |
|
|
|
|
|
|
| ||
Total revenue |
| 325,291 |
|
|
| 315,324 |
|
|
|
|
|
|
|
|
|
Expenses: |
|
|
|
|
|
|
|
Property operating |
| 73,562 |
|
|
| 62,965 |
|
Real estate taxes |
| 40,980 |
|
|
| 40,215 |
|
|
|
|
|
|
| ||
Total expenses |
| 114,542 |
|
|
| 103,180 |
|
|
|
|
|
|
| ||
|
|
|
|
|
|
|
|
Operating income |
| 210,749 |
|
|
| 212,144 |
|
Depreciation and amortization and other |
| (33,534 | ) |
|
| (40,594 | ) |
Interest expense |
| (63,045 | ) |
|
| (66,736 | ) |
|
|
|
|
|
| ||
Income from continuing operations |
| 114,170 |
|
|
| 104,814 |
|
Operating income from discontinued operations |
| — |
|
|
| 60,603 |
|
|
|
|
|
|
| ||
Net income | $ | 114,170 |
|
| $ | 165,417 |
|
|
|
|
|
|
| ||
Company’s share of unconsolidated net operating income |
$ | 126,449 |
|
|
$ | 127,286 |
|
|
|
|
|
|
| ||
Company’s share of unconsolidated interest expense |
$ | 37,827 |
|
|
$ | 40,042 |
|
|
|
|
|
|
| ||
| |
|
|
TOP 10 RETAIL TENANTS BY GROSS LEASABLE AREA (GLA)
As of March 31, 2009
This table includes the following:
| • | Operating retail properties; |
| • | Operating commercial properties; and |
| • | Development property tenants open for business or ground lease tenants who commenced paying rent as of March 31, 2009. |
Tenant |
| Number of |
| Total GLA |
| Number of |
| Company |
| Number of Anchor |
| Anchor |
|
|
|
|
|
| |||||||
Lowe's Home Improvement1 |
| 9 |
| 1,247,630 |
| 3 |
| 128,997 |
| 6 |
| 1,118,633 |
Target |
| 6 |
| 665,732 |
| 0 |
| 0 |
| 6 |
| 665,732 |
Wal-Mart |
| 4 |
| 618,161 |
| 1 |
| 103,161 |
| 3 |
| 515,000 |
Publix |
| 6 |
| 289,779 |
| 6 |
| 289,779 |
| 0 |
| 0 |
Federated Department Stores |
| 1 |
| 237,455 |
| 1 |
| 237,455 |
| 0 |
| 0 |
Petsmart |
| 6 |
| 147,069 |
| 6 |
| 147,069 |
| 0 |
| 0 |
Home Depot |
| 1 |
| 140,000 |
| 0 |
| 0 |
| 1 |
| 140,000 |
Bed Bath & Beyond |
| 5 |
| 134,298 |
| 5 |
| 134,298 |
| 0 |
| 0 |
Office Depot |
| 5 |
| 129,099 |
| 5 |
| 129,099 |
| 0 |
| 0 |
Dick's Sporting Goods |
| 2 |
| 126,672 |
| 2 |
| 126,672 |
| 0 |
| 0 |
|
|
|
|
|
|
| ||||||
|
| 45 |
| 3,735,895 |
| 29 |
| 1,296,530 |
| 16 |
| 2,439,365 |
|
|
|
|
|
|
|
____________________ | |
1 | The Company has entered into two ground leases with Lowe’s Home Improvement for a total of 328,000 square feet, which is included in Anchor Owned GLA. |
|
|
2 | Excludes the estimated size of the structures located on land owned by the Company and ground leased to tenants. |
|
|
3 | Includes the estimated size of the structures located on land owned by the Company and ground leased to tenants. |
|
|
|
|
TOP 25 TENANTS BY ANNUALIZED BASE RENT1,2
As of March 31, 2009
This table includes the following:
| • | Operating retail properties; |
| • | Operating commercial properties; and |
| • | Development property tenants open for business or ground lease tenants who commenced paying rent as of March 31, 2009. |
Tenant |
| Type of |
| Number of |
| Leased GLA/NRA4 |
| % of Owned |
| Annualized |
| Annualized |
| % of Total | ||
|
|
|
|
|
|
| ||||||||||
Lowe's Home Improvement |
| Retail |
| 3 |
| 128,997 |
| 2.3% |
| $ | 2,564,000 |
| $ | 5.61 |
| 3.6% |
Publix |
| Retail |
| 6 |
| 289,779 |
| 5.1% |
|
| 2,366,871 |
|
| 8.17 |
| 3.3% |
Petsmart |
| Retail |
| 6 |
| 147,069 |
| 2.6% |
|
| 2,045,138 |
|
| 13.91 |
| 2.9% |
State of Indiana |
| Commercial |
| 3 |
| 210,393 |
| 3.7% |
|
| 1,635,911 |
|
| 7.78 |
| 2.3% |
Marsh Supermarkets |
| Retail |
| 2 |
| 124,902 |
| 2.2% |
|
| 1,633,958 |
|
| 13.08 |
| 2.3% |
Bed Bath & Beyond |
| Retail |
| 5 |
| 134,298 |
| 2.4% |
|
| 1,581,884 |
|
| 11.78 |
| 2.2% |
Office Depot |
| Retail |
| 5 |
| 129,099 |
| 2.3% |
|
| 1,353,866 |
|
| 10.49 |
| 1.9% |
Indiana Supreme Court |
| Commercial |
| 1 |
| 75,488 |
| 1.3% |
|
| 1,339,164 |
|
| 17.74 |
| 1.9% |
Staples |
| Retail |
| 4 |
| 89,797 |
| 1.6% |
|
| 1,220,849 |
|
| 13.60 |
| 1.7% |
Dick's Sporting Goods |
| Retail |
| 2 |
| 126,672 |
| 2.2% |
|
| 1,220,004 |
|
| 9.63 |
| 1.7% |
Ross Stores |
| Retail |
| 4 |
| 117,761 |
| 2.1% |
|
| 1,210,784 |
|
| 10.28 |
| 1.7% |
HEB Grocery Company |
| Retail |
| 1 |
| 105,000 |
| 1.9% |
|
| 1,155,000 |
|
| 11.00 |
| 1.6% |
Best Buy |
| Retail |
| 2 |
| 75,045 |
| 1.3% |
|
| 934,493 |
|
| 12.45 |
| 1.3% |
Kmart |
| Retail |
| 1 |
| 110,875 |
| 2.0% |
|
| 850,379 |
|
| 7.67 |
| 1.2% |
Michaels |
| Retail |
| 3 |
| 68,989 |
| 1.2% |
|
| 823,544 |
|
| 11.94 |
| 1.2% |
TJX Companies |
| Retail |
| 3 |
| 88,550 |
| 1.6% |
|
| 818,313 |
|
| 9.24 |
| 1.2% |
Kerasotes Theaters 3 |
| Retail |
| 2 |
| 43,050 |
| 0.8% |
|
| 776,496 |
|
| 8.92 |
| 1.1% |
Dominick's |
| Retail |
| 1 |
| 65,977 |
| 1.2% |
|
| 775,230 |
|
| 11.75 |
| 1.1% |
City Securities Corporation |
| Commercial |
| 1 |
| 38,810 |
| 0.7% |
|
| 771,155 |
|
| 19.87 |
| 1.1% |
A & P Grocery |
| Retail |
| 1 |
| 58,732 |
| 1.0% |
|
| 763,516 |
|
| 13.00 |
| 1.1% |
Old Navy |
| Retail |
| 3 |
| 64,868 |
| 1.1% |
|
| 748,693 |
|
| 11.54 |
| 1.1% |
Petco |
| Retail |
| 3 |
| 40,778 |
| 0.7% |
|
| 595,945 |
|
| 14.61 |
| 0.8% |
Beall's |
| Retail |
| 2 |
| 79,611 |
| 1.4% |
|
| 576,000 |
|
| 7.24 |
| 0.8% |
Burlington Coat Factory |
| Retail |
| 1 |
| 107,400 |
| 1.9% |
|
| 510,150 |
|
| 4.75 |
| 0.7% |
Office Max |
| Retail |
| 2 |
| 47,000 |
| 0.8% |
|
| 505,250 |
|
| 10.75 |
| 0.7% |
|
|
|
|
|
|
|
|
|
|
|
| |||||
TOTAL |
|
|
|
|
| 2,568,940 |
| 45.4% |
| $ | 28,776,592 |
| $ | 9.78 |
| 40.7% |
|
|
|
|
|
|
|
|
|
|
|
| |||||
____________________ | |
1 | Annualized base rent represents the monthly contractual rent for March 2009 for each applicable tenant multiplied by 12. |
|
|
2 | Excludes tenants at development properties that are designated as Build-to-Suits for sale. |
|
|
3 | Annualized Base Rent per square foot is adjusted to account for the estimated square footage attributed to structures on land owned by the Company and ground leased to tenants. |
|
|
4 | Excludes the estimated size of the structures located on land owned by the Company and ground leased to tenants. |
|
|
|
|
|
|
|
|
LEASE EXPIRATIONS – OPERATING PORTFOLIO1
As of March 31, 2009
This table includes the following:
| • | Operating retail properties; |
| • | Operating commercial properties; and |
| • | Development property tenants open for business or ground lease tenants who commenced paying rent as of March 31, 2009. |
|
| Number of Expiring Leases1,2 |
| Expiring GLA/NRA3 |
| % of Total GLA/NRA Expiring |
| Expiring Annualized Base Rent4 |
| % of Total Annualized Base Rent |
| Expiring Annualized Base Rent per Sq. Ft. |
| Expiring Ground Lease Revenue | |||
|
|
|
|
|
|
|
| ||||||||||
2009 |
| 67 |
| 220,325 |
| 4.2% |
| $ | 3,333,857 |
| 4.9% |
| $ | 15.13 |
| $ | 800,000 |
2010 |
| 87 |
| 514,575 |
| 9.8% |
|
| 6,591,240 |
| 9.8% |
|
| 12.81 |
|
| 0 |
2011 |
| 98 |
| 661,812 |
| 12.7% |
|
| 6,680,891 |
| 9.9% |
|
| 10.09 |
|
| 0 |
2012 |
| 107 |
| 451,722 |
| 8.6% |
|
| 7,372,167 |
| 10.9% |
|
| 16.32 |
|
| 0 |
2013 |
| 72 |
| 507,740 |
| 9.7% |
|
| 6,058,876 |
| 9.0% |
|
| 11.93 |
|
| 0 |
2014 |
| 60 |
| 533,307 |
| 10.2% |
|
| 6,638,016 |
| 9.8% |
|
| 12.45 |
|
| 427,900 |
2015 |
| 38 |
| 493,364 |
| 9.4% |
|
| 6,198,331 |
| 9.2% |
|
| 12.56 |
|
| 181,504 |
2016 |
| 26 |
| 234,371 |
| 4.5% |
|
| 3,001,980 |
| 4.5% |
|
| 12.81 |
|
| 0 |
2017 |
| 26 |
| 396,288 |
| 7.6% |
|
| 5,726,600 |
| 8.5% |
|
| 14.45 |
|
| 435,296 |
2018 |
| 23 |
| 346,966 |
| 6.6% |
|
| 4,628,518 |
| 6.9% |
|
| 13.34 |
|
| 128,820 |
Beyond |
| 29 |
| 869,254 |
| 16.6% |
|
| 11,273,275 |
| 16.7% |
|
| 12.97 |
|
| 2,073,505 |
|
|
|
|
|
|
|
|
|
|
| |||||||
|
| 633 |
| 5,229,724 |
| 100.0% |
| $ | 67,503,751 |
| 100.0% |
| $ | 12.91 |
| $ | 4,047,025 |
|
|
|
|
|
|
|
|
|
|
| |||||||
____________________ | |
1 | Excludes tenants at development properties that are designated as Build-to-Suits for sale. |
|
|
2 | Lease expiration table reflects rents in place as of March 31, 2009, and does not include option periods; 2009 expirations include 20 month-to-month tenants. This column also excludes ground leases. |
|
|
3 | Expiring GLA excludes estimated square footage attributable to non-owned structures on land owned by the Company and ground leased to tenants. |
|
|
4 | Annualized base rent represents the monthly contractual rent for March 2009 for each applicable tenant multiplied by 12. Excludes ground lease revenue. |
|
|
|
|
LEASE EXPIRATIONS – RETAIL ANCHOR TENANTS1
As of March 31, 2009
This table includes the following:
| • | Operating retail properties; and |
| • | Development property tenants open for business or ground lease tenants who commenced paying rent as of March 31, 2009. |
|
| Number of Expiring Leases1,2 |
| Expiring GLA/NRA3 |
| % of Total GLA/NRA Expiring |
| Expiring Annualized Base Rent4 |
| % of Total Annualized Base Rent |
| Expiring Annualized Base Rent per Sq. Ft. |
| Expiring Ground Lease Revenue | |||
|
|
|
|
|
|
|
| ||||||||||
2009 |
| 3 |
| 67,022 |
| 1.3% |
| $ | 567,270 |
| 0.8% |
| $ | 8.46 |
| $ | 800,000 |
2010 |
| 14 |
| 332,886 |
| 6.4% |
|
| 3,185,500 |
| 4.7% |
|
| 9.57 |
|
| 0 |
2011 |
| 7 |
| 433,404 |
| 8.3% |
|
| 2,185,747 |
| 3.2% |
|
| 5.04 |
|
| 0 |
2012 |
| 8 |
| 179,471 |
| 3.4% |
|
| 1,678,862 |
| 2.5% |
|
| 9.35 |
|
| 0 |
2013 |
| 3 |
| 222,521 |
| 4.3% |
|
| 993,053 |
| 1.5% |
|
| 4.46 |
|
| 0 |
2014 |
| 10 |
| 247,834 |
| 4.7% |
|
| 2,503,717 |
| 3.7% |
|
| 10.10 |
|
| 0 |
2015 |
| 11 |
| 377,371 |
| 7.2% |
|
| 3,585,414 |
| 5.3% |
|
| 9.50 |
|
| 0 |
2016 |
| 5 |
| 153,782 |
| 2.9% |
|
| 1,318,562 |
| 2.0% |
|
| 8.57 |
|
| 0 |
2017 |
| 11 |
| 277,102 |
| 5.3% |
|
| 3,383,722 |
| 5.0% |
|
| 12.21 |
|
| 0 |
2018 |
| 9 |
| 310,576 |
| 5.9% |
|
| 3,700,624 |
| 5.5% |
|
| 11.92 |
|
| 0 |
Beyond |
| 20 |
| 825,681 |
| 15.8% |
|
| 10,288,506 |
| 15.2% |
|
| 12.46 |
|
| 990,000 |
|
|
|
|
|
|
|
|
|
|
| |||||||
|
| 101 |
| 3,427,650 |
| 65.6% |
| $ | 33,390,978 |
| 49.5% |
| $ | 9.74 |
| $ | 1,790,000 |
|
|
|
|
|
|
|
|
|
|
| |||||||
____________________ | |
1 | Retail anchor tenants are defined as tenants that occupy 10,000 square feet or more. Excludes tenants at development properties that are designated as Build-to-Suits for sale. |
|
|
2 | Lease expiration table reflects rents in place as of March 31, 2009, and does not include option periods; 2009 expirations include one month-to-month tenant. This column also excludes ground leases. |
|
|
3 | Expiring GLA excludes square footage for non-owned ground lease structures on land we own and ground leased to tenants. |
|
|
4 | Annualized base rent represents the monthly contractual rent for March 2009 for each applicable property multiplied by 12. Excludes ground lease revenue. |
LEASE EXPIRATIONS – RETAIL SHOPS
As of March 31, 2009
This table includes the following:
| • | Operating retail properties; and |
| • | Development property tenants open for business as of March 31, 2009. |
|
| Number of Expiring Leases1 |
| Expiring GLA/NRA1,2 |
| % of Total GLA/NRA Expiring |
| Expiring Annualized Base Rent3 |
| % of Total Annualized Base Rent |
| Expiring Annualized Base Rent per Sq. Ft. |
| Expiring Ground Lease Revenue | |||
|
|
|
|
|
|
|
| ||||||||||
2009 |
| 63 |
| 143,271 |
| 2.7% |
| $ | 2,656,595 |
| 3.9% |
| $ | 18.54 |
| $ | 0 |
2010 |
| 70 |
| 169,349 |
| 3.2% |
|
| 3,178,464 |
| 4.7% |
|
| 18.77 |
|
| 0 |
2011 |
| 90 |
| 211,370 |
| 4.0% |
|
| 4,205,488 |
| 6.2% |
|
| 19.90 |
|
| 0 |
2012 |
| 97 |
| 235,199 |
| 4.5% |
|
| 5,097,839 |
| 7.6% |
|
| 21.67 |
|
| 0 |
2013 |
| 65 |
| 151,180 |
| 2.9% |
|
| 3,441,952 |
| 5.1% |
|
| 22.77 |
|
| 0 |
2014 |
| 48 |
| 131,663 |
| 2.5% |
|
| 2,723,744 |
| 4.0% |
|
| 20.69 |
|
| 427,900 |
2015 |
| 26 |
| 75,300 |
| 1.4% |
|
| 1,721,976 |
| 2.6% |
|
| 22.87 |
|
| 181,504 |
2016 |
| 21 |
| 80,589 |
| 1.5% |
|
| 1,683,418 |
| 2.5% |
|
| 20.89 |
|
| 0 |
2017 |
| 14 |
| 43,698 |
| 0.8% |
|
| 1,003,714 |
| 1.5% |
|
| 22.97 |
|
| 435,296 |
2018 |
| 14 |
| 36,390 |
| 0.7% |
|
| 927,894 |
| 1.4% |
|
| 25.50 |
|
| 128,820 |
Beyond |
| 9 |
| 43,573 |
| 0.8% |
|
| 984,769 |
| 1.5% |
|
| 22.60 |
|
| 1,083,505 |
|
|
|
|
|
|
|
|
|
|
| |||||||
|
| 517 |
| 1,321,582 |
| 25.3% |
| $ | 27,625,853 |
| 40.9% |
| $ | 20.90 |
| $ | 2,257,025 |
|
|
|
|
|
|
|
|
|
|
| |||||||
____________________ | |
1 | Lease expiration table reflects rents in place as of March 31, 2009, and does not include option periods; 2009 expirations include 19 month-to-month tenants. This column also excludes ground leases. |
|
|
2 | Expiring GLA excludes estimated square footage to non-owned structures on land we own and ground leased to tenants. |
|
|
3 | Annualized base rent represents the monthly contractual rent for March 2009 for each applicable property multiplied by 12. Excludes ground lease revenue. |
LEASE EXPIRATIONS – COMMERCIAL TENANTS
As of March 31, 2009
|
| Number of Expiring Leases1 |
| Expiring NLA1 |
| % of Total NRA Expiring |
| Expiring Annualized Base Rent2 |
| % of Total Annualized Base Rent |
| Expiring Annualized Base Rent per Sq. Ft. | ||
|
|
|
|
|
|
| ||||||||
2009 |
| 1 |
| 10,032 |
| 0.2% |
| $ | 109,992 |
| 0.2% |
| $ | 10.96 |
2010 |
| 3 |
| 12,340 |
| 0.2% |
|
| 227,276 |
| 0.3% |
|
| 18.42 |
2011 |
| 1 |
| 17,038 |
| 0.3% |
|
| 289,656 |
| 0.4% |
|
| 17.00 |
2012 |
| 2 |
| 37,052 |
| 0.7% |
|
| 595,467 |
| 0.9% |
|
| 16.07 |
2013 |
| 4 |
| 134,039 |
| 2.6% |
|
| 1,623,871 |
| 2.4% |
|
| 12.11 |
2014 |
| 2 |
| 153,810 |
| 2.9% |
|
| 1,410,555 |
| 2.1% |
|
| 9.17 |
2015 |
| 1 |
| 40,693 |
| 0.8% |
|
| 890,942 |
| 1.3% |
|
| 21.89 |
2016 |
| 0 |
| 0 |
| 0.0% |
|
| 0 |
| 0.0% |
|
| 0.00 |
2017 |
| 1 |
| 75,488 |
| 1.4% |
|
| 1,339,164 |
| 2.0% |
|
| 17.74 |
2018 |
| 0 |
| 0 |
| 0.0% |
|
| 0 |
| 0.0% |
|
| 0.00 |
Beyond |
| 0 |
| 0 |
| 0.0% |
|
| 0 |
| 0.0% |
|
| 0.00 |
|
|
|
|
|
|
|
|
| ||||||
|
| 15 |
| 480,492 |
| 9.2% |
| $ | 6,486,922 |
| 9.6% |
| $ | 13.50 |
|
|
|
|
|
|
|
|
| ||||||
____________________ | |
1 | Lease expiration table reflects rents in place as of March 31, 2009, and does not include option periods. This column also excludes ground leases. |
|
|
2 | Annualized base rent represents the monthly contractual rent for March 2009 for each applicable property multiplied by 12. |
|
|
|
|
SUMMARY RETAIL PORTFOLIO STATISTICS INCLUDING JOINT VENTURE PROPERTIES
| March 31, 2009 |
| December 31, 2008 |
| September 30, 2008 |
| June 30, 2008 |
| March 31, 2008 |
| December 31, 2007 |
|
|
|
|
|
| ||||||
Company Owned GLA – Operating Retail1 | 4,944,570 |
| 4,958,838 |
| 5,059,842 |
| 4,669,276 |
| 4,842,214 |
| 4,732,924 |
Total GLA – Operating Retail1 | 7,998,523 |
| 8,372,791 |
| 8,479,344 |
| 7,448,227 |
| 7,613,265 |
| 7,392,845 |
Projected Company Owned GLA Under Development or Redevelopment2 | 902,353 |
| 888,085 |
| 948,245 |
| 1,308,760 |
| 1,146,127 |
| 990,376 |
Projected Total GLA Under Development or Redevelopment2 | 1,207,996 |
| 1,193,728 |
| 1,253,888 |
| 2,349,865 |
| 2,152,027 |
| 1,791,096 |
Number of Operating Retail Properties | 51 |
| 52 |
| 52 |
| 51 |
| 52 |
| 50 |
Number of Retail Properties Under Development or Redevelopment | 9 |
| 8 |
| 10 |
| 11 |
| 10 |
| 11 |
Percentage Leased – Operating Retail | 90.2% |
| 91.2% |
| 91.9% |
| 93.0% |
| 92.8% |
| 94.8% |
Annualized Base Rent & Ground Lease Revenue – Retail Properties3 | $61,101,120 |
| $61,987,904 |
| $63,719,164 |
| $60,689,289 |
| $61,766,441 |
| $61,768,402 |
____________________ | |
1 | Company Owned GLA represents gross leasable area owned by the Company. Total GLA includes Company Owned GLA, plus square footage attributable to non-owned outlot structures on land owned by the Company and ground leased to tenants, and non-owned anchor space. |
|
|
2 | Projected Company Owned GLA Under Development or Redevelopment represents gross leasable area under development that is projected to be owned by the Company. Projected Total GLA Under Development or Redevelopment includes Projected Company Owned GLA, plus projected square footage attributable to non-owned outlot structures on land owned by the Company and ground leased to tenants, and non-owned anchor space that is existing or under construction. |
|
|
3 | Annualized Base Rent represents the monthly contractual rent for March 2009, multiplied by 12. |
SUMMARY COMMERCIAL PORTFOLIO STATISTICS
Retail Portfolio | March 31, 2009 |
| December 31, 2008 |
| September 30, 2008 |
| June 30, 2008 |
| March 31, 2008 |
| December 31, 2007 |
|
|
|
|
|
| ||||||
Company Owned Net Rentable Area (NRA)1 | 499,221 |
| 499,221 |
| 562,652 |
| 562,652 |
| 562,652 |
| 562,652 |
Number of Operating Commercial Properties | 4 |
| 4 |
| 5 |
| 5 |
| 5 |
| 5 |
Percentage Leased – Operating Commercial Properties | 97.2% |
| 96.5% |
| 97.8% |
| 97.8% |
| 98.4% |
| 93.0% |
Annualized Base Rent – Commercial Properties2,3 | $6,486,922 |
| $6,437,195 |
| $7,970,942 |
| $7,906,781 |
| $8,073,623 |
| $7,625,342 |
____________________ | |
1 | Company Owned NRA does not include square footage of Union Station Parking Garage, a detached parking garage supporting the 30 South property that includes approximately 850 parking spaces. It is managed by Denison Parking, a third party. |
|
|
2 | Annualized Base Rent does not include income attributable to the Union Station Parking Garage. |
|
|
3 | Annualized Base Rent includes $890,942 from KRG and subsidiaries as of March 31, 2009. |
CURRENT DEVELOPMENT PIPELINE
Current Development Projects |
| Company Ownership %6 |
| MSA |
| Actual/ Projected Opening |
| Projected |
| Projected |
| Percent |
| Percent |
| Total |
| Cost |
| Major Tenants and Non-owned Anchors | |||
|
|
|
|
|
|
|
|
|
| ||||||||||||||
Cobblestone Plaza, FL |
| 50% |
| Ft. Lauderdale |
| Q2 2009 |
| 157,957 |
| 163,600 |
| 0.0% |
| 78.5% |
| $ | 47,000 |
| $ | 38,525 |
| Whole Foods Market9, Staples, Party City | |
South Elgin Commons, IL – I |
| 100% |
| Chicago |
| Q2 2009 |
| 45,000 |
| 45,000 |
| 0.0% |
| 100.0% |
|
| 9,200 |
|
| 7,700 |
| LA Fitness | |
Eddy Street Commons, IN – I8 |
| 100% |
| South Bend |
| Q4 2009 |
| 165,000 |
| 465,000 |
| 0.0% |
| 64.1% |
|
| 35,000 |
|
| 14,098 |
| Follett Bookstore, Other Retail, Office | |
|
|
|
|
|
|
|
|
|
|
|
|
|
|
|
|
| |||||||
Total Current Development Projects |
|
|
| 367,957 |
| 673,600 |
| 0.0% |
| 74.7% |
| $ | 91,200 |
| $ | 60,323 |
|
| |||||
|
|
|
|
|
|
|
|
|
|
|
|
| |||||||||||
|
|
|
|
|
|
|
|
|
|
|
|
|
|
|
|
|
| ||||||
____________________ | |
1 | Opening Date is defined as the first date a tenant is open for business or a ground lease payment is made. Stabilization (i.e., 85% occupied) typically occurs within six to twelve months after the opening date. |
2 | Projected Owned GLA represents gross leasable area we project we will own. It excludes square footage that we project will be attributable to non-owned outlot structures on land owned by us and expected to be ground leased to tenants. It also excludes non-owned anchor space. |
3 | Projected Total GLA includes Projected Owned GLA, projected square footage attributable to non-owned outlot structures on land that we own, and non-owned anchor space that currently exists or is under construction. |
4 | Dollars in thousands. Reflects both the Company’s and partners’ share of costs, except Eddy Street Commons (see Note 8). |
5 | Excludes outlot land parcels owned by the Company and ground leased to tenants. Includes leases under negotiation for approximately 10,932 square feet for which the Company has signed non-binding letters of intent. |
6 | The Company owns Cobblestone Plaza through a joint venture. |
7 | Includes tenants that have taken possession of their space or have begun paying rent. |
8 | The Company is the master developer for this project. The total estimated cost of Phase I is approximately $70 million; however, the Company’s share of Phase I estimated project cost is approximately $35 million and 165,000 square feet. The remaining $35 million of the project cost is attributable to the apartments which will be funded by a third party. |
9 | This tenant is pursuing a termination of its lease. The Company is in discussions with several replacement tenants. |
CURRENT REDEVELOPMENT PROJECTS
Redevelopment Projects4 |
| MSA |
| Existing Owned GLA |
| Projected |
| Projected |
| Total |
| Cost |
| Major Tenants and Non-owned Anchors | ||
|
|
|
|
|
|
| ||||||||||
Rivers Edge, IN |
| Indianapolis |
| 110,875 |
| 110,875 |
| 110,875 |
| $ | 2,500 |
| $ | 23 |
| Pending |
Bolton Plaza, FL |
| Jacksonville |
| 172,938 |
| 172,938 |
| 172,938 |
|
| 2,000 |
|
| 274 |
| Pending |
Courthouse Shadows, FL |
| Naples |
| 134,867 |
| 134,867 |
| 134,867 |
|
| 2,500 |
|
| 279 |
| Publix, Office Max |
Four Corner Square, WA |
| Seattle |
| 29,177 |
| 29,177 |
| 29,177 |
|
| 500 |
|
| 25 |
| Johnson Hardware Store, Walgreens |
Coral Springs Plaza, FL |
| Boca Raton |
| 45,906 |
| 45,906 |
| 45,906 |
|
| 4,000 |
|
| – |
| Pending |
Galleria Plaza, TX |
| Dallas |
| 44,306 |
| 44,306 |
| 44,306 |
|
| 400 |
|
| – |
| Pending |
|
|
|
|
|
|
|
|
|
|
|
| |||||
Total Redevelopment Projects | 538,069 |
| 538,069 |
| 538,069 |
| $ | 11,900 |
| $ | 601 |
|
| |||
|
|
|
|
|
|
|
|
| ||||||||
____________________ | |
1 | Projected Owned GLA represents gross leasable area we project we will own. It excludes square footage that we project will be attributable to non-owned outlot structures on land owned by us and expected to be ground leased to tenants. It also excludes non-owned anchor space. |
2 | Projected Total GLA includes Projected Owned GLA, projected square footage attributable to non-owned outlot structures on land that we own, and non-owned anchor space that currently exists or is under construction. |
3 | Dollars in thousands. Reflects both the Company’s and partners’ share of costs. |
4 | Redevelopment properties have been removed from the operating portfolio statistics. |
|
|
��
VISIBLE SHADOW PIPELINE
Project |
| MSA |
| KRG Ownership %2 |
| Estimated Start Date |
| Estimated Total GLA1 |
| Total Estimated Project Cost1,5 |
| Cost Incurred as of March 31, 20095 |
| Potential Tenancy | ||
|
|
|
|
|
|
| ||||||||||
Unconsolidated –
|
|
|
|
|
|
|
|
|
|
|
|
|
|
|
|
|
Parkside Town Commons, NC3 |
| Raleigh |
| 40% |
| TBD |
| 1,500,000 |
| $ | 148,000 |
| $ | 58,441 |
| Frank Theatres, Discount Department Store, Jr. Boxes, Restaurants |
|
|
|
|
|
|
|
|
|
|
|
|
|
|
| ||
KRG current share of unconsolidated project3 |
|
|
|
|
|
|
| $ | 29,600 |
| $ | 23,376 |
|
| ||
|
|
|
|
|
|
|
|
|
|
|
|
| ||||
Consolidated – |
|
|
|
|
|
|
|
|
|
|
|
|
|
|
|
|
Delray Marketplace, FL |
| Delray Beach |
| 50% |
| TBD |
| 296,000 |
| $ | 90,000 |
| $ | 42,121 |
| Publix, Frank Theatres, Jr. Boxes, Shops, Restaurants |
Maple Valley, WA6 |
| Seattle |
| 100% |
| TBD |
| 127,000 |
|
| 9,600 |
|
| 9,522 |
| Hardware Store, Shops, Drug Store |
Broadstone Station, NC6 |
| Raleigh |
| 100% |
| TBD |
| 345,000 |
|
| 19,100 |
|
| 10,571 |
| Super Wal-Mart (non-owned), Shops, Pad Sales, Jr. Boxes |
South Elgin Commons, IL - II6 |
| Chicago |
| 100% |
| TBD |
| 263,000 |
|
| 6,100 |
|
| 5,117 |
| Jr. Boxes, Super Target (non-owned) |
New Hill Place, NC - I6 |
| Raleigh |
| 100% |
| TBD |
| 310,000 |
|
| 30,000 |
|
| 11,903 |
| Target, Frank Theatres |
|
|
|
|
|
|
|
|
|
|
|
|
|
| |||
Total Consolidated |
|
|
| 1,341,000 |
| $ | 154,800 |
| $ | 79,234 |
|
| ||||
|
|
|
|
|
|
|
|
|
| |||||||
____________________ | |
1 | Total Estimated Project Cost and Estimated Total GLA based on preliminary site plans and includes non-owned anchor space that exists or is currently under construction. |
|
|
2 | The Company owns Delray Marketplace through a joint venture (preferred return, then 50%). |
|
|
3 | Parkside Town Commons is owned through a joint venture with Prudential Real Estate Investors. The Company’s interest in this joint venture is 40% as of March 31, 2009 and will be reduced to 20% at the time of project specific construction financing. |
|
|
4 | “Total Estimated Project Cost” includes a portion of the acquisition cost of the Four Corner Square shopping center which is a component of the Maple Valley redevelopment. |
|
|
5 | Dollars in thousands. Reflects both the Company’s and partners’ share of costs. |
|
|
6 | The Company has reduced capital expenditures in the visible shadow pipeline by approximately $110 million by focusing on ground leasing or selling to end users as well as modifying the scope of the development projects. |
GEOGRAPHIC DIVERSIFICATION – OPERATING PORTFOLIO
As of March 31, 2009
|
| Number of Operating Properties1 |
| Owned GLA/NRA2 |
| Percent of Owned GLA/NRA |
| Total |
| Annualized |
| Percent of |
| Annualized | ||
|
|
|
|
|
|
|
| |||||||||
Indiana |
| 24 |
| 2,182,551 |
| 40.3% |
| 230 |
| $ | 25,329,876 |
| 39.9% |
| $ | 12.56 |
• Retail |
| 20 |
| 1,683,330 |
| 30.9% |
| 215 |
|
| 18,842,954 |
| 29.7% |
|
| 12.26 |
• Commercial |
| 4 |
| 499,221 |
| 9.2% |
| 15 |
|
| 6,486,922 |
| 10.2% |
|
| 13.50 |
Florida |
| 12 |
| 1,169,119 |
| 21.5% |
| 159 |
|
| 13,709,985 |
| 21.6% |
|
| 12.92 |
Texas |
| 7 |
| 1,099,480 |
| 20.2% |
| 79 |
|
| 11,444,130 |
| 18.0% |
|
| 11.62 |
Georgia |
| 3 |
| 300,115 |
| 5.5% |
| 59 |
|
| 4,129,243 |
| 6.5% |
|
| 14.71 |
Washington |
| 3 |
| 128,001 |
| 2.4% |
| 17 |
|
| 2,401,452 |
| 3.8% |
|
| 22.94 |
Ohio |
| 1 |
| 236,230 |
| 4.3% |
| 7 |
|
| 2,366,522 |
| 3.7% |
|
| 10.02 |
Illinois |
| 2 |
| 182,362 |
| 3.4% |
| 17 |
|
| 2,097,053 |
| 3.3% |
|
| 13.39 |
New Jersey |
| 1 |
| 115,088 |
| 2.1% |
| 14 |
|
| 1,596,541 |
| 2.5% |
|
| 16.27 |
Oregon |
| 2 |
| 30,845 |
| 0.6% |
| 11 |
|
| 466,215 |
| 0.7% |
|
| 23.19 |
|
|
|
|
|
|
|
|
|
| |||||||
|
| 55 |
| 5,443,791 |
| 100.0% |
| 593 |
| $ | 63,541,017 |
| 100.0% |
| $ | 12.81 |
|
|
|
|
|
|
|
|
|
| |||||||
____________________ | |
1 | This table includes operating retail properties, operating commercial properties, and ground lease tenants who commenced paying rent as of March 31, 2009. |
|
|
2 | Owned GLA/NRA represents gross leasable area or net leasable area owned by the Company. It does not include 22 parcels or outlots owned by the Company and ground leased to tenants, which contain 22 non-owned structures totaling approximately 477,404 square feet. It also excludes the square footage of Union Station Parking Garage. |
|
|
3 | Annualized Base Rent excludes $4,047,025 in annualized ground lease revenue attributable to parcels and outlots owned by the Company and ground leased to tenants. |
|
|
|
|
|
|
OPERATING RETAIL PROPERTIES – TABLE I
As of March 31, 2009
Property1,2 | State | MSA | Year Built/Renovated | Year Added to Operating Portfolio | Acquired, Redeveloped, or Developed | Total GLA2 | Owned GLA2 | Percentage of Owned |
Bayport Commons | FL | Oldsmar | 2008 | 2008 | Developed | 268,556 | 94,756 | 90.8% |
Eagle Creek Lowe’s | FL | Naples | 2006 | 2006 | Developed | 165,000 | - | * |
Estero Town Commons | FL | Naples | 2006 | 2007 | Developed | 206,600 | 25,600 | 75.8% |
Indian River Square | FL | Vero Beach | 1997/2004 | 2005 | Acquired | 379,246 | 144,246 | 97.6% |
International Speedway Square | FL | Daytona | 1999 | 1999 | Developed | 233,901 | 220,901 | 81.9% |
King’s Lake Square | FL | Naples | 1986 | 2003 | Acquired | 85,497 | 85,497 | 96.2% |
Pine Ridge Crossing | FL | Naples | 1993 | 2006 | Acquired | 258,874 | 105,515 | 96.4% |
Riverchase Plaza | FL | Naples | 1991/2001 | 2006 | Acquired | 78,340 | 78,340 | 100.0% |
Shops at Eagle Creek | FL | Naples | 1983 | 2003 | Developed | 75,944 | 75,944 | 57.4% |
Tarpon Springs Plaza | FL | Naples | 2007 | 2007 | Developed | 276,346 | 82,546 | 98.5% |
Wal-Mart Plaza | FL | Gainesville | 1970 | 2004 | Acquired | 177,826 | 177,826 | 98.0% |
Waterford Lakes Village | FL | Orlando | 1997 | 2004 | Acquired | 77,948 | 77,948 | 92.6% |
Kedron Village | GA | Atlanta | 2006 | 2006 | Developed | 282,125 | 157,408 | 88.6% |
Publix at Acworth | GA | Atlanta | 1996 | 2004 | Acquired | 69,628 | 69,628 | 98.0% |
The Centre at Panola | GA | Atlanta | 2001 | 2004 | Acquired | 73,079 | 73,079 | 100.0% |
Fox Lake Crossing | IL | Chicago | 2002 | 2005 | Acquired | 99,072 | 99,072 | 84.7% |
Naperville Marketplace | IL | Chicago | 2008 | 2008 | Developed | 169,600 | 83,290 | 87.3% |
50 South Morton | IN | Indianapolis | 1999 | 1999 | Developed | 2,000 | 2,000 | 100.0% |
54th & College | IN | Indianapolis | 2008 | 2008 | Developed | 20,100 | - | * |
Beacon Hill8 | IN | Crown Point | 2006 | 2007 | Developed | 127,821 | 57,321 | 60.4% |
Boulevard Crossing | IN | Kokomo | 2004 | 2004 | Developed | 213,696 | 123,696 | 96.3% |
Bridgewater Marketplace | IN | Westfield | 2008 | 2008 | Developed | 50,820 | 26,000 | 36.0% |
Cool Creek Commons | IN | Indianapolis | 2005 | 2005 | Developed | 137,107 | 124,578 | 100.0% |
Fishers Station4 | IN | Indianapolis | 1989 | 2004 | Acquired | 114,457 | 114,457 | 79.5% |
Geist Pavilion | IN | Indianapolis | 2006 | 2006 | Developed | 64,114 | 64,114 | 83.6% |
Glendale Town Center | IN | Indianapolis | 1958/2008 | 2008 | Redeveloped | 685,827 | 403,327 | 92.4% |
Greyhound Commons | IN | Indianapolis | 2005 | 2005 | Developed | 153,187 | - | * |
Hamilton Crossing Centre | IN | Indianapolis | 1999 | 2004 | Acquired | 87,424 | 82,424 | 95.8% |
Martinsville Shops | IN | Martinsville | 2005 | 2005 | Developed | 10,986 | 10,986 | 100.0% |
Red Bank Commons | IN | Evansville | 2005 | 2006 | Developed | 324,308 | 34,308 | 69.8% |
Stoney Creek Commons | IN | Indianapolis | 2000 | 2000 | Developed | 189,527 | 49,330 | 100.0% |
The Centre5 | IN | Indianapolis | 1986 | 1986 | Developed | 80,689 | 80,689 | 96.5% |
The Corner | IN | Indianapolis | 1984/2003 | 1984 | Developed | 42,545 | 42,545 | 96.4% |
____________________ | |
* | Property consists of ground leases only and, therefore, no Owned GLA. As of March 31, 2009, the following were leased: Eagle Creek Lowe’s and 54th & College – single ground lease property; Greyhound Commons – two of four outlots leased. |
|
|
1 | All properties are wholly owned, except as indicated. Unless otherwise noted, each property is owned in fee simple by the Company. |
|
|
2 | Owned GLA represents gross leasable area that is owned by the Company. Total GLA includes Owned GLA, square footage attributable to non-owned anchor space, and non-owned structures on ground leases. |
|
|
3 | Percentage of Owned GLA Leased reflects Owned GLA/NRA leased as of March 31, 2009, except for Greyhound Commons, 54th & College, and Eagle Creek Lowe’s (see * ). |
|
|
4 | This property is divided into two parcels: a grocery store and small shops. The Company owns a 25% interest in the small shops parcel through a joint venture and a 100% interest in the grocery store. The joint venture partner is entitled to an annual preferred payment of $96,000. All remaining cash flow is distributed to the Company. |
|
|
5 | The Company owns a 60% interest in this property through a joint venture with a third party that manages the property. |
|
|
6 | The Company does not own the land at this property. It has leased the land pursuant to two ground leases that expire in 2017. The Company has six five-year options to renew this lease. |
|
|
7 | The Company does not own the land at this property. It has leased the land pursuant to a ground lease that expires in 2012. The Company has six five-year renewal options and a right of first refusal to purchase the land. |
|
|
8 | The Company owns and manages the following properties through joint ventures with third parties: Beacon Hill (50%); Cornelius Gateway (80%); and Sandifur Plaza (95%). |
OPERATING RETAIL PROPERTIES – TABLE I (CONTINUED)
Property1,2 | State | MSA | Year | Year Added | Acquired, Redeveloped, | Total GLA2 | Owned GLA2 | Percentage of Owned |
Traders Point | IN | Indianapolis | 2005 | 2005 | Developed | 348,835 | 279,558 | 98.2% |
Traders Point II | IN | Indianapolis | 2005 | 2005 | Developed | 46,600 | 46,600 | 61.4% |
Whitehall Pike | IN | Bloomington | 1999 | 1999 | Developed | 128,997 | 128,997 | 100.0% |
Zionsville Place | IN | Indianapolis | 2006 | 2006 | Developed | 12,400 | 12,400 | 90.3% |
Ridge Plaza | NJ | Oak Ridge | 2002 | 2003 | Acquired | 115,088 | 115,088 | 85.3% |
Eastgate Pavilion | OH | Cincinnati | 1995 | 2004 | Acquired | 236,230 | 236,230 | 100.0% |
CorneliusGateway8 | OR | Portland | 2006 | 2007 | Developed | 35,800 | 21,000 | 53.7% |
Shops at Otty6 | OR | Portland | 2004 | 2004 | Developed | 154,845 | 9,845 | 89.6% |
Burlington Coat Factory7 | TX | San Antonio | 1992/2000 | 2000 | Redeveloped | 107,400 | 107,400 | 100.0% |
Cedar Hill Village | TX | Dallas | 2002 | 2004 | Acquired | 139,092 | 44,262 | 94.2% |
Market Street Village | TX | Hurst | 1970/2004 | 2005 | Acquired | 163,625 | 156,625 | 77.6% |
Plaza at Cedar Hill | TX | Dallas | 2000 | 2004 | Acquired | 299,847 | 299,847 | 86.5% |
Plaza Volente | TX | Austin | 2004 | 2005 | Acquired | 160,333 | 156,333 | 93.4% |
Preston Commons | TX | Dallas | 2002 | 2002 | Developed | 142,539 | 27,539 | 92.5% |
Sunland Towne Centre | TX | El Paso | 1996 | 2004 | Acquired | 312,450 | 307,474 | 89.0% |
50th & 12th | WA | Seattle | 2004 | 2004 | Developed | 14,500 | 14,500 | 100.0% |
Gateway Shopping Center | WA | Seattle | 2008 | 2008 | Developed | 285,200 | 100,949 | 76.2% |
Sandifur Plaza8 | WA | Pasco | 2008 | 2008 | Developed | 12,552 | 12,552 | 82.5% |
|
|
|
|
|
| |||
|
|
|
|
| TOTAL | 7,998,523 | 4,944,570 | 90.2% |
|
|
|
|
|
| |||
|
|
|
|
|
|
|
|
|
See prior page for footnote disclosure.
OPERATING RETAIL PROPERTIES – TABLE II
As of March 31, 2009
Property | State | MSA | Annualized | Annualized Ground Lease Revenue | Annualized Total Retail Revenue |
| Percentage of Annualized Total Retail Revenue | Base Rent Per Leased Owned GLA2 |
| Major Tenants and |
Bayport Commons | FL | Tampa | $ 1,563,448 | $ - | $1,563,448 |
| 2.56% | $ 18.18 |
| Petsmart, Best Buy, Michaels |
Eagle Creek Lowe’s | FL | Naples | - | 800,000 | 800,000 |
| 1.31% | - |
| Lowe’s Home Improvement |
Estero Town Commons4 | FL | Naples | 574,962 | 871,000 | 1,445,962 |
| 2.37% | 29.62 |
| Lowe’s Home Improvement, Ruby Tuesday, Mattress Giant |
Indian River Square | FL | Vero Beach | 1,436,956 | - | 1,436,956 |
| 2.35% | 10.21 |
| Beall’s, Target (non-owned), Lowe’s Home Improvement (non-owned), Office Depot |
International Speedway Square | FL | Daytona | 1,947,547 | 362,900 | 2,310,447 |
| 3.78% | 10.77 |
| Bed, Bath & Beyond, Stein Mart, Old Navy, Staples, Michaels |
King’s Lake Square | FL | Naples | 1,147,309 | - | 1,147,309 |
| 1.88% | 13.96 |
| Publix, Retro Fitness |
Pine Ridge Crossing | FL | Naples | 1,528,878 | - | 1,528,878 |
| 2.50% | 15.02 |
| Publix, Target (non-owned), Beall’s (non-owned) |
Riverchase Plaza | FL | Naples | 1,130,107 | - | 1,130,107 |
| 1.85% | 14.42 |
| Publix |
Shops at Eagle Creek | FL | Naples | 751,236 | - | 751,236 |
| 1.23% | 17.24 |
| Staples |
Tarpon Springs Plaza | FL | Naples | 1,825,917 | 128,820 | 1,954,737 |
| 3.20% | 22.45 |
| Cost Plus, AC Moore, Staples |
Wal-Mart Plaza | FL | Gainesville | 936,004 | - | 936,004 |
| 1.53% | 5.37 |
| Books-A-Million,Save-A-Lot, Wal-Mart |
Waterford Lakes Village | FL | Orlando | 867,621 | - | 867,621 |
| 1.42% | 12.02 |
| Winn-Dixie |
Kedron Village | GA | Atlanta | 2,438,138 | - | 2,438,138 |
| 3.99% | 17.49 |
| Target (non-owned), Bed Bath & Beyond, Ross Dress for Less, PETCO |
Publix at Acworth | GA | Atlanta | 810,767 | - | 810,767 |
| 1.33% | 11.88 |
| Publix |
The Centre at Panola | GA | Atlanta | 880,338 | - | 880,338 |
| 1.44% | 12.05 |
| Publix |
Fox Lake Crossing | IL | Chicago | 1,175,843 | - | 1,175,843 |
| 1.92% | 14.02 |
| Dominick’s Finer Foods |
Naperville Marketplace | IL | Chicago | 921,210 | - | 921,210 |
| 1.51% | 12.67 |
| TJ Maxx, PetSmart |
50 South Morton | IN | Indianapolis | 114,000 | - | 114,000 |
| 0.19% | 57.00 |
|
|
54th & College | IN | Indianapolis | - | 260,000 | 260,000 |
| 0.43% | - |
| The Fresh Market (non-owned) |
Beacon Hill | IN | Crown Point | 603,069 | 60,000 | 663,069 |
| 1.09% | 17.42 |
| Strack & VanTill (non-owned) |
Boulevard Crossing | IN | Kokomo | 1,687,150 | - | 1,687,150 |
| 2.76% | 14.16 |
| PETCO, TJ Maxx, Kohl’s (non-owned) |
Bridgewater Marketplace | IN | Indianapolis | 189,863 |
| 189,863 |
| 0.31% | 20.30 |
|
|
Cool Creek Commons | IN | Indianapolis | 2,113,962 | - | 2,113,962 |
| 3.46% | 16.97 |
| The Fresh Market, Stein Mart, Cardinal Fitness |
Fishers Station | IN | Indianapolis | 1,100,136 | - | 1,100,136 |
| 1.80% | 12.10 |
| Marsh Supermarkets |
Geist Pavilion | IN | Indianapolis | 900,271 | - | 900,271 |
| 1.47% | 16.80 |
| Partytree Superstore, Ace Hardware |
Glendale Town Center | IN | Indianapolis | 2,108,463 | 168,996 | 2,277,459 |
| 3.73% | 5.66 |
| Federated Dept Store, Kerasotes Theater, Staples, Indianapolis Library, Lowe’s Home Improvement Center (non-owned), Target (non-owned) |
Greyhound Commons | IN | Indianapolis | - | 202,500 | 202,500 |
| 0.33% | - |
| Lowe’s Home Improvement Center (non-owned) |
Hamilton Crossing Centre | IN | Indianapolis | 1,389,363 | 71,500 | 1,460,863 |
| 2.39% | 17.60 |
| Office Depot |
Martinsville Shops | IN | Martinsville | 160,815 | - | 160,815 |
| 0.26% | 14.64 |
| Walgreens (non-owned) |
Red Bank Commons | IN | Evansville | 359,292 | - | 359,292 |
| 0.59% | 15.00 |
| Wal-Mart (non-owned), Home Depot (non-owned) |
Stoney Creek Commons | IN | Indianapolis | 464,755 | - | 464,755 |
| 0.76% | 9.42 |
| Lowe’s Home Improvement (non-owned), HH Gregg, Office Depot |
The Centre4 | IN | Indianapolis | 1,060,308 | - | 1,060,308 |
| 1.74% | 13.61 |
| Osco Drug |
The Corner | IN | Indianapolis | 612,314 | - | 612,314 |
| 1.00% | 14.92 |
| Hancock Fabrics |
Traders Point | IN | Indianapolis | 3,957,335 | 435,000 | 4,392,335 |
| 7.19% | 14.41 |
| Dick’s Sporting Goods, Kerasotes, Marsh, Bed, Bath & Beyond, Michaels, Old Navy, Petsmart |
____________________ | |
1 | Annualized Base Rent Revenue represents the contractual rent for March 2009 for each applicable property, multiplied by 12. This table does not include Annualized Base Rent from development property tenants open for business as of March 31, 2009. |
|
|
2 | Owned GLA represents gross leasable area that is owned by the Company. Total GLA includes Owned GLA, square footage attributable to non-owned anchor space and non-owned structures on ground leases. |
|
|
3 | Represents the three largest tenants that occupy at least 10,000 square feet of GLA at the property, including non-owned anchors. |
|
|
4 | A third party manages this property. |
OPERATING RETAIL PROPERTIES – TABLE II (CONTINUED)
Property | State | MSA | Annualized Base Rent Revenue1 | Annualized Ground Lease Revenue | Annualized Total Retail Revenue | Percentage of Annualized Total Retail Revenue | Base Rent Per Leased Owned GLA2 | Major Tenants and | ||||
Traders Point II | IN | Indianapolis | $ | 733,838 | $ | - | $ | 733,838 | 1.27% | $ | 27.05 |
|
Whitehall Pike | IN | Bloomington | 1,014,000 | - | 1,014,000 | 1.66% | 7.86 | Lowe’s Home Improvement Center | ||||
Zionsville Place | IN | Indianapolis | 234,020 | - | 234,020 | 0.38% | 20.89 |
| ||||
Ridge Plaza | NJ | Oak Ridge | 1,596,541 | - | 1,596,541 | 2.61% | 16.27 | A&P Grocery, CVS | ||||
Eastgate Pavilion | OH | Cincinnati | 2,366,522 | - | 2,366,522 | 3.87% | 10.02 | Best Buy, Dick’s Sporting Goods, Value City Furniture | ||||
Cornelius Gateway | OR | Portland | 216,550 | - | 216,550 | 0.35% | 19.21 | Fedex/Kinkos | ||||
Shops at Otty | OR | Portland | 249,665 | 136,300 | 385,965 | 0.63% | 28.29 | Wal-Mart (non-owned) | ||||
Burlington Coat Factory | TX | San Antonio | 510,150 | - | 510,150 | 0.83% | 4.75 | Burlington Coat Factory | ||||
Cedar Hill Village | TX | Dallas | 686,247 | - | 686,247 | 1.12% | 16.45 | 24 Hour Fitness, JC Penny (non-owned) | ||||
Market Street Village | TX | Hurst | 1,445,386 | 115,700 | 1,561,086 | 2.55% | 11.89 | Jo-Ann Fabric, Ross Dress for Less | ||||
Plaza at Cedar Hill | TX | Dallas | 3,302,669 | - | 3,302,669 | 5.41% | 12.73 | Hobby Lobby, Office Max, Ross Dress for Less, Old Navy, Marshalls, Sprouts Farmers Market | ||||
Plaza Volente | TX | Austin | 2,229,470 | 100,000 | 2,329,470 | 3.81% | 15.27 | H-E-B Grocery | ||||
Preston Commons | TX | Dallas | 640,708 | - | 640,708 | 1.05% | 25.15 | Lowe’s Home Improvement (non-owned) | ||||
Sunland Towne Centre | TX | El Paso | 2,629,500 | 104,809 | 2,734,309 | 4.48% | 9.58 | HMY Roomstore, Kmart, Bed Bath & Beyond | ||||
50th & 12th | WA | Seattle | 475,000 | - | 475,000 | 0.78% | 32.76 | Walgreens | ||||
Gateway Shopping Center | WA | Seattle | 1,730,132 | 229,500 | 1,959,632 | 3.21% | 22.49 | Petsmart, Ross Dress for Less, Rite Aid | ||||
Sandifur Plaza | WA | Pasco | 196,320 | - | 196,320 | 0.32% | 18.96 |
| ||||
|
| TOTAL | $ | 57,054,095 | $ | 4,047,025 | $ | 61,101,120 | 100% | $ | 12.79 |
|
See prior page for footnote disclosure
OPERATING COMMERCIAL PROPERTIES
As of March 31, 2009
Property | MSA | Year Built/ | Acquired, | Owned | Percentage | Annualized | Percentage | Base Rent |
| Major Tenants | ||
Indiana |
|
|
|
|
|
|
|
|
|
| ||
30 South3 | Indianapolis | 1905/2002 | Redeveloped | 298,346 | 95.3% | $ | 5,012,817 | 77.3% | $ | 16.80 |
| Indiana Supreme Court, City Securities, Kite Realty Group |
Pen Products | Indianapolis | 2003 | Acquired | 85,875 | 100.0% |
| 834,705 | 12.9% |
| 9.72 |
| Indiana Dept. of Administration |
Union Station Parking Garage2 | Indianapolis | 1986 | Acquired | N/A | N/A |
| N/A | N/A |
| N/A |
| Denison Parking Management Agreement |
Indiana State Motorpool | Indianapolis | 2004 | Developed | 115,000 | 100.0% |
| 639,400 | 9.9% |
| 5.56 |
| Indiana Dept. of Administration |
|
|
|
|
|
| |||||||
|
|
| TOTAL | 499,221 | 97.2% | $ | 6,486,922 | 100.0% | $ | 12.99 |
|
|
|
|
|
|
|
| |||||||
____________________ | |
1 | Annualized Base Rent represents the monthly contractual rent for March 2009 for each applicable property, multiplied by 12. |
|
|
2 | The garage is managed by a third party. |
|
|
3 | Annualized Base Rent includes $890,942 from the Company and subsidiaries as of March 31, 2009. |
|
|
RETAIL OPERATING PORTFOLIO – TENANT BREAKDOWN1
As of March 31, 2009
| Owned Gross Leasable Area |
| Percent of Owned GLA Leased |
| Annualized |
| Annualized Base Rent | ||||||||||
|
|
| |||||||||||||||
Property | State | Anchors | Shops | Total |
| Anchors | Shops | Total |
| Anchors | Shops | Ground Lease | Total |
| Anchors | Shops | Total |
|
|
| |||||||||||||||
Bayport Commons | FL | 71,563 | 23,193 | 94,756 |
| 100.0% | 62.4% | 90.8% |
| $1,107,187 | $456,261 | $ - | 1,563,448 |
| $15.48 | $31.51 | $18.18 |
Eagle Creek Lowe's | FL | - | - | - |
| 0.0% | 0.0% | 0.0% |
| - | - | 800,000 | 800,000 |
| - | - | - |
Estero Town Commons | FL | - | 25,600 | 25,600 |
| 0.0% | 75.8% | 75.8% |
| - | 574,962 | 871,000 | 1,445,962 |
| - | 29.62 | 29.62 |
Indian River Square | FL | 116,342 | 27,904 | 144,246 |
| 100.0% | 87.5% | 97.6% |
| 973,085 | 463,871 | - | 1,436,956 |
| 8.36 | 19.01 | 10.21 |
International Speedway Square | FL | 200,401 | 20,500 | 220,901 |
| 83.8% | 63.3% | 81.9% |
| 1,700,041 | 247,506 | 362,900 | 2,310,447 |
| 10.12 | 19.08 | 10.77 |
King's Lake Square | FL | 49,805 | 35,692 | 85,497 |
| 100.0% | 90.8% | 96.2% |
| 358,890 | 788,419 | - | 1,147,309 |
| 7.21 | 24.33 | 13.96 |
Pine Ridge Crossing | FL | 65,999 | 39,516 | 105,515 |
| 100.0% | 89.6% | 96.4% |
| 627,628 | 901,250 | - | 1,528,878 |
| 9.46 | 25.45 | 15.02 |
Riverchase Plaza | FL | 48,890 | 29,450 | 78,340 |
| 100.0% | 100.0% | 100.0% |
| 386,231 | 743,876 | - | 1,130,107 |
| 7.90 | 25.22 | 14.42 |
Shops at Eagle Creek | FL | 51,703 | 24,241 | 75,944 |
| 49.3% | 74.6% | 57.4% |
| 356,678 | 394,558 | - | 751,236 |
| 14.00 | 21.80 | 17.24 |
Tarpon Springs Plaza | FL | 60,151 | 22,395 | 82,546 |
| 100.0% | 94.6% | 98.5% |
| 1,144,008 | 681,909 | 128,820 | 1,954,737 |
| 19.02 | 32.19 | 22.45 |
Wal-Mart Plaza | FL | 138,323 | 39,503 | 177,826 |
| 100.0% | 91.0% | 98.0% |
| 554,049 | 381,956 | - | 936,005 |
| 4.01 | 10.62 | 5.37 |
Waterford Lakes Village | FL | 51,703 | 26,245 | 77,948 |
| 100.0% | 78.0% | 92.6% |
| 408,452 | 459,169 | - | 867,621 |
| 7.90 | 22.44 | 12.02 |
Kedron Village | GA | 68,845 | 88,563 | 157,408 |
| 100.0% | 79.7% | 88.6% |
| 849,648 | 1,588,489 | - | 2,438,137 |
| 12.34 | 22.51 | 17.49 |
Publix at Acworth | GA | 37,888 | 31,740 | 69,628 |
| 100.0% | 95.6% | 98.0% |
| 337,203 | 473,564 | - | 810,767 |
| 8.90 | 15.61 | 11.88 |
The Centre at Panola | GA | 51,674 | 21,405 | 73,079 |
| 100.0% | 100.0% | 100.0% |
| 413,392 | 466,946 | - | 880,338 |
| 8.00 | 21.81 | 12.05 |
Fox Lake Crossing | IL | 65,977 | 33,095 | 99,072 |
| 100.0% | 54.1% | 84.7% |
| 775,230 | 400,614 | - | 1,175,844 |
| 11.75 | 22.36 | 14.02 |
Naperville Marketplace | IL | 61,683 | 21,607 | 83,290 |
| 100.0% | 51.0% | 87.3% |
| 702,879 | 218,331 | - | 921,210 |
| 11.40 | 19.81 | 12.67 |
50 South Morton | IN | - | 2,000 | 2,000 |
| 0.0% | 100.0% | 100.0% |
| - | 114,000 | - | 114,000 |
| - | 57.00 | 57.00 |
54th & College | IN | - | - | - |
| 0.0% | 0.0% | 0.0% |
| - | - | 260,000 | 260,000 |
| - | - | - |
Beacon Hill | IN | - | 57,321 | 57,321 |
| 0.0% | 60.4% | 60.4% |
| - | 603,069 | 60,000 | 663,069 |
| - | 17.42 | 17.42 |
Boulevard Crossing | IN | 73,440 | 50,256 | 123,696 |
| 100.0% | 90.9% | 96.3% |
| 851,460 | 835,690 | - | 1,687,150 |
| 11.59 | 18.30 | 14.16 |
Bridgewater Marketplace | IN | - | 26,000 | 26,000 |
| 0.0% | 36.0% | 36.0% |
| - | 189,863 | - | 189,863 |
| - | 20.30 | 20.30 |
Cool Creek Commons | IN | 63,600 | 60,978 | 124,578 |
| 100.0% | 100.0% | 100.0% |
| 643,200 | 1,470,762 | - | 2,113,962 |
| 10.11 | 24.12 | 16.97 |
Fishers Station | IN | 57,000 | 57,457 | 114,457 |
| 100.0% | 59.1% | 79.5% |
| 575,000 | 525,136 | - | 1,100,136 |
| 10.09 | 15.46 | 12.10 |
Geist Pavilion | IN | 27,955 | 36,159 | 64,114 |
| 100.0% | 70.9% | 83.6% |
| 383,546 | 516,725 | - | 900,271 |
| 13.72 | 20.15 | 16.80 |
Glendale Town Center | IN | 329,588 | 73,739 | 403,327 |
| 100.0% | 58.4% | 92.4% |
| 1,207,305 | 901,158 | 168,996 | 2,277,459 |
| 3.66 | 20.92 | 5.66 |
Greyhound Commons | IN | - | - | - |
| 0.0% | 0.0% | 0.0% |
| - | - | 202,500 | 202,500 |
| - | - | - |
Hamilton Crossing Centre | IN | 30,722 | 51,702 | 82,424 |
| 100.0% | 93.2% | 95.8% |
| 345,623 | 1,043,741 | 71,500 | 1,460,864 |
| 11.25 | 21.65 | 17.60 |
Martinsville Shops | IN | - | 10,986 | 10,986 |
| 0.0% | 100.0% | 100.0% |
| - | 160,815 | - | 160,815 |
| - | 14.64 | 14.64 |
Red Bank Commons | IN | - | 34,308 | 34,308 |
| 0.0% | 69.8% | 69.8% |
| - | 359,292 | - | 359,292 |
| - | 15.00 | 15.00 |
Stoney Creek Commons | IN | 49,330 | - | 49,330 |
| 100.0% | 0.0% | 100.0% |
| 464,755 | - | - | 464,755 |
| 9.42 | - | 9.42 |
The Centre4 | IN | 18,720 | 61,969 | 80,689 |
| 100.0% | 95.5% | 96.5% |
| 170,352 | 889,956 | - | 1,060,308 |
| 9.10 | 15.04 | 13.61 |
The Corner | IN | 12,200 | 30,345 | 42,545 |
| 100.0% | 95.0% | 96.4% |
| 88,450 | 523,864 | - | 612,314 |
| 7.25 | 18.17 | 14.92 |
Traders Point | IN | 238,721 | 40,837 | 279,558 |
| 100.0% | 87.8% | 98.2% |
| 3,127,248 | 830,087 | 435,000 | 4,392,335 |
| 13.10 | 23.16 | 14.41 |
Traders Point II | IN | - | 46,600 | 46,600 |
| 0.0% | 61.4% | 61.4% |
| - | 773,838 | - | 773,838 |
| - | 27.05 | 27.05 |
Whitehall Pike | IN | 128,997 | - | 128,997 |
| 100.0% | 0.0% | 100.0% |
| 1,014,000 | - | - | 1,014,000 |
| 7.86 | - | 7.86 |
Zionsville Place | IN | - | 12,400 | 12,400 |
| 0.0% | 90.3% | 90.3% |
| - | 234,020 | - | 234,020 |
| - | 20.89 | 20.89 |
Ridge Plaza | NJ | 69,612 | 45,476 | 115,088 |
| 100.0% | 62.7% | 85.3% |
| 997,762 | 598,779 | - | 1,596,541 |
| 14.33 | 21.00 | 16.27 |
Eastgate Pavilion | OH | 231,730 | 4,500 | 236,230 |
| 100.0% | 100.0% | 100.0% |
| 2,233,771 | 132,750 | - | 2,366,522 |
| 9.64 | 29.50 | 10.02 |
Cornelius Gateway | OR | - | 21,000 | 21,000 |
| 0.0% | 53.7% | 53.7% |
| - | 216,550 | - | 216,550 |
| - | 19.21 | 19.21 |
Shops at Otty | OR | - | 9,845 | 9,845 |
| 0.0% | 89.6% | 89.6% |
| - | 249,665 | 136,300 | 385,965 |
| - | 28.29 | 28.29 |
Burlington Coat Factory | TX | 107,400 | - | 107,400 |
| 100.0% | 0.0% | 100.0% |
| 510,150 | - | - | 510,150 |
| 4.75 | - | 4.75 |
Cedar Hill Village | TX | 32,231 | 12,031 | 44,262 |
| 100.0% | 78.8% | 94.2% |
| 483,465 | 202,782 | - | 686,247 |
| 15.00 | 21.39 | 16.45 |
Market Street Village | TX | 136,746 | 19,879 | 156,625 |
| 75.2% | 94.0% | 77.6% |
| 1,028,209 | 417,177 | 115,700 | 1,561,086 |
| 9.99 | 22.33 | 11.89 |
Plaza at Cedar Hill | TX | 227,106 | 72,741 | 299,847 |
| 84.8% | 92.0% | 86.5% |
| 1,954,009 | 1,348,660 | - | 3,302,669 |
| 10.15 | 20.15 | 12.73 |
Plaza Volente | TX | 105,000 | 51,333 | 156,333 |
| 100.0% | 79.9% | 93.4% |
| 1,155,000 | 1,074,470 | 100,000 | 2,329,470 |
| 11.00 | 26.20 | 15.27 |
Preston Commons | TX | - | 27,539 | 27,539 |
| 0.0% | 92.5% | 92.5% |
| - | 640,708 | - | 640,708 |
| - | 25.15 | 25.15 |
Sunland Towne Centre | TX | 277,131 | 30,343 | 307,474 |
| 89.2% | 90.1% | 89.0% |
| 2,159,495 | 470,005 | 104,809 | 2,734,309 |
| 8.73 | 17.19 | 9.58 |
50th & 12th | WA | 14,500 | - | 14,500 |
| 100.0% | 0.0% | 100.0% |
| 475,000 | - | - | 475,000 |
| 32.76 | - | 32.76 |
Gateway Shopping Center | WA | 64,637 | 36,312 | 100,949 |
| 100.0% | 33.9% | 76.2% |
| 1,337,747 | 392,385 | 229,500 | 1,959,632 |
| 20.70 | 31.90 | 22.49 |
Sandifur Plaza | WA | - | 12,552 | 12,552 |
| 0.0% | 82.5% | 82.5% |
| - | 196,320 | - | 196,320 |
| - | 18.96 | 18.96 |
|
|
|
|
| |||||||||||||
TOTAL | 3,437,313 | 1,507,257 | 4,944,570 |
| 95.4% | 78.4% | 90.2% |
| $31,900,146 | $25,153,949 | $4,047,025 | $61,101,120 |
| $ 9.72 | $21.28 | $12.79 | |
|
|
|
| ||||||||||||||
____________________ | |
1 | This table does not include annualized base rent from development property tenants open for business as of March 31, 2009. |