p. 2Kite Realty Group Trust Supplemental Financial and Operating Statistics –3/31/14
PRESS RELEASE
| Contact Information: | Investors/Media: |
| Kite Realty Group Trust | Kite Realty Group Trust |
| Dan Sink, Chief Financial Officer | Adam Basch, Investor Relations |
| (317) 577-5609 | (317) 578-5161 |
| dsink@kiterealty.com | abasch@kiterealty.com |
Kite Realty Group Trust Reports
First Quarter 2014 Results
Indianapolis, Ind., May 1, 2014 – Kite Realty Group Trust (NYSE: KRG) (the “Company”) announced today operating results for the first quarter ended March 31, 2014. Financial statements and exhibits attached to this release include results for the three months ended March 31, 2014 and 2013.
“Significant progress on investments in properties and robust operations resulted in another excellent quarter,” said John A. Kite, Chairman and CEO. “Our portfolio fundamentals and operating results continue to be very strong. We achieved strong same property net operating income growth of 4.7% driven by healthy occupancy gains, additional rent related to increased tenant sales, and positive re-leasing spreads. We are also continuing to add value for our shareholders as we progress on redevelopments and developments such as the construction at Gainesville Plaza in Florida and Phase II of Holly Springs Town Center in North Carolina. Finally, we remain tremendously excited about our pending merger transaction with Inland Diversified Real Estate Trust, which once completed will more than double our size, increase our cash flow and strengthen our balance sheet. Overall, we are very pleased with our outstanding first quarter and start to 2014.”
Financial Results
| · | As adjusted for $4.5 million of merger costs, Funds From Operations (FFO), was $17.5 million, or $0.13 per diluted common share, for the first quarter of 2014. |
| · | Net income was $2.2 million, or $0.02 per diluted common share, for the first quarter of 2014, compared to a net loss of $0.1 million, or $0.00 per diluted common share, in the first quarter of 2013. |
| · | Revenue from recurring property operations increased 55% in the first quarter of 2014 over the first quarter of 2013. |
For the three months ended March 31, 2014, FFO was $12.4 million, or $0.09 per diluted common share for Kite Realty Group, L.P.’s real estate properties in which the Company owns an interest (which we refer to as the “Kite Portfolio”), compared to $10.6 million, or $0.14 per diluted common share, for the same period in the prior year. As adjusted for costs associated with our pending merger with Inland Diversified Real Estate Trust, FFO for the three months ended March 31, 2014 was $17.5 million, or $0.13 per diluted common share for the Kite Portfolio, compared to $11.6 million, or $0.14 per diluted common share, for the same period in the prior year. Other property-related revenue was higher in the first quarter of 2013 by $2.8 million, or $0.03 per diluted common share, reflecting a gain on the sale of a single outparcel in that quarter.
p. PR-1
Kite Realty Group Trust Supplemental Financial and Operating Statistics –3/31/14
Net income attributable to common shareholders for the three months ended March 31, 2014 was $2.2 million compared to a net loss of $0.1 million for the same period in 2013. Net income attributable to common shareholders during the three months ended March 31, 2014 included net gains on the sales of three operating properties totaling $6.7 million, partially offset by merger-related costs of $4.5 million.
Revenue from property operations increased 55% year over year as the Company continues to deliver its development and redevelopment properties into operations. Also, the first quarter of 2014 reflected the full effect of the nine-property portfolio acquisition that was completed in November 2013.
Portfolio Operations
| · | Same property net operating income increased 4.7% in the first quarter of 2014 over the same period in the prior year. |
| · | The total portfolio was 95.3% leased at the end of the first quarter of 2014. |
| · | The Company executed 44 new and renewal leases for 259,600 square feet during the first quarter of 2014 for an aggregate cash rent spread of 27.2%. |
| · | The Company opened five new anchor tenants totaling 239,000 square feet of total GLA in the first quarter of 2014. |
As of March 31, 2014, the Company owned interests in 64 operating properties totaling approximately 11.3 million square feet. The owned GLA in the Company’s retail operating portfolio was 95.3% leased as of March 31, 2014, compared to 94.5% leased as of March 31, 2013. The owned net rentable area of the Company’s two commercial properties was 95.2% leased as of March 31, 2014 compared to 94.0% leased as of March 31, 2013.
Same property net operating income, which includes 50 operating properties, increased 4.7% in the first quarter of 2014 compared to the same period in the prior year. The increase was due to occupancy gains, additional rent related to strong tenant sales, and positive re-leasing spreads. The leased percentage of these properties increased to 96.4% at March 31, 2014 from 95.1% at March 31, 2013.
The Company executed 44 new and renewal leases during the first quarter of 2014 totaling 259,600 square feet. The Company generated positive cash leasing spreads in the quarter with new leases up 51.1% and renewals up 3.2% for a blended spread of 27.2%. The new leasing spreads are primarily driven by the re-tenanting of the former Wal-Mart at our Gainesville, Florida redevelopment property.
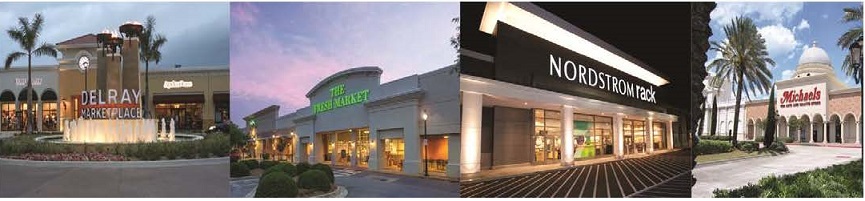
As previously announced, the Company opened five new anchor tenants totaling 239,000 square feet of GLA in the first quarter of 2014. The new anchor tenants are Sprouts Farmers Market at Sunland Town Center in El Paso, Texas; Walgreens at Rangeline Crossing in Indianapolis, Indiana; LA Fitness at Bolton Plaza in Jacksonville, Florida; Fresh Market at Lithia Crossing in Tampa, Florida; and a non-owned Target at Parkside Town Commons in Raleigh, North Carolina.
p. PR-2
Kite Realty Group Trust Supplemental Financial and Operating Statistics –3/31/14
Investments in Properties for the First Quarter
| · | Substantially completed the development of Delray Marketplace, a retail property in Delray Beach, Florida that was 87% leased at quarter-end, and transitioned the property to the operating portfolio. |
| · | Signed two new anchor leases with DSW and Bed Bath and Beyond at Holly Springs Town Center Phase II in Raleigh, North Carolina. |
| · | Signed two new anchor leases with Ross Dress for Less and Burlington Coat Factory at Gainesville Plaza, a redevelopment project located in Gainesville, Florida. |
| · | As previously announced, completed the sales of 50th and 12th, a 14,500 square feet single-tenant Walgreens in Seattle, Washington; Red Bank Commons, a 34,300 square feet non-anchored center in Evansville, Indiana; and Ridge Plaza, a 115,100 square feet A&P Grocery-anchored center in Oak Ridge, New Jersey, for aggregate gross proceeds of $35.2 million. |
Development
Delray Marketplace in Delray Beach, Florida was transitioned to the Company’s operating portfolio during the first quarter of 2014. The project was 87% leased as of March 31, 2014 and is anchored by Publix, Frank Theatres, Burt & Max’s Grille, Charming Charlie, Chico’s, White House | Black Market, Ann Taylor Loft, and Jos. A. Bank.
As of March 31, 2014, the Company owned interests in two development projects under construction, Phase II of Holly Springs Towne Center and Parkside Town Commons, both near Raleigh, North Carolina. Phase II of Holly Springs Towne Center is anchored by Target, Frank Theatres, Bed Bath & Beyond and DSW while Parkside Town Commons is anchored by Target, Frank Theatres, Harris Teeter, Golf Galaxy and Field & Stream. The total estimated cost of these projects is approximately $153.3 million, of which approximately $85.1 million had been incurred as of March 31, 2014, and they were in the aggregate 73% pre-leased or committed as of March 31, 2014.
Redevelopment
The Company owned three redevelopment properties under construction that were in the aggregate 87.4% pre-leased or committed as of March 31, 2014. LA Fitness opened at Bolton Plaza in Jacksonville, Florida in the first quarter of 2014 and anchors the center along with Academy Sports and Outdoors. The Company continues the redevelopment of King’s Lake Square in Naples, Florida, with work completed on a new and upgraded Publix grocery store. The new Publix store opened in April 2014. Gainesville Plaza in Gainesville, Florida will be anchored by Burlington Coat Factory and Ross Dress for Less.
p. PR-3
Kite Realty Group Trust Supplemental Financial and Operating Statistics –3/31/14
Dispositions
During the first quarter, the Company recycled capital through the sale of three operating properties: 50th and 12th, a 14,500 square feet single-tenant Walgreens in Seattle, Washington, for gross proceeds of $8.6 million; Red Bank Commons, a 34,300 square feet non-anchored center in Evansville, Indiana, for gross proceeds of $5.3 million; and Ridge Plaza located in Oak Ridge, New Jersey for gross proceeds of $21.3 million. This 115,100 square feet center was 90% leased at time of sale and was anchored by A&P Grocery.
Distributions
| · | Increased the quarterly common share dividend by 8.3%. |
On March 20, 2014, the Board of Trustees declared a quarterly common share distribution of $0.065 per common share, which represented an increase of 8.3% for the quarter ended March 31, 2014 payable to shareholders of record as of April 7, 2014. This distribution was paid on April 14, 2014.
On February 7, 2014, the Board of Trustees declared a quarterly preferred share cash distribution of $0.515625 per preferred share covering the distribution period from December 2, 2013 to March 1, 2014 payable to shareholders of record as of February 21, 2014. This distribution was paid on March 1, 2014.
Merger Update
On February 9, 2014, the Company entered into a definitive merger agreement with Inland Diversified pursuant to which Inland Diversified will merge with and into a subsidiary of the Company, and each outstanding share of Inland Diversified common stock will be converted into a right to receive between 1.707 and 1.650 common shares of the Company. The merger is subject to customary closing conditions, including approval of shareholders of both companies at meetings which currently are scheduled to occur on June 24, 2014. The Company currently expects that the transaction will close early in the third quarter of 2014.
2014 Earnings Guidance
| · | Increased Same Property Net Operating Income growth guidance for 2014 to 3.5% – 4.0%. |
The Company reaffirms its as adjusted FFO guidance for the year ending December 31, 2014 to be within a range of $0.48 to $0.52 per diluted common share and net income to be within a range of $0.00 to $0.04 per diluted common share. The Company has also increased its guidance for 2014 same property net operating income to an increase of 3.5% - 4.0% over the prior year, a change from a 3.0% - 4.0% increase set forth in its initial earnings guidance. Guidance assumptions exclude the effects of the pending merger with Inland Diversified and merger-related costs.
p. PR-4
Kite Realty Group Trust Supplemental Financial and Operating Statistics –3/31/14
| Guidance Range for 2014 | | Low | | | High | |
| Net income per diluted common share | | $ | 0.00 | | | $ | 0.04 | |
| Depreciation and amortization | | | 0.48 | | | | 0.48 | |
| FFO per diluted common share, as adjusted | | $ | 0.48 | | | $ | 0.52 | |
Non-GAAP Financial Measures
Given the nature of the Company’s business as a real estate owner and operator, the Company believes that FFO and FFO, as adjusted, are helpful to investors when measuring operating performance because they exclude various items included in net income or loss that do not relate to or are not indicative of operating performance, such as gains or losses from sales and impairments of operating properties, and depreciation and amortization, which can make periodic and peer analyses of operating performance more difficult. For informational purposes, we have also provided FFO adjusted for first quarter 2014 costs associated with our pending merger with Inland Diversified and the first quarter 2013 write-off of deferred loan costs. We believe this supplemental information provides a more meaningful measure of our operating performance. The Company believes presenting FFO and adjusted FFO in this manner allows investors and other interested parties to form a more meaningful assessment of the Company’s operating results. Reconciliations of net income to FFO and adjusted FFO are included in the attached table.
Earnings Conference Call
The Company will conduct a conference call to discuss its financial results on Friday, May 2nd at 1:00 p.m. eastern time. A live webcast of the conference call will be available online on the Company’s corporate website at www.kiterealty.com. The dial-in numbers are (877) 703-6103 for domestic callers and (857) 244-7302 for international callers (passcode 80512645). In addition, a telephonic replay of the call will be available until August 2, 2014. The replay dial-in telephone numbers are (888) 286-8010 for domestic callers and (617) 801-6888 for international callers (passcode 86084460).
About Kite Realty Group Trust
Kite Realty Group Trust is a full-service, vertically integrated real estate investment trust engaged in the ownership, operation, management, leasing, acquisition, construction, redevelopment and development of neighborhood and community shopping centers in selected markets in the United States. At March 31, 2014, the Company owned interests in a portfolio of 68 operating and redevelopment properties totaling approximately 11.8 million square feet and two properties currently under development totaling 0.7 million square feet.
p. PR-5
Kite Realty Group Trust Supplemental Financial and Operating Statistics –3/31/14
Safe Harbor
This press release contains certain forward-looking statements within the meaning of Section 27A of the Securities Act of 1933 and Section 21E of the Securities Exchange Act of 1934. Such statements are based on assumptions and expectations that may not be realized and are inherently subject to risks, uncertainties and other factors, many of which cannot be predicted with accuracy and some of which might not even be anticipated. Future events and actual results, performance, transactions or achievements, financial or otherwise, may differ materially from the results, performance, transactions or achievements, financial or otherwise, expressed or implied by the forward-looking statements. Risks, uncertainties and other factors that might cause such differences, some of which could be material, include, but are not limited to: national and local economic, business, real estate and other market conditions, particularly in light of low growth in the U.S. economy, financing risks, including the availability of and costs associated with sources of liquidity, the Company’s ability to refinance, or extend the maturity dates of, its indebtedness, the level and volatility of interest rates, the financial stability of tenants, including their ability to pay rent and the risk of tenant bankruptcies, the competitive environment in which the Company operates, acquisition, disposition, development and joint venture risks (including the pending merger transaction with Inland Diversified Real Estate Trust, Inc., and the Company’s ability to successfully integrate the operations of the acquired properties), property ownership and management risks, the Company’s ability to maintain its status as a real estate investment trust for federal income tax purposes, potential environmental and other liabilities, impairment in the value of real estate property the Company owns, risks related to the geographical concentration of our properties in Indiana, Florida and Texas, the dilutive effects of future offerings of issuing additional securities, and other factors affecting the real estate industry generally. The Company refers you to the documents filed by the Company from time to time with the Securities and Exchange Commission, specifically the section titled “Risk Factors” in the Company’s Annual Report on Form 10-K for the year ended December 31, 2013, which discuss these and other factors that could adversely affect the Company’s results. The Company undertakes no obligation to publicly update or revise these forward-looking statements, whether as a result of new information, future events or otherwise.
p. PR-6
Kite Realty Group Trust Supplemental Financial and Operating Statistics –3/31/14
Kite Realty Group Trust
Consolidated Balance Sheets
(Unaudited)
| | | March 31, 2014 | | | December 31, 2013 | |
| Assets: | | | | | | |
| Investment properties, at cost: | | | | | | |
| Land | | $ | 328,137,169 | | | $ | 333,458,070 | |
| Land held for development | | | 55,943,799 | | | | 56,078,488 | |
| Buildings and improvements | | | 1,355,317,562 | | | | 1,351,641,925 | |
| Furniture, equipment and other | | | 6,531,034 | | | | 4,970,310 | |
| Construction in progress | | | 117,578,997 | | | | 130,909,478 | |
| | | | 1,863,508,561 | | | | 1,877,058,271 | |
| Less: accumulated depreciation | | | (238,659,193 | ) | | | (232,580,267 | ) |
| | | | 1,624,849,368 | | | | 1,644,478,004 | |
| Cash and cash equivalents | | | 31,876,229 | | | | 18,134,320 | |
| Tenant receivables, including accrued straight-line rent of $15,117,510 and $14,490,070, respectively, net of allowance for uncollectible accounts | | | 26,756,364 | | | | 24,767,556 | |
| Other receivables | | | 3,431,482 | | | | 4,566,679 | |
| Escrow deposits | | | 11,186,176 | | | | 11,046,133 | |
| Deferred costs, net | | | 54,975,834 | | | | 56,387,586 | |
| Prepaid and other assets | | | 6,815,015 | | | | 4,546,752 | |
| Total Assets | | $ | 1,759,890,468 | | | $ | 1,763,927,030 | |
| | | | | | | | | |
| Liabilities and Equity: | | | | | | | | |
| Mortgage and other indebtedness | | $ | 871,333,889 | | | $ | 857,144,074 | |
| Accounts payable and accrued expenses | | | 52,838,493 | | | | 61,437,187 | |
| Deferred revenue and other liabilities | | | 41,934,485 | | | | 44,313,402 | |
| Total Liabilities | | | 966,106,867 | | | | 962,894,663 | |
| | | | | | | | | |
| Commitments and contingencies | | | | | | | | |
| | | | | | | | | |
| Redeemable noncontrolling interests in the Operating Partnership | | | 39,851,299 | | | | 43,927,540 | |
| | | | | | | | | |
| Equity: | | | | | | | | |
| Kite Realty Group Trust Shareholders’ Equity: | | | | | | | | |
| Preferred Shares, $.01 par value, 40,000,000 shares authorized, 4,100,000 shares issued and outstanding. | | | 102,500,000 | | | | 102,500,000 | |
| Common Shares, $.01 par value, 200,000,000 shares authorized 131,527,053 shares and 130,826,217 shares issued and outstanding, respectively | | | 1,315,270 | | | | 1,308,262 | |
| Additional paid in capital | | | 825,336,567 | | | | 821,526,172 | |
| Accumulated other comprehensive income | | | 686,344 | | | | 1,352,850 | |
| Accumulated deficit | | | (179,461,343 | ) | | | (173,130,113 | ) |
| Total Kite Realty Group Trust Shareholders’ Equity | | | 750,376,838 | | | | 753,557,171 | |
| Noncontrolling Interests | | | 3,555,464 | | | | 3,547,656 | |
| Total Equity | | | 753,932,302 | | | | 757,104,827 | |
| Total Liabilities and Equity | | $ | 1,759,890,468 | | | $ | 1,763,927,030 | |
p. PR-7
Kite Realty Group Trust Supplemental Financial and Operating Statistics –3/31/14
Kite Realty Group Trust
Consolidated Statements of Operations
For the Three Months Ended March 31, 2014 and 2013
(Unaudited)
| | Three Months Ended March 31, | |
| | 2014 | | | 2013 | |
| Revenue: | | | | | | |
| Minimum rent | | $ | 31,260,036 | | | $ | 20,480,206 | |
| Tenant reimbursements | | | 9,162,860 | | | | 5,555,747 | |
| Other property related revenue | | | 2,237,015 | | | | 5,005,038 | |
| Total revenue | | | 42,659,911 | | | | 31,040,991 | |
| Expenses: | | | | | | | | |
| Property operating | | | 7,315,255 | | | | 5,100,838 | |
| Real estate taxes | | | 5,113,023 | | | | 3,510,960 | |
| General, administrative and other | | | 3,106,102 | | | | 2,139,949 | |
| Merger and acquisition costs | | | 4,480,389 | | | | 176,899 | |
| Depreciation and amortization | | | 17,439,606 | | | | 11,384,964 | |
| Total expenses | | | 37,454,375 | | | | 22,313,610 | |
| Operating income | | | 5,205,536 | | | | 8,727,381 | |
| Interest expense | | | (7,382,845 | ) | | | (6,328,108 | ) |
| Income tax benefit of taxable REIT subsidiary | | | 53,146 | | | | 28,952 | |
| Other (expense) income | | | (92,944 | ) | | | 46,909 | |
| (Loss) income from continuing operations | | | (2,217,107 | ) | | | 2,475,134 | |
| Discontinued operations:* | | | | | | | | |
| Loss from operations | | | — | | | | (418,366 | ) |
| | | | | | | | | |
| Loss from discontinued operations | | | — | | | | (418,366 | ) |
| Income before gain on sale of operating properties | | | (2,217,107 | ) | | | 2,056,768 | |
Gain on sale of operating properties | | | 6,688,110 | | | | — | |
| Consolidated net income | | | 4,471,003 | | | | 2,056,768 | |
| Net income attributable to noncontrolling interests | | | (138,912 | ) | | | (24,854 | ) |
| Net income attributable to Kite Realty Group Trust | | | 4,332,091 | | | | 2,031,914 | |
| Dividends on preferred shares | | | (2,114,063 | ) | | | (2,114,063 | ) |
| Net income (loss) attributable to common shareholders | | $ | 2,218,028 | | | $ | (82,149 | ) |
| | | | | | | | | |
| Net income (loss) per common share attributable to Kite Realty Group Trust common shareholders – basic and diluted | | | | | |
| Income from continuing operations attributable to common shareholders | | $ | 0.02 | | | $ | 0.00 | |
| Loss from discontinued operations attributable to common shareholders | | | — | | | | (0.00 | ) |
| Net income (loss) attributable to common shareholders | | $ | 0.02 | | | $ | (0.00 | ) |
| | | | | | | | | |
| Weighted average common shares outstanding – basic | | | 131,023,592 | | | | 77,832,499 | |
| Weighted average common shares outstanding – diluted | | | 131,226,326 | | | | 77,832,499 | |
| Dividends declared per common share | | $ | 0.065 | | | $ | 0.060 | |
| | | | | | | | | |
| Income (loss) attributable to Kite Realty Group Trust common shareholders: | | | | | |
| Income from continuing operations | | $ | 2,218,028 | | | $ | 303,042 | |
| Loss from discontinued operations | | | — | | | | (385,191 | ) |
| Net income (loss) attributable to Kite Realty Group Trust common shareholders | | $ | 2,218,028 | | | $ | (82,149 | ) |
| | | | | | | | | |
| |
| * | Note: The Financial Accounting Standards Board (“FASB”) has issued ASU 2014-08 regarding the criteria for reporting discontinued operations. The Company has elected to early adopt this standard. Therefore, beginning in the first quarter of 2014, activity related to individual properties sold or held for sale will no longer be included as discontinued operations on the consolidated statements of operations unless such activity represents a strategic shift that has or will have a major effect on the Company’s operations and financial results. |
p. PR-8
Kite Realty Group Trust Supplemental Financial and Operating Statistics –3/31/14
Kite Realty Group Trust
Funds From Operations
For the Three Months Ended March 31, 2014 and 2013
(Unaudited)
| | | Three Months Ended March 31, | |
| | | 2014 | | | 2013 | |
| Consolidated net income | | $ | 4,471,003 | | | $ | 2,056,768 | |
| Less dividends on preferred shares | | | (2,114,063 | ) | | | (2,114,063 | ) |
| Less net income attributable to noncontrolling interests in properties | | | (26,633 | ) | | | (31,977 | ) |
| Less gain on sale of operating properties | | | (6,688,110 | ) | | | — | |
| Add depreciation and amortization, net of noncontrolling interests | | | 17,342,631 | | | | 11,561,282 | |
Funds From Operations of the Kite Portfolio1 | | | 12,984,828 | | | | 11,472,010 | |
| Less redeemable noncontrolling interests in Funds From Operations | | | (624,852 | ) | | | (910,025 | ) |
Funds From Operations allocable to the Company1 | | $ | 12,359,976 | | | $ | 10,561,985 | |
| | | | | | | | | |
| Basic and Diluted FFO per share of the Kite Portfolio | | $ | 0.09 | | | $ | 0.14 | |
| | | | | | | | | |
| Funds From Operations of the Kite Portfolio | | $ | 12,984,828 | | | $ | 11,472,010 | |
| Add back: merger and acquisition costs | | | 4,480,389 | | | | — | |
| Add back: accelerated amortization of deferred financing fees | | | — | | | | 171,572 | |
| Funds From Operations of the Kite Portfolio, as adjusted | | $ | 17,465,217 | | | $ | 11,643,582 | |
| Basic and Diluted FFO per share of the Kite Portfolio, as adjusted | | $ | 0.13 | | | $ | 0.14 | |
| | | | | | | | | |
| Basic weighted average Common Shares outstanding | | | 131,023,592 | | | | 77,832,499 | |
| Diluted weighted average Common Shares outstanding | | | 131,226,326 | | | | 78,208,159 | |
| Basic weighted average Common Shares and Units outstanding | | | 137,666,409 | | | | 84,570,950 | |
| Diluted weighted average Common Shares and Units outstanding | | | 137,869,144 | | | | 84,946,610 | |
| | | | | | | | | |
| ____________________ |
| 1 | “Funds From Operations of the Operating Partnership” measures 100% of the operating performance of the Operating Partnership’s real estate properties and construction and service subsidiaries in which the Company owns an interest. “Funds From Operations allocable to the Company” reflects a reduction for the redeemable noncontrolling weighted average diluted interest in the Operating Partnership. |
| | |
p. PR-9
Kite Realty Group Trust Supplemental Financial and Operating Statistics –3/31/14
Kite Realty Group Trust
Same Property Net Operating Income
For the Three Months Ended March 31, 2014 and 2013
(Unaudited)
| | | Three Months Ended March 31, | |
| | | 2014 | | | 2013 | | | % Change | |
Number of properties at period end1 | | | 50 | | | | 50 | | | | |
| | | | | | | | | | | | |
| Leased percentage at period end | | | 96.4 | % | | | 95.1 | % | | | |
| Occupied Percentage at period end | | | 92.9 | % | | | 91.6 | % | | | |
| Minimum rent | | $ | 18,772,884 | | | $ | 17,982,145 | | | | |
| Tenant recoveries | | | 6,180,033 | | | | 5,630,192 | | | | |
| Other income | | | 776,698 | | | | 683,679 | | | | |
| | | | 25,729,615 | | | | 24,296,016 | | | | |
| | | | | | | | | | | | |
| Property operating expenses | | | 5,850,808 | | | | 5,324,738 | | | | |
| Real estate taxes | | | 3,562,355 | | | | 3,386,613 | | | | |
| | | | 9,413,163 | | | | 8,711,351 | | | | |
Net operating income – same properties (50 properties)2 | | | 16,316,452 | | | | 15,584,665 | | | | 4.7 | % |
| | | | | | | | | | | | | |
| Reconciliation to Most Directly Comparable GAAP Measure: | | | | | | | | | | | | |
| Net operating income - same properties | | $ | 16,316,452 | | | $ | 15,584,665 | | | | | |
| Net operating income - non-same activity | | | 13,915,181 | | | | 6,958,475 | | | | | |
| Other income (expense), net | | | (39,798 | ) | | | (38,086 | ) | | | | |
| General and administrative expense | | | (3,106,102 | ) | | | (2,139,949 | ) | | | | |
| Merger and acquisition costs | | | (4,480,389 | ) | | | (176,899 | ) | | | | |
| Depreciation expense | | | (17,439,606 | ) | | | (11,384,964 | ) | | | | |
| Interest expense | | | (7,382,845 | ) | | | (6,328,108 | ) | | | | |
| Discontinued operations | | | - | | | | (418,366 | ) | | | | |
| Gain on sales of operating properties | | | 6,688,110 | | | | - | | | | | |
| Net income attributable to noncontrolling interests | | | (138,912 | ) | | | (24,854 | ) | | | | |
| Dividends on preferred shares | | | (2,114,063 | ) | | | (2,114,063 | ) | | | | |
| Net income (loss) attributable to common shareholders | | $ | 2,218,028 | | | $ | (82,149 | ) | | | | |
| ____________________ |
| 1 | Same Property analysis excludes operating properties in redevelopment. |
| | |
| 2 | Excludes net gains from outlot sales, straight-line rent revenue, bad debt expense, lease termination fees, amortization of lease intangibles and significant prior period expense recoveries and adjustments, if any. |
| | |
| | |
The Company believes that Net Operating Income is helpful to investors as a measure of its operating performance because it excludes various items included in net income that do not relate to or are not indicative of its operating performance, such as depreciation and amortization, interest expense, and impairment, if any. The Company believes that Same Property NOI is helpful to investors as a measure of its operating performance because it includes only the NOI of properties that have been owned for the full period presented, which eliminates disparities in net income due to the redevelopment, acquisition or disposition of properties during the particular period presented, and thus provides a more consistent metric for the comparison of the Company's properties. NOI and Same Property NOI should not, however, be considered as alternatives to net income (calculated in accordance with GAAP) as indicators of the Company's financial performance.
Kite Realty Group Trust is a full-service, vertically integrated real estate company engaged primarily in the development, construction, acquisition, ownership and operation of high-quality neighborhood and community shopping centers in selected markets in the United States. We are organized as a real estate investment trust ("REIT") for federal income tax purposes. As of March 31, 2014, we owned interests in 68 properties totaling approximately 11.8 million square feet and an additional 0.7 million square feet in two development projects currently under construction.
Our strategy is to maximize the cash flow of our operating properties, successfully complete the construction and lease-up of our development portfolio and identify additional growth opportunities in the form of acquisitions and redevelopments. New investments are focused in the shopping center sector in markets where we currently operate and where we believe we can leverage existing infrastructure and relationships to generate attractive risk-adjusted returns.
This Quarterly Financial Supplement contains historical information of Kite Realty Group Trust (“the Company” or “KRG”) and is intended to supplement the Company’s Quarterly Report on Form 10-Q for the quarter ended March 31, 2014 to be filed on or about May 9, 2014, which should be read in conjunction with this supplement. The supplemental information is unaudited, although it reflects all adjustments which, in the opinion of management, are necessary for a fair presentation of operating results for the interim periods.
This supplemental information package contains certain forward-looking statements within the meaning of Section 27A of the Securities Act of 1933 and Section 21E of the Securities Exchange Act of 1934. Such statements are based on assumptions and expectations that may not be realized and are inherently subject to risks, uncertainties and other factors, many of which cannot be predicted with accuracy and some of which might not even be anticipated. Future events and actual results, performance, transactions or achievements, financial or otherwise, may differ materially from the results, performance, transactions or achievements expressed or implied by the forward-looking statements. Risks, uncertainties and other factors that might cause such differences, some of which could be material, include, but are not limited to:
The Company undertakes no obligation to publicly update or revise these forward-looking statements, whether as a result of new information, future events or otherwise.
Funds from Operations (FFO) is a widely used performance measure for real estate companies and is provided here as a supplemental measure of operating performance. We calculate FFO in accordance with the best practices described in the April 2002 National Policy Bulletin of the National Association of Real Estate Investment Trusts (NAREIT), which we refer to as the White Paper. The White Paper defines FFO as net income (determined in accordance with generally accepted accounting principles (GAAP)), excluding gains (or losses) from sales and impairments of depreciated property, plus depreciation and amortization, and after adjustments for unconsolidated partnerships and joint ventures.
Considering the nature of our business as a real estate owner and operator, we believe that FFO is helpful to investors in measuring our operational performance because it excludes various items included in net income that do not relate to or are not indicative of our operating performance, such as gains or losses from sales of depreciated property and depreciation and amortization, which can make periodic and peer analyses of operating performance more difficult. For informational purposes, we have also provided FFO adjusted for the write-off of deferred financing costs in the first quarter of 2013 and costs incurred in the first quarter of 2014 related to the pending merger with Inland Diversified. We believe this supplemental information provides a meaningful measure of our operating performance. We believe our presentation of adjusted FFO provides investors with another financial measure that may facilitate comparison of operating performance between periods and among our peer companies. FFO should not be considered as an alternative to net income (determined in accordance with GAAP) as an indicator of our financial performance, is not an alternative to cash flow from operating activities (determined in accordance with GAAP) as a measure of our liquidity, and is not indicative of funds available to satisfy our cash needs, including our ability to make distributions. Our computation of FFO may not be comparable to FFO reported by other REITs that do not define the term in accordance with the current NAREIT definition or that interpret the current NAREIT definition differently than we do.
Net operating income (NOI) is provided here as a supplemental measure of operating performance. NOI is defined as property revenues less property operating expenses, excluding depreciation and amortization, interest expense, impairment, and other items. We believe this presentation of NOI is helpful to investors as a measure of our operational performance because it is widely used in the real estate industry to measure the performance of real estate assets without regard to various items, included in net income, that do not relate to or are not indicative of operating performance, such as depreciation and amortization, which can vary depending upon accounting methods and book value of assets. We also believe NOI helps our investors to meaningfully compare the results of our operating performance from period to period by removing the impact of our capital structure (primarily interest expense on our outstanding indebtedness) and depreciation of the basis in our assets from our operating results. NOI should not, however, be considered as an alternative to net income (determined in accordance with GAAP) as an indicator of our financial performance.
The Company believes that Net Operating Income is helpful to investors as a measure of its operating performance because it excludes various items included in net income that do not relate to or are not indicative of its operating performance, such as depreciation and amortization, interest expense, and impairment, if any. The Company believes that Same Property NOI is helpful to investors as a measure of its operating performance because it includes only the NOI of properties that have been owned for the full period presented, which eliminates disparities in net income due to the redevelopment, acquisition or disposition of properties during the particular period presented, and thus provides a more consistent metric for the comparison of the Company's properties. NOI and Same Property NOI should not, however, be considered as alternatives to net income (calculated in accordance with GAAP) as indicators of the Company's financial performance.
Note: Earnings guidance assumptions exclude the effects of the pending merger with Inland Diversified and merger-related costs.