QUARTERLY FINANCIAL SUPPLEMENT
SEPTEMBER 30, 2014
KITE REALTY GROUP TRUST
INVESTOR RELATIONS CONTACTS:
Dan Sink, Chief Financial Officer
Margaret Kofkoff, Senior Financial Analyst & Investor Relations
QUARTERLY FINANCIAL SUPPLEMENT – SEPTEMBER 30, 2014
PAGE NO. | | TABLE OF CONTENTS |
| | | |
| 3 | | Corporate Profile |
| 4 | | Contact Information |
| 5 | | Important Notes |
| 6 | | Corporate Structure Chart |
| 7 | | Consolidated Balance Sheets |
| 8 | | Consolidated Statements of Operations for the Three and Nine Months Ended September 30 |
| 9 | | Funds from Operations and Adjusted Funds from Operations for the Three and Nine Months Ended September 30 |
| 10 | | Other Financial Information |
| 11 | | Market Capitalization |
| 11 | | Ratio of Debt to Total Undepreciated Assets as of September 30 |
| 11 | | Ratio of Company Share of Net Debt to EBITDA as of September 30 |
| 12 | | Same Property Net Operating Income for the Three and Nine Months Ended September 30 |
| 13 | | Net Operating Income by Quarter |
| 14 | | Consolidated Joint Venture Summary |
| 15 | | Summary of Outstanding Debt as of September 30 |
| 16 | | Maturity Schedule of Outstanding Debt as of September 30 |
| 19 | | Top 10 Retail Tenants by Gross Leasable Area |
| 20 | | Top 25 Tenants by Annualized Base Rent |
| 21 | | Retail Leasing Summary |
| 22 | | Lease Expirations – Operating Portfolio |
| 23 | | Lease Expirations – Retail Anchor Tenants |
| 24 | | Lease Expirations – Retail Shops |
| 25 | | Lease Expirations – Office Tenants |
| 26 | | Summary Retail Portfolio Statistics Including Joint Venture Properties |
| 27 | | Summary Office Portfolio Statistics |
| 28 | | Development Projects |
| 29 | | Redevelopment Projects |
| 30 | | 2014 Property Dispositions |
| 31 | | Geographic Diversification – Operating Portfolio |
| 32 | | Operating Retail Portfolio Summary Report |
| 37 | | Operating Office Properties |
| 38 | | Earnings Guidance |
| | | |

CORPORATE PROFILE
General Description
Kite Realty Group Trust is a full-service, vertically integrated real estate investment trust (REIT) engaged primarily in the ownership and operation, acquisition, development and redevelopment of high-quality neighborhood and community shopping centers in select markets in the United States. As of September 30, 2014, we owned interests in 129 properties totaling approximately 26 million square feet and an additional 0.7 million square feet in three development projects currently under construction.
Our strategy is to maximize the cash flow of our operating properties, successfully complete the construction and lease-up of our development portfolio and identify additional growth opportunities in the form of acquisitions and redevelopments. New investments are focused in the shopping center sector in markets where we currently operate and where we believe we can leverage our existing infrastructure and relationships to generate attractive risk-adjusted returns.
Company Highlights as of September 30, 2014
| | # of Properties | Total GLA /NRA1 | Owned GLA /NRA1 |
| | | | |
Operating Retail Properties(2) | 124 | 25,213,668 | 16,935,582 |
| Operating Office Properties | 2 | 386,852 | 386,852 |
| Redevelopment Properties | | | |
| - Under Construction | 1 | 164,665 | 162,693 |
| - Pending Construction | 2 | 212,163 | 204,463 |
| Subtotal Redevelopment Properties | 3 | 376,828 | 367,156 |
| Total Operating and Redevelopment Properties | 129 | 25,977,348 | 17,689,590 |
| | | | |
| Development Projects: | | | |
| - Under Construction | 3 | 723,976 | 502,553 |
| Subtotal Development Properties | 3 | 723,976 | 502,553 |
| Total All Properties | 132 | 26,701,324 | 18,192,143 |
| | | | |
| | Retail | Office | Total1 |
| | | | |
Operating Properties – Leased Percentage1 | 94.9% | 95.2% | 94.9% |
| | | | |
| States | | | 26 |
Stock Listing: New York Stock Exchange symbol: KRG
| ____________________ |
| 1 | Excludes square footage of structures located on land owned by the company and ground leased to tenants. |
| 2 | Includes 15 properties held for sale with owned square footage 1,545,675 and a leased percentage of 95.3%. |
p. 3
Kite Realty Group Trust Supplemental Financial and Operating Statistics –9/30/14
Corporate Office
30 South Meridian Street, Suite 1100
Indianapolis, IN 46204
(888) 577-5600
(317) 577-5600
www.kiterealty.com
| Investor Relations Contacts: | | Analyst Coverage: | | Analyst Coverage: |
| | | | | |
| Dan Sink, Chief Financial Officer | | Bank of America/Merrill Lynch | | Janney Capital Market |
| Kite Realty Group Trust | | Mr. Jeffrey Spector/Mr. Craig Schmidt | | Mr. Michael Gorman |
| 30 South Meridian Street, Suite 1100 | (646) 855-1363/(646) 855-3640 | (215) 665-6224 |
| Indianapolis, IN 46204 | | jeff.spector@baml.com | | mgorman@janney.com |
| (317) 577-5609 | | craig.schmidt@baml.com | | |
| dsink@kiterealty.com | | | | KeyBanc Capital Markets |
| | | BMO Capital Markets | | Mr. Jordan Sadler/Mr. Todd Thomas |
| Margaret Kofkoff, CFA | | Mr. Paul E. Adornato | | (917) 368-2280/(917) 368-2286 |
| Senior Financial Analyst & | | (212) 885-4170 | | tthomas@keybanccm.com |
| Investor Relations | | paul.adornato@bmo.com | | jsadler@keybanccm.com |
| Kite Realty Group Trust | | | | |
| 30 South Meridian Street, Suite 1100 | | Capital One Securities, Inc. | | Raymond James |
| Indianapolis, IN 46204 | | Mr. Christopher Lucas/Mr. Vineet Khanna | | Mr. Paul Puryear/Mr. R. J. Milligan |
| (317) 713-7644 | | (571) 633-8151/(571) 835-7013 | | (727) 567-2253/(727) 567-2660 |
| mkofkoff@kiterealty.com | | christopher.lucas@capitalone.com | | paul.puryear@raymondjames.com |
| | | vineet.khanna@capitalone.com | | richard.milligan@raymondjames.com |
| Transfer Agent: | | | | |
| | | Citigroup Global Markets | | Stifel, Nicolaus & Company, Inc. |
| Broadridge Financial Solutions | | Mr. Michael Bilerman/Ms. Christy McElroy | | Mr. Nathan Isbee/Ms. Jennifer Hummert |
| Ms. Kristen Tartaglione | | (212) 816-1383/(212) 816-6981 | | (443) 224-1346 /(443) 224-1288 |
2 Journal Square, 7th Floor | | michael.bilerman@citigroup.com | | nisbee@stifel.com |
| Jersey City, NJ 07306 | | christy.mcelroy@citigroup.com | | hummertj@stifel.com |
| (201) 714-8094 | | | | |
| | | Hilliard Lyons | | Wells Fargo Securities, LLC |
| Stock Specialist: | | Ms. Carol L. Kemple | | Mr. Jeffrey J. Donnelly, CFA /Ms. Tamara Fique |
| | | (502) 588-1839 | | (617) 603-4262/(443) 263-6568 |
| Barclays Capital | | ckemple@hilliard.com | | jeff.donnelly@wellsfargo.com |
| 45 Broadway | | | | tamara.fique@wellsfargo.com |
| 20th Floor | | | | |
| New York, NY 10006 | | | | |
| (646) 333-7000 | | | | |
| | | | | |
| | | | | |
p. 4
Kite Realty Group Trust Supplemental Financial and Operating Statistics –9/30/14
Interim Information
This Quarterly Financial Supplement contains historical information of Kite Realty Group Trust (“the Company” or “KRG”) and is intended to supplement the Company’s Quarterly Report on Form 10-Q for the quarter ended September 30, 2014 to be filed on or about November 7, 2014, which should be read in conjunction with this supplement. The supplemental information is unaudited, although it reflects all adjustments which, in the opinion of management, are necessary for a fair presentation of operating results for the interim periods.
Forward-Looking Statements
This supplemental information package contains certain forward-looking statements within the meaning of Section 27A of the Securities Act of 1933 and Section 21E of the Securities Exchange Act of 1934. Such statements are based on assumptions and expectations that may not be realized and are inherently subject to risks, uncertainties and other factors, many of which cannot be predicted with accuracy and some of which might not even be anticipated. Future events and actual results, performance, transactions or achievements, financial or otherwise, may differ materially from the results, performance, transactions or achievements expressed or implied by the forward-looking statements. Risks, uncertainties and other factors that might cause such differences, some of which could be material, include, but are not limited to:
| · | national and local economic, business, real estate and other market conditions, particularly in light of the recent slowing of growth in the U.S. economy; |
| · | financing risks, including the availability of and costs associated with sources of liquidity; |
| · | the Company’s ability to refinance, or extend the maturity dates of, its indebtedness; |
| · | the level and volatility of interest rates; |
| · | the financial stability of tenants, including their ability to pay rent and the risk of tenant bankruptcies; |
| · | the competitive environment in which the Company operates; |
| · | acquisition, disposition, development and joint venture risks; |
| · | property ownership and management risks; |
| · | the Company’s ability to maintain its status as a real estate investment trust (“REIT”) for federal income tax purposes; |
| · | potential environmental and other liabilities; |
| · | impairment in the value of real estate property the Company owns; |
| · | risks related to the geographical concentration of our properties in Indiana, Florida, Texas and North Carolina; |
| · | other factors affecting the real estate industry generally; and |
| · | other risks identified in reports the Company files with the Securities and Exchange Commission (“the SEC”) or in other documents that it publicly disseminates, including, in particular, the section titled “Risk Factors” in our Annual Report on Form |
10-K for the fiscal year ended December 31, 2013, and in our quarterly reports on Form 10-Q.
The Company undertakes no obligation to publicly update or revise these forward-looking statements, whether as a result of new information, future events or otherwise.
Funds from Operations
Funds from Operations (FFO) is a widely used performance measure for real estate companies and is provided here as a supplemental measure of operating performance. We calculate FFO in accordance with the best practices described in the April 2002 National Policy Bulletin of the National Association of Real Estate Investment Trusts (NAREIT), which we refer to as the White Paper. The White Paper defines FFO as net income (determined in accordance with generally accepted accounting principles (GAAP)), excluding gains (or losses) from sales and impairments of depreciated property, plus depreciation and amortization, and after adjustments for unconsolidated partnerships and joint ventures.
Considering the nature of our business as a real estate owner and operator, we believe that FFO is helpful to investors in measuring our operational performance because it excludes various items included in net income that do not relate to or are not indicative of our operating performance, such as gains or losses from sales of depreciated property and depreciation and amortization, which can make periodic and peer analyses of operating performance more difficult. For informational purposes, we have also provided FFO adjusted for the write-off of deferred financing costs in the first quarter of 2013 and costs incurred in the first, second and third quarters of 2014 related to our merger with Inland Diversified Real Estate Trust . We believe this supplemental information provides a meaningful measure of our operating performance. We believe our presentation of adjusted FFO provides investors with another financial measure that may facilitate comparison of operating performance between periods and among our peer companies. FFO should not be considered as an alternative to net income (determined in accordance with GAAP) as an indicator of our financial performance, is not an alternative to cash flow from operating activities (determined in accordance with GAAP) as a measure of our liquidity, and is not indicative of funds available to satisfy our cash needs, including our ability to make distributions. Our computation of FFO may not be comparable to FFO reported by other REITs that do not define the term in accordance with the current NAREIT definition or that interpret the current NAREIT definition differently than we do.
Net Operating Income
Net operating income (NOI) is provided here as a supplemental measure of operating performance. NOI is defined as property revenues less property operating expenses, excluding depreciation and amortization, interest expense, impairment, and other items. We believe this presentation of NOI is helpful to investors as a measure of our operational performance because it is widely used in the real estate industry to measure the performance of real estate assets without regard to various items, included in net income, that do not relate to or are not indicative of operating performance, such as depreciation and amortization, which can vary depending upon accounting methods and book value of assets. We also believe NOI helps our investors to meaningfully compare the results of our operating performance from period to period by removing the impact of our capital structure (primarily interest expense on our outstanding indebtedness) and depreciation of the basis in our assets from our operating results. NOI should not, however, be considered as an alternative to net income (determined in accordance with GAAP) as an indicator of our financial performance.
p. 5
Kite Realty Group Trust Supplemental Financial and Operating Statistics –9/30/14
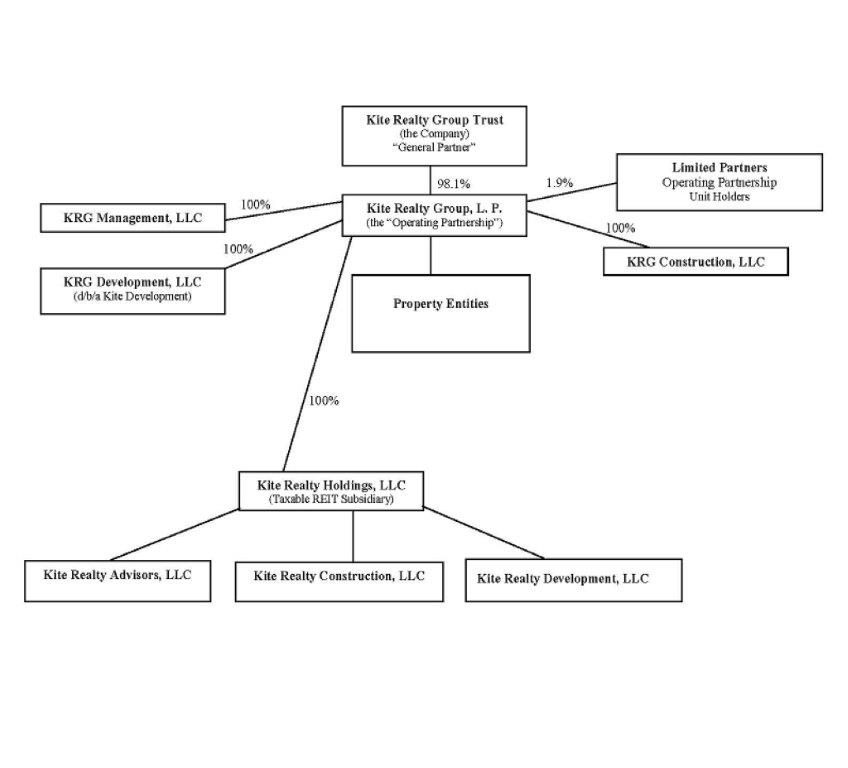
CORPORATE STRUCTURE CHART – SEPTEMBER 30, 2014
p. 6
Kite Realty Group Trust Supplemental Financial and Operating Statistics –9/30/14
CONSOLIDATED BALANCE SHEETS (UNAUDITED)
| | | September 30, 2014 | | December 31, 2013 | |
| Assets: | | | | | |
| | | | | | |
| Investment properties, at cost | | $ | 3,673,832,165 | | $ | 1,877,058,271 | |
| Less: accumulated depreciation | | | (282,693,584 | ) | | (232,580,267 | ) |
| | | | 3,391,138,581 | | | 1,644,478,004 | |
| Cash and cash equivalents | | | 31,213,429 | | | 18,134,320 | |
| Tenant receivables, including accrued straight-line rent of $17,304,875 and $14,490,070, respectively, net of allowance for uncollectible accounts | | | 38,622,387 | | | 24,767,556 | |
| Other receivables | | | 4,891,082 | | | 4,566,679 | |
| Restricted cash and escrow deposits | | | 17,442,007 | | | 11,046,133 | |
| Deferred costs, net | | | 168,237,357 | | | 56,387,586 | |
| Prepaid and other assets | | | 12,072,887 | | | 4,546,752 | |
Assets held for sale2 | | | 344,466,022 | | | - | |
| Total Assets | | $ | 4,008,083,752 | | $ | 1,763,927,030 | |
| Liabilities and Shareholders’ Equity: | | | | | | | |
Mortgage and other indebtedness1 | | $ | 1,556,495,902 | | $ | 857,144,074 | |
| Accounts payable and accrued expenses | | | 87,823,304 | | | 61,437,187 | |
| Deferred revenue and other liabilities | | | 141,864,601 | | | 44,313,402 | |
Liabilities held for sale2 | | | 176,635,843 | | | - | |
| Total Liabilities | | | 1,962,819,650 | | | 962,894,663 | |
| | | | | | | | |
| Commitments and contingencies | | | | | | | |
| | | | | | | | |
| Limited Partners’ interests in the Operating Partnership and other redeemable noncontrolling interests | | | 109,553,889 | | | 43,927,540 | |
| | | | | | | | |
| Shareholders’ Equity: | | | | | | | |
| Kite Realty Group Trust Shareholders’ Equity: | | | | | | | |
| Preferred Shares, $.01 par value, 40,000,000 shares authorized, 4,100,000 and 4,100,000 shares issued and outstanding at September 30, 2014 and December 31, 2013, respectively | | | 102,500,000 | | | 102,500,000 | |
| Common Shares, $.01 par value, 450,000,000 shares authorized, 83,459,618 shares and 32,706,554 shares issued and outstanding at September 30, 2014 and December 31, 2013, respectively | | | 834,596 | | | 327,066 | |
| Additional paid in capital | | | 2,059,063,388 | | | 822,507,368 | |
| Accumulated other comprehensive income | | | 1,151,247 | | | 1,352,850 | |
| Accumulated deficit | | | (231,202,890 | ) | | (173,130,113 | ) |
| Total Kite Realty Group Trust Shareholders’ Equity | | | 1,932,346,341 | | | 753,557,171 | |
| Noncontrolling Interests | | | 3,363,872 | | | 3,547,656 | |
| Total Equity | | | 1,935,710,213 | | | 757,104,827 | |
| Total Liabilities and Equity | | $ | 4,008,083,752 | | $ | 1,763,927,030 | |
| ____________________ |
| 1 | Includes debt premium of $27.5 million at September 30, 2014. |
| 2 | See Other Financial Information for details. |
p. 7
Kite Realty Group Trust Supplemental Financial and Operating Statistics –9/30/14
CONSOLIDATED STATEMENTS OF OPERATIONS – THREE AND NINE MONTHS (UNAUDITED)1
| | | Three Months Ended September 30, | | | Nine Months Ended September 30, | |
| | | 2014 | | | 2013 | | | 2014 | | | 2013 | |
| Revenue: | | | | | | | | | | | | |
| Minimum rent | | $ | 69,033,444 | | | $ | 23,726,468 | | | $ | 131,515,166 | | | $ | 66,858,966 | |
| Tenant reimbursements | | | 17,605,172 | | | | 6,257,937 | | | | 35,083,261 | | | | 17,350,746 | |
| Other property related revenue | | | 1,938,247 | | | | 2,568,468 | | | | 5,481,402 | | | | 9,300,135 | |
| Total revenue | | | 88,576,863 | | | | 32,552,873 | | | | 172,079,829 | | | | 93,509,847 | |
| Expenses: | | | | | | | | | | | | | | | | |
| Property operating | | | 11,850,627 | | | | 5,448,738 | | | | 26,056,661 | | | | 15,582,301 | |
| Real estate taxes | | | 10,631,555 | | | | 3,724,116 | | | | 20,047,713 | | | | 10,684,894 | |
| General, administrative and other | | | 3,938,758 | | | | 2,114,828 | | | | 9,358,218 | | | | 6,069,063 | |
| Merger and acquisition costs | | | 19,088,590 | | | | 153,314 | | | | 26,849,077 | | | | 566,826 | |
| Depreciation and amortization | | | 44,382,793 | | | | 15,373,538 | | | | 81,559,506 | | | | 40,565,934 | |
| Total expenses | | | 89,892,323 | | | | 26,814,534 | | | | 163,871,175 | | | | 73,469,018 | |
| | | | | | | | | | | | | | | | | |
| Operating (loss) income | | | (1,315,460 | ) | | | 5,738,339 | | | | 8,208,654 | | | | 20,040,829 | |
| Interest expense | | | (15,386,192 | ) | | | (7,541,534 | ) | | | (30,291,028 | ) | | | (20,812,460 | ) |
| Income tax expense of taxable REIT subsidiary | | | (14,144 | ) | | | (30,596 | ) | | | (36,612 | ) | | | (106,477 | ) |
| Other expense, net | | | (13,070 | ) | | | (47,013 | ) | | | (119,469 | ) | | | (39,151 | ) |
| Loss from continuing operations | | | (16,728,866 | ) | | | (1,880,804 | ) | | | (22,238,455 | ) | | | (917,259 | ) |
| Discontinued operations: | | | | | | | | | | | | | | | | |
| Operating income from discontinued operations | | | - | | | | 1,393,616 | | | | - | | | | 604,454 | |
| Impairment charge | | | - | | | | - | | | | - | | | | (5,371,427 | ) |
| Non-cash gain on debt extinguishment | | | - | | | | 1,241,724 | | | | - | | | | 1,241,724 | |
| Gain on sale of operating property | | | - | | | | 486,540 | | | | 3,198,772 | | | | 486,540 | |
| Income (loss) from discontinued operations | | | - | | | | 3,121,880 | | | | 3,198,772 | | | | (3,038,709 | ) |
| (Loss) income before gain on sale of operating properties | | | (16,728,866 | ) | | | 1,241,076 | | | | (19,039,683 | ) | | | (3,955,968 | ) |
| Gain on sale of operating properties | | | 2,749,403 | | | | - | | | | 6,335,518 | | | | - | |
| Net (loss) income | | | (13,979,463 | ) | | | 1,241,076 | | | | (12,704,165 | ) | | | (3,955,968 | ) |
| Less: Net (income) loss attributable to noncontrolling interest | | | (304,456 | ) | | | 15,174 | | | | (223,865 | ) | | | 651,327 | |
| Less: Dividends on preferred shares | | | (2,114,063 | ) | | | (2,114,063 | ) | | | (6,342,188 | ) | | | (6,342,188 | ) |
| Net loss attributable to Kite Realty Group Trust common shareholders | | $ | (16,397,982 | ) | | $ | (857,813 | ) | | $ | (19,270,218 | ) | | $ | (9,646,829 | ) |
| | | | | | | | | | | | | | | | | |
| (Loss) income per common share– basic and diluted: | | | | | | | | | | | | | | | | |
| Continuing operations | | $ | (0.20 | ) | | $ | (0.16 | ) | | $ | (0.45 | ) | | $ | (0.31 | ) |
| Discontinued operations | | | - | | | | 0.12 | | | | 0.06 | | | | (0.13 | ) |
| | | $ | (0.20 | ) | | $ | (0.04 | ) | | $ | (0.39 | ) | | $ | (0.44 | ) |
| | | | | | | | | | | | | | | | | |
| Weighted average common shares outstanding – basic and diluted | | | 83,455,900 | | | | 23,450,974 | | | | 49,884,469 | | | | 21,906,686 | |
| Common dividends declared per common share | | $ | 0.26 | | | $ | 0.24 | | | $ | 0.76 | | | $ | 0.72 | |
| | | | | | | | | | | | | | | | | |
| Amounts attributable to Kite Realty Group Trust common shareholders: | | | | | | | | | | | | | | | | |
| Loss from continuing operations | | $ | (16,397,982 | ) | | $ | (3,771,352 | ) | | $ | (22,366,523 | ) | | $ | (6,824,266 | ) |
| Income (loss) from discontinued operations | | | - | | | | 2,913,539 | | | | 3,096,305 | | | | (2,822,563 | ) |
| Net loss | | $ | (16,397,982 | ) | | $ | (857,813 | ) | | $ | (19,270,218 | ) | | $ | (9,646,829 | ) |
| ____________________ |
| 1 | Share and per share information has been restated for the effects of the Company’s one-for-four reverse share split in August 2014. |
p. 8
Kite Realty Group Trust Supplemental Financial and Operating Statistics –9/30/14
FUNDS FROM OPERATIONS AND ADJUSTED FUNDS FROM OPERATIONS (‘AFFO”)2
| | | Three Months Ended September 30, | | | Nine Months Ended September 30, | |
| | | 2014 | | | 2013 | | | 2014 | | | 2013 | |
| Funds From Operations | | | | | | | | | | | | |
| Consolidated net (loss) income | | $ | (13,979,463 | ) | | $ | 1,241,076 | | | $ | (12,704,165 | ) | | $ | (3,955,968 | ) |
| Less: dividends on preferred shares | | | (2,114,063 | ) | | | (2,114,063 | ) | | | (6,342,188 | ) | | | (6,342,188 | ) |
| Less: net income attributable to noncontrolling interests in properties | | | (678,828 | ) | | | (27,978 | ) | | | (757,069 | ) | | | (89,750 | ) |
| Less: gain on sale of operating properties | | | (2,749,403 | ) | | | (486,540 | ) | | | (9,534,290 | ) | | | (486,540 | ) |
| Add: impairment charge | | | - | | | | - | | | | - | | | | 5,371,427 | |
| Add: depreciation and amortization of consolidated entities, net of noncontrolling interests | | | 44,208,215 | | | | 15,379,237 | | | | 81,160,870 | | | | 41,019,039 | |
| Funds From Operations of the Operating Partnership | | | 24,686,458 | | | | 13,991,732 | | | | 51,823,158 | | | | 35,516,020 | |
| Less Limited Partners' interests in Funds From Operations | | | (353,750 | ) | | | (942,811 | ) | | | (1,658,341 | ) | | | (2,526,288 | ) |
Funds From Operations allocable to the Company1 | | $ | 24,332,708 | | | $ | 13,048,921 | | | $ | 50,164,817 | | | $ | 32,989,732 | |
| Basic FFO per share of the Operating Partnership (NAREIT definition) | | $ | 0.29 | | | $ | 0.56 | | | $ | 1.01 | | | $ | 1.51 | |
| Diluted FFO per share of the Operating Partnership (NAREIT definition) | | $ | 0.29 | | | $ | 0.56 | | | $ | 1.00 | | | $ | 1.50 | |
| | | | | | | | | | | | | | | | | |
| Funds From Operations of the Operating Partnership | | $ | 24,686,458 | | | $ | 13,991,732 | | | $ | 51,823,158 | | | $ | 35,516,020 | |
| Add write-off of loan fees on early repayment of debt | | | - | | | | 317,057 | | | | - | | | | 488,629 | |
| Add: Merger related costs | | | 19,088,590 | | | | - | | | | 26,849,077 | | | | - | |
| Less: Gain on debt extinguishment | | | - | | | | (1,241,724 | ) | | | - | | | | (1,241,724 | ) |
| Funds From Operations of the Kite Portfolio as adjusted | | $ | 43,775,048 | | | $ | 13,067,065 | | | $ | 78,672,235 | | | $ | 34,762,925 | |
| Basic FFO per share of the Operating Partnership, as adjusted | | $ | 0.51 | | | $ | 0.52 | | | $ | 1.53 | | | $ | 1.47 | |
| Diluted FFO per share of the Operating Partnership, as adjusted | | $ | 0.51 | | | $ | 0.52 | | | $ | 1.52 | | | $ | 1.47 | |
| Basic weighted average Common Shares outstanding | | | 83,455,900 | | | | 23,450,974 | | | | 49,884,469 | | | | 21,906,686 | |
| Diluted weighted average Common Shares outstanding | | | 83,718,735 | | | | 23,517,222 | | | | 50,145,571 | | | | 21,976,131 | |
| Basic weighted average Common Shares and Units outstanding | | | 85,114,237 | | | | 25,132,645 | | | | 51,543,952 | | | | 23,589,574 | |
| Diluted weighted average Common Shares and Units outstanding | | | 85,377,073 | | | | 25,198,894 | | | | 51,805,054 | | | | 23,659,019 | |
| | | | | | | | | | | | | | | | | |
| Adjusted Funds from Operations (AFFO) | | | | | | | | | | | | | | | | |
| | | | | | | | | | | | | | | | | |
| Total FFO of the Kite Portfolio, as adjusted | | $ | 43,775,048 | | | $ | 13,067,065 | | | $ | 78,672,235 | | | $ | 34,762,925 | |
| Add: | | | | | | | | | | | | | | | | |
| Depreciation of non-real estate assets | | | 134,645 | | | | 81,508 | | | | 360,470 | | | | 268,762 | |
| Amortization of deferred financing costs | | | 852,696 | | | | 499,179 | | | | 1,912,090 | | | | 1,434,099 | |
| Non-cash compensation expense | | | 1,253,752 | | | | 496,479 | | | | 2,353,629 | | | | 1,176,801 | |
| Less: | | | | | | | | | | | | | | | | |
| Straight-line rent and above/below market rent | | | 3,217,632 | | | | 1,521,136 | | | | 6,932,017 | | | | 4,474,029 | |
| Amortization of debt premium | | | 1,659,340 | | | | 2,021 | | | | 1,663,382 | | | | 125,010 | |
| Maintenance capital expenditures | | | 941,486 | | | | 289,684 | | | | 1,677,201 | | | | 725,582 | |
Revenue enhancing T/I – retail3 | | | 1,161,824 | | | | 1,045,135 | | | | 2,530,949 | | | | 4,136,459 | |
| External leasing commissions | | | 255,268 | | | | 279,655 | | | | 754,979 | | | | 792,493 | |
| Revenue enhancing T/I – office | | | - | | | | - | | | | 525,091 | | | | 319,551 | |
Total AFFO available to shareholders4 | | $ | 38,780,591 | | | $ | 11,006,600 | | | $ | 69,214,805 | | | $ | 27,069,463 | |
| | | | | | | | | | | | | | | | | |
Total AFFO per share4 | | $ | 0.45 | | | $ | 0.44 | | | $ | 1.34 | | | $ | 1.14 | |
| ____________________ |
| 1 | “Funds From Operations of the Kite Portfolio measures 100% of the operating performance of the Operating Partnership’s real estate properties and construction and service subsidiaries in which the Company owns an interest. “Funds From Operations allocable to the Company” reflects a reduction for the redeemable noncontrolling weighted average diluted interest in the Operating Partnership. |
| 2 | Share and per share information has been restated for the effects of the Company’s one-for-four reverse share split in August 2014. |
| 3 | For the three months ended September 30, 2014, includes $0.5 million for anchor retenanting at Lithia Crossing. |
| 4 | Excludes merger and acquisition costs. |
p. 9
Kite Realty Group Trust Supplemental Financial and Operating Statistics –9/30/14
OTHER FINANCIAL INFORMATION
| | | Three Months Ended September 30, | | | Nine Months Ended September 30, | |
| | | 2014 | | | 2013 | | | 2014 | | | 2013 | |
| Other Financial Information: | | | | | | | | | | | | |
Capital expenditures1 | | | | | | | | | | | | |
| Tenant improvements – Retail | | $ | 1,161,824 | | | $ | 1,045,135 | | | $ | 2,530,949 | | | $ | 4,136,459 | |
| Tenant improvements – Office | | | — | | | | — | | | | 525,091 | | | | 319,551 | |
| Leasing commissions – Retail | | | 255,268 | | | | 279,655 | | | | 725,541 | | | | 792,493 | |
| Leasing commissions – Office | | | — | | | | — | | | | 29,438 | | | | — | |
Capital improvements2 | | | 941,486 | | | | 289,684 | | | | 1,677,201 | | | | 725,582 | |
| Scheduled debt principal payments | | | 1,645,208 | | | | 1,507,063 | | | | 4,666,301 | | | | 4,933,570 | |
| Straight line rent – total | | | 1,597,477 | | | | 875,740 | | | | 3,350,403 | | | | 2,557,882 | |
| Market rent amortization income from acquired leases | | | 1,620,155 | | | | 645,396 | | | | 3,581,614 | | | | 1,916,147 | |
| Amortization of debt premium | | | 1,659,340 | | | | 2,021 | | | | 1,663,382 | | | | 125,010 | |
| Amortization of deferred financing costs | | | 852,696 | | | | 499,179 | | | | 1,912,090 | | | | 1,434,099 | |
| Non-cash compensation expense | | | 1,253,752 | | | | 496,479 | | | | 2,353,629 | | | | 1,176,801 | |
| Capitalized interest | | | 1,123,579 | | | | 1,018,041 | | | | 3,613,807 | | | | 3,964,255 | |
Mark to market lease amount in Deferred revenue and other liabilities on consolidated balance sheet – excluding properties held for sale | | | 113,173,015 | | | | 10,959,527 | | | | | | | | | |
Acreage of undeveloped, vacant land in the operating portfolio3 | | | 57.2 | | | | 32.7 | | | | | | | | | |
| | | | | | | | | | | | | | | | | |
| | | September 30, 2014 | |
| Detail of assets and liabilities held for sale: | | | |
| | | | |
| Assets: | | | |
| Investment properties at cost: | | $ | 323,570,482 | |
Less: accumulated depreciation | | | (3,049,926 | ) |
| | | | 320,520,556 | |
| Accounts receivable, prepaids and other assets | | | 1,989,132 | |
| Deferred costs, net | | | 21,956,334 | |
| | | | 344,466,022 | |
| | | | | |
| Liabilities: | | | | |
Mortgage and other indebtedness4 | | | 144,316,064 | |
| Deferred revenue and other liabilities | | | 28,563,898 | |
| Accounts payable and accrued expenses | | | 3,755,881 | |
| | | $ | 176,635,843 | |
| | | | | |
| | | September 30, 2014 | | | December 31, 2013 | |
| Investment properties, at cost: | | | | | | |
Land3 | | $ | 763,563,123 | | | $ | 333,458,070 | |
| Buildings and improvements | | | 2,749,023,136 | | | | 1,351,641,925 | |
| Furniture, equipment and other | | | 6,314,796 | | | | 4,970,310 | |
| Land held for development | | | 54,778,349 | | | | 56,078,488 | |
| Construction in progress | | | 100,152,761 | | | | 130,909,478 | |
| Total | | $ | 3,673,832,165 | | | $ | 1,877,058,271 | |
| ____________________ |
| 1 | Excludes landlord work, tenant improvements and leasing commissions relating to development and redevelopment projects and first-generation space. |
| 2 | A portion of these capital improvements are reimbursed by tenants and are revenue producing. |
| 3 | Includes undeveloped vacant land with a book value $15.5 million at September 30, 2014. |
| 4 | Includes unamortized debt premium of $4.2 million |
p. 10
Kite Realty Group Trust Supplemental Financial and Operating Statistics –9/30/14
MARKET CAPITALIZATION AS OF SEPTEMBER 30, 2014
| | | | Total | | Percent of |
| | Percent of | | Market | | Total Market |
| | Total Equity | | Capitalization | | Capitalization |
| Equity Capitalization: | | | | | | | |
| Total Common Shares Outstanding | 98.1 | % | | | 83,459,618 | | |
| | | | | | | | |
| Operating Partnership ("OP") Units Outstanding | 1.9 | % | | | 1,656,946 | | |
| | | | | | | | |
| Combined Common Shares and OP Units | 100.0 | % | | | 85,116,564 | | |
| | | | | | | | |
| Market Price of Common Shares | | | | $ | 24.24 | | |
| | | | | | | | |
| Series A Preferred Shares ($26.35/share) | | | | | | | |
| | | | | | 108,035,000 | | |
| Total Equity Capitalization | | | | | 2,171,260,511 | | 57% |
| | | | | | | | |
| Debt Capitalization: | | | | | | | |
| Company Consolidated Outstanding Debt | | | | | 1,556,495,902 | | |
| | | | | | | | |
| Plus: Indebtedness of assets held for sale | | | | | 144,316,064 | | |
| | | | | | | | |
| Less: Debt Premium | | | | | (27,460,433 | ) | |
| | | | | | | | |
| Less: Debt Premium - assets held for sale | | | | | (4,238,950 | ) | |
| | | | | | | | |
Less: Partner Share of Consolidated Joint Venture Debt1 | | | | | (24,122,478 | ) | |
| | | | | | | | |
| Company Share of Outstanding Debt | | | | | 1,644,990,105 | | |
| | | | | | | | |
| Less: Cash and Cash Equivalents | | | | | (31,213,429 | ) | |
| | | | | | | | |
| Total Net Debt Capitalization | | | | | 1,613,776,676 | | 43% |
| | | | | | | | |
| Total Enterprise Value | | | | $ | 3,785,037,187 | | 100% |
| | | | | | | | |
RATIO OF DEBT TO TOTAL UNDEPRECIATED ASSETS AS OF SEPTEMBER 30, 2014 |
| | | | | | | | | |
| Consolidated Undepreciated Real Estate Assets | | | | | $ | 3,673,832,165 | | |
| Real estate assets of assets held for sale | | | | | | 323,570,482 | | |
Company Share of Unconsolidated Real Estate Assets2 | | | | | | 2,500,000 | | |
| Escrow and Other Deposits including assets held for sale | | | | | | 17,651,877 | | |
| | | | | | | 4,017,554,524 | | |
| Total Consolidated Debt | | | | | | 1,700,811,966 | | |
| Less: Debt premium including assets held for sale | | | | | | (31,699,383 | ) | |
| Less: Cash and cash equivalents | | | | | | (31,213,429 | ) | |
| | | | | | $ | 1,637,899,154 | | |
| | | | | | | | | |
| Ratio of Debt to Total Undepreciated Real Estate Assets | | | | | | 40.8 | % | |
| | | | | | | | |
RATIO OF COMPANY SHARE OF NET DEBT TO EBITDA AS OF SEPTEMBER 30, 2014 |
| | | | | | | | | |
| Company share of consolidated debt | | | | | $ | 1,644,990,105 | | |
| Less: Cash and Cash Equivalents | | | (31,213,429 | ) | |
| | | | | | | 1,613,776,676 | | |
| Q3 2014 EBITDA, annualized: | | | | | | | |
| - consolidated (excluding merger costs) | | $ | 248,623,692 | | | | | | |
| - unconsolidated | | | 131,250 | | | | | | |
- minority interest EBITDA1 | | | (2,715,310 | ) | | | 246,039,632 | | |
| | | | | | | 6.56x | | |
| ____________________ |
| 1 | See Joint Venture Summary page for details. |
| 2 | Included in prepaid and other assets |
p. 11
Kite Realty Group Trust Supplemental Financial and Operating Statistics –9/30/14
SAME PROPERTY NET OPERATING INCOME (NOI)
| | | Three Months Ended September 30, | | | Nine Months Ended September 30, | |
| | | 2014 | | | 2013 | | | % Change | | | 2014 | | | 2013 | | | % Change | |
Number of properties at period end1 | | | 50 | | | | 50 | | | | | | | 50 | | | | 50 | | | | |
| | | | | | | | | | | | | | | | | | | | | | | |
| Leased percentage at period end | | | 96.4 | % | | | 96.1 | % | | | | | | 96.4 | % | | | 96.1 | % | | | |
Economic Occupancy percentage at period end 2 | | | 94.9 | % | | | 92.8 | % | | | | | | 94.9 | % | | | 92.8 | % | | | |
| | | | | | | | | | | | | | | | | | | | | | | |
| Minimum rent | | $ | 19,845,719 | | | $ | 19,087,381 | | | | | | $ | 56,988,100 | | | $ | 54,604,856 | | | | |
| Tenant recoveries | | | 5,698,457 | | | | 5,642,824 | | | | | | | 17,234,056 | | | | 16,300,109 | | | | |
| Other income | | | 608,902 | | | | 687,021 | | | | | | | 1,866,890 | | | | 1,809,407 | | | | |
| | | | 26,153,078 | | | | 25,417,226 | | | | | | | 76,089,046 | | | | 72,714,372 | | | | |
| | | | | | | | | | | | | | | | | | | | | | | |
| Property operating expenses | | | 5,161,636 | | | | 5,218,913 | | | | | | | 15,975,587 | | | | 15,127,255 | | | | |
| Real estate taxes | | | 3,430,190 | | | | 3,419,428 | | | | | | | 10,324,768 | | | | 9,986,567 | | | | |
| | | | 8,591,826 | | | | 8,638,341 | | | | | | | 26,300,355 | | | | 25,113,822 | | | | |
Net operating income – same properties (50 properties)3 | | $ | 17,561,252 | | | $ | 16,778,885 | | | | 4.7 | % | | $ | 49,788,691 | | | $ | 47,600,550 | | | | 4.6 | % |
| | | | | | | | | | | | | | | | | | | | | | | | | |
| Reconciliation to Most Directly Comparable GAAP Measure: | | | | | | | | | | | | | | | | | | | | | | | | |
| Net operating income - same properties | | $ | 17,561,252 | | | $ | 16,778,885 | | | | | | | $ | 49,788,691 | | | $ | 47,600,550 | | | | | |
| Net operating income - non-same activity | | | 48,533,429 | | | | 6,601,135 | | | | | | | | 76,186,764 | | | | 19,642,102 | | | | | |
| Other expense, net | | | (27,214 | ) | | | (77,609 | ) | | | | | | | (156,081 | ) | | | (145,628 | ) | | | | |
| General and administrative expenses | | | (3,938,758 | ) | | | (2,114,828 | ) | | | | | | | (9,358,218 | ) | | | (6,069,063 | ) | | | | |
| Merger and acquisition costs | | | (19,088,590 | ) | | | (153,314 | ) | | | | | | | (26,849,077 | ) | | | (566,826 | ) | | | | |
| Impairment charge | | | - | | | | - | | | | | | | | - | | | | (5,371,427 | ) | | | | |
| Depreciation expense | | | (44,382,793 | ) | | | (15,373,538 | ) | | | | | | | (81,559,506 | ) | | | (40,565,934 | ) | | | | |
| Interest expense | | | (15,386,192 | ) | | | (7,541,534 | ) | | | | | | | (30,291,028 | ) | | | (20,812,460 | ) | | | | |
| Discontinued operations | | | - | | | | 3,121,880 | | | | | | | | - | | | | 2,332,718 | | | | | |
| Gain on sales of operating properties | | | 2,749,403 | | | | - | | | | | | | | 9,534,290 | | | | - | | | | | |
| Net (income) loss attributable to noncontrolling interests | | | (304,456 | ) | | | 15,173 | | | | | | | | (223,865 | ) | | | 651,327 | | | | | |
| Dividends on preferred shares | | | (2,114,063 | ) | | | (2,114,063 | ) | | | | | | | (6,342,188 | ) | | | (6,342,188 | ) | | | | |
| Net loss attributable to common shareholders | | $ | (16,397,982 | ) | | $ | (857,813 | ) | | | | | | $ | (19,270,218 | ) | | $ | (9,646,829 | ) | | | | |
| ____________________ |
| 1 | Same Property NOI analysis excludes operating properties in redevelopment. |
| 2 | Excludes leases that are signed but for which tenants have not commenced payment of cash rent. |
| 3 | Same Property net operating income excludes net gains from outlot sales, straight-line rent revenue, bad debt expense and related recoveries, lease termination fees, amortization of lease intangibles and significant prior year expense recoveries and adjustments, if any. |
| | |
The Company believes that Net Operating Income is helpful to investors as a measure of its operating performance because it excludes various items included in net income that do not relate to or are not indicative of its operating performance, such as depreciation and amortization, interest expense, and impairment, if any. The Company believes that Same Property NOI is helpful to investors as a measure of its operating performance because it includes only the NOI of properties that have been owned for the full period presented, which eliminates disparities in net income due to the redevelopment, acquisition or disposition of properties during the particular period presented, and thus provides a more consistent metric for the comparison of the Company's properties. NOI and Same Property NOI should not, however, be considered as alternatives to net income (calculated in accordance with GAAP) as indicators of the Company's financial performance.
p. 12
Kite Realty Group Trust Supplemental Financial and Operating Statistics –9/30/14
NET OPERATING INCOME BY QUARTER
| | Three Months Ended |
| | September 30, 2014 | | June 30, 2014 | | March 31, 2014 | | December 31, 2013 | | September 30, 2013 |
| Revenue: | | | | | | | | | | | | | | | | | | | |
| Minimum rent | $ | 69,033,444 | | | $ | 31,221,687 | | | $ | 31,260,036 | | | $ | 26,778,302 | | | $ | 23,726,468 | |
| Tenant reimbursements | | 17,605,172 | | | | 8,315,228 | | | | 9,162,860 | | | | 7,071,611 | | | | 6,257,937 | |
Other property related revenue1 | | 1,296,138 | | | | 833,009 | | | | 1,305,164 | | | | 1,380,844 | | | | 1,910,420 | |
| Overage rent | | 124,988 | | | | 70,790 | | | | 458,038 | | | | 184,824 | | | | 119,975 | |
Parking revenue, net2 | | 126,642 | | | | 219,936 | | | | 26,130 | | | | 121,028 | | | | 86,676 | |
| | | 88,186,384 | | | | 40,660,650 | | | | 42,212,228 | | | | 35,536,609 | | | | 32,101,476 | |
| Expenses: | | | | | | | | | | | | | | | | | | | |
Property operating – Recoverable3 | | 9,888,434 | | | | 5,536,914 | | | | 6,399,906 | | | | 4,831,008 | | | | 4,506,739 | |
Property operating – Non-Recoverable3 | | 1,747,943 | | | | 1,149,413 | | | | 683,261 | | | | 1,105,602 | | | | 721,809 | |
| Real estate taxes | | 10,455,326 | | | | 4,325,181 | | | | 4,897,428 | | | | 4,346,503 | | | | 3,492,909 | |
| | | 22,091,703 | | | | 11,011,508 | | | | 11,980,595 | | | | 10,283,113 | | | | 8,721,457 | |
| Net Operating Income – Properties | | 66,094,681 | | | | 29,649,142 | | | | 30,231,633 | | | | 25,253,496 | | | | 23,380,019 | |
| | | | | | | | | | | | | | | | | | | | |
| Other Income (Expense): | | | | | | | | | | | | | | | | | | | |
| General, administrative, and other | | (3,938,758 | ) | | | (2,313,357 | ) | | | (3,106,102 | ) | | | (2,141,729 | | | | (2,114,828 | ) |
| Merger and acquisition costs | | (19,088,590 | ) | | | (3,280,099 | ) | | | (4,480,389 | ) | | | (1,647,740 | ) | | | (153,314 | ) |
| | | (23,027,348 | ) | | | (5,593,456 | ) | | | (7,586,491 | ) | | | (3,789,469 | ) | | | (2,268,142 | ) |
| Earnings Before Interest, Taxes, Depreciation and Amortization | | 43,067,333 | | | | 24,055,686 | | | | 22,645,142 | | | | 21,464,027 | | | | 21,111,877 | |
| | | | | | | | | | | | | | | | | | | | |
| Depreciation and amortization | | (44,382,793 | ) | | | (19,737,108 | ) | | | (17,439,606 | ) | | | (13,913,089 | ) | | | (15,373,538 | ) |
| Interest expense | | (15,386,192 | ) | | | (7,521,991 | ) | | | (7,382,845 | ) | | | (7,181,116 | ) | | | (7,541,534 | ) |
| Income tax (expense)/benefit of taxable REIT subsidiary | | (14,144 | ) | | | (75,614 | ) | | | 53,146 | | | | (155,927 | ) | | | (30,596 | ) |
| Other (expense) income, net | | (13,070 | ) | | | 83,323 | | | | (92,944 | ) | | | (23,231 | ) | | | (47,013 | ) |
| | | | | | | | | | | | | | | | | | | | |
| (Loss) Income From Continuing Operations | | (16,728,866 | ) | | | (3,195,704 | ) | | | (2,217,107 | ) | | | 190,664 | | | | (1,880,804 | ) |
| | | | | | | | | | | | | | | | | | | | |
| Discontinued operations: | | | | | | | | | | | | | | | | | | | |
| | | | | | | | | | | | | | | | | | | | |
| Income from discontinued operations | | — | | | | — | | | | — | | | | 230,048 | | | | 1,393,616 | |
| Gain on debt extinguishment | | — | | | | — | | | | — | | | | — | | | | 1,241,724 | |
| Gain on sale of operating properties | | — | | | | — | | | | 3,198,772 | | | | — | | | | 486,540 | |
| Income from discontinued operations | | — | | | | — | | | | 3,198,772 | | | | 230,048 | | | | 3,121,880 | |
| (Loss) income before gain on sale of operating properties | | (16,728,866 | ) | | | (3,195,704 | ) | | | 981,665 | | | | 420,712 | | | | 1,241,076 | |
| Gain on sale of operating property | | 2,749,403 | | | | — | | | | 3,489,338 | | | | — | | | | — | |
| Net (loss) income | | (13,979,463 | ) | | | (3,195,704 | ) | | | 4,471,003 | | | | 420,712 | | | | 1,241,076 | |
| Less: Net income attributable to noncontrolling interest | | (304,456 | ) | | | 219,502 | | | | (138,912 | ) | | | 34,193 | | | | 15,173 | |
| Less: Dividends on preferred shares | | (2,114,063 | ) | | | (2,114,063 | ) | | | (2,114,063 | ) | | | (2,114,063 | ) | | | (2,114,063 | ) |
| Net income (loss) attributable to Kite Realty Group Trust | $ | (16,397,982 | ) | | $ | (5,090,265 | ) | | $ | 2,218,028 | | | $ | (1,659,158 | ) | | $ | (857,813 | ) |
| | | | | | | | | | | | | | | | | | | | |
| NOI/Revenue | | 75.0% | | | | 72.9% | | | | 71.6% | | | | 71.1% | | | | 72.8% | |
Recovery Ratio4 | | | | | | | | | | | | | | | | | | | |
| – Retail Only | | 89.0% | | | | 89.5% | | | | 85.7% | | | | 85.9% | | | | 85.4% | |
| – Consolidated | | 86.5% | | | | 84.3% | | | | 81.1% | | | | 77.1% | | | | 78.2% | |
| | | | | | | | | | | | | | | | | | | | |
| ____________________ |
| 1 | Other property related revenue for the three months ended September 30, 2014 includes $1.1 million of lease termination income and a pre-tax gain of $0.2 million from the sale of residential units at Eddy Street Commons. |
| 2 | Parking revenue, net, represents the net operating results of the Eddy Street Parking Garage and the Union Station Parking Garage. |
| 3 | Recoverable expenses include total management fee expense (or G&A expense of $1.1 million) allocable to the property operations in the three months ended September 30, 2014, a portion of which is recoverable. Non-recoverable expenses primarily include bad debt, ground rent, and legal expenses. |
| 4 | “Recovery Ratio” is computed by dividing tenant reimbursements by the sum of recoverable property operating expense and real estate tax expense. |
| | |
p. 13
Kite Realty Group Trust Supplemental Financial and Operating Statistics –9/30/14
CONSOLIDATED JOINT VENTURE SUMMARY
As of September 30, 2014
| Ownership | | | | |
Joint Venture Entity | Location (MSA) | Owned GLA | KRG Ownership % | Current KRG Economic %1 | |
| | | | | | |
| Cornelius Gateway | Portland, OR | 21,326 | 80% | 80% | |
| Beacon Hill | Crown Point, IN | 57,191 | 50% | 94% | |
| Delray Marketplace | Delray, FL | 260,255 | 50% | 98% | |
Fishers Station2 | Indianapolis, IN | 71,943 | 25% | 88% | |
| Bayport Commons | Oldsmar, FL | 97,193 | 60% | 100% | |
| Pan Am Plaza | Indianapolis, IN | - | 85% | 85% | |
| City Center at White Plains | White Plains, NY | 365,905 | 67% | 89% | |
| Crossing at Killingly Commons | Killington, CT | 208,929 | 55% | 90% | |
Territory Portfolio3 | Las Vegas, NV | 847,690 | 78% | 94% | |
| | | | | | |
Balance Sheet | | Current Partner Economic % | | | |
| Joint Venture Entity | 9/30/2014 Debt Balance | Partner Share of Debt | Redeemable Noncontrolling Interest | |
| | | | | | |
| Cornelius Gateway | $ | - | 20% | $ | - | $ | - | |
| Beacon Hill | | 6,752,550 | 6% | | 405,153 | | - | |
| Delray Marketplace | | 59,138,103 | 2% | | 1,182,762 | | - | |
Fishers Station2 | | 3,318,024 | 12% | | 398,163 | | - | |
| Bayport Commons | | 12,592,154 | 0% | | - | | - | |
| Pan Am Plaza | | - | 15% | | - | | - | |
| City Center at White Plains | | 90,000,000 | 11% | | 9,900,000 | | 27,842,198 | |
| Crossing at Killingly Commons | | 33,000,000 | 10% | | 3,300,000 | | 10,070,146 | |
Territory Portfolio3 | | 148,940,000 | 6% | | 8,936,400 | | 31,442,940 | |
| Total | $ | 353,740,831 | | $ | 24,122,478 | $ | 69,355,284 | |
| | | | | | |
| Income Statement | | | | | |
| Joint Venture Entity | | | EBITDA | Comments |
| | | Total Quarterly Minority Interest | Annualized Minority Interest |
| | | | | | |
| Cornelius Gateway | | | | | $ | 573 | $ | 2,292 | − |
| Beacon Hill | | | | | | - | | - | KRG has a 10% cumulative preferred return |
| Delray Marketplace | | | | | | - | | - | KRG has a 8% cumulative preferred return |
Fishers Station2 | | | | | | 28,167 | | 112,668 | Partner receives a fixed annual payment |
| Bayport Commons | | | | | | - | | - | Cumulative preferred return |
| Pan Am Plaza | | | | | | - | | - | Project currently in Land Held For Development |
| City Center at White Plains | | | | | | 266,000 | | 1,064,000 | Partner receives a fixed annual preferred payment of 4% on $26.6 million |
| Crossing at Killingly Commons | | | | | | 84,088 | | 336,350 | Partner receives a fixed annual preferred payment of 3.5% on $9.6 million |
Territory Portfolio3 | | | | | | 300,000 | | 1,200,000 | Partner receives a fixed annual preferred payment of 4% on $30 million |
| Total | | | | | $ | 678,828 | $ | 2,715,310 | |
| ____________________ |
| 1 | Economic % represents partner share of cash flow. |
| 2 | Joint Venture entity also owns a portion of Fishers Station shopping center. |
| 3 | Joint Venture includes the six operating properties in Las Vegas. |
p. 14
Kite Realty Group Trust Supplemental Financial and Operating Statistics –9/30/14
SUMMARY OF OUTSTANDING DEBT AS OF SEPTEMBER 30, 2014
| TOTAL OUTSTANDING DEBT | | | | | | | | | | |
| | | Outstanding Amount | | | Ratio | | | Weighted Average Interest Rate1 | | | Weighted Average Maturity (in years) | |
| Fixed Rate Debt: | | | | | | | | | | | | |
| Consolidated | | $ | 800,078,314 | | | | 52 | % | | | 5.06 | % | | | 5.6 | |
| Variable Rate Debt (Hedged) | | | 456,275,141 | | | | 30 | % | | | 3.25 | % | | | 3.6 | |
| Total Fixed Rate Debt | | | 1,256,353,455 | | | | 82 | % | | | 4.40 | % | | | 4.9 | |
| Variable Rate Debt: | | | | | | | | | | | | | | | | |
| Construction Loans | | | 147,041,291 | | | | 10 | % | | | 2.15 | % | | | 1.0 | |
| Other Variable | | | 238,915,864 | | | | 16 | % | | | 2.42 | % | | | 4.8 | |
| Corporate Unsecured | | | 343,000,000 | | | | 22 | % | | | 1.52 | % | | | 5.1 | |
| Variable Rate Debt (Hedged) | | | (456,275,141 | ) | | | (30 | % ) | | | (1.94 | % ) | | | (3.6 | ) |
| Total Variable Rate Debt | | | 272,682,014 | | | | 18 | % | | | 1.94 | % | | | 5.2 | |
| Net Premiums on Acquired Debt | | | 27,460,433 | | | | N/A | | | | N/A | | | | N/A | |
| Total | | $ | 1,556,495,902 | | | | 100 | % | | | 3.96 | % | | | 4.9 | |
| SCHEDULE OF MATURITIES BY YEAR | | | | | | | | | | |
| | | Mortgage Debt | | | | | | Construction Loans | | | Total Consolidated Outstanding Debt | |
| | Scheduled Principal Payments | | | Term Maturities | | | Corporate Debt2 | |
| 2014 | | $ | 1,657,341 | | | $ | - | | | $ | - | | | $ | 59,138,103 | | | $ | 60,795,444 | |
| 2015 | | | 6,484,740 | | | | 112,347,048 | | | | - | | | | 34,044,690 | | | | 152,876,478 | |
| 2016 | | | 5,606,989 | | | | 143,379,403 | | | | - | | | | 53,858,498 | | | | 202,844,890 | |
| 2017 | | | 4,502,488 | | | | 65,106,246 | | | | - | | | | - | | | | 69,608,734 | |
| 2018 | | | 4,549,810 | | | | 68,693,599 | | | | - | | | | - | | | | 73,243,409 | |
| 2019 | | | 4,373,874 | | | | - | | | | 113,000,000 | | | | - | | | | 117,373,874 | |
| 2020 | | | 4,178,765 | | | | 28,102,416 | | | | 230,000,000 | | | | - | | | | 262,281,181 | |
| 2021 | | | 2,949,764 | | | | 182,202,854 | | | | - | | | | - | | | | 185,152,618 | |
| 2022 | | | 291,109 | | | | 240,877,732 | | | | - | | | | - | | | | 241,168,841 | |
| 2023 and beyond | | | - | | | | 163,690,000 | | | | - | | | | - | | | | 163,690,000 | |
| Net Premiums on Acquired Debt | | | 27,460,433 | | | | - | | | | - | | | | - | | | | 27,460,433 | |
| Total | | $ | 62,055,313 | | | $ | 1,004,399,298 | | | $ | 343,000,000 | | | $ | 147,041,291 | | | $ | 1,556,495,902 | |
| ____________________ |
| 1 | Calculations on Hedged Debt assume a weighted average spread over LIBOR on all variable rate debt, consistent with the hedges’ designation. |
| 2 | This presentation reflects the Company's exercise of its options to extend the maturity dates by one year to July 1, 2019 for the Company's unsecured credit facility and its option to extend the maturity date by six months to January 1, 2020 for the Company's unsecured term loan. |
p. 15
Kite Realty Group Trust Supplemental Financial and Operating Statistics –9/30/14
MATURITY SCHEDULE OF OUTSTANDING DEBT AS OF SEPTEMBER 30, 2014
| Property | Lender(s) | Loan Type | | Interest Rate1 | | Maturity Date | | Total Commitment | | | Balance as of Sept. 30, 2014 | | | % of Total Outstanding | | | Monthly Debt Service as of Sept. 30, 2014 | |
| | | | | | | | | | | | | | | | | | | |
Delray Marketplace2,3 | Bank of America/USBank | Construction Variable | | LIBOR + 175 | | 11/18/14 | | | 60,783,941 | | | $ | 59,138,103 | | | | | | $ | 96,950 | |
| 2014 Debt Maturities | | | | | | | | | | | | | 59,138,103 | | | | 3.9 | % | | | | |
| | | | | | | | | | | | | | | | | | | | | | | |
| Indian River Square | CMBS | Fixed Rate | | | 5.42 | % | 6/11/15 | | | | | | | 12,288,208 | | | | | | | | 74,850 | |
| Plaza Volente | CMBS | Fixed Rate | | | 5.42 | % | 6/11/15 | | | | | | | 26,498,180 | | | | | | | | 161,405 | |
Holly Springs Towne Center-Phase I4 | Bank of America | Construction Variable | | LIBOR + 225 | | 7/31/15 | | | 37,500,000 | | | | 34,044,690 | | | | | | | | 70,508 | |
| Landstown Commons | Bank of America, NA | Other Variable | | LIBOR + 175 | | 9/25/15 | | | | | | | 50,140,000 | | | | | | | | 82,241 | |
| Draper Peaks A | Transamerica Financial Life | Fixed Rate | | | 5.42 | % | 10/1/15 | | | | | | | 13,990,760 | | | | | | | | 63,192 | |
| Draper Peaks B | Transamerica Financial Life | Fixed Rate | | | 6.19 | % | 10/1/15 | | | | | | | 9,914,346 | | | | | | | | 51,142 | |
| 2015 Debt Maturities | | | | | | | | | | | | | | 146,876,184 | | | | 9.6 | % | | | | |
| | | | | | | | | | | | | | | | | | | | | | | | |
| Cool Creek Commons | CMBS | Fixed Rate | | | 5.88 | % | 4/11/16 | | | | | | | 16,697,481 | | | | | | | | 106,534 | |
| Sunland Towne Centre | CMBS | Fixed Rate | | | 6.01 | % | 7/1/16 | | | | | | | 24,044,668 | | | | | | | | 150,048 | |
| Mullins Crossing | CMBS | Fixed Rate | | | 5.50 | % | 9/6/16 | | | | | | | 21,025,683 | | | | | | | | 133,430 | |
| Pine Ridge Crossing | CMBS | Fixed Rate | | | 6.34 | % | 10/11/16 | | | | | | | 16,928,218 | | | | | | | | 108,823 | |
| Riverchase Plaza | CMBS | Fixed Rate | | | 6.34 | % | 10/11/16 | | | | | | | 10,156,930 | | | | | | | | 65,294 | |
| Traders Point | CMBS | Fixed Rate | | | 5.86 | % | 10/11/16 | | | | | | | 43,763,358 | | | | | | | | 283,478 | |
Parkside Town Commons5 | Huntington Bank (Admin Agent) | Construction Variable | | LIBOR + 210 | | 11/21/16 | | | 87,225,000 | | | | 53,858,498 | | | | | | | | 102,568 | |
| Eastgate Pavilion | Associated Bank | Other Variable | | LIBOR + 225 | | 12/31/16 | | | | | | | 15,925,500 | | | | | | | | 59,547 | |
| 2016 Debt Maturities | | | | | | | | | | | | | | 202,400,336 | | | | 13.2 | % | | | | |
| | | | | | | | | | | | | | | | | | | | | | | | |
| Geist Pavilion | CMBS | Fixed Rate | | | 5.78 | % | 1/1/17 | | | | | | | 10,752,929 | | | | | | | | 65,135 | |
| Pleasant Hill Commons | John Hancock Life Ins | Fixed Rate | | | 6.00 | % | 6/1/17 | | | | | | | 6,800,000 | | | | | | | | 34,000 | |
Crossing at Killingly Commons2,6 | Huntington Bank | Other Variable | | LIBOR + 275 | | 11/1/17 | | | | | | | 33,000,000 | | | | | | | | 74,582 | |
| Wheatland Towne Crossing | Capital One | Other Variable | | LIBOR + 235 | | 12/20/17 | | | | | | | 15,080,000 | | | | | | | | 32,542 | |
| 2017 Debt Maturities | | | | | | | | | | | | | | 65,632,929 | | | | 4.3 | % | | | | |
| | | | | | | | | | | | | | | | | | | | | | | | |
| Colonial Square & Village Walk | CMBS | Fixed Rate | | | 5.50 | % | 1/1/18 | | | | | | | 25,000,000 | | | | | | | | 118,403 | |
Beacon Hill7 | Fifth Third Bank | Other Variable | | LIBOR + 195 | | 4/1/18 | | | | | | | 6,752,550 | | | | | | | | 27,573 | |
| Whitehall Pike | CMBS | Fixed Rate | | | 6.71 | % | 7/5/18 | | | | | | | 6,382,915 | | | | | | | | 77,436 | |
| Perimeter Woods S.C. | Jackson National Life Insurance | Fixed Rate | | | 6.02 | % | 9/1/18 | | | | | | | 33,330,000 | | | | | | | | 167,206 | |
| 2018 Debt Maturities | | | | | | | | | | | | | | 71,465,465 | | | | 4.7 | % | | | | |
| | | | | | | | | | | | | | | | | | | | | | | | |
Unsecured Credit Facility8,9 | KeyBank (Admin. Agent) | Corporate Unsecured | | LIBOR + 140 | | 7/1/19 | | | | | | | 113,000,000 | | | | | | | | N/A | |
| 2019 Debt Maturities | | | | | | | | | | | | | | 113,000,000 | | | | 7.4 | % | | | | |
| | | | | | | | | | | | | | | | | | | | | | | | |
Unsecured Term Loan10 | KeyBank (Admin. Agent) | Corporate Unsecured | | LIBOR + 135 | | 1/1/20 | | | | | | | 230,000,000 | | | | | | | | N/A | |
Fishers Station2 | Old National Bank | Other Variable | | LIBOR + 225 | | 1/4/20 | | | | | | | 7,525,820 | | | | | | | | 17,520 | |
| Bridgewater Marketplace | Old National Bank | Other Variable | | LIBOR + 225 | | 1/4/20 | | | | | | | 1,884,494 | | | | | | | | 9,551 | |
| Lake City Commons /Whispering Ridge/University Town Center II | CMBS | Fixed Rate | | | 5.70 | % | 9/1/20 | | | | | | | 20,700,000 | | | | | | | | 101,603 | |
| Thirty South Meridian | Associated Bank | Other Variable | | LIBOR + 205 | | 12/31/20 | | | | | | | 18,607,500 | | | | | | | | 67,973 | |
| 2020 Debt Maturities | | | | | | | | | | | | | | 278,717,814 | | | | 18.2 | % | | | | |
| | | | | | | | | | | | | | | | | | | | | | | | |
| Waxahachie Crossing | CMBS | Fixed Rate | | | 5.55 | % | 3/1/21 | | | | | | | 7,750,000 | | | | | | | | 37,039 | |
| International Speedway Square | CMBS | Fixed Rate | | | 5.77 | % | 4/1/21 | | | | | | | 20,081,988 | | | | | | | | 122,817 | |
| Lima Marketplace | CMBS | Fixed Rate | | | 5.80 | % | 4/1/21 | | | | | | | 8,383,000 | | | | | | | | 41,868 | |
| Bell Oaks Centre | CMBS | Fixed Rate | | | 5.59 | % | 4/1/21 | | | | | | | 6,547,500 | | | | | | | | 31,489 | |
| Northcrest Shopping Center | CMBS | Fixed Rate | | | 5.48 | % | 5/1/21 | | | | | | | 15,780,000 | | | | | | | | 74,396 | |
| University Town Center | CMBS | Fixed Rate | | | 5.48 | % | 6/1/21 | | | | | | | 18,690,000 | | | | | | | | 88,116 | |
| Village at Bay Park | CMBS | Fixed Rate | | | 5.58 | % | 6/1/21 | | | | | | | 9,183,298 | | | | | | | | 44,126 | |
| Silver Springs Pointe | CMBS | Fixed Rate | | | 5.03 | % | 7/1/21 | | | | | | | 8,800,000 | | | | | | | | 38,131 | |
| Lake Mary Plaza | CMBS | Fixed Rate | | | 5.10 | % | 7/1/21 | | | | | | | 5,080,000 | | | | | | | | 22,310 | |
Bayport Commons2 | CMBS | Fixed Rate | | | 5.44 | % | 9/1/21 | | | | | | | 12,592,154 | | | | | | | | 74,045 | |
| Eddy Street Commons | CMBS | Fixed Rate | | | 5.44 | % | 9/1/21 | | | | | | | 24,464,756 | | | | | | | | 143,859 | |
| Four Property Pool Loan | CMBS | Fixed Rate | | | 5.44 | % | 9/1/21 | | | | | | | 41,638,055 | | | | | | | | 244,843 | |
| 2021 Debt Maturities | | | | | | | | | | | | | | 178,990,751 | | | | 11.7 | % | | | | |
| | | | | | | | | | | | | | | | | | | | | | | | |
| Centre at Panola, Phase I | CMBS | Fixed Rate | | | 6.78 | % | 1/1/22 | | | | | | | 2,608,887 | | | | | | | | 36,583 | |
| Palm Coast Landing at Town Center | CMBS | Fixed Rate | | | 5.00 | % | 3/1/22 | | | | | | | 22,550,000 | | | | | | | | 93,958 | |
| Bayonne Crossing | CMBS | Fixed Rate | | | 4.08 | % | 4/1/22 | | | | | | | 45,000,000 | | | | | | | | 153,000 | |
| | | | | | | | | | | | | | | | | | | | | | | | |
| | | | | | | | | | | | | | | | | | | | | | | | |
| | | | | | | | | | | | | | | | | | | | | | | | |
| See footnotes on next page | | | | | | | | | | | | | | | | | | | | | | | |
| | | | | | | | | | | | | | | | | | | | | | | | |
p. 16
Kite Realty Group Trust Supplemental Financial and Operating Statistics –9/30/14
MATURITY SCHEDULE OF OUTSTANDING DEBT AS OF SEPTEMBER 30, 2014 (CONTINUED)
| | | | | | | | | |
| Property | Lender(s) | Loan Type | Interest Rate1 | Maturity Date | Total Commitment | Balance as of Sept. 30, 2014 | % of Total Outstanding | Monthly Debt Service as of Sept. 30, 2014 |
| Saxon Crossing | CMBS | Fixed Rate | 4.65% | 7/1/22 | | $ 11,400,000 | | $ 45,648 |
| Merrimack Village Center | CMBS | Fixed Rate | 4.36% | 7/6/22 | | 5,445,000 | | 20,443 |
| Shops at Moore | CMBS | Fixed Rate | 4.29% | 9/1/22 | | 21,300,000 | | 78,658 |
| Shops at Julington Creek | CMBS | Fixed Rate | 4.60% | 9/1/22 | | 4,785,000 | | 18,954 |
City Center2 | Bank of America | Other Variable | LIBOR + 245 | 9/28/22 | | 90,000,000 | | 201,894 |
| Centre Point Commons | CMBS | Fixed Rate | 4.34% | 10/1/22 | | 14,410,000 | | 53,835 |
| Miramar Square | CMBS | Fixed Rate | 4.16% | 12/1/22 | | 31,625,000 | | 113,288 |
| 2022 Debt Maturities | | | | | | 249,123,887 | 16.3% | |
| | | | | | | | | |
Centennial Gateway/Eastgate2 | CMBS | Fixed Rate | 3.81% | 1/1/23 | | 44,385,000 | | 145,658 |
Centennial Center2 | CMBS | Fixed Rate | 3.83% | 1/6/23 | | 70,455,000 | | 232,456 |
Eastern Beltway2 | CMBS | Fixed Rate | 3.83% | 1/6/23 | | 34,100,000 | | 112,508 |
| Corner, The | CMBS | Fixed Rate | 4.10% | 3/1/23 | | 14,750,000 | | 52,095 |
| 2023 Debt Maturities | | | | | | 163,690,000 | 10.7% | |
| | | | | | | | | |
| NET PREMIUMS ON ACQUIRED DEBT | | | | | 27,460,433 | | |
| TOTAL KRG DEBT (Consolidated and KRG Share of Unconsolidated) | | | $1,556,495,902 | | |
| | | | | | | | | |
| ____________________ |
| 1 | At September 30, 2014, one-month LIBOR interest rate was 0.15%. |
| 2 | Property is held in a joint venture. The loan is guaranteed by Kite Realty Group, LP. See Joint Venture Summary page for additional detail. |
| 3 | Loan has two one year extension options. |
| 4 | Loan has a two year extension option. |
| 5 | Loan has a four year extension option. |
| 6 | Loan has a five year extension option. |
| 7 | Loan has a one year extension option. |
| 8 | Assumes Company exercises its option to extend the maturity date by one year. |
| 9 | The Company has 84 unencumbered properties of which 76 are wholly owned and are guarantors under the unsecured credit facility and unsecured term loan. |
| 10 | Assumes Company exercises its option to extend the maturity date by six months. |
| | |
p. 17
Kite Realty Group Trust Supplemental Financial and Operating Statistics –9/30/14
SCHEDULE OF OUTSTANDING DEBT AS OF SEPTEMBER 30, 2014 (CONTINUED)
Floating Rate Debt Hedged1 | | | | | | | | | | |
| Lender | Loan Type | | LIBOR Hedge Rate | | Maturity Date | | Balance as of Sept. 30, 2014 | | | Monthly Debt Service as of Sept. 30, 2014 | |
| US Bank | Variable Rate | | | 0.26 | % | 11/18/2014 | | $ | 56,000,000 | | | $ | 12,250 | |
Associated Bank1 | Variable Rate | | | 1.35 | % | 12/31/2016 | | | 15,100,000 | | | | 16,955 | |
| KeyBank | Variable Rate | | | 3.31 | % | 1/3/2017 | | | 14,043,793 | | | | 38,737 | |
| Huntington Bank | Variable Rate | | | 0.98 | % | 10/1/2017 | | | 24,750,000 | | | | 20,213 | |
| Capital One | Variable Rate | | | 1.01 | % | 12/20/2017 | | | 9,900,000 | | | | 8,333 | |
| Various Banks | Variable Rate | | | 0.91 | % | 2/26/2018 | | | 50,000,000 | | | | 37,750 | |
| JP Morgan | Variable Rate | | | 1.49 | % | 8/21/2018 | | | 40,950,000 | | | | 50,710 | |
| Capital One | Variable Rate | | | 2.97 | % | 12/10/2018 | | | 49,331,348 | | | | 121,890 | |
| Bank of America | Variable Rate | | | 1.40 | % | 3/29/2019 | | | 45,000,000 | | | | 52,313 | |
Various Banks1 | Variable Rate | | | 1.52 | % | 4/30/2019 | | | 125,000,000 | | | | 158,167 | |
| Old National | Variable Rate | | | 1.33 | % | 1/4/2020 | | | 10,000,000 | | | | 11,083 | |
| Associated Bank | Variable Rate | | | 2.12 | % | 1/15/2020 | | | 16,200,000 | | | | 28,620 | |
| | | | | | | | | | | | | | | |
| Total | | | | | | | | $ | 456,275,141 | | | | | |
| ____________________ |
| 1 | Calculations on Hedged Debt assume a weighted average spread over LIBOR on all variable rate debt, as the hedges are designated with various pieces of debt. |
The following loans and hedges are associated with assets held for sale and are anticipated to be assumed or prepaid at closing.
| Loans | | | | | | | | | | | | |
| Property | Lender | Loan Type | | Interest Rate | | Maturity Date | | Balance as of Sept. 30, 2014 | | | Monthly Debt Service as of Sept. 30, 2014 | |
| Regal Court | CMBS | Fixed Rate | | | 5.30 | % | 6/1/15 | | $ | 23,900,000 | | | $ | 109,077 | |
| TJ Maxx at Branson | CMBS | Fixed Rate | | | 5.78 | % | 5/11/16 | | | 3,016,549 | | | | 18,443 | |
| Shoppes at Prairie Ridge | PNC Bank | Other Variable | | LIBOR + 250 | | 6/22/16 | | | 15,591,446 | | | | 33,409 | |
| Fox Point Plaza | PNC Bank, NA | Other Variable | | LIBOR + 225 | | 10/21/16 | | | 10,836,530 | | | | 23,214 | |
| Branson Hills Shopping Center | PNC Bank, NA | Other Variable | | LIBOR + 225 | | 5/9/17 | | | 20,240,000 | | | | 39,294 | |
| Kohl's at Branson | CMBS | Fixed Rate | | | 5.95 | % | 11/11/17 | | | 6,554,189 | | | | 39,955 | |
| Copps Grocery | Parkway Bank and Trust Company | Fixed Rate | | | 3.95 | % | 9/26/18 | | | 8,375,400 | | | | 28,488 | |
| Prattville Town Center | CMBS | Fixed Rate | | | 5.48 | % | 5/1/21 | | | 15,930,000 | | | | 75,103 | |
| Heritage Square | CMBS | Fixed Rate | | | 5.10 | % | 7/1/21 | | | 4,460,000 | | | | 19,587 | |
| Walgreens Plaza | CMBS | Fixed Rate | | | 5.30 | % | 7/1/21 | | | 4,650,000 | | | | 21,238 | |
| Fairgrounds Crossing | CMBS | Fixed Rate | | | 5.21 | % | 10/6/21 | | | 13,453,000 | | | | 60,326 | |
| Harvest Square | CMBS | Fixed Rate | | | 4.65 | % | 1/1/22 | | | 6,800,000 | | | | 27,228 | |
| Eastside Junction | CMBS | Fixed Rate | | | 4.60 | % | 6/1/22 | | | 6,270,000 | | | | 24,836 | |
| Net Premiums on Acquired Debt | | | | | | | | | 4,238,950 | | | | | |
| Total | | | | | ** | | | | $ | 144,316,064 | | | | | |
| | | | | | | | | | | | | | | | |
| Hedges | Loan Type | | LIBOR Hedge Rate | | Maturity Date | | Balance as of Sept. 30, 2014 | | | Monthly Debt Service as of Sept. 30, 2014 | |
| Lender |
| PNC Bank | Variable Rate (Hedged) | | | 1.97 | % | 6/22/2016 | | $ | 13,358,984 | | | $ | 21,931 | |
| PNC Bank | Variable Rate (Hedged) | | | 1.50 | % | 10/21/2016 | | | 10,836,530 | | | | 13,546 | |
| PNC Bank | Variable Rate (Hedged) | | | 1.13 | % | 5/9/2017 | | | 10,150,000 | | | | 9,558 | |
| Total | | | | | ** | | | | $ | 34,345,514 | | | | | |
| ____________________ |
| ** | Weighted average interest rate, including hedged portion, is 4.61%. |
p. 18
Kite Realty Group Trust Supplemental Financial and Operating Statistics –9/30/14
TOP 10 RETAIL TENANTS BY GROSS LEASABLE AREA (GLA)
As of September 30, 2014
This table includes the following:
| · | Operating retail properties; |
| · | Operating office properties; and |
| · | Development property tenants open for business or ground lease tenants who commenced paying rent as of September 30, 2014. |
| Tenant | | Number of Stores | | | Total GLA | | | Number of Leases | | | Company Owned GLA1 | | | Number of Anchor Owned Locations | | | Anchor Owned GLA2 | |
| Target | | | 19 | | | | 2,716,833 | | | | 0 | | | | 0 | | | | 19 | | | | 2,716,833 | |
| Lowe’s Home Improvement | | | 17 | | | | 1,897,998 | | | | 5 | | | | 128,997 | | | | 12 | | | | 1,769,001 | |
| Wal-Mart | | | 15 | | | | 1,836,157 | | | | 6 | | | | 203,742 | | | | 9 | | | | 1,632,415 | |
| Publix | | | 20 | | | | 959,422 | | | | 20 | | | | 959,422 | | | | 0 | | | | 0 | |
| Kohl’s | | | 12 | | | | 703,369 | | | | 7 | | | | 253,241 | | | | 5 | | | | 450,128 | |
TJX Companies4 | | | 21 | | | | 642,557 | | | | 21 | | | | 642,557 | | | | 0 | | | | 0 | |
| Dick's Sporting Goods | | | 10 | | | | 490,622 | | | | 10 | | | | 490,622 | | | | 0 | | | | 0 | |
| Ross Dress for Less | | | 16 | | | | 460,580 | | | | 16 | | | | 460,580 | | | | 0 | | | | 0 | |
| PetSmart | | | 22 | | | | 453,063 | | | | 22 | | | | 453,063 | | | | 0 | | | | 0 | |
Bed Bath & Beyond3 | | | 16 | | | | 433,053 | | | | 16 | | | | 433,053 | | | | 0 | | | | 0 | |
| Total | | | 168 | | | | 10,593,654 | | | | 123 | | | | 4,025,277 | | | | 45 | | | | 6,568,377 | |
| ____________________ |
| 1 | Excludes the estimated size of the structures located on land owned by the Company and ground leased to tenants. |
| 2 | Includes the estimated size of the structures located on land owned by the Company and ground leased to tenants. |
| 3 | Includes Buy Buy Baby, Christmas Tree Shops and Cost Plus, which are owned by the same parent company. |
| 4 | Includes TJ Maxx, HomeGoods and Marshalls, which are owned by the same parent company. |
| | |
p. 19
Kite Realty Group Trust Supplemental Financial and Operating Statistics –9/30/14
TOP 25 TENANTS BY ANNUALIZED BASE RENT
As of September 30, 2014
This table includes the following:
| · | Operating retail properties; |
| · | Operating office properties; and |
| · | Development property tenants open for business or ground lease tenants who commenced paying rent as of September 30, 2014. |
| Tenant | | Number of Stores | | | Leased GLA/NRA2 | | | % of Owned GLA/NRA of the Portfolio | | | Annualized Base Rent1 | | | Annualized Base Rent per Sq. Ft. | | | % of Total Portfolio Annualized Base Rent | |
| Publix | | | 20 | | | | 959,422 | | | | 5.6 | % | | $ | 9,446,607 | | | $ | 9.85 | | | | 3.5 | % |
| PetSmart | | | 22 | | | | 453,063 | | | | 2.7 | % | | | 6,693,272 | | | | 14.77 | | | | 2.5 | % |
TJX Companies4 | | | 21 | | | | 642,557 | | | | 3.8 | % | | | 6,164,825 | | | | 9.59 | | | | 2.3 | % |
| Office Depot/Office Max | | | 20 | | | | 412,204 | | | | 2.4 | % | | | 5,454,512 | | | | 13.23 | | | | 2.0 | % |
| Dick's Sporting Goods | | | 10 | | | | 490,622 | | | | 2.9 | % | | | 5,375,691 | | | | 10.96 | | | | 2.0 | % |
Lowe’s Home Improvement5 | | | 5 | | | | 128,997 | | | | 0.8 | % | | | 5,039,000 | | | | 6.51 | | | | 1.9 | % |
| Ross Dress for Less | | | 16 | | | | 460,580 | | | | 2.7 | % | | | 4,917,367 | | | | 10.68 | | | | 1.8 | % |
| Bed Bath & Beyond | | | 16 | | | | 433,053 | | | | 2.5 | % | | | 4,504,730 | | | | 10.40 | | | | 1.7 | % |
| Michaels | | | 15 | | | | 316,232 | | | | 1.9 | % | | | 4,086,266 | | | | 12.92 | | | | 1.5 | % |
Kohl’s5 | | | 7 | | | | 253,241 | | | | 1.5 | % | | | 3,893,839 | | | | 6.63 | | | | 1.5 | % |
| Best Buy | | | 8 | | | | 273,429 | | | | 1.6 | % | | | 3,833,090 | | | | 14.02 | | | | 1.4 | % |
Wal-Mart5 | | | 6 | | | | 203,742 | | | | 1.2 | % | | | 3,655,238 | | | | 3.60 | | | | 1.4 | % |
| Walgreens | | | 7 | | | | 107,331 | | | | 0.6 | % | | | 3,632,601 | | | | 33.84 | | | | 1.4 | % |
| LA Fitness | | | 5 | | | | 208,209 | | | | 1.2 | % | | | 3,363,098 | | | | 16.15 | | | | 1.3 | % |
| Sports Authority | | | 5 | | | | 211,739 | | | | 1.2 | % | | | 2,944,606 | | | | 13.91 | | | | 1.1 | % |
Toys “R” Us/Babies “R” Us3 | | | 5 | | | | 209,940 | | | | 1.2 | % | | | 2,765,780 | | | | 13.17 | | | | 1.0 | % |
| National Amusements | | | 1 | | | | 80,000 | | | | 0.5 | % | | | 2,716,800 | | | | 33.96 | | | | 1.0 | % |
| Petco | | | 11 | | | | 155,457 | | | | 0.9 | % | | | 2,529,271 | | | | 16.27 | | | | 0.9 | % |
| Nordstrom | | | 3 | | | | 103,904 | | | | 0.6 | % | | | 2,043,876 | | | | 19.67 | | | | 0.8 | % |
| Mattress Firm | | | 18 | | | | 72,991 | | | | 0.4 | % | | | 1,843,697 | | | | 25.26 | | | | 0.7 | % |
| Ulta Salon | | | 9 | | | | 96,649 | | | | 0.6 | % | | | 1,826,229 | | | | 18.90 | | | | 0.7 | % |
| New York Sports Club | | | 2 | | | | 86,717 | | | | 0.5 | % | | | 1,815,540 | | | | 20.94 | | | | 0.7 | % |
| Staples | | | 6 | | | | 116,362 | | | | 0.7 | % | | | 1,747,821 | | | | 15.02 | | | | 0.7 | % |
| Randalls Food & Drugs | | | 2 | | | | 133,990 | | | | 0.8 | % | | | 1,732,196 | | | | 12.93 | | | | 0.6 | % |
| Dollar Tree | | | 15 | | | | 153,776 | | | | 0.9 | % | | | 1,718,823 | | | | 11.18 | | | | 0.6 | % |
| TOTAL | | | | | | | 6,764,207 | | | | 39.6 | % | | $ | 93,744,775 | | | $ | 10.96 | | | | 35.1 | % |
| ____________________ |
| 1 | Annualized base rent represents the monthly contractual rent for the month of September 2014 for each applicable tenant multiplied by 12. Annualized base rent does not include tenant reimbursements. |
| 2 | Excludes the estimated size of the structures located on land owned by the Company and ground leased to tenants. |
| 3 | Includes Buy Buy Baby, Christmas Tree Shops and Cost Plus, which are owned by the same parent company. |
| 4 | Includes TJ Maxx, Marshalls and HomeGoods |
| 5 | Annualized base rent and percent of total portfolio annualized base rent includes ground lease rent. |
| | |
p. 20
Kite Realty Group Trust Supplemental Financial and Operating Statistics –9/30/14
RETAIL LEASING SUMMARY1 – THREE MONTHS ENDED SEPTEMBER 30, 2014
Category1 | | Total Leases | | | Total Sq. Ft. | | | Same Space Leases2 | | | Same Space Sq. Ft. | | | Prior Rent PSF3 | | | New Rent PSF4,5 | | | Rent Spread | | | Same Space TI PSF | |
| | | | | | | | | | | | | | | | | | | | | | | | | |
| New Leases | | | 28 | | | | 172,799 | | | | 15 | | | | 68,834 | | | $ | 13.91 | | | $ | 20.03 | | | | 43.9 | % | | $ | 11.97 | |
| | | | | | | | | | | | | | | | | | | | | | | | | | | | | | | | | |
| Renewal and Options | | | 36 | | | | 251,717 | | | | 36 | | | | 251,717 | | | $ | 13.92 | | | $ | 14.80 | | | | 6.3 | % | | $ | 0.41 | |
| | | | | | | | | | | | | | | | | | | | | | | | | | | | | | | | | |
| Total New, Renewal, and Options | | | 64 | | | | 424,516 | | | | 51 | | | | 320,551 | | | $ | 13.92 | | | $ | 15.92 | | | | 14.4 | % | | $ | 2.89 | |
| ________________ |
| 1 | Leases on this report represent retail properties only. Office leases are shown as non-comparable and ground leases are excluded. |
| 2 | Comparable leases represent those leases signed for which there was a former tenant within the last 12 months. |
| 3 | Prior rent represents minimum rent, if any, paid by the prior tenant in the final 12 months of the term. |
| 4 | All amounts reported at lease execution. |
| 5 | Contractual rent represents contractual minimum rent per square foot for the first twelve months of the lease |
| | |
p. 21
Kite Realty Group Trust Supplemental Financial and Operating Statistics –9/30/14
LEASE EXPIRATIONS – OPERATING PORTFOLIO
As of September 30, 2014
This table includes the following:
| · | Operating retail properties; |
| · | Operating office properties; and |
| · | Development property tenants open for business or ground lease tenants who commenced paying rent as of September 30, 2014. |
| | Number of Expiring Leases1 | | Expiring GLA/NRA2 | | % of Total GLA/NRA Expiring | | Expiring Annualized Base Rent3 | | % of Total Annualized Base Rent | | Expiring Annualized Base Rent per Sq. Ft. | | Expiring Ground Lease Revenue |
| 2014 | 78 | | 267,414 | | 1.6% | | $ | 4,299,663 | | 1.7% | | $ | 16.08 | | $ | 255,475 |
| 2015 | 242 | | 1,270,581 | | 7.7% | | | 18,226,851 | | 7.3% | | | 14.35 | | | 143,650 |
| 2016 | 290 | | 1,628,755 | | 9.8% | | | 21,707,166 | | 8.7% | | | 13.33 | | | 0 |
| 2017 | 299 | | 1,800,467 | | 10.8% | | | 28,092,746 | | 11.3% | | | 15.60 | | | 512,556 |
| 2018 | 350 | | 2,239,022 | | 13.5% | | | 35,978,036 | | 14.4% | | | 16.07 | | | 1,037,875 |
| 2019 | 268 | | 1,727,344 | | 10.4% | | | 28,025,344 | | 11.2% | | | 16.22 | | | 643,470 |
| 2020 | 120 | | 1,589,883 | | 9.6% | | | 18,795,103 | | 7.5% | | | 11.82 | | | 1,492,445 |
| 2021 | 93 | | 862,398 | | 5.2% | | | 12,271,774 | | 4.9% | | | 14.23 | | | 580,525 |
| 2022 | 94 | | 879,742 | | 5.3% | | | 14,406,067 | | 5.8% | | | 16.38 | | | 1,185,782 |
| 2023 | 117 | | 1,013,533 | | 6.1% | | | 16,110,790 | | 6.5% | | | 15.90 | | | 359,523 |
| Beyond | 233 | | 3,319,074 | | 20.0% | | | 51,732,552 | | 20.7% | | | 15.59 | | | 12,360,559 |
| | 2,184 | | 16,598,213 | | 100.0% | | $ | 249,646,094 | | 100.0% | | $ | 15.04 | | $ | 18,571,860 |
| ____________________ |
| 1 | Lease expiration table reflects rents in place as of September 30, 2014 and does not include option periods; 2014 expirations include 44 month-to-month tenants. This column also excludes ground leases. |
| 2 | Expiring GLA excludes estimated square footage attributable to non-owned structures on land owned by the Company and ground leased to tenants. |
| 3 | Annualized base rent represents the monthly contractual rent for the month of September 2014 for each applicable tenant multiplied by 12. Excludes tenant reimbursements and ground lease revenue. |
p. 22
Kite Realty Group Trust Supplemental Financial and Operating Statistics –9/30/14
LEASE EXPIRATIONS – RETAIL ANCHOR TENANTS1
As of September 30, 2014
This table includes the following:
| · | Operating retail properties; and |
| · | Development property tenants open for business or ground lease tenants who commenced paying rent as of September 30, 2014. |
| | Number of Expiring Leases2 | | Expiring GLA/NRA3 | | % of Total GLA/NRA Expiring | | Expiring Annualized Base Rent4 | | % of Total Annualized Base Rent | | Expiring Annualized Base Rent per Sq. Ft. | | Expiring Ground Lease Revenue |
| 2014 | 4 | | 105,033 | | 0.6% | | $ | 867,086 | | 0.4% | | $ | 8.26 | | $ | 0 |
| 2015 | 23 | | 692,473 | | 4.2% | | | 6,432,402 | | 2.6% | | | 9.29 | | | 0 |
| 2016 | 32 | | 983,677 | | 5.9% | | | 8,404,600 | | 3.4% | | | 8.54 | | | 0 |
| 2017 | 44 | | 1,106,078 | | 6.7% | | | 12,920,310 | | 5.1% | | | 11.68 | | | 0 |
| 2018 | 55 | | 1,452,200 | | 8.8% | | | 17,168,014 | | 6.9% | | | 11.82 | | | 644,149 |
| 2019 | 43 | | 1,156,444 | | 7.0% | | | 14,604,497 | | 5.9% | | | 12.63 | | | 0 |
| 2020 | 40 | | 1,353,513 | | 8.2% | | | 13,861,921 | | 5.6% | | | 10.24 | | | 1,110,883 |
| 2021 | 24 | | 663,293 | | 4.0% | | | 7,270,534 | | 2.9% | | | 10.96 | | | 0 |
| 2022 | 27 | | 616,349 | | 3.7% | | | 8,346,496 | | 3.3% | | | 13.54 | | | 744,622 |
| 2023 | 28 | | 679,943 | | 4.1% | | | 8,271,605 | | 3.3% | | | 12.17 | | | 260,000 |
| Beyond | 83 | | 2,827,618 | | 17.0% | | | 40,164,597 | | 16.0% | | | 14.20 | | | 8,248,014 |
| | 403 | | 11,636,621 | | 70.1% | | $ | 138,312,062 | | 55.4% | | $ | 11.89 | | $ | 11,007,667 |
| ____________________ |
| 1 | Retail anchor tenants are defined as tenants that occupy 10,000 square feet or more. |
| 2 | Lease expiration table reflects rents in place as of September 30, 2014 and does not include option periods; 2014 expirations include 3 month-to-month tenants. This column also excludes ground leases. |
| 3 | Expiring GLA excludes square footage for non-owned ground lease structures on land we own and ground leased to tenants. |
| 4 | Annualized base rent represents the monthly contractual rent for the month of September 2014 for each applicable property multiplied by 12. Excludes tenant reimbursements and ground lease revenue. |
p. 23
Kite Realty Group Trust Supplemental Financial and Operating Statistics –9/30/14
LEASE EXPIRATIONS – RETAIL SHOPS
As of September 30, 2014
This table includes the following:
| · | Operating retail properties; and |
| · | Development property tenants open for business as of September 30, 2014. |
| | | Number of Expiring Leases1 | | Expiring GLA/NRA1,2 | | % of Total GLA/NRA Expiring | | Expiring Annualized Base Rent3 | | % of Total Annualized Base Rent | | Expiring Annualized Base Rent per Sq. Ft. | | | Expiring Ground Lease Revenue |
| 2014 | | 74 | | 162,381 | | 1.0% | | $ | 3,432,576 | | 1.5% | | $ | 21.14 | | $ | 255,475 |
| 2015 | | 217 | | 539,524 | | 3.3% | | | 11,064,993 | | 4.4% | | | 20.51 | | | 143,650 |
| 2016 | | 258 | | 645,078 | | 3.9% | | | 13,302,566 | | 5.3% | | | 20.62 | | | 0 |
| 2017 | | 253 | | 611,279 | | 3.7% | | | 13,676,589 | | 5.5% | | | 22.37 | | | 512,556 |
| 2018 | | 293 | | 768,985 | | 4.6% | | | 18,426,450 | | 7.4% | | | 23.96 | | | 393,727 |
| 2019 | | 224 | | 565,647 | | 3.4% | | | 13,319,727 | | 5.3% | | | 23.55 | | | 643,470 |
| 2020 | | 79 | | 226,301 | | 1.4% | | | 4,749,414 | | 1.9% | | | 20.99 | | | 381,562 |
| 2021 | | 68 | | 192,943 | | 1.2% | | | 4,859,509 | | 2.0% | | | 25.19 | | | 580,525 |
| 2022 | | 64 | | 212,347 | | 1.3% | | | 5,185,953 | | 2.1% | | | 24.42 | | | 441,160 |
| 2023 | | 87 | | 300,602 | | 1.8% | | | 7,170,997 | | 2.9% | | | 23.86 | | | 99,522 |
| Beyond | | 146 | | 384,532 | | 2.3% | | | 10,151,532 | | 4.2% | | | 26.40 | | | 4,112,546 |
| | | 1,763 | | 4,609,619 | | 27.8% | | $ | 105,340,306 | | 42.2% | | $ | 22.85 | | $ | 7,564,193 |
| ____________________ |
| 1 | Lease expiration table reflects rents in place as of September 30, 2014, and does not include option periods; 2014 expirations include 41 month-to-month tenants. This column also excludes ground leases. |
| 2 | Expiring GLA excludes estimated square footage to non-owned structures on land we own and ground leased to tenants. |
| 3 | Annualized base rent represents the monthly contractual rent for the month of September 2014 for each applicable property multiplied by 12. Excludes tenant reimbursements and ground lease revenue. |
p. 24
Kite Realty Group Trust Supplemental Financial and Operating Statistics –9/30/14
LEASE EXPIRATIONS – OFFICE TENANTS
As of September 30, 2014
| | Number of Expiring Leases1 | | Expiring NLA1 | | % of Total NRA Expiring | | Expiring Annualized Base Rent2 | | % of Total Annualized Base Rent | | Expiring Annualized Base Rent per Sq. Ft. |
| 2014 | 0 | | 0 | | 0.0% | | $ | 0 | | 0.0% | | $ | 0.00 |
| 2015 | 2 | | 38,584 | | 0.2% | | | 729,456 | | 0.3% | | | 18.91 |
| 2016 | 0 | | 0 | | 0.0% | | | 0 | | 0.0% | | | 0.00 |
| 2017 | 2 | | 83,110 | | 0.5% | | | 1,495,847 | | 0.6% | | | 18.00 |
| 2018 | 2 | | 17,837 | | 0.1% | | | 383,572 | | 0.2% | | | 21.50 |
| 2019 | 1 | | 5,253 | | 0.0% | | | 101,120 | | 0.0% | | | 19.25 |
| 2020 | 1 | | 10,069 | | 0.1% | | | 183,768 | | 0.1% | | | 18.25 |
| 2021 | 1 | | 6,162 | | 0.0% | | | 141,732 | | 0.1% | | | 23.00 |
| 2022 | 3 | | 51,046 | | 0.3% | | | 873,619 | | 0.4% | | | 17.11 |
| 2023 | 2 | | 32,988 | | 0.2% | | | 668,189 | | 0.3% | | | 20.26 |
| Beyond | 4 | | 106,924 | | 0.6% | | | 1,416,423 | | 0.6% | | | 13.25 |
| | 18 | | 351,973 | | 2.1% | | $ | 5,993,726 | | 2.4% | | $ | 17.03 |
| ____________________ |
| 1 | Lease expiration table reflects rents in place as of September 30, 2014 and does not include option periods. This column also excludes ground leases. |
| 2 | Annualized base rent represents the monthly contractual rent for the month of September 2014 for each applicable property multiplied by 12. Excludes tenant reimbursements. |
| | |
p. 25
Kite Realty Group Trust Supplemental Financial and Operating Statistics –9/30/14
SUMMARY RETAIL PORTFOLIO STATISTICS INCLUDING JOINT VENTURE PROPERTIES
| | | September 30, 2014 | | | June 30, 2014 | | | March 31, 2014 | | | December 31, 2013 | | | September 30, 2013 | |
Company Owned GLA – Operating Retail1 | | | 16,935,582 | | | | 8,489,877 | | | | 8,483,449 | | | | 8,358,846 | | | | 6,065,122 | |
Total GLA – Operating Retail1 | | | 25,213,668 | | | | 11,296,321 | | | | 11,295,013 | | | | 11,463,830 | | | | 8,483,361 | |
| Projected Owned GLA of Development and Redevelopment Projects Under Construction | | | 665,246 | | | | 831,698 | | | | 914,636 | | | | 879,754 | | | | 1,199,235 | |
Projected Total GLA of Development and Redevelopment Projects Under Construction2 | | | 888,641 | | | | 1,055,093 | | | | 1,138,031 | | | | 1,073,890 | | | | 1,570,540 | |
| Number of Operating Retail Properties | | | 124 | | | | 64 | | | | 64 | | | | 66 | | | | 55 | |
| Number of Retail Development Properties Under Construction | | | 3 | | | | 3 | | | | 2 | | | | 2 | | | | 3 | |
| Number of Retail Redevelopment Properties | | | 3 | | | | 4 | | | | 4 | | | | 4 | | | | 5 | |
Percentage Leased – Operating Retail4 | | | 94.9 | % | | | 95.2 | % | | | 95.3 | % | | | 95.3 | % | | | 95.9 | % |
Annualized Base Rent & Ground Lease Revenue – Operating Retail Properties3 (excludes redevelopment) | | $ | 258,706,533 | | | $ | 112,602,606 | | | $ | 112,631,533 | | | $ | 108,829,221 | | | $ | 80,106,832 | |
| | | | | | | | | | | | | | | | | | | | | |
| ____________________ |
| 1 | Company Owned GLA represents gross leasable area owned by the Company. Total GLA includes Company Owned GLA, plus square footage attributable to non-owned outlot structures on land owned by the Company and ground leased to tenants, and non-owned anchor space. |
| 2 | Projected Company Owned GLA Under Development or Redevelopment represents gross leasable area under development that is projected to be owned by the Company. Projected Total GLA Under Development or Redevelopment includes Projected Company Owned GLA, plus projected square footage attributable to non-owned outlot structures on land owned by the Company and ground leased to tenants, and non-owned anchor space that is existing or under construction. |
| 3 | Annualized Base Rent represents the monthly contractual rent in effect for each period shown, multiplied by 12. Excludes tenant reimbursements. |
| 4 | Excludes square footage of structure owned by tenants under ground leases with the Company. |
p. 26
Kite Realty Group Trust Supplemental Financial and Operating Statistics –9/30/14
SUMMARY OFFICE PORTFOLIO STATISTICS
| Retail Portfolio | | September 30, 2014 | | | June 30, 2014 | | | March 31, 2014 | | | December 31, 2013 | | | September 30, 2013 | |
Company Owned Net Rentable Area (NRA)1 | | | 386,852 | | | | 386,852 | | | | 386,852 | | | | 386,852 | | | | 379,974 | |
Number of Operating Office Properties4 | | | 2 | | | | 2 | | | | 2 | | | | 2 | | | | 2 | |
| Percentage Leased – Operating Office Properties | | | 95.2 | % | | | 95.2 | % | | | 95.2 | % | | | 95.2 | % | | | 94.2 | % |
Annualized Base Rent – Office Properties2,3 | | $ | 5,993,727 | | | $ | 5,993,727 | | | $ | 5,993,732 | | | $ | 5,941,788 | | | $ | 5,936,163 | |
| ____________________ |
| 1 | Company Owned NRA does not include square footage of Union Station Parking Garage, a detached parking garage supporting the Thirty South Meridian property that includes approximately 850 parking spaces. It is managed by a third party. |
| 2 | Annualized Base Rent does not include tenant reimbursements or income attributable to the Union Station Parking Garage. |
| 3 | Annualized Base Rent includes $723,216 from KRG and subsidiaries. |
| 4 | Includes the office space at Eddy Street Commons. |
p. 27
Kite Realty Group Trust Supplemental Financial and Operating Statistics –9/30/14
DEVELOPMENT PROJECTS
Under Construction: | | | | | | | | | | |
| Project | Company Ownership % | MSA | Actual/ Projected Opening Date1 | Projected Owned GLA2 | Projected Total GLA3 | Percent of Owned GLA Occupied4 | Percent of Owned GLA Pre-Leased/ Committed5 | Total Estimated Project Cost7 | Cost Incurred as of Sept. 30, 20146 | | Major Tenants and Non-owned Anchors |
| Holly Springs Towne Center, NC - Phase II | 100% | Raleigh | Q3 2015 | 122,143 | 154,143 | 0.0% | 77.6% | $47,500 | $17,773 | | Target (non-owned), Carmike Cinemas, Bed Bath & Beyond, DSW |
Parkside Town Commons, NC – Phase I8 | 100% | Raleigh | Q2 2014 | 104,978 | 245,573 | 77.8% | 90.2% | 39,000 | 38,760 | | Target (non-owned), Harris Teeter (ground lease), Petco |
| Parkside Town Commons, NC – Phase II | 100% | Raleigh | Q3 2014 | 275,432 | 324,260 | 30.9% | 66.8% | 70,000 | 54,265 | | Frank Theatres, Golf Galaxy, Field & Stream |
| Total | | 502,553 | 723,976 | 33.2% | 74.3% | $156,500 | $110,798 | | |
Cost incurred as of September 30, 2014 included in Construction In Progress on balance sheet | | | $59,889 | | |
| ____________________ |
| 1 | Opening Date is defined as the first date a tenant is open for business or a ground lease payment is made. Stabilization (i.e., 85% occupied) typically occurs within six to twelve months after the opening date. |
| 2 | Projected Owned GLA represents gross leasable area we project we will own. It excludes square footage that we project will be attributable to non-owned outlot structures on land owned by us and expected to be ground leased to tenants. It also excludes non-owned anchor space. |
| 3 | Projected Total GLA includes Projected Owned GLA, projected square footage attributable to non-owned outlot structures on land that we own, and non-owned anchor space that currently exists or is under construction. |
| 4 | Includes tenants that have taken possession of their space or have begun paying rent. |
| 5 | Excludes outlot land parcels owned by the Company and ground leased to tenants. Includes leases under negotiation for approximately 15,113 square feet for which the Company has signed non-binding letters of intent. |
| 6 | Dollars in thousands. Reflects both the Company’s and partners’ share of costs. |
| 7 | Cost incurred is reclassified to fixed assets on the consolidated balance sheet on a pro-rata basis as portions of the asset are placed in service. |
| 8 | The owned GLA for Parkside Town Commons Phase I includes a 53,000 square foot ground lease with Harris Teeter Supermarket. |
| | |
p. 28
Kite Realty Group Trust Supplemental Financial and Operating Statistics –9/30/14
REDEVELOPMENT PROJECTS
Under Construction: | | | | | | | |
Project | Company Ownership % | MSA | Actual/ Projected Opening Date1 | Projected Total GLA3 | Projected Owned GLA2 | Percent of Owned GLA Occupied4 | Percent of Owned GLA Pre-Leased/ Committed5 | Total Estimated Project Cost7 | Cost Incurred as of Sept. 30, 20146 | | Major Tenants and Non-owned Anchors |
| Gainesville Plaza, FL | 100% | Gainesville | Q2 2015 | 164,665 | 162,693 | 66.3% | 81.6% | 14,300 | $6,023 | | Burlington Coat Factory, Ross Dress for Less |
| | | | | | | | | | | | |
| Total | | | | 164,665 | 162,693 | 66.3% | 81.6% | $14,300 | $6,023 | | |
Cost incurred as of September 30, 2014 included in Construction In Progress on balance sheet | | $3,086 | | |
Pending Commencement of Construction: | | | | | | |
Project | Company Ownership % | MSA | Actual/ Projected Opening Date1 | Projected Total GLA3 | Projected Owned GLA2 | Total Estimated Project Cost7 | Cost Incurred as of Sept. 30, 20146 | | Major Tenants and Non-owned Anchors |
| Hamilton Crossing Centre, IN | 100% | Indianapolis | TBD | 77,296 | 69,596 | TBD | $135 | | TBD |
| Courthouse Shadows, FL | 100% | Naples | TBD | 134,867 | 134,867 | TBD | 534 | | Grocer, Office Max |
| Total | | 212,163 | 204,463 | TBD | $669 | | |
Cost incurred as of September 30, 2014 included in Construction In Progress on balance sheet | | $669 | | |
Summary of Construction In Progress on Consolidated Balance Sheet ($ in thousands): | |
| Cost incurred for development projects under construction | | $ | 59,889 | |
| Cost incurred for redevelopment projects under construction | | | 3,086 | |
| Cost incurred for redevelopment projects pending construction | | | 669 | |
| Deerwood apartments | | | 14,659 | |
| Holly Springs Towne Center – Phase III | | | 4,367 | |
| Miscellaneous tenant improvements and small projects | | | 17,483 | |
| Construction In Progress on Consolidated Balance Sheet | | $ | 100,153 | |
| |
| | See prior page for footnotes. |
| | |
p. 29
Kite Realty Group Trust Supplemental Financial and Operating Statistics –9/30/14
2014 PROPERTY DISPOSITIONS
Property Name | Property Type | MSA | Date Sold | | Sales Price | |
50th & 12th | Single tenant (Walgreens) | Seattle, WA | 1/7/14 | | $ | 8,640,000 | |
| Red Bank Commons | Unanchored strip center | Evansville, IN | 3/7/14 | | | 5,300,000 | |
| Ridge Plaza | A & P Grocery-anchored center | Oak Ridge, NJ | 3/31/14 | | | 21,250,000 | |
| Zionsville Walgreens | Single tenant (Walgreens) | Indianapolis, IN | 9/23/14 | | | 7,348,000 | |
| Total | | | | | $ | 42,538,000 | |
| ____________________ |
| 1 | Company under definitive agreement to sell 15 operating properties. |
| | |
p. 30
Kite Realty Group Trust Supplemental Financial and Operating Statistics –9/30/14
GEOGRAPHIC DIVERSIFICATION – OPERATING PORTFOLIO
As of September 30, 2014
| | Number of Operating Properties1 | | Owned GLA/NRA2 | | Percent of Owned GLA/NRA | | Total Number of Leases | | Annualized Base Rent3 | | Percent of Annualized Base Rent | | Annualized Base Rent per Leased Sq. Ft. |
| Alabama | 5 | | 831,781 | | 4.8% | | 91 | | $ | 8,991,263 | | 3.6% | | $ | 11.33 |
| Arizona | 1 | | 79,902 | | 0.5% | | 10 | | | 2,241,241 | | 0.9% | | | 28.05 |
| Arkansas | 1 | | 151,927 | | 0.9% | | 14 | | | 1,926,306 | | 0.8% | | | 12.85 |
| Connecticut | 1 | | 208,929 | | 1.2% | | 24 | | | 3,241,084 | | 1.3% | | | 16.00 |
| Florida | 36 | | 4,353,316 | | 25.2% | | 614 | | | 59,671,453 | | 24.2% | | | 14.88 |
| Georgia | 5 | | 789,645 | | 4.6% | | 97 | | | 9,296,488 | | 3.8% | | | 12.09 |
| Illinois | 3 | | 310,865 | | 1.8% | | 23 | | | 4,095,850 | | 1.7% | | | 13.61 |
| Indiana | 21 | | 2,302,439 | | 13.3% | | 256 | | | 29,574,408 | | 12.0% | | | 13.32 |
| Indiana – Office | 2 | | 369,556 | | 2.1% | | 18 | | | 5,993,727 | | 2.4% | | | 17.03 |
| Louisiana | 1 | | 151,719 | | 0.9% | | 22 | | | 2,314,980 | | 0.9% | | | 19.58 |
| Missouri | 2 | | 365,937 | | 2.1% | | 36 | | | 4,493,188 | | 1.8% | | | 12.42 |
| Nebraska | 1 | | 69,676 | | 0.4% | | 2 | | | 992,226 | | 0.4% | | | 14.24 |
| Nevada | 6 | | 847,690 | | 4.9% | | 168 | | | 18,277,981 | | 7.4% | | | 23.37 |
| New Hampshire | 1 | | 78,892 | | 0.5% | | 14 | | | 963,807 | | 0.4% | | | 12.22 |
| New Jersey | 1 | | 106,383 | | 0.6% | | 26 | | | 2,870,700 | | 1.2% | | | 28.16 |
| New York | 1 | | 365,905 | | 2.1% | | 13 | | | 9,250,483 | | 3.8% | | | 25.85 |
| North Carolina | 8 | | 780,227 | | 4.5% | | 119 | | | 13,121,405 | | 5.3% | | | 17.74 |
| Ohio | 1 | | 236,230 | | 1.4% | | 7 | | | 2,062,668 | | 0.8% | | | 8.73 |
| Oklahoma | 4 | | 657,146 | | 3.8% | | 82 | | | 8,500,268 | | 3.4% | | | 13.48 |
| Oregon | 2 | | 31,171 | | 0.2% | | 13 | | | 553,894 | | 0.2% | | | 23.63 |
| South Carolina | 3 | | 516,732 | | 3.0% | | 42 | | | 5,494,462 | | 2.2% | | | 10.89 |
| Tennessee | 2 | | 403,776 | | 2.3% | | 34 | | | 5,461,354 | | 2.2% | | | 14.77 |
| Texas | 10 | | 1,951,840 | | 11.3% | | 201 | | | 25,950,265 | | 10.5% | | | 13.77 |
| Utah | 2 | | 384,692 | | 2.2% | | 75 | | | 6,262,204 | | 2.5% | | | 16.57 |
| Virginia | 1 | | 399,047 | | 2.3% | | 59 | | | 7,040,439 | | 2.9% | | | 18.69 |
| Washington | 1 | | 107,998 | | 0.6% | | 24 | | | 2,092,040 | | 0.8% | | | 21.36 |
| Wisconsin | 4 | | 451,717 | | 2.6% | | 53 | | | 5,910,115 | | 2.4% | | | 13.70 |
| Total | 126 | | 17,305,138 | | 100.0% | | 2,137 | | $ | 246,644,301 | | 100.0% | | $ | 15.02 |
| ____________________ |
| 1 | This table includes operating retail properties, operating office properties, and ground lease tenants who commenced paying rent as of September 30, 2014 and excludes three retail properties under redevelopment. |
| 2 | Owned GLA/NRA represents gross leasable area or net leasable area owned by the Company. It also excludes the square footage of Union Station Parking Garage. |
| 3 | Annualized Base Rent excludes $18,055,959 in annualized ground lease revenue attributable to parcels and outlots owned by the Company and ground leased to tenants. |
p. 31
Kite Realty Group Trust Supplemental Financial and Operating Statistics –9/30/14
OPERATING RETAIL PORTFOLIO SUMMARY REPORT
As of September 30, 2014
| | | Year | Owned GLA2 | | Leased | | | |
Property1 | MSA | Built/ Renovated | Total | Anchors | Shops | Total | Anchors | Shops | ABR per Sqft | Major Owned Tenants | Major Non-owned Tenants |
| Alabama | | | | | | | | | | | |
| Clay Marketplace | Birmingham | 1966/2003 | 66,165 | 44,840 | 21,325 | 94.7% | 100.0% | 83.5% | 12.60 | Publix | |
| Eastside Junction** | Athens | 2008 | 79,700 | 45,600 | 34,100 | 88.6% | 100.0% | 73.3% | 11.82 | Publix | |
| Harvest Square** | Harvest | 2008 | 70,590 | 45,600 | 24,990 | 93.2% | 100.0% | 80.8% | 14.97 | Publix | |
| Prattville Town Center** | Prattville | 2007 | 168,842 | 112,042 | 56,800 | 98.9% | 100.0% | 96.8% | 14.52 | Books A Million, Office Depot, PetSmart, Ross Dress for Less, TJ Maxx | Target, Home Depot |
| Trussville Promenade | Birmingham | 1999 | 446,484 | 354,010 | 92,474 | 95.7% | 100.0% | 79.4% | 9.26 | Wal-Mart, Regal Cinemas, Marshalls, Big Lots, PetSmart, Dollar Tree | Kohl's, Sam's Club |
| Arizona | | | | | | | | | | | |
| The Corner | Tucson | 2008 | 79,902 | 55,883 | 24,019 | 100.0% | 100.0% | 100.0% | 28.05 | Nordstrom Rack, Total Wine & More | Home Depot |
| Arkansas | | | | | | | | | | | |
| Fairgrounds Crossing** | Hot Springs | 2011 | 151,927 | 126,613 | 25,314 | 98.7% | 100.0% | 91.9% | 12.85 | Bed Bath & Beyond, Best Buy, Dick's Sporting Goods, Michaels, PetSmart | Sam’s Club |
| Connecticut | | | | | | | | | | | |
| Crossing at Killingly Commons | Killington | 2010 | 208,929 | 148,250 | 60,679 | 97.0% | 100.0% | 89.5% | 16.00 | Bed Bath & Beyond, Lowe's Home Improvement, Michaels, Petco, Staples, Stop & Shop Supermarket, TJ Maxx | Lowe's Home Improvement, Target |
| Florida | | | | | | | | | | | |
| 12th Street Plaza | Vero Beach | 1978/2003 | 138,268 | 121,376 | 16,892 | 99.0% | 100.0% | 91.7% | 9.82 | Publix, Stein Mart, Tuesday Morning, Sunshine Furniture, Planet Fitness | |
| Bayport Commons | Oldsmar | 2008 | 97,193 | 71,540 | 25,653 | 91.6% | 100.0% | 68.1% | 16.08 | Gander Mountain, PetSmart, Michaels | Target |
| Bolton Plaza | Jacksonville | 1986/2014 | 155,705 | 114,195 | 41,510 | 85.4% | 100.0% | 45.0% | 8.78 | LA Fitness, Academy Sports | |
| Burnt Store Promenade | Punta Gorda | 1989 | 94,223 | 42,112 | 52,111 | 74.9% | 100.0% | 54.6% | 8.99 | Publix | Home Depot |
| Centre Point Commons | Bradenton | 2007 | 119,275 | 93,574 | 25,701 | 98.8% | 100.0% | 94.6% | 17.07 | Best Buy, Dick's Sporting Goods, Office Depot | Lowe’s Home Improvement |
| Cobblestone Plaza | Ft Lauderdale | 2011 | 133,213 | 68,169 | 65,044 | 99.2% | 100.0% | 98.3% | 25.74 | Whole Foods, Party City, All Pets Emporium | |
| Colonial Square | Fort Myers | 2010 | 182,354 | 146,283 | 36,071 | 92.2% | 100.0% | 60.6% | 15.06 | Around the Clock Fitness, Dollar Tree, Hobby Lobby, PetSmart, Sports Authority | Kohl’s |
| Cove Center | Stuart | 1984/2008 | 155,053 | 130,915 | 24,138 | 96.2% | 100.0% | 75.5% | 9.10 | Publix, Bealls, Ace Hardware | |
| Delray Marketplace | Delray | 2013 | 260,255 | 118,136 | 142,119 | 89.8% | 100.0% | 81.4% | 24.01 | Frank Theatres, Publix, Jos. A. Bank, Carl’s Patio, Chico’s, Charming Charlie, Ann Taylor | |
| Estero Town Commons | Naples | 2006 | 25,631 | - | 25,631 | 46.8% | 0.0% | 46.8% | 18.67 | Lowe's Home Improvement | |
| Hunter's Creek Promenade | Orlando | 1994 | 119,729 | 55,999 | 63,730 | 100.0% | 100.0% | 100.0% | 13.00 | Publix | |
| Indian River Square | Vero Beach | 1997/2004 | 142,706 | 109,000 | 33,706 | 95.9% | 100.0% | 82.8% | 10.87 | Bealls, Office Depot, Dollar Tree | Target |
| International Speedway Square | Daytona | 1999/2013 | 233,495 | 203,457 | 30,038 | 99.5% | 100.0% | 96.0% | 10.96 | Bed Bath & Beyond, Stein Mart, Old Navy, Staples, Michaels, Dick’s Sporting Goods, Total Wine & More, Shoe Carnival | |
| King's Lake Square | Naples | 1986/2014 | 87,073 | 55,610 | 31,463 | 88.8% | 100.0% | 69.1% | 17.27 | Publix, Royal Fitness | |
| Lake City Commons | Lake City | 2008 | 66,510 | 45,600 | 20,910 | 88.9% | 100.0% | 64.6% | 13.38 | Publix | |
| Lake City Commons - Phase II | Lake City | 2011 | 16,291 | 12,131 | 4,160 | 100.0% | 100.0% | 100.0% | 14.86 | PetSmart | |
| Lake Mary Plaza | Lake Mary | 2009 | 21,370 | 14,880 | 6,490 | 91.4% | 100.0% | 71.6% | 37.71 | Walgreens | |
| Lakewood Promenade | Jacksonville | 1948/1998 | 196,820 | 77,840 | 118,980 | 84.1% | 100.0% | 73.7% | 11.27 | Stein Mart, Winn Dixie | |
| Lithia Crossing | Tampa | 2003/2013 | 90,499 | 53,547 | 36,952 | 89.9% | 100.0% | 75.3% | 13.99 | Stein Mart, The Fresh Market | |
| Miramar Square | Miramar | 2008 | 238,334 | 137,505 | 100,829 | 84.2% | 85.5% | 82.5% | 18.06 | Kohl's, Miami Children's Hospital, Dollar General | |
| Northdale Promenade | Tampa | 1985/2002 | 175,925 | 118,269 | 57,656 | 93.6% | 100.0% | 80.5% | 11.39 | TJ Maxx, Bealls, Crunch Fitness | Winn Dixie |
| Palm Coast Landing | Palm Coast | 2010 | 168,297 | 106,292 | 62,005 | 94.3% | 94.9% | 93.5% | 18.19 | Michaels, PetSmart, Ross Dress for Less, TJ Maxx, Ulta Salon | Target |
| Pine Ridge Crossing | Naples | 1993 | 105,867 | 66,351 | 39,516 | 98.0% | 100.0% | 94.5% | 16.25 | Publix, Party City | Bealls, Target |
See notes on page 36
p. 32
Kite Realty Group Trust Supplemental Financial and Operating Statistics –9/30/14
OPERATING RETAIL PORTFOLIO SUMMARY REPORT (CONTINUED)
As of September 30, 2014
| | | Year | Owned GLA2 | | Leased | | | |
Property1 | MSA | Built/ Renovated | Total | Anchors | Shops | Total | Anchors | Shops | ABR per Sq. ft. | Major Owned Tenants | Major Non-owned Tenants |
| Pleasant Hill Commons | Kissimmee | 2008 | 70,642 | 45,600 | 25,042 | 94.1% | 100.0% | 83.2% | 14.17 | Publix | |
| Publix at St. Cloud | St. Cloud | 2003 | 78,820 | 54,379 | 24,441 | 92.7% | 100.0% | 76.5% | 12.36 | Publix | |
| Riverchase Plaza | Naples | 1991/2001 | 78,291 | 48,890 | 29,401 | 98.5% | 100.0% | 95.9% | 15.28 | Publix | |
| Saxon Crossing | Orange City | 2009 | 119,894 | 95,304 | 24,590 | 100.0% | 100.0% | 100.0% | 14.70 | Hobby Lobby, LA Fitness | Lowe's Home Improvement |
| Shops at Eagle Creek | Naples | 1983/2013 | 70,755 | 50,187 | 20,568 | 89.7% | 100.0% | 64.5% | 14.80 | Staples, The Fresh Market | Lowe's Home Improvement |
| Shops of Eastwood | Orlando | 1997 | 69,037 | 51,512 | 17,525 | 98.1% | 100.0% | 92.6% | 12.68 | Publix | |
| Shops at Julington Creek | Jacksonville | 2011 | 40,207 | 21,038 | 19,169 | 96.4% | 100.0% | 92.5% | 18.16 | The Fresh Market | |
| Tarpon Bay Plaza | Naples | 2007 | 82,547 | 60,151 | 22,396 | 90.8% | 100.0% | 66.1% | 21.59 | World Market, Staples | Target |
| Temple Terrace | Temple Terrace | 2012 | 90,377 | 58,798 | 31,579 | 100.0% | 100.0% | 100.0% | 10.39 | Sweetbay, United Parcel Service | |
| The Landings at Tradition | Port St Lucie | 2007 | 359,758 | 272,944 | 86,814 | 90.4% | 100.0% | 60.1% | 15.18 | Babies “R” Us, Bed Bath & Beyond, LA Fitness, Michaels, Office Max, Old Navy, PetSmart, Pier 1, Sports Authority, TJ Maxx, Ulta Salon | Target |
| Tradition Village Square | Port St Lucie | 2006 | 112,421 | 45,600 | 66,821 | 78.2% | 100.0% | 63.4% | 15.34 | Publix | |
| Village Walk | Fort Myers | 2009 | 78,533 | 54,340 | 24,193 | 90.0% | 100.0% | 67.5% | 15.87 | Publix | |
| Waterford Lakes Village | Orlando | 1997 | 77,948 | 51,703 | 26,245 | 96.7% | 100.0% | 90.1% | 12.36 | Winn-Dixie | |
| Georgia | | | | | | | | | | | |
| Beechwood Promenade | Athens | 1961/2009 | 342,217 | 247,011 | 95,206 | 95.4% | 100.0% | 83.6% | 11.53 | TJ Maxx, Georgia Theatre, CVS, BodyPlex, Stein Mart, Tuesday Morning, The Fresh Market, Jos A. Bank, Ann Taylor, Talbots, USPS, Buffalos | |
| Heritage Square** | Conyers | 2010 | 22,385 | 10,479 | 11,906 | 88.8% | 100.0% | 79.0% | 34.18 | Walgreens | |
| Mullins Crossing | Evans | 2005 | 282,336 | 236,340 | 45,996 | 100.0% | 100.0% | 100.0% | 11.18 | Babies “R” Us, Kohl’s, La-Z Boy, Marshalls, Office Max, Ross Dress for Less, Petco | Target |
| Publix at Acworth | Atlanta | 1996 | 69,628 | 37,888 | 31,740 | 96.6% | 100.0% | 92.4% | 11.94 | Publix | |
| The Centre at Panola | Atlanta | 2001 | 73,079 | 51,674 | 21,405 | 100.0% | 100.0% | 100.0% | 12.21 | Publix | |
| Illinois | | | | | | | | | | | |
| Fox Lake Crossing | Chicago | 2002 | 99,072 | 65,977 | 33,095 | 90.0% | 100.0% | 69.9% | 13.48 | Dominick's Finer Foods, Dollar Tree | |
| Naperville Marketplace | Chicago | 2008 | 83,793 | 61,683 | 22,110 | 100.0% | 100.0% | 100.0% | 13.40 | TJ Maxx, PetSmart | Caputo's |
| South Elgin Commons | South Elgin | 2011 | 128,000 | 128,000 | - | 100.0% | 100.0% | 0.0% | 13.84 | LA Fitness, Ross Dress for Less, Toy “R” Us | Target |
Indiana | | | | | | | | | | | |
| 54th & College | Indianapolis | 2008 | - | - | - | 0.0% | 0.0% | 0.0% | - | The Fresh Market (ground lease) | |
| Beacon Hill | Crown Point | 2006 | 57,191 | 11,043 | 46,148 | 84.0% | 100.0% | 80.1% | 14.97 | Anytime Fitness | Strack & Van Til, Walgreens |
| Bell Oaks Center | Newburgh | 2008 | 94,811 | 74,122 | 20,689 | 98.5% | 100.0% | 93.0% | 11.59 | Archie & Clyde's Restaurant, Schnuck Markets | |
| Boulevard Crossing | Kokomo | 2004 | 124,631 | 74,440 | 50,191 | 96.7% | 100.0% | 91.8% | 14.23 | Petco, TJ Maxx, Ulta Salon, Shoe Carnival | Kohl's |
| Bridgewater Marketplace | Indianapolis | 2008 | 25,975 | - | 25,975 | 68.2% | 0.0% | 68.2% | 17.68 | | Walgreens |
| Castleton Crossing | Indianapolis | 1975/2012 | 277,812 | 247,710 | 30,102 | 100.0% | 100.0% | 100.0% | 10.75 | K&G Menswear, Value City, TJ Maxx/Home Goods, Shoe Carnival, Dollar Tree, Burlington Coat Factory | |
| Cool Creek Commons | Indianapolis | 2005/2012 | 124,646 | 62,600 | 62,046 | 92.7% | 85.6% | 99.8% | 16.72 | The Fresh Market, Stein Mart | |
| Depauw University Bookstore and Café | Greencastle | 2012 | 11,974 | - | 11,974 | 100.0% | 0.0% | 100.0% | 8.36 | Folletts, Starbucks | |
| Eddy Street Commons | South Bend | 2009 | 88,093 | 20,154 | 67,939 | 92.7% | 100.0% | 90.6% | 22.50 | Hammes Bookstore, Urban Outfitters | |
| Fishers Station | Indianapolis | 1989/2009 | 116,943 | 72,212 | 44,731 | 96.6% | 100.0% | 91.2% | 11.73 | Marsh Supermarkets, Goodwill, Dollar Tree | |
| Geist Pavilion | Indianapolis | 2006 | 64,102 | 29,700 | 34,402 | 95.9% | 100.0% | 92.3% | 16.23 | Goodwill, Ace Hardware | |
| Glendale Town Center | Indianapolis | 1958/2008 | 393,002 | 329,546 | 63,456 | 98.8% | 100.0% | 92.7% | 6.95 | Macy’s, Landmark Theaters, Staples, Indianapolis Library, Nexus Academy of Indianapolis | Lowe's Home Improvement, Target, Walgreens |
See Notes on page 36
p. 33
Kite Realty Group Trust Supplemental Financial and Operating Statistics –9/30/14
OPERATING RETAIL PORTFOLIO SUMMARY REPORT (CONTINUED)
As of September 30, 2014
| | | Year | Owned GLA2 | �� | Leased | | | |
Property1 | MSA | Built/ Renovated | Total | Anchors | Shops | Total | Anchors | Shops | ABR per Sqft | Major Owned Tenants | Major Non-owned Tenants |
| Greyhound Commons | Indianapolis | 2005 | - | - | - | 0.0% | 0.0% | 0.0% | - | | Lowe's Home Improvement Center |
| Lima Marketplace | Fort Wayne | 2008 | 93,135 | 71,521 | 21,614 | 98.5% | 100.0% | 93.5% | 13.97 | Aldi, Dollar Tree, Office Depot, PetSmart | Walmart |
| Rangeline Crossing | Indianapolis | 1986/2013 | 99,311 | 47,962 | 51,349 | 91.8% | 100.0% | 84.1% | 21.57 | Earth Fare, Walgreens | |
| Rivers Edge | Indianapolis | 2011 | 149,209 | 117,890 | 31,319 | 100.0% | 100.0% | 100.0% | 19.65 | Buy Buy Baby, Nordstrom Rack, The Container Store, Arhaus Furniture, Bicycle Garage of Indy | |
| Stoney Creek Commons | Indianapolis | 2000/2013 | 84,330 | 84,330 | - | 100.0% | 100.0% | 0.0% | 12.39 | HH Gregg, Goodwill, LA Fitness | Lowe's Home Improvement |
| The Corner | Indianapolis | 1984/2013 | 42,494 | 12,200 | 30,294 | 65.1% | 0.0% | 91.3% | 18.67 | | |
| Traders Point | Indianapolis | 2005 | 279,684 | 238,721 | 40,963 | 99.2% | 100.0% | 94.3% | 14.69 | Dick's Sporting Goods, AMC Theatres, Marsh Supermarkets, Bed, Bath & Beyond, Michaels, Old Navy, PetSmart, Books-A-Million | |
| Traders Point II | Indianapolis | 2005 | 46,099 | - | 46,099 | 88.7% | 0.0% | 88.7% | 25.32 | | |
| Whitehall Pike | Bloomington | 1999 | 128,997 | 128,997 | - | 100.0% | 100.0% | 0.0% | 7.86 | Lowe's Home Improvement Center | |
| Louisiana | | | | | | | | | | | |
| Regal Court** | Shreveport | 2008 | 151,719 | 89,649 | 62,070 | 77.9% | 77.7% | 78.2% | 19.58 | Dick's Sporting Goods, DSW, Ulta Salon, JC Penney, Kohl’s | |
| Missouri | | | | | | | | | | | |
Branson Hills Shopping Center** (Includes Branson Hills Plaza & Shoppes at Branson Hills) | Branson | 2005 | 289,986 | 226,096 | 63,890 | 98.6% | 100.0% | 93.4% | 12.49 | TJ Maxx, Bed Bath & Beyond, Best Buy, Books-A-Million, Kohl’s, MC Sports, Michaels, Petco, Ulta Salon, Home Depot | Walmart, Target |
| Shops at Hawk Ridge** | Lake St Louis | 2008 | 75,951 | 66,081 | 9,870 | 100.0% | 100.0% | 100.0% | 12.15 | Sports Authority, TJ Maxx | Lowe's Home Improvement, Wal-Mart |
| Nebraska | | | | | | | | | | | |
| Whispering Ridge** | Omaha | 2008 | 69,676 | 69,676 | - | 100.0% | 100.0% | 0.0% | 14.24 | PetSmart, Sports Authority | |
| Nevada | | | | | | | | | | | |
| Cannery Corner | Las Vegas | 2008 | 30,745 | - | 30,745 | 77.9% | 0.0% | 77.9% | 35.26 | | |
| Centennial Center | Las Vegas | 2002 | 334,705 | 158,335 | 176,370 | 93.3% | 100.0% | 87.2% | 22.61 | Big Lots, Famous Footwear, Michaels, Office Max, Party City, Petco, Rhapsodielle, Ross Dress for Less, Home Depot, Sam's Club, Wal-Mart | |
| Centennial Gateway | Las Vegas | 2005 | 192,999 | 139,861 | 53,138 | 97.9% | 100.0% | 92.3% | 23.72 | 24 Hour Fitness, Fresh & Easy Neighborhood Market, Sportsman's Warehouse, Walgreens | |
| Eastern Beltway Center | Las Vegas | 1998/2006 | 162,444 | 83,982 | 78,462 | 97.4% | 100.0% | 94.6% | 22.97 | Home Consignment Center, Office Max, Petco, Ross Dress for Less, Sam's Club, Walmart | Home Depot |
| Eastgate | Las Vegas | 2002 | 96,589 | 53,030 | 43,559 | 88.5% | 100.0% | 74.4% | 21.67 | 99 Cent Only Store, Office Depot, Party City | Walmart |
| Lowe's Plaza | Las Vegas | 2007 | 30,208 | - | 30,208 | 44.4% | 0.0% | 44.4% | 30.48 | | Sam’s Club, Lowe’s Home Improvement |
| New Hampshire | | | | | | | | | | | |
| Merrimack Village Center | Merrimack | 2007 | 78,892 | 54,000 | 24,892 | 100.0% | 100.0% | 100.0% | 12.22 | Supervalu | |
| New Jersey | | | | | | | | | | | |
| Bayonne Crossing | Bayonne | 2011 | 106,383 | 52,219 | 54,164 | 95.8% | 100.0% | 91.8% | 28.16 | Michaels, New York Sports Club, Lowe's Home Improvement, Walmart | |
| New York | | | | | | | | | | | |
| City Center at White Plains | White Plains | 2004 | 365,905 | 329,360 | 36,545 | 97.8% | 100.0% | 78.1% | 25.85 | Barnes & Noble, National Amusement, New York Sports Club, Nordstrom Rack, Shop Rite, Toys “R” Us/Babies “R” Us | Target |
| North Carolina | | | | | | | | | | | |
| Holly Springs Towne Center | Holly Springs | 2013 | 207,631 | 109,233 | 98,398 | 90.8% | 100.0% | 80.6% | 15.73 | Dick's Sporting Goods, Marshalls, Petco, Ulta Salon | Target |
| The Landing at Ocean Isle Beach** | Ocean Isle Beach | 2009 | 53,220 | 41,982 | 11,238 | 94.5% | 100.0% | 74.1% | 17.17 | Lowes Foods | |
| Memorial Commons | Goldsboro | 2008 | 111,271 | 73,876 | 37,395 | 91.0% | 100.0% | 73.1% | 11.98 | Harris Teeter, Office Depot | |
See Notes on page 36
p. 34
Kite Realty Group Trust Supplemental Financial and Operating Statistics –9/30/14
OPERATING RETAIL PORTFOLIO SUMMARY REPORT (CONTINUED)
As of September 30, 2014
| | | Year | Owned GLA2 | | Leased | | | |
Property1 | MSA | Built/ Renovated | Total | Anchors | Shops | Total | Anchors | Shops | ABR per Sqft | Major Owned Tenants | Major Non-owned Tenants |
| Northcrest Shopping Center | Charlotte | 2008 | 133,674 | 76,053 | 57,621 | 95.7% | 100.0% | 89.9% | 21.34 | David's Bridal, Dollar Tree, Old Navy, REI, Shoe Carnival | Target |
| Oleander Place | Wilmington | 2012 | 45,530 | 30,144 | 15,386 | 100.0% | 100.0% | 100.0% | 16.06 | Whole Foods | |
| Perimeter Woods | Charlotte | 2008 | 126,143 | 105,262 | 20,881 | 99.2% | 100.0% | 95.2% | 20.60 | Best Buy, Off Broadway Shoes, Office Max, PetSmart, Lowe's Home Improvement | |
| Toringdon Market | Charlotte | 2004 | 60,539 | 26,072 | 34,467 | 100.0% | 100.0% | 100.0% | 19.51 | Earth Fare | |
| Walgreens Plaza** | Jacksonville | 2010 | 42,219 | 27,779 | 14,440 | 95.6% | 100.0% | 87.0% | 21.29 | L-3 Communications, Walgreens | |
| Ohio | | | | | | | | | | | |
| Eastgate Pavilion | Cincinnati | 1995 | 236,230 | 231,730 | 4,500 | 100.0% | 100.0% | 100.0% | 8.73 | Best Buy, Dick's Sporting Goods, Value City Furniture, PetSmart, DSW, Bed Bath & Beyond | |
| Oklahoma | | | | | | | | | | | |
| Shops at Moore | Moore | 2010 | 259,692 | 187,916 | 71,776 | 99.5% | 100.0% | 98.3% | 12.02 | Bed Bath and Beyond, Best Buy, Dustee's Fashion Accessories, Hobby Lobby, Office Depot, PetSmart, Ross Dress for Less | JC Penney |
| Silver Springs Pointe | Oklahoma City | 2001 | 48,444 | 20,515 | 27,929 | 79.8% | 100.0% | 65.0% | 15.36 | Kohl’s, Office Depot | Walmart, Sam’s Club, Home Depot |
| University Town Center | Norman | 2009 | 158,516 | 77,097 | 81,419 | 95.6% | 100.0% | 91.5% | 17.43 | Office Depot, Petco, TJ Maxx, Ulta Salon | Target |
| University Town Center Phase II | Norman | 2012 | 190,494 | 133,546 | 56,948 | 95.4% | 100.0% | 84.5% | 11.88 | Academy Sports, DSW, Home Goods, Michaels, Kohl’s | |
| Oregon | | | | | | | | | | | |
| Cornelius Gateway | Portland | 2006 | 21,326 | - | 21,326 | 70.8% | 0.0% | 70.8% | 21.10 | Fedex/Kinkos | Fred Meyer |
| Shops at Otty | Portland | 2004 | 9,845 | - | 9,845 | 84.7% | 0.0% | 84.7% | 28.19 | | Wal-Mart |
| South Carolina | | | | | | | | | | | |
| Hitchcock Plaza | Aiken | 2006 | 252,370 | 214,480 | 37,890 | 100.0% | 100.0% | 100.0% | 9.27 | Academy Sports, Achieve Fitness, Bed Bath and Beyond, Farmers Home Furniture, Old Navy, Ross Dress for Less, TJ Maxx | |
| Shoppes at Plaza Green | Greenville | 2000 | 196,307 | 172,136 | 24,171 | 94.8% | 94.1% | 100.0% | 13.25 | Bed Bath & Beyond, Christmas Tree Shops, Sears, Party City, Shoe Carnival, AC Moore, Old Navy | |
| Publix at Woodruff | Greenville | 1997 | 68,055 | 47,955 | 20,100 | 97.4% | 100.0% | 91.0% | 10.40 | Publix | |
| Tennessee | | | | | | | | | | | |
| Cool Springs Market | Nashville | 1995 | 223,912 | 165,712 | 58,200 | 86.8% | 87.9% | 83.7% | 14.91 | Jo-Ann Fabric, Dicks Sporting Goods, Staples, Marshalls | Kroger |
Hamilton Crossing – Phases II & III | Alcoa | 2008 | 179,864 | 135,737 | 44,127 | 97.6% | 100.0% | 90.0% | 14.60 | Dicks Sporting Goods, Michaels, Old Navy, PetSmart, Ross Dress for Less | |
| Texas | | | | | | | | | | | |
| Burlington Coat Factory | San Antonio | 1992/2000 | 107,400 | 107,400 | - | 100.0% | 100.0% | 0.0% | 5.00 | Burlington Coat Factory | |
| Kingwood Commons | Houston | 1999 | 164,366 | 74,836 | 89,530 | 98.1% | 100.0% | 96.4% | 18.59 | Randall's Food and Drug, Petco, Chico's, Talbots, Ann Taylor, Jos. A. Bank | |
| Market Street Village | Hurst | 1970/2011 | 156,625 | 136,746 | 19,879 | 100.0% | 100.0% | 100.0% | 11.61 | Jo-Ann Fabric, Ross Dress for Less, Office Depot, Buy Buy Baby | |
| Plaza at Cedar Hill | Dallas | 2000/2010 | 303,458 | 244,065 | 59,393 | 98.0% | 100.0% | 89.5% | 12.28 | Hobby Lobby, Office Max, Ross Dress for Less, Marshalls, Sprouts Farmers Market, Toys “R” Us/Babies “R” Us, DSW | |
| Plaza Volente | Austin | 2004 | 156,333 | 105,000 | 51,333 | 99.1% | 100.0% | 97.3% | 16.87 | H-E-B Grocery | |
| Portofino Shopping Center | Houston | 1999/2010 | 371,990 | 211,858 | 160,132 | 88.0% | 89.4% | 86.1% | 17.31 | DSW, Michaels, Sports Authority, Lifeway Christian Store, Stein Mart, PetSmart, Old Navy | Sam’s Club |
| Sunland Towne Centre | El Paso | 1996/2014 | 306,437 | 265,037 | 41,400 | 98.9% | 100.0% | 91.7% | 11.36 | PetSmart, Ross Dress for Less, Kmart, Bed Bath & Beyond, Specs Fine Wines, Sprouts Farmers Market | |
See notes on page 36
p. 35
Kite Realty Group Trust Supplemental Financial and Operating Statistics –9/30/14
OPERATING RETAIL PORTFOLIO SUMMARY REPORT (CONTINUED)
As of September 30, 2014
| | | Year | Owned GLA2 | | Leased | | | Major |
Property1 | MSA | Built/ Renovated | Total | Anchors | Shops | Total | Anchors | Shops | ABR per Sqft | Major Owned Tenants | Non-owned Tenants |
| Waxahachie Crossing | Waxahachie | 2010 | 97,127 | 72,191 | 24,936 | 98.8% | 100.0% | 95.2% | 14.13 | Best Buy, PetSmart, Ross Dress for Less | Home Depot, JC Penney |
| Westside Market | Frisco | 2013 | 93,377 | 70,000 | 23,377 | 97.4% | 100.0% | 89.4% | 15.83 | Randall's Tom Thumb | |
| Wheatland | 2012 | 194,727 | 142,302 | 52,425 | 97.8% | 100.0% | 91.9% | 12.77 | Conn's, Dollar Tree, Office Depot, Party City, PetSmart, Ross Dress for Less, Shoe Carnival | Target, ,Aldi |
| Utah | | | | | | | | | | | |
| Draper Crossing | Draper | 2012 | 164,098 | 115,916 | 48,182 | 97.9% | 100.0% | 92.8% | 14.51 | Dollar Tree, Downeast Home, Smiths, TJ Maxx | |
| Draper Peaks | Draper | 2012 | 220,594 | 101,464 | 119,130 | 98.5% | 100.0% | 97.3% | 18.09 | Michaels, Office Depot, Petco, Quilted Bear, Ross Dress for Less | Kohl’s |
| Virginia | | | | | | | | | | | |
| Landstown Commons | Virginia Beach | 2007 | 399,047 | 217,466 | 181,581 | 94.4% | 100.0% | 87.7% | 18.69 | AC Moore, Bed Bath & Beyond, Best Buy, Books-A-Million, Office Max, PetSmart, Ross Dress for Less, Shoe Carnival, Walgreens | Kohl’s |
| Washington | | | | | | | | | | | |
| Four Corner Square | Maple Valley | 1985/2013 | 107,998 | 68,046 | 39,952 | 90.7% | 100.0% | 74.8% | 21.36 | Walgreens, Grocery Outlet, Johnsons Do-It Center | |
| Wisconsin | | | | | | | | | | | |
| Copps Grocery** | Stevens Point | 2012 | 69,911 | 69,911 | - | 100.0% | 100.0% | 0.0% | 15.50 | Copps Grocery | |
| Fox Point Plaza** | Neenah | 2008 | 171,121 | 112,127 | 58,994 | 98.1% | 100.0% | 94.5% | 9.99 | Bethesda Lutheran Thrift Store, Pick N Save, Rent-A-Center, Adventures in Advertising | |
| Shoppes at Prairie Ridge** | Pleasant Prairie | 2009 | 128,431 | 78,843 | 49,588 | 94.4% | 100.0% | 85.5% | 17.20 | Dicks Sporting Goods, PetSmart, Ulta Salon, JC Penney | Target |
| Village at Bay Park | Green Bay | 2005 | 82,254 | 23,878 | 58,376 | 88.1% | 100.0% | 83.2% | 14.67 | DSW, JC Penney | |
| | | | | | | | | | | | |
| Total | | | 16,935,582 | 11,684,865 | 5,250,717 | 94.9% | 99.0% | 85.8% | $14.98 | | |
| ____________________ |
| 1 | All properties are wholly owned, except as indicated. Unless otherwise noted, each property is owned in fee simple by the Company. |
| 2 | Percentage of Owned GLA Leased reflects Owned GLA/NRA leased as of September 30, 2014, except for Greyhound Commons and 54th & College. |
| 3 | See Consolidated Joint Venture Summary. |
| ** | These properties are under a definitive agreement to be sold. |
| | |
p. 36
Kite Realty Group Trust Supplemental Financial and Operating Statistics –9/30/14
OPERATING OFFICE PROPERTIES
As of September 30, 2014
| Property | MSA | Year Built/ Renovated | Acquired, Redeveloped or Developed | Owned NRA | Percentage Of Owned NRA Leased | Annualized Base Rent1 | Percentage of Annualized Office Base Rent | Base Rent Per Leased Sq. Ft. | | Major Tenants |
| Indiana | | | | | | | | | | |
Thirty South Meridian2 | Indianapolis | 1905/2002 | Redeveloped | 305,224 | 93.9% | $ | 4,865,147 | 81.2% | $ | 18.00 | | Indiana Supreme Court, City Securities, Kite Realty Group, Lumina Foundation |
Union Station Parking Garage3 | Indianapolis | 1986 | Acquired | N/A | N/A | | N/A | N/A | | N/A | | Denison Parking |
Eddy Street Office (part of Eddy Street Commons) 4 | South Bend | 2009 | Developed | 81,628 | 100.0% | | 1,128,580 | 18.8% | | 13.83 | | University of Notre Dame Offices |
| Total | | | | 386,852 | 95.2% | $ | 5,993,727 | 100.0% | $ | 17.03 | | |
| ____________________ |
| 1 | Annualized Base Rent represents the monthly contractual rent for September 2014 for each applicable property, multiplied by 12. Excludes tenant reimbursements. |
| 2 | Annualized Base Rent includes $723,216 from the Company and subsidiaries as of September 30, 2014. |
| 3 | The garage is managed by a third party. |
| 4 | The Company also owns Eddy Street Commons in South Bend, Indiana along with a parking garage that serves a hotel and the office and retail components of the property. |
p. 37
Kite Realty Group Trust Supplemental Financial and Operating Statistics –9/30/14
As of September 30, 2014
| | | Q2 2014 Revised Guidance | | Q3 2014 Revised Guidance |
FFO per diluted common share, as adjusted1,2 | | $1.96 – $2.08 | | $2.00 – $2.04 |
FFO per diluted common share (NAREIT definition) 2 | | N/A | | $1.55 – $1.59 |
| Same Property NOI | | 3.5% – 4.0% | | 4.4% – 4.6% |
| Percent leased at year-end | | 95% – 96% | | 95% – 96% |
Asset Dispositions3 | | $40 – $50 million | | $200 – $210 million |
| | | | | |
| ____________________ |
| 1 | Excludes costs related to the merger with Inland Diversified Real Estate Trust. |
| 2 | Restated for the effects of the Company’s 1 for 4 reverse share split |
| 3 | Includes $163 million of assets expected to be sold in December 2014, pursuant to an executed definitive agreement. |
p. 38
Kite Realty Group Trust Supplemental Financial and Operating Statistics –9/30/14