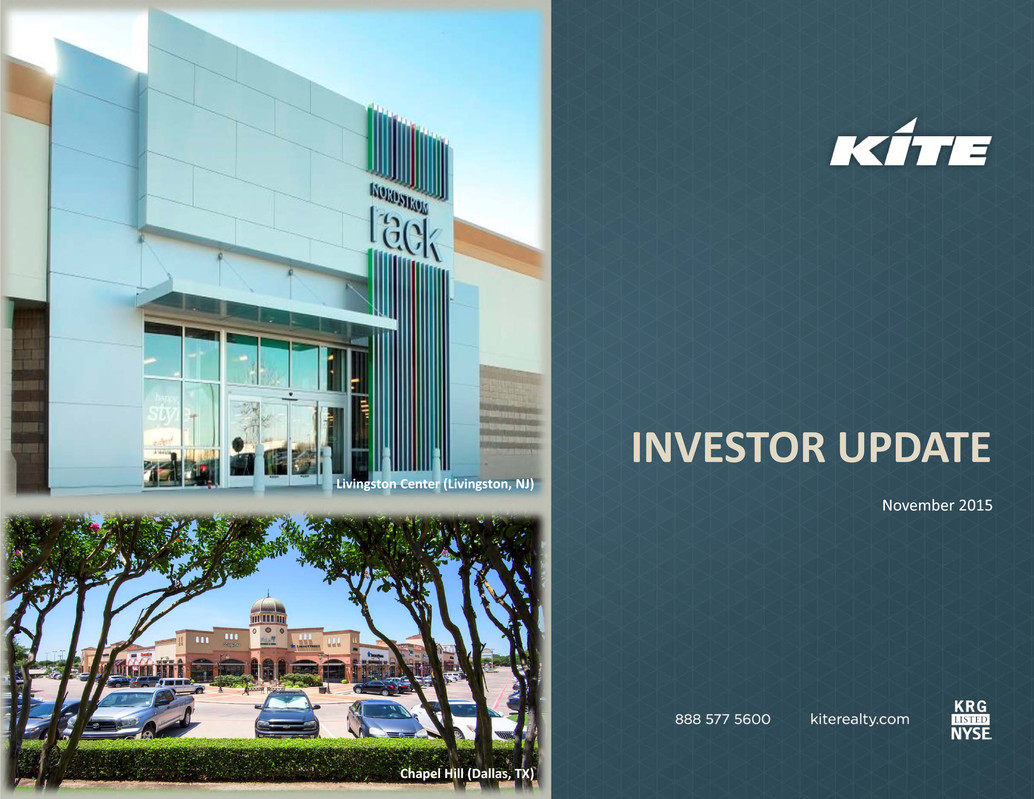
INVESTOR UPDATE November 2015 Chapel Hill (Dallas, TX) Livingston Center (Livingston, NJ)

© 2015 Kite Realty Group kiterealty.com Investor Update | 2 KITE REALTY’S STRATEGIC PRIORITIES OPERATIONAL EXCELLENCE HIGH‐QUALITY PORTFOLIO PORTFOLIO UPGRADE FINANCIAL FLEXIBILITY Long‐standing, experienced management team Industry‐leading operating metrics ~4.4% same‐store NOI growth over last 10 quarters Over 70% ABR coming from top 50 MSAs Highly‐trafficked centers; over 67% of assets include grocer Enhancing assets via the 3 R’s; Redevelop, Reposition, Repurpose Recent portfolio transformation Completed 15‐ asset sale and tax efficient / strategic redeployment Expected net seller again in 2016 of ~$100mm Investment grade balance sheet $50mm in free cash flow annually Minimal debt maturities through 2020 <10% floating rate debt exposure STRATEGIC OBJECTIVES DRIVE FREE CASH FLOW, LONG‐TERM VALUE AND SHAREHOLDER RETURN Financial FlexibilityPortfolio UpgradeOperational Excellence High‐Quality Portfolio

OPERATIONAL EXCELLENCE
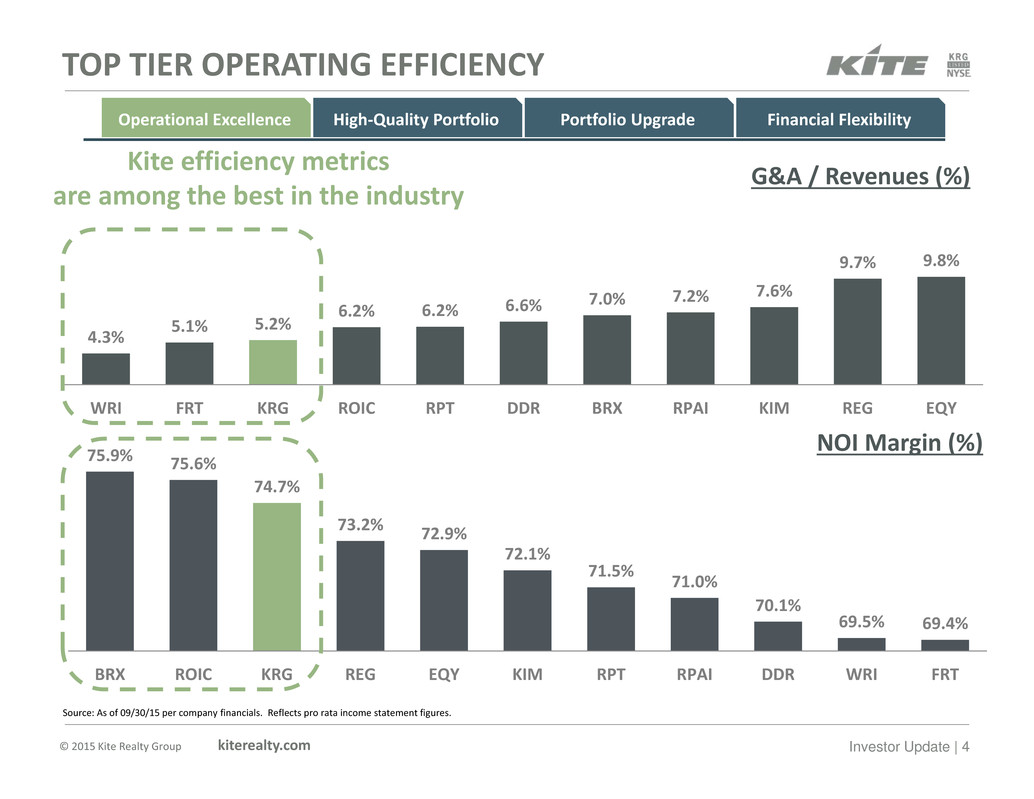
© 2015 Kite Realty Group kiterealty.com Investor Update | 4 TOP TIER OPERATING EFFICIENCY 4.3% 5.1% 5.2% 6.2% 6.2% 6.6% 7.0% 7.2% 7.6% 9.7% 9.8% WRI FRT KRG ROIC RPT DDR BRX RPAI KIM REG EQY G&A / Revenues (%) 75.9% 75.6% 74.7% 73.2% 72.9% 72.1% 71.5% 71.0% 70.1% 69.5% 69.4% BRX ROIC KRG REG EQY KIM RPT RPAI DDR WRI FRT NOI Margin (%) Kite efficiency metrics are among the best in the industry Source: As of 09/30/15 per company financials. Reflects pro rata income statement figures. Financial FlexibilityPortfolio UpgradeOperational Excellence High‐Quality Portfolio
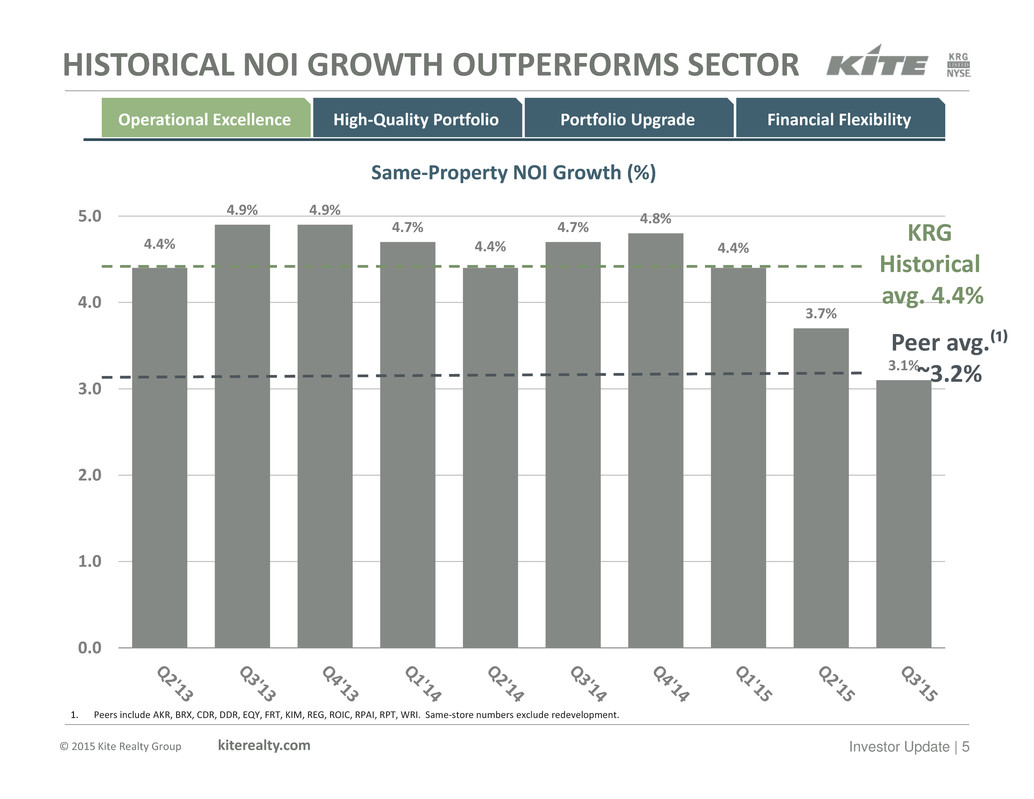
© 2015 Kite Realty Group kiterealty.com Investor Update | 5 HISTORICAL NOI GROWTH OUTPERFORMS SECTOR 4.4% 4.9% 4.9% 4.7% 4.4% 4.7% 4.8% 4.4% 3.7% 3.1% 0.0 1.0 2.0 3.0 4.0 5.0 Same‐Property NOI Growth (%) KRG Historical avg. 4.4% Peer avg.⁽¹⁾ ~3.2% 1. Peers include AKR, BRX, CDR, DDR, EQY, FRT, KIM, REG, ROIC, RPAI, RPT, WRI. Same‐store numbers exclude redevelopment. Financial FlexibilityPortfolio UpgradeOperational Excellence High‐Quality Portfolio
HIGH‐QUALITY PORTFOLIO
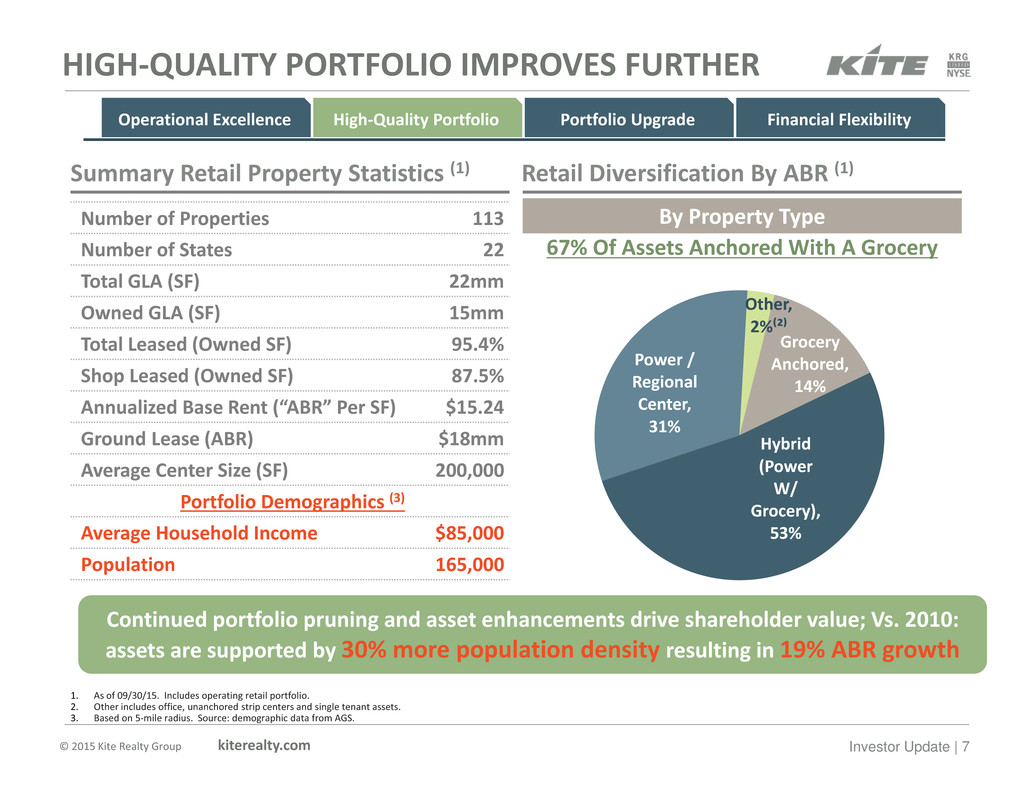
© 2015 Kite Realty Group kiterealty.com Investor Update | 7 Grocery Anchored, 14% Hybrid (Power W/ Grocery), 53% Power / Regional Center, 31% Other, 2%⁽²⁾ HIGH‐QUALITY PORTFOLIO IMPROVES FURTHER 1. As of 09/30/15. Includes operating retail portfolio. 2. Other includes office, unanchored strip centers and single tenant assets. 3. Based on 5‐mile radius. Source: demographic data from AGS. Number of Properties 113 Number of States 22 Total GLA (SF) 22mm Owned GLA (SF) 15mm Total Leased (Owned SF) 95.4% Shop Leased (Owned SF) 87.5% Annualized Base Rent (“ABR” Per SF) $15.24 Ground Lease (ABR) $18mm Average Center Size (SF) 200,000 Portfolio Demographics (3) Average Household Income $85,000 Population 165,000 Retail Diversification By ABR (1)Summary Retail Property Statistics (1) By Property Type 67% Of Assets Anchored With A Grocery Financial FlexibilityPortfolio UpgradeOperational Excellence High‐Quality Portfolio Continued portfolio pruning and asset enhancements drive shareholder value; Vs. 2010: assets are supported by 30% more population density resulting in 19% ABR growth
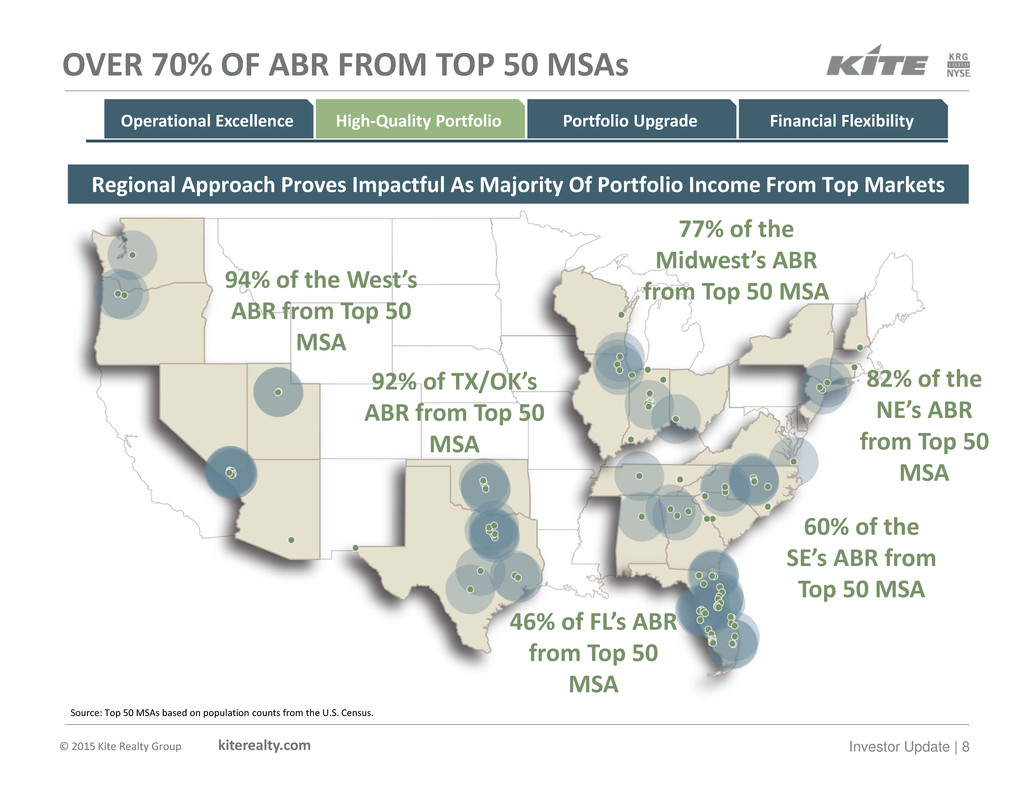
© 2015 Kite Realty Group kiterealty.com Investor Update | 8 OVER 70% OF ABR FROM TOP 50 MSAs 46% of FL’s ABR from Top 50 MSA 60% of the SE’s ABR from Top 50 MSA 82% of the NE’s ABR from Top 50 MSA 77% of the Midwest’s ABR from Top 50 MSA 92% of TX/OK’s ABR from Top 50 MSA 94% of the West’s ABR from Top 50 MSA Regional Approach Proves Impactful As Majority Of Portfolio Income From Top Markets Source: Top 50 MSAs based on population counts from the U.S. Census. Financial FlexibilityPortfolio UpgradeOperational Excellence High‐Quality Portfolio
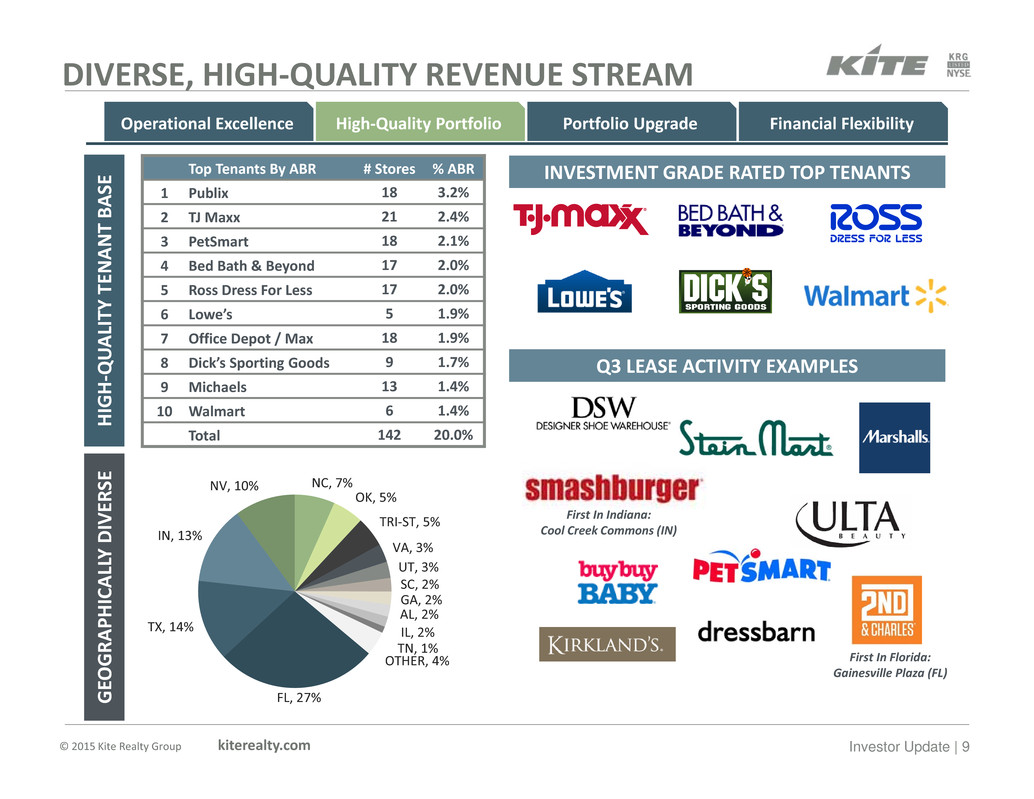
© 2015 Kite Realty Group kiterealty.com Investor Update | 9 DIVERSE, HIGH‐QUALITY REVENUE STREAM Top Tenants By ABR # Stores % ABR 1 Publix 18 3.2% 2 TJ Maxx 21 2.4% 3 PetSmart 18 2.1% 4 Bed Bath & Beyond 17 2.0% 5 Ross Dress For Less 17 2.0% 6 Lowe’s 5 1.9% 7 Office Depot / Max 18 1.9% 8 Dick’s Sporting Goods 9 1.7% 9 Michaels 13 1.4% 10 Walmart 6 1.4% Total 142 20.0% H I G H ‐ Q U A L I T Y T E N A N T B A S E INVESTMENT GRADE RATED TOP TENANTS Financial FlexibilityPortfolio UpgradeOperational Excellence High‐Quality Portfolio FL, 27% TX, 14% IN, 13% NV, 10% NC, 7% OK, 5% TRI‐ST, 5% VA, 3% UT, 3% SC, 2% GA, 2% AL, 2% IL, 2% TN, 1% OTHER, 4% G E O G R A P H I C A L L Y D I V E R S E Q3 LEASE ACTIVITY EXAMPLES First In Indiana: Cool Creek Commons (IN) First In Florida: Gainesville Plaza (FL)
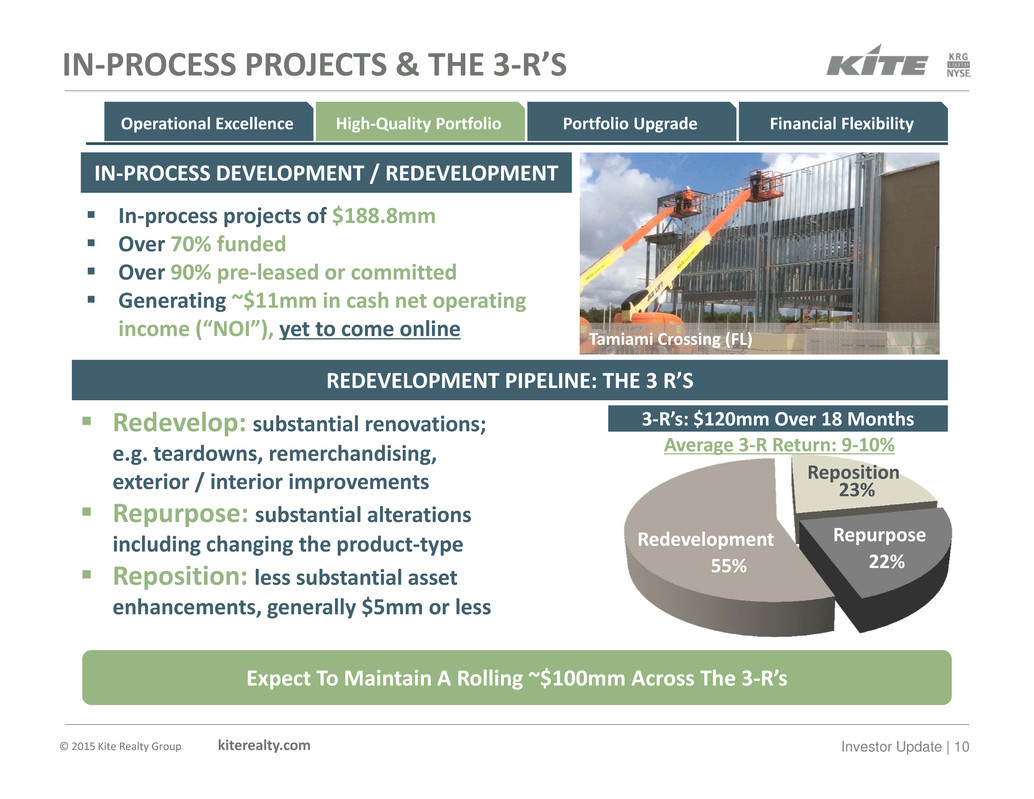
© 2015 Kite Realty Group kiterealty.com Investor Update | 10 IN‐PROCESS PROJECTS & THE 3‐R’S REDEVELOPMENT PIPELINE: THE 3 R’S Financial FlexibilityPortfolio UpgradeOperational Excellence High‐Quality Portfolio Parkside Town Commons – Phase II (Raleigh, NC) Redevelop: substantial renovations; e.g. teardowns, remerchandising, exterior / interior improvements Repurpose: substantial alterations including changing the product‐type Reposition: less substantial asset enhancements, generally $5mm or less 55% 23% 22% Redevelopment Repurpose Reposition Average 3‐R Return: 9‐10% 3‐R’s: $120mm Over 18 Months IN‐PROCESS DEVELOPMENT / REDEVELOPMENT In‐process projects of $188.8mm Over 70% funded Over 90% pre‐leased or committed Generating ~$11mm in cash net operating income (“NOI”), yet to come online Expect To Maintain A Rolling ~$100mm Across The 3‐R’s Tamiami Crossing (FL)
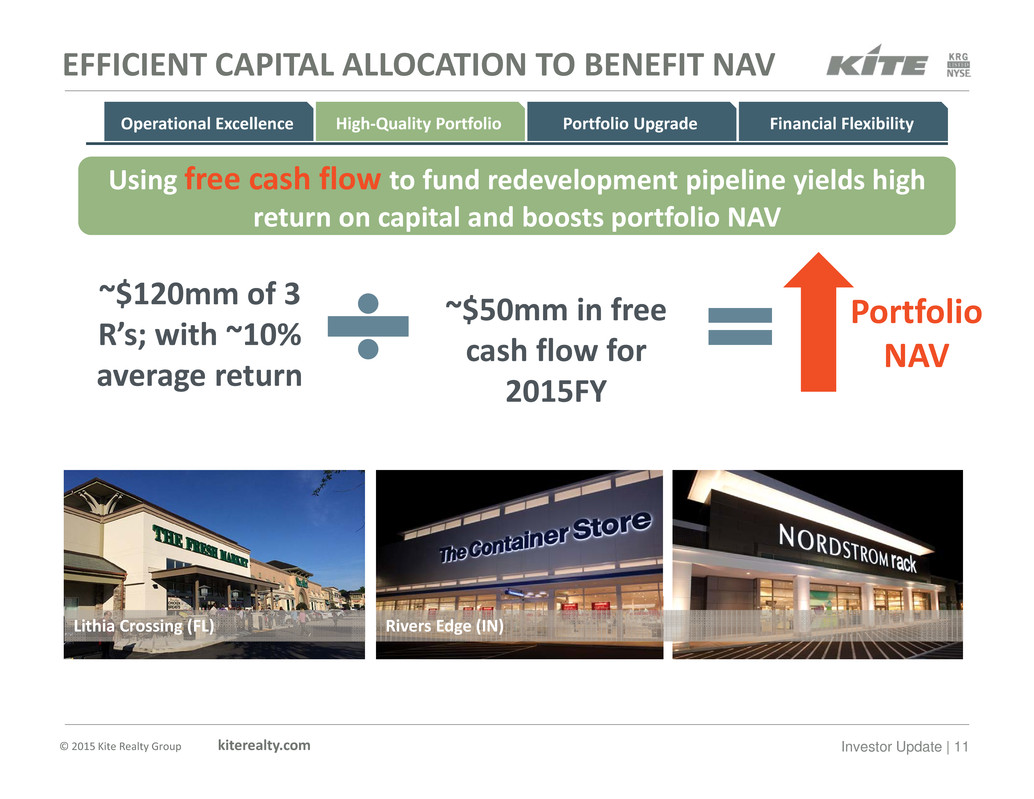
© 2015 Kite Realty Group kiterealty.com Investor Update | 11 EFFICIENT CAPITAL ALLOCATION TO BENEFIT NAV Using free cash flow to fund redevelopment pipeline yields high return on capital and boosts portfolio NAV ~$50mm in free cash flow for 2015FY ~$120mm of 3 R’s; with ~10% average return Portfolio NAV Rivers Edge (IN)Lithia Crossing (FL) Financial FlexibilityPortfolio UpgradeOperational Excellence High‐Quality Portfolio
PORTFOLIO UPGRADE

© 2015 Kite Realty Group kiterealty.com Investor Update | 13 RECAP OF TRANSFORMATION AND 2016 OUTLOOK Parkside Town Commons – Phase II (Raleigh, NC) Financial FlexibilityPortfolio UpgradeOperational Excellence High‐Quality Portfolio ACTIONS TAKEN TO‐DATE Completed $320mm 15‐asset disposition in December 2014 and March 2015 Redeployed ~$185mm in a tax efficient way in 2015, acquiring 4 top‐tier, premier assets in core markets Net seller of ~$100mm non‐core assets OBJECTIVES AND 2016 OUTLOOK Capitalize on market and cap rate environment Opportunistically sell ~$100mm in non‐ core assets Livingston Shopping Center (NJ) Belle Isle Station (OK)

© 2015 Kite Realty Group kiterealty.com Investor Update | 14 STRATEGIC INTIATIVE RESULTS $13.02 $19.71 Dispositions Acquisitions 50% Improvement In ABR per SF 50% Increase $74K $107K Dispositions Acquisitions 45% Increase In Household Income Note: Dispositions include the 15‐ asset disposition which closed in Q4 2014 and Q1 2015. Acquisition assets include Livingston Shopping Center, Rampart Commons, Belle Isle, Colleyville Downs and Chapel Hill. Demographic data from AGS; population based on a 5‐mile radius and household income based on a 3‐mile radius. 45% Increase 61K 251K Dispositions Acquisitions More Than 300% Growth In Population >300% Increase Dramatic Tenant Improvement Dispositions Acquisitions Financial FlexibilityPortfolio UpgradeOperational Excellence High‐Quality Portfolio

BALANCE SHEET
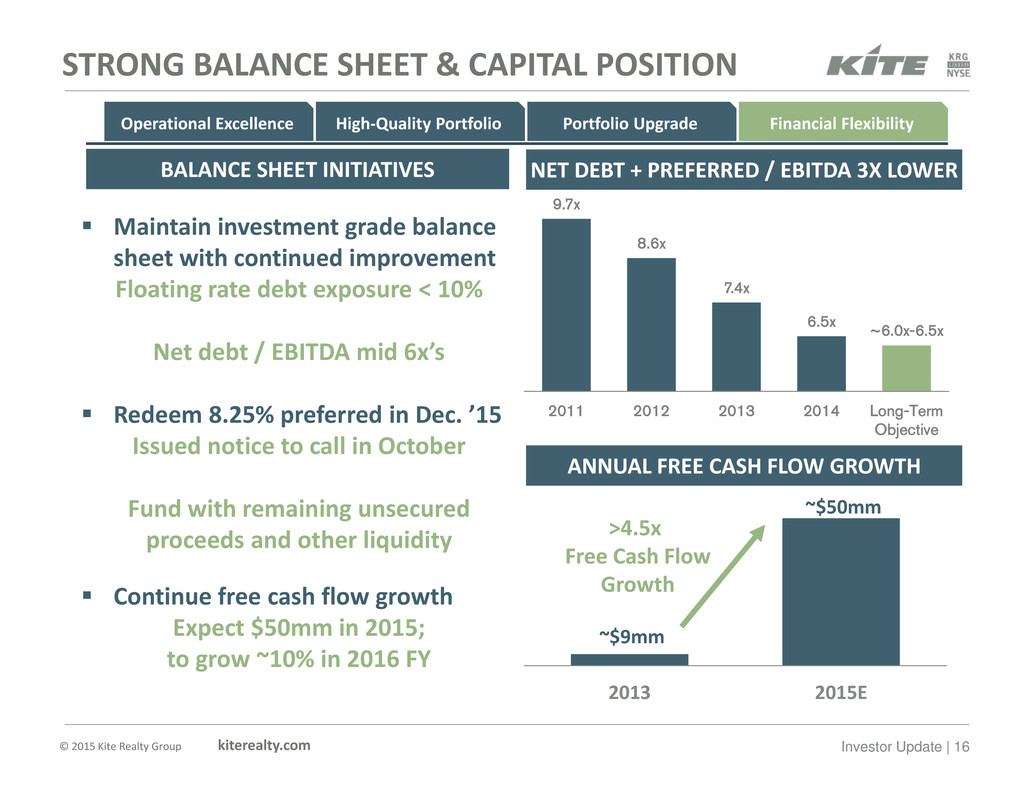
© 2015 Kite Realty Group kiterealty.com Investor Update | 16 STRONG BALANCE SHEET & CAPITAL POSITION 9.7x 8.6x 7.4x 6.5x ~6.0x-6.5x 2011 2012 2013 2014 Long-Term Objective ~$9mm ~$50mm 2013 2015E >4.5x Free Cash Flow Growth ANNUAL FREE CASH FLOW GROWTH Financial FlexibilityPortfolio UpgradeOperational Excellence High‐Quality Portfolio NET DEBT + PREFERRED / EBITDA 3X LOWERBALANCE SHEET INITIATIVES Maintain investment grade balance sheet with continued improvement Floating rate debt exposure < 10% Net debt / EBITDA mid 6x’s Redeem 8.25% preferred in Dec. ’15 Issued notice to call in October Fund with remaining unsecured proceeds and other liquidity Continue free cash flow growth Expect $50mm in 2015; to grow ~10% in 2016 FY
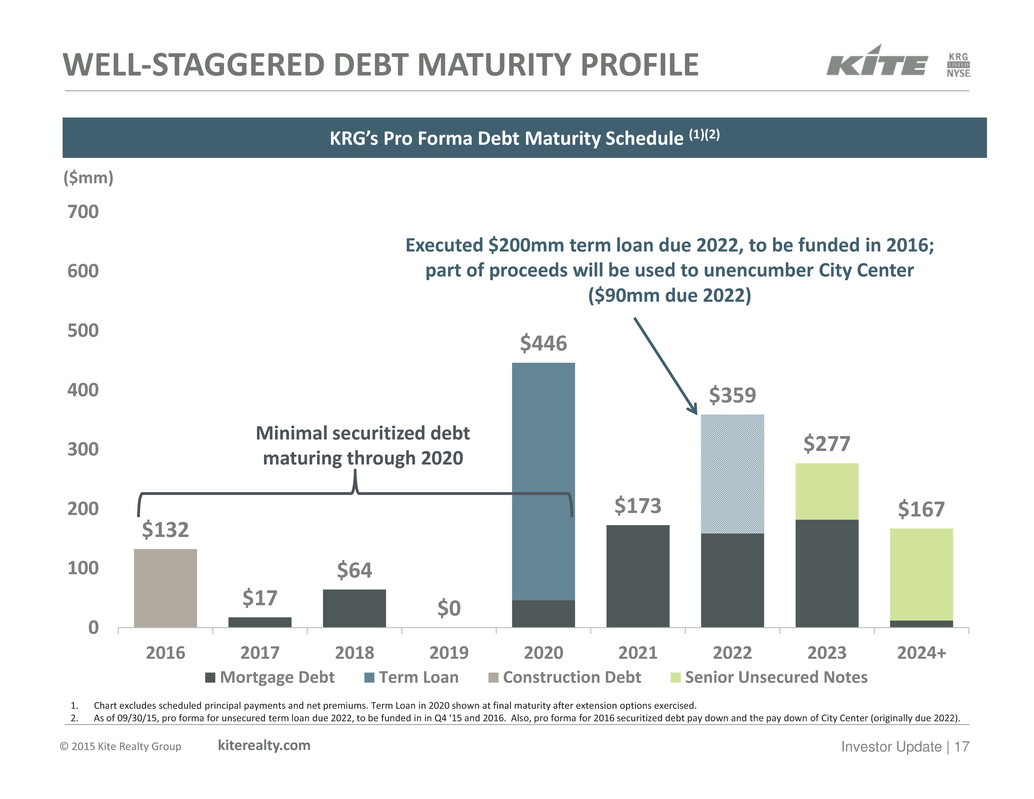
© 2015 Kite Realty Group kiterealty.com Investor Update | 17 WELL‐STAGGERED DEBT MATURITY PROFILE $132 $17 $64 $0 $446 $173 $359 $277 $167 0 100 200 300 400 500 600 700 2016 2017 2018 2019 2020 2021 2022 2023 2024+ Mortgage Debt Term Loan Construction Debt Senior Unsecured Notes ($mm) 1. Chart excludes scheduled principal payments and net premiums. Term Loan in 2020 shown at final maturity after extension options exercised. 2. As of 09/30/15, pro forma for unsecured term loan due 2022, to be funded in in Q4 ‘15 and 2016. Also, pro forma for 2016 securitized debt pay down and the pay down of City Center (originally due 2022). KRG’s Pro Forma Debt Maturity Schedule (1)(2) Executed $200mm term loan due 2022, to be funded in 2016; part of proceeds will be used to unencumber City Center ($90mm due 2022) Minimal securitized debt maturing through 2020
© 2015 Kite Realty Group kiterealty.com Investor Update | 18 KEY INVESTOR TAKEAWAYS FROM THE KITE TEAM Redeeming $102.5mm 8.25% Preferred On Dec. 7, 2015 Lowers average debt cost by ~25 bps; improves financial flexibility Free Cash Flow To Fund Redevelopments Highest‐returning investment for our growing free cash flow Ongoing Redevelopment Pipeline Of ~$100mm Future asset enhancements drive long‐term shareholder value Limited Debt Maturities For The Next ~5 Years Only ~$100mm in securitized debt maturing through 2020 Expect To Be Net Sellers Of ~$100mm In 2016 Capitalize on market environment by selling non‐core assets
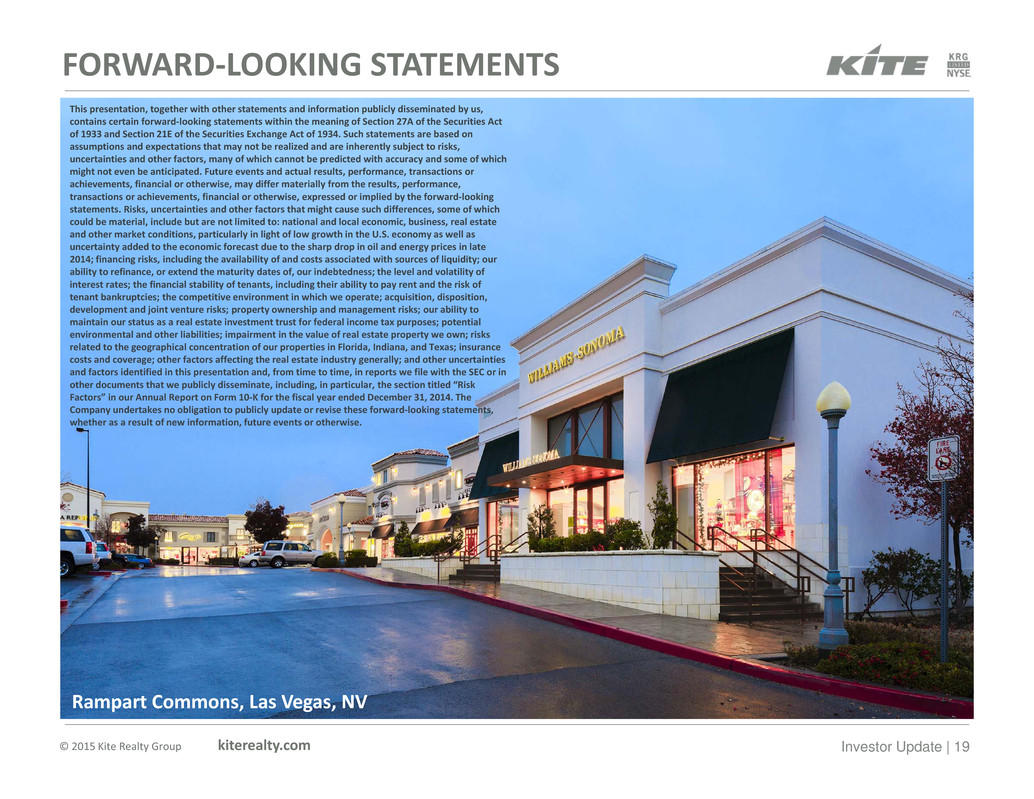
© 2015 Kite Realty Group kiterealty.com Investor Update | 19 This presentation, together with other statements and information publicly disseminated by us, contains certain forward‐looking statements within the meaning of Section 27A of the Securities Act of 1933 and Section 21E of the Securities Exchange Act of 1934. Such statements are based on assumptions and expectations that may not be realized and are inherently subject to risks, uncertainties and other factors, many of which cannot be predicted with accuracy and some of which might not even be anticipated. Future events and actual results, performance, transactions or achievements, financial or otherwise, may differ materially from the results, performance, transactions or achievements, financial or otherwise, expressed or implied by the forward‐looking statements. Risks, uncertainties and other factors that might cause such differences, some of which could be material, include but are not limited to: national and local economic, business, real estate and other market conditions, particularly in light of low growth in the U.S. economy as well as uncertainty added to the economic forecast due to the sharp drop in oil and energy prices in late 2014; financing risks, including the availability of and costs associated with sources of liquidity; our ability to refinance, or extend the maturity dates of, our indebtedness; the level and volatility of interest rates; the financial stability of tenants, including their ability to pay rent and the risk of tenant bankruptcies; the competitive environment in which we operate; acquisition, disposition, development and joint venture risks; property ownership and management risks; our ability to maintain our status as a real estate investment trust for federal income tax purposes; potential environmental and other liabilities; impairment in the value of real estate property we own; risks related to the geographical concentration of our properties in Florida, Indiana, and Texas; insurance costs and coverage; other factors affecting the real estate industry generally; and other uncertainties and factors identified in this presentation and, from time to time, in reports we file with the SEC or in other documents that we publicly disseminate, including, in particular, the section titled “Risk Factors” in our Annual Report on Form 10‐K for the fiscal year ended December 31, 2014. The Company undertakes no obligation to publicly update or revise these forward‐looking statements, whether as a result of new information, future events or otherwise. FORWARD‐LOOKING STATEMENTS Rampart Commons, Las Vegas, NV


