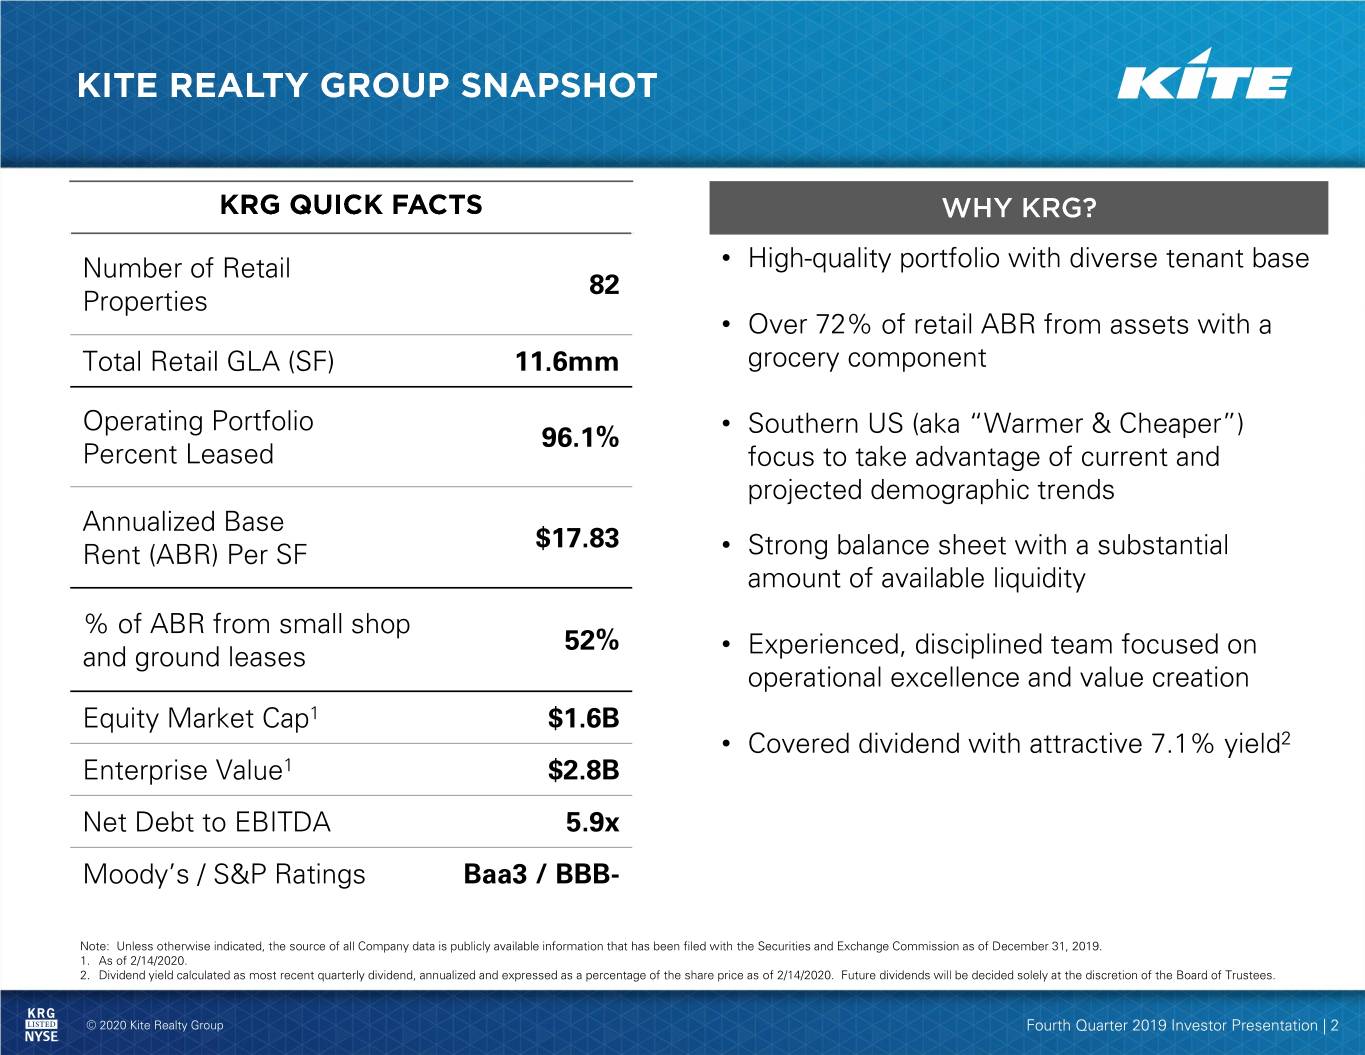
Number of Retail • High-quality portfolio with diverse tenant base 82 Properties • Over 72% of retail ABR from assets with a Total Retail GLA (SF) 11.6mm grocery component Operating Portfolio • Southern US (aka “Warmer & Cheaper”) 96.1% Percent Leased focus to take advantage of current and projected demographic trends Annualized Base $17.83 Rent (ABR) Per SF • Strong balance sheet with a substantial amount of available liquidity % of ABR from small shop 52% and ground leases • Experienced, disciplined team focused on operational excellence and value creation Equity Market Cap1 $1.6B • Covered dividend with attractive 7.1% yield2 Enterprise Value1 $2.8B Net Debt to EBITDA 5.9x Moody’s / S&P Ratings Baa3 / BBB- Note: Unless otherwise indicated, the source of all Company data is publicly available information that has been filed with the Securities and Exchange Commission as of December 31, 2019. 1. As of 2/14/2020. 2. Dividend yield calculated as most recent quarterly dividend, annualized and expressed as a percentage of the share price as of 2/14/2020. Future dividends will be decided solely at the discretion of the Board of Trustees. © 2020 Kite Realty Group Fourth Quarter 2019 Investor Presentation | 2
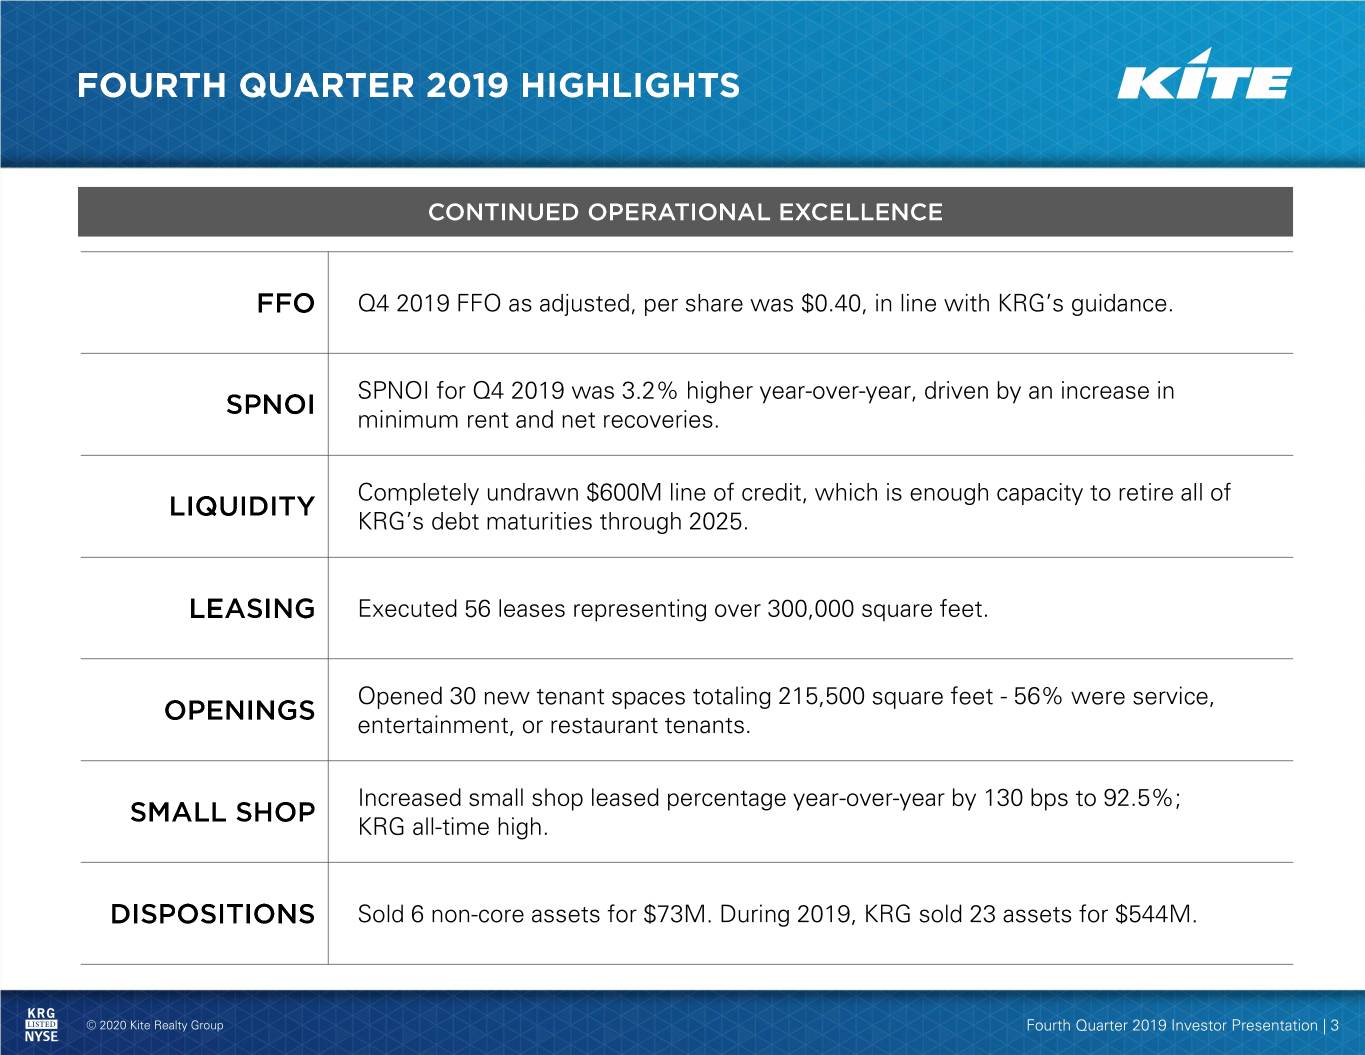
Q4 2019 FFO as adjusted, per share was $0.40, in line with KRG’s guidance. SPNOI for Q4 2019 was 3.2% higher year-over-year, driven by an increase in minimum rent and net recoveries. Completely undrawn $600M line of credit, which is enough capacity to retire all of KRG’s debt maturities through 2025. Executed 56 leases representing over 300,000 square feet. Opened 30 new tenant spaces totaling 215,500 square feet - 56% were service, entertainment, or restaurant tenants. Increased small shop leased percentage year-over-year by 130 bps to 92.5%; KRG all-time high. Sold 6 non-core assets for $73M. During 2019, KRG sold 23 assets for $544M. © 2020 Kite Realty Group Fourth Quarter 2019 Investor Presentation | 3
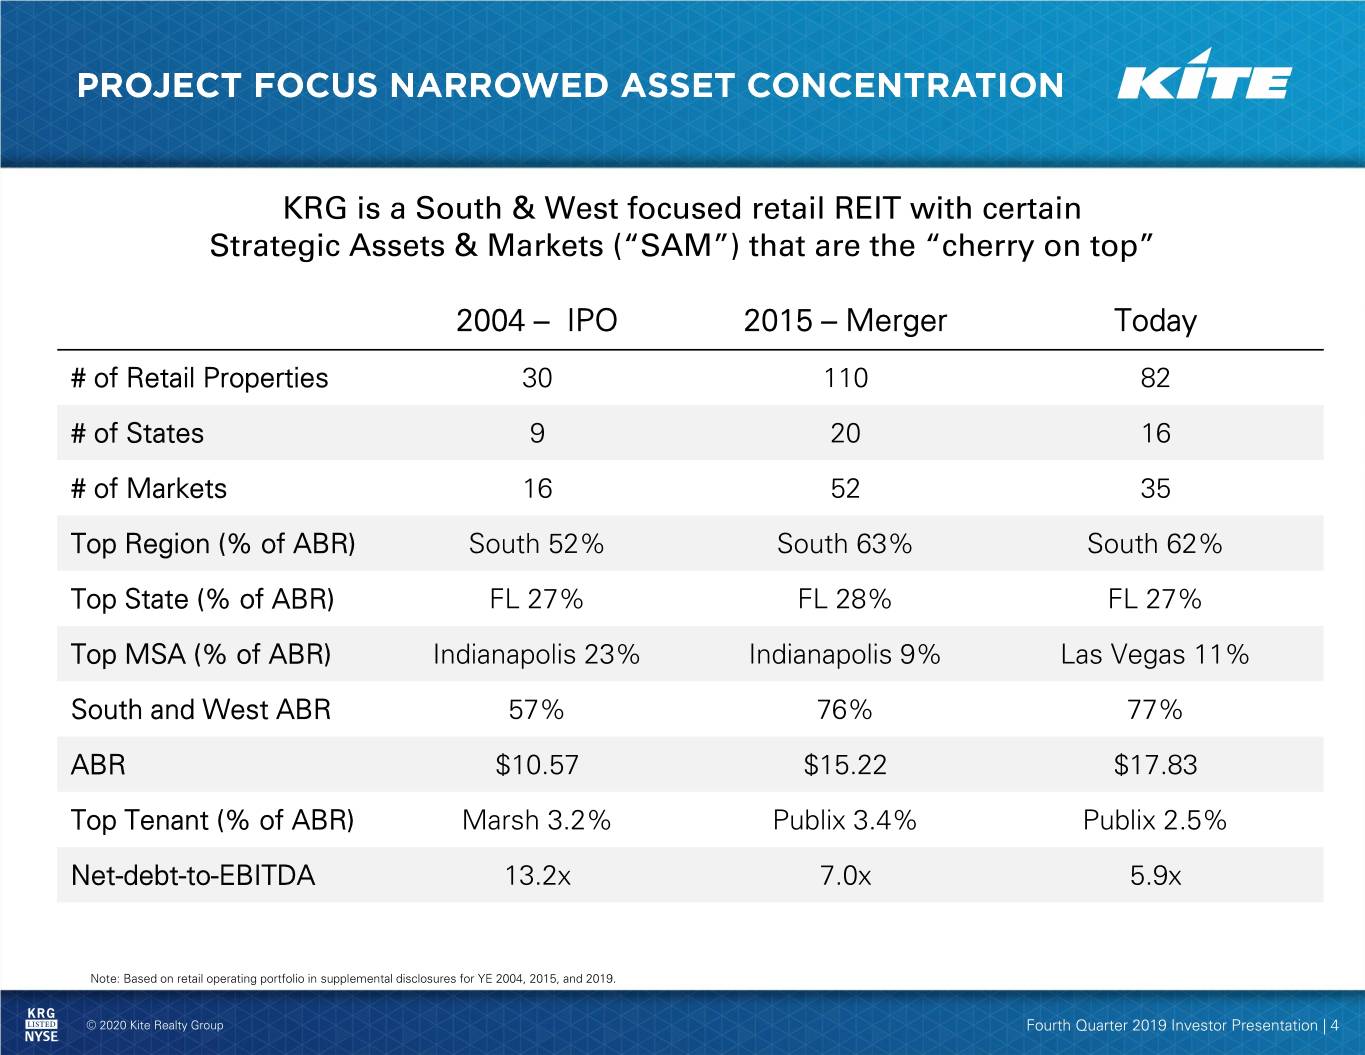
KRG is a South & West focused retail REIT with certain Strategic Assets & Markets (“SAM”) that are the “cherry on top” 2004 – IPO 2015 – Merger Today # of Retail Properties 30 110 82 # of States 9 20 16 # of Markets 16 52 35 Top Region (% of ABR) South 52% South 63% South 62% Top State (% of ABR) FL 27% FL 28% FL 27% Top MSA (% of ABR) Indianapolis 23% Indianapolis 9% Las Vegas 11% South and West ABR 57% 76% 77% ABR $10.57 $15.22 $17.83 Top Tenant (% of ABR) Marsh 3.2% Publix 3.4% Publix 2.5% Net-debt-to-EBITDA 13.2x 7.0x 5.9x Note: Based on retail operating portfolio in supplemental disclosures for YE 2004, 2015, and 2019. © 2020 Kite Realty Group Fourth Quarter 2019 Investor Presentation | 4
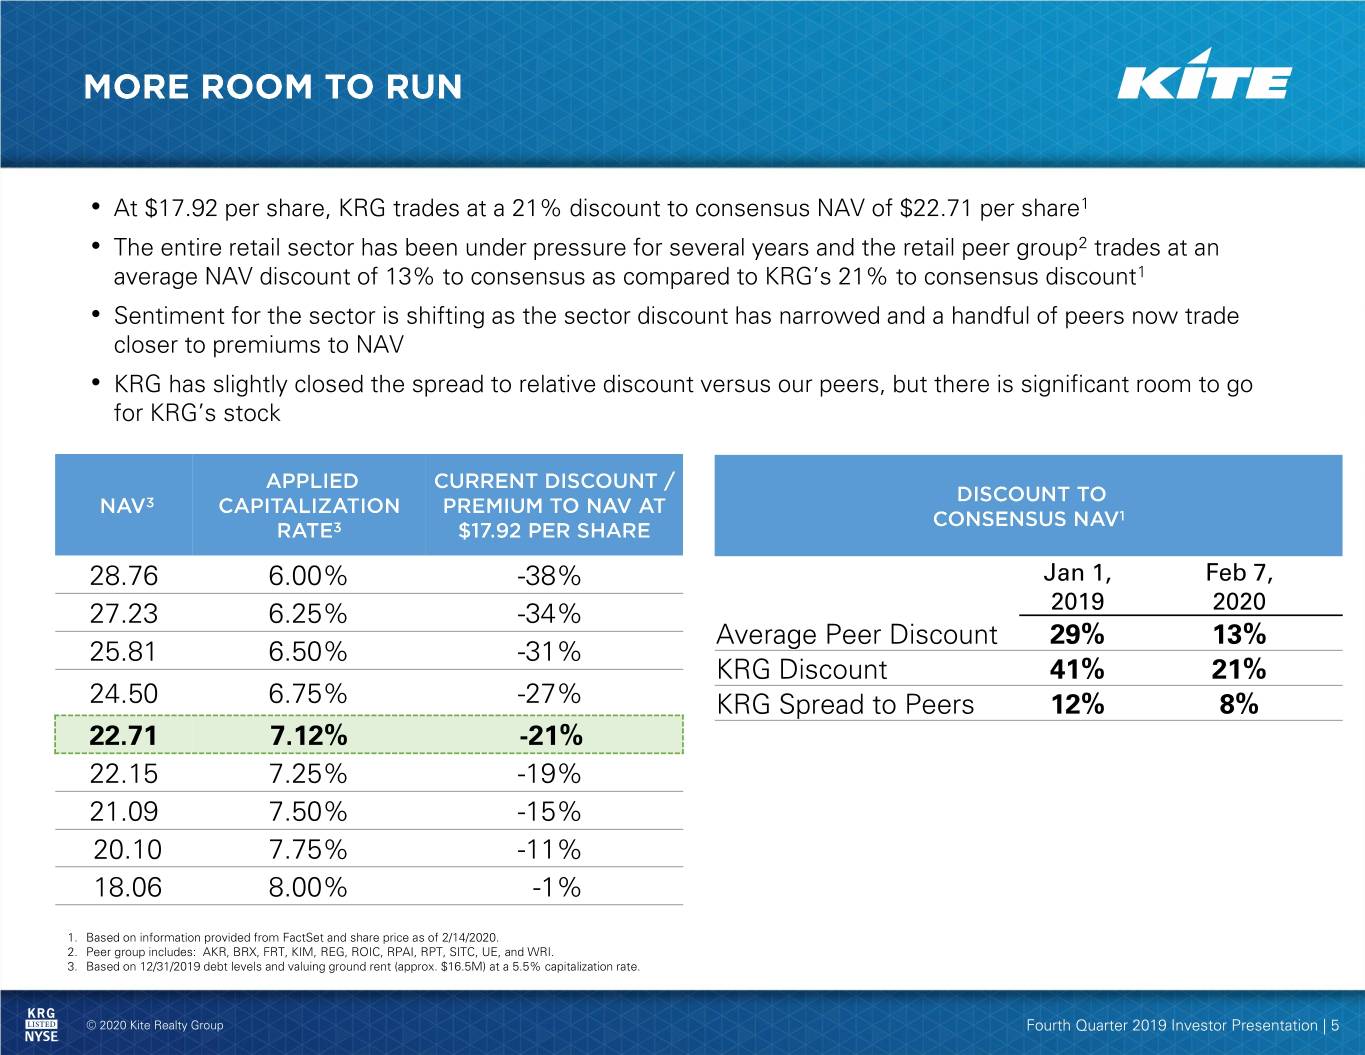
• At $17.92 per share, KRG trades at a 21% discount to consensus NAV of $22.71 per share1 • The entire retail sector has been under pressure for several years and the retail peer group2 trades at an average NAV discount of 13% to consensus as compared to KRG’s 21% to consensus discount1 • Sentiment for the sector is shifting as the sector discount has narrowed and a handful of peers now trade closer to premiums to NAV • KRG has slightly closed the spread to relative discount versus our peers, but there is significant room to go for KRG’s stock 28.76 6.00% -38% Jan 1, Feb 7, 27.23 6.25% -34% 2019 2020 Average Peer Discount 29% 13% 25.81 6.50% -31% KRG Discount 41% 21% 24.50 6.75% -27% KRG Spread to Peers 12% 8% 22.71 7.12% -21% 22.15 7.25% -19% 21.09 7.50% -15% 20.10 7.75% -11% 18.06 8.00% -1% 1. Based on information provided from FactSet and share price as of 2/14/2020. 2. Peer group includes: AKR, BRX, FRT, KIM, REG, ROIC, RPAI, RPT, SITC, UE, and WRI. 3. Based on 12/31/2019 debt levels and valuing ground rent (approx. $16.5M) at a 5.5% capitalization rate. © 2020 Kite Realty Group Fourth Quarter 2019 Investor Presentation | 5
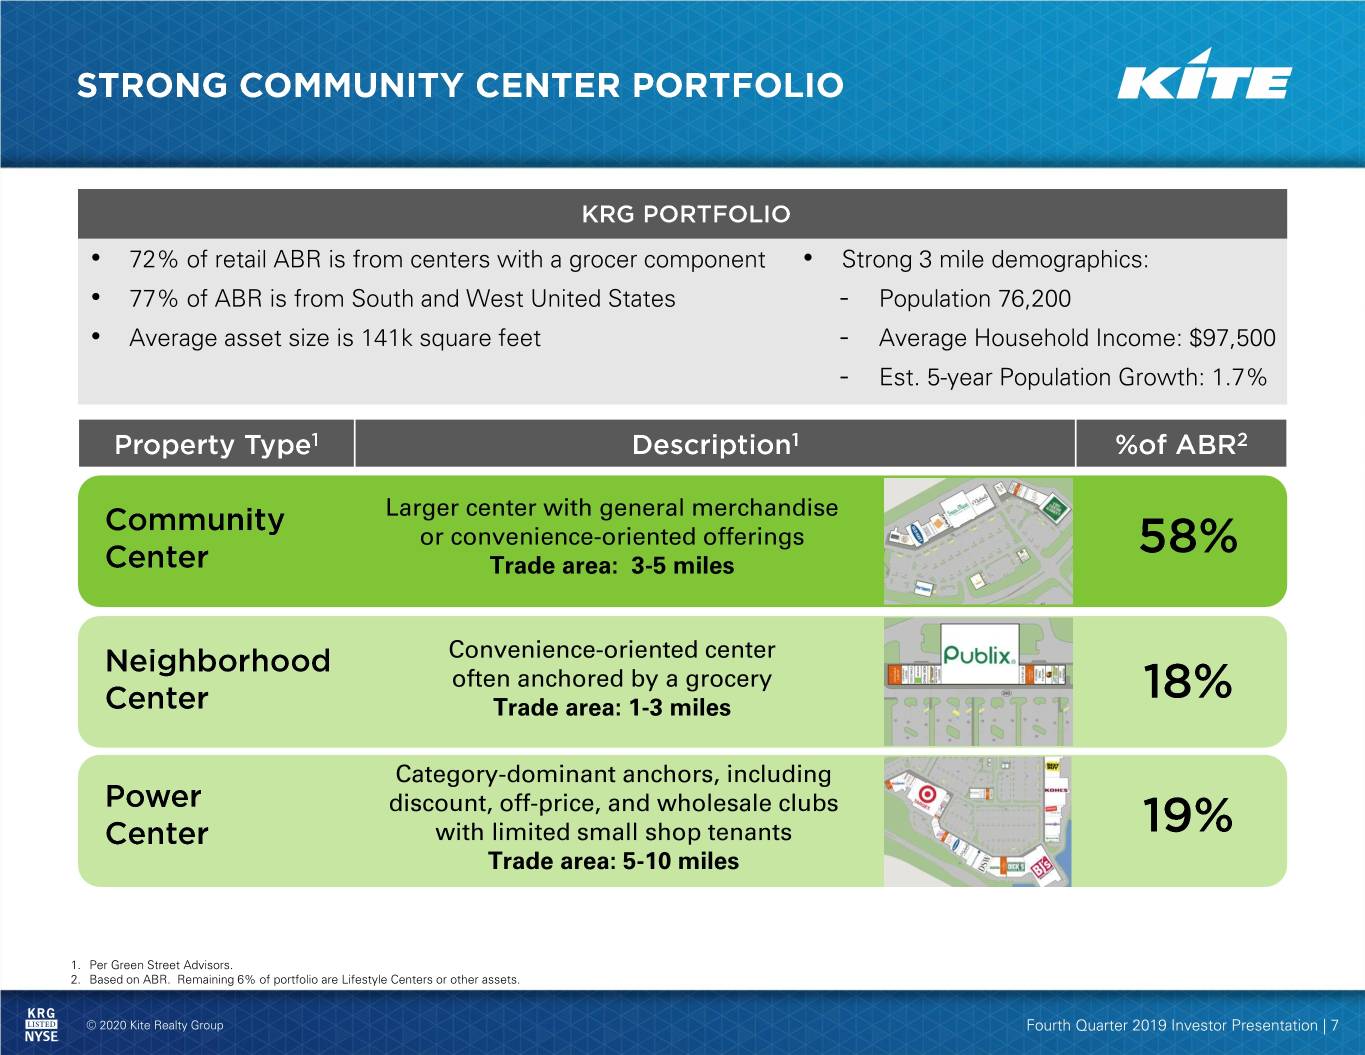
• 72% of retail ABR is from centers with a grocer component • Strong 3 mile demographics: • 77% of ABR is from South and West United States - Population 76,200 • Average asset size is 141k square feet - Average Household Income: $97,500 - Est. 5-year Population Growth: 1.7% Larger center with general merchandise or convenience-oriented offerings Trade area: 3-5 miles Convenience-oriented center often anchored by a grocery Trade area: 1-3 miles Category-dominant anchors, including discount, off-price, and wholesale clubs with limited small shop tenants Trade area: 5-10 miles 1. Per Green Street Advisors. 2. Based on ABR. Remaining 6% of portfolio are Lifestyle Centers or other assets. © 2020 Kite Realty Group Fourth Quarter 2019 Investor Presentation | 7

• Project Focus pruned lower-growth, non-core assets at a cap rate of ~8.0% Population (3 Mile) 61,700 76,200 • KRG’s strong portfolio currently trades at an implied cap rate of ~8.0% Population Growth (3 Mile) 1.0% 1.7% • Consensus estimated NAV is $22.71, Average HHI (3 Mile) $71,800 $97,500 which implies a 7.1% cap rate1 ABR / PSF $14.64 $17.83 • If KRG stock traded up to consensus NAV % of ABR with Grocer 68% 72% the stock would return over 25% in price- only movement % of ABR in Top 50 MSAs 41% 73% Average 2014 – 2019 NOI CAGR 1.1% 2.6% • 79% of KRG’s ABR comes from Top 50 MSAs and our “SAM” Portfolio Cap Rate - Actual / Implied1 ~8.0% ~8.0% Note: “SAM” Portfolio stands for Strategic Assets and Markets. 1. Based on share price as of 2/14/2020 and valuing ground rent (approx. $16.5M) at a 5.5% capitalization rate. © 2020 Kite Realty Group Fourth Quarter 2019 Investor Presentation | 8

© 2020 Kite Realty Group Fourth Quarter 2019 Investor Presentation | 9

Same-Property Occupancy Rate ABR PSF 96% $19.00 Record Level 95% $18.00 $17.83 94% 93.7% $17.00 $16.00 93% $15.00 92% $14.00 91% $13.00 90% $12.00 2013 2014 2015 2016 2017 2018 2019 2013 2014 2015 2016 2017 2018 2019 Narrowing spread (230 bps) as anchor rent commences across the Same-Property Leased Rate portfolio Small Shop Leased Rate Record Level 97% 93% 92.5% 96.0% 96% 91% 95% 89% 94% 87% 93% 85% 92% 83% 2013 2014 2015 2016 2017 2018 2019 2013 2014 2015 2016 2017 2018 2019 © 2020 Kite Realty Group Fourth Quarter 2019 Investor Presentation | 10
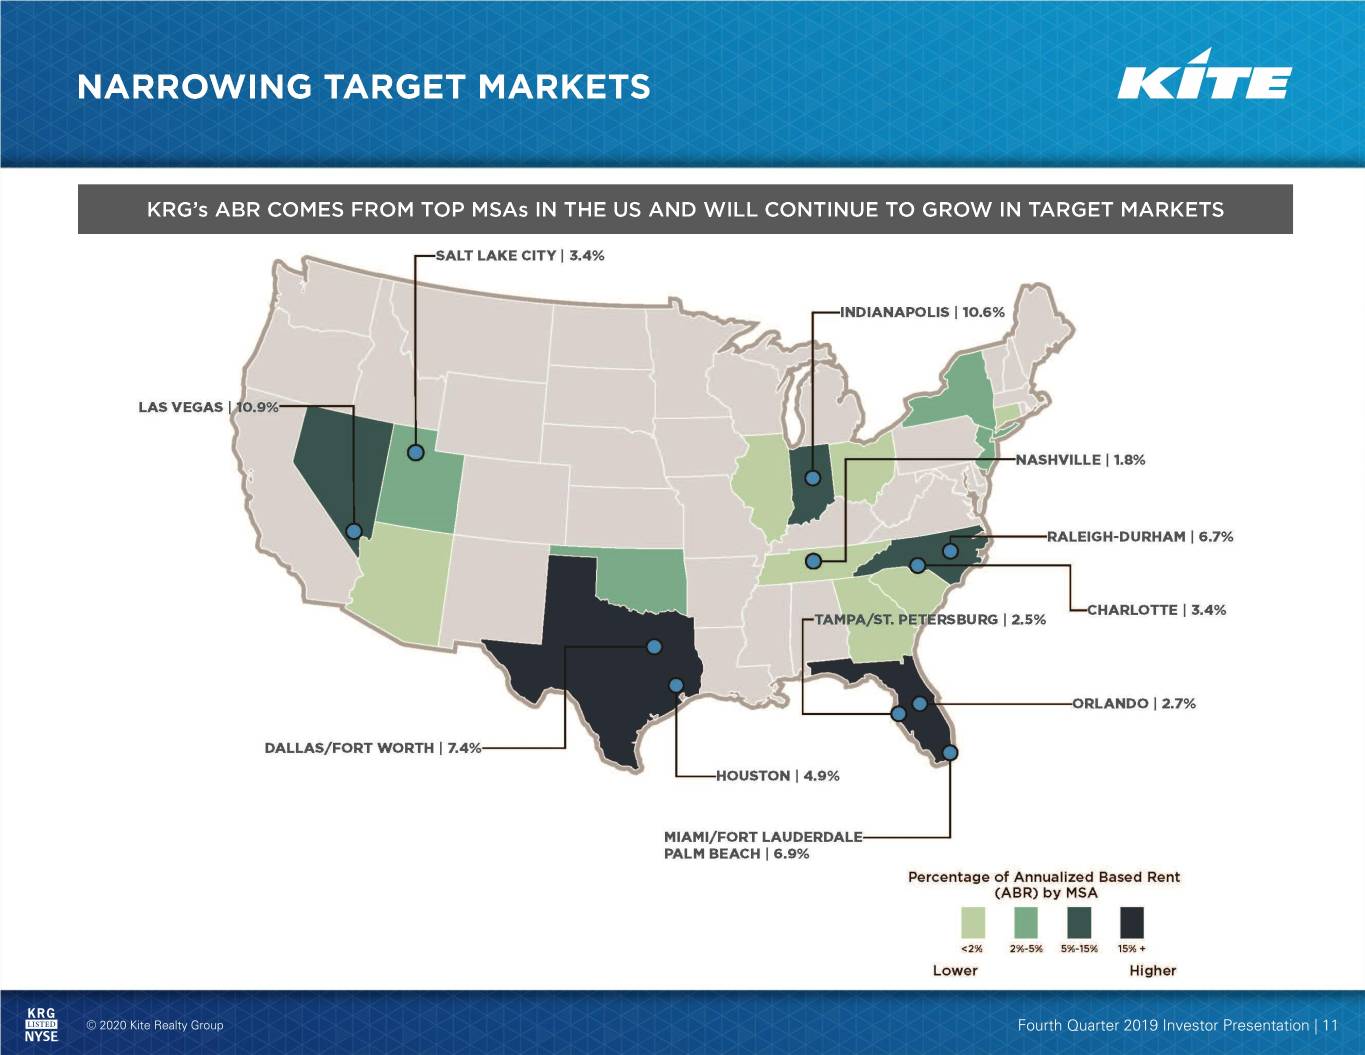
© 2020 Kite Realty Group Fourth Quarter 2019 Investor Presentation | 11
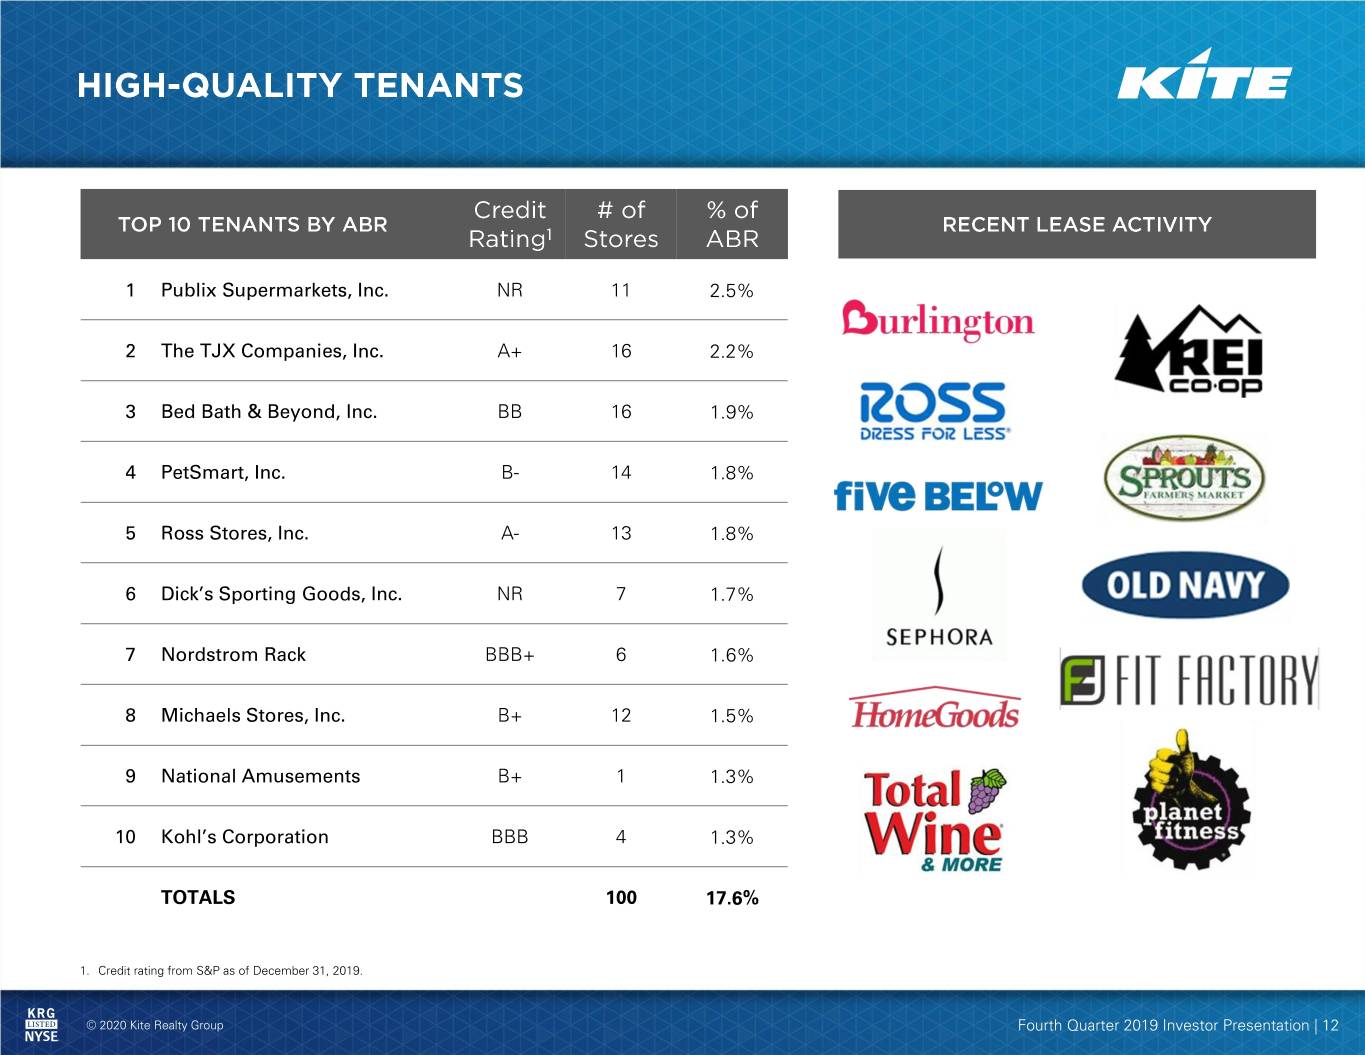
1 Publix Supermarkets, Inc. NR 11 2.5% 2 The TJX Companies, Inc. A+ 16 2.2% 3 Bed Bath & Beyond, Inc. BB 16 1.9% 4 PetSmart, Inc. B- 14 1.8% 5 Ross Stores, Inc. A- 13 1.8% 6 Dick’s Sporting Goods, Inc. NR 7 1.7% 7 Nordstrom Rack BBB+ 6 1.6% 8 Michaels Stores, Inc. B+ 12 1.5% 9 National Amusements B+ 1 1.3% 10 Kohl’s Corporation BBB 4 1.3% TOTALS 100 17.6% 1. Credit rating from S&P as of December 31, 2019. © 2020 Kite Realty Group Fourth Quarter 2019 Investor Presentation | 12
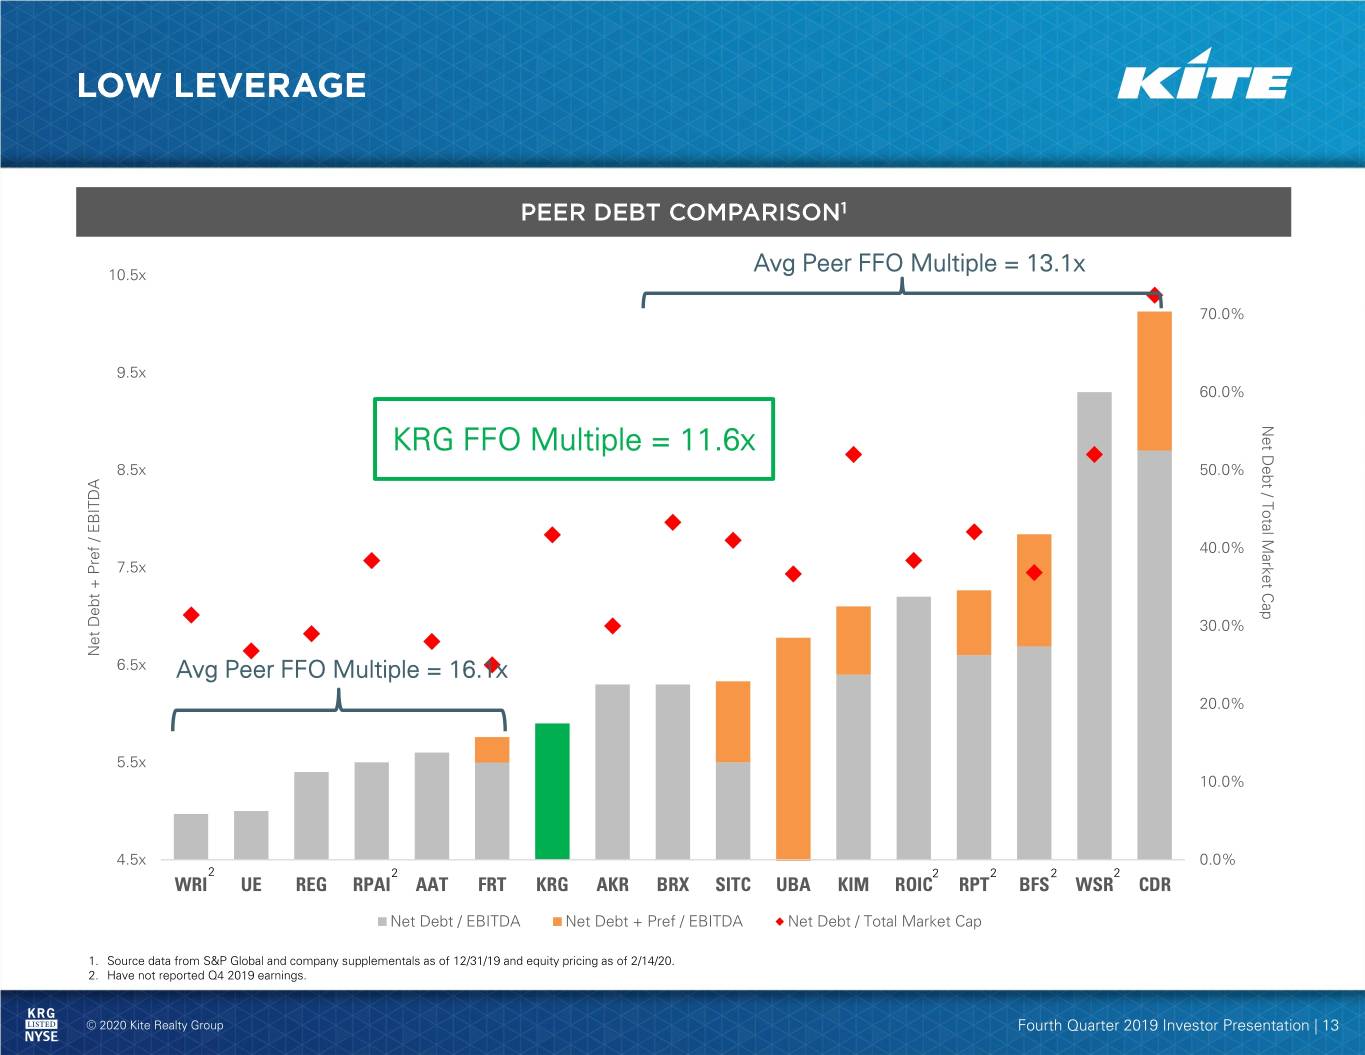
10.5x Avg Peer FFO Multiple = 13.1x 70.0% 9.5x 60.0% KRG FFO Multiple = 11.6x NetCap Total / Market Debt 8.5x 50.0% 40.0% 7.5x 30.0% Net Debt / Debt EBITDA Pref + Net 6.5x Avg Peer FFO Multiple = 16.1x 20.0% 5.5x 10.0% 4.5x 0.0% 2 2 2 2 2 2 WRI UE REG RPAI AAT FRT KRG AKR BRX SITC UBA KIM ROIC RPT BFS WSR CDR Net Debt / EBITDA Net Debt + Pref / EBITDA Net Debt / Total Market Cap 1. Source data from S&P Global and company supplementals as of 12/31/19 and equity pricing as of 2/14/20. 2. Have not reported Q4 2019 earnings. © 2020 Kite Realty Group Fourth Quarter 2019 Investor Presentation | 13

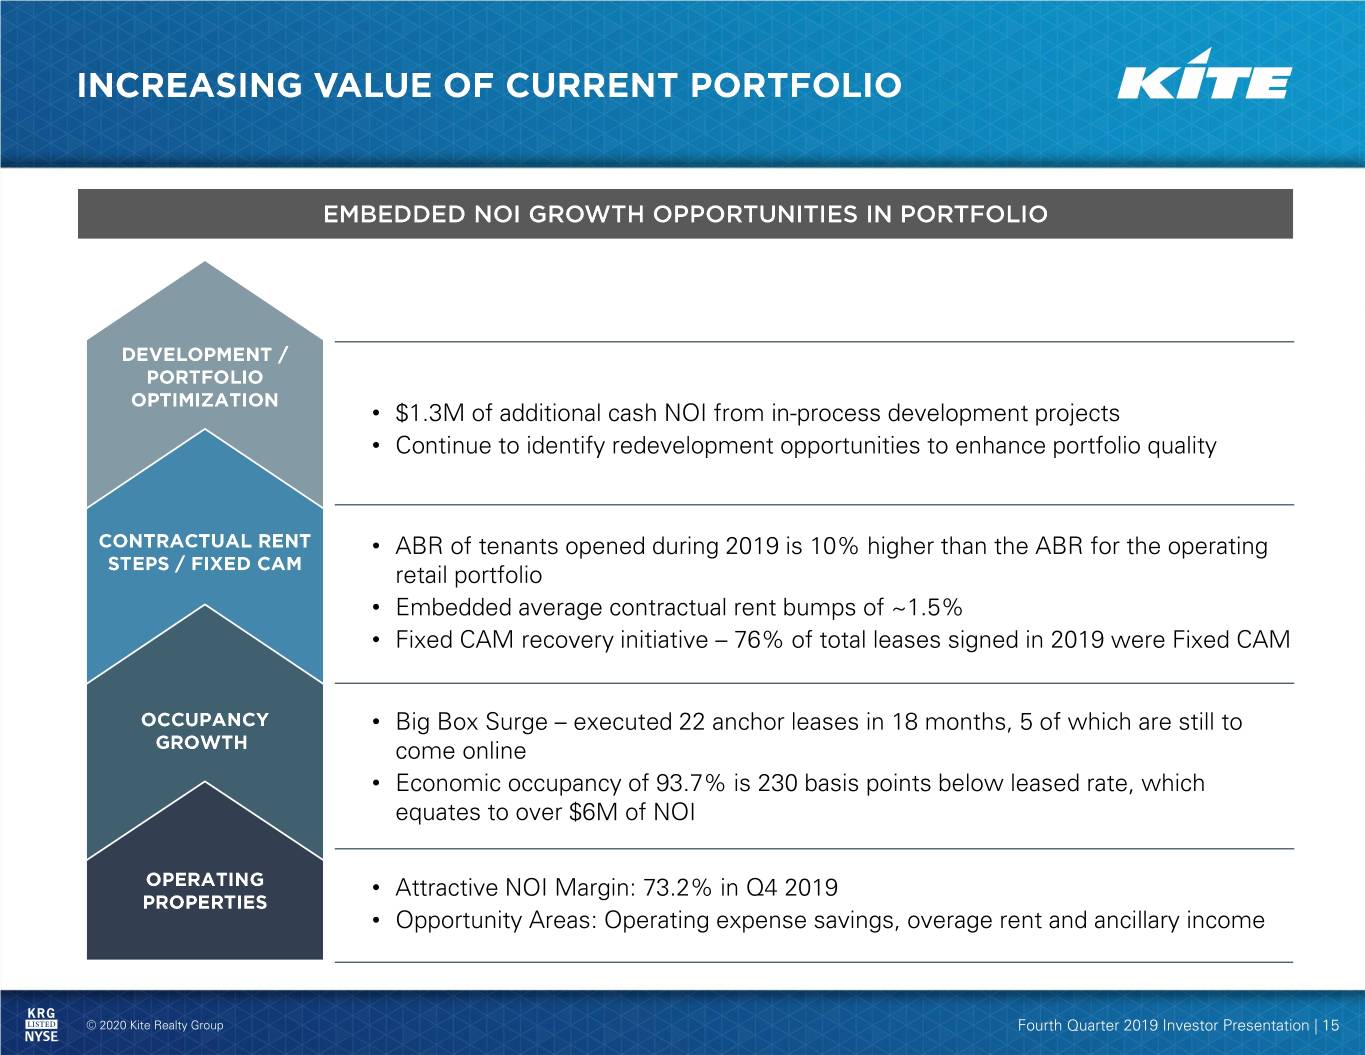
• $1.3M of additional cash NOI from in-process development projects • Continue to identify redevelopment opportunities to enhance portfolio quality • ABR of tenants opened during 2019 is 10% higher than the ABR for the operating retail portfolio • Embedded average contractual rent bumps of ~1.5% • Fixed CAM recovery initiative – 76% of total leases signed in 2019 were Fixed CAM • Big Box Surge – executed 22 anchor leases in 18 months, 5 of which are still to come online • Economic occupancy of 93.7% is 230 basis points below leased rate, which equates to over $6M of NOI • Attractive NOI Margin: 73.2% in Q4 2019 • Opportunity Areas: Operating expense savings, overage rent and ancillary income © 2020 Kite Realty Group Fourth Quarter 2019 Investor Presentation | 15

# of Leases Signed 22 Anchors as % of GLA 68% # of Different Tenants Signed 17 Anchors as % of ABR 48% Square Feet of New Leases 561k Anchor Leased % 98% Total Expected Cost $43M Number of Anchors Spaces Vacant 5 Return on Capital ~16% Comparable Cash Lease Spread1 ~21% $2.5 $2.1 $2.0 $1.6 $1.5 $1.0 $0.6 $0.5 $0.0 1. Includes 16 of 22 leases. Q1 2020 Q2 2020 Q3 2020 Q4 2020 © 2020 Kite Realty Group Fourth Quarter 2019 Investor Presentation | 16
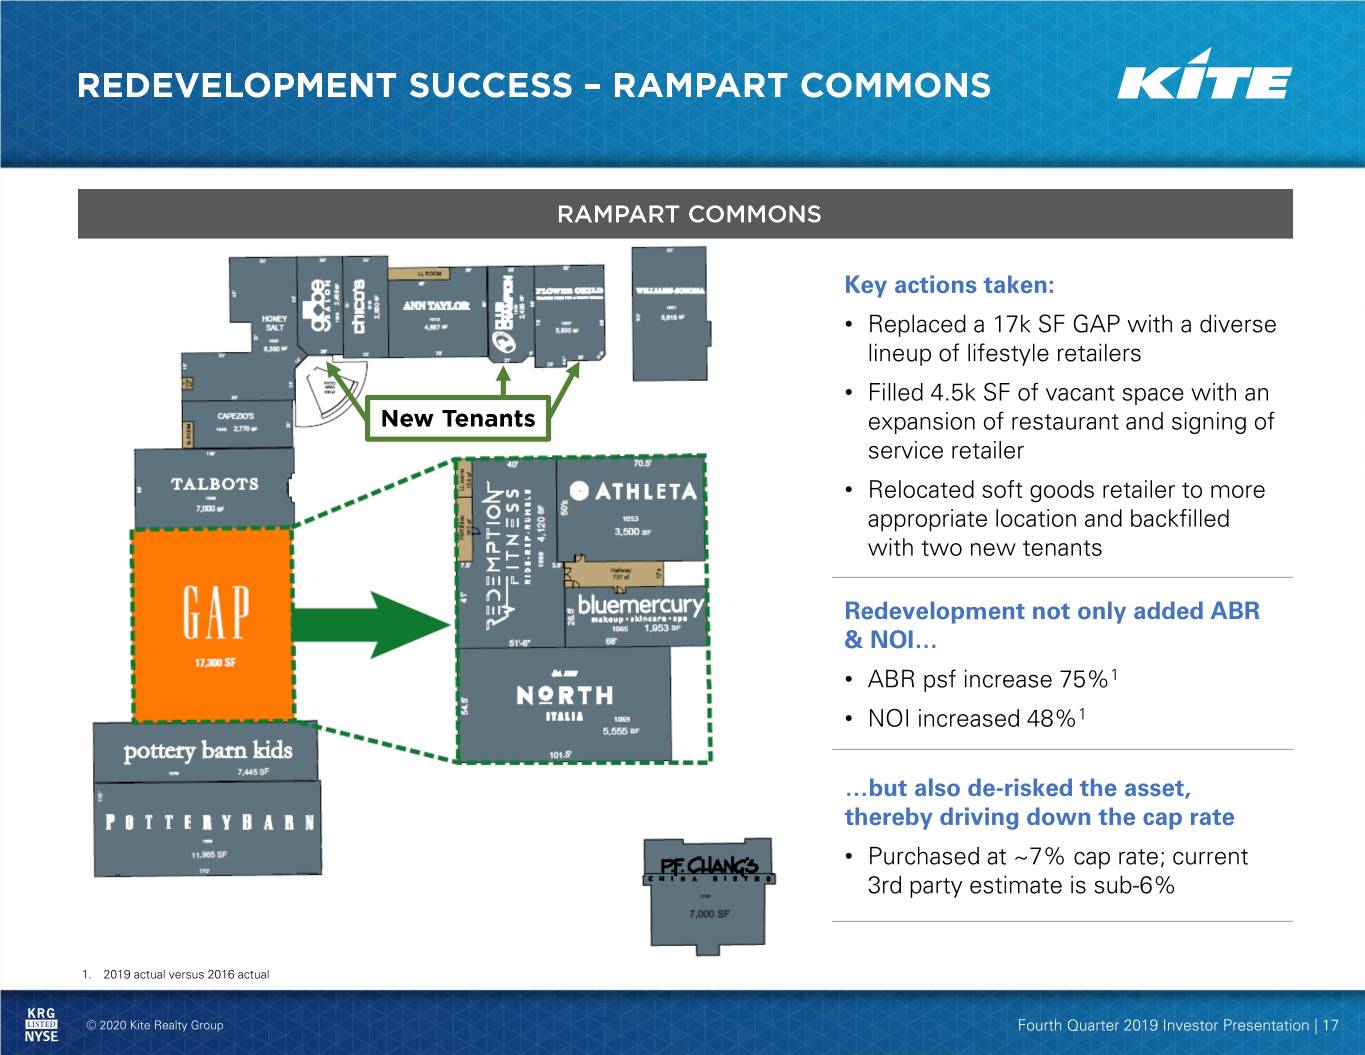
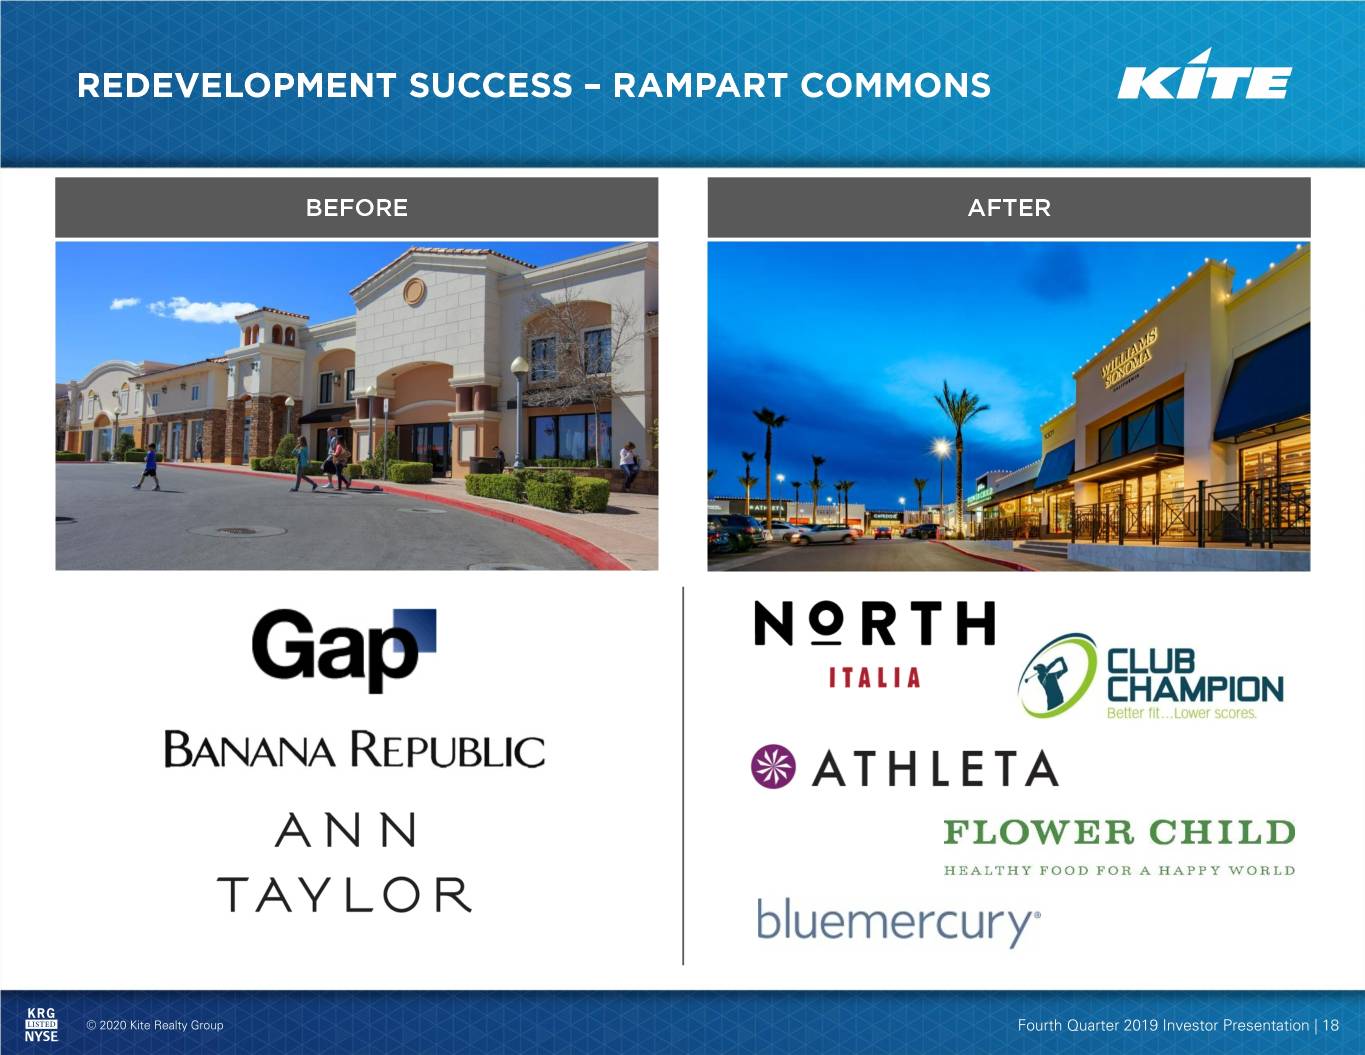
Key actions taken: • Replaced a 17k SF GAP with a diverse lineup of lifestyle retailers • Filled 4.5k SF of vacant space with an expansion of restaurant and signing of service retailer • Relocated soft goods retailer to more appropriate location and backfilled with two new tenants Redevelopment not only added ABR & NOI… • ABR psf increase 75%1 • NOI increased 48%1 …but also de-risked the asset, thereby driving down the cap rate • Purchased at ~7% cap rate; current 3rd party estimate is sub-6% 1. 2019 actual versus 2016 actual © 2020 Kite Realty Group Fourth Quarter 2019 Investor Presentation | 17
© 2020 Kite Realty Group Fourth Quarter 2019 Investor Presentation | 18
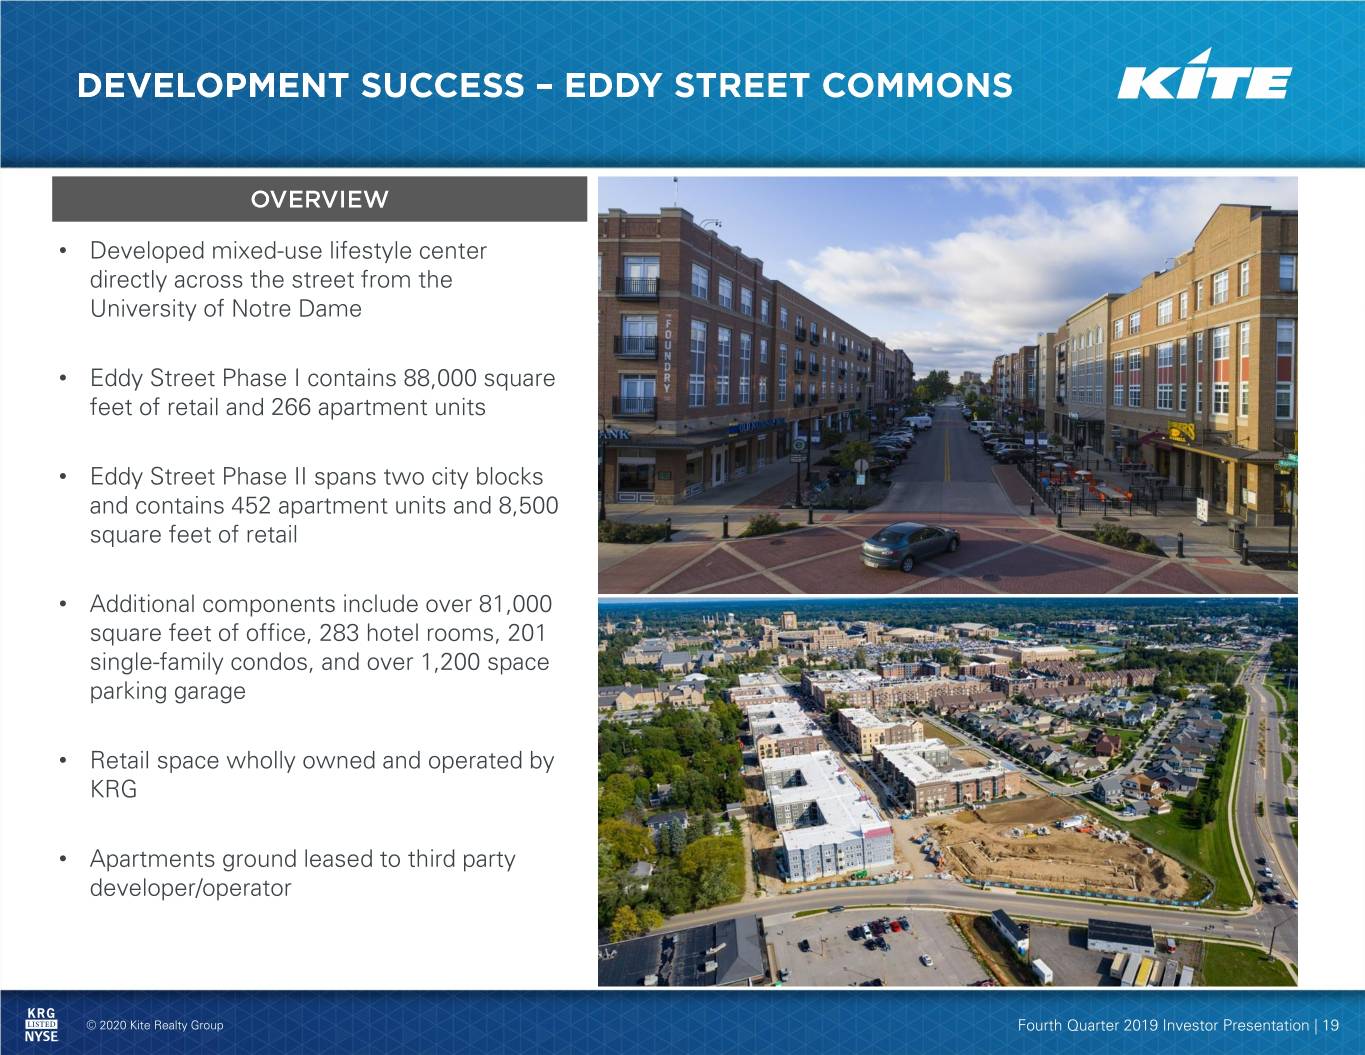
• Developed mixed-use lifestyle center directly across the street from the University of Notre Dame • Eddy Street Phase I contains 88,000 square feet of retail and 266 apartment units • Eddy Street Phase II spans two city blocks and contains 452 apartment units and 8,500 square feet of retail • Additional components include over 81,000 square feet of office, 283 hotel rooms, 201 single-family condos, and over 1,200 space parking garage • Retail space wholly owned and operated by KRG • Apartments ground leased to third party developer/operator © 2020 Kite Realty Group Fourth Quarter 2019 Investor Presentation | 19

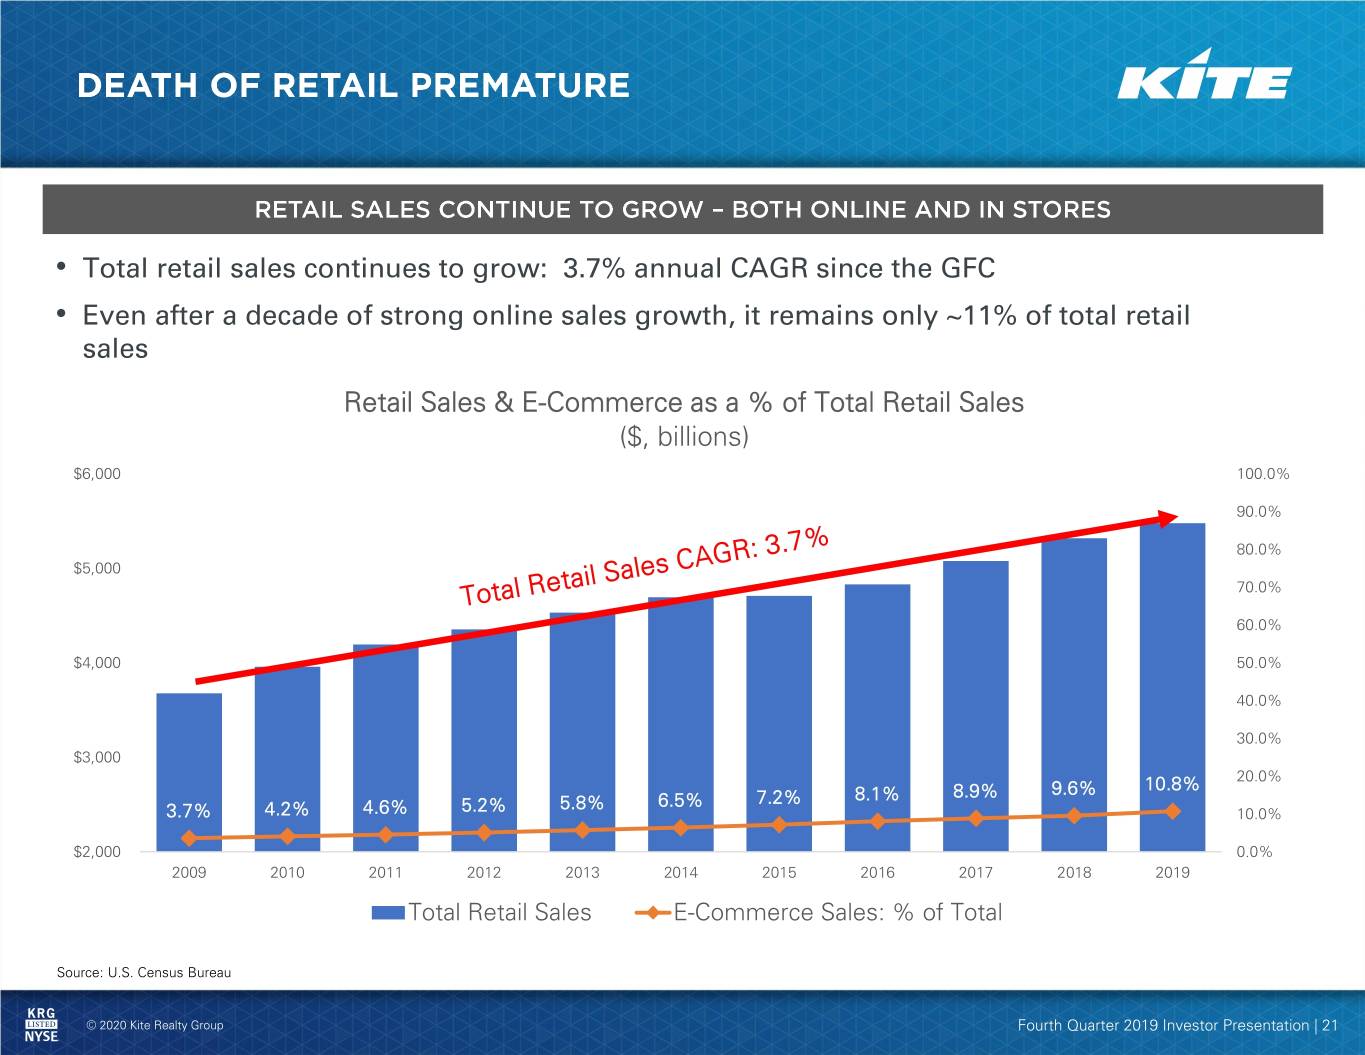
• Total retail sales continues to grow: 3.7% annual CAGR since the GFC • Even after a decade of strong online sales growth, it remains only ~11% of total retail sales Retail Sales & E-Commerce as a % of Total Retail Sales ($, billions) $6,000 100.0% 90.0% 80.0% $5,000 70.0% 60.0% $4,000 Total U.S. 50.0% 40.0% Retail Sales: 30.0% $3,000 $4.9 trillion 20.0% 8.9% 9.6% 10.8% 5.8% 6.5% 7.2% 8.1% 3.7% 4.2% 4.6% 5.2% 10.0% $2,000 0.0% 2009 2010 2011 2012 2013 2014 2015 2016 2017 2018 2019 Total Retail Sales E-Commerce Sales: % of Total Source: U.S. Census Bureau © 2020 Kite Realty Group Fourth Quarter 2019 Investor Presentation | 21
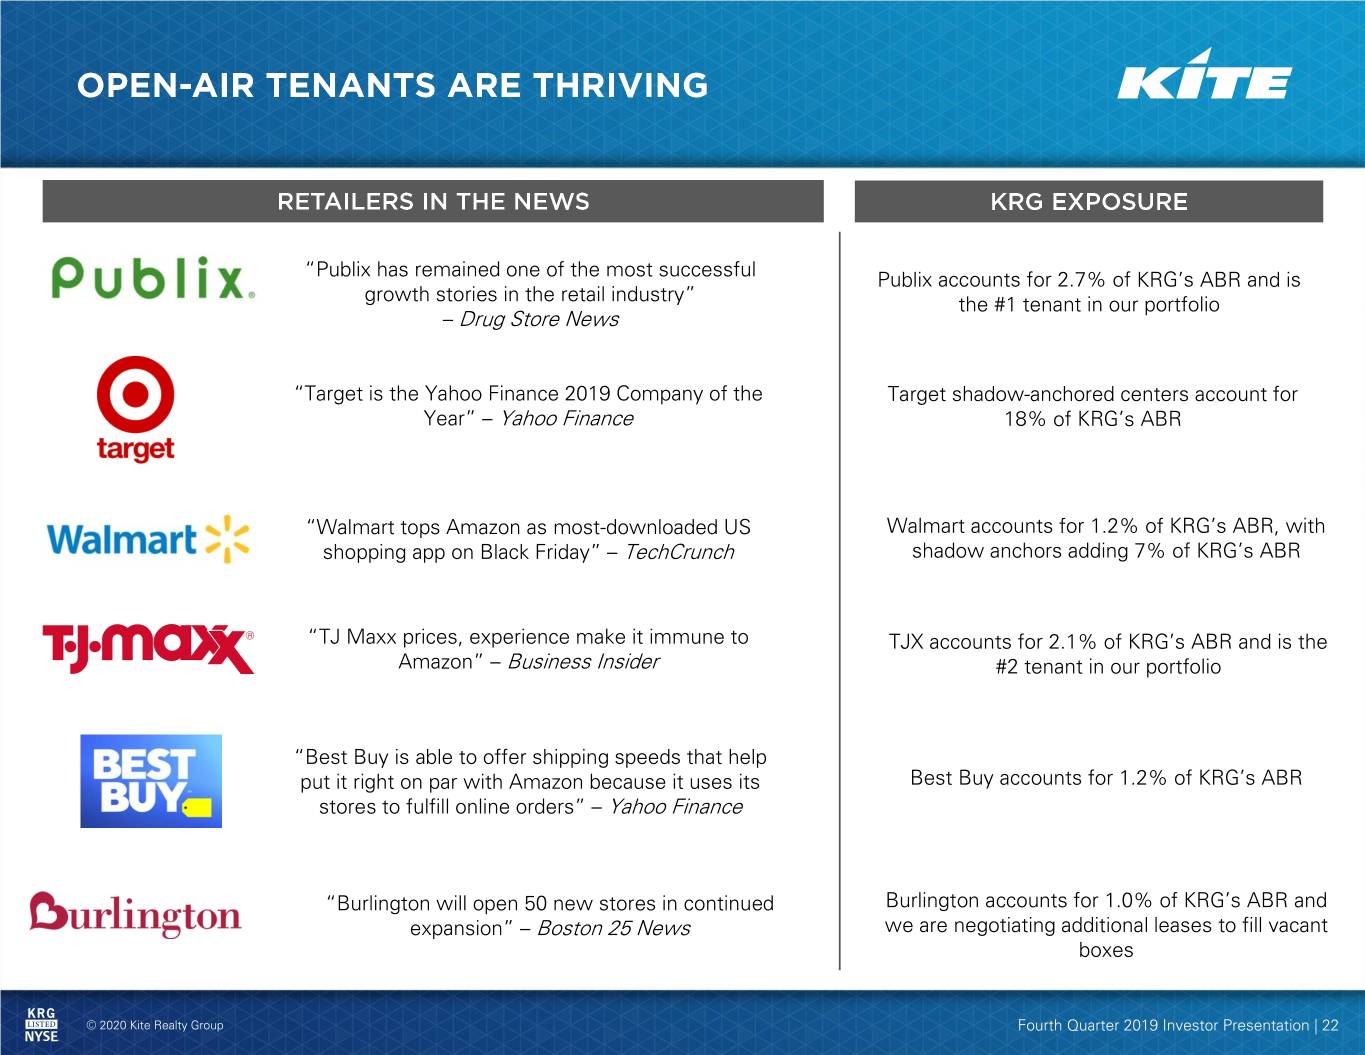
“Publix has remained one of the most successful Publix accounts for 2.7% of KRG’s ABR and is growth stories in the retail industry” the #1 tenant in our portfolio – Drug Store News “Target is the Yahoo Finance 2019 Company of the Target shadow-anchored centers account for Year” – Yahoo Finance 18% of KRG’s ABR “Walmart tops Amazon as most-downloaded US Walmart accounts for 1.2% of KRG’s ABR, with shopping app on Black Friday” – TechCrunch shadow anchors adding 7% of KRG’s ABR “TJ Maxx prices, experience make it immune to TJX accounts for 2.1% of KRG’s ABR and is the Amazon” – Business Insider #2 tenant in our portfolio “Best Buy is able to offer shipping speeds that help put it right on par with Amazon because it uses its Best Buy accounts for 1.2% of KRG’s ABR stores to fulfill online orders” – Yahoo Finance “Burlington will open 50 new stores in continued Burlington accounts for 1.0% of KRG’s ABR and expansion” – Boston 25 News we are negotiating additional leases to fill vacant boxes © 2020 Kite Realty Group Fourth Quarter 2019 Investor Presentation | 22
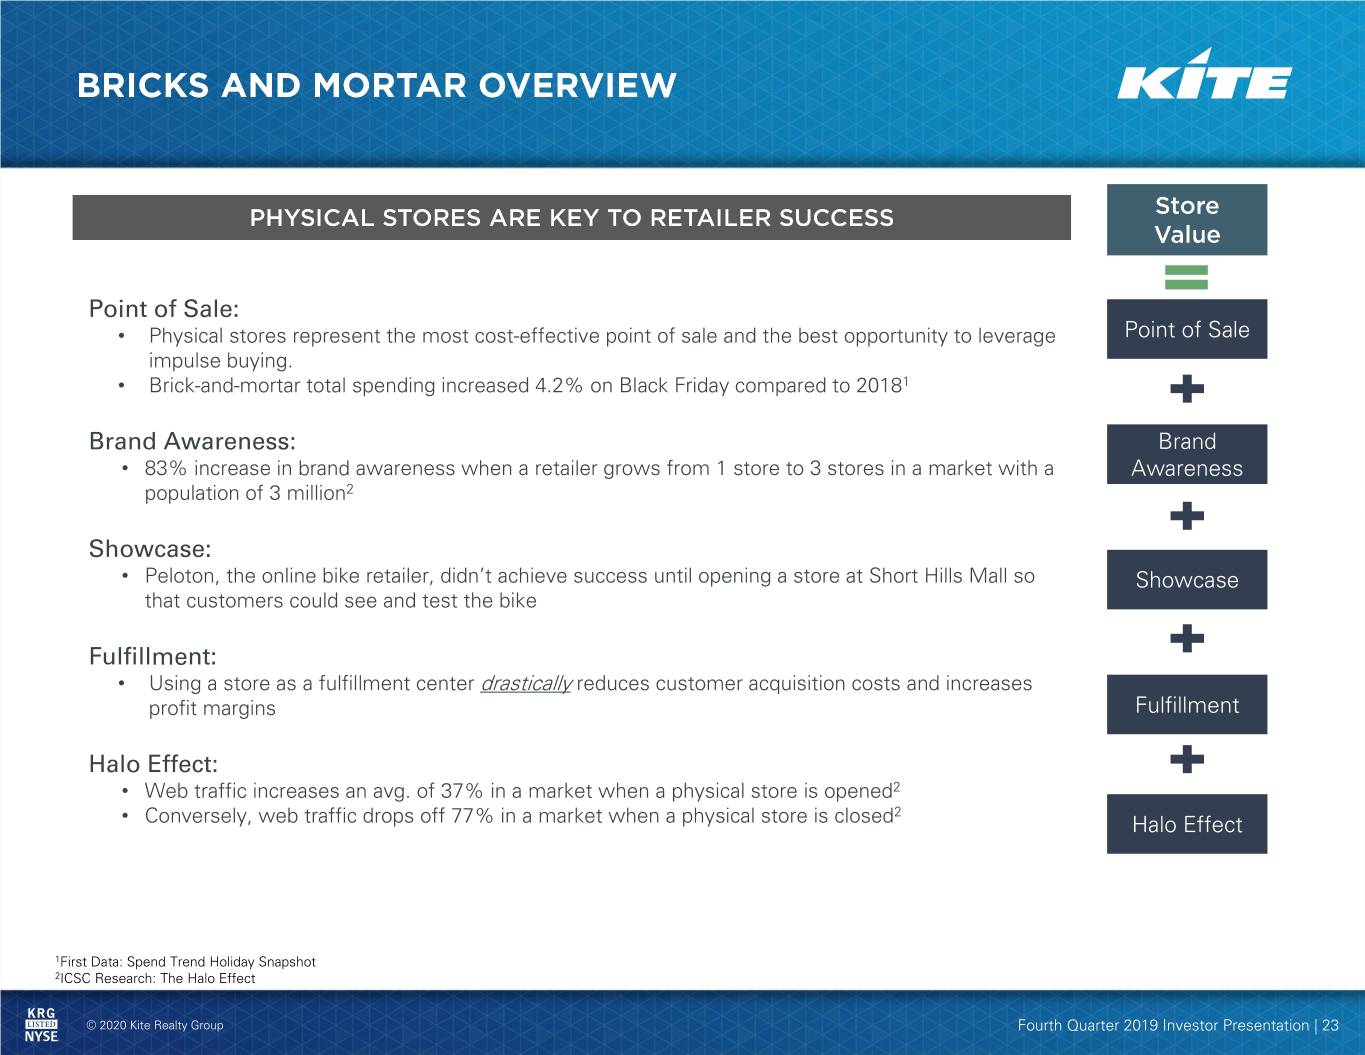
Point of Sale: • Physical stores represent the most cost-effective point of sale and the best opportunity to leverage Point of Sale impulse buying. • Brick-and-mortar total spending increased 4.2% on Black Friday compared to 20181 Brand Awareness: Brand • 83% increase in brand awareness when a retailer grows from 1 store to 3 stores in a market with a Awareness population of 3 million2 Showcase: • Peloton, the online bike retailer, didn’t achieve success until opening a store at Short Hills Mall so Showcase that customers could see and test the bike Fulfillment: • Using a store as a fulfillment center drastically reduces customer acquisition costs and increases profit margins Fulfillment Halo Effect: • Web traffic increases an avg. of 37% in a market when a physical store is opened2 2 • Conversely, web traffic drops off 77% in a market when a physical store is closed Halo Effect 1First Data: Spend Trend Holiday Snapshot 2ICSC Research: The Halo Effect © 2020 Kite Realty Group Fourth Quarter 2019 Investor Presentation | 23
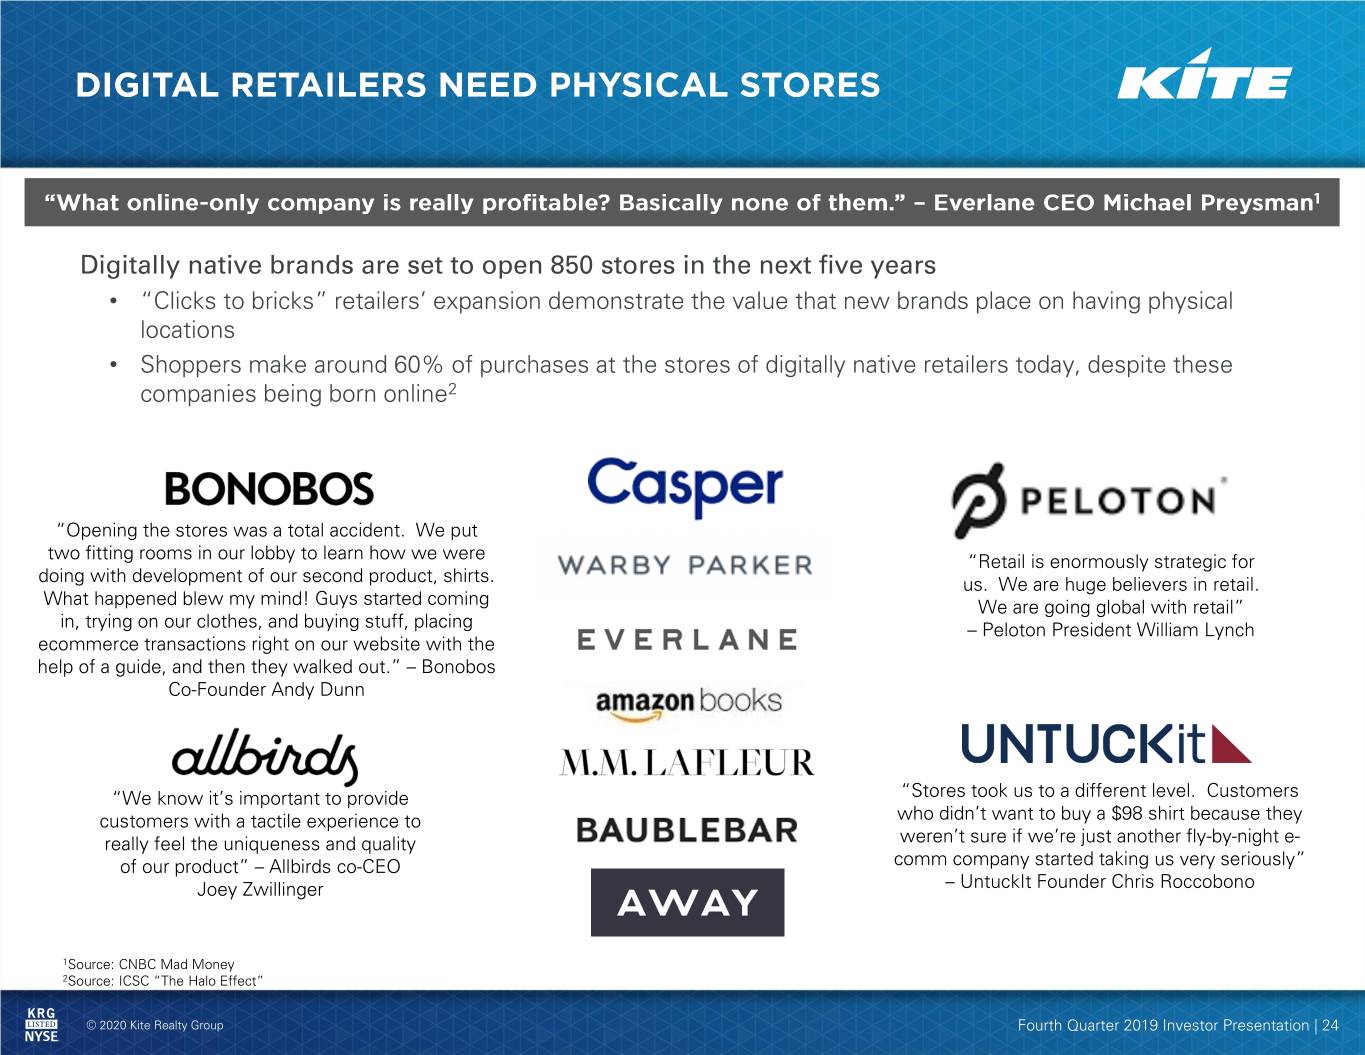
Digitally native brands are set to open 850 stores in the next five years • “Clicks to bricks” retailers’ expansion demonstrate the value that new brands place on having physical locations • Shoppers make around 60% of purchases at the stores of digitally native retailers today, despite these companies being born online2 “Opening the stores was a total accident. We put two fitting rooms in our lobby to learn how we were “Retail is enormously strategic for doing with development of our second product, shirts. us. We are huge believers in retail. What happened blew my mind! Guys started coming We are going global with retail” in, trying on our clothes, and buying stuff, placing – Peloton President William Lynch ecommerce transactions right on our website with the help of a guide, and then they walked out.” – Bonobos Co-Founder Andy Dunn “We know it’s important to provide “Stores took us to a different level. Customers customers with a tactile experience to who didn’t want to buy a $98 shirt because they really feel the uniqueness and quality weren’t sure if we’re just another fly-by-night e- of our product” – Allbirds co-CEO comm company started taking us very seriously” Joey Zwillinger – UntuckIt Founder Chris Roccobono 1Source: CNBC Mad Money 2Source: ICSC “The Halo Effect” © 2020 Kite Realty Group Fourth Quarter 2019 Investor Presentation | 24
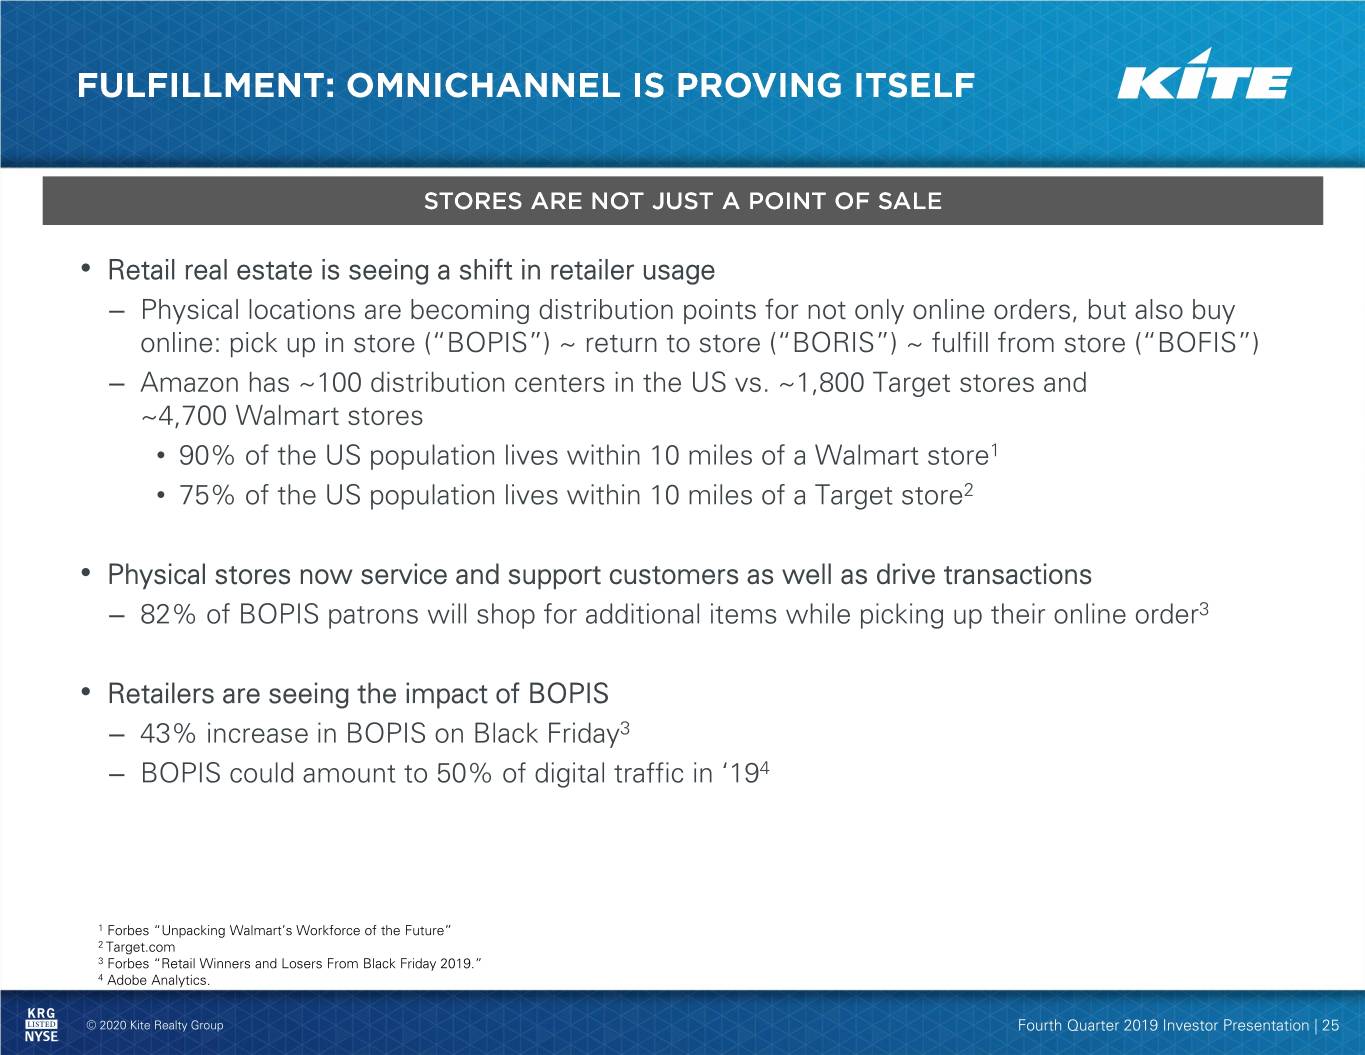
• Retail real estate is seeing a shift in retailer usage – Physical locations are becoming distribution points for not only online orders, but also buy online: pick up in store (“BOPIS”) ~ return to store (“BORIS”) ~ fulfill from store (“BOFIS”) – Amazon has ~100 distribution centers in the US vs. ~1,800 Target stores and ~4,700 Walmart stores • 90% of the US population lives within 10 miles of a Walmart store1 • 75% of the US population lives within 10 miles of a Target store2 • Physical stores now service and support customers as well as drive transactions – 82% of BOPIS patrons will shop for additional items while picking up their online order3 • Retailers are seeing the impact of BOPIS – 43% increase in BOPIS on Black Friday3 – BOPIS could amount to 50% of digital traffic in ‘194 1 Forbes “Unpacking Walmart’s Workforce of the Future” 2 Target.com 3 Forbes “Retail Winners and Losers From Black Friday 2019.” 4 Adobe Analytics. © 2020 Kite Realty Group Fourth Quarter 2019 Investor Presentation | 25
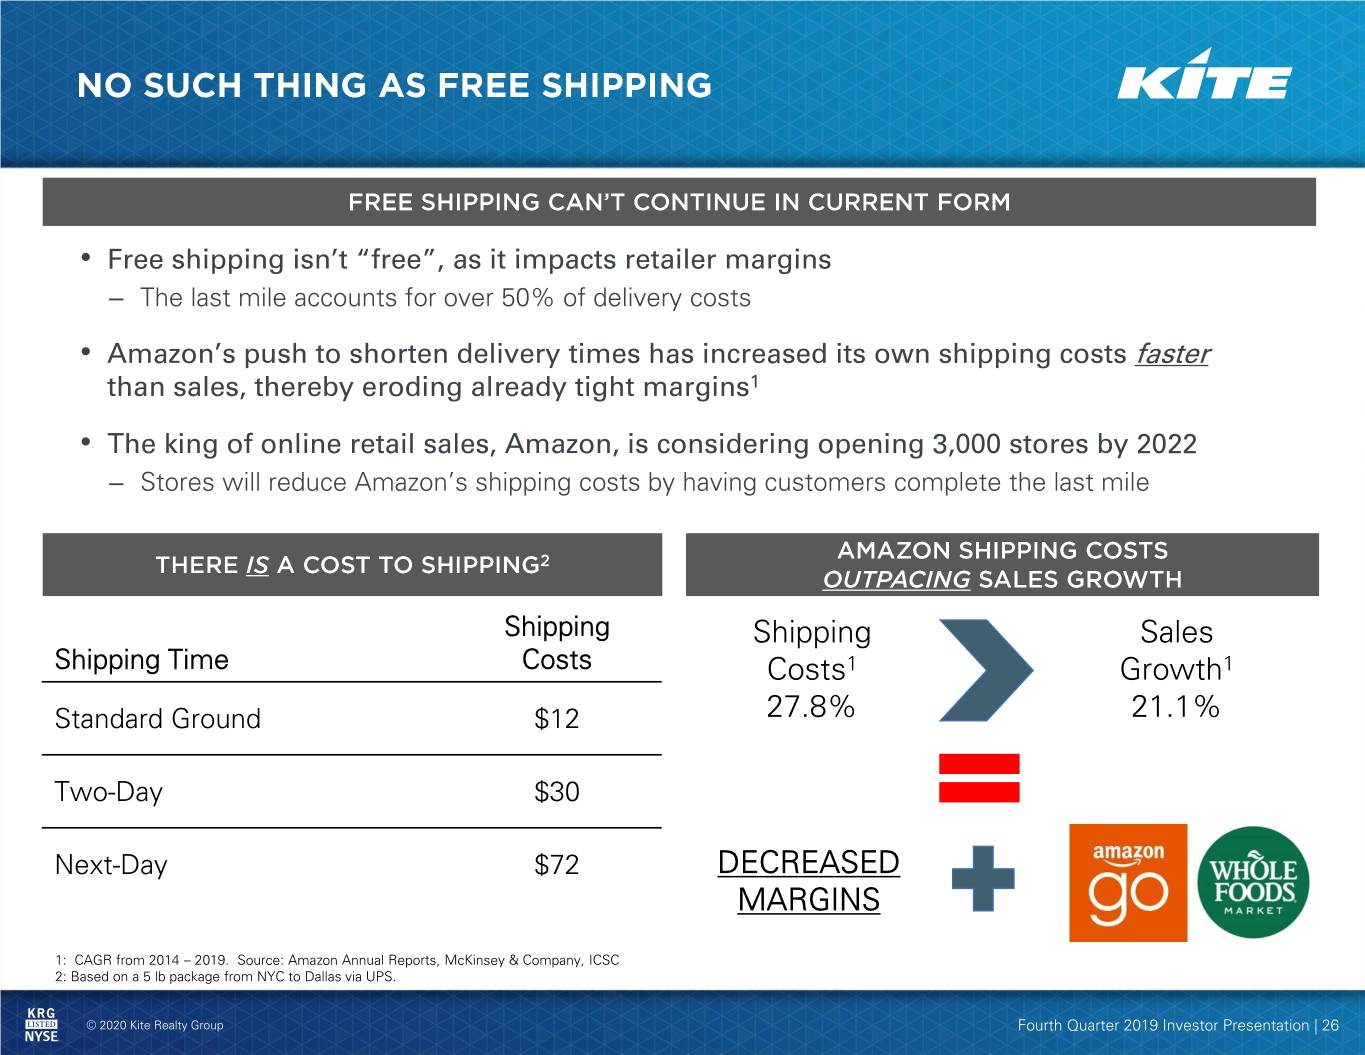
• Free shipping isn’t “free”, as it impacts retailer margins – The last mile accounts for over 50% of delivery costs • Amazon’s push to shorten delivery times has increased its own shipping costs faster than sales, thereby eroding already tight margins1 • The king of online retail sales, Amazon, is considering opening 3,000 stores by 2022 – Stores will reduce Amazon’s shipping costs by having customers complete the last mile Shipping Shipping Sales Shipping Time Costs Costs1 Growth1 Standard Ground $12 27.8% 21.1% Two-Day $30 Next-Day $72 DECREASED MARGINS 1: CAGR from 2014 – 2019. Source: Amazon Annual Reports, McKinsey & Company, ICSC 2: Based on a 5 lb package from NYC to Dallas via UPS. © 2020 Kite Realty Group Fourth Quarter 2019 Investor Presentation | 26
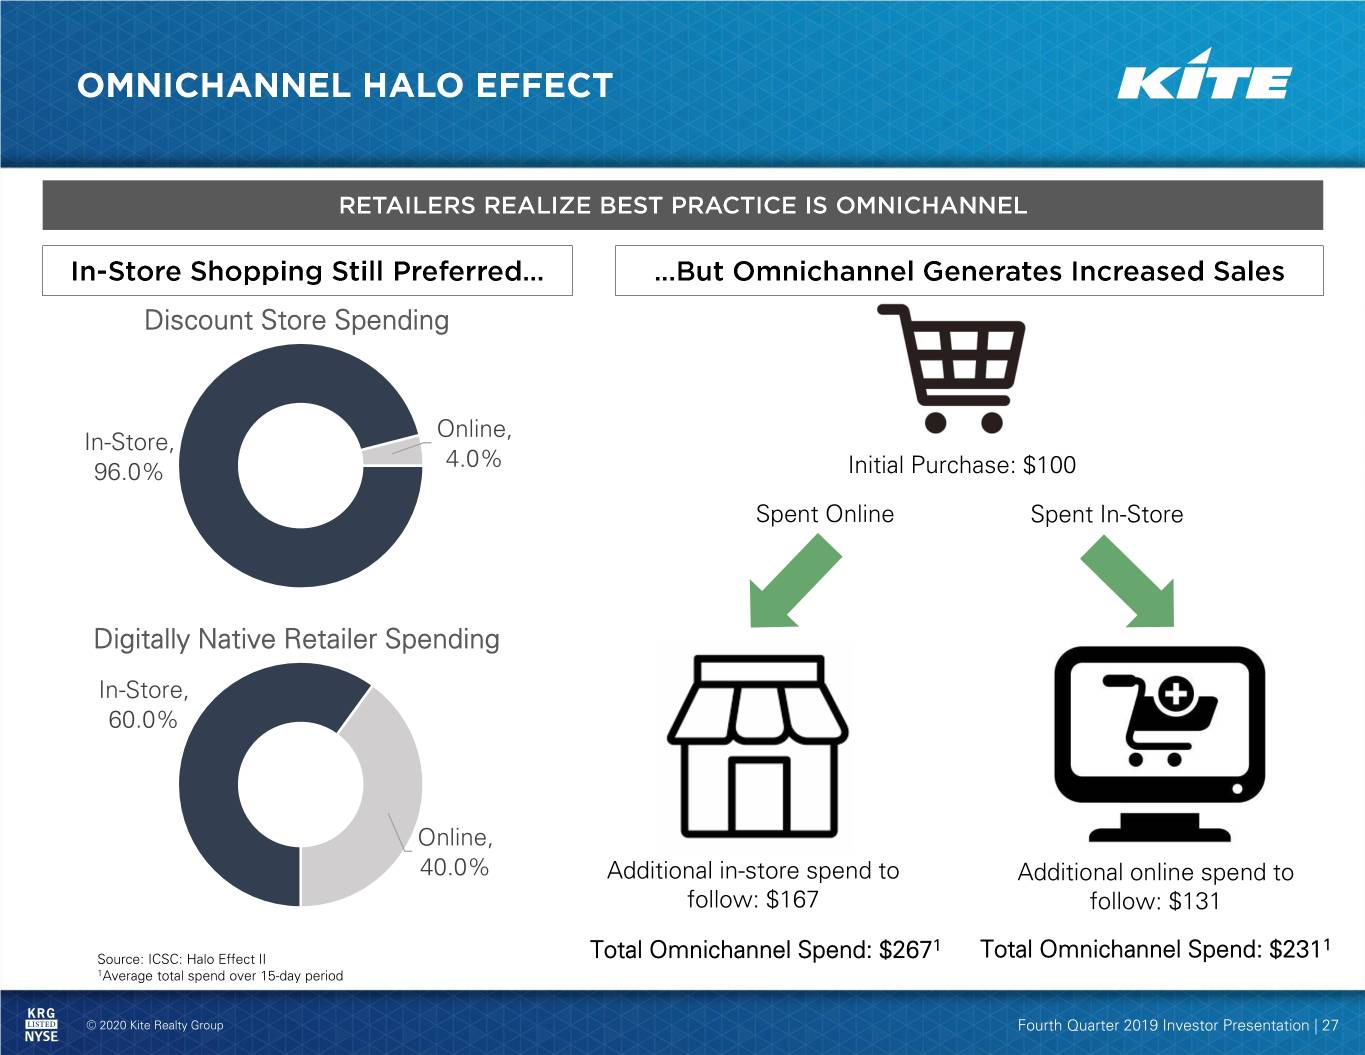
Discount Store Spending Online, In-Store, 4.0% 96.0% Initial Purchase: $100 Spent Online Spent In-Store Digitally Native Retailer Spending In-Store, 60.0% Online, 40.0% Additional in-store spend to Additional online spend to follow: $167 follow: $131 1 1 Source: ICSC: Halo Effect II Total Omnichannel Spend: $267 Total Omnichannel Spend: $231 1Average total spend over 15-day period © 2020 Kite Realty Group Fourth Quarter 2019 Investor Presentation | 27

• US is currently experiencing a migration shift to the Southern / Western US for a variety of reasons (cost of living, lifestyle, taxes, etc.) • No state income taxes in Florida, Texas, Nevada, and Tennessee is influencing migration from high income tax states like New York, California, Illinois, Connecticut, and New Jersey • In 2018, 1.2 million people moved to the South from another region – the highest migration total compared to other regions – Florida had the most movers into the state with 566k people – New York was the largest contributor to Florida with 64k people – New York, Los Angeles, and Chicago experienced the largest daily migration per day from July 2017 – June 2018 Source: US Census Bureau © 2020 Kite Realty Group Fourth Quarter 2019 Investor Presentation | 29
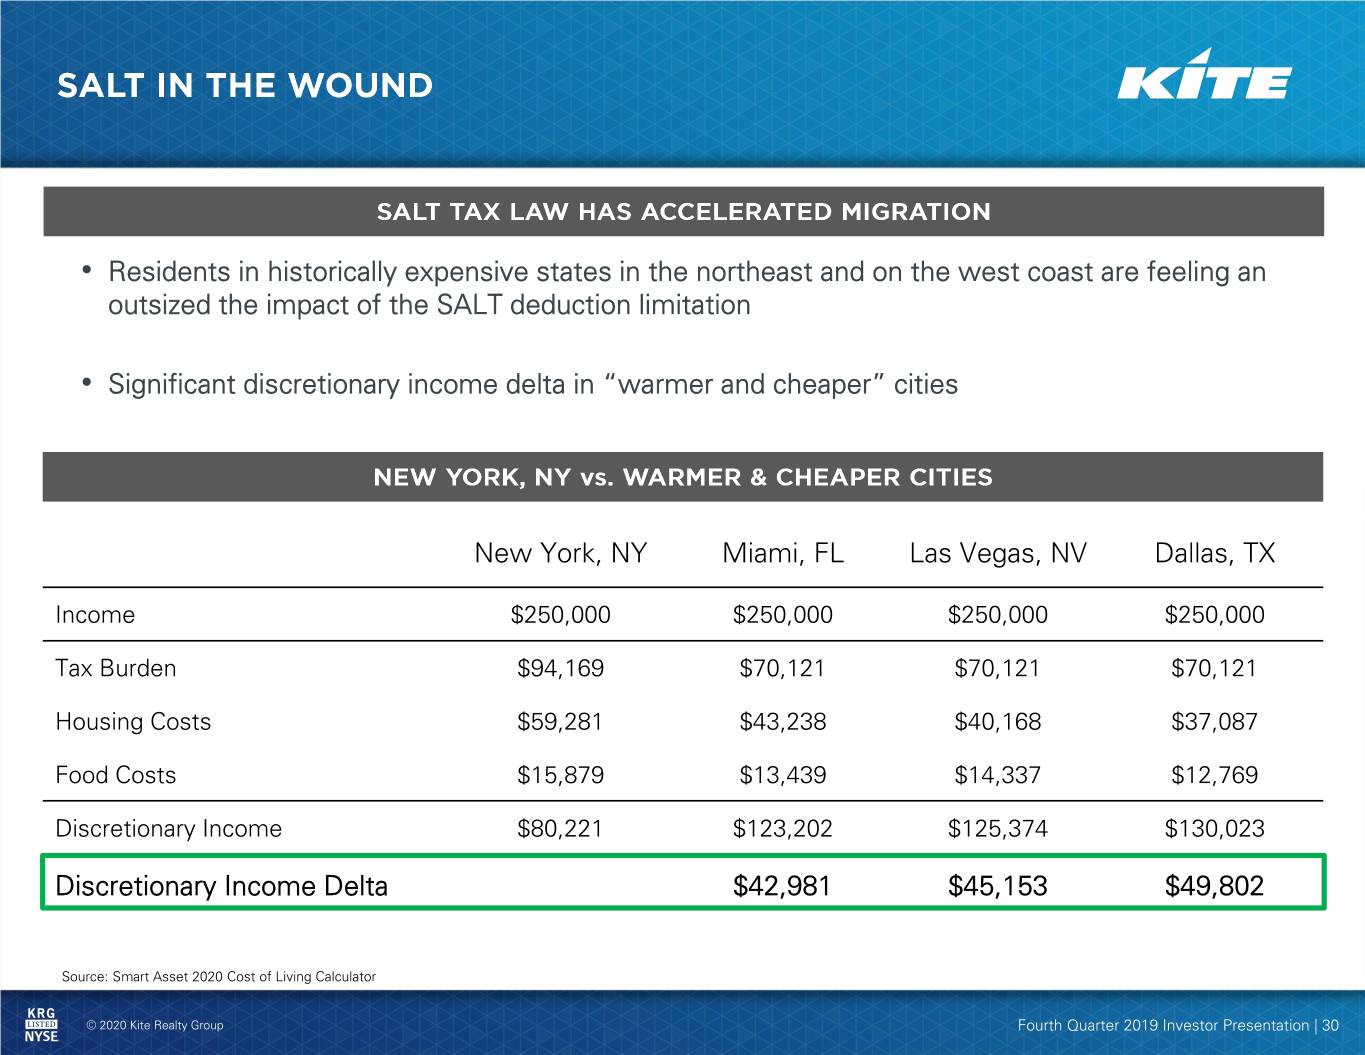
• Residents in historically expensive states in the northeast and on the west coast are feeling an outsized the impact of the SALT deduction limitation • Significant discretionary income delta in “warmer and cheaper” cities New York, NY Miami, FL Las Vegas, NV Dallas, TX Income $250,000 $250,000 $250,000 $250,000 Tax Burden $94,169 $70,121 $70,121 $70,121 Housing Costs $59,281 $43,238 $40,168 $37,087 Food Costs $15,879 $13,439 $14,337 $12,769 Discretionary Income $80,221 $123,202 $125,374 $130,023 Discretionary Income Delta $42,981 $45,153 $49,802 Source: Smart Asset 2020 Cost of Living Calculator © 2020 Kite Realty Group Fourth Quarter 2019 Investor Presentation | 30

“JPMorgan Weighs “Charles Schwab to “70 financial firms flee Shifting Thousands of move 1,000 jobs out of NYC for Palm Beach Jobs Out of New York San Francisco” County Florida in 3 years” Area” Associated Press Palm Beach BDB Bloomberg “Honeywell HQ is “1,800 companies left “Amazon plans Austin moving to Charlotte, California in a year, with expansion that will add bringing hundreds of most bound for Texas” 800 jobs” jobs” bizjournals CNBC Charlotte Observer “McKesson, nation’s “Mitsubishi Motors “Billionaire investor Carl sixth largest company, is Relocating North Icahn to leave New York moving corporate HQ American HQ from SoCal for Florida” from California to Irving” to Tennessee” Reuters Dallas News CBS © 2020 Kite Realty Group Fourth Quarter 2019 Investor Presentation | 31
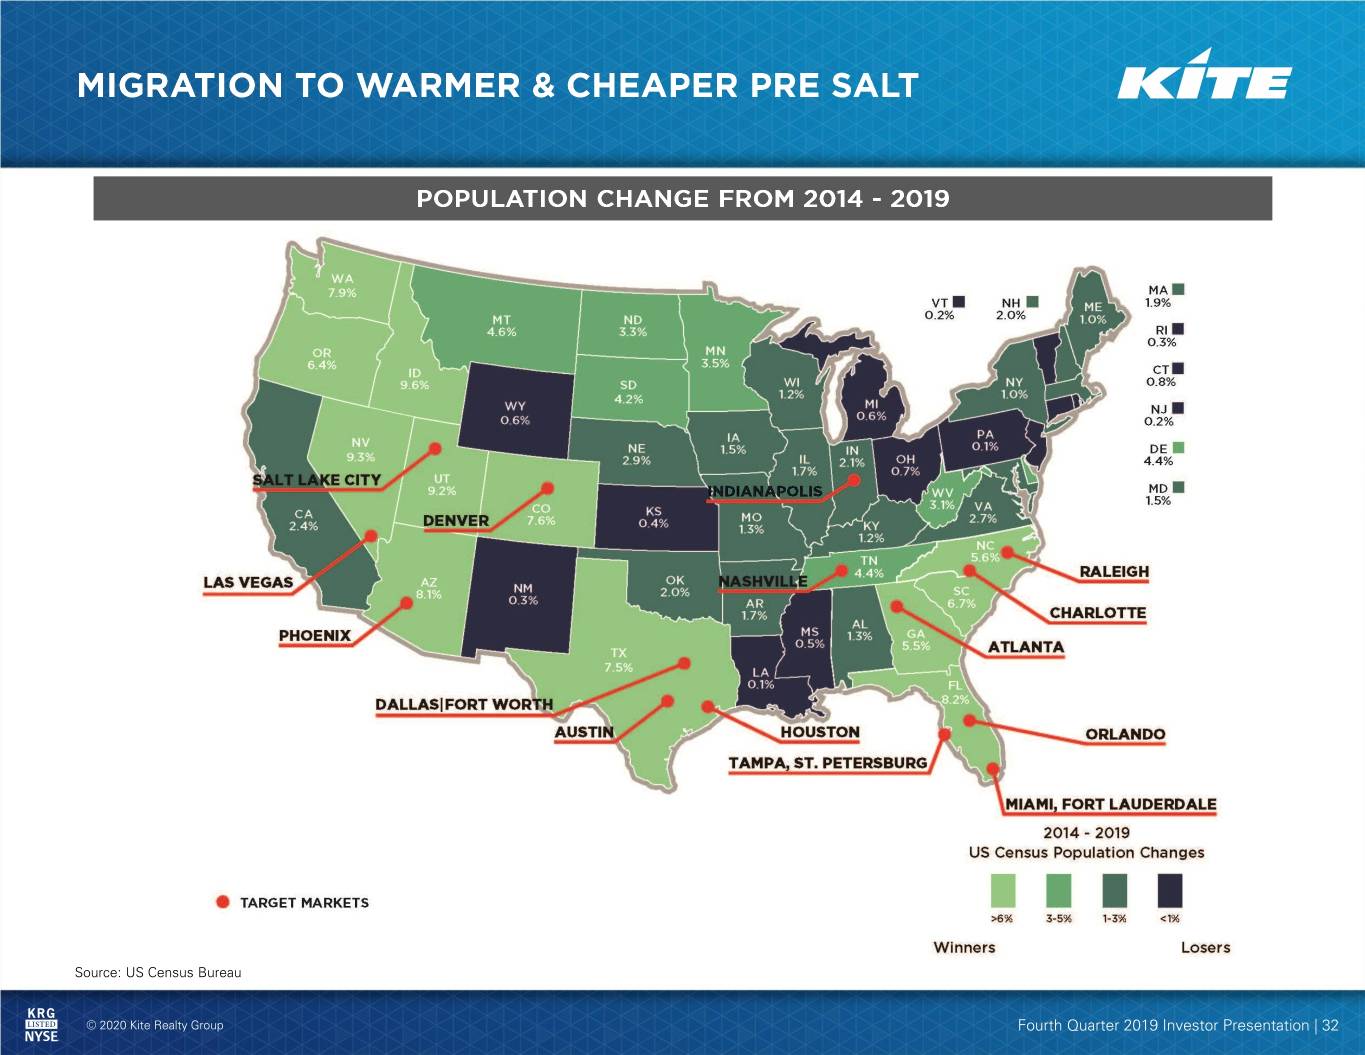
Source: US Census Bureau © 2020 Kite Realty Group Fourth Quarter 2019 Investor Presentation | 32

Source: Synergos Technologies © 2020 Kite Realty Group Fourth Quarter 2019 Investor Presentation | 33
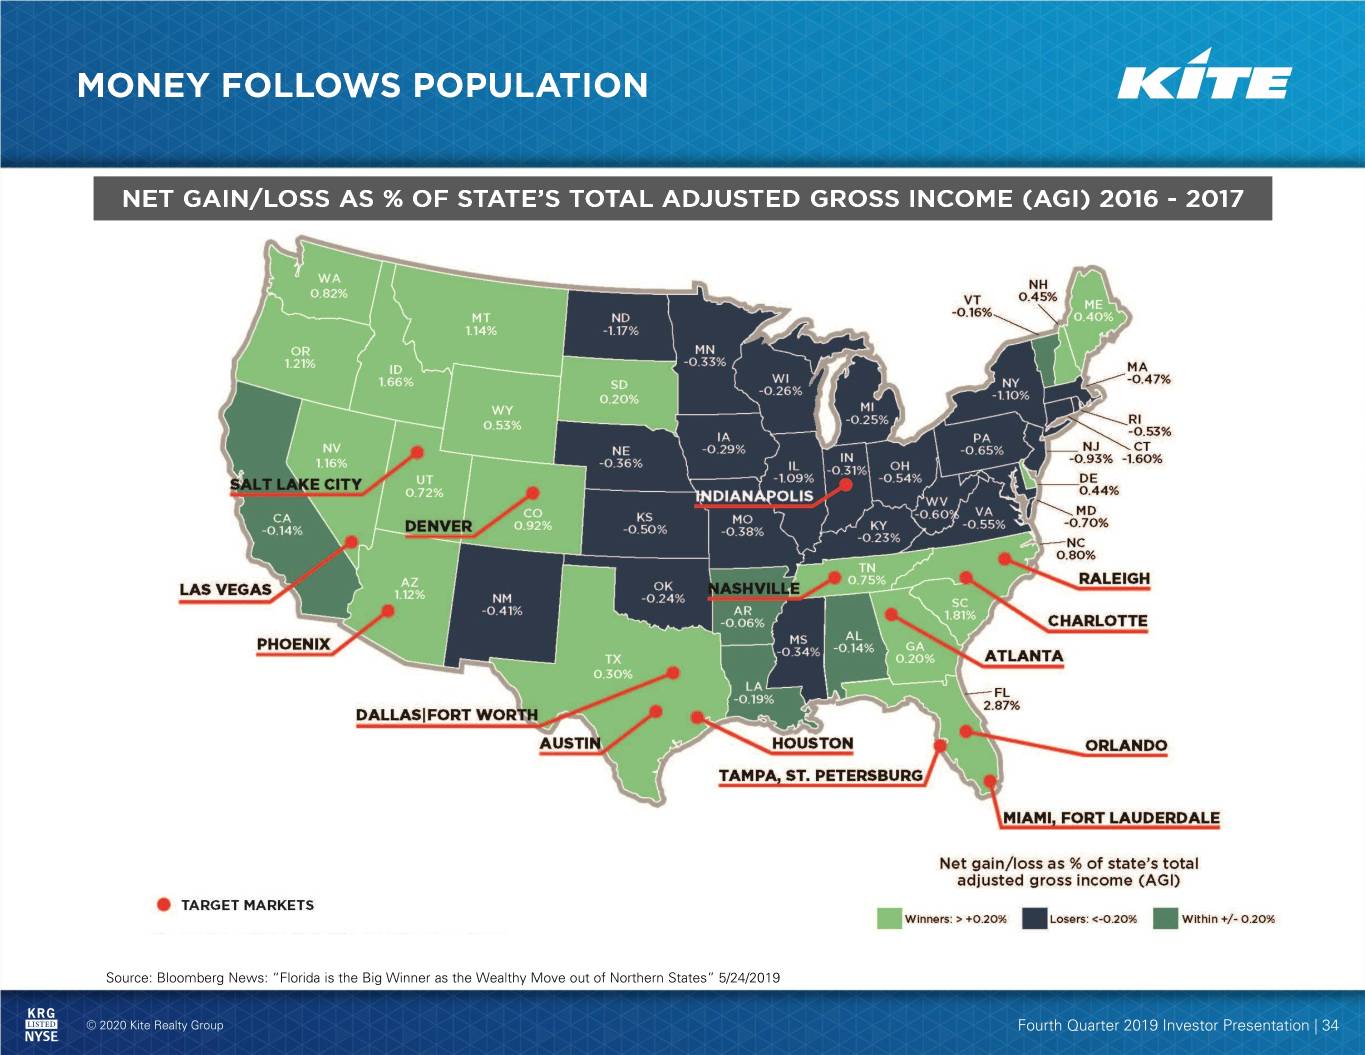
Source: Bloomberg News: “Florida is the Big Winner as the Wealthy Move out of Northern States” 5/24/2019 © 2020 Kite Realty Group Fourth Quarter 2019 Investor Presentation | 34


2020 Guidance Net Income $0.13 - $0.17 NAREIT FFO $1.48 - $1.52 Same-Property NOI Growth (excluding redevelopments) 1.00% - 2.00% Bad Debt Assumption 90bps of Same-Property (in addition to known vacancies and any declared or imminent bankruptcies) Revenues Net Income to NAREIT FFO Reconciliation Low End High End Net Income Guidance $0.13 $0.17 Depreciation 1.35 1.35 NAREIT FFO Guidance $1.48 $1.52 2020 Estimated FFO Per Share Bridge Low End High End 2019 NAREIT FFO $1.53 $1.53 Loss on debt extinguishment 0.13 0.13 2019 FFO (as adjusted) $1.66 $1.66 Impact of 2019 Transactions (0.20) (0.20) Term fee related to office building (0.02) (0.02) 2020 Same-Property NOI 0.02 0.04 2020 Other Items 0.02 0.04 2020 Estimated NAREIT FFO $1.48 $1.52 Estimated adjustments 0.00 0.00 2020 Estimated FFO (as adjusted) $1.48 $1.52 © 2020 Kite Realty Group Fourth Quarter 2019 Investor Presentation | 36
Forward-Looking Statements This supplemental information package, together with other statements and information publicly disseminated by us, contains certain forward-looking statements within the meaning of Section 27A of the Securities Act of 1933 and Section 21E of the Securities Exchange Act of 1934. Such statements are based on assumptions and expectations that may not be realized and are inherently subject to risks, uncertainties and other factors, many of which cannot be predicted with accuracy and some of which might not even be anticipated. Future events and actual results, performance, transactions or achievements, financial or otherwise, may differ materially from the results, performance, transactions or achievements, financial or otherwise, expressed or implied by the forward-looking statements. Risks, uncertainties and other factors that might cause such differences, some of which could be material, include but are not limited to: • national and local economic, business, real estate and other market conditions, particularly in connection with low or negative growth in the U.S. economy as well as economic uncertainty; • financing risks, including the availability of, and costs associated with, sources of liquidity; • our ability to refinance, or extend the maturity dates of, our indebtedness; • the level and volatility of interest rates; • the financial stability of tenants, including their ability to pay rent and the risk of tenant insolvency and bankruptcy; • the competitive environment in which the Company operates; • acquisition, disposition, development and joint venture risks; • property ownership and management risks; • our ability to maintain our status as a real estate investment trust for U.S. federal income tax purposes; • potential environmental and other liabilities; • impairment in the value of real estate property the Company owns; • the actual and perceived impact of e-commerce on the value of shopping center assets; • risks related to the geographical concentration of our properties in Florida, Indiana, Texas, Nevada and North Carolina; • insurance costs and coverage; • risks associated with cybersecurity attacks and the loss of confidential information and other business disruptions; • other factors affecting the real estate industry generally; and • other risks identified in reports the Company files with the Securities and Exchange Commission (“the SEC”) or in other documents that it publicly disseminates, including, in particular, the section titled “Risk Factors” in our Annual Report on Form 10-K for the fiscal year ended December 31, 2019, and in our quarterly reports on Form 10-Q. The Company undertakes no obligation to publicly update or revise these forward-looking statements, whether as a result of new information, future events or otherwise. © 2020 Kite Realty Group Fourth Quarter 2019 Investor Presentation | 37
NET OPERATING INCOME AND SAME PROPERTY NET OPERATING INCOME The Company uses property net operating income (“NOI”), a non-GAAP financial measure, to evaluate the performance of our properties. The Company defines NOI as income from our real estate, including lease termination fees received from tenants, less our property operating expenses. NOI excludes amortization of capitalized tenant improvement costs and leasing commissions and certain corporate level expenses. The Company believes that NOI is helpful to investors as a measure of our operating performance because it excludes various items included in net income that do not relate to or are not indicative of our operating performance, such as depreciation and amortization, interest expense, and impairment, if any. The Company also uses same property NOI ("Same Property NOI"), a non-GAAP financial measure, to evaluate the performance of our retail properties. Same Property NOI excludes properties that have not been owned for the full period presented. It also excludes net gains from outlot sales, straight-line rent revenue, lease termination fees, amortization of lease intangibles and significant prior period expense recoveries and adjustments, if any. The Company believes that Same Property NOI is helpful to investors as a measure of our operating performance because it includes only the NOI of properties that have been owned and fully operational for the full quarters presented. The Company believes such presentation eliminates disparities in net income due to the acquisition or disposition of properties during the particular quarters presented and thus provides a more consistent comparison of our properties. The year-to-date results represent the sum of the individual quarters, as reported. NOI and Same Property NOI should not, however, be considered as alternatives to net income (calculated in accordance with GAAP) as indicators of our financial performance. Our computation of NOI and Same Property NOI may differ from the methodology used by other REITs, and therefore may not be comparable to such other REITs. When evaluating the properties that are included in the same property pool, the Company has established specific criteria for determining the inclusion of properties acquired or those recently under development. An acquired property is included in the same property pool when there is a full quarter of operations in both years subsequent to the acquisition date. Development and redevelopment properties are included in the same property pool four full quarters after the properties have been transferred to the operating portfolio. A redevelopment property is first excluded from the same property pool when the execution of a redevelopment plan is likely and the Company begins recapturing space from tenants. For the quarter ended December 31, 2019, the Company excluded four redevelopment properties and two recently completed redevelopments from the same property pool that met these criteria and were owned in both comparable periods. © 2020 Kite Realty Group Fourth Quarter 2019 Investor Presentation | 38
EBITDA The Company defines EBITDA, a non-GAAP financial measure, as net income before depreciation and amortization, interest expense and income tax expense of taxable REIT subsidiary. For informational purposes, the Company has also provided Adjusted EBITDA, which the Company defines as EBITDA less (i) EBITDA from unconsolidated entities, (ii) gains on sales of operating properties or impairment charges, (iii) other income and expense, (iv) noncontrolling interest EBITDA and (v) other non-recurring activity or items impacting comparability from period to period. Annualized Adjusted EBITDA is Adjusted EBITDA for the most recent quarter multiplied by four. Net Debt to Adjusted EBITDA is the Company's share of net debt divided by Annualized Adjusted EBITDA. EBITDA, Adjusted EBITDA, Annualized Adjusted EBITDA and Net Debt to Adjusted EBITDA, as calculated by us, are not comparable to EBITDA and EBITDA-related measures reported by other REITs that do not define EBITDA and EBITDA-related measures exactly as we do. EBITDA, Adjusted EBITDA and Annualized Adjusted EBITDA do not represent cash generated from operating activities in accordance with GAAP, and should not be considered alternatives to net income as an indicator of performance or as alternatives to cash flows from operating activities as an indicator of liquidity. Considering the nature of our business as a real estate owner and operator, the Company believes that EBITDA, Adjusted EBITDA and the ratio of Net Debt to Adjusted EBITDA are helpful to investors in measuring our operational performance because they exclude various items included in net income that do not relate to or are not indicative of our operating performance, such as gains or losses from sales of depreciated property and depreciation and amortization, which can make periodic and peer analyses of operating performance more difficult. For informational purposes, the Company has also provided Annualized Adjusted EBITDA, adjusted as described above. The Company believes this supplemental information provides a meaningful measure of our operating performance. The Company believes presenting EBITDA and the related measures in this manner allows investors and other interested parties to form a more meaningful assessment of our operating results. FUNDS FROM OPERATIONS Funds from Operations (FFO) is a widely used performance measure for real estate companies and is provided here as a supplemental measure of operating performance. The Company calculates FFO, a non-GAAP financial measure, in accordance with the best practices described in the April 2002 National Policy Bulletin of the National Association of Real Estate Investment Trusts ("NAREIT"), as restated in 2018. The NAREIT white paper defines FFO as net income (calculated in accordance with GAAP), excluding depreciation and amortization related to real estate, gains and losses from the sale of certain real estate assets, gains and losses from change in control, and impairment write-downs of certain real estate assets and investments in entities when the impairment is directly attributable to decreases in the value of depreciable real estate held by the entity. Considering the nature of our business as a real estate owner and operator, the Company believes that FFO is helpful to investors in measuring our operational performance because it excludes various items included in net income that do not relate to or are not indicative of our operating performance, such as gains or losses from sales of depreciated property and depreciation and amortization, which can make periodic and peer analyses of operating performance more difficult. FFO (a) should not be considered as an alternative to net income (calculated in accordance with GAAP) for the purpose of measuring our financial performance, (b) is not an alternative to cash flow from operating activities (calculated in accordance with GAAP) as a measure of our liquidity, and (c) is not indicative of funds available to satisfy our cash needs, including our ability to make distributions. Our computation of FFO may not be comparable to FFO reported by other REITs that do not define the term in accordance with the current NAREIT definition or that interpret the current NAREIT definition differently than we do. For informational purposes, we have also provided FFO adjusted for loss on debt extinguishment. A reconciliation of net income (calculated in accordance with GAAP) to FFO is included elsewhere in this Financial Supplement. From time to time, the Company may report or provide guidance with respect to “NAREIT FFO as adjusted” which removes the impact of certain non-recurring and non- operating transactions or other items the Company does not consider to be representative of its core operating results including without limitation, gains or losses associated with the early extinguishment of debt, gains or losses associated with litigation involving the Company that is not in the normal course of business, the impact on earnings from executive separation, and the excess of redemption value over carrying value of preferred stock redemption, which are not otherwise adjusted in the Company’s calculation of FFO. © 2020 Kite Realty Group Fourth Quarter 2019 Investor Presentation | 39
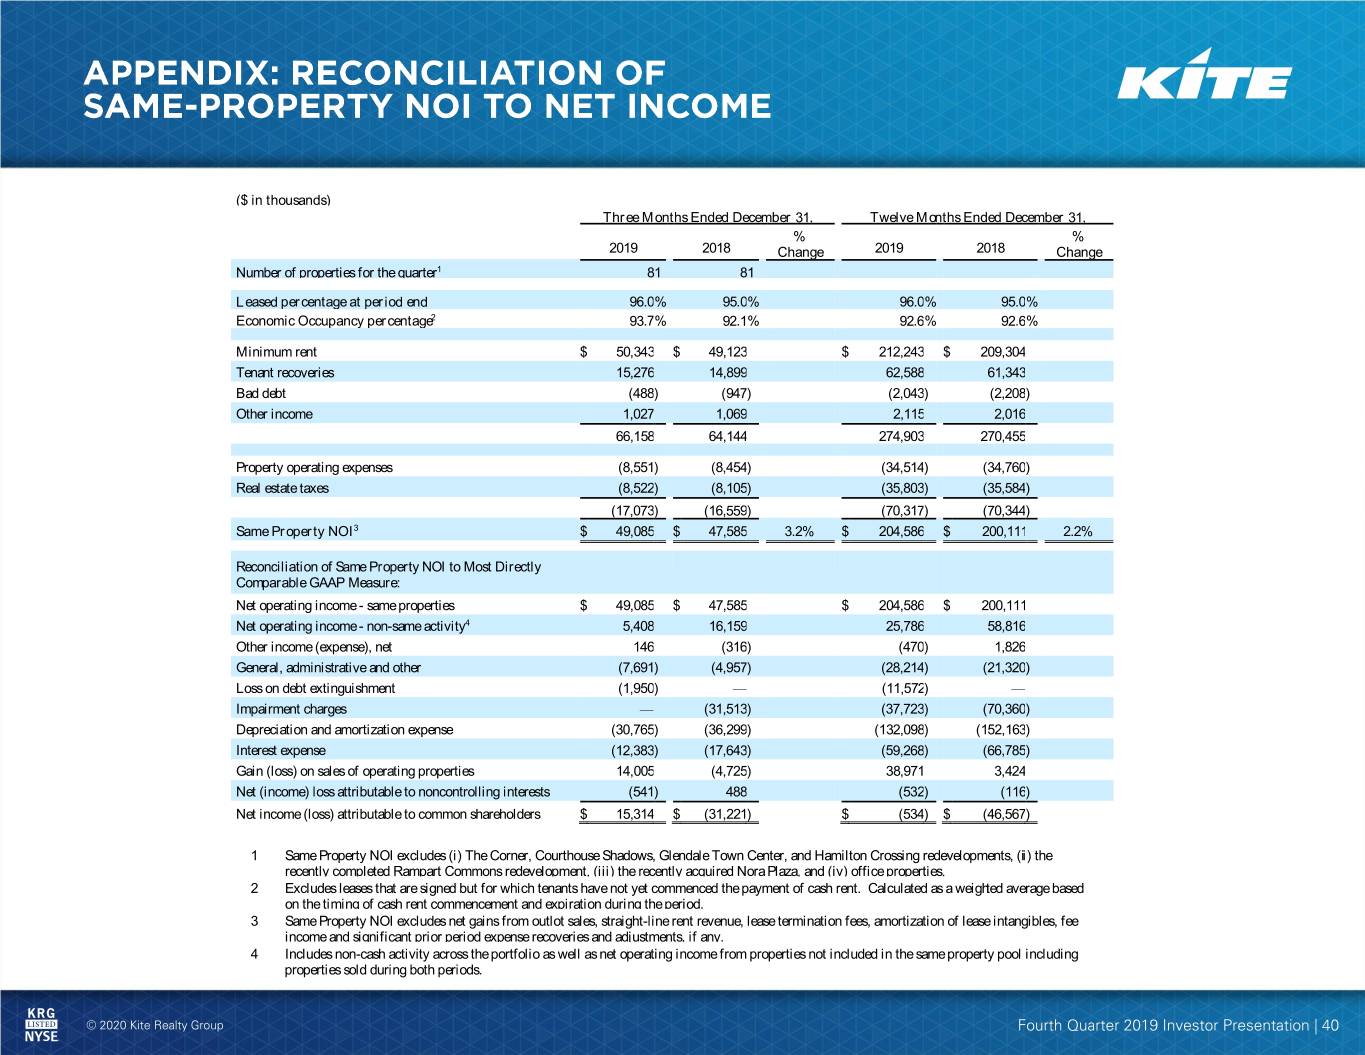
($ in thousands) Three Months Ended December 31, Twelve Months Ended December 31, % % 2019 2018 Change 2019 2018 Change Number of properties for the quarter1 81 81 Leased percentage at period end 96.0 % 95.0 % 96.0 % 95.0 % Economic Occupancy percentage2 93.7 % 92.1 % 92.6 % 92.6 % Minimum rent $ 50,343 $ 49,123 $ 212,243 $ 209,304 Tenant recoveries 15,276 14,899 62,588 61,343 Bad debt (488 ) (947 ) (2,043 ) (2,208 ) Other income 1,027 1,069 2,115 2,016 66,158 64,144 274,903 270,455 Property operating expenses (8,551 ) (8,454 ) (34,514 ) (34,760 ) Real estate taxes (8,522 ) (8,105 ) (35,803 ) (35,584 ) (17,073 ) (16,559 ) (70,317 ) (70,344 ) Same Property NOI3 $ 49,085 $ 47,585 3.2% $ 204,586 $ 200,111 2.2% Reconciliation of Same Property NOI to Most Directly Comparable GAAP Measure: Net operating income - same properties $ 49,085 $ 47,585 $ 204,586 $ 200,111 Net operating income - non-same activity4 5,408 16,159 25,786 58,816 Other income (expense), net 146 (316 ) (470 ) 1,826 General, administrative and other (7,691 ) (4,957 ) (28,214 ) (21,320 ) Loss on debt extinguishment (1,950 ) — (11,572 ) — Impairment charges — (31,513 ) (37,723 ) (70,360 ) Depreciation and amortization expense (30,765 ) (36,299 ) (132,098 ) (152,163 ) Interest expense (12,383 ) (17,643 ) (59,268 ) (66,785 ) Gain (loss) on sales of operating properties 14,005 (4,725 ) 38,971 3,424 Net (income) loss attributable to noncontrolling interests (541 ) 488 (532 ) (116 ) Net income (loss) attributable to common shareholders $ 15,314 $ (31,221 ) $ (534 ) $ (46,567 ) 1 Same Property NOI excludes (i) The Corner, Courthouse Shadows, Glendale Town Center, and Hamilton Crossing redevelopments, (ii) the recently completed Rampart Commons redevelopment, (iii) the recently acquired Nora Plaza, and (iv) office properties. 2 Excludes leases that are signed but for which tenants have not yet commenced the payment of cash rent. Calculated as a weighted average based on the timing of cash rent commencement and expiration during the period. 3 Same Property NOI excludes net gains from outlot sales, straight-line rent revenue, lease termination fees, amortization of lease intangibles, fee income and significant prior period expense recoveries and adjustments, if any. 4 Includes non-cash activity across the portfolio as well as net operating income from properties not included in the same property pool including properties sold during both periods. © 2020 Kite Realty Group Fourth Quarter 2019 Investor Presentation | 40

($ in thousands, except per share data) Three Months Ended Twelve Months Ended December 31, December 31, 2019 2018 2019 2018 Funds From Operations Consolidated net income (loss) $ 15,855 $ (31,709 ) $ (2 ) $ (46,451 ) Less: net income attributable to noncontrolling interests in properties (132 ) (172 ) (528 ) (1,151) Less: (Gain) loss on sales of operating properties (14,005 ) 4,725 (38,971 ) (3,424) Add: impairment charges — 31,513 37,723 70,360 Add: depreciation and amortization of consolidated and unconsolidated entities, net of noncontrolling interests 31,065 36,534 133,184 151,856 FFO of the Operating Partnership1 32,783 40,891 131,406 171,190 Less: Limited Partners' interests in FFO (785 ) (982 ) (3,153 ) (4,109) FFO attributable to Kite Realty Group Trust common shareholders1 $ 31,998 $ 39,909 $ 128,253 $ 167,081 FFO, as defined by NAREIT, per share of the Operating Partnership- basic $ 0.38 $ 0.48 $ 1.53 $ 2.00 FFO, as defined by NAREIT, per share of the Operating Partnership- diluted $ 0.38 $ 0.48 $ 1.52 $ 2.00 FFO of the Operating Partnership1 $ 32,783 $ 40,891 $ 131,406 $ 171,190 Add: loss on debt extinguishment 1,950 — 11,572 — FFO, as adjusted, of the Operating Partnership $ 34,733 $ 40,891 $ 142,978 $ 171,190 FFO, as adjusted, per share of the Operating Partnership - basic and diluted $ 0.40 $ 0.48 $ 1.66 $ 2.00 Weighted average common shares outstanding - basic 83,960,045 83,762,664 83,926,296 83,693,385 Weighted average common shares outstanding - diluted 84,478,245 83,822,752 84,214,079 83,744,896 Weighted average common shares and units outstanding - basic 86,070,082 85,808,725 86,027,409 85,740,449 Weighted average common shares and units outstanding - diluted 86,588,282 85,868,813 86,315,191 85,791,961 FFO, as defined by NAREIT, per diluted share/unit Consolidated net income (loss) $ 0.18 $ (0.37 ) $ 0.00 $ (0.54 ) Less: net income attributable to noncontrolling interests in properties — — (0.01 ) (0.01) Less: Loss (gain) on sales of operating properties (0.16 ) 0.05 (0.45 ) (0.04) Add: impairment charges — 0.37 0.44 0.82 Add: depreciation and amortization of consolidated and unconsolidated entities, net of noncontrolling interests 0.36 0.43 1.55 1.77 FFO, as defined by NAREIT, of the Operating Partnership per diluted share/unit1 $ 0.38 $ 0.48 $ 1.52 $ 2.00 Add: loss on debt extinguishment 0.02 — 0.13 — FFO, as adjusted, of the Operating Partnership per diluted share/unit2 $ 0.40 $ 0.48 $ 1.66 $ 2.00 ____________________ 1 “FFO of the Operating Partnership" measures 100% of the operating performance of the Operating Partnership’s real estate properties. “FFO attributable to Kite Realty Group Trust common shareholders” reflects a reduction for the redeemable noncontrolling weighted average diluted interest in the Operating Partnership. 2 Per share/unit amounts of components will not necessarily sum to the total due to rounding to the nearest cent. © 2020 Kite Realty Group Fourth Quarter 2019 Investor Presentation | 41
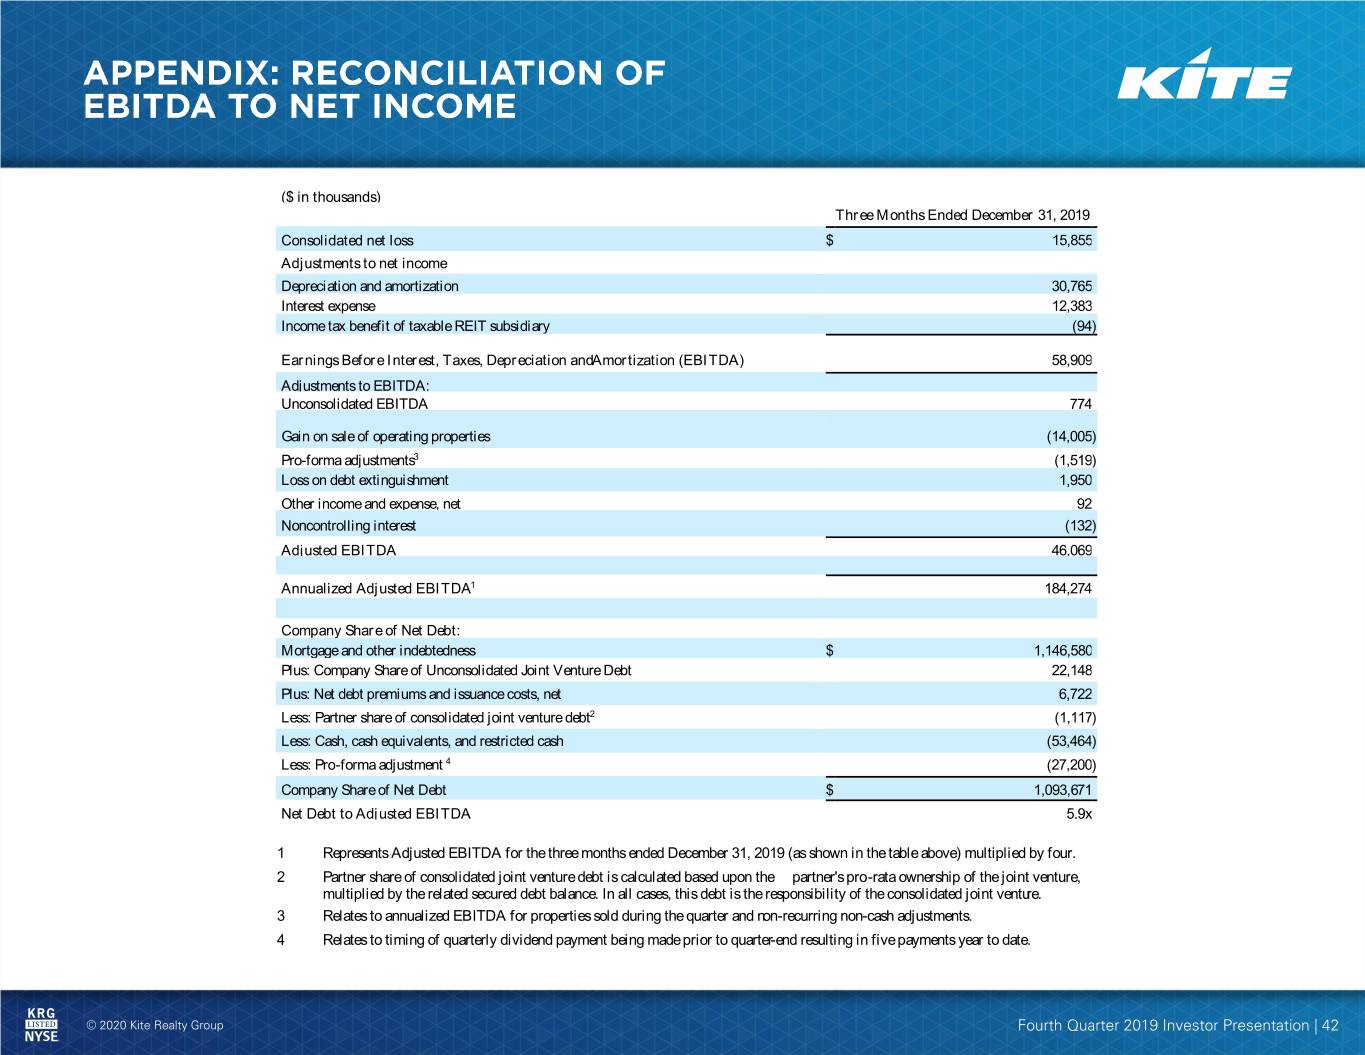
($ in thousands) Three Months Ended December 31, 2019 Consolidated net loss $ 15,855 Adjustments to net income Depreciation and amortization 30,765 Interest expense 12,383 Income tax benefit of taxable REIT subsidiary (94 ) Earnings Before Interest, Taxes, Depreciation andAmortization (EBITDA) 58,909 Adjustments to EBITDA: Unconsolidated EBITDA 774 Gain on sale of operating properties (14,005 ) Pro-forma adjustments3 (1,519 ) Loss on debt extinguishment 1,950 Other income and expense, net 92 Noncontrolling interest (132 ) Adjusted EBITDA 46,069 Annualized Adjusted EBITDA1 184,274 Company Share of Net Debt: Mortgage and other indebtedness $ 1,146,580 Plus: Company Share of Unconsolidated Joint Venture Debt 22,148 Plus: Net debt premiums and issuance costs, net 6,722 Less: Partner share of consolidated joint venture debt2 (1,117 ) Less: Cash, cash equivalents, and restricted cash (53,464 ) Less: Pro-forma adjustment 4 (27,200 ) Company Share of Net Debt $ 1,093,671 Net Debt to Adjusted EBITDA 5.9x 1 Represents Adjusted EBITDA for the three months ended December 31, 2019 (as shown in the table above) multiplied by four. 2 Partner share of consolidated joint venture debt is calculated based upon the partner's pro-rata ownership of the joint venture, multiplied by the related secured debt balance. In all cases, this debt is the responsibility of the consolidated joint venture. 3 Relates to annualized EBITDA for properties sold during the quarter and non-recurring non-cash adjustments. 4 Relates to timing of quarterly dividend payment being made prior to quarter-end resulting in five payments year to date. © 2020 Kite Realty Group Fourth Quarter 2019 Investor Presentation | 42


