UNITED STATES
SECURITIES AND EXCHANGE COMMISSION
Washington, D.C. 20549
FORM N-CSR
CERTIFIED SHAREHOLDER REPORT OF REGISTERED
MANAGEMENT INVESTMENT COMPANIES
Investment Company Act file number 811-21556
Perritt Funds, Inc.
(Exact name of registrant as specified in charter)
300 South Wacker Drive, Suite 2880, Chicago, IL 60606
(Address of principal executive offices) (Zip code)
Michael J. Corbett, 300 South Wacker Drive, Suite 2880, Chicago, IL 60606
(Name and address of agent for service)
1-312-669-1650
Registrant's telephone number, including area code
Date of fiscal year end: October 31, 2011
Date of reporting period: October 31, 2011
Item 1. Reports to Stockholders.
 |
 |
MicroCap
Opportunities
Fund
Emerging
Opportunities
Fund
Annual Reports
October 31, 2011
 |
The PERRITT MICROCAP OPPORTUNITIES FUND will, under normal circumstances, invest at least 80% of its assets in a diversified portfolio of common stocks of United States companies that at the time of initial purchase have a market capitalization (equity market value) that is below $500 million. The Fund seeks to invest in microcap companies that have demonstrated above-average growth in revenues and/or earnings, possess relatively low levels of long-term debt, have a high percentage of their shares owned by company management, and possess modest price-to-sales ratios and price-to-earnings ratios that are below their long-term annual growth rate. At times, the Fund may also invest in “special situations” such as companies that possess valuable patents, companies undergoing restructuring, and companies involved in large share repurchase programs. Investors should expect the Fund to contain a mix of both value and growth stocks.
The PERRITT EMERGING OPPORTUNITIES FUND will, under normal circumstances, invest at least 80% of its assets in a diversified portfolio of common stocks of United States companies that at the time of initial purchase have a market capitalization (equity market value) that is below $300 million (referred to as “microcap” companies). The Fund seeks to invest in micro-cap companies that have a high percentage of their shares owned by company management, possess relatively low levels of long-term debt, have a potential for above average growth in revenues and/or earnings, and possess reasonable valuations based on the ratios of price-to-sales, price-to-earnings, and price-to-book values. The micro-cap companies in which the Fund may invest include “early stage” companies, which are companies that are in a relatively early stage of development with market capitalizations that are below $50 million. At times, the Fund may also invest in unseasoned companies, companies that are undergoing corporate restructuring, initial public offerings, and companies believed to possess undervalued assets.
Table of
Contents
Annual Reports
October 31, 2011
| Perritt Capital Management, Inc. | |
| From the desk of Dr. Gerald W. Perritt, Founder and Vice President | 2 |
| Perritt MicroCap Opportunities Fund | |
| From the Desk of Michael Corbett, President | 4 |
| Performance | 6 |
| Ten Largest Common Stock Holdings | 7 |
| Allocation of Portfolio Investments | 7 |
| Schedule of Investments | 8 |
| Statement of Operations | 10 |
| Financial Highlights | 10 |
| Statements of Changes in Net Assets | 11 |
| Statement of Assets and Liabilities | 11 |
| Notes to Financial Statements | 12 |
| Report of Independent Registered Public Accounting Firm | 15 |
| Expense Example | 16 |
| Perritt Emerging Opportunities Fund | |
| From the Desk of Michael Corbett, President | 17 |
| Performance | 19 |
| Ten Largest Common Stock Holdings | 20 |
| Allocation of Portfolio Investments | 20 |
| Schedule of Investments | 21 |
| Statement of Operations | 24 |
| Financial Highlights | 24 |
| Statements of Changes in Net Assets | 25 |
| Statement of Assets and Liabilities | 25 |
| Notes to Financial Statements | 26 |
| Report of Independent Registered Public Accounting Firm | 29 |
| Expense Example | 30 |
| Perritt Funds | |
| Directors and Officers | 31 |
| Information | 32 |
1
From the Desk of Doctor Gerald W. Perritt
 |
Dr. Gerald W. Perritt
Founder and Vice President
Perritt Capital Management
Are You Better Off Today?
The twenty-first century began with so much promise. The economy was booming, start-up technology companies were raising money by the bucketful, and the Dow Jones Industrial Average closed out the twentieth century at 11,497 on December 31, 1999, a whopping 11,429 points higher than when that century began on January 1, 1900.
A few months into the new millennium, however, the technology bubble burst and after topping out at 11,722 on January 14, 2000, the Dow began heading downward and the U.S. economy was bordering on recession. The September 11, 2001 terrorist attacks on U.S. soil tipped a fragile economy into its first recession in ten years. The United States would spend the next 10 years at war in Afghanistan and Iraq. During that span 6,200 Americans would lose their lives and another 42,000 would suffer war wounds. In addition, the U.S. would spend $800 billion on the war in Iraq, $460 billion in Afghanistan, and nearly $640 billion on homeland security.
In August 2005, hurricane Katrina struck the Louisiana and Mississippi coasts. It would be the costliest natural disaster in U.S. history. The hurricane would leave 80% of New Orleans and surrounding parishes underwater and 90% of the beachfront towns along the Mississippi coast flooded as the storm surge pushed the Gulf of Mexico more than six miles inland. The storm would ultimately cause 1,836 deaths.
Beginning in 2007, a sub-prime mortgage crisis led to the collapse of the U.S. housing bubble. The collapse contributed to a global financial crisis, which in turn led to the collapse of such large financial institutions as Bear Sterns, Fannie Mae, Freddie Mac, Lehman Brothers, and AIG. It also precipitated a crisis in the auto industry. Credit markets froze and the U.S. economy was most likely headed for a repeat of the Great Depression of the 1930s. The government responded with an unprecedented $700 billion bank bailout and a $787 billion fiscal stimulus package and an economic depression was averted.
| ... people of the world are living better than they were 111 years ago and the Dow Jones Industrial Average has climbed from 68.13 to more than 12,000 today. |
Today, the world economies and financial markets are in disarray. The fear of a recession in Europe has cast a pall on the U.S. stock market. Deep cuts in sovereign spending in Europe coupled with increased taxes could send Europe into a deep recession, which would weaken economic growth in the U.S.
Although the U.S. economy is not in recession at the present time, it has been growing at an anemic rate. The unemployment rate stubbornly refuses to retreat below 9%. House prices across the country are 30% to 40% below where they were in 2007. One of three households with a mortgage owe more than their house is worth. More than 46 million Americans are living below the poverty level, the most in the 52 years that the census bureau has reported such data. The U.S. government is $14 trillion in debt, and unless Congress can break a gridlock, the deficit is headed significantly higher in the years ahead. Finally, two stock market meltdowns during the last 10 years have spooked equity investors who continue to pull money out of stock markets around the world.
The ANSWER to the question “Are you better off today?” depends on your point of reference. A new study titled “The State of the World 2011” published by an international think tank known as the Millennium Project concluded that “The world is getting richer, healthier, better educated, living longer and is more peaceful and better connected; yet half the world is potentially unstable.” Here are some of the study’s figures on what has happened in just the last 25 years.
• Infant mortality worldwide has fallen from nearly 70 deaths per 100,000 people to 40 deaths per 100,000 people today.
• Poverty, defined by the percentage of people living on less than $1.25 a day, fell from 43% of the world population in the mid-1980s to 23% today.
• Secondary school enrollment rose from 45% in the mid 1980s to nearly 70% today.
• The number of major armed conflicts declined from 37 in the mid-1980s to 26 today.
For sure, we are experiencing and will experience periodic setbacks. However, the world’s positive trends may improve even faster thanks to new technological advances. “The coming biological revolution may change civilization more profoundly than did the industrial or information revolutions,” the report says.
It seems that I get drawn into frequent gloom-and-doom “end of the world” discussions these days. My response to the doomsayers is usually the question: if you could choose between having lived 100 years ago or today, what would you choose?
If you answered this question by saying that you would choose the simpler life of a century ago, consider this brief list of the inventions of the twentieth century that you would have to do without.
2
Inventions of the 20th Century
| 1900-1909 | Escalators, Safety Razors, Radio Transmissions, Vacuum Cleaners, Neon Lights, Crayons, Airplanes, Teabags, Tractors, Cornflakes, Synthetic Plastic, Cellophane, Instant Coffee | 1910-1919 | Motion Pictures, Life Savers Candy, Crossword Puzzles, Braziers, Zippers, Stainless Steel, Pop-Up Toasters, Short Wave Radios |
| 1920-1929 | Band Aids, Insulin, 3-D Movies, Traffic Signals, Televisions, Frozen Foods, Spiral Notebooks, Liquid-Fueled Rockets, PEZ Candy, Aerosol Cans, Penicillin, Bubble Gum, Electric Shavers, Car Radios, Yo-Yos | 1930-1939 | Scotch Tape, Analog Computers, Jet Engines, Parking Meters, Radio Telescopes, FM Radios, Drive-In Movie Theaters, Monopoly, Tape Recorders, Nylon, Canned Beer, Radar, Photo Copiers, Teflon, Helicopters |
| 1940-1949 | Color TV, Jeeps, Synthetic Rubber, Aqua Lungs (SCUBA), Kidney Dialysis, Microwave Ovens, Transistors, Tupperware, Frisbees, Velcro | 1950-1959 | Credit Cards, Superglue, Power Steering, Bar Codes, Diet Soft Drinks, Radial Tires, Transistor Radios, Modems, Lasers, Hula Hoops, Integrated Circuits, Pacemakers, Barbie Dolls, Microchips |
| 1960-1969 | Valium, Nondairy Creamer, Audio Cassettes, Fiber-Tip Pens, Silicone Breast Implants, Video Disks, Acrylic Paint, Permanent Press Fabrics, Astroturf, Soft Contact Lenses, Compact Disks, Hand Held Calculators, Computer Mice, RAM, Internet, Artificial Hearts, ATMs, Bar Code Scanners | 1970-1979 | Dot Matrix Printers, Food Processors, Liquid-Crystal Displays, Microprocessors, Video Games, Gene Splicing, Ethernets, Disposable Lighters, Post-It Notes, Laser Printers, Push Tab Cans, Cell Phones, Supercomputers |
| 1980-1989 | MS DOS, IBM-PCs, CD ROM, Apple Macintosh, Windows Programs, Super Conductors, Synthetic Skin, Disposable Cameras, 3-D Video Games, Disposable Contact Lenses, Digital Cell Phones, Doppler Radar, Prozac, High Definition TVs | 1990-1999 | World Wide Web, Digital Answering Machines, Pentium Processors, Java Computer Language, Web TV, Viagra |
Where are humanity and the world’s stock markets headed? I think, despite recent setbacks, the world will be a better place in which to live and the world’s stock markets will be trading at significantly higher prices. Remember, since the onset of the 20th century, the world has experienced two world wars, the Korean War, the Vietnam War, the Cold War and the threat of thermonuclear meltdown, a world-wide depression, a presidential assassination and a presidential resignation, deflation in the 1930s and the hyperinflation of the 1970s, four stock market meltdowns, and several catastrophic natural disasters. Even so, people of the world are living better than they were 111 years ago and the Dow Jones Industrial Average has climbed from 68.13 on January 1, 1900 to nearly 12,000 on October 31, 2011.
 |
Gerald W. Perritt
Perritt Capital Management, Inc.
3
President’s Message
 |
Michael Corbett
President
Perritt MicroCap
Opportunities Fund
Fiscal 2011 was a challenging year. Although the Perritt MicroCap Opportunities Fund’s perfor-mance this past year lagged the Russell 2000, we are pleased with the Fund’s long-term performance. The Fund’s long-term performance record can be reviewed on page six.
The Perritt MicroCap Opportunities Fund, like the entire microcap market, had a lackluster year for several reasons. First, a crisis of confidence with leadership around the world has put a great deal of stress on the financial markets. Most investors are well aware of our politicians’ unwillingness to rise above the partisan differences for the good of our country. We believe similar problems remain within Europe, as sovereign debt problems continue to plague Greece and Italy and possibly other countries within Europe. Despite all of these uncertainties, I am confident that difficult decisions will eventually be made and overall confidence in the financial markets will improve.
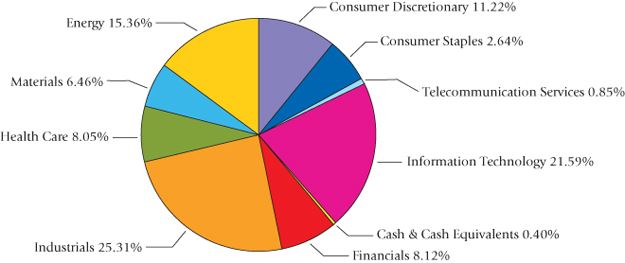
The second reason for the lackluster performance was related to our sector allocation mix. As can be seen on page seven, our largest sector allocation weights are energy, information technology and industrials, which are all cyclical businesses. Our discussions with management teams and analysis of those companies lead us to believe that the earnings power is substantial among these cyclical businesses. Defensive businesses, such as healthcare and consumer staples, appear reasonably valued but don’t offer the potential for substantial rewards we are seeking within the microcap universe. As a result, we believe the ultimate upside potential is greater with cyclical companies within the microcap universe. Since the economy has continued to grow at a below average rate, our cyclical investments have suffered. Our view is that we are early in these cyclical investments, and we believe we should be rewarded substantially within the next few years.
During the past year, we liquidated investments in 31 companies. Five companies were sold due to buyout offers: AC Moore Art & Crafts (ACMR), America Service Group (ASGR), Continucare (CNO), Fronteer Gold (FRG) and NovaMed (NOVA). Five companies were sold because either price targets were reached or current valuations became excessive and 19 companies were sold after management reported disappointing results. The final two companies, Middleby Corporation (MIDD) and Questcor Pharmaceuticals (QCOR), were sold because the market capitalization expanded beyond our market-cap threshold.
Despite being one our favorite companies, Middleby was sold because its market capitalization reached more than $1.6 billion. We have a strict discipline to invest only in micro-cap companies, which we define as companies with market capitalizations less than $500 million. We first purchased Middleby in 2003, when its market capitalization was approximately $150 million. The company’s management team and their highly energy efficient cooking products impressed us at that time. In fact, we still have a great deal of confidence in the company and its management team, but the company is no longer considered to be a microcap company under our strict definition.
As of October 31, 2011, the Fund’s portfolio contained the common stocks of 118 companies, 20 of which were added during the past year. The Fund’s ten largest holdings and detailed descriptions can be found on page seven of this report. Based on our earnings estimate, the Fund’s portfolio is trading at approximately 18 times 2011 earnings and slightly less than 13 times our 2012 earnings estimate. Stocks in the portfolio are priced at 0.6x average revenue and the median market capitalization is approximately $163 million. Finally, the average stock in the Fund is trading at slightly less than 1.3x tangible book value.
I am pleased to report that the Fund’s expense ratio went from 1.27 percent in fiscal 2010 down to 1.22 percent in fiscal year 2011. This expense ratio of 1.22 percent represents the lowest expense ratio reported
4
for the Perritt MicroCap Opportunities Fund since inception. The reduction is attributable to the lower fees we negotiated with the Fund’s vendors as well as an increase in average net assets over fiscal year ended October 31, 2011. As always, the Fund’s directors and the management team at Perritt Capital Management are committed to keeping the Fund’s expense ratio at a reasonable level.
As always, I want to thank my fellow shareholders for their continued support and confidence in the Perritt Capital Management team. I maintain an unshakeable belief in long-term investing and the value of active management within the micro-cap segment of the market. I look forward to continuing the tradition of investing in smaller companies in order to help our shareholders meet their financial goals. If you have any questions or comments about this report or your investment in the Perritt MicroCap Opportunities Fund, please call us toll-free at (800)331-8936 or visit our web site at www.perrittmutualfunds.com. Please refer to the prospectus for information about the Fund’s investment objectives and strategies.
 |
Michael Corbett
President
Past performance is not a guarantee of future results.
Mutual fund investing involves risk. Principal loss is possible. The Funds invest in smaller companies, which involve additional risks such as limited liquidity and greater volatility. The Funds invest in microcap companies which tend to perform poorly during times of economic stress. The Emerging Opportunities Fund may invest in early stage companies which tend to be more volatile and somewhat more speculative than investments in more established companies.
The information provided herein represents the opinion of Perritt Capital Management and is not intended to be a forecast of future events, a guarantee of future results, nor investment advice.
Diversification does not guarantee a profit nor protect against risks in a declining market.
The Dow Jones Industrial Average is an unmanaged index of common stocks comprised of major industrial companies and assumes reinvestment of dividends.
The Russell 2000 Index measures the performance of the small-cap segment of the U.S. equity market. One cannot invest directly in an index.
Price-to-Earnings: Current share price divided by trailing twelve-month earnings. Book value is the value at which an asset is carried on a balance sheet.
The Perritt Funds are distributed by Quasar Distributors, LLC.
| Michael Corbett |
| joined the firm in |
| 1990 as a research |
| analyst. |
| He was appointed |
| co-manager of the |
| MicroCap |
| Opportunities Fund |
| in 1996 and President |
| of the Fund in 1999. |
| A graduate of |
| DePaul University, |
| Mr. Corbett has been |
| President of the |
| Emerging |
| Opportunities Fund |
| since its inception. He |
| is responsible for the |
| daily operations of |
| both funds and |
| assumed the lead |
| portfolio management |
| duties of both the |
| MicroCap and |
| Emerging |
| Opportunities Funds |
| in October 2010. |
Perritt MicroCap Opportunities Fund
5
Performance* (Unaudited) | October 31, 2011 |
Perritt MicroCap
Opportunities Fund
versus
Russell 2000® Index
and Russell
MicroCap® Index
 |
 | Perritt MicroCap Opportunities Fund Russell 2000® Index Russell MicroCap® Index |
There are several ways to evaluate a fund’s historical performance. You can look at the total percentage change in value, the average annual percentage change, or the growth of a hypothetical $10,000 investment. Each performance figure includes changes in a fund’s share price, plus reinvestment of any dividends (or income) and capital gains (the profits the fund earns when it sells stocks that have grown in value).
Cumulative total returns reflect the Fund’s actual performance over a set period. For example, if you invested $1,000 in a fund that had a 5% return over one year, you would end up with $1,050. You can compare the Fund’s returns to the Russell 2000® Index, which reflects a popular measure of the stock performance of small companies, and the Russell Microcap® Index, which measures the performance of the microcap segment of the U.S. equity market. The Russell Microcap® Index had an inception date of June 30, 2000.
Average annual total returns take the Fund’s actual (or cumulative) return and show you what would have happened if the Fund had performed at a constant rate each year.
| Cumulative Total Returns** | ||||||||||||||||||||||||
| Periods ended October 31, 2011 | ||||||||||||||||||||||||
| Past 1 Year | Past 3 Years | Past 5 Years | Past 10 Years | Past 15 Years | Past 20 Years | |||||||||||||||||||
| Perritt MicroCap Opportunities Fund | (4.45)% | 47.17% | (6.14)% | 148.84% | 258.13% | 505.09% | ||||||||||||||||||
| Russell 2000® Index | 6.71% | 43.79% | 3.45% | 97.05% | 164.51% | 427.36% | ||||||||||||||||||
| (reflects no deduction for fees and expenses) | ||||||||||||||||||||||||
| Russell Microcap® Index | 2.11% | 34.17% | (14.45)% | 79.61% | N/A | N/A | ||||||||||||||||||
| (reflects no deduction for fees and expenses) | ||||||||||||||||||||||||
| Average Annual Total Returns** | ||||||||||||||||||||||||
| Periods ended October 31, 2011 | ||||||||||||||||||||||||
| Past 1 Year | Past 3 Years | Past 5 Years | Past 10 Years | Past 15 Years | Past 20 Years | |||||||||||||||||||
| Perritt MicroCap Opportunities Fund | (4.45)% | 13.75% | (1.26)% | 9.54% | 8.87% | 9.41% | ||||||||||||||||||
| Russell 2000® Index | 6.71% | 12.87% | 0.68% | 7.02% | 6.70% | 8.67% | ||||||||||||||||||
| (reflects no deduction for fees and expenses) | ||||||||||||||||||||||||
| Russell Microcap® Index | 2.11% | 10.29% | (3.07)% | 6.03% | N/A | N/A | ||||||||||||||||||
| (reflects no deduction for fees and expenses) | ||||||||||||||||||||||||
Performance data quoted represents past performance; past performance does not guarantee future results. The investment return and principal value of an investment will fluctuate so that an investor’s shares, when redeemed, may be worth more or less than their original cost. Current performance of the Fund may be lower or higher than the performance quoted. Performance data current to the most recent month end may be obtained by calling 800-331-8936.
| * | The graph illustrates the performance of a hypothetical $10,000 investment made in the Fund 10 years ago. Assumes reinvestment of dividends and capital gains, but does not reflect the effect of any applicable sales charge or redemption fees. The graph does not imply any future performance. | |
| ** | The graph and tables do not reflect the deduction of taxes that a shareholder would pay on the Fund’s distributions or the redemption of Fund shares. |
6
Ten Largest Common Stock Holdings (Unaudited) |
Newpark Resources Inc. (NR) provides fluids management, environmental, and oilfield services to the oil and gas exploration and production industry. The company provides drilling fluids sales and engineering services, as well as onsite drilling fluids processing services. It also provides prefabricated interlocking mat systems for constructing drilling and work sites, onsite and offsite environmental services, including site assessment, pit design, construction, and drilling waste management, regulatory compliance services, and temporary work site services to the pipeline, electrical utility, and highway construction industries.
GP Strategies Corp. (GPX) provides customized training solutions focused on performance improvement initiatives, as well as consulting, engineering, and technical services in the United States and internationally.
ClickSoftware Technologies Ltd. (CKSW) provides workforce and service management software products and solutions. It serves organizations in the utilities and energy, telecommunications, retail, insurance, high-technology, computer and office equipment, industrial equipment, medical equipment, building automation, public security, and home services sectors.
BioScrip, Inc. (BIOS) is a specialty pharmaceutical healthcare organization. It operates through two segments: Specialty Pharmaceutical Services and Pharmacy Benefit Management Services. As of March 31, 2011 it owned and operated 111 specialty pharmacies comprising community, mail order, and infusion pharmacies.
Mitcham Industries, Inc. (MIND) through its subsidiaries, engages in the lease, sale, and service of seismic equipment to the oil and gas industry worldwide. It also sells new and used seismic equipment, as well as is involved in the design, manufacture, and sale of marine seismic equipment.
Intersections, Inc. (INTX) provides subscription-based consumer protection services and other consumer products and services primarily in the United States. The company operates in three segments: Consumer Products and Services, Online Brand Protection, and Bail Bonds Industry Solutions.
Vaalco Energy, Inc. (EGY) together with its subsidiaries, engages in the acquisition, exploration, development, and production of crude oil and natural gas. The company owns producing properties and conducts exploration activities as an operator of consortiums internationally in Gabon and Angola; and as a non-operator in the British North Sea.
Virtusa Corp. (VRTU) provides information technology (IT) services to clients across North America, Europe, the Middle East, and Asia including IT consulting, technology implementation, and application outsourcing for the communications and technology, banking, financial services, insurance, media, and information industries.
American Software, Inc. (AMSWA) develops, markets, and supports a portfolio of software and services that deliver enterprise management and collaborative supply chain solutions worldwide. The company serves retail, apparel, consumer-packaged goods, chemical, pharmaceutical, industrial product, and other manufacturing industries.
Midas Inc. (MDS) provides retail automotive services through franchised or company-operated shops. The company’s retail shops offer automotive repair and maintenance services, such as exhaust, brake, suspension, air conditioning, tires, batteries, and various other maintenance services. As of January 1, 2011, it operated the Midas network of 1,538 shops located in the United States and 9 Canadian provinces; the SpeeDee network of franchised and company-operated shops consisting of 106 shops located in 10 states in the United States; and 781 Midas shops licensed in 13 other countries, and 65 licensed SpeeDee shops in Mexico.
Fund holdings and/or sector allocations are subject to change at any time and are not recommendations to buy or sell any security.
Please refer to the Schedule of Investments in this report for a complete list of Fund holdings.
Allocation of Portfolio Investments (Unaudited) | October 31, 2011 |
 | |
Perritt MicroCap Opportunities Fund
7
| Schedule of Investments | October 31, 2011 |
| Shares | COMMON STOCKS – 96.72% | Value | |||||
| Aerospace & Defense – 1.41% | |||||||
| 256,300 | CPI Aerostructures, Inc. (a) | $ | 2,780,855 | ||||
| 140,000 | Ducommun, Inc. | 1,997,800 | |||||
| 4,778,655 | |||||||
| Auto Parts & Equipment – 1.69% | |||||||
| 470,132 | Midas, Inc. (a) | 4,287,604 | |||||
| 427,281 | SORL Auto Parts, Inc. (a) | 1,414,300 | |||||
| 5,701,904 | |||||||
| Building Materials – 0.75% | |||||||
| 245,500 | Insteel Industries, Inc. | 2,531,105 | |||||
| Business Services – 8.72% | |||||||
| 260,700 | Barrett Business Services, Inc. | 4,137,309 | |||||
| 485,000 | GP Strategies Corp. (a) | 5,732,700 | |||||
| 864,026 | Innodata Isogen, Inc. (a) | 3,024,091 | |||||
| 600,000 | PRGX Global, Inc. (a) | 3,204,000 | |||||
| 488,500 | RCM Technologies, Inc. (a) | 2,349,685 | |||||
| 171,000 | Rentrak Corporation (a) | 2,335,860 | |||||
| 230,000 | The Dolan Media Co. (a) | 2,012,500 | |||||
| 632,100 | Tier Technologies, Inc. (a) | 2,224,992 | |||||
| 272,521 | Virtusa Corp. (a) | 4,439,367 | |||||
| 29,460,504 | |||||||
| Chemical & Related Products – 3.23% | |||||||
| 600,000 | Aceto Corporation | 3,804,000 | |||||
| 225,000 | KMG Chemicals, Inc. | 3,271,500 | |||||
| 414,707 | Omnova Solutions, Inc. (a) | 1,837,152 | |||||
| 394,558 | Penford Corp. (a) | 2,016,191 | |||||
| 10,928,843 | |||||||
| Computers & Electronics – 3.25% | |||||||
| 253,750 | Astro-Med, Inc. | 2,024,925 | |||||
| 298,044 | Cyberoptics Corp. (a) | 2,429,059 | |||||
| 580,000 | PC-Tel, Inc. (a) | 4,199,200 | |||||
| 209,350 | Rimage Corporation | 2,323,785 | |||||
| 10,976,969 | |||||||
| Construction & Engineering – 4.53% | |||||||
| 333,130 | Comfort Systems USA, Inc. | 3,664,430 | |||||
| 395,000 | Furmanite Corp. (a) | 2,634,650 | |||||
| 690,000 | Hill International, Inc. (a) | 3,864,000 | |||||
| 243,714 | MFRI, Inc. (a) | 1,737,681 | |||||
| 273,981 | Sterling Construction Company, Inc. (a) | 3,411,063 | |||||
| 15,311,824 | |||||||
| Consumer Products – Manufacturing – 6.02% | |||||||
| 256,308 | Flexsteel Industries | 3,652,389 | |||||
| 550,000 | Furniture Brands International, Inc. (a) | 1,050,500 | |||||
| 700,000 | Heelys, Inc. | ||||||
(Acquired 5/5/10, Cost $1,603,000) (a)(b) | 1,393,000 | ||||||
| 612,000 | Kimball International, Inc. | 3,445,560 | |||||
| 175,081 | Motorcar Parts of America, Inc. (a) | 1,736,804 | |||||
| 259,147 | Orchids Paper Products Co. | 3,026,837 | |||||
| 128,869 | Steinway Musical Instruments, Inc. (a) | 3,247,499 | |||||
| 150,500 | Universal Electronics, Inc. (a) | 2,797,795 | |||||
| 20,350,384 | |||||||
| Consumer Services – 3.03% | |||||||
| 300,000 | CPI Corp. | 1,791,000 | |||||
| 290,000 | Intersections, Inc. | 4,898,100 | |||||
| 550,000 | Stewart Enterprises, Inc. – Class A | 3,542,000 | |||||
| 10,231,100 | |||||||
| Electronic Equipment & Instruments – 0.50% | |||||||
| 353,000 | NAM TAI Electronics, Inc. | 1,694,400 | |||||
| Energy & Related Services – 10.46% | |||||||
| 1,000,000 | Cal Dive International, Inc. (a) | 2,240,000 | |||||
| 395,200 | CE Franklin Ltd. (a) | 3,367,104 | |||||
| 342,911 | Matrix Service Co. (a) | 3,641,715 | |||||
| 115,171 | Michael Baker Corp. (a) | 2,370,219 | |||||
| 354,545 | Mitcham Industries, Inc. (a) | 5,169,266 | |||||
| 650,000 | Newpark Resources, Inc. (a) | 5,804,500 | |||||
| 173,299 | PHI, Inc. (a) | 3,824,709 | |||||
| 656,565 | TGC Industries, Inc. (a) | 3,663,633 | |||||
| 250,000 | Union Drilling, Inc. (a) | 1,872,500 | |||||
| 653,100 | Uranium Energy Corp. (a) | 2,194,416 | |||||
| 937,500 | Ur-Energy, Inc. (a) | 1,209,375 | |||||
| 35,357,437 | |||||||
| Environmental Services – 0.85% | |||||||
| 2,125,000 | Perma-Fix Environmental Services (a) | 2,868,750 | |||||
| Financial Services – 6.73% | |||||||
| 244,600 | B of I Holding, Inc. (a) | 3,742,380 | |||||
| 524,418 | Edelman Financial Group, Inc. | 3,639,461 | |||||
| 1,161,921 | Global Cash Access Holdings, Inc. (a) | 3,462,525 | |||||
| 257,525 | Nicholas Financial, Inc. | 2,925,484 | |||||
| 415,000 | SWS Group, Inc. | 2,286,650 | |||||
| 511,982 | U.S. Global Investors, Inc. – Class A | 3,885,943 | |||||
| 45,130 | Virtus Investment Partners, Inc. (a) | 2,816,112 | |||||
| 22,758,555 | |||||||
| Food – 2.72% | |||||||
| 90,000 | Cal-Maine Foods, Inc. | 2,998,800 | |||||
| 326,000 | John B. Sanfilippo & Son, Inc. (a) | 2,803,600 | |||||
| 545,000 | Landec Corp. (a) | 3,384,450 | |||||
| 9,186,850 | |||||||
| Insurance – 0.55% | |||||||
| 260,960 | SeaBright Holdings, Inc. | 1,873,693 | |||||
| Leisure – 2.03% | |||||||
| 93,675 | Ascent Capital Corp. (a) | 4,261,276 | |||||
| 1,020,000 | Century Casinos, Inc. (a) | 2,601,000 | |||||
| 6,862,276 | |||||||
| Medical Supplies & Services – 7.96% | |||||||
| 410,000 | Albany Molecular Research, Inc. (a) | 1,316,100 | |||||
| 305,695 | Allied Healthcare Products (a) | 1,094,388 | |||||
| 850,000 | BioScrip, Inc. (a) | 5,525,000 | |||||
| 400,000 | Cornerstone Therapeutics, Inc. (a) | 2,452,000 | |||||
| 350,000 | Five Star Quality Care, Inc. (a) | 906,500 | |||||
| 2,064,000 | Hooper Holmes, Inc. (a) | 1,609,920 | |||||
| 325,000 | Integramed America, Inc. (a) | 2,603,250 | |||||
| 316,279 | Medical Action Industries, Inc. (a) | 1,657,302 | |||||
| 114,378 | Psychemedics Corp. | 1,017,964 | |||||
| 125,900 | The Ensign Group, Inc. | 2,865,484 | |||||
| 145,000 | Transcend Services, Inc. (a) | 3,962,850 | |||||
| 200,000 | Vivus, Inc. (a) | 1,886,000 | |||||
| 26,896,758 | |||||||
| Military Equipment – 0.69% | |||||||
| 637,300 | Force Protection, Inc. (a) | 2,345,264 | |||||
The accompanying notes to financial statements are an integral part of this schedule.
8
| Schedule of Investments Continued | October 31, 2011 |
| Shares | Value | ||||||
| Minerals & Resources – 0.65% | |||||||
| 600,000 | Exeter Resource Corp. (a) | $ | 2,208,000 | ||||
| Oil & Gas – 2.96% | |||||||
| 269,000 | Hallador Energy Co. | 2,555,500 | |||||
| 595,553 | Magnum Hunter Resources Corp. (a) | 2,679,988 | |||||
| 700,000 | Vaalco Energy, Inc. (a) | 4,767,000 | |||||
| 10,002,488 | |||||||
| Retail – 2.28% | |||||||
| 500,000 | PC Mall, Inc. (a) | 2,635,000 | |||||
| 106,523 | Rush Enterprises, Inc. (a) | 1,704,368 | |||||
| 142,000 | Systemax, Inc. (a) | 2,148,460 | |||||
| 340,197 | Tuesday Morning Corp. (a) | 1,231,513 | |||||
| 7,719,341 | |||||||
| Semiconductor Related Products – 2.88% | |||||||
| 600,000 | FSI International, Inc. (a) | 1,482,000 | |||||
| 400,000 | Integrated Silicon Solution, Inc. (a) | 3,684,000 | |||||
| 298,650 | Rudolph Technologies, Inc. (a) | 2,201,050 | |||||
| 430,000 | Ultra Clean Holdings, Inc. (a) | 2,356,400 | |||||
| 9,723,450 | |||||||
| Software – 4.67% | |||||||
| 550,000 | American Software, Inc. – Class A | 4,301,000 | |||||
| 570,600 | Clicksoftware Technologies Ltd. | 5,648,940 | |||||
| 1,880,000 | iPass, Inc. (a) | 2,481,600 | |||||
| 801,500 | ModusLink Global Solutions, Inc. | 3,350,270 | |||||
| 15,781,810 | |||||||
| Specialty Manufacturing – 8.38% | |||||||
| 105,000 | AEP Industries, Inc. (a) | 2,838,150 | |||||
| 165,000 | AM Castle & Co. (a) | 2,258,850 | |||||
| 225,000 | China Gerui Advanced Materials Group | ||||||
| Ltd. (Acquired 6/1/10, | |||||||
Cost $1,282,500) (a)(b) | 562,500 | ||||||
| 435,000 | China Gerui Advanced Materials | ||||||
Group Ltd. (a) | 1,087,500 | ||||||
| 264,500 | Courier Corp. | 2,298,505 | |||||
| 152,600 | Douglas Dynamics, Inc. | 2,292,052 | |||||
| 50,000 | Federal Signal Corp. (a) | 236,000 | |||||
| 910,000 | Flanders Corp. (a) | 2,693,600 | |||||
| 112,700 | Global Power Equipment Group, Inc. (a) | 2,987,677 | |||||
| 100,000 | L.B. Foster Co. | 2,550,000 | |||||
| 184,324 | LMI Aerospace, Inc. (a) | 3,706,756 | |||||
| 146,617 | Northern Technologies | ||||||
International Corp. (a) | 2,125,946 | ||||||
| 100,000 | Northwest Pipe Co. (a) | 2,667,000 | |||||
| 28,304,536 | |||||||
| Telecommunications – 5.28% | |||||||
| 1,120,600 | Alvarion Ltd. (a) | 1,311,102 | |||||
| 297,000 | City Telecom HK Ltd. – ADR | 2,845,260 | |||||
| 705,000 | Gilat Satellite Networks Ltd. (a) | 2,735,400 | |||||
| 307,400 | Globecomm Systems, Inc. (a) | 4,177,566 | |||||
| 240,000 | Oplink Communications, Inc. (a) | 3,892,800 | |||||
| 342,000 | Seachange International, Inc. (a) | 2,886,480 | |||||
| 17,848,608 | |||||||
| Transportation – 4.50% | |||||||
| 626,493 | Grupo TMM S.A. – ADR (a) | 1,083,833 | |||||
| 100,000 | Hornbeck Offshore Services, Inc. (a) | 3,284,000 | |||||
| 650,000 | Republic Airways Holdings, Inc. (a) | 1,690,000 | |||||
| 420,000 | Scorpio Tankers, Inc. (a) | 2,683,800 | |||||
| 2,000,000 | Star Bulk Carriers Corp. | 2,780,000 | |||||
| 310,000 | StealthGas, Inc. (a) | 1,280,300 | |||||
| 273,000 | USA Truck, Inc. (a) | 2,402,400 | |||||
| 15,204,333 | |||||||
| TOTAL COMMON STOCKS | |||||||
| (Cost $341,906,704) | $ | 326,907,837 | |||||
| REAL ESTATE INVESTMENT | |||||||
| TRUSTS – 1.77% | |||||||
| 390,000 | Monmouth Real Estate | ||||||
| Investment Corp. – Class A | $ | 3,276,000 | |||||
| 230,000 | Whitestone Real Estate | ||||||
| Investment Trust | 2,691,000 | ||||||
| TOTAL REAL ESTATE | |||||||
| INVESTMENT TRUSTS | |||||||
| (Cost $5,305,533) | $ | 5,967,000 | |||||
| Contracts | WARRANTS – 0.00% | Value | |||||
| Oil & Gas | |||||||
| 59,555 | Magnum Hunter Resources | ||||||
| Corp. Warrant | |||||||
| Expiration: 10/14/2013, | |||||||
Exercise Price $10.50) (c) | $ | — | |||||
| TOTAL WARRANTS | $ | — | |||||
| RIGHTS – 0.00% | |||||||
| Oil & Gas | |||||||
| 305,000 | Sino Clean Energy, Inc. (c)(d) | $ | — | ||||
| TOTAL RIGHTS | |||||||
| (Cost $0) | $ | — | |||||
| Shares | SHORT TERM INVESTMENTS – 0.39% | Value | |||||
| 1,330,642 | Fidelity Institutional Money | ||||||
| Market Fund, 0.10% | $ | 1,330,642 | |||||
| TOTAL SHORT TERM | |||||||
| INVESTMENTS | |||||||
| (Cost $1,330,642) | $ | 1,330,642 | |||||
| Total Investments | |||||||
| (Cost $348,542,879) – 98.88% | $ | 334,205,479 | |||||
| Other Assets in Excess | |||||||
of Liabilities – 1.12% | 3,769,151 | ||||||
| TOTAL NET ASSETS – 100.00% | $ | 337,974,630 | |||||
Percentages are stated as a percent of net assets.
| ADR | American Depository Receipt | |
| (a) | Non-income producing security. | |
| (b) | Restricted under Rule 144A of the Securities Act of 1933. Such securities may be sold in transactions exempt from registration, normally to qualified institutional buyers. See Note 6 of the Notes to Financial Statements. | |
| (c) | The price for this security was derived from an estimate of fair value using methods approved by the Fund’s Board of Directors. These securities represent $0 or 0.00% of the Fund’s net assets. | |
| (d) | Contingent Value Right. See Note 11 of the Notes to Financial Statements. | |
The industry classifications listed above are in accordance with Global Industry Classification Standard (GICS®), which was developed by and/or is the exclusive property of MSCI, Inc. and Standard & Poor Financial Services LLC (“S&P”).
The accompanying notes to financial statements are an integral part of this schedule.
Perritt MicroCap Opportunities Fund
9
| Statement of Operations |
For the Year Ended October 31, 2011
| Investment Income: | ||||
| Dividend income | ||||
| Unaffiliated issuers | $ | 3,048,777 | ||
| Affiliated issuers | 245,100 | |||
| Less: Foreign tax withheld | (22,588 | ) | ||
| Interest income | 31,270 | |||
| Total investment income | 3,302,559 | |||
| Expenses: | ||||
| Investment advisory fee | 4,124,167 | |||
| Shareholder servicing | 395,467 | |||
| Administration fee | 160,362 | |||
| Printing & mailing fees | 94,816 | |||
| Fund accounting expenses | 79,887 | |||
| Directors’ fees and expenses | 50,018 | |||
| Federal & state registration fees | 44,115 | |||
| Custodian fees | 29,913 | |||
| Legal fees | 23,318 | |||
| Payroll expense ** | 20,988 | |||
| Other expense | 14,321 | |||
| Audit fees | 13,009 | |||
| Total expenses | 5,050,381 | |||
| Net investment loss | (1,747,822 | ) | ||
| Realized and Unrealized Loss on Investments: | ||||
| Realized gain on investments | ||||
| Unaffiliated issuers | 7,076,278 | |||
| Affiliated issuers | — | |||
| Change in unrealized depreciation on investments | (23,069,535 | ) | ||
| Net realized and unrealized loss on investments | (15,993,257 | ) | ||
| Net Decrease in Net Assets Resulting from Operations | $ | (17,741,079 | ) | |
**Chief Compliance Officer compensation
The accompanying notes to financial statements are an integral part of this statement.
| Financial Highlights |
For a Fund share outstanding throughout the period
| For the Years Ended October 31, | ||||||||||||||||||||
| 2011 | 2010 | 2009 | 2008 | 2007 | ||||||||||||||||
| Net asset value, beginning of period | $ | 24.52 | $ | 19.83 | $ | 15.92 | $ | 34.24 | $ | 32.32 | ||||||||||
Income (loss) from investment operations: | ||||||||||||||||||||
Net investment loss2 | (0.11 | ) | (0.15 | ) | (0.03 | ) | (0.13 | ) | (0.10 | ) | ||||||||||
| Net realized and unrealized gain/(loss) on investments | (0.98 | ) | 4.84 | 3.94 | (13.43 | ) | 5.06 | |||||||||||||
| Total from investment operations | (1.09 | ) | 4.69 | 3.91 | (13.56 | ) | 4.96 | |||||||||||||
| Less dividends and distributions: | ||||||||||||||||||||
| Distributions from net realized gains | — | — | — | (4.77 | ) | (3.05 | ) | |||||||||||||
| Total dividends and distributions | — | — | — | (4.77 | ) | (3.05 | ) | |||||||||||||
Redemption fees2 | — | 3 | — | 3 | — | 3 | 0.01 | 0.01 | ||||||||||||
| Net asset value, end of period | $ | 23.43 | $ | 24.52 | $ | 19.83 | $ | 15.92 | $ | 34.24 | ||||||||||
Total return1 | (4.45 | %) | 23.59 | % | 24.56 | % | (45.32 | %) | 16.64 | % | ||||||||||
| Supplemental data and ratios: | ||||||||||||||||||||
| Net assets, end of period (in thousands) | $ | 337,975 | $ | 371,998 | $ | 315,865 | $ | 234,350 | $ | 569,856 | ||||||||||
| Ratio of net expenses to average net assets: | 1.22 | % | 1.27 | % | 1.42 | % | 1.37 | % | 1.27 | % | ||||||||||
| Ratio of net investment loss to average net assets: | (0.42 | %) | (0.67 | %) | (0.18 | %) | (0.56 | %) | (0.30 | %) | ||||||||||
| Portfolio turnover rate | 25.4 | % | 41.5 | % | 25.4 | % | 26.7 | % | 28.5 | % | ||||||||||
| 1 | Total return reflects reinvested dividends but does not reflect the impact of taxes. | |
| 2 | Net investment loss and redemption fees per share has been calculated based on average shares outstanding during the period. | |
| 3 | Amount is less than $0.01 per share. | |
The accompanying notes to financial statements are an integral part of this schedule.
10
| Statements of Changes in Net Assets |
| For the | For the | |||||||
| Year Ended | Year Ended | |||||||
| October 31, 2011 | October 31, 2010 | |||||||
| Operations: | ||||||||
| Net investment loss | $ | (1,747,822 | ) | $ | (2,371,036 | ) | ||
| Net realized gain on investments | 7,076,278 | 14,324,411 | ||||||
| Net increase (decrease) in unrealized appreciation on investments | (23,069,535 | ) | 62,424,077 | |||||
| Net increase (decrease) in net assets resulting from operations | (17,741,079 | ) | 74,377,452 | |||||
| Dividends and Distributions to Shareholders: | ||||||||
| Net investment income | — | — | ||||||
| Net realized gains | — | — | ||||||
| Total dividends and distributions | — | — | ||||||
| Capital Share Transactions: | ||||||||
| Proceeds from shares issued | ||||||||
| (4,181,974 and 3,594,806 shares, respectively) | 108,913,526 | 80,162,882 | ||||||
| Cost of shares redeemed | ||||||||
| (4,929,574 and 4,347,517 shares, respectively) | (125,227,156 | ) | (98,426,406 | ) | ||||
| Reinvestment of distributions | ||||||||
| (0 and 0 shares, respectively) | — | — | ||||||
| Redemption fees | 31,329 | 19,470 | ||||||
| Net decrease in net assets from capital share transactions | (16,282,301 | ) | (18,244,054 | ) | ||||
| Total Increase (Decrease) in Net Assets | (34,023,380 | ) | 56,133,398 | |||||
| Net Assets | ||||||||
| Beginning of the Period | 371,998,010 | 315,864,612 | ||||||
End of the Period (including undistributed net investment | ||||||||
| loss of ($758,859) and ($234,659), respectively) | $ | 337,974,630 | $ | 371,998,010 | ||||
The accompanying notes to financial statements are an integral part of these statements.
| Statement of Assets and Liabilities |
October 31, 2011
| Assets: | ||||
| Investments at value (cost: $348,542,879) | $ | 334,205,479 | ||
| Receivable for investments sold | 3,667,154 | |||
| Receivable for fund shares issued | 735,378 | |||
| Dividends and interest receivable | 26,204 | |||
| Prepaid expenses | 20,816 | |||
| Other receivables | 34 | |||
| Total Assets | 338,655,065 | |||
| Liabilities: | ||||
| Payable to Advisor | 277,656 | |||
| Payable for fund shares purchased | 142,099 | |||
| Accrued expenses and other liabilities | 132,255 | |||
| Payable for investments purchased | 107,925 | |||
| Payable to Directors | 15,503 | |||
| Payable to Chief Compliance Officer | 4,997 | |||
| Total Liabilities | 680,435 | |||
| Net Assets | $ | 337,974,630 | ||
| Net Assets Consist of: | ||||
| Capital stock | $ | 359,804,009 | ||
| Accumulated net investment loss | (758,859 | ) | ||
| Accumulated undistributed net realized loss on investments sold | (6,733,120 | ) | ||
| Net unrealized depreciation on investments | (14,337,400 | ) | ||
| Total Net Assets | $ | 337,974,630 | ||
| Capital shares issued and outstanding, $0.01 par value, 40,000,000 shares authorized | 14,424,940 | |||
| Net asset value per share | $ | 23.43 | ||
The accompanying notes to financial statements are an integral part of this statement.
Perritt MicroCap Opportunities Fund
11
| Notes to Financial Statements |
October 31, 2011
Perritt MicroCap Opportunities Fund, Inc., which consists solely of the Perritt MicroCap Opportunities Fund (the “Fund”), was formed under the laws of the state of Maryland, and is registered under the Investment Company Act of 1940 as an open-end diversified management investment company.
| 1. | Summary of Significant Accounting Policies |
| a. | Exchange-listed securities are generally valued at the last sales price reported by the principal security exchange on which the issue is traded, or if no sale is reported, the mean between the latest bid and ask price unless the Fund’s investment advisor believes that the mean does not represent a fair value, in which case the securities are fair valued as set forth below. Securities listed on NASDAQ are valued at the NASDAQ Official Closing Price. Demand notes, commercial paper, U.S. Treasury Bills and warrants are stated at fair value using market prices if available, or a pricing service when such prices are believed to reflect fair value. Securities for which market quotations are not readily available are valued at their fair value as determined in good faith by the Fund’s advisor under procedures established by and under the supervision of the Board of Directors of the Fund. The Fund’s fair value procedures allow for the use of certain methods performed by the Fund’s advisor to value those securities for which market quotations are not readily available, at a price that the Fund might reasonably expect to receive upon a sale of such securities. For example, these methods may be based on a multiple of earnings, or a discount from market of a similar freely traded security, or a yield to maturity with respect to debt issues, or a combination of these and other methods. |
| b. | Net realized gains and losses on securities are computed using the first-in, first-out method. |
| c. | Dividend income is recognized on the ex-dividend date, and interest income is recognized on the accrual basis. Withholding taxes on foreign dividends and capital, which are included as a component of net investment income and realized gain (loss) on investments, respectively, have been provided for in accordance with the Fund’s understanding of the applicable country’s tax rules and rates. Discounts and premiums on securities purchased are amortized over the life of the respective securities. Investment and shareholder transactions are recorded on the trade date. |
| d. | Provision has not been made for federal income tax since the Fund has elected to be taxed as a “regulated investment company” and intends to distribute substantially all income to its shareholders and otherwise comply with the provisions of the Internal Revenue Code applicable to regulated investment companies. |
| e. | The preparation of financial statements in conformity with accounting principles generally accepted in the United States of America (“GAAP”) requires management to make estimates and assumptions that affect the reported amounts of assets and liabilities and disclosure of contingent assets and liabilities at the date of the financial statements and reported amounts of increases and decreases in net assets from operations during the reporting period. Actual results could differ from those estimates. |
In preparing these financial statements, the Fund has evaluated events and transactions for potential recognition or disclosure through the date the financial statements were issued. Management determined there were no events that impacted the Fund’s Financial Statements.
| f. | Dividends from net investment income and net realized capital gains, if any, are declared and paid annually. Distributions to shareholders are recorded on the ex-dividend date. The Fund may periodically make reclassifications among certain of its capital accounts as a result of the timing and characterization of certain income and realized gain distributions determined annually in accordance with federal tax regulations which may differ from GAAP. The Fund has reclassified its investment loss for the year ended October 31, 2011 by increasing accumulated net investment income by $1,223,621, increasing accumulated net realized losses by $1 and decreasing capital stock by $1,223,622. |
| g. | As of and during the year ended October 31, 2011, the Fund did not have a liability for any unrecognized tax benefits. The Fund recognizes interest and penalties, if any, related to unrecognized tax benefits as income tax expense on the Statement of Operations. During the year, the Fund did not incur any interest or penalties. The Fund is not subject to examination by U.S. federal tax authorities for any tax years before 2007. |
| 2. | Security Valuation |
GAAP establishes an authoritative definition of fair value and sets out a hierarchy for measuring fair value. GAAP also requires additional disclosures about the various inputs used to develop the measurements of fair value. These inputs are summarized in the three broad levels listed below:
| • Level 1 – | Quoted prices in active markets for identical securities. |
12
| Notes to Financial Statements Continued |
| • Level 2 – | Other significant observable inputs (including quoted prices for similar securities or the identical security on an active market, interest rates, prepayment speeds, credit risk, etc.). | |
| • Level 3 – | Significant unobservable inputs (including the Fund’s own assumptions in determining the fair value of investments). |
The inputs or methodology used for valuing securities are not necessarily an indication of the risk associated with investing in those securities. The following is a summary of the inputs used to value the Fund’s net assets as of October 31, 2011:
| Description | Level 1 | Level 2 | Level 3 | Total | ||||||||||||
| Investments in Securities | ||||||||||||||||
| Common Stocks* | ||||||||||||||||
| Consumer Discretionary | $ | 37,490,999 | $ | — | $ | — | $ | 37,490,999 | ||||||||
| Consumer Staples | 8,829,237 | — | — | 8,829,237 | ||||||||||||
| Energy | 51,321,639 | — | — | 51,321,639 | ||||||||||||
| Financial | 21,169,723 | — | — | 21,169,723 | ||||||||||||
| Health Care | 26,896,758 | — | — | 26,896,758 | ||||||||||||
| Industrials | 84,594,029 | — | — | 84,594,029 | ||||||||||||
| Information Technology | 72,169,952 | — | — | 72,169,952 | ||||||||||||
| Materials | 21,590,240 | — | — | 21,590,240 | ||||||||||||
| Telecommunication Services | 2,845,260 | — | — | 2,845,260 | ||||||||||||
| Total Common Stocks | 326,907,837 | — | — | 326,907,837 | ||||||||||||
| Fixed Income | ||||||||||||||||
| Real Estate Investment Trusts | 5,967,000 | — | — | 5,967,000 | ||||||||||||
| Total Fixed Income | 5,967,000 | — | — | 5,967,000 | ||||||||||||
| Short Term Investments | 1,330,642 | — | — | 1,330,642 | ||||||||||||
| Total Investments in Securities | $ | 334,205,479 | $ | — | $ | — | $ | 334,205,479 | ||||||||
* Refer to the Schedule of Investments for additional information regarding industry classifications.
There were no significant transfers between Levels 1 and 2 during the year ended October 31, 2011. Transfers between levels are recognized at the end of the reporting period.
| 3. | Investment Advisory Agreement |
The Fund has an investment advisory agreement with Perritt Capital Management, Inc. (“PCM” or “Advisor”), with whom certain officers and directors of the Fund are affiliated. Under the terms of the agreement, the Fund pays PCM a monthly investment advisory fee at the annual rate of 1% of the daily average net assets of the Fund. At October 31, 2011, the Fund had fees due to PCM of $277,656. For the year ended October 31, 2011, the Fund incurred advisory fees of $4,124,167 pursuant to the investment advisory agreement.
PCM manages the Fund’s investments subject to the supervision of the Fund’s Board of Directors. PCM is responsible for investment decisions and supplies investment research and portfolio management. Under the investment advisory agreement, PCM, at its own expense and without reimbursement from the Fund, will furnish office space and all necessary office facilities, equipment and personnel for making the investment decisions necessary for managing the Fund and maintaining its organization, will pay the salaries and fees of all officers and directors of the Fund (except the Chief Compliance Officer’s salary and the fees paid to disinterested directors) and will bear all sales and promotional expenses of the Fund.
| 4. | Investment Transactions |
Purchases and sales of securities, excluding short-term investments, for the year ended October 31, 2011 were as follows:
| Purchases | Sales | ||||||||||||||
| U.S. Government | Other | U.S. Government | Other | ||||||||||||
| $ | — | $ | 99,492,114 | $ | — | $ | 98,686,345 | ||||||||
Perritt MicroCap Opportunities Fund
13
| Notes to Financial Statements Continued |
| 5. | Federal Income Tax Matters |
As of October 31, 2011, the components of distributable earnings on a tax basis were as follows:
| Cost of investments for tax purposes | $ | 349,301,738 | ||
| Gross tax unrealized appreciation | $ | 60,003,629 | ||
| Gross tax unrealized depreciation | (75,099,888 | ) | ||
| Net tax unrealized depreciation on investment | (15,096,259 | ) | ||
| Distributable ordinary income | — | |||
| Distributable long-term capital gains | — | |||
| Total distributable earnings | — | |||
| Other accumulated losses | (6,733,120 | ) | ||
| Total accumulated losses | $ | (21,829,379 | ) |
The differences between book and tax basis distributable earnings are primarily related to the classification of distributions from real estate investment trusts (“REITs”) and master limited partnerships (“MLPs”), the recognition of income from passive foreign investment companies (“PFICs”), and the deferral of losses on wash sales.
The tax composition of distributions paid during the years ended October 31, 2011 and 2010 were as follows:
| Year Ended October 31, 2011 | Year Ended October 31, 2010 | |||||||
| Ordinary Income | $ | — | $ | — | ||||
| Long Term Capital Gain | — | — | ||||||
As of October 31, 2011, the Fund had capital losses expiring as indicated below:
| Date of Expiration | Amount | |||
| October 31, 2017 | $ | 6,733,120 | ||
| 6. | Restricted Securities |
The Fund owns investment securities which are unregistered and thus restricted as to resale. These securities are valued by the Fund after giving due consideration to pertinent factors including recent private sales, market conditions and the issuer’s financial performance. Where future disposition of these securities requires registration under the Securities Act of 1933, the Fund has the right to include these securities in such registration, generally without cost to the Fund. The Fund has no right to require registration of the unregistered securities it holds. At October 31, 2011, the Fund held restricted securities with an aggregate market value of $1,955,500 or 0.58% of the Fund’s net assets.
| 7. | Guarantees and Indemnifications |
Under the Fund’s organizational documents, its officers and directors are indemnified by the Fund against certain liabilities arising out of the performance of their duties to the Fund. Additionally, in the normal course of business, the Fund enters into contracts with service providers that contain general indemnification clauses. The Fund’s maximum exposure under these arrangements is unknown as this would involve future claims that may be made against the Fund that have not yet occurred. Currently, the Fund expects the risk of loss to be remote.
| 8. | Line of Credit Arrangement |
The Fund is party to an uncommitted line of credit agreement with U.S. Bank, N.A., expiring December 15, 2012, and renewed annually thereafter, under which the Fund may borrow up to the lesser of $15,000,000, 5% of the net assets of the Fund, 5% of the market value of the assets of the Fund, or 33.33% of the sum of the market value of the certain assets of the Fund. Interest is charged on borrowings at the prevailing Prime Rate. The Fund has borrowed under these agreements from time to time to increase the efficiency of cash flow management. For the period from November 1, 2010 to October 31, 2011, the Fund did not have any borrowings. At October 31, 2011, the Fund had no outstanding borrowings on the line of credit.
14
| Notes to Financial Statements Continued |
| 9. | Redemption Fee |
The Fund charges a 2% redemption fee to those who buy and sell shares within 90 calendar days or less. The redemption fee is retained for the benefit of long-term shareholders, and recorded as additional capital in the Statement of Changes in Net Assets.
| 10. | Transactions with Affiliates |
The following issuer was affiliated with the Perritt MicroCap Opportunities Fund, as the Fund held 5% or more of the outstanding voting securities of the issuer during the period from November 1, 2010 through October 31, 2011. See Section (2)(a)(3) of the Investment Company Act of 1940.
| Share Balance at | Share Balance at | Dividend | Value at | ||||
| Issuer Name | November 1, 2010 | Additions | Reductions | October 31, 2011 | Income | October 31, 2011 | |
| Whitestone Real Estate | |||||||
Investment Trust(1) | 200,000 | 30,000 | — | 230,000 | $245,100 | $2,691,000 | |
| (1) | Issuer was not an affiliate as of October 31, 2011. |
| 11. | Contingent Value Right |
A Contingent Value Right (“CVR”) grants shareholders the right to realize the proceeds from a specified event. Proceeds are contingent upon an outcome of the specified event. Perritt MicroCap Opportunities Fund holds Sino Clean Energy CVRs as of October 31, 2011. Proceeds from these rights are contingent upon a favorable lawsuit ruling or settlement relating to a complaint filed by Sino Clean Energy. If a favorable ruling or settlement occurs, shareholders are entitled to 90% of the lawsuit proceeds, if any, less certain legal and other expenses that will be deducted from such proceeds. The CVRs expire upon the entry of a final, non-appealable judgment or settlement in the underlying lawsuit.
| Report of Independent Registered Public Accounting Firm |
To the Shareholders and Board of Directors
Perritt MicroCap Opportunities Fund
We have audited the accompanying statement of assets and liabilities, including the schedule of investments, of Perritt MicroCap Opportunities Fund (the “Fund”), a series of Perritt MicroCap Opportunities Fund, Inc., as of October 31, 2011, and the related statement of operations for the year then ended, the statements of changes in net assets for each of the two years in the period then ended, and the financial highlights for each of the three years in the period then ended. These financial statements and financial highlights are the responsibility of Fund management. Our responsibility is to express an opinion on these financial statements and financial highlights based on our audits. The financial highlights for the periods indicated prior to October 31, 2009 were audited by another independent registered public accounting firm, who expressed unqualified opinions on those financial highlights.
We conducted our audits in accordance with the standards of the Public Company Accounting Oversight Board (United States). Those standards require that we plan and perform the audit to obtain reasonable assurance about whether the financial statements and financial highlights are free of material misstatement. An audit includes examining, on a test basis, evidence supporting the amounts and disclosures in the financial statements. Our procedures included confirmation of securities owned as of October 31, 2011 by correspondence with the custodian and brokers or by other appropriate auditing procedures where replies from brokers were not received. An audit also includes assessing the accounting principles used and significant estimates made by management, as well as evaluating the overall financial statement presentation. We believe that our audits provide a reasonable basis for our opinion.
In our opinion, the financial statements and financial highlights referred to above present fairly, in all material respects, the financial position of Perritt MicroCap Opportunities Fund as of October 31, 2011, the results of its operations for the year then ended, the changes in its net assets for each of the two years in the period then ended, and the financial highlights for each of the three years in the period then ended, in conformity with accounting principles generally accepted in the United States of America.
COHEN FUND AUDIT SERVICES, LTD.
Westlake, Ohio
December 21, 2011
Perritt MicroCap Opportunities Fund
15
Expense Example (Unaudited) |
October 31, 2011
As a shareholder of the Fund, you incur two types of costs: (1) transaction costs, including sales charges (loads) on purchase payments, reinvested dividends, or other distributions; redemption fees (the Fund imposes a 2.00% redemption fee on shares held for 90 calendar days or less after purchase); and exchange fees; and (2) ongoing costs, including management fees; distribution and/or service fees; and other Fund expenses. This Example is intended to help you understand your ongoing costs (in dollars) of investing in the Fund and to compare these costs with the ongoing costs of investing in other mutual funds. The Example is based on an investment of $1,000 invested at the beginning of the period and held for the entire period (May 1, 2011 – October 31, 2011).
Actual Expenses
The first line of the table below provides information about actual account values and actual expenses. Although the Fund charges no sales load or transaction fees (other than a 2.00% redemption fee for shares held for 90 calendar days or less after purchase), you will be assessed fees for outgoing wire transfers, returned checks and stop payment orders at prevailing rates charged by U.S. Bancorp Fund Services, LLC, the Fund’s transfer agent. If you request that a redemption be made by wire transfer, currently a $15.00 fee is charged by the Fund’s transfer agent. You will be charged a transaction fee equal to 2.00% of the net amount of the redemption if you redeem your shares within 90 calendar days of purchase. IRA accounts will be charged a $15.00 annual maintenance fee. To the extent the Fund invests in shares of other investment companies as part of its investment strategy, you will indirectly bear your proportionate share of any fees and expenses charged by the underlying funds in which the Fund invests in addition to the expenses of the Fund. Actual expenses of the underlying funds are expected to vary among the various underlying funds. These expenses are not included in the example below. The example below includes, but is not limited to, management fees, shareholder servicing fees, fund accounting, custody and transfer agent fees. However, the example below does not include portfolio trading commissions and related expenses, interest expense and other extraordinary expenses as determined under accounting principles generally accepted in the United States of America. You may use the information in this line, together with the amount you invested, to estimate the expenses that you paid over the period. Simply divide your account value by $1,000 (for example, an $8,600 account value divided by $1,000 = 8.6), then multiply the result by the number in the first line under the heading entitled “Expenses Paid During Period” to estimate the expenses you paid on your account during this period.
Hypothetical Example for Comparison Purposes
The second line of the table below provides information about hypothetical account values and hypothetical expenses based on the Fund’s actual expense ratio and an assumed rate of return of 5% per year before expenses, which is not the Fund’s actual return. The hypothetical account values and expenses may not be used to estimate the actual ending account balance or expenses you paid for the period. You may use this information to compare the ongoing costs of investing in the Fund and other funds. To do so, compare this 5% hypothetical example with the 5% hypothetical examples that appear in the shareholder reports of the other funds.
Please note that the expenses shown in the table are meant to highlight your ongoing costs only and do not reflect any transactional costs, such as sales charges (loads), redemption fees, or exchange fees. Therefore, the second line of the table is useful in comparing ongoing costs only, and will not help you determine the relative total costs of owning different funds. In addition, if these transactional costs were included, your costs would have been higher.
| Beginning | Ending | Expenses Paid | |
| Account Value | Account Value | During Period | |
| 5/1/11 | 10/31/11 | 5/1/11 – 10/31/111 | |
| Actual | $1,000.00 | $ 798.60 | $5.59 |
| Hypothetical (5% return before expenses) | 1,000.00 | 1,018.85 | 6.28 |
| 1 | Expenses are equal to the Fund’s annualized expense ratio of 1.24%, multiplied by the average account value over the period, multiplied by 184/365 (to reflect the one-half year period). |
16
President’s Message
By Michael Corbett, President
The Perritt Emerging Opportunities Fund posted a modest loss in fiscal 2011. While the Fund slightly underperformed its Russell Microcap Index benchmark in the past year, we are pleased with the Fund’s returns for the three, five and since inception periods. The complete performance results for the Fund and its benchmark can be viewed on page 19 of this report.
The past year has been a challenging period for smaller company investors. The table below outlines the stock performance results for various market capitalization ranges for the ten month period ending October 31, 2011. As can be seen, the average stock during this measured period produced a negative return. However, companies below $500 million market capitalization declined significantly more than larger market capitalization companies.
There are several reasons for the weak performance across the market capitalization spectrum, but we believe the main reason is related to a crisis of confidence within the leadership around the world. The weaker performance of smaller market capitalization companies versus larger market capitalization companies should not be surprising. Smaller market capitalization companies have less liquidity and investors are typically unwilling to deploy capital in smaller companies in uncertain times, such as the one we are experiencing this year.
Another interesting fact about smaller market capitalization companies is that they tend to have a lower R-Squared, which means that they are less correlated to the overall equity markets. In fact, according to Morningstar, as of December 19, 2011 the Perritt Emerging Opportunities Fund’s R-Squared of 66.5 is currently one of the lowest of 6,812 domestic stock mutual funds with fund assets more than $50 million. This helps us believe that the Emerging Opportunities Fund can be a unique diversifier in an investor’s overall portfolio. While the weak performance among true microcap companies is disappointing, we also believe that opportunities for rewards may be substantial for long-term investors.
Small/Microcap Universe Performance by Market Capitalization
December 31, 2010 to October 31, 2011
| Greater | ||||||||||||||||
| Less than | $150 Mil. | $500 Mil. | than | |||||||||||||
| $150 Mil. | to $500 Mil. | to $2 Bil. | $2 Bil. | |||||||||||||
| Median Return | -12.3 | % | -17.9 | % | -9.1 | % | -4.7 | % | ||||||||
| # Positive | 373 | 251 | 371 | 115 | ||||||||||||
| # Negative | 765 | 681 | 653 | 150 | ||||||||||||
| Advance/ | ||||||||||||||||
| Decline Ratio | 0.49 | 0.37 | 0.57 | 0.77 | ||||||||||||
| Source: Capital IQ | ||||||||||||||||
Small/Microcap Universe includes all equities listed in the Russell Microcap Indexes plus an approximate 1,000 U.S. listed microcap equities not listed in the Indexes.
During the past year, we sold 49 positions from the portfolio. Seven issues were sold due to buyout offers: AC Moore Arts & Crafts (ACMR), Allied Healthcare International (AHCI), American Medical Alert (AMAC), NovaMed (NOVA), Ophthalmic Imaging Systems (OISI), Spectrum Controls (SPEC) and Xeta Technologies (XETA). We sold 16 issues after the company’s stock price reached our price targets, and the remaining 26 issues were due to disappointing operating results.
| Michael Corbett |
| joined the firm in |
| 1990 as a research |
| analyst. |
| He was appointed |
| co-manager of the |
| MicroCap |
| Opportunities Fund in |
| 1996 and President of |
| the Fund in 1999. |
| A graduate of |
| DePaul University, |
| Mr. Corbett has been |
| President of the |
| Emerging |
| Opportunities Fund |
| since its inception. He |
| is responsible for the |
| daily operations of |
| both funds and |
| assumed the lead |
| portfolio management |
| duties of both the |
| MicroCap and |
| Emerging |
| Opportunities Funds |
| in October 2010. |
As of October 31, 2011, the Fund’s portfolio contained the common stocks of 119 companies, 20 of which were added during the year. The Fund’s ten largest holdings and detailed description can be found on page 20 of this report. Based on our earnings estimates, the Fund’s portfolio is trading at a little more than 14x 2011 earnings and approximately 12x our 2012 earnings estimate. The average stock in the portfolio is priced at 0.6x revenue and the median market capitalization is approximately $54 million. According to Morningstar, as of December 19, 2011 the Perritt Emerging Opportunities Fund had the lowest average market capitalization of 6,812 domestic stock mutual funds with fund assets more than $50 million.
I am pleased to report that the Fund’s expense ratio decreased from 1.72 percent in fiscal 2010 to 1.65 percent for fiscal 2011. The lower expense this past year is attributable to higher average net assets over fiscal year ended October 31, 2011 and strong expense controls that the team at Perritt Capital Management put in place two years ago. The Fund’s directors and the management team at Perritt Capital Management are committed to keeping the Fund’s expense ratio at a reasonable level.
For the third year in a row, the Perritt Emerging Opportunities Fund did not pay a capital gain and income distribution in 2011. The Fund used tax-loss carry forwards
Perritt Emerging Opportunities Fund
17
to ensure that there were no distributions in 2011. The Fund’s tax loss carry forwards now stand at $2,068,965. While we can’t guarantee that the Fund will not have capital gain and income distributions in future years, the $2,068,965 of tax loss carry forwards will reduce future income and capital gain distributions. Please review the notes to financial statements on page 26 for more information on tax matters.
I want to thank my fellow shareholders for their continued support and confidence in the Perritt Capital Management team. Dr. Perritt and I made the first investment in this Fund seven years ago, and we continue to add our investment in the Fund on a regular basis. If you have any questions or comments about this report or your investment in the Perritt Emerging Opportunities Fund, please call us toll-free at (800)331-8936 or visit our new web site at www.perrittmutualfunds.com. Please refer to the prospectus for information about the Fund’s investment objectives and strategies.
|
Michael Corbett
President
Past performance is not a guarantee of future results.
Mutual fund investing involves risk. Principal loss is possible. The Funds invest in smaller companies, which involve additional risks such as limited liquidity and greater volatility. The Funds invest in microcap companies which tend to perform poorly during times of economic stress. The Emerging Opportunities Fund may invest in early stage companies which tend to be more volatile and somewhat more speculative than investments in more established companies.
The Russell 2000 Index measures the performance of the small-cap segment of the U.S. equity market.
The Russell Microcap® Index measures the microcap segment of the U.S. equity market.
You cannot invest directly in an index.
Any tax or legal information provided is merely a summary of our understanding and interpretation of some of the current income tax regulations and is not exhaustive. Investors must consult their tax advisor or legal counsel for advice and information concerning their particular situation. Neither the Fund nor any of its representatives may give legal or tax advice.
R-Squared is a statistical measure that represents the percentage of a fund’s or security’s movements that are explained by movements in a benchmark index. R-squared values range from 0 to 100. An R-squared of 100 means that all movements of a security are completely explained by movements in the index. A high R-squared (between 85 and 100) indicates the fund’s performance patterns have been in line with the index. A fund with a low R-squared (70 or less) doesn’t act much like the index.
Correlation is a statistical measure of how two securities move in relation to each other.
18
Performance* (Unaudited) | October 31, 2011 |
Perritt Emerging
Opportunities Fund
versus
Russell 2000® Index
and
Russell
MicroCap® Index
 |
| Perritt Emerging Opportunities Fund Russell 2000® Index Russell MicroCap® Index |
There are several ways to evaluate a fund’s historical performance. You can look at the total percentage change in value, the average annual percentage change, or the growth of a hypothetical $10,000 investment. Each performance figure includes changes in a fund’s share price, plus reinvestment of any dividends (or income) and capital gains (the profits the fund earns when it sells stocks that have grown in value).
Cumulative total returns reflect the Fund’s actual performance over a set period. For example, if you invested $1,000 in a fund that had a 5% return over one year, you would end up with $1,050. You can compare the Fund’s returns to the Russell Microcap® Index, which measures the performance of the microcap segment of the U.S. equity market, and the Russell 2000® Index, which reflects a popular measure of the stock performance of small companies.
Average annual total returns take the Fund’s actual (or cumulative) return and show you what would have happened if the Fund had performed at a constant rate each year.
| Cumulative Total Returns** | ||||||||||||||||
| Periods ended October 31, 2011 | ||||||||||||||||
| Past 1 Year | Past 3 Years | Past 5 Years | Since Inception | |||||||||||||
| Perritt Emerging Opportunities Fund | (1.80)% | 69.78% | (10.27)% | 31.38% | ||||||||||||
| Russell 2000® Index | 6.71% | 43.79% | 3.45% | 49.43% | ||||||||||||
| (reflects no deduction for fees and expenses) | ||||||||||||||||
| Russell Microcap® Index | 2.11% | 34.17% | (14.45)% | 19.11% | ||||||||||||
| (reflects no deduction for fees and expenses) | ||||||||||||||||
| Average Annual Total Returns** | |||||||||||||||||
| Periods ended October 31, 2011 | |||||||||||||||||
| Past 1 Year | Past 3 Years | Past 5 Years | Since Inception | ||||||||||||||
| Perritt Emerging Opportunities Fund | (1.80)% | 19.30% | (2.14)% | 3.88% | |||||||||||||
| Russell 2000® Index | 6.71% | 12.87% | 0.68% | 5.76% | |||||||||||||
| (reflects no deduction for fees and expenses) | |||||||||||||||||
| Russell Microcap® Index | 2.11% | 10.29% | (3.07)% | 2.47% | |||||||||||||
| (reflects no deduction for fees and expenses) | |||||||||||||||||
Performance data quoted represents past performance; past performance does not guarantee future results. The investment return and principal value of an investment will fluctuate so that an investor’s shares, when redeemed, may be worth more or less than their original cost. Current performance of the Fund may be lower or higher than the performance quoted. Performance data current to the most recent month end may be obtained by calling 800-331-8936.
| * | The graph illustrates the performance of a hypothetical $10,000 investment made in the Fund at inception (August 30, 2004) through October 31, 2011. Assumes reinvestment of dividends and capital gains, but does not reflect the effect of any applicable sales charge or redemption fees. The graph does not imply any future performance. | |
| ** | The chart and tables do not reflect the deduction of taxes that a shareholder would pay on the Fund’s distributions or the redemption of Fund shares. |
Perritt Emerging Opportunities Fund
19
Ten Largest Common Stock Holdings (Unaudited) |
GBS Enterprises, Inc. (GBSX) offers software technology and training services, particularly in the areas of software development tools, point-of-care electronic health record software, and sales training.
Datalink Corp. (DTLK) provides data center solutions and services to mid and large-size companies in the United States. It engages in assessing, designing, deploying, and supporting infrastructures, such as servers, storage, and networks, and reselling hardware and software from original equipment manufacturers.
Quadrant 4 Systems Corp. (QFOR) operates in the information technology (IT) and IT enabled services sector in the United States. It intends to provide IT consulting services, managed services, software product architecture; software development, maintenance, and outsourcing services, and industry-specific software solutions primarily to enterprises operating in health care, telecommunications, and financial services industries.
Pacific Premier Bancorp, Inc. (PPBI) operates as the holding company for Pacific Premier Bank in Southern California. As of July 27, 2011 the company operated nine depository branches located in the cities of Costa Mesa, Huntington Beach, Los Alamitos, Newport Beach, Palm Desert, Palm Springs, San Bernardino, and Seal Beach.
B of I Holding Inc. (BOFI) operates as the holding company for B of I Federal Bank that provides various consumer and wholesale banking services primarily through the Internet in the United States. It serves approximately 36,000 retail deposit and loan customers across 50 states.
Innodata Isogen Inc. (INOD) provides publishing and related information technology (IT), knowledge process outsourcing (KPO), and consulting services that help media, publishing, and information services companies to create, manage, and distribute their products. Its publishing services include digitization, conversion, composition, data modeling, and XML encoding, and editorial services, including authoring original material for publishers. The company offers its publishing services to manufacturers of reading devices in the eBook market, as well as to manufacturers of tablet computers.
Trinity Biotech (TRIB) develops, manufactures and sells diagnostic test kits and instrumentation for the point-of-care and clinical laboratory segments of the diagnostic market. The company offers clinical laboratory products, including diagnostic tests and instrumentation, which detect autoimmune, infectious, and sexually transmitted diseases, diabetes and hemoglobin disorders; and disorders of the liver and intestine. It also sells raw materials to the life sciences industry and research institutes.
Reading International (RDI) engages in the development, ownership, and operation of entertainment and real property assets in the United States, Australia, and New Zealand. It operates multiplex theatres, and is involved in real estate development, as well as the rental of retail, commercial, and live theater assets.
Newtek Business Services, Inc. (NEWT) provides business services to the small-and medium-sized business markets in the United States. It provides electronic payment processing services and ancillary processing equipment and software to merchants who accept credit cards, debit cards, checks, and other non-cash forms of payment. The company also provides shared and dedicated hosting services under the CrystalTech brand name. In addition, it originates, sells, and services small businesses loans by the U.S. Small Business Administration.
US Home Systems Inc. (USHS) engages in the design, manufacture, sale, and installation of custom specialty home improvement products in the United States. It offers kitchen refacing products, bathroom refacing products, home organization products for garages and closets, and deck products. The company’s products and installed services are marketed through The Home Depot stores under a service provider agreement and a product supply agreement.
Fund holdings and/or sector allocations are subject to change at any time and are not recommendations to buy or sell any security.
Please refer to the Schedule of Investments in this report for a complete list of Fund holdings.
Allocation of Portfolio Investments (Unaudited) | October 31, 2011 |
 | |
20
| Schedule of Investments | October 31, 2011 |
| Shares | COMMON STOCKS – 95.88% | Value | |||||
| Aerospace & Defense – 1.46% | |||||||
| 56,271 | CPI Aerostructures, Inc. (a) | $ | 610,540 | ||||
| 50,000 | Kratos Defense & | ||||||
Security Solutions, Inc. (a) | 316,500 | ||||||
| 927,040 | |||||||
| Air Transport – 0.32% | |||||||
| 34,500 | AeroCentury Corp. (a) | 201,825 | |||||
| Auto Parts & Equipment – 0.56% | |||||||
| 108,000 | SORL Auto Parts, Inc. (a) | 357,480 | |||||
| Biotechnology – 2.31% | |||||||
| 155,000 | BioClinica, Inc. (a) | 692,850 | |||||
| 75,000 | Trinity Biotech PLC – ADR | 769,500 | |||||
| 1,462,350 | |||||||
| Building Materials – 1.16% | |||||||
| 135,600 | U.S. Home Systems, Inc. | 731,562 | |||||
| Business Services – 13.37% | |||||||
| 100,000 | Datalink Corp. (a) | 948,000 | |||||
| 366,085 | Fortune Industries, Inc. (a) | 189,998 | |||||
| 600,000 | GBS Enterprises, Inc. | ||||||
| (Acquired 2/24/2011, | |||||||
Cost $750,000) (a)(b) | 1,530,000 | ||||||
| 56,944 | GP Strategies Corporation (a) | 673,078 | |||||
| 224,334 | Innodata Isogen, Inc. (a) | 785,169 | |||||
| 591,631 | Newtek Business Services, Inc. (a) | 733,622 | |||||
| 167,760 | Onvia, Inc. (a) | 488,181 | |||||
| 55,000 | Perceptron, Inc. (a) | 311,025 | |||||
| 2,500,000 | Quadrant 4 Systems Corp. | ||||||
| (Acquired 1/19/2011, | |||||||
Cost $500,000) (a)(b)(c)(d) | 862,500 | ||||||
| 93,199 | RCM Technologies, Inc. (a) | 448,287 | |||||
| 30,000 | Rentrak Corporation (a) | 409,800 | |||||
| 208,000 | SmartPros Ltd. | 424,320 | |||||
| 770,855 | WidePoint Corp. (a) | 655,227 | |||||
| 8,459,207 | |||||||
| Chemical & Related Products – 2.85% | |||||||
| 100,000 | Flexible Solutions International, Inc. | ||||||
| (Acquired 4/13/2005, | |||||||
Cost $354,450) (a)(b) | 285,000 | ||||||
| 114,520 | Flexible Solutions International, Inc. (a) | 326,382 | |||||
| 40,000 | KMG Chemicals, Inc. | 581,600 | |||||
| 41,500 | TOR Minerals International, Inc. (a) | 609,220 | |||||
| 1,802,202 | |||||||
| Computers & Electronics – 7.43% | |||||||
| 290,000 | ADDvantage Technologies | ||||||
Group, Inc. (a) | 627,850 | ||||||
| 90,100 | Astro-Med, Inc. | 718,998 | |||||
| 116,100 | Concurrent Computer Corporation (a) | 486,459 | |||||
| 65,000 | Cyberoptics Corp. (a) | 529,750 | |||||
| 275,000 | Dot Hill Systems Corp. (a) | 473,000 | |||||
| 338,500 | NAPCO Security Technologies, Inc. (a) | 704,080 | |||||
| 35,000 | Rimage Corp. | 388,500 | |||||
| 148,340 | Socket Mobile, Inc. (a) | 334,507 | |||||
| 40,000 | Williams Controls, Inc. | 444,000 | |||||
| 4,707,144 | |||||||
| Construction & Engineering – 1.66% | |||||||
| 185,000 | KSW, Inc. | 577,200 | |||||
| Construction & Engineering (Continued) | |||||||
| 66,150 | MFRI, Inc. (a) | 471,649 | |||||
| 1,048,849 | |||||||
| Consumer Products – Distributing – 0.19% | |||||||
| 1,656,300 | China 3C Group (a) | 119,254 | |||||
| Consumer Products – Manufacturing – 4.21% | |||||||
| 49,900 | AT Cross Co. (a) | 606,784 | |||||
| 333,947 | Emerson Radio Corp. (a) | 567,710 | |||||
| 48,641 | Flexsteel Industries | 693,134 | |||||
| 200,000 | Heelys, Inc. | ||||||
| (Acquired 5/5/2010, | |||||||
Cost $458,000) (a)(b) | 398,000 | ||||||
| 435,000 | Sinohub, Inc. (a) | 188,138 | |||||
| 203,800 | Tandy Brands Accessories, Inc. (a) | 210,933 | |||||
| 2,664,699 | |||||||
| Consumer Services – 0.51% | |||||||
| 256,700 | Noah Education Holdings Ltd. – ADR (a) | 323,442 | |||||
| Electronic Equipment & Instruments – 5.23% | |||||||
| 125,000 | Allied Motion Technologies, Inc. | 657,500 | |||||
| 373,700 | Iteris, Inc. (a) | 482,073 | |||||
| 42,000 | LGL Group, Inc. (a) | 333,900 | |||||
| 353,858 | Magnetek, Inc. (a) | 375,089 | |||||
| 67,400 | Schmitt Industries, Inc. (a) | 251,739 | |||||
| 238,000 | Universal Power Group, Inc. (a) | 523,600 | |||||
| 283,600 | Wells-Gardner Electronics Corp. (a) | 686,312 | |||||
| 3,310,213 | |||||||
| Energy & Related Services – 2.78% | |||||||
| 120,000 | Acorn Energy, Inc. | 585,600 | |||||
| 70,000 | CE Franklin Ltd. (a) | 596,400 | |||||
| 40,000 | Mitcham Industries, Inc. (a) | 583,200 | |||||
| 1,765,200 | |||||||
| Energy Equipment & Services – 0.73% | |||||||
| 150,000 | Orion Energy Systems, Inc. (a) | 462,000 | |||||
| Environmental Services – 2.60% | |||||||
| 450,000 | Perma-Fix Environmental Services (a) | 607,500 | |||||
| 1,110,000 | TurboSonic Technologies, Inc. (a)(d) | 432,900 | |||||
| 183,000 | Versar, Inc. (a) | 602,070 | |||||
| 1,642,470 | |||||||
| Financial Services – 7.95% | |||||||
| 55,500 | B of I Holding, Inc. (a) | 849,150 | |||||
| 142,000 | Bank of Commerce Holdings | 489,900 | |||||
| 106,500 | Hennessy Advisors, Inc. | 319,500 | |||||
| 102,000 | HopFed Bancorp, Inc. | 615,060 | |||||
| 120,000 | MicroFinancial, Inc. | 678,000 | |||||
| 130,758 | Pacific Premier Bancorp (a) | 852,542 | |||||
| 260,000 | Riverview Bancorp, Inc. (a) | 603,200 | |||||
| 10,000 | Virtus Investment Partners, Inc. (a) | 624,000 | |||||
| 5,031,352 | |||||||
| Food – 3.49% | |||||||
| 119,000 | G. Willi-Food International Ltd. (a) | 675,920 | |||||
| 81,228 | John B. Sanfilippo & Son, Inc. (a) | 698,561 | |||||
| 100,000 | Overhill Farms, Inc. (a) | 387,000 | |||||
| 149,000 | Willamette Valley Vineyards, Inc. (a) | 448,490 | |||||
| 2,209,971 | |||||||
The accompanying notes to financial statements are an integral part of this schedule.
Perritt Emerging Opportunities Fund
21
| Schedule of Investments Continued | October 31, 2011 |
| Shares | Value | ||||||
| Health Care Providers & Services – 0.97% | |||||||
| 140,101 | Adcare Health Systems, Inc.(a) | $ | 610,840 | ||||
| Leisure – 2.75% | |||||||
| 215,000 | Century Casinos, Inc. (a) | 548,250 | |||||
| 151,000 | Full House Resorts, Inc. (a) | 434,880 | |||||
| 182,500 | Reading International, Inc. (a) | 755,550 | |||||
| 1,738,680 | |||||||
| Medical Supplies & Services – 6.25% | |||||||
| 177,900 | Addus Homecare Corp. (a) | 684,915 | |||||
| 1,032,500 | AdvanSource Biomaterials Corporation (a) | 34,073 | |||||
| 109,000 | Allied Healthcare Products (a) | 390,220 | |||||
| 578,000 | American BIO Medica Corp. (a) | 69,360 | |||||
| 294,104 | American Caresource Holdings, Inc. (a) | 155,875 | |||||
| 39,100 | Birner Dental Management Services, Inc. | 689,920 | |||||
| 104,600 | Carriage Services, Inc. | 623,416 | |||||
| 400,000 | Hooper Holmes, Inc. (a) | 312,000 | |||||
| 86,500 | Lakeland Industries, Inc. (a) | 650,480 | |||||
| 177,300 | PHC, Inc. (a) | 345,735 | |||||
| 3,955,994 | |||||||
| Minerals & Resources – 1.32% | |||||||
| 1,100,000 | Deer Horn Metals, Inc. (a) | 148,984 | |||||
| 190,000 | Vista Gold Corp. (a) | 685,900 | |||||
| 834,884 | |||||||
| Motion Pictures – 0.41% | |||||||
| 69,900 | Ballantyne Strong, Inc. (a) | 260,028 | |||||
| Oil & Gas – 2.21% | |||||||
| 124,500 | American Standard Energy Corp. | ||||||
| (Acquired 2/2/2011, | |||||||
Cost $435,750) (a)(b) | 529,125 | ||||||
| 60,000 | Hallador Energy Co. | 570,000 | |||||
| 290,000 | Magellan Petroleum Corp. (a) | 298,700 | |||||
| 1,397,825 | |||||||
| Retail – 2.05% | |||||||
| 215,000 | 1-800-Flowers.com, Inc. (a) | 612,750 | |||||
| 104,745 | Hastings Entertainment, Inc. (a) | 209,490 | |||||
| 90,000 | PC Mall, Inc.(a) | 474,300 | |||||
| 1,296,540 | |||||||
| Semiconductor Related Products – 4.21% | |||||||
| 90,000 | AXT, Inc. (a) | 423,000 | |||||
| 185,000 | inTEST Corp. (a) | 529,100 | |||||
| 250,000 | On Track Innovations Ltd. (a) | 377,500 | |||||
| 270,000 | Ramtron International Corp. (a) | 645,300 | |||||
| 80,694 | Sparton Corporation (a) | 687,513 | |||||
| 2,662,413 | |||||||
| Software – 5.40% | |||||||
| 78,000 | American Software, Inc. – Class A | 609,960 | |||||
| 360,000 | ARI Network Services, Inc. (a) | 342,000 | |||||
| 100,000 | Bsquare Corp. (a) | 488,000 | |||||
| 70,000 | Clicksoftware Technologies Ltd | 693,000 | |||||
| 80,000 | Evolving Systems, Inc. | 560,000 | |||||
| 245,000 | Navarre Corp. (a) | 377,300 | |||||
| 30,000 | Versant Corp. (a) | 349,500 | |||||
| 3,419,760 | |||||||
| Specialty Manufacturing – 6.97% | |||||||
| 21,500 | Alamo Group, Inc. | 512,775 | |||||
| 131,046 | China Solar & Clean | ||||||
| Energy Solutions, Inc. | |||||||
| (Acquired 3/15/2005, 10/3/2005, | |||||||
and 3/5/2008, Cost $441,000) (a)(b) | 35,382 | ||||||
| 79,700 | Core Molding Technologies, Inc. (a) | 692,593 | |||||
| 139,300 | CTI Industries Corp. | 582,274 | |||||
| 516,190 | Digital Ally, Inc. (a) | 423,998 | |||||
| 33,200 | Friedman Industries | 347,936 | |||||
| 70,000 | Manitex International, Inc. (a) | 302,400 | |||||
| 39,350 | Nobility Homes, Inc. (a) | 239,642 | |||||
| 32,000 | Northern Technologies | ||||||
International Corp. (a) | 464,000 | ||||||
| 246,500 | RF Monolithics, Inc. (a) | 236,640 | |||||
| 13,000 | Universal Stainless & | ||||||
Alloy Products, Inc. (a) | 489,450 | ||||||
| 166,667 | Worldwide Energy & | ||||||
| Manufacturing USA, Inc. (Acquired | |||||||
1/26/2010, Cost $749,997) (a)(b) | 65,000 | ||||||
| 46,183 | Worldwide Energy & | ||||||
Manufacturing USA, Inc. (a) | 18,012 | ||||||
| 4,410,102 | |||||||
| Telecommunications – 3.67% | |||||||
| 390,000 | Alvarion Ltd. (a) | 456,300 | |||||
| 170,000 | CalAmp Corp. (a) | 627,300 | |||||
| 320,140 | Management Network | ||||||
Group, Inc. (a) | 669,093 | ||||||
| 79,600 | Micronetics, Inc. (a) | 570,732 | |||||
| 2,323,425 | |||||||
| Transportation – 0.86% | |||||||
| 112,535 | Vitran Corp, Inc. (a) | 545,795 | |||||
| TOTAL COMMON STOCKS | |||||||
| (Cost 67,794,114) | $ | 60,682,546 | |||||
| PREFERRED STOCKS – 0.32% | |||||||
| Waste Management | |||||||
| 20,000 | Pure Earth, Inc. Preferred Shares | ||||||
(Acquired 11/30/2009, Cost $200,000) (b)(c) | $ | 200,000 | |||||
| TOTAL PREFERRED STOCKS | |||||||
| (Cost, $200,000) | $ | 200,000 | |||||
The accompanying notes to financial statements are an integral part of this schedule.
22
| Schedule of Investments Continued | October 31, 2011 |
| Contracts | WARRANTS – 1.00% | Value | |||||
| Oil & Gas | |||||||
| 35,625 | American Standard Energy Corp. Warrant A | ||||||
| (Acquired 2/24/2011, Cost $0) | |||||||
| Expiration: 12/31/2012, | |||||||
Exercise Price: $5.00 (a)(b)(c) | $ | — | |||||
| 35,625 | American Standard Energy Corp. Warrant B | ||||||
| (Acquired 2/24/2011, Cost $0) | |||||||
| Expiration: 12/31/2012, | |||||||
Exercise Price: $6.50 (a)(b)(c) | — | ||||||
| Business Services | |||||||
| 600,000 | GBS Enterprises, Inc. Warrant | ||||||
| (Acquired 2/24/2011, Cost $0) | |||||||
| Expiration: 2/22/2014, | |||||||
Exercise Price: $1.50 (a)(b)(c) | 630,000 | ||||||
| 1,666,667 | Quadrant 4 Systems Corp. Warrant | ||||||
| (Acquired 1/18/2011, Cost $0) | |||||||
| Expiration: 1/1/2016, | |||||||
Exercise Price: $0.60 (a)(b)(c) | — | ||||||
| Consumer Products – Manufacturing | |||||||
| 52,500 | Sinohub, Inc. Warrant | ||||||
| (Acquired 3/21/2011, Cost $0) | |||||||
| Expiration: 1/18/2016, | |||||||
Exercise Price: $0.60 (a)(b)(c) | — | ||||||
| Specialty Manufacturing | |||||||
| 418,518 | Worldwide Energy & Manufacturing | ||||||
| USA, Inc. Warrant | |||||||
| (Acquired 1/26/2010, Cost $0) | |||||||
| Expiration: 1/26/2015, | |||||||
Exercise Price: $5.65 (a)(b)(c) | — | ||||||
| TOTAL WARRANTS | |||||||
| (Cost $0) | $ | 630,000 | |||||
| Principal | Value | ||||||
| Amount | FIXED INCOME SECURITIES – 0.40% | ||||||
| Real Estate Investment Trust – 0.40% | |||||||
| $ | 250,000 | Monmouth Capital Corporation | |||||
| (Acquired 3/30/2005, Cost $250,000) | |||||||
8.00%, 3/30/2015 (b)(c) | $ | 250,000 | |||||
| TOTAL FIXED INCOME SECURITIES | |||||||
| (Cost $250,000) | $ | 250,000 | |||||
| Shares | SHORT TERM INVESTMENTS – 2.57% | Value | |||||
| 1,631,459 | Fidelity Institutional Money | ||||||
| Market Fund, 0.10% | $ | 1,631,459 | |||||
| TOTAL SHORT TERM INVESTMENTS | |||||||
| (Cost $1,631,459) | $ | 1,631,459 | |||||
| Total Investments | |||||||
| (Cost $69,875,573) – 100.17% | $ | 63,394,005 | |||||
| Liabilities in Excess of | |||||||
Other Assets – (0.17)% | (104,505 | ) | |||||
TOTAL NET ASSETS – 100.00% | $ | 63,289,500 | |||||
Percentages are stated as a percent of net assets.
| ADR | American Depository Receipt | |
| (a) | Non-income producing security. | |
| (b) | Restricted under Rule 144A of the Securities Act of 1933. Such securities may be sold in transactions exempt from registration, normally to qualified institutional buyers. See Note 6 of the Notes to Financial Statements. | |
| (c) | The prices for these securities were derived from an estimate of fair market value using methods approved by the Fund’s Board of Directors. These securities represent $1,942,500 or 3.07% of the Fund’s net assets. | |
| (d) | Affiliated issuer. See Note 10 of the Notes to Financial Statements. | |
The industry classifications listed above are in accordance with Global Industry Classification Standard (GICS®), which was developed by and/or is the exclusive property of MSCI, Inc. and Standard & Poor Financial Services LLC (“S&P”).
The accompanying notes to financial statements are an integral part of this schedule.
Perritt Emerging Opportunities Fund
23
| Statement of Operations |
For the Year Ended October 31, 2011
| Investment Income: | ||||
| Dividend income | ||||
| Unaffiliated issuers | $ | 482,431 | ||
| Affiliated issuers | — | |||
| Less: Foreign tax withheld | (2,640 | ) | ||
| Interest income | 25,671 | |||
| Total investment income | 505,462 | |||
| Expenses: | ||||
| Investment advisory fee | 1,142,164 | |||
| Shareholder servicing | 100,208 | |||
| Directors’ fees and expenses | 50,017 | |||
| Fund accounting expenses | 43,459 | |||
| Federal & state registration fees | 42,250 | |||
| Administration fee | 37,559 | |||
| Printing and mailing expenses | 27,310 | |||
| Legal fees | 22,697 | |||
| Payroll expense ** | 20,989 | |||
| Audit fees | 13,010 | |||
| Custodian fees | 12,929 | |||
| Other expense | 10,632 | |||
| Total expenses | 1,523,224 | |||
| Net investment loss | (1,017,762 | ) | ||
| Realized and Unrealized Gain (Loss) on Investments: | ||||
| Realized gain on investments | ||||
| Unaffiliated issuers | 4,784,214 | |||
| Affiliated issuers | — | |||
| Change in unrealized depreciation on investments | (1,073,523 | ) | ||
| Net realized and unrealized gain on investments | 3,710,691 | |||
| Net Increase in Net Assets Resulting from Operations | $ | 2,692,929 | ||
** Chief Compliance Officer compensation
The accompanying notes to financial statements are an integral part of this statement.
| Financial Highlights |
For a Fund share outstanding throughout the period
| For the Years Ended October 31, | ||||||||||||||||||||
| 2011 | 2010 | 2009 | 2008 | 2007 | ||||||||||||||||
| Net asset value, beginning of period | $ | 11.10 | $ | 8.14 | $ | 6.42 | $ | 16.45 | $ | 14.35 | ||||||||||
| Income (loss) from investment operations: | ||||||||||||||||||||
Net investment loss2 | (0.15 | ) | (0.06 | ) | (0.03 | )2 | (0.16 | )2 | (0.06 | )2 | ||||||||||
Net realized and unrealized gain (loss) on investments4 | (0.06 | ) | 3.02 | 1.75 | (8.28 | ) | 2.90 | |||||||||||||
| Total from investment operations | (0.21 | ) | 2.96 | 1.72 | (8.44 | ) | 2.84 | |||||||||||||
| Less dividends and distributions: | ||||||||||||||||||||
| Distributions from net realized gains | — | — | — | (1.59 | ) | (0.76 | ) | |||||||||||||
| Total dividends and distributions | — | — | — | (1.59 | ) | (0.76 | ) | |||||||||||||
Redemption fees2 | 0.01 | — | 3 | — | 3 | — | 3 | 0.02 | ||||||||||||
| Net asset value, end of period | $ | 10.90 | $ | 11.10 | $ | 8.14 | $ | 6.42 | $ | 16.45 | ||||||||||
Total return1 | (1.80 | %) | 36.36 | % | 26.79 | % | (56.37 | %) | 21.13 | % | ||||||||||
| Supplemental data and ratios: | ||||||||||||||||||||
| Net assets, end of period (in thousands) | $ | 63,290 | $ | 96,532 | $ | 64,002 | $ | 40,794 | $ | 119,323 | ||||||||||
| Ratio of net expenses to average net assets: | 1.65 | % | 1.72 | % | 2.12 | % | 1.87 | % | 1.59 | % | ||||||||||
| Ratio of net investment loss to average net assets: | (1.11 | %) | (0.57 | %) | (0.07 | %) | (1.42 | %) | (0.41 | %) | ||||||||||
| Portfolio turnover rate | 17.9 | % | 29.0 | % | 19.6 | % | 13.2 | % | 34.4 | % | ||||||||||
| 1 | Total return reflects reinvested dividends but does not reflect the impact of taxes. | |
| 2 | Net investment loss and redemption fees per share has been calculated based on average shares outstanding during the period. | |
| 3 | Amount is less than $0.01 per share. | |
| 4 | Realized and unrealized gains and losses per share in this caption are balancing amounts necessary to reconcile the change in net asset value per share for the period, and may not reconcile with the aggregate gains and losses in the Statement of Operations due to share transactions for the period. |
The accompanying notes to financial statements are an integral part of this schedule.
24
| Statements of Changes in Net Assets | ||||||||
| For the | For the | |||||||
| Year Ended | Year Ended | |||||||
| October 31, 2011 | October 31, 2010 | |||||||
| Operations: | ||||||||
| Net investment loss | $ | (1,017,762 | ) | $ | (443,082 | ) | ||
| Net realized gain on investments | 4,784,214 | 4,020,190 | ||||||
| Net increase (decrease) in unrealized depreciation on investments | (1,073,523 | ) | 20,067,182 | |||||
| Net increase in net assets resulting from operations | 2,692,929 | 23,644,290 | ||||||
| Dividends and Distributions to Shareholders: | ||||||||
| Net realized gains | — | — | ||||||
| Total dividends and distributions | — | — | ||||||
| Capital Share Transactions: | ||||||||
| Proceeds from shares issued | ||||||||
| (3,258,982 and 3,586,523 shares, respectively) | 40,567,358 | 35,363,720 | ||||||
| Cost of shares redeemed | ||||||||
| (6,149,554 and 2,752,281 shares, respectively) | (76,542,509 | ) | (26,489,193 | ) | ||||
| Reinvestment of distributions | ||||||||
| (0 and 0 shares, respectively) | — | — | ||||||
| Redemption fees | 39,341 | 11,713 | ||||||
| Net increase (decrease) in net assets from capital share transactions | (35,935,810 | ) | 8,886,240 | |||||
| Total Increase (Decrease) in Net Assets | (33,242,881 | ) | 32,530,530 | |||||
| Net Assets | ||||||||
| Beginning of the Period | 96,532,381 | 64,001,851 | ||||||
End of the Period (including undistributed net investment | ||||||||
| loss of ($0) and ($41), respectively) | $ | 63,289,500 | $ | 96,532,381 | ||||
The accompanying notes to financial statements are an integral part of these statements.
| Statement of Assets and Liabilities |
October 31, 2011
| Assets: | ||||
| Investments at value | ||||
| Unaffiliated issuers (cost $68,443,813) | $ | 62,098,605 | ||
| Affiliated issuers (cost $1,431,760) | 1,295,400 | |||
| Cash | 10,000 | |||
| Receivable for investments sold | 212,277 | |||
| Receivable for fund shares issued | 16,559 | |||
| Dividends and interest receivable | 4,420 | |||
| Prepaid expenses | 19,207 | |||
| Total Assets | 63,656,468 | |||
| Liabilities: | ||||
| Payable for investments purchased | 193,206 | |||
| Payable to Advisor | 64,195 | |||
| Accrued expenses and other liabilities | 50,473 | |||
| Payable for fund shares purchased | 38,593 | |||
| Payable to Directors | 15,503 | |||
| Payable to Chief Compliance Officer | 4,998 | |||
| Total Liabilities | 366,968 | |||
| Net Assets | $ | 63,289,500 | ||
| Net Assets Consist of: | ||||
| Capital stock | $ | 71,849,240 | ||
| Accumulated undistributed net realized loss on investments sold | (2,078,172 | ) | ||
| Net unrealized depreciation on investments | (6,481,568 | ) | ||
| Total Net Assets | $ | 63,289,500 | ||
| Capital shares issued and outstanding, $0.0001 par value; 100,000,000 shares authorized | 5,805,287 | |||
| Net asset value per share | $ | 10.90 | ||
The accompanying notes to financial statements are an integral part of this statement.
Perritt Emerging Opportunities Fund
25
| Notes to Financial Statements |
October 31, 2011
Perritt Funds, Inc., which consists solely of the Perritt Emerging Opportunities Fund (the “Fund”), was formed under the laws of the state of Maryland, and is registered under the Investment Company Act of 1940 as an open-end diversified management investment company.
| 1. | Summary of Significant Accounting Policies |
| a. | Exchange-listed securities are generally valued at the last sales price reported by the principal security exchange on which the issue is traded, or if no sale is reported, the mean between the latest bid and ask price unless the Fund’s investment advisor believes that the mean does not represent a fair value, in which case the securities are fair valued as set forth below. Securities listed on NASDAQ are valued at the NASDAQ Official Closing Price. Demand notes, commercial paper, U.S. Treasury Bills and warrants are stated at fair value using market prices if available, or a pricing service when such prices are believed to reflect fair value. Securities for which market quotations are not readily available are valued at their fair value as determined in good faith by the Fund’s advisor under procedures established by and under the supervision of the Board of Directors of the Fund. The Fund’s fair value procedures allow for the use of certain methods performed by the Fund’s advisor to value those securities for which market quotations are not readily available, at a price that the Fund might reasonably expect to receive upon a sale of such securities. For example, these methods may be based on a multiple of earnings, or a discount from market of a similar freely traded security, or a yield to maturity with respect to debt issues, or a combination of these and other methods. |
| b. | Net realized gains and losses on securities are computed using the first-in, first-out method. |
| c. | Dividend income is recognized on the ex-dividend date, and interest income is recognized on the accrual basis. Withholding taxes on foreign dividends and capital, which are included as a component of net investment income and realized gain (loss) on investments, respectively, have been provided for in accordance with the Fund’s understanding of the applicable country’s tax rules and rates. Discounts and premiums on securities purchased are amortized over the life of the respective securities. Investment and shareholder transactions are recorded on the trade date. |
| d. | Provision has not been made for federal income tax since the Fund has elected to be taxed as a “regulated investment company” and intends to distribute substantially all income to its shareholders and otherwise comply with the provisions of the Internal Revenue Code applicable to regulated investment companies. |
| e. | The preparation of financial statements in conformity with accounting principles generally accepted in the United States of America (“GAAP”) requires management to make estimates and assumptions that affect the reported amounts of assets and liabilities and disclosure of contingent assets and liabilities at the date of the financial statements and reported amounts of increases and decreases in net assets from operations during the reporting period. Actual results could differ from those estimates. |
In preparing these financial statements, the Fund has evaluated events and transactions for potential recognition or disclosure through the date the financial statements were issued. Management determined that there were no events that impacted the Fund’s Financial Statements.
| f. | Dividends from net investment income and net realized capital gains, if any, are declared and paid annually. Distributions to shareholders are recorded on the ex-dividend date. The Fund may periodically make reclassifications among certain of its capital accounts as a result of the timing and characterization of certain income and realized gain distributions determined annually in accordance with federal tax regulations which may differ from GAAP. The Fund has reclassified its net investment loss for the year ended October 31, 2011 by increasing accumulated net investment income by $1,017,803, increasing accumulated net realized losses by $40, and decreasing capital stock by $1,017,763. |
| g. | As of and during the year ended October 31, 2011, the Fund did not have a liability for any unrecognized tax benefits. The Fund recognizes interest and penalties, if any, related to unrecognized tax benefits as income tax expense on the Statement of Operations. During the year, the Fund did not incur any interest or penalties. The Fund is not subject to examination by U.S. federal tax authorities for any tax years before 2007. |
| 2. | Security Valuation |
GAAP establishes an authoritative definition of fair value and sets out a hierarchy for measuring fair value. GAAP also requires additional disclosures about the various inputs used to develop the measurements of fair value. These inputs are summarized in the three broad levels listed below:
| • Level 1 – | Quoted prices in active markets for identical securities. |
26
| Notes to Financial Statements Continued |
| • Level 2 – | Other significant observable inputs (including quoted prices for similar securities or the identical security on an inactive market, interest rates, prepayment speeds, credit risk, etc.). | |
| • Level 3 - | Significant unobservable inputs (including the Fund’s own assumptions in determining the fair value of investments). |
The inputs or methodology used for valuing securities are not necessarily an indication of the risk associated with investing in those securities. The following is a summary of the inputs used to value the Fund’s net assets as of October 31, 2011:
| Description | Level 1 | Level 2 | Level 3 | Total | ||||||||||||
| Investments in Securities | ||||||||||||||||
| Common Stocks* | ||||||||||||||||
| Consumer Discretionary | $ | 8,591,664 | $ | 793,207 | $ | — | $ | 9,384,871 | ||||||||
| Consumer Staples | 2,209,971 | — | — | 2,209,971 | ||||||||||||
| Energy | 2,577,425 | — | — | 2,577,425 | ||||||||||||
| Financial | 5,031,352 | — | — | 5,031,352 | ||||||||||||
| Health Care | 4,065,368 | 689,919 | — | 4,755,287 | ||||||||||||
| Industrials | 11,391,871 | 189,998 | — | 11,581,869 | ||||||||||||
| Information Technology | 17,134,341 | 3,376,365 | — | 20,510,706 | ||||||||||||
| Materials | 4,631,065 | — | — | 4,631,065 | ||||||||||||
| Total Common Stocks | 55,633,057 | 5,049,489 | — | 60,682,546 | ||||||||||||
| Preferred Stock* | ||||||||||||||||
| Industrials | — | — | 200,000 | 200,000 | ||||||||||||
| Total Preferred Stock | — | — | 200,000 | 200,000 | ||||||||||||
| Fixed Income | ||||||||||||||||
| Real Estate Investment Trusts | — | — | 250,000 | 250,000 | ||||||||||||
| Total Fixed Income | — | — | 250,000 | 250,000 | ||||||||||||
| Warrants* | ||||||||||||||||
| Information Technology | — | 630,000 | — | 630,000 | ||||||||||||
| Total Warrants | — | 630,000 | — | 630,000 | ||||||||||||
| Short Term Investments | 1,631,459 | — | — | 1,631,459 | ||||||||||||
| Total Investments in Securities | $ | 57,264,516 | $ | 5,679,489 | $ | 450,000 | $ | 63,394,005 | ||||||||
* Refer to the Schedule of Investments for additional information regarding industry classifications.
| Transfers into Level 1 | $ | 1,034,593 | Transfers into Level 2 | $ | 4,186,989 | ||||
| Transfers out of Level 1 | (4,186,989 | ) | Transfers out of Level 2 | (1,034,593 | ) | ||||
| Net transfers in and/or out of Level 1 | $ | (3,152,396 | ) | Net transfers in and/or out of Level 2 | $ | 3,152,396 |
The securities transferred from Level 1 to Level 2 are due to the securities not trading on the last day of the fiscal year end.
The securities transferred from Level 2 to Level 1 are due to an increase of observable market data from an increase in market activity. Transfers between levels are recognized at the end of the reporting period.
Below is a reconciliation that details the activity of the securities in Level 3 since the adoption of the pronouncement on November 1, 2010 to October 31, 2011:
| Beginning Balance – November 1, 2010 | $ | 450,000 | ||
| Net purchases/(sales) | — | |||
| Transfers in/(out) of level 3 | — | |||
| Total realized and unrealized gains/(losses) | — | |||
| Accrued accretion/(amortization) | — | |||
| Ending Balance – October 31, 2011 | $ | 450,000 |
| 3. | Investment Advisory Agreement |
The Fund has an investment advisory agreement with Perritt Capital Management, Inc. (“PCM” or “Advisor”), with whom certain officers and directors of the Fund are affiliated. Under the terms of this agreement, the Fund pays an annual investment advisory fee equal to 1.25% of its average net assets less than or equal to $100 million; 1.00% with respect to average net assets in excess of $100 million and less than or equal to $200 million; and 0.50% with respect to average net
Perritt Emerging Opportunities Fund
27
| Notes to Financial Statements Continued |
assets in excess of $200 million. At October 31, 2011, the Fund had fees due to PCM of $64,195. For the year ended October 31, 2011, the Fund incurred advisory fees of $1,142,164 pursuant to the investment advisory agreement.
PCM manages the Fund’s investments subject to the supervision of the Fund’s Board of Directors. PCM is responsible for investment decisions and supplies investment research and portfolio management. Under the investment advisory agreement, PCM, at its own expense and without reimbursement from the Fund, will furnish office space and all necessary office facilities, equipment and personnel for making the investment decisions necessary for managing the Fund and maintaining its organization, will pay the salaries and fees of all officers and directors of the Fund (except the Chief Compliance Officer’s Salary and the fees paid to disinterested directors) and will bear all sales and promotional expenses of the Fund.
| 4. | Investment Transactions |
Purchases and sales of securities, excluding short-term investments, for the year ended October 31, 2011 were as follows:
| Purchases | Sales | ||||||||||||||
| U.S. Government | Other | U.S. Government | Other | ||||||||||||
| $ | — | $ | 15,766,728 | $ | — | $ | 50,438,767 | ||||||||
| 5. | Federal Income Tax Matters |
As of October 31, 2011, the components of distributable earnings on a tax basis were as follows:
| Cost of investments for tax purposes | $ | 69,884,780 | ||
| Gross tax unrealized appreciation | $ | 13,094,526 | ||
| Gross tax unrealized depreciation | (19,585,301 | ) | ||
| Net tax unrealized depreciation on investment | (6,490,775 | ) | ||
| Distributable ordinary income | — | |||
| Distributable long-term capital gains | — | |||
| Total distributable earnings | — | |||
| Other accumulated losses | (2,068,965 | ) | ||
| Total accumulated losses | $ | (8,559,740 | ) |
The difference between book and tax basis distributable earnings are primarily related to the deferral of losses on wash sales.
The tax composition of distributions paid during the years ended October 31, 2011 and 2010 were as follows:
| Year Ended October 31, 2011 | Year Ended October 31, 2010 | |||||||
| Ordinary Income | $ | — | $ | — | ||||
| Long Term Capital Gain | — | — | ||||||
As of October 31, 2011, the Fund had capital losses expiring as indicated below:
| Date of Expiration | Amount | |||
| October 31, 2017 | $ | 2,068,965 | ||
| 6. | Restricted Securities |
The Fund owns investment securities which are unregistered and thus restricted as to resale. These securities are valued by the Fund after giving due consideration to pertinent factors including recent private sales, market conditions and the issuer’s financial performance. Where future disposition of these securities requires registration under the Securities Act of 1933, the Fund has the right to include these securities in such registration, generally without cost to the Fund. The Fund has no right to require registration of the unregistered securities it holds. At October 31, 2011, the Fund held restricted securities with an aggregate market value of $4,769,389 or 7.54% of the Fund’s net assets.
| 7. | Guarantees and Indemnifications |
Under the Fund’s organizational documents, its officers and directors are indemnified by the Fund against certain liabilities arising out of the performance of their duties to the Fund. Additionally, in the normal course of business, the Fund enters into contracts with service providers that contain general indemnification clauses. The Fund’s maximum exposure under these arrangements is unknown as this would involve future claims that may be made against the Fund that have not yet occurred. Currently, the Fund expects the risk of loss to be remote.
28
| Notes to Financial Statements Continued |
| 8. | Line of Credit Arrangement |
The Fund is party to an uncommitted line of credit agreement with U.S. Bank, N.A., expiring December 15, 2012, and renewed annually thereafter, under which the Fund may borrow up to the lesser of $4,500,000, 5% of the net assets of the Fund, 5% of the market value of the assets, or 33.33% of the sum of the market value of the certain assets of the Fund. Interest is charged on borrowings at the prevailing Prime Rate. The Fund has borrowed under these agreements from time to time to increase the efficiency of cash flow management. For the period from November 1, 2010 to October 31, 2011, the Fund had average borrowings of $114,764 and the weighted average interest rate on the line of credit borrowings was 3.25%. At October 31, 2011, the Fund had no outstanding borrowings on the line of credit.
| 9. | Redemption Fee |
The Fund charges a 2% redemption fee to those who buy and sell shares within 90 calendar days or less. The redemption fee is retained for the benefit of long-term shareholders, and recorded as additional capital in the Statement of Changes in Net Assets.
| 10. | Transactions with Affiliates |
The following issuers were affiliated with the Perritt Emerging Opportunities Fund, as the Fund held 5% or more of the outstanding voting securities of the issuer during the period from November 1, 2010 through October 31, 2011. See Section (2)(a)(3) of the Investment Company Act of 1940.
| Share Balance at | Share Balance at | Dividend | Value at | ||||
| Issuer Name | November 1, 2010 | Additions | Reductions | October 31, 2011 | Income | October 31, 2011 | |
| TurboSonic Technologies, Inc. | 578,000 | 532,000 | — | 1,110,000 | $— | $ 432,900 | |
| Quadrant 4 Systems Corp. | — | 2,500,000 | — | 2,500,000 | — | 862,500 | |
| $1,295,400 |
| Report of Independent Registered Public Accounting Firm |
To the Shareholders and Board of Directors
Perritt Emerging Opportunities Fund
We have audited the accompanying statement of assets and liabilities, including the schedule of investments, of the Perritt Emerging Opportunities Fund (the “Fund”), a series of Perritt Funds, Inc., as of October 31, 2011, and the related statement of operations for the year then ended, the statements of changes in net assets for each of the two years in the period then ended, and the financial highlights for each of the three years in the period then ended. These financial statements and financial highlights are the responsibility of Fund management. Our responsibility is to express an opinion on these financial statements and financial highlights based on our audits. The financial highlights for the periods indicated prior to October 31, 2009 were audited by another independent registered public accounting firm, who expressed unqualified opinions on those financial highlights.
We conducted our audits in accordance with the standards of the Public Company Accounting Oversight Board (United States). Those standards require that we plan and perform the audit to obtain reasonable assurance about whether the financial statements and financial highlights are free of material misstatement. An audit includes examining, on a test basis, evidence supporting the amounts and disclosures in the financial statements. Our procedures included confirmation of securities owned as of October 31, 2011 by correspondence with the custodian and brokers or by other appropriate auditing procedures where replies from brokers were not received. An audit also includes assessing the accounting principles used and significant estimates made by management, as well as evaluating the overall financial statement presentation. We believe that our audits provide a reasonable basis for our opinion.
In our opinion, the financial statements and financial highlights referred to above present fairly, in all material respects, the financial position of the Perritt Emerging Opportunities Fund as of October 31, 2011, the results of its operations for the year then ended, the changes in its net assets for each of the two years in the period then ended, and the financial highlights for each of the three years in the period then ended, in conformity with accounting principles generally accepted in the United States of America.
COHEN FUND AUDIT SERVICES, LTD.
Westlake, Ohio
December 21, 2011
Perritt Emerging Opportunities Fund
29
Expense Example (Unaudited) |
October 31, 2011
As a shareholder of the Fund, you incur two types of costs: (1) transaction costs, including sales charges (loads) on purchase payments, reinvested dividends, or other distributions; redemption fees (the Fund imposes a 2.00% redemption fee on shares held for 90 calendar days or less after purchase); and exchange fees; and (2) ongoing costs, including management fees; distribution and/or service fees; and other Fund expenses. This Example is intended to help you understand your ongoing costs (in dollars) of investing in the Fund and to compare these costs with the ongoing costs of investing in other mutual funds. The Example is based on an investment of $1,000 invested at the beginning of the period and held for the entire period (May 1, 2011 – October 31, 2011).
Actual Expenses
The first line of the table below provides information about actual account values and actual expenses. Although the Fund charges no sales load or transaction fees (other than a 2.00% redemption fee for shares held for 90 calendar days or less after purchase), you will be assessed fees for outgoing wire transfers, returned checks and stop payment orders at prevailing rates charged by U.S. Bancorp Fund Services, LLC, the Fund’s transfer agent. If you request that a redemption be made by wire transfer, currently a $15.00 fee is charged by the Fund’s transfer agent. You will be charged a transaction fee equal to 2.00% of the net amount of the redemption if you redeem your shares within 90 calendar days of purchase. IRA accounts will be charged a $15.00 annual maintenance fee. To the extent the Fund invests in shares of other investment companies as part of its investment strategy, you will indirectly bear your proportionate share of any fees and expenses charged by the underlying funds in which the Fund invests in addition to the expenses of the Fund. Actual expenses of the underlying funds are expected to vary among the various underlying funds. These expenses are not included in the example below. The example below includes, but is not limited to, management fees, shareholder servicing fees, fund accounting, custody and transfer agent fees. However, the example below does not include portfolio trading commissions and related expenses, interest expense and other extraordinary expenses as determined under accounting principles generally accepted in the United States of America. You may use the information in this line, together with the amount you invested, to estimate the expenses that you paid over the period. Simply divide your account value by $1,000 (for example, an $8,600 account value divided by $1,000 = 8.6), then multiply the result by the number in the first line under the heading entitled “Expenses Paid During Period” to estimate the expenses you paid on your account during this period.
Hypothetical Example for Comparison Purposes
The second line of the table below provides information about hypothetical account values and hypothetical expenses based on the Fund’s actual expense ratio and an assumed rate of return of 5% per year before expenses, which is not the Fund’s actual return. The hypothetical account values and expenses may not be used to estimate the actual ending account balance or expenses you paid for the period. You may use this information to compare the ongoing costs of investing in the Fund and other funds. To do so, compare this 5% hypothetical example with the 5% hypothetical examples that appear in the shareholder reports of the other funds.
Please note that the expenses shown in the table are meant to highlight your ongoing costs only and do not reflect any transactional costs, such as sales charges (loads), redemption fees, or exchange fees. Therefore, the second line of the table is useful in comparing ongoing costs only, and will not help you determine the relative total costs of owning different funds. In addition, if these transactional costs were included, your costs would have been higher.
| Beginning | Ending | Expenses Paid | |
| Account Value | Account Value | During Period | |
| 5/1/11 | 10/31/11 | 5/1/11 – 10/31/111 | |
| Actual | $1,000.00 | $ 815.30 | $7.96 |
| Hypothetical (5% return before expenses) | 1,000.00 | 1,016.29 | 8.85 |
| 1 | Expenses are equal to the Fund’s annualized expense ratio of 1.75% for the six-month period, multiplied by the average account value over the period, multiplied by 184/365 (to reflect the one-half year period). |
30
Directors and Officers (Unaudited) |
The Funds are governed by a Board of Directors that meets regularly to review investments, performance, expenses, and other business matters, and is responsible for protecting the interests of shareholders. The majority of the Funds’ directors are independent of Perritt Capital Management, Inc. The inside director is an officer of Perritt Capital Management. The Board of Directors elects the Funds’ officers. The business address of each director and officer is 300 South Wacker Drive, Suite 2880, Chicago, IL 60606.
| Position(s) Held | |||||
| with Fund and | Other | ||||
| Number of | Directorships | ||||
| Portfolios in | Held by | ||||
| Fund Complex | Term of Office | Principal | Director | ||
| Name, | Overseen | and Length of | Occupation(s) | during the | |
| Address, and Age | by Director | Time Served | during Past 5 Years | Past 5 Years | |
| Independent Directors of the Fund | |||||
| Dianne C. Click | Director | Indefinite, until | Ms. Click is a licensed Real Estate Broker in the State of Montana. | None | |
| Age: 49 | successor elected; | She has been a partner and a principal owner of a real estate sales | |||
| Portfolios in | 16 years, | company, Bozeman Broker Group, since April 2004. She has been | |||
| Fund Complex | Perritt MicroCap | licensed in the state of Montana since 1995. | |||
| Overseen: 2 | Opportunities Fund; | ||||
| 7 years, | |||||
| Perritt Emerging | |||||
| Opportunities Fund | |||||
| David S. Maglich | Director | Indefinite, until | Mr. Maglich is a Shareholder with the law firm of Fergeson, Skipper, | None | |
| Age: 54 | successor elected; | et. al. in Sarasota, Florida and has been employed with such firm | |||
| Portfolios in | 23 years, | since April 1989. | |||
| Fund Complex | Perritt MicroCap | ||||
| Overseen: 2 | Opportunities Fund; | ||||
| 7 years, | |||||
| Perritt Emerging | |||||
| Opportunities Fund | |||||
| Inside Director of the Fund | |||||
Michael J. Corbett(1) | President | One-year term | Mr. Corbett has been President of the Perritt MicroCap Opportunities | None | |
| Age: 45 | as President; | Fund since November 1999 and President of the Perritt Emerging | |||
| Portfolios in | As Director, indefinite | Opportunities Fund since August 2004. He has served as President of | |||
| Fund Complex | until successor elected; | the Advisor since October 5, 2010, and previously served as Vice | |||
| Overseen: 2 | Director since | President of the Advisor from February 1997 until October 5, 2010. | |||
| October 5, 2010; | Mr. Corbett began his tenure with Perritt Capital Management in 1990 | ||||
| 12 years as President | as a research analyst. He assumed portfolio management | ||||
| of Perritt MicroCap | responsibilities in 1996 and now serves as portfolio manager for | ||||
| Opportunities Fund; | both funds. | ||||
| 7 years as President | |||||
| of Perritt Emerging | |||||
| Opportunities Fund | |||||
| Officers of the Fund other than Mr. Corbett | |||||
| Gerald W. Perritt | Vice President | One-year term; | Dr. Perritt was a director of the Perritt MicroCap Opportunities Fund | N/A | |
| Age: 69 | 12 years as Vice President | and the Perritt Emerging Opportunities Fund from their inception | |||
| of Perritt MicroCap | until October 5, 2010. He has been Vice President of the Perritt | ||||
| Opportunities Fund; | MicroCap Opportunities Fund since November 1999 and Vice | ||||
| 7 years as Vice President | President of the Perritt Emerging Opportunities Fund since August | ||||
| of Perritt Emerging | 2004. He served as President of the Advisor from its inception in 1987 | ||||
| Opportunities Fund | until October 5, 2010. | ||||
| Samuel J. Schulz | Vice President | One-year term | Mr. Schulz has been the Vice President and Treasurer of the Funds | N/A | |
| Age: 69 | and Treasurer | since March 2006. He has served as Chief Financial Officer of the | |||
| 6 years | Advisor since January 2005. From January 2004 to January 2005, | ||||
| Mr. Schulz was a securities analyst for the Advisor. | |||||
| Allison B. Hearst | Secretary | One-year term | Mrs. Hearst has 13 years of experience in the mutual fund industry, | N/A | |
| Age: 48 | including a previous tenure at the Advisor beginning in 1990. Mrs. | ||||
| 2 years | Hearst returned to the Advisor in 2007. | ||||
| Lynn E. Burmeister | Vice President | One-year term | Mrs. Burmeister has been the Chief Compliance Officer since May 1, | N/A | |
| Age: 52 | and Chief | 2010, and oversees all compliance matters for the funds and the advisor. | |||
| Compliance | 2 years | She also coordinates the administration of the Funds and is a liaison | |||
| Officer | with the firm’s corporate counsel. Mrs. Burmeister has worked in the | ||||
| financial industry since 1980. Her previous experience includes work | |||||
| at Harris Associates, Gofen & Glossberg and Optimum Investments. | |||||
(1) Mr. Corbett is an interested person of the Funds based upon his position with the Advisor.
31
MicroCap Opportunities Fund
Emerging Opportunities Fund
The Funds file their complete schedule of portfolio holdings with the Securities and Exchange Commission for the first and third quarters of each fiscal year on Form N-Q. The Funds’ Forms N-Q are available on the Securities and Exchange Commission’s website at http://www.sec.gov and may be reviewed and copied at the Commission’s Public Reference Room in Washington, D.C. Information on the operation of the Public Reference Room may be obtained by calling 1-800-SEC-0330. The Funds’ latest Forms N-Q are also available without charge upon request by calling 1-800-331-8936.
A description of the policies and procedures that the Funds use to determine how to vote proxies relating to portfolio securities is available without charge, upon request, by calling the Advisor at 1-800-331-8936 and on the Securities and Exchange Commission’s website at http://www.sec.gov.
Information regarding how the Funds voted proxies relating to portfolio securities during the most recent 12-month period ended June 30 is available without charge, upon request, by calling 1-800-331-8936 and on the Securities and Exchange Commission’s website at http://www.sec.gov.
Household Delivery of Shareholder Documents: To reduce expenses, the Funds may mail only one copy of the Funds’ prospectus, SAI and each annual and semi-annual report to those addresses shared by two or more accounts. If you wish to receive individual copies of these documents, please call the Funds at 1-800-331-8936 or contact your financial institution. You will begin receiving individual copies thirty days after receiving your request.
Electronic Delivery of Shareholder Documents: You may choose to receive the Funds’ prospectus and annual and semi-annual reports electronically. To sign up for electronic delivery, visit www.icsdelivery.com and select the first letter of your brokerage firm’s name. Then, select your brokerage institution from the list that follows, fill out the appropriate information and provide an e-mail address where you would like your information sent. If your brokerage firm is not listed, electronic delivery may not be available. Please contact your brokerage firm or financial advisor.
Tax Notice
For the year ended October 31, 2011, the Perritt MicroCap Opportunities Fund and Perritt Emerging Opportunities Fund did not pay any interest related dividends under Internal Revenue Code Section 87(k)(1)(c). Additionally, for the year ended October 31, 2011, there were no short-term capital gain distributions designated under Internal Revenue Code Section 871(k)(2)(c).
There were no qualified dividend income distributions under the Jobs and Growth Tax Relief Reconciliation Act of 2003.
Privacy Policy
We collect the following nonpublic personal information about you:
| • | Information we receive from you on or in applications or other forms, including but not limited to, your name, address, phone number, and social security number; and | ||
| • | Information about your transactions with us, our affiliates or others, including but not limited to, your account number and balance, parties to transactions, cost basis information and other financial information. |
We do not disclose any nonpublic personal information about our current or former shareholders to nonaffiliated third parties, except as permitted by law. For example, we are permitted by law to disclose all the information we collect to our transfer agent to process your transactions. Furthermore, we restrict access to your nonpublic personal information to those persons who require such information to provide products or services to you. We maintain physical, electronic, and procedural safeguards through our transfer agent, U. S. Bancorp Fund Services, LLC, that comply with federal standards to guard your nonpublic personal information.
In the event that you hold shares of the Funds through a financial intermediary, including, but not limited to, a broker-dealer, bank or trust company, the privacy policy of your financial intermediary would govern how your nonpublic personal information would be shared with nonaffiliated third parties.
32
|
Investment Advisor
Perritt Capital Management, Inc.
300 South Wacker Drive, Suite 2880
Chicago, IL 60606-6703
800-331-8936
Independent Registered
Public Accounting Firm
Cohen Fund Audit Services, Ltd.
800 Westpoint Parkway, Suite 1100
Westlake, OH 44145-1524
Legal Counsel
Foley & Lardner LLP
777 East Wisconsin Avenue
Milwaukee, WI 53202
Custodian
U.S. Bank, NA
1555 North River Center Drive, Suite 302
Milwaukee, WI 53212
Transfer Agent
and Dividend Disbursing Agent
U.S. Bancorp Fund Services, LLC
P.O. Box 701
Milwaukee, WI 53201-0701
Distributor
Quasar Distributors, LLC
615 East Michigan Street
Milwaukee, WI 53202
For assistance with your existing account, call our Shareholder Service Center at 1-800-332-3133.
The Funds’ Statements of Additional Information contain information about the Funds’ directors and are available without charge upon request by calling 1-800-332-3133.
|
|
MicroCap Opportunities Fund
Emerging Opportunities Fund
Minimum Initial Investment $1,000
IRA Minimum Initial Investment $250
Dividend Reinvestment Plan
Systematic Withdrawal Plan
Automatic Investment Plan
Retirement Plans Including:
| • | IRA | • | Roth IRA |
| • | SEP-IRA | • | Coverdell Education |
| • | Simple IRA | Savings Account |
2% redemption fee imposed for shares
held ninety (90) calendar days or less.
This report is authorized for distribution only to
shareholders and others who have received a copy of the
prospectus of the Perritt MicroCap Opportunities Fund
and/or the Perritt Emerging Opportunities Fund.
300 S. Wacker Drive • Suite 2880 • Chicago, IL 60606-6703
Tel 312-669-1650 • 800-331-8936 • Fax: 312-669-1235
E-mail: PerrittCap@PerrittCap.com
Web Site: www.perrittmutualfunds.com
Item 2. Code of Ethics.
The registrant has adopted a code of ethics that applies to the registrant’s principal executive officer and principal financial officer. The registrant has not made any amendments to its code of ethics during the period covered by this report. The registrant has not granted any waivers from any provisions of the code of ethics during the period covered by this report. Incorporated by reference to the registrant’s Form N-CSR filed January 8, 2010.
Item 3. Audit Committee Financial Expert.
The registrant’s board of directors has determined that the registrant does not have an audit committee financial expert serving on its board of directors, which functions as the registrant’s audit committee since the registrant does not have a separate audit committee.
The board of directors has determined that the members of the board of directors have sufficient background, experience and financial knowledge to fulfill their responsibilities and obligations to the registrant and its shareholders. Accordingly, the board of directors has determined that the search for, and possible appointment of, a person who would satisfy the definition of an audit committee financial expert is not necessary.
Item 4. Principal Accountant Fees and Services.
The registrant has engaged its principal accountant, Cohen Fund Audit Services, Ltd., to perform audit services, audit-related services, and tax services during the past fiscal year. “Audit services” refer to performing an audit of the registrant's annual financial statements or services that are normally provided by the accountant in connection with statutory and regulatory filings or engagements for the fiscal year. “Audit-related services” refer to the assurance and related services by the principal accountant that are reasonably related to the performance of the audit. “Tax services” refer to professional services rendered by the principal accountant for tax compliance, tax advice, and tax planning. The following table details the aggregate fees billed or expected to be billed for each of the last two fiscal years for audit fees, audit-related fees, tax fees and other fees by the principal accountant.
| FYE 10/31/2011 | FYE 10/31/2010 | |
| Audit Fees | $13,500 | $13,000 |
| Audit-Related Fees | $0 | $0 |
| Tax Fees | $2,500 | $2,500 |
| All Other Fees | $0 | $0 |
The percentage of fees billed by Cohen Fund Audit Services, Ltd. for the fiscal years ended October 31, 2011 and October 31, 2010, respectively, applicable to non-audit services pursuant to a waiver of the pre-approval requirement was as follows:
| FYE 10/31/2011 | FYE 10/31/2010 | |
| Audit-Related Fees | 0% | 0% |
| Tax Fees | 0% | 0% |
| All Other Fees | 0% | 0% |
All of the principal accountant’s hours spent on auditing the registrant’s financial statements were attributed to work performed by full-time permanent employees of the principal accountant. The following table indicates the non-audit fees billed or expected to be billed by the registrant’s accountants for services to the registrant and to the registrant’s investment adviser or Service Affiliates (as defined below) for the last two years.
| Non-Audit Related Fees | FYE 10/31/2011 | FYE 10/31/2010 |
| Registrant | $0 | $0 |
| Registrant’s Investment Adviser | $0 | $0 |
Because the registrant’s accountants have not rendered any non-audit services during the last two fiscal years to the registrant’s investment adviser, or any entity controlling, controlled by or under common control with the investment adviser that provides ongoing services to the registrant (together with the registrant’s investment adviser, “Service Affiliates”) that were not pre-approved pursuant to paragraph (c)(7)(ii) of Rule 2-01 of Regulation S-X, the registrant’s board of directors has not considered whether the provision of such services to the registrant’s investment adviser or the Service Affiliates is compatible with maintaining the independence of the registrant’s accountant.
Item 5. Audit Committee of Listed Registrants.
Not applicable to registrants who are not listed issuers (as defined in Rule 10A-3 under the Securities Exchange Act of 1934).
Item 6. Investments.
(a). Schedule of Investments is included as part of the report to shareholders filed under Item 1 of this Form.
(b). Not applicable.
Item 7. Disclosure of Proxy Voting Policies and Procedures for Closed-End Management Investment Companies.
Not applicable to open-end investment companies.
Item 8. Portfolio Managers of Closed-End Management Investment Companies.
Not applicable to open-end investment companies.
Item 9. Purchases of Equity Securities by Closed-End Management Investment Company and Affiliated Purchasers.
Not applicable to open-end investment companies.
Item 10. Submission of Matters to a Vote of Security Holders.
There have been no material changes to the procedures by which shareholders may recommend nominees to the registrant’s board of directors.
Item 11. Controls and Procedures.
The Registrant’s President and Treasurer have reviewed the Registrant's disclosure controls and procedures (as defined in Rule 30a-3(c) under the Investment Company Act of 1940 (the “Act”)) as of a date within 90 days of the filing of this report, as required by Rule 30a-3(b) under the Act and Rules 13a-15(b) or 15d-15(b) under the Securities Exchange Act of 1934. Based on their review, such officers have concluded that the disclosure controls and procedures are effective in ensuring that information required to be disclosed in this report is appropriately recorded, processed, summarized and reported and made known to them by others within the Registrant and by the Registrant’s service provider.
There were no changes in the Registrant's internal control over financial reporting (as defined in Rule 30a-3(d) under the Act) that occurred during the second fiscal quarter of the period covered by this report that has materially affected, or is reasonably likely to materially affect, the Registrant's internal control over financial reporting.
Item 12. Exhibits.
| (a) | (1) Any code of ethics or amendment thereto, that is the subject of the disclosure required by Item 2, to the extent that the registrant intends to satisfy Item 2 requirements through filing an exhibit. Incorporated by reference to the registrant’s Form N-CSR filed January 8, 2010. |
(2) A separate certification for each principal executive and principal financial officer pursuant to Section 302 of the Sarbanes-Oxley Act of 2002. Filed herewith.
(3) Any written solicitation to purchase securities under Rule 23c-1 under the Act sent or given during the period covered by the report by or on behalf of the registrant to 10 or more persons. Not applicable to open-end investment companies.
| (b) | Certifications pursuant to Section 906 of the Sarbanes-Oxley Act of 2002. Furnished herewith. |
SIGNATURES
Pursuant to the requirements of the Securities Exchange Act of 1934 and the Investment Company Act of 1940, the registrant has duly caused this report to be signed on its behalf by the undersigned, thereunto duly authorized.
(Registrant) Perritt Funds, Inc.
By (Signature and Title)* /s/ Michael J. Corbett
Michael J. Corbett, President
Date December 30, 2011
Pursuant to the requirements of the Securities Exchange Act of 1934 and the Investment Company Act of 1940, this report has been signed below by the following persons on behalf of the registrant and in the capacities and on the dates indicated.
By (Signature and Title)* /s/ Michael J. Corbett
Michael J. Corbett, President
Date December 30, 2011
By (Signature and Title)* /s/ Samuel J. Schulz
Samuel J. Schulz, Treasurer
Date December 30, 2011
* Print the name and title of each signing officer under his or her signature.