Exhibit 99.1
Exhibit 99.1
Merrill Lynch 2005 Death Care Conference
April 21, 2005
Presented by:
StoneMor Presentation Team
Lawrence Miller
CEO, President and Chairman of the Board of Directors
William R. Shane
CFO, Executive Vice President and Director
3
Disclaimer
This presentation contains certain statements that may be deemed to be “forward-looking statements” within the meaning of the Securities Acts. All statements, other than statements of historical facts, that address activities, events or developments that the Partnership expects, projects, believes or anticipates will or may occur in the future, including, without limitation, the outlook for population growth and death rates, general industry conditions including future operating results of the Partnership’s properties, capital expenditures, asset sales, expansion and growth opportunities, bank borrowings, financing activities and other such matters, are forward-looking statements. Although the Partnership believes that its expectations stated in this presentation are based on reasonable assumptions, actual results may differ from those projected in the forward-looking statements. For a more detailed discussion of risk factors, please refer to our annual Report on Form 10-K filed with the SEC.
In addition, this presentation contains projections of Distributable Free Cash Flow based upon hypothetical acquisitions by the Partnership. The projected impact of the acquisitions reflect management’s projections as to possible future results based on a number of assumptions that are inherently uncertain, including without limitation the organic growth of the Partnership, the availability of acquisition targets, the purchase prices for the targets, the availability of debt or equity financing from either third parties or the targets and the Partnership’s ability to integrate and manage such acquisitions. The assumptions involve significant elements of subjective judgment and analysis, and no representation is made as to their or the projections’ attainability.
4
Table of Contents
1. Who We Are
2. MLP Structure – Unique Advantages
3. Why We Reorganized
4. Where Do We Go From Here
5. Financial Overview
6. Appendix
5
Who We Are
6
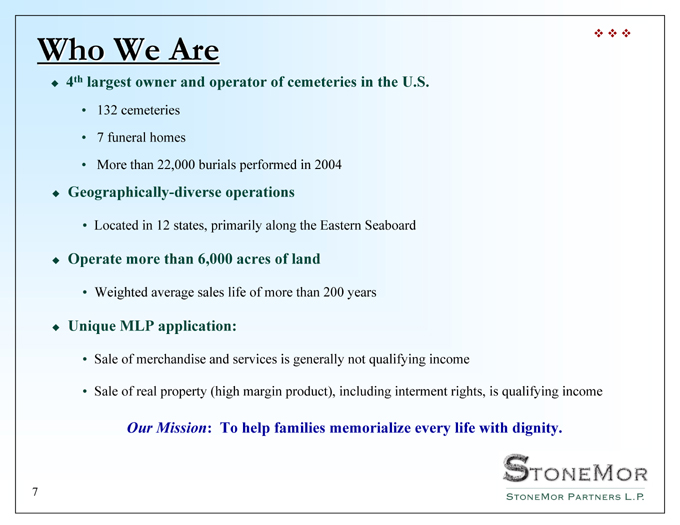
Who We Are
4th largest owner and operator of cemeteries in the U.S.
132 cemeteries 7 funeral homes
More than 22,000 burials performed in 2004
Geographically-diverse operations
Located in 12 states, primarily along the Eastern Seaboard
Operate more than 6,000 acres of land
Weighted average sales life of more than 200 years
Unique MLP application:
Sale of merchandise and services is generally not qualifying income
Sale of real property (high margin product), including interment rights, is qualifying income
Our Mission: To help families memorialize every life with dignity.
7
Who We Are
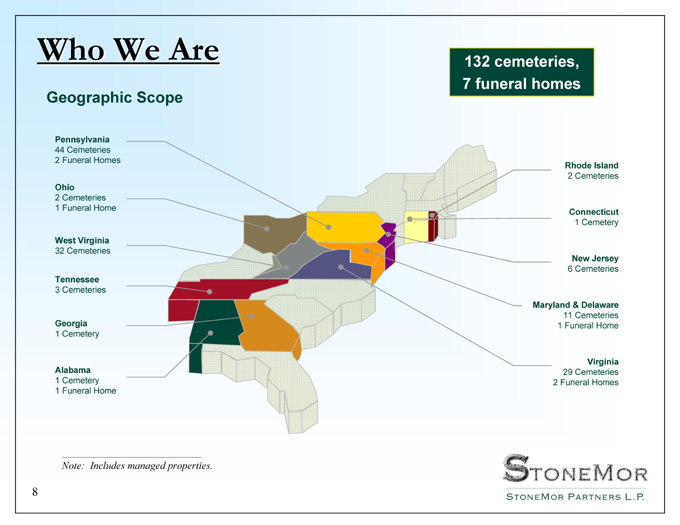
132 cemeteries, 7 funeral homes
Geographic Scope
Pennsylvania
44 Cemeteries 2 Funeral Homes
Ohio
2 Cemeteries 1 Funeral Home
West Virginia
32 Cemeteries
Tennessee
3 Cemeteries
Georgia
1 Cemetery
Alabama
1 Cemetery 1 Funeral Home
Rhode Island
2 Cemeteries
Connecticut
1 Cemetery
New Jersey
6 Cemeteries
Maryland & Delaware
11 Cemeteries 1 Funeral Home
Virginia
29 Cemeteries 2 Funeral Homes
Note: Includes managed properties.
8
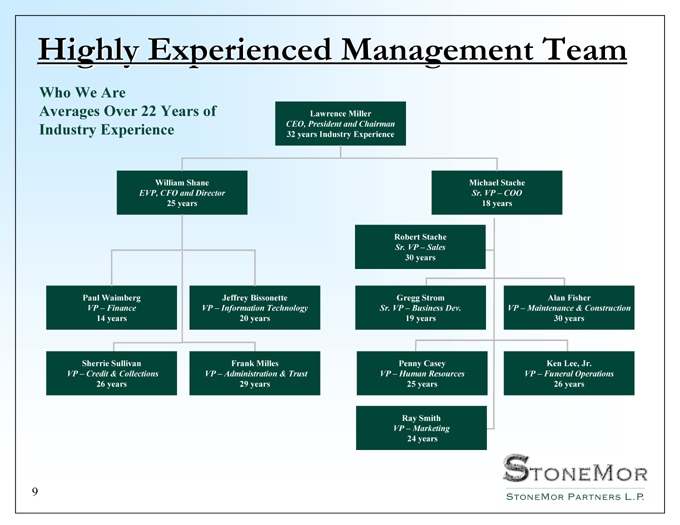
Highly Experienced Management Team
Who We Are
Averages Over 22 Years of Industry Experience
Lawrence Miller
CEO, President and Chairman
32 years Industry Experience
William Shane
EVP, CFO and Director
25 years
Michael Stache
Sr. VP – COO
18 years
Paul Waimberg
VP – Finance
14 years
Jeffrey Bissonette
VP – Information Technology
20 years
Sherrie Sullivan
VP – Credit & Collections
26 years
Frank Milles
VP – Administration & Trust
29 years
Robert Stache
Sr. VP – Sales
30 years
Gregg Strom
Sr. VP – Business Dev.
19 years
Alan Fisher
VP – Maintenance & Construction
30 years
Penny Casey
VP – Human Resources
25 years
Ken Lee, Jr.
VP – Funeral Operations
26 years
Ray Smith
VP – Marketing
24 years
9
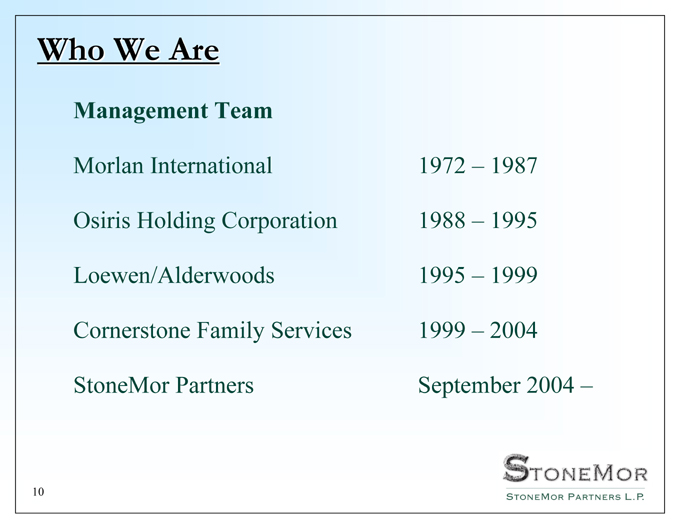
Who We Are
Management Team
Morlan International 1972 – 1987
Osiris Holding Corporation 1988 – 1995
Loewen/Alderwoods 1995 – 1999
Cornerstone Family Services 1999 – 2004
StoneMor Partners September 2004 –
10
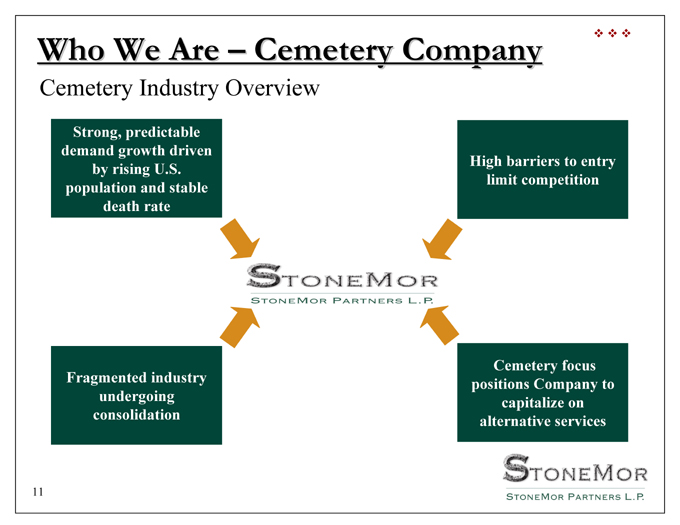
Who We Are – Cemetery Company
Cemetery Industry Overview
Strong, predictable demand growth driven by rising U.S. population and stable death rate
Fragmented industry undergoing consolidation
High barriers to entry limit competition
Cemetery focus positions Company to capitalize on alternative services
11
MLP Structure – Unique Advantages
12

MLP Structure – Unique Advantages
StoneMor Partners is a cemetery company organized as a Master Limited Partnership (MLP).
13
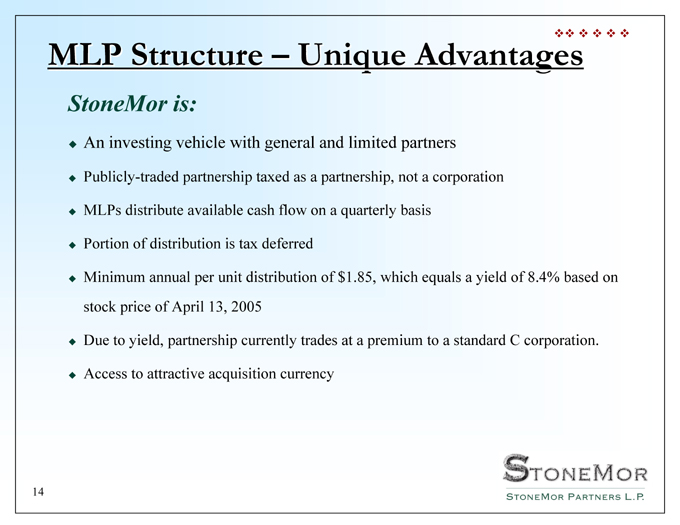
MLP Structure – Unique Advantages
StoneMor is:
An investing vehicle with general and limited partners
Publicly-traded partnership taxed as a partnership, not a corporation MLPs distribute available cash flow on a quarterly basis Portion of distribution is tax deferred
Minimum annual per unit distribution of $1.85, which equals a yield of 8.4% based on stock price of April 13, 2005
Due to yield, partnership currently trades at a premium to a standard C corporation.
Access to attractive acquisition currency
14
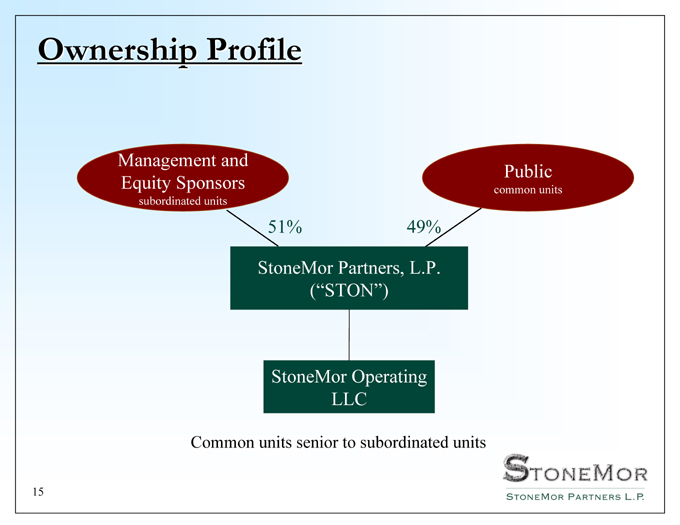
Ownership Profile
Management and Equity Sponsors
subordinated units
51%
Public
common units
49%
StoneMor Partners, L.P.
(“STON”)
StoneMor Operating LLC
Common units senior to subordinated units
15
Why We Reorganized
16
Why We Reorganized
Historic Economic Situation – Industry
Industry issues of 1990s had eliminated companies’ access to capital markets Limited amount of acquisition activity Significant decline in yield curve and equity markets Tightening of lending markets Change in accounting principles to SAB 101
17
Where Do We Go From Here?
18
Where Do We Go From Here?
We generate return for our investors by growing distributable cash flow.
Grow unit distributions by
Acquisitions Pre-need sales Manage trusts
19
Where Do We Go From Here?
Robust opportunity for growth through acquisition
Fragmented industry structure affords plentiful acquisition opportunities
Target acquisitions intended to be accretive on a cash basis
Rigorous diligence process leads to attractive acquisition multiples
Experienced management team has completed numerous acquisitions
22 years of average industry experience
Partnership management has acquired more than 400 cemeteries while working together Stock (units) is attractive acquisition currency
20
Impact of Acquisitions – How We Intend to Grow
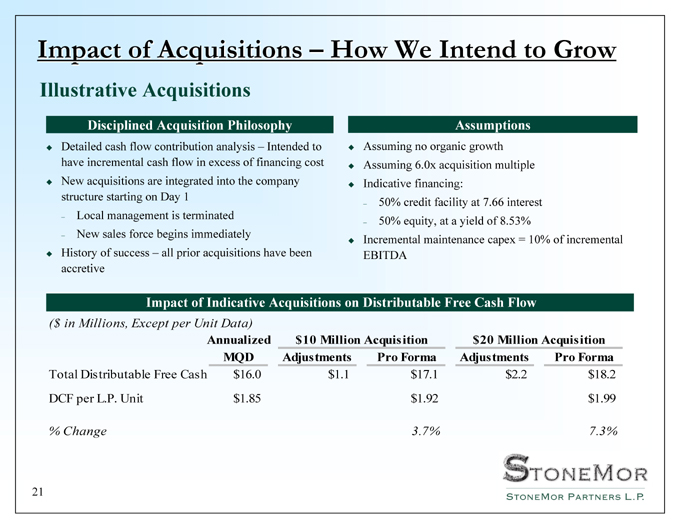
Illustrative Acquisitions
Disciplined Acquisition Philosophy
Detailed cash flow contribution analysis – Intended to have incremental cash flow in excess of financing cost New acquisitions are integrated into the company structure starting on Day 1
Local management is terminated New sales force begins immediately
History of success – all prior acquisitions have been accretive
Assumptions
Assuming no organic growth Assuming 6.0x acquisition multiple Indicative financing:
50% credit facility at 7.66 interest 50% equity, at a yield of 8.53%
Incremental maintenance capex = 10% of incremental EBITDA
Impact of Indicative Acquisitions on Distributable Free Cash Flow
($ in Millions, Except per Unit Data)
Annualized $10 Million Acquisition $20 Million Acquisition
MQD Adjustments Pro Forma Adjustments Pro Forma
Total Distributable Free Cash $16.0 $1.1 $17.1 $2.2 $18.2
DCF per L.P. Unit $1.85 $1.92 $1.99
% Change 3.7% 7.3%
21
Financial Overview
22

Financial Overview
Distribution of Revenues
100% 80% 60% 40% 20% 0%
2002 2003 2004
Service and Other Trust Funds At-Need Sales Pre-Need Sales
23
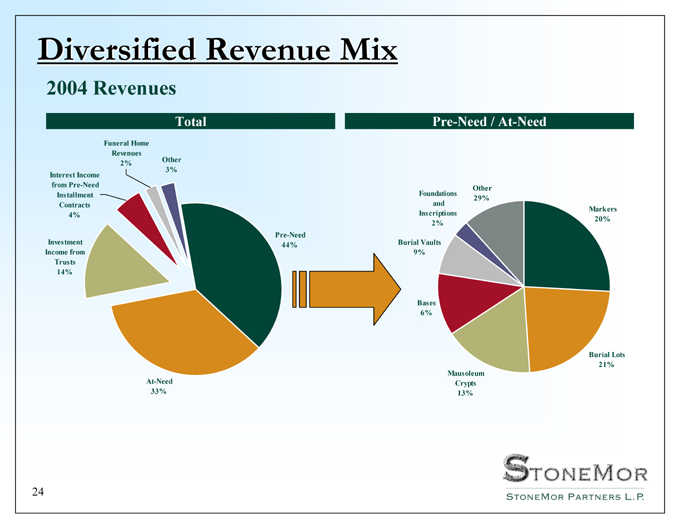
Diversified Revenue Mix
2004 Revenues
Total
Funeral Home Revenues 2%
Other 3%
Interest Income from Pre-Need Installment Contracts 4%
Investment Income from Trusts 14%
At-Need 33%
Pre-Need 44%
Foundations and Inscriptions 2%
Burial Vaults 9%
Bases 6%
Mausoleum Crypts 13%
Burial Lots 21%
Markers 20%
Other 29%
Pre-Need / At-Need
24
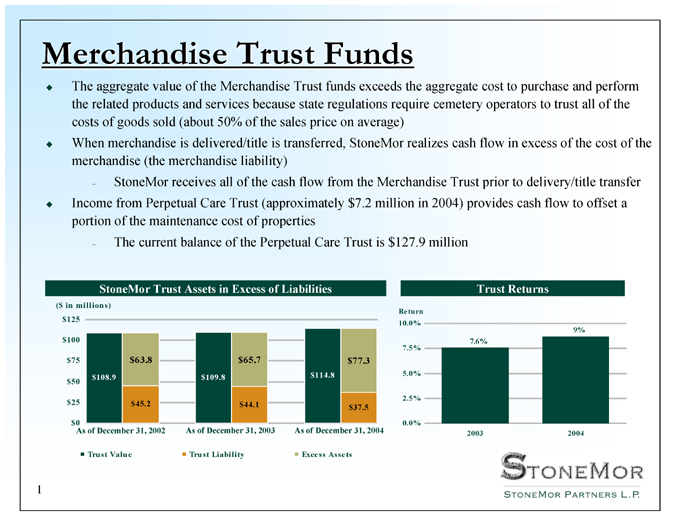
Merchandise Trust Funds
The aggregate value of the Merchandise Trust funds exceeds the aggregate cost to purchase and perform the related products and services because state regulations require cemetery operators to trust all of the costs of goods sold (about 50% of the sales price on average) When merchandise is delivered/title is transferred, StoneMor realizes cash flow in excess of the cost of the merchandise (the merchandise liability)
StoneMor receives all of the cash flow from the Merchandise Trust prior to delivery/title transfer Income from Perpetual Care Trust (approximately $7.2 million in 2004) provides cash flow to offset a portion of the maintenance cost of properties
The current balance of the Perpetual Care Trust is $127.9 million
StoneMor Trust Assets in Excess of Liabilities
($ in millions)
$125 $100 $75 $50 $25 $0
As of December 31, 2002
As of December 31, 2003
As of December 31, 2004
$108.9 $63.8 $45.2 $109.8 $65.7 $44.1 $114.8 $77.3 $37.5
Trust Value
Trust Liability
Excess Assets
Trust Returns
Return
10.0% 7.5% 5.0% 2.5% 0.0%
2003 2004
7.6% 9%
1
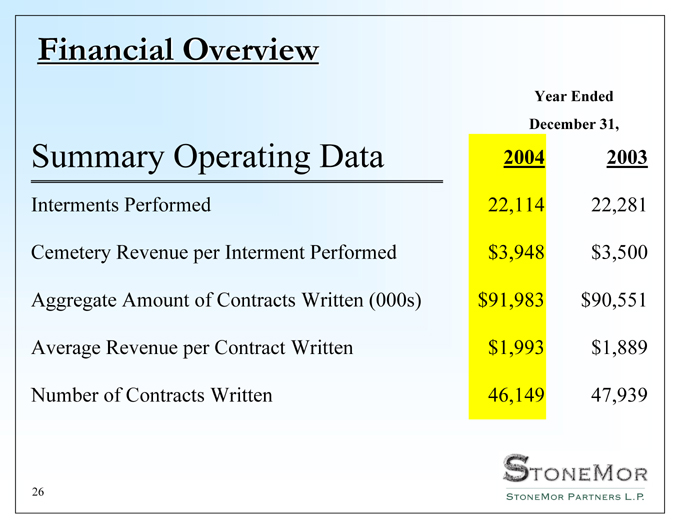
Financial Overview
Year Ended
December 31,
Summary Operating Data 2004 2003
Interments Performed 22,114 22,281
Cemetery Revenue per Interment Performed $3,948 $3,500
Aggregate Amount of Contracts Written (000s) $91,983 $ 90,551
Average Revenue per Contract Written $1,993 $1,889
Number of Contracts Written 46,149 47,939
26
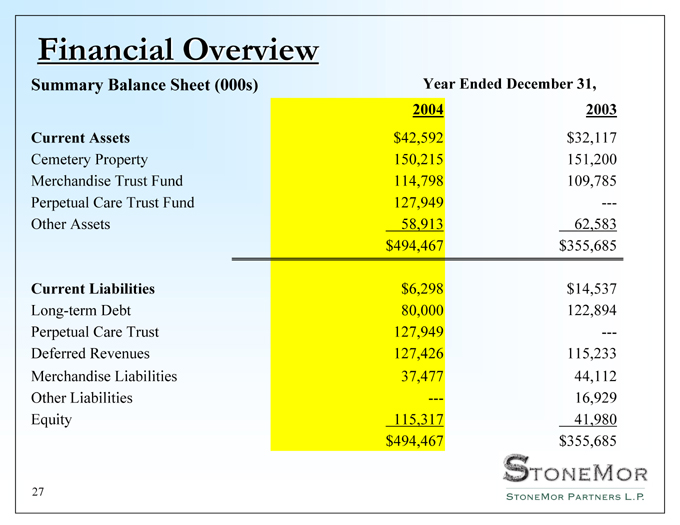
Financial Overview
Summary Balance Sheet (000s) Year Ended December 31,
2004 2003
Current Assets $42,592 $32,117
Cemetery Property 150,215 151,200
Merchandise Trust Fund 114,798 109,785
Perpetual Care Trust Fund 127,949 —-
Other Assets 58,913 62,583
$494,467 $355,685
Current Liabilities $6,298 $14,537
Long-term Debt 80,000 122,894
Perpetual Care Trust 127,949 —-
Deferred Revenues 127,426 115,233
Merchandise Liabilities 37,477 44,112
Other Liabilities —- 16,929
Equity 115,317 41,980
$494,467 $355,685
27
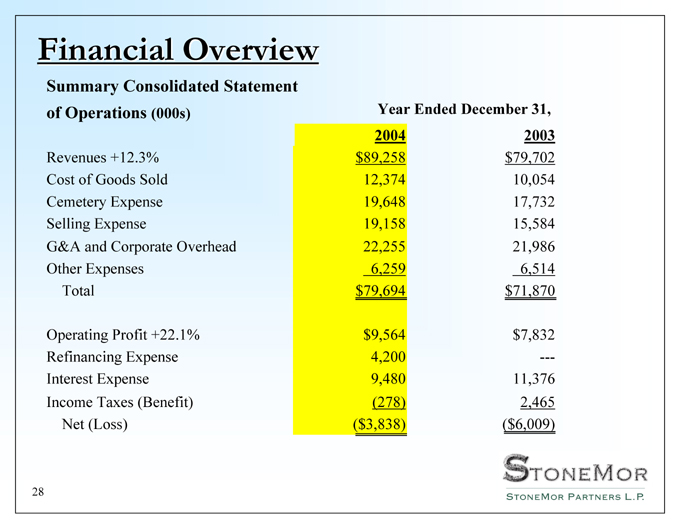
Financial Overview
Summary Consolidated Statement
of Operations (000s) Year Ended December 31,
2004 2003
Revenues +12.3% $89,258 $79,702
Cost of Goods Sold 12,374 10,054
Cemetery Expense 19,648 17,732
Selling Expense 19,158 15,584
G&A and Corporate Overhead 22,255 21,986
Other Expenses 6,259 6,514
Total $ 79,694 $71,870
Operating Profit +22.1% $9,564 $7,832
Refinancing Expense 4,200 —-
Interest Expense 9,480 11,376
Income Taxes (Benefit) (278) 2,465
Net (Loss) ($3,838) ($6,009)
28
Financial Overview
Cash Flow
Key – Generate distributable free cash flow to pay $1.85 minimum per unit distribution or approximately $16,000,000 annually. Minimum return is 8.4% based on stock price of April 13, 2005.
The Company defines distributable free cash flow as net cash provided by operating activities before appropriate reserves, if any, adjusted for expenditures related to its initial public offering less maintenance capital expenditures and debt payments not funded by the proceeds of that offering. A reconciliation between net cash provided by operating activities (the GAAP financial measure the Company believes is most directly comparable to distributable free cash flow) and distributable free cash flow for the quarter ended December 31, 2004 follows:
29
Financial Overview
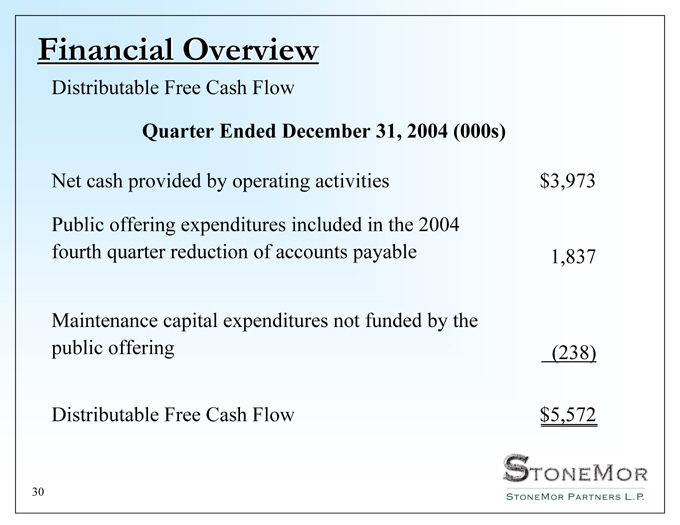
Distributable Free Cash Flow
Quarter Ended December 31, 2004 (000s)
Net cash provided by operating activities $3,973
Public offering expenditures included in the 2004
fourth quarter reduction of accounts payable 1,837
Maintenance capital expenditures not funded by the
public offering (238)
Distributable Free Cash Flow $5,572
30
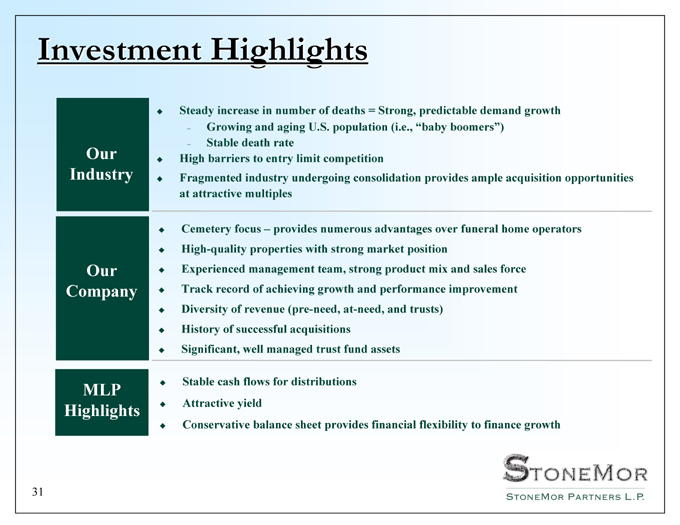
Investment Highlights
Steady increase in number of deaths = Strong, predictable demand growth
Growing and aging U.S. population (i.e., “baby boomers”) Stable death rate
High barriers to entry limit competition
Fragmented industry undergoing consolidation provides ample acquisition opportunities at attractive multiples
Cemetery focus – provides numerous advantages over funeral home operators High-quality properties with strong market position Experienced management team, strong product mix and sales force Track record of achieving growth and performance improvement Diversity of revenue (pre-need, at-need, and trusts) History of successful acquisitions Significant, well managed trust fund assets
Stable cash flows for distributions Attractive yield
Conservative balance sheet provides financial flexibility to finance growth
Our Industry
Our Company
MLP Highlights
31
Investment Highlights
American Jobs Creation Act of 2004
MLP income is qualified income for mutual funds Mutual funds allowed to hold 25% of their assets in MLPs No state tax in states that follow federal tax rules
32
Appendix
33
Appendix
Distributable Free Cash Flow
We present distributable free cash flow because management believes this information is a useful adjunct to net cash provided by operating activities under GAAP. Distributable free cash flow is a significant liquidity metric that we believe is an indicator of our ability to generate cash flow at a level sufficient to pay the minimum quarterly cash distribution to the holders of our common units and subordinated units and for other purposes such as repaying debt and expanding through strategic investments.
Distributable free cash flow is similar to quantitative standards of free cash flow used throughout the deathcare industry and to quantitative standards of distributable cash flow used throughout the investment community with respect to publicly traded partnerships, but is not intended to be a prediction of the future. However, our calculation of distributable free cash flow may not be consistent with calculations of free cash flow, distributable cash flow or other similarly titled measures of other companies. Distributable free cash flow is not a measure of financial performance and should not be considered as an alternative to cash flows from operating, investing, or financing activities.
34