Exhibit 99.3

Q2 2016 EARNINGS AUGUST 2016
FORWARD-LOOKING STATEMENTS This presentation contains “forward-looking” statements relating to RealPage, Inc.’s expected, possible or assumed future results; anticipated contributions to performance of its various product families, including the statement that Resident Services, Property Management and Asset Optimization product categories continue to fuel solid revenue traction; anticipated synergies resulting from the integration of NWP Services Corporation into RealPage, Inc.’s business; and RealPage, Inc.’s opportunities for operating leverage and operating cash flow growth. These forward-looking statements are based on management's beliefs and assumptions and on information currently available to management. Forward-looking statements include all statements that are not historical facts and may be identified by terms such as “expects,” “believes,” “plans,” or similar expressions and the negatives of those terms. Those forward-looking statements involve known and unknown risks, uncertainties and other factors that may cause actual results, performance or achievements to be materially different from any future results, performance or achievements expressed or implied by the forward-looking statements. The company may be required to revise its results upon finalizing its review of quarterly and full year results, which could cause or contribute to such differences. Additional factors that could cause or contribute to such differences include, but are not limited to, the following: (a) the possibility that general economic conditions, including leasing velocity or uncertainty, could cause information technology spending, particularly in the rental housing industry, to be reduced or purchasing decisions to be delayed; (b) an increase in insurance claims; (c) an increase in customer cancellations; (d) the inability to increase sales to existing customers and to attract new customers; (e) RealPage, Inc.’s failure to integrate acquired businesses and any future acquisitions successfully or to achieve expected synergies; (f) the timing and success of new product introductions by RealPage, Inc. or its competitors; (g) changes in RealPage, Inc.’s pricing policies or those of its competitors; (h) legal or regulatory proceedings; (i) the inability to achieve revenue growth or to enable margin expansion; and (j) such other risks and uncertainties described more fully in documents filed with or furnished to the Securities and Exchange Commission (“SEC”) by RealPage Inc., including its Quarterly Report on Form 10-Q previously filed with the SEC on May 6, 2016. All information provided in this release is as of the date hereof and RealPage Inc. undertakes no duty to update this information except as required by law.In the company’s earnings releases, conference call remarks, slide presentations, and webcasts, the company may use or discuss non-GAAP financial measures, as defined by Regulation G. The GAAP financial measure most directly comparable to each non-GAAP financial measure used or discussed, and a reconciliation of the differences between each non-GAAP financial measure and the comparable GAAP financial measure, are included in this presentation. For such non-GAAP reconciliations, please reference this presentation, the Investor Relations section of www.realpage.com, and the company’s most recent SEC filings.. A reconciliation between GAAP and non-GAAP measures is included in the appendix to this presentation and is available on the Investor Relations portion of the website www.realpage.com. This presentation should also be used in conjunction with the company’s IR Fact Sheet and “Explanation of Non-GAAP Financial Measures,” both previously furnished to the SEC by Form 8-K filed on August 3, 2016.RealPage is a registered trademark of RealPage, Inc. This presentation also contains additional trademarks and service marks of ours and of other companies. We do not intend our use or display of other companies’ trademarks or service marks to imply a relationship with, or endorsement or sponsorship of us by, these other companies. 2

STEVE WINNCHAIRMAN & CEO
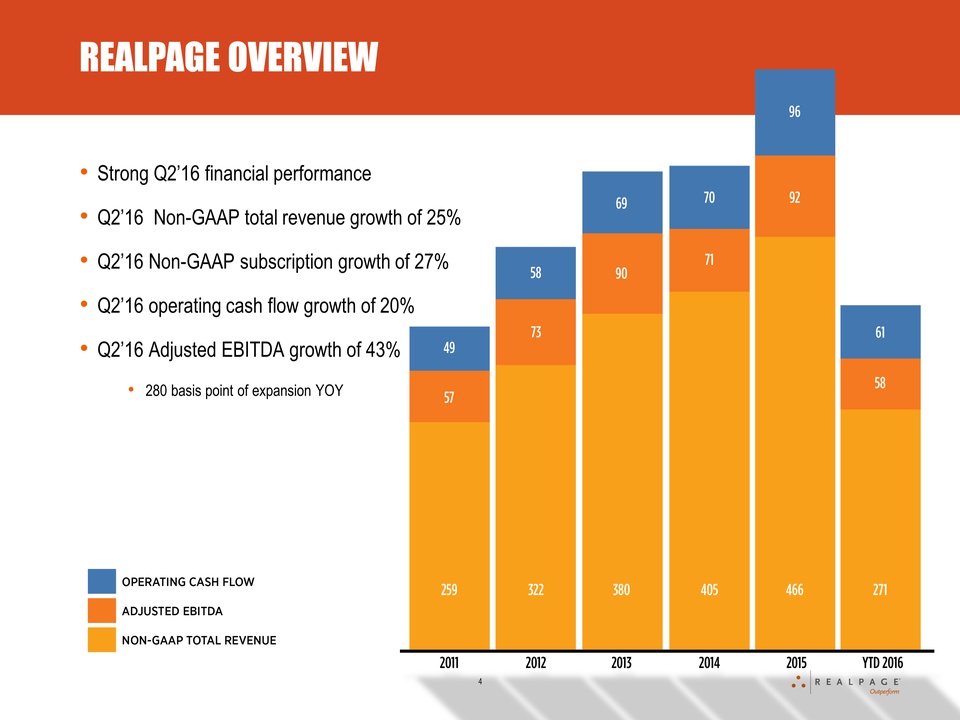
REALPAGE OVERVIEW Strong Q2’16 financial performanceQ2’16 Non-GAAP total revenue growth of 25%Q2’16 Non-GAAP subscription growth of 27%Q2’16 operating cash flow growth of 20%Q2’16 Adjusted EBITDA growth of 43%280 basis point of expansion YOY 4
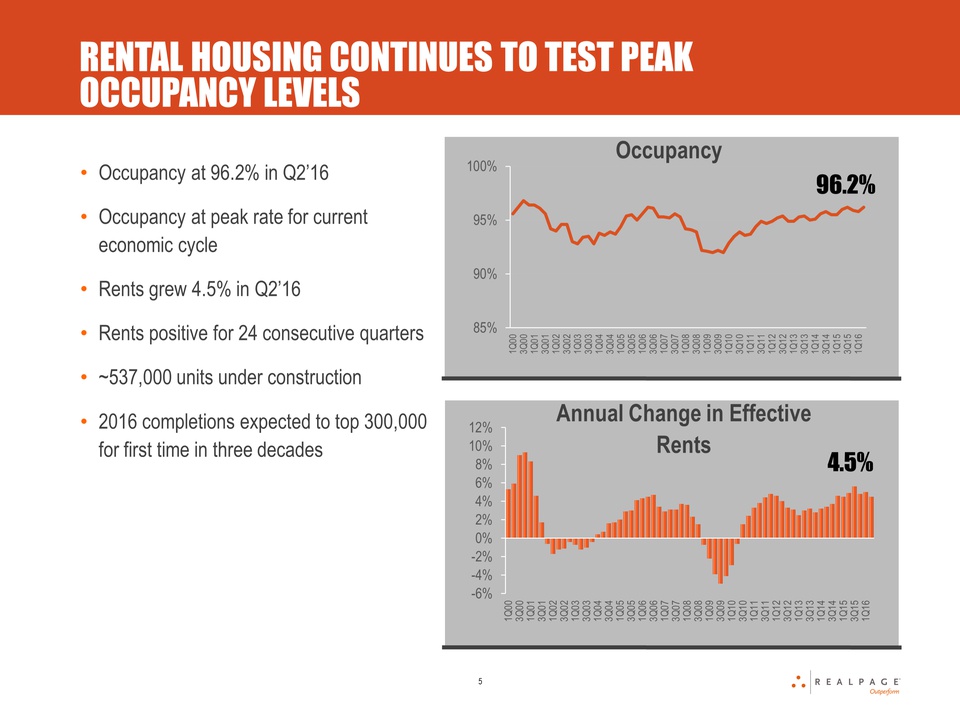
RENTAL HOUSING CONTINUES TO TEST PEAK OCCUPANCY LEVELS 5 Occupancy at 96.2% in Q2’16Occupancy at peak rate for current economic cycleRents grew 4.5% in Q2’16Rents positive for 24 consecutive quarters~537,000 units under construction2016 completions expected to top 300,000 for first time in three decades Occupancy Annual Change in Effective Rents
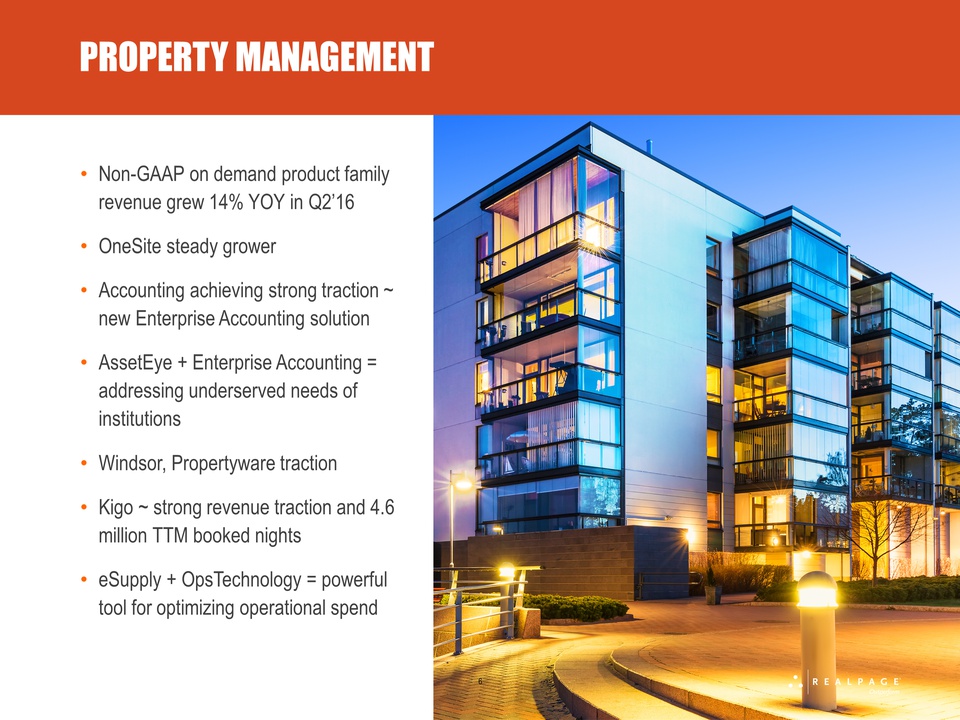
PROPERTY MANAGEMENT 6 Non-GAAP on demand product family revenue grew 14% YOY in Q2’16OneSite steady growerAccounting achieving strong traction ~ new Enterprise Accounting solutionAssetEye + Enterprise Accounting = addressing underserved needs of institutionsWindsor, Propertyware tractionKigo ~ strong revenue traction and 4.6 million TTM booked nightseSupply + OpsTechnology = powerful tool for optimizing operational spend

Non-GAAP on demand product family revenue grew 60% YOY in Q2’16NWP, Renter’s Insurance, Payments, Portals & Velocity all achieving strong revenue growthIntegrating NWP & Velocity to include best of both platformsNWP synergies on track ~ 5x to 6x EBITDA exiting 2016 RESIDENT SERVICES 7
LEASING & MARKETING 8 Non-GAAP on demand product family revenue declined 3% YOY in Q2’16Screening, online leasing and websites driving growthContact center headwinds continueNext generation contact center to include unified communication platform ~ rental housing prospects can use phone, text, email or chatLive agent / automated agent modelWebsite innovation driving growth ~ 2D/3D, virtual tours, improved client tools
ASSET OPTIMIZATION 9 Non-GAAP on demand product family revenue grew 16% YOY in Q2’16Growth driven by YieldStar® and Business IntelligenceBusiness Intelligence + Benchmarking = over 1 million active unitsRealWorld user conference highlighted industry veterans leveraging RealPage BI to make material impact Investment Analytics unlocking broader client base ~ lenders, brokers & research firms

INNOVATION 10 Innovation focused on unlocking insights from RP massive repository of dataLead Scoring ~ measure the effectiveness of each ad source and leasing agentLearning Management ~ new-hire and associate training is acute pain pointVideo for easy consumption and administrationTraining aides in compliance and can increase product usageEuropean expansion ~ following large clients
ORGANIZATIONAL EFFECTIVENESS 11 Structuring company for next phase of growthDisciplined expense strategy criticalHeadquarters consolidation and remote office closures or reduced footprintData centers migration ~ expect to leverage IT spendNew product technology framework expected to accelerate development speed to market, reduce costs, and accelerate integration of acquisitionsExpect more leverage from sales and marketingAshley Glover named Chief Revenue OfficerDeep experience to evolve sales and operations
Nearly 80% of revenue experiencing exceptional adoptionExpense efficiency initiatives driving significant Adjusted EBITDA margin expansion280 bp YOYExpect continued Adjusted EBITDA margin expansion marching towards goal of 30%+Driving significant FCF ROIC ~ 25% for Q2’16Underscores importance of organic and inorganic growthInnovation engine building to full throttleImproving organizational effectiveness to support next phase of growthBalanced, flexible capital allocation strategy SUMMARY 12

BRYAN HILLCFO & TREASURER
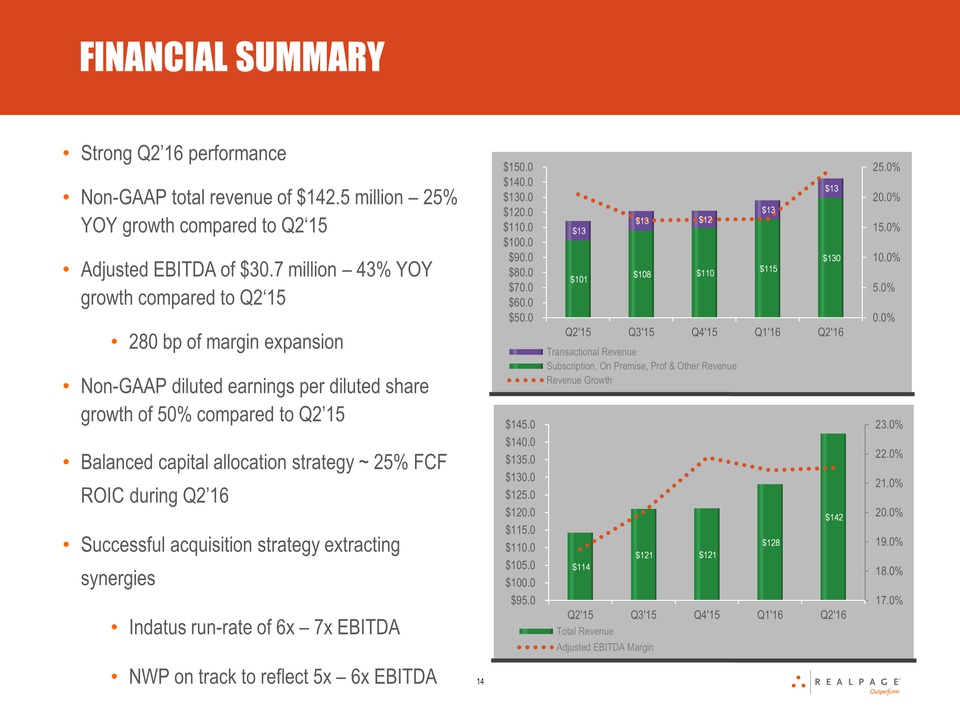
Strong Q2’16 performanceNon-GAAP total revenue of $142.5 million – 25% YOY growth compared to Q2‘15Adjusted EBITDA of $30.7 million – 43% YOY growth compared to Q2‘15280 bp of margin expansionNon-GAAP diluted earnings per diluted share growth of 50% compared to Q2’15Balanced capital allocation strategy ~ 25% FCF ROIC during Q2’16Successful acquisition strategy extracting synergiesIndatus run-rate of 6x – 7x EBITDANWP on track to reflect 5x – 6x EBITDA FINANCIAL SUMMARY 14
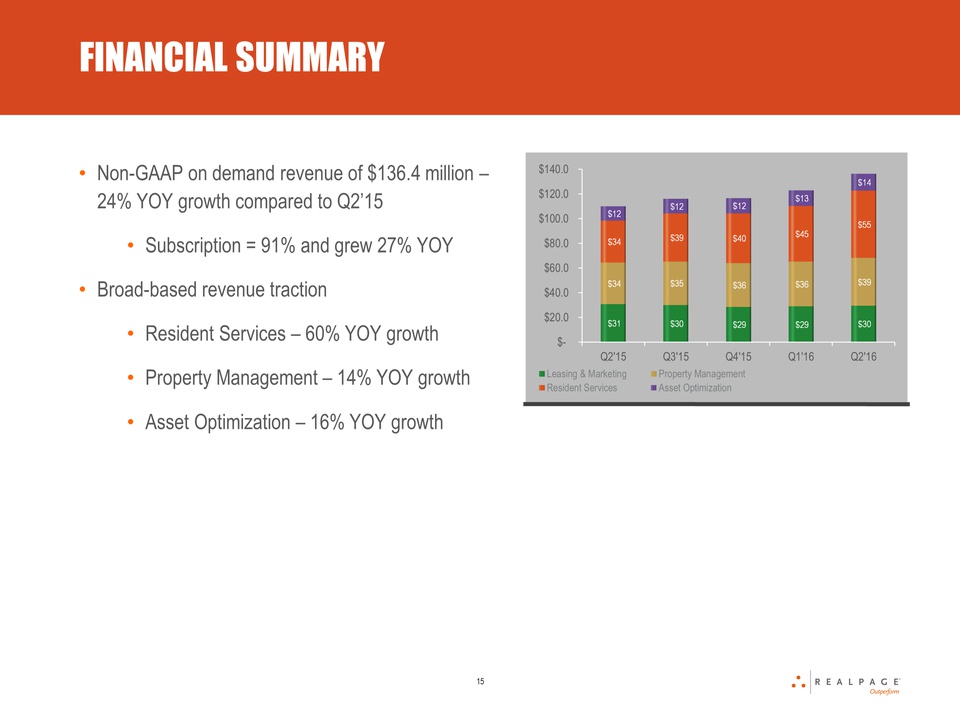
FINANCIAL SUMMARY Non-GAAP on demand revenue of $136.4 million – 24% YOY growth compared to Q2’15Subscription = 91% and grew 27% YOYBroad-based revenue tractionResident Services – 60% YOY growthProperty Management – 14% YOY growthAsset Optimization – 16% YOY growth 15
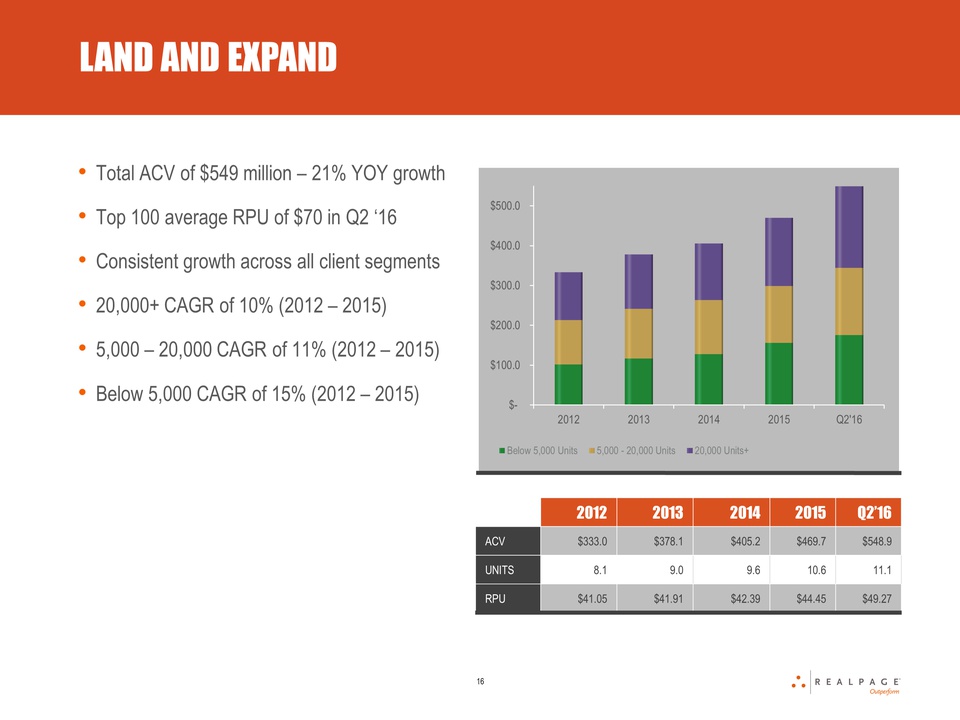
LAND AND EXPAND Total ACV of $549 million – 21% YOY growthTop 100 average RPU of $70 in Q2 ‘16Consistent growth across all client segments20,000+ CAGR of 10% (2012 – 2015)5,000 – 20,000 CAGR of 11% (2012 – 2015)Below 5,000 CAGR of 15% (2012 – 2015) 2012 2013 2014 2015 Q2’16 ACV $333.0 $378.1 $405.2 $469.7 $548.9 Units 8.1 9.0 9.6 10.6 11.1 RPU $41.05 $41.91 $42.39 $44.45 $49.27 16
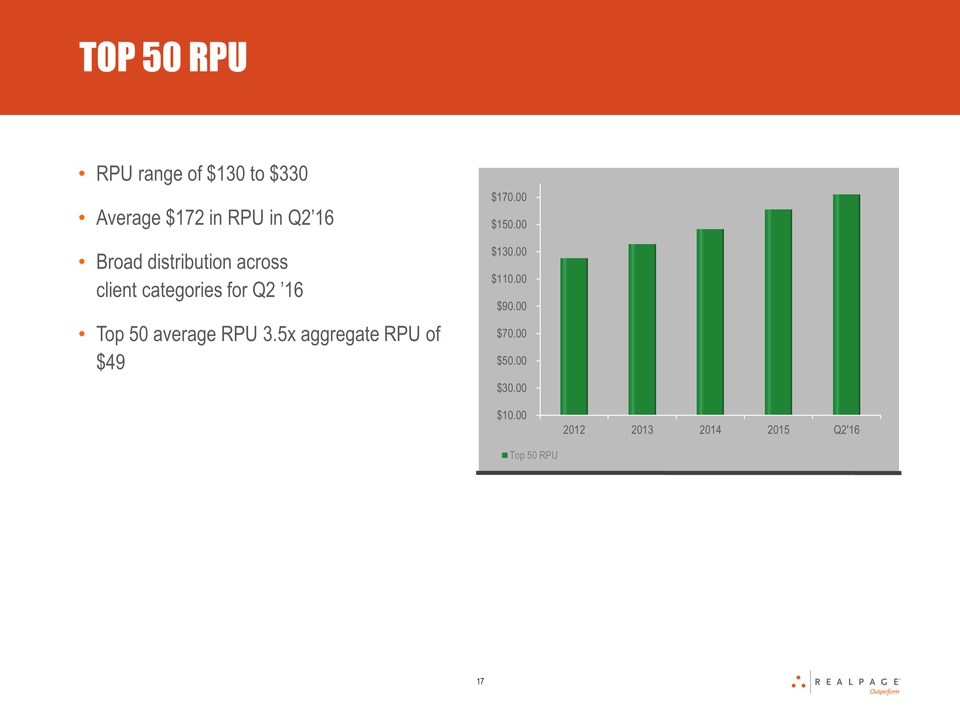
TOP 50 RPU 17 RPU range of $130 to $330Average $172 in RPU in Q2’16Broad distribution acrossclient categories for Q2 ’16Top 50 average RPU 3.5x aggregate RPU of $49
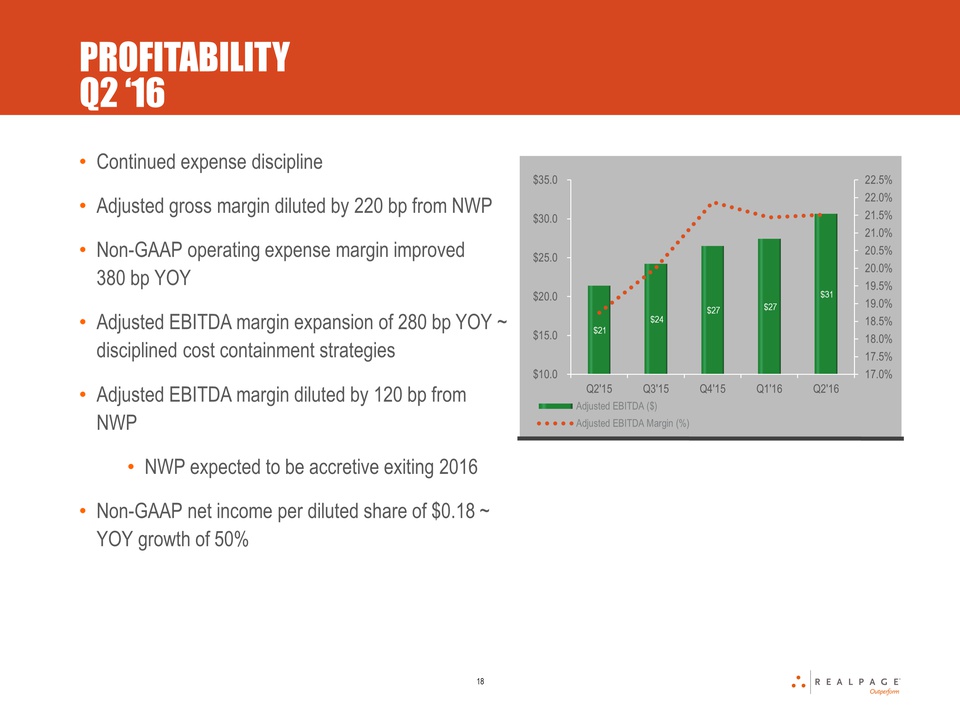
PROFITABILITY Q2 ‘16 Continued expense disciplineAdjusted gross margin diluted by 220 bp from NWPNon-GAAP operating expense margin improved 380 bp YOYAdjusted EBITDA margin expansion of 280 bp YOY ~ disciplined cost containment strategiesAdjusted EBITDA margin diluted by 120 bp from NWPNWP expected to be accretive exiting 2016Non-GAAP net income per diluted share of $0.18 ~ YOY growth of 50% 18
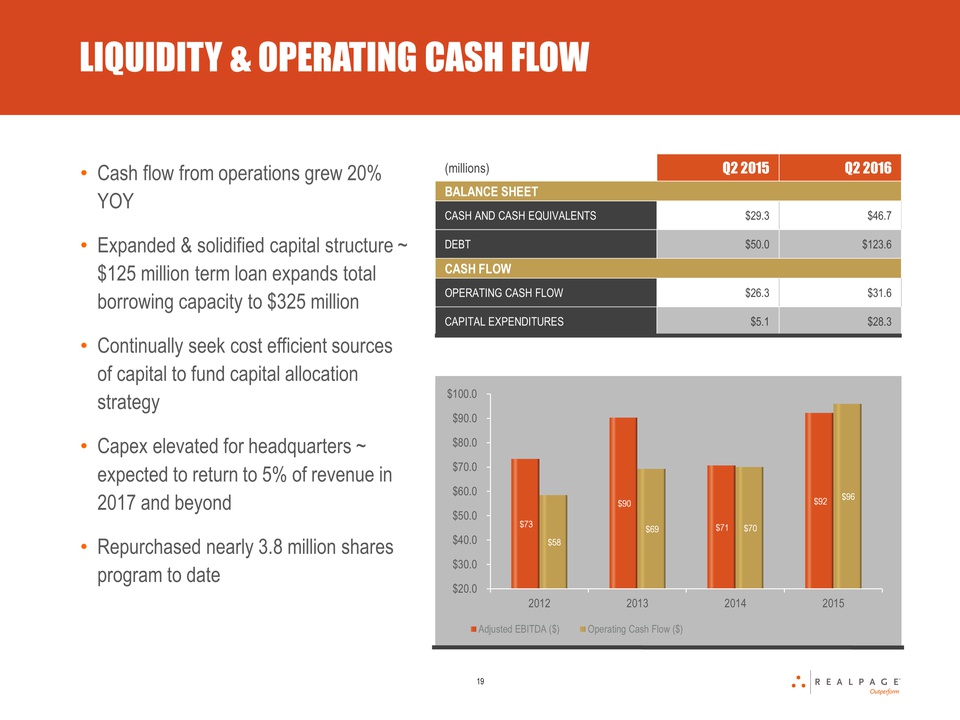
LIQUIDITY & OPERATING CASH FLOW Cash flow from operations grew 20% YOYExpanded & solidified capital structure ~ $125 million term loan expands total borrowing capacity to $325 millionContinually seek cost efficient sources of capital to fund capital allocation strategyCapex elevated for headquarters ~ expected to return to 5% of revenue in 2017 and beyondRepurchased nearly 3.8 million shares program to date (millions) Q2 2015 Q2 2016 Balance sheet Cash and Cash equivalents $29.3 $46.7 Debt $50.0 $123.6 Cash Flow Operating Cash Flow $26.3 $31.6 Capital Expenditures $5.1 $28.3 19
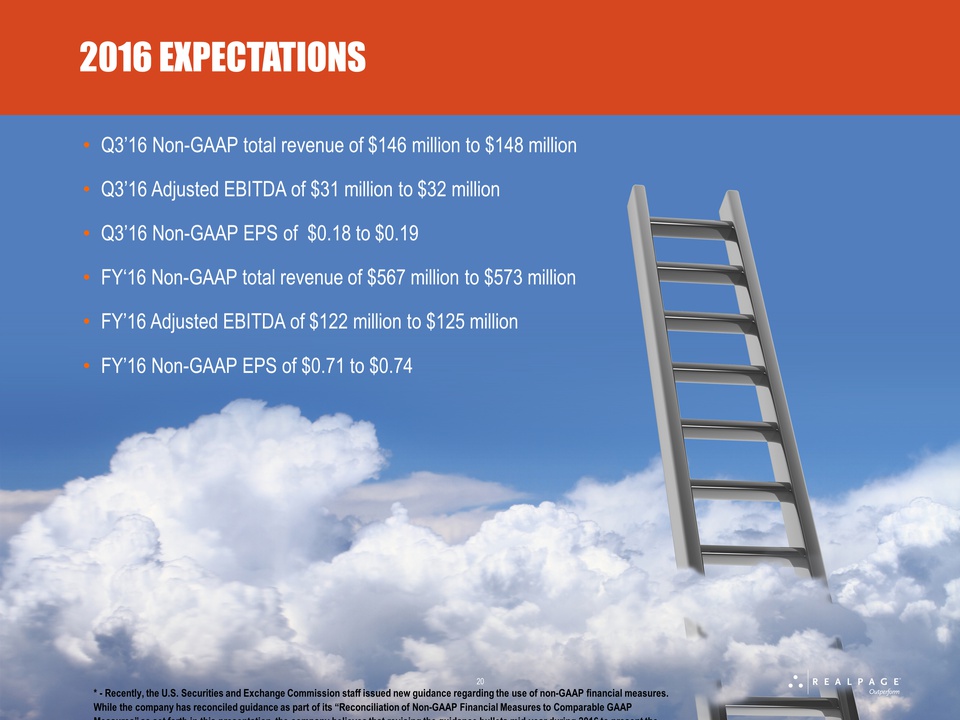
2016 EXPECTATIONS Q3’16 Non-GAAP total revenue of $146 million to $148 millionQ3’16 Adjusted EBITDA of $31 million to $32 millionQ3’16 Non-GAAP EPS of $0.18 to $0.19FY‘16 Non-GAAP total revenue of $567 million to $573 millionFY’16 Adjusted EBITDA of $122 million to $125 millionFY’16 Non-GAAP EPS of $0.71 to $0.74 20 * - Recently, the U.S. Securities and Exchange Commission staff issued new guidance regarding the use of non-GAAP financial measures. While the company has reconciled guidance as part of its “Reconciliation of Non-GAAP Financial Measures to Comparable GAAP Measures” as set forth in this presentation, the company believes that revising the guidance bullets mid-year during 2016 to present the GAAP equivalent may confuse our stockholders and the investment community. As a result, the company plans to present both the non-GAAP financial measure and the applicable GAAP financial measure in its guidance bullets beginning with the release of its fiscal year 2017 guidance.

APPENDIX
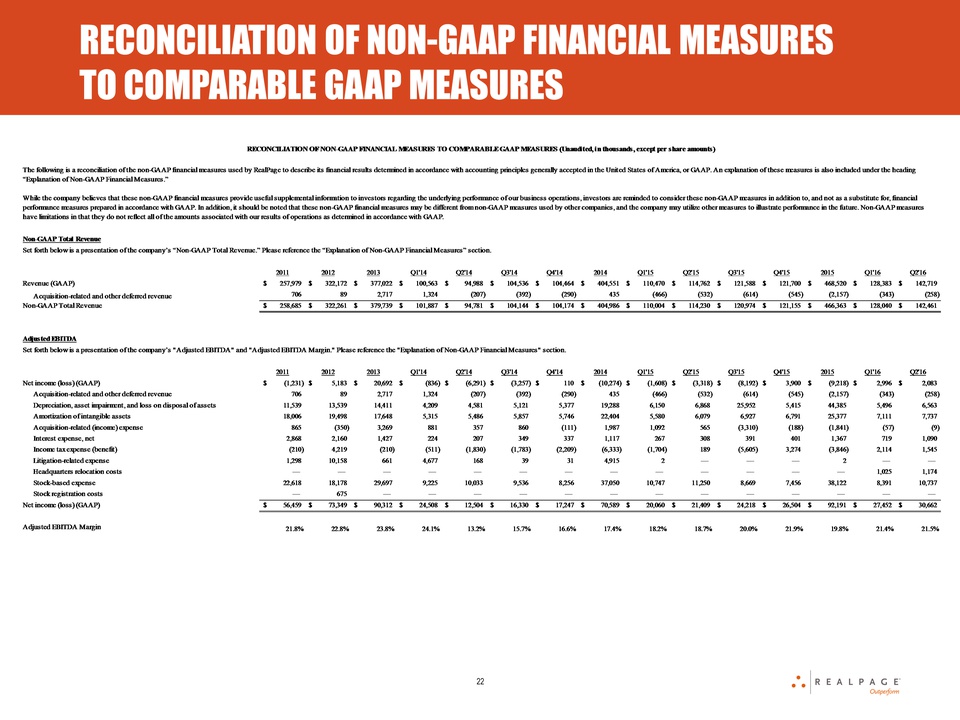
22 RECONCILIATION OF NON-GAAP FINANCIAL MEASURES TO COMPARABLE GAAP MEASURES
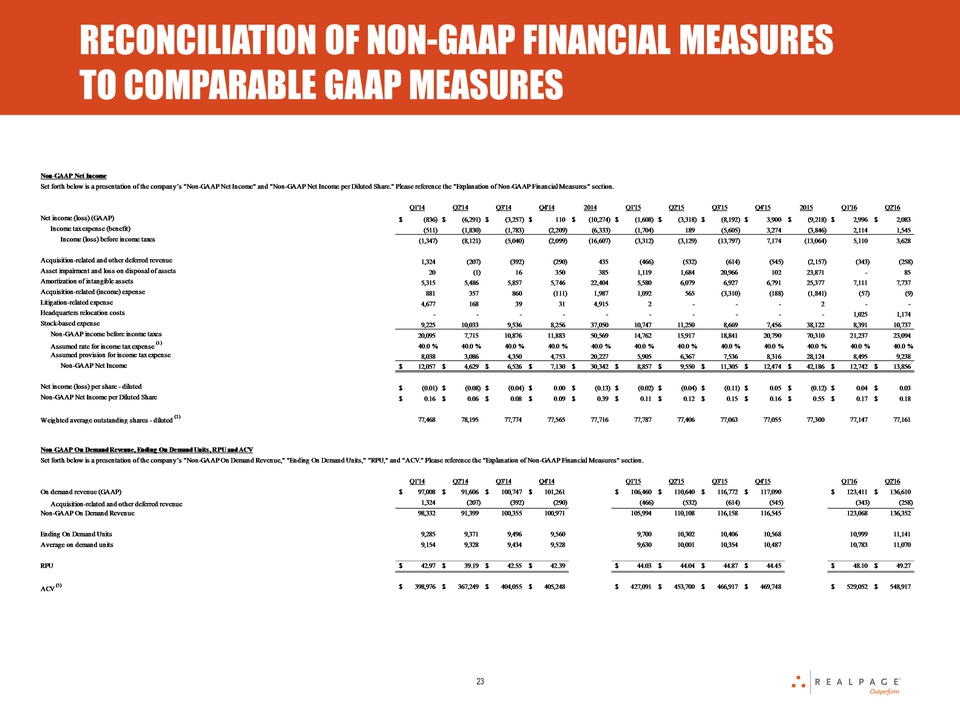
23 RECONCILIATION OF NON-GAAP FINANCIAL MEASURES TO COMPARABLE GAAP MEASURES
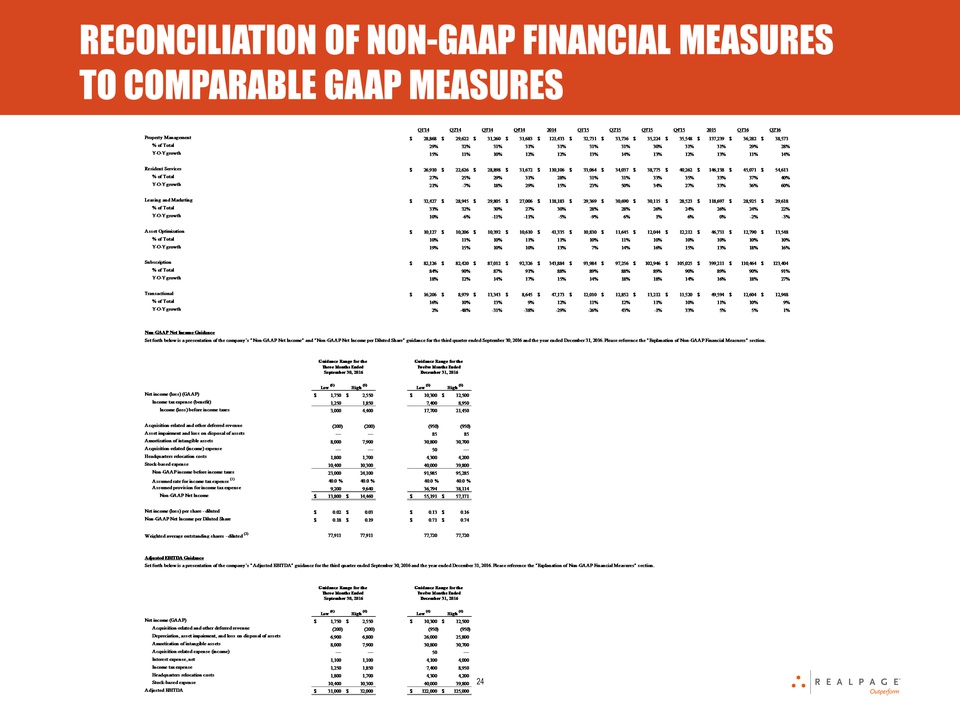
24 RECONCILIATION OF NON-GAAP FINANCIAL MEASURES TO COMPARABLE GAAP MEASURES

25 RECONCILIATION OF NON-GAAP FINANCIAL MEASURES TO COMPARABLE GAAP MEASURES
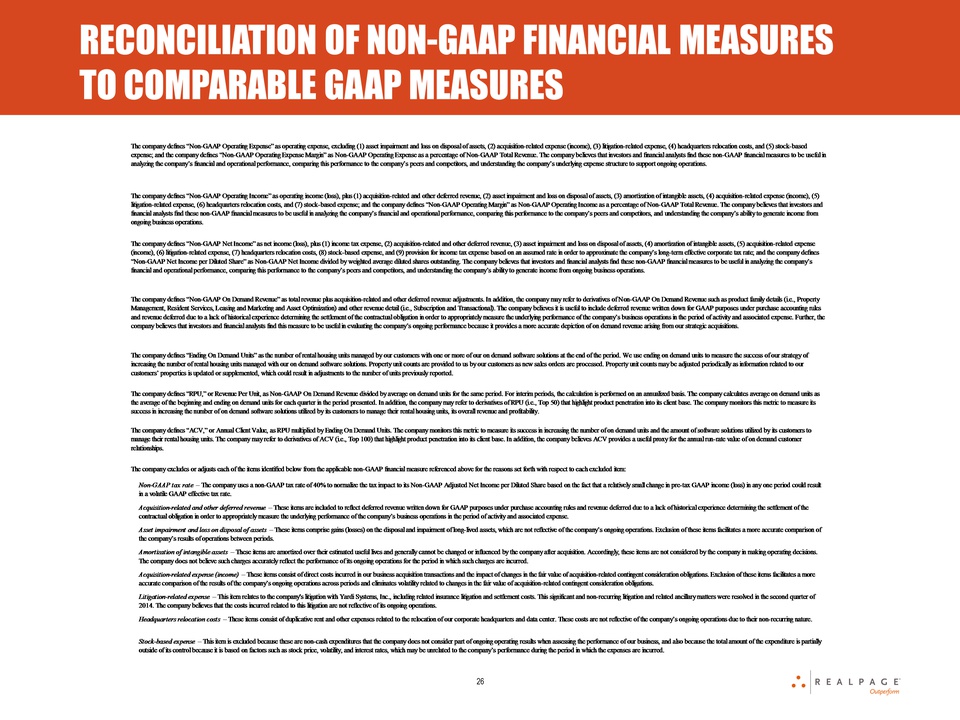
26 RECONCILIATION OF NON-GAAP FINANCIAL MEASURES TO COMPARABLE GAAP MEASURES