UNITED STATES
SECURITIES AND EXCHANGE COMMISSION
Washington, D.C. 20549
FORM N-CSR
CERTIFIED SHAREHOLDER REPORT OF REGISTERED MANAGEMENT
INVESTMENT COMPANIES
Investment Company Act file number 811-21552
J.P. Morgan Access Multi-Strategy Fund, L.L.C.
(Exact name of registrant as specified in charter)
270 Park Avenue, Floor 22
New York, NY 10017
(Address of principal executive offices) (Zip code)
Frank J. Nasta, Esq.
J.P. Morgan Investment Management Inc.
270 Park Avenue, Floor 9
New York, NY 10017
(Name and address of agent for service)
Copy to:
Richard Horowitz, Esq.
Dechert LLP
1095 Avenue of the Americas
New York, NY 10036
Registrant’s telephone number, including area code: (800) 480-4111
Date of fiscal year end: March 31
Date of reporting period: September 30, 2015
Form N-CSR is to be used by management investment companies to file reports with the Commission not later than 10 days after the transmission to stockholders of any report that is required to be transmitted to stockholders under Rule 30e-1 under the Investment Company Act of 1940 (17 CFR 270.30e-1). The Commission may use the information provided on Form N-CSR in its regulatory, disclosure review, inspection, and policymaking roles.
A registrant is required to disclose the information specified by Form N-CSR, and the Commission will make this information public. A registrant is not required to respond to the collection of information contained in Form N-CSR unless the Form displays a currently valid Office of Management and Budget (“OMB”) control number. Please direct comments concerning the accuracy of the information collection burden estimate and any suggestions for reducing the burden to Secretary, Securities and Exchange Commission, 100 F Street, NE, Washington, DC 20549. The OMB has reviewed this collection of information under the clearance requirements of 44 U.S.C. § 3507.
Item 1. Reports to Stockholders.
The Report to Shareholders is attached herewith.
J.P. Morgan Access Multi-Strategy Fund, L.L.C.
Financial Statements
For the six months ended September 30, 2015
(Unaudited)
This report is open and authorized for distribution only to qualified and accredited investors or financial intermediaries who have received a copy of the Fund’s Private Placement Memorandum. This document, although required to be filed with the SEC, may not be copied, faxed or otherwise distributed to the general public.
J.P. Morgan Access Multi-Strategy Fund, L.L.C.
Financial Statements
For the six months ended September 30, 2015
(Unaudited)
Contents
Past performance is no guarantee of future results. Market volatility can significantly impact short-term performance. Results of an investment made today may differ substantially from the Fund’s historical performance. Investment return and principal value will fluctuate so that an investor’s interests, when redeemed, may be worth more or less than original cost.
J.P. Morgan Access Multi-Strategy Fund, L.L.C.
Schedule of Investments
September 30, 2015
(Unaudited)
| | | | | | | | | | | | | | |
| Investment Fund | | Cost ($) | | | Fair Value ($) | | | % of
Members’
Capital | | Liquidity (e) |
| | | | |
Diversified | | | | | | | | | | | | | | |
OZ Domestic Partners II, L.P. (b) | | | 149,539,523 | | | | 153,963,841 | | | | 5.74 | | | Quarterly |
| | | | | | | | | | | | | | |
Total | | | 149,539,523 | | | | 153,963,841 | | | | 5.74 | | | |
| | | | | | | | | | | | | | |
| | | | |
Event Driven - Core | | | | | | | | | | | | | | |
Apollo Asia Opportunity Fund, L.P. | | | 94,637 | | | | 3,654 | | | | 0.00 | (a) | | Side Pocket* |
Corvex Partners LP (b) | | | 119,500,000 | | | | 147,572,565 | | | | 5.49 | | | Quarterly |
Deephaven Event Fund LLC | | | 81,842 | | | | 7,353 | | | | 0.00 | (a) | | In Liquidation** |
JANA Partners Qualified, L.P. (b),(g) | | | 136,803,679 | | | | 129,646,451 | | | | 4.83 | | | Quarterly |
Paulson Partners Enhanced, L.P. (b) | | | 152,028,901 | | | | 147,106,489 | | | | 5.48 | | | Semi-Annual |
Pershing Square, L.P. (b),(g) | | | 85,000,000 | | | | 82,214,971 | | | | 3.06 | | | Quarterly |
Third Point Partners Qualified L.P. (b) | | | 111,619,644 | | | | 131,308,951 | | | | 4.90 | | | Quarterly |
Tyrus Capital Event Fund, L.P. | | | 4,137,940 | | | | 5,005,237 | | | | 0.19 | | | Quarterly |
ValueAct Capital Partners, L.P. | | | 165,490 | | | | 382,193 | | | | 0.01 | | | Side Pocket* |
York European Opportunities Fund L.P. (h) | | | 140,000,000 | | | | 136,961,344 | | | | 5.10 | | | Quarterly |
| | | | | | | | | | | | | | |
Total | | | 749,432,133 | | | | 780,209,208 | | | | 29.06 | | | |
| | | | | | | | | | | | | | |
| | | | |
Event Driven - Distressed | | | | | | | | | | | | | | |
Caspian Select Credit Fund, L.P. | | | 88,442,801 | | | | 93,099,884 | | | | 3.47 | | | Quarterly |
Strategic Value Restructuring Fund, LP | | | 1,309,240 | | | | 44,167 | | | | 0.00 | (a) | | In Liquidation** |
SVRF (Onshore) Holdings LLC | | | 71,440 | | | | 31,861 | | | | 0.00 | (a) | | In Liquidation** |
York Credit Opportunities Fund, L.P. (b) | | | 182,219,027 | | | | 194,750,823 | | | | 7.25 | | | Quarterly |
| | | | | | | | | | | | | | |
Total | | | 272,042,508 | | | | 287,926,735 | | | | 10.72 | | | |
| | | | | | | | | | | | | | |
| | | | |
Long/Short Equities | | | | | | | | | | | | | | |
Alyeska Fund, L.P. (b) | | | 142,000,000 | | | | 140,382,968 | | | | 5.23 | | | Monthly |
Brahman Partners III, L.P. (b) | | | 98,661,147 | | | | 125,549,866 | | | | 4.68 | | | Quarterly |
Copper River Partners, L.P. | | | 57,214 | | | | 14,968 | | | | 0.00 | (a) | | In Liquidation** |
Glenview Institutional Partners, L.P. (b) | | | 146,510,816 | | | | 154,592,986 | | | | 5.75 | | | Quarterly/Side Pocket* |
Miura Global Partners II, LP (b) | | | 134,486,943 | | | | 139,507,605 | | | | 5.20 | | | Monthly |
| | | | | | | | | | | | | | |
Total | | | 521,716,120 | | | | 560,048,393 | | | | 20.86 | | | |
| | | | | | | | | | | | | | |
| | | | |
Opportunistic/Macro | | | | | | | | | | | | | | |
Black River Commodity Multi-Strategy Fund LLC | | | 399,310 | | | | 128,453 | | | | 0.00 | (a) | | Side Pocket* |
Brevan Howard L.P. (b) | | | 1,324,971 | | | | 3,041,496 | | | | 0.11 | | | Monthly |
Caxton Global Investments (USA) LLC (b) | | | 60,000,000 | | | | 61,322,489 | | | | 2.28 | | | Quarterly |
D.E. Shaw Oculus Fund, L.L.C. (b) | | | 89,392,961 | | | | 118,682,697 | | | | 4.42 | | | Quarterly |
Winton Diversified Futures Fund (US) L.P. (i) | | | 91,000,000 | | | | 96,879,982 | | | | 3.62 | | | Monthly |
| | | | | | | | | | | | | | |
Total | | | 242,117,242 | | | | 280,055,117 | | | | 10.43 | | | |
| | | | | | | | | | | | | | |
| | | | |
Relative Value | | | | | | | | | | | | | | |
Aristeia Partners, L.P. (b) | | | 128,000,000 | | | | 123,572,536 | | | | 4.61 | | | Quarterly |
GoldenTree Partners, L.P. (b) | | | 4,177,312 | | | | 10,754,479 | | | | 0.40 | | | In Liquidation** |
Good Hill SPV, Ltd. | | | 213,659 | | | | 173,927 | | | | 0.01 | | | In Liquidation** |
GSO Special Situations Fund LP (h) | | | 131,931,726 | | | | 122,230,898 | | | | 4.55 | | | Quarterly |
King Street Capital, L.P. (b) | | | 40,600,000 | | | | 40,148,117 | | | | 1.49 | | | Quarterly |
Magnetar Capital Fund, LP | | | 273,527 | | | | 42,083 | | | | 0.00 | (a) | | In Liquidation** |
Magnetar Risk Linked Fund (US), Ltd. | | | 294,734 | | | | 471,606 | | | | 0.02 | | | Side Pocket* |
Magnetar SPV LLC | | | 10,218 | | | | 10,560 | | | | 0.00 | (a) | | In Liquidation** |
Pine River Fund, L.P. (b) | | | 48,000,000 | | | | 47,163,147 | | | | 1.76 | | | Quarterly |
Tricadia Credit Strategies L.P. | | | 119,000,000 | | | | 120,186,414 | | | | 4.47 | | | Quarterly |
Waterfall Victoria Fund, L.P. | | | 1,308 | | | | 17,270 | | | | 0.00 | (a) | | Side Pocket* |
| | | | | | | | | | | | | | |
Total | | | 472,502,484 | | | | 464,771,037 | | | | 17.31 | | | |
| | | | | | | | | | | | | | |
Total Investments in Investment Funds | | | 2,407,350,010 | | | | 2,526,974,331 | | | | 94.12 | | | |
| | | | | | | | | | | | | | |
The accompanying notes are an integral part of these financial statements.
1
J.P. Morgan Access Multi-Strategy Fund, L.L.C.
Schedule of Investments (continued)
September 30, 2015
(Unaudited)
| | | | | | | | | | | | | | |
| Private Equity Investment | | Cost ($) | | | Fair Value ($) | | | % of
Members’
Capital | | | Liquidity (e) |
United States: | | | | | | | | | | | | | | |
Energy | | | | | | | | | | | | | | |
BlackLight Power, Inc. (f) | | | 179,400 | | | | 134,550 | | | | 0.01 | | | Illiquid*** |
| | | | | | | | | | | | | | |
Total Private Equity Investment | | | 179,400 | | | | 134,550 | | | | 0.01 | | | |
| | | | | | | | | | | | | | |
| | | | |
Short-Term Investment | | | | | | | | | | | | | | |
| | | | |
Investment Company | | | | | | | | | | | | | | |
JPMorgan Prime Money Market Fund, Institutional Class Shares,
0.01% (b),(c),(d) | | | 21,350,847 | | | | 21,350,847 | | | | 0.80 | | | Daily |
| | | | | | | | | | | | | | |
| | | | |
Total Investments | | | 2,428,880,257 | | | | 2,548,459,728 | | | | 94.93 | | | |
| | | | |
Other Assets, less Liabilities | | | | | | | 136,226,717 | | | | 5.07 | | | |
| | | | | | | | | | | | | | |
| | | | |
Members’ Capital | | | | | | | 2,684,686,445 | | | | 100.00 | | | |
| | | | | | | | | | | | | | |
| (a) | Amount rounds to less than 0.01%. |
| (b) | Partially or wholly held in a pledged account by the Custodian as collateral for existing line of credit. The aggregate value of collateral pledged for the line of credit is $1,952,777,821. |
| (c) | Investment in affiliate. The Fund holds 21,350,847 shares in the JPMorgan Prime Money Market Fund, which is registered under the Investment Company Act of 1940, as amended, and advised by J.P. Morgan Investment Management Inc. |
| (d) | The rate shown is the current yield as of September 30, 2015. |
| (e) | Certain funds may be subject to an initial lock-up period, as described in Note 1 of the financial statements. |
| (f) | Received 15 shares via an in-kind distribution from Black Bear I, L.P. Fund. |
| (g) | Investment Fund was reclassified from “Long/Short Equities” strategy during the reporting period. |
| (h) | Investment Fund was reclassified from “Event Driven – Distressed” strategy during the reporting period. |
| (i) | Investment Fund was reclassified from “Diversified” strategy during the reporting period. |
| * | A side pocket is an account within the Investment Fund that has additional restrictions on liquidity. |
| ** | The Investment Fund is in the process of ceasing its operations or has created a special purpose vehicle to handle the orderly disposition of the underlying assets, which may result in J.P. Morgan Access Multi-Strategy Fund, L.L.C.’s delayed receipt of redemption proceeds. |
| *** | Subject to in-kind distribution liquidity provisions. |
The accompanying notes are an integral part of these financial statements.
2
J.P. Morgan Access Multi-Strategy Fund, L.L.C.
Schedule of Investments (continued)
September 30, 2015
(Unaudited)
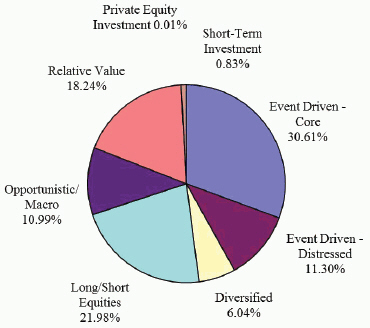
Investment Strategy as a Percentage of Total Investments
The management agreements of the general partners/managers provide for compensation to such general partners/managers in the form of management fees ranging from 1% to 3% annually of net assets and incentives of 15% to 30% of net profits earned.
The accompanying notes are an integral part of these financial statements.
3
J.P. Morgan Access Multi-Strategy Fund, L.L.C.
Statement of Assets, Liabilities and Members’ Capital
September 30, 2015
(Unaudited)
| | | | |
Assets | | | | |
| |
Investments, at fair value (cost $2,407,529,410) | | $ | 2,527,108,881 | |
Investment in affiliate, at fair value (cost $19,855,503) | | | 19,855,503 | |
Investment in affiliate - restricted, at fair value (cost $1,495,344) (See Note 4) | | | 1,495,344 | |
| | | | |
Total Investments, at fair value (cost $2,428,880,257) | | | 2,548,459,728 | |
| |
Cash | | | 2,617 | |
Receivable for Investment Funds sold | | | 217,186,384 | |
Investments paid in advance (see Note 2c) | | | 61,000,000 | |
Prepaid expenses | | | 43,892 | |
Dividend receivable from affiliate | | | 3,650 | |
| | | | |
Total assets | | | 2,826,696,271 | |
| | | | |
| |
Liabilities | | | | |
Tender offer proceeds payable | | | 113,273,732 | |
Contributions received in advance (see Note 6) | | | 21,323,056 | |
Management Fee payable | | | 5,889,216 | |
Administration Fee payable | | | 710,115 | |
Professional fees payable | | | 403,369 | |
Credit facility fees payable | | | 87,500 | |
Other accrued expenses | | | 322,838 | |
| | | | |
Total liabilities | | | 142,009,826 | |
| | | | |
| |
Members’ capital | | $ | 2,684,686,445 | |
| | | | |
The accompanying notes are an integral part of these financial statements.
4
J.P. Morgan Access Multi-Strategy Fund, L.L.C.
Statement of Operations
For the six months ended September 30, 2015
(Unaudited)
| | | | |
Investment income | | | | |
Dividend income from affiliate | | $ | 35,119 | |
| | | | |
Total investment income | | | 35,119 | |
| | | | |
| |
Expenses | | | | |
Management Fee (see Note 3) | | | 18,496,852 | |
Administration Fee (see Note 3) | | | 2,219,622 | |
Credit facility fees (see Note 4) | | | 1,066,417 | |
Fund accounting and custodian fees | | | 637,287 | |
Investor servicing fees | | | 339,463 | |
Professional fees | | | 276,058 | |
Insurance | | | 52,670 | |
Directors’ and Chief Compliance Officer’s fees | | | 10,135 | |
Interest (see Note 4) | | | 2,914 | |
Other | | | 238,196 | |
| | | | |
Total expenses | | | 23,339,614 | |
| | | | |
| |
Less: Waivers and/or expense reimbursements (see Note 3) | | | (121,350) | |
| | | | |
Net expenses | | | 23,218,264 | |
| | | | |
| |
Net investment income/(loss) | | | (23,183,145) | |
| | | | |
| |
Realized and unrealized gain/(loss) | | | | |
Net realized gain/(loss) from Investment Fund transactions | | | 38,066,277 | |
Net change in unrealized appreciation/(depreciation) on Investment Funds | | | (193,712,271) | |
| | | | |
| |
Net realized and unrealized gain/(loss) | | | (155,645,994) | |
| | | | |
| |
Net decrease in members’ capital resulting from operations | | $ | (178,829,139) | |
| | | | |
The accompanying notes are an integral part of these financial statements.
5
J.P. Morgan Access Multi-Strategy Fund, L.L.C.
Statements of Changes in Members’ Capital
For the six months ended September 30, 2015 (Unaudited)
| | | | | | | | | | | | | | | | |
| | | Managing
Member* | | | Special
Member | | | Other
Members | | | Total | |
| | | | |
From investment activities | | | | | | | | | | | | | | | | |
| | | | |
Net investment income/(loss) | | $ | (28 | ) | | $ | (13,487 | ) | | $ | (23,169,630 | ) | | $ | (23,183,145) | |
Net realized gain/(loss) from Investment Fund transactions | | | 221 | | | | 34,353 | | | | 38,031,703 | | | | 38,066,277 | |
Net change in unrealized appreciation/(depreciation) on Investment Funds | | | (205 | ) | | | (142,512 | ) | | | (193,569,554 | ) | | | (193,712,271) | |
Performance allocation | | | – | | | | (8,859,230 | ) | | | 8,859,230 | | | | – | |
| | | | |
Net increase/(decrease) in members’ capital resulting from operations | | | (12 | ) | | | (8,980,876 | ) | | | (169,848,251 | ) | | | (178,829,139) | |
| | | | |
From members’ capital transactions | | | | | | | | | | | | | | | | |
| | | | |
Capital contributions | | | – | | | | – | | | | 191,734,744 | | | | 191,734,744 | |
Repurchase fee | | | – | | | | 22 | | | | 40,947 | | | | 40,969 | |
Capital repurchases | | | (14,420 | ) | | | – | | | | (285,098,188 | ) | | | (285,112,608) | |
| | | | |
Net increase/(decrease) in members’ capital resulting from capital transactions | | | (14,420 | ) | | | 22 | | | | (93,322,497 | ) | | | (93,336,895) | |
| | | | |
Net change in members’ capital | | | (14,432 | ) | | | (8,980,854 | ) | | | (263,170,748 | ) | | | (272,166,034) | |
| | | | |
Members’ capital at beginning of period | | | 14,432 | | | | 10,892,814 | | | | 2,945,945,233 | | | | 2,956,852,479 | |
| | | | |
| | | | |
Members’ capital at end of period | | $ | – | | | $ | 1,911,960 | | | $ | 2,682,774,485 | | | $ | 2,684,686,445 | |
| | | | |
* As described in Note 1, the Fund’s managing member changed from JPMorgan Investment Management, Inc. (“JPMIM”) to MSFMM, Inc. (“MSFMM”). On July 1, 2015, MSFMM made a capital contribution of less than $1 and JPMIM redeemed its entire investment in the Fund. For the year ended March 31, 2015 | |
| | | Managing
Member | | | Special
Member | | | Other
Members | | | Total | |
| | | | |
From investment activities | | | | | | | | | | | | | | | | |
| | | | |
Net investment income/(loss) | | $ | (271 | ) | | $ | (11,186 | ) | | $ | (45,377,552 | ) | | $ | (45,389,009) | |
Net realized gain/(loss) from Investment Fund transactions | | | 345 | | | | 17,119 | | | | 118,728,511 | | | | 118,745,975 | |
Net change in unrealized appreciation/(depreciation) on Investment Funds | | | 375 | | | | 18,252 | | | | 29,970,155 | | | | 29,988,782 | |
Performance allocation | | | – | | | | 10,096,277 | | | | (10,096,277 | ) | | | – | |
| | | | |
Net increase/(decrease) in members’ capital resulting from operations | | | 449 | | | | 10,120,462 | | | | 93,224,837 | | | | 103,345,748 | |
| | | | |
From members’ capital transactions | | | | | | | | | | | | | | | | |
| | | | |
Capital contributions | | | – | | | | – | | | | 841,386,157 | | | | 841,386,157 | |
Repurchase fee | | | – | | | | 26 | | | | 98,971 | | | | 98,997 | |
Capital repurchases | | | – | | | | (2,354,758 | ) | | | (328,830,695 | ) | | | (331,185,453) | |
| | | | |
Net increase/(decrease) in members’ capital resulting from capital transactions | | | – | | | | (2,354,732 | ) | | | 512,654,433 | | | | 510,299,701 | |
| | | | |
Net change in members’ capital | | | 449 | | | | 7,765,730 | | | | 605,879,270 | | | | 613,645,449 | |
| | | | |
Members’ capital at beginning of year | | | 13,983 | | | | 3,127,084 | | | | 2,340,065,963 | | | | 2,343,207,030 | |
| | | | |
| | | | |
Members’ capital at end of year | | $ | 14,432 | | | $ | 10,892,814 | | | $ | 2,945,945,233 | | | $ | 2,956,852,479 | |
| | | | |
The accompanying notes are an integral part of these financial statements.
6
J.P. Morgan Access Multi-Strategy Fund, L.L.C.
Statement of Cash Flows
For the six months ended September 30, 2015
(Unaudited)
| | | | |
Cash flows from operating activities | | | | |
| |
Net decrease in members’ capital resulting from operations | | $ | (178,829,139) | |
| Adjustments to reconcile net decrease in members’ capital from operations to net cash provided by operating activities: | | | | |
Purchases of Investment Funds | | | (366,600,000) | |
Sales of Investment Funds | | | 468,213,897 | |
Purchases of short-term investments, net | | | (10,044,179) | |
Net realized (gain)/loss from Investment Fund transactions | | | (38,066,277) | |
Net change in unrealized (appreciation)/depreciation on Investment Funds | | | 193,712,271 | |
Decrease in investments paid in advance | | | 77,000,000 | |
Decrease in prepaid expenses | | | 52,669 | |
Decrease in receivable for Investment Funds sold | | | 60,187,933 | |
Increase in dividend receivable from affiliate | | | (636) | |
Decrease in Administration Fee payable | | | (70,316) | |
Decrease in interest payable | | | (897) | |
Decrease in Management Fee payable | | | (582,836) | |
Increase in credit facility fees payable | | | 333 | |
Increase in professional fees payable | | | 96,475 | |
Decrease in other accrued expenses | | | (13,366) | |
| | | | |
| |
Net cash provided by operating activities | | | 205,055,932 | |
| | | | |
| |
Cash flows from financing activities | | | | |
| |
Capital contributions, including change in contributions received in advance | | | 165,931,418 | |
Capital redemptions, including change in tender offer proceeds payable and repurchase fees | | | (366,984,733) | |
Repayment of loan payable | | | (4,000,000) | |
| | | | |
| |
Net cash used in financing activities | | | (205,053,315) | |
| | | | |
| |
Net increase in cash | | | 2,617 | |
| |
Cash at beginning of period | | | – | |
| | | | |
Cash at end of period | | $ | 2,617 | |
| | | | |
| |
Supplemental disclosure of cash flow information | | | | |
| |
Cash paid during the period for interest | | $ | 3,811 | |
| | | | |
For purposes of reporting the statement of cash flows, the Fund considers all cash accounts that are not subject to withdrawal restrictions or penalties to be cash equivalents.
The accompanying notes are an integral part of these financial statements.
7
J.P. Morgan Access Multi-Strategy Fund, L.L.C.
Financial Highlights
Ratios and other Financial Highlights
The following represents the ratios to other average Members’ Capital and other financial highlights information for Members’ Capital other than the Managing Member and Special Member.
| | | | | | | | | | | | |
| | | For the six | | | | | | | | | | |
| | | months ended | | | | | | | | | | |
| | | September 30, | | | | | | | | | | |
| | | 2015 | | | | Years Ended March 31, | | |
| | | (Unaudited) | | 2015 | | 2014 | | 2013 | | 2012 | | 2011 |
| | | | | | |
Total return | | (6.04%)(a) | | 3.56% | | 7.88% | | 9.05% | | (0.92%) | | 5.99% |
Performance allocation | | 0.30%(a) | | (0.34%) | | (0.81%) | | (0.84%) | | (0.03%) | | (0.36%) |
Total return after performance allocation | | (5.74%)(a) | | 3.22% | | 7.07% | | 8.21% | | (0.95%) | | 5.63% |
| | | | | | |
| Ratios to other average members’ capital: | | | | | | | | | | | | |
| | | | | | |
Expenses, before waivers | | 1.58%(b)(c) | | 1.60%(b) | | 1.60%(b) | | 1.60%(b) | | 1.70%(b) | | 1.91%(b) |
Expenses, net of waivers | | 1.57%(b)(c) | | 1.59%(b) | | 1.59%(b) | | 1.59%(b) | | 1.70%(b) | | 1.90%(b) |
Performance allocation | | (0.60%)(c) | | 0.35% | | 0.79% | | 0.83% | | 0.04% | | 0.53% |
Expenses, net of performance allocation and net of waivers | | 0.97%(b)(c) | | 1.94% | | 2.38% | | 2.42% | | 1.74% | | 2.43% |
| | | | | | |
Net investment income (loss), before waivers | | (1.58%)(b)(c) | | (1.60%)(b) | | (1.60%)(b) | | (1.60%)(b) | | (1.69%)(b) | | (1.91%)(b) |
Net investment income (loss), net of waivers | | (1.57%)(b)(c) | | (1.59%)(b) | | (1.59%)(b) | | (1.59%)(b) | | (1.69%)(b) | | (1.90%)(b) |
| | | | | | |
Portfolio turnover rate | | 12.94%(a) | | 32.38% | | 22.18% | | 23.95% | | 6.21% | | 37.88% |
| | | | | | |
Members’ Capital applicable to Other Members | | $2,682,774,485 | | $2,945,945,233 | | $2,340,065,963 | | $1,170,171,993 | | $889,423,998 | | $501,099,254 |
The above ratios and total returns are calculated for Other Members taken as a whole. An individual investor’s return may vary from these returns based on the timing of capital contributions and performance allocation.
The above expense ratios do not include the expenses from the investment funds and affiliated money market fund. However, total returns take into account all expenses.
| (b) | The Investment Manager waived and/or reimbursed a portion of its fees for the period pursuant to the agreement between the Fund and the Investment Manager. |
The accompanying notes are an integral part of these financial statements.
8
J.P. Morgan Access Multi-Strategy Fund, L.L.C.
Notes to Financial Statements September 30, 2015 (Unaudited)
1. Organization
J.P. Morgan Access Multi-Strategy Fund, L.L.C. (the “Fund”) was organized as a limited liability company on April 6, 2004 under the laws of the State of Delaware and is registered under the Investment Company Act of 1940, as amended (the “1940 Act”), as a closed-end, non-diversified, management investment company. The Fund’s investment objective is to generate consistent capital appreciation over the long term, with relatively low volatility and a low correlation with traditional equity and fixed-income markets. The Fund will seek to accomplish this objective by allocating its assets primarily among professionally selected investment funds (collectively, “Investment Funds” and each individually, “Investment Fund”) that are managed by experienced third-party investment advisers (“Portfolio Managers”) who invest in a variety of markets and employ, as a group, a range of investment techniques and strategies. There can be no assurance that the Fund will achieve its investment objective.
The following is a description of strategies used by third party investment advisors:
Diversified – Investment Funds within this strategy employ two or more of the strategies described below. Investment Funds within this strategy are generally subject to 30 day redemption notice periods.
Event Driven – Core – Invests in securities of companies involved in mergers, acquisitions, restructurings, liquidations, spin-offs, or other special situations that alter a company’s financial structure or operating strategy. Investment Funds within this strategy are generally subject to 30-90 day redemption notice periods and may have lock-up periods of up to two years as of September 30, 2015.
Event Driven - Distressed – Invests in debt and equity securities of companies in financial difficulty, reorganization or bankruptcy, nonperforming and sub-performing bank loans, and emerging market debt. Investment Funds within this strategy are generally subject to 90 day redemption notice periods and may have lock-up periods of up to one year as of September 30, 2015.
Long/Short Equities – Invests in long and short equity securities that are deemed to be under or overvalued. Investment Funds within this strategy are generally subject to 30-90 day redemption notice periods and may have lock-up periods of up to one year as of September 30, 2015.
Opportunistic/Macro – Invests in a wide variety of instruments using a broad range of strategies, often assuming an aggressive risk posture. This strategy uses a combination of macro-economic models and fundamental research to invest across countries, markets, sectors and companies, and have the flexibility to invest in numerous financial instruments. Investment Funds within this strategy are generally subject to 30-90 day redemption notice periods.
Relative Value – Makes simultaneous purchases and sales of similar securities to exploit pricing differentials or have long exposure in non-equity oriented beta opportunities (such as credit). Different relative value strategies include convertible bond arbitrage, statistical arbitrage, pairs trading, yield curve arbitrage and basis trading. Investment Funds within this strategy are generally subject to 45-90 day redemption notice periods and may have lock-up periods of up to one year as of September 30, 2015.
9
J.P. Morgan Access Multi-Strategy Fund, L.L.C.
Notes to Financial Statements September 30, 2015 (Unaudited) (continued)
1. Organization (continued)
J.P. Morgan Investment Management, Inc. (“JPMIM” or the “Investment Manager”), a corporation formed under the laws of the State of Delaware and a wholly-owned subsidiary of JPMorgan Chase & Co. (“JPMorgan Chase”), is responsible for the day-to-day management of the Fund, subject to policies adopted by the Board of Directors (the “Board”). The Investment Manager has in turn delegated substantially all investment authority and the allocation of the Fund’s assets among the Investment Funds and other instruments to J.P. Morgan Private Investments Inc. (the “Sub-Advisor” or “JPMPI”), a corporation formed under the laws of the State of Delaware and a wholly-owned subsidiary of JPMorgan Chase. The Sub-Advisor will allocate Fund assets among the Investment Funds and other investments that, in its view, represent attractive investment opportunities. Effective July 1, 2015, the managing member of the Fund was changed from JPMIM to MSFMM, Inc. (“MSFMM” or the “Managing Member”), an entity established by Intertrust Group B.V. The Fund’s limited liability company agreement (“LLC Agreement”) was amended to reflect this change. In conjunction with that change, MSFMM made a capital contribution of less than $1 and JPMIM redeemed its entire investment in the Fund.
Both the Investment Manager and the Sub-Advisor are registered as investment advisers under the Investment Advisers Act of 1940, as amended (the “Advisers Act”).
2. Significant Accounting Policies
a. Use of Estimates
The following is a summary of significant accounting policies followed by the Fund in the preparation of its financial statements. The Fund is an investment company and, accordingly, follows the investment company accounting and reporting guidance of the Financial Accounting Standards Board (“FASB”) Accounting Standards Codification Topic 946 - Investment Companies, which is part of U.S. generally accepted accounting principles (“GAAP”). The preparation of financial statements in conformity with GAAP requires management to make estimates and assumptions that affect the reported amounts of assets and liabilities and disclosure of contingent assets and liabilities at the date of the financial statements and the reported amounts of increases and decreases in net assets from operations during the reporting period. Actual results could differ from those estimates.
b. Valuation of Investments
The valuation of the investments is in accordance with GAAP and the Fund’s valuation policies set forth by and under the supervision and responsibility of the Board, which established the following approach to valuation, as described more fully below. The Fund values its investments in Investment Funds at fair value. Fair value as of each month-end ordinarily is the net asset value (“NAV”) determined as of such month-end for each Investment Fund in accordance with the Investment Fund’s valuation policies and reported at the time of the Fund’s valuation.
10
J.P. Morgan Access Multi-Strategy Fund, L.L.C.
Notes to Financial Statements September 30, 2015 (Unaudited) (continued)
2. Significant Accounting Policies (continued)
b. Valuation of Investments (continued)
JPMorgan Funds Management, Inc. (the “Administrator” or “JPMFM”), an indirect, wholly owned subsidiary of JPMorgan Chase, has established the J.P. Morgan Asset Management Americas Valuation Committee (“AVC”) to assist the Board with the oversight and monitoring of the valuation of the Funds’ investments. The Administrator implements the valuation policies of the Fund’s investments, as directed by the Board. The AVC oversees and carries out the policies for the valuation of investments held in the Fund as described in detail below. The Administrator is responsible for discussing and assessing the potential impacts to the fair values on an ongoing basis, and at least on a quarterly basis with the AVC and the Board.
On a monthly basis, NAV is used to determine the fair value of all underlying investments which (a) do not have readily determinable fair values and (b) either have the attributes of an investment company or prepare their financial statements consistent with measurement principles of an investment company. As a general matter, the fair value of the Fund’s interest in an Investment Fund will represent the amount that the Fund could reasonably expect to receive from an Investment Fund if the Fund’s interest were redeemed at the time of the valuation, based on information reasonably available at the time the valuation is made and that the Administrator believes to be reliable. In the unlikely event that an Investment Fund does not report a month-end NAV to the Fund on a timely basis, the Administrator would determine the fair value of such Investment Fund based on the most recent value reported by the Investment Fund, as well as any other relevant information available at such time. Considerable judgment is required to interpret the factors used to develop estimates at fair value. These factors include, but are not limited to, a review of the underlying securities of the Investment Fund when available, ongoing due diligence of the style, strategy and valuation methodology employed by each Investment Fund, and a review of market inputs that may be expected to impact the performance of a particular Investment Fund. The use of different factors and estimation methodologies could have a significant effect on the estimated fair value and could be material to the financial statements.
Some of the Investment Funds may invest all or a portion of their assets in investments which may be illiquid. Some of these investments are held in “side pockets”, sub funds within the Investment Funds, which provide for their separate liquidation potentially over a much longer period than the liquidity an investment in the Investment Funds may provide. Should the Fund seek to liquidate its investment in an Investment Fund which maintains investments in a side pocket arrangement or which holds substantially all of its assets in illiquid investments, the Fund might not be able to fully liquidate its investment without considerable delay. In such cases, the value of its investment could fluctuate during the period until the Fund is permitted to fully liquidate its interest in the Investment Funds.
Investments in the affiliated money market fund are valued at such fund’s NAV per share as of the valuation date.
Valuations reflected in this report are as of the report date. As a result, changes in valuation due to market events and/or issuer related events after the report date and prior to issuance of the report are not reflected herein.
11
J.P. Morgan Access Multi-Strategy Fund, L.L.C.
Notes to Financial Statements September 30, 2015 (Unaudited) (continued)
2. Significant Accounting Policies (continued)
b. Valuation of Investments (continued)
The various inputs that are used in determining the fair value of the Fund’s investments are summarized into the three broad levels listed below.
Level 1 – Unadjusted inputs using quoted prices in active markets for identical investments.
Level 2 – Other significant observable inputs including, but not limited to, quoted prices for similar investments or other significant observable inputs.
Level 3 – Significant inputs based on the best information available in the circumstances, to the extent observable inputs are not available (including the Fund’s assumptions in determining the fair value of investments).
A financial instrument’s level within the fair value hierarchy is based on the lowest level of any input both individually and in aggregate that is significant to the fair value measurement. The inputs or methodology used for valuing instruments are not necessarily an indication of the risk associated with investing in those instruments.
The Fund’s investments in an affiliated money market mutual fund and a private equity investment, as disclosed on the Schedule of Investments, are designated as Level 1 and Level 3, respectively.
The Fund has adopted the Financial Accounting Standards Board (“FASB”) Accounting Standards Update (“ASU”) No. 2015-07 (“ASU 2015-07”), Fair Value Measurement (Topic 820), Disclosures for Investments in Certain Entities That Calculate Net Asset Value per Share (or Its Equivalent). ASU 2015-07 removes the requirement to categorize within the fair value hierarchy all investments for which fair value is measured using the NAV per share practical expedient. Accordingly, as of September 30, 2015, Investment Funds with a fair value of $2,526,974,331 have not been categorized in the fair value hierarchy.
c. Investments Paid in Advance
Investments paid in advance represent cash which has been sent to Investment Funds prior to September 30, 2015 but the investment is not effective until October 1, 2015. At September 30, 2015, the Fund made the following commitments to purchase Investment Funds:
| | | | |
| Investment Fund | | Amount | |
| |
Lakewood Capital Partners, L.P.* | | $ | 20,000,000 | |
King Street Capital, L.P. | | | 20,000,000 | |
Third Point Partners Qualified L.P. | | | 21,000,000 | |
| | | | |
Total | | $ | 61,000,000 | |
| | | | |
* The Investment Fund utilizes the long/short equities strategy subject to a 60 day redemption notice period and has quarterly liquidity.
12
J.P. Morgan Access Multi-Strategy Fund, L.L.C.
Notes to Financial Statements September 30, 2015 (Unaudited) (continued)
2. Significant Accounting Policies (continued)
d. Distributions from Investment Funds
Distributions received from Investment Funds, whether in the form of cash or securities, are applied as a reduction of the investment’s cost when identified by the Investment Fund as a return of capital. Once the investment’s cost is received, any further distributions are recognized as realized gains.
e. Income Recognition and Security Transactions
Distributions of net investment income and realized capital gains from the affiliated money market fund, if any, are recorded on the ex-dividend date. Interest income is recorded on an accrual basis. Realized gains and losses from Investment Fund transactions are calculated based on the identified cost basis. Investments are recorded on the effective date of the subscription in the Investment Fund. All changes in the value of the Investment Funds are included in the net change in unrealized appreciation/(depreciation) on the Statement of Operations.
f. Fund Expenses
The Fund bears all expenses incurred in its business other than those that the Investment Manager assumes. The expenses of the Fund include, but are not limited to, the following: all costs and expenses related to investment transactions and positions for the Fund’s account; legal fees; accounting and auditing fees; custodial fees; costs of computing the Fund’s net asset value; costs of insurance; registration expenses; expenses of meetings of the Board; all costs with respect to communications to members (the “Members”); and other types of expenses as may be approved from time to time by the Board.
The Fund invests in Investment Funds and, as a result, bears a portion of the expenses incurred by these Investment Funds. These expenses are not reflected in the expenses shown on the Statement of Operations and are not included in the ratios to other average net assets shown in the Financial Highlights. Certain expenses incurred indirectly through investment in the affiliated money market fund are waived by the Fund as described in Note 3.
g. Income Taxes
The Fund intends to operate and has elected to be treated as a partnership for federal income tax purposes. Accordingly, no provision for the payment of federal, state or local income taxes has been provided. Each member is individually responsible to report on its own tax return its distributive share of the Fund’s taxable income or loss.
The Investment Manager evaluates tax positions taken or expected to be taken in the course of preparing the Fund’s financial statements to determine whether the tax positions are “more-likely-than-not” of being sustained by the applicable tax authority. Tax positions with respect to tax at the Fund level not deemed to meet the “more-likely-than-not” threshold would be recorded as a tax benefit or expense in the current year. The Investment Manager is not aware of any tax positions for which it is reasonably possible that the total amounts of unrecognized tax benefits or expense will significantly change in the next twelve months. The Investment Manager’s conclusions regarding tax positions will be subject to review and may be adjusted at a later date based on factors including, but not limited to, on-going analyses of tax laws, regulations and interpretations thereof.
13
J.P. Morgan Access Multi-Strategy Fund, L.L.C.
Notes to Financial Statements September 30, 2015 (Unaudited) (continued)
2. Significant Accounting Policies (continued)
g. Income Taxes (continued)
The Investment Manager has reviewed the Fund’s tax positions for all open tax years and has determined that as of September 30, 2015, no liability for income tax is required in the Fund’s financial statements for net unrecognized tax benefits. However, Investment Management’s conclusions may be subject to future review based on changes in, or the interpretation of, the accounting standards or tax laws and regulations. The Fund’s Federal tax returns for the prior three fiscal years remains subject to examination by the Internal Revenue Service.
3. Management Fee, Related Party Transactions and Other
The Fund has entered into an investment management agreement with the Investment Manager. In consideration of the advisory services provided by the Investment Manager to the Fund, the Fund pays the Investment Manager a management fee of 1.25% per year (the “Management Fee”), payable monthly at the rate of 1/12 of 1.25% of the month-end capital account balance of each Member, before giving effect to repurchases, Repurchase Fees (if any, as defined below) or the Performance Allocation (as defined below), but after giving effect to the Fund’s other expenses. The Management Fee is an expense paid out of the Fund’s assets. The Management Fee is paid monthly in arrears within 30 days of the calculation of the Fund’s month-end Members’ Capital of each month. For the six months ended September 30, 2015, the Management Fee earned by JPMIM totaled $18,496,852.
The Investment Manager, on behalf of the Fund, has entered into an investment sub-advisory agreement with JPMPI. For its services as sub-advisor, the Investment Manager pays JPMPI a monthly sub-advisory fee of 1/12 of 1.10% of the month-end capital balance of each Member of the Fund.
The Sub-Advisor is the special member of the Fund (the “Special Member”). The Special Member is entitled to all incentive-based performance allocations, if any, from Members’ accounts (see Note 6).
Pursuant to an Administration Agreement, the Administrator provides certain administration services to the Fund. In consideration of these services, the Administrator receives a fee (the “Administration Fee”) paid monthly at the annual rate of 0.15% of the Fund’s month end net assets before repurchases, Repurchase Fees, or the performance allocation, but after giving effect to the Fund’s other expenses. For the six months ended September 30, 2015, the Administration Fee earned by JPMFM totaled $2,219,622.
The Investment Manager and the Sub-Advisor, have contractually agreed to waive fees and/or reimburse the Fund to the extent that total annual operating expenses (excluding acquired fund fees and expenses, interest, brokerage commissions, other transaction-related expenses and any extraordinary expenses as well as any Performance Allocation) exceed 1.92% on an annualized basis of the Fund’s net assets as of the end of each month. This expense limitation agreement is in effect until June 30, 2016. There were no fees waived pursuant to this agreement during the six months ended September 30, 2015.
14
J.P. Morgan Access Multi-Strategy Fund, L.L.C.
Notes to Financial Statements September 30, 2015 (Unaudited) (continued)
3. Management Fee, Related Party Transactions and Other (continued)
The Fund may invest in one or more money market funds advised by the Investment Manager or its affiliates. The Investment Manager and Administrator waive fees in an amount sufficient to offset the respective fees each charges to the affiliated money market fund on the Fund’s investment in such affiliated money market fund. A portion of the waiver is voluntary. The amount of waivers resulting from investments in the money market fund for the six months ended September 30, 2015 was $121,350.
Entities may be retained by the Fund to assist in the placement of interests. These entities (“Placement Agents” or “Intermediaries”), which may include the Investment Manager and its affiliates, will generally be entitled to receive a placement fee of up to 2.0% of the invested amount from each investor purchasing an interest through a Placement Agent. The placement fee will be added to a prospective investor’s subscription amount; it will not constitute a capital contribution made by the investor to the Fund nor will it be included as part of the assets of the Fund. The placement fee may be adjusted or waived in the sole discretion of the Placement Agent.
Certain officers of the Fund are affiliated with the Investment Manager and the Administrator. Such officers, with the exception of the Chief Compliance Officer, receive no compensation from the Fund for serving in their respective roles.
The Board appointed a Chief Compliance Officer to the Fund in accordance with Federal securities regulations. The Fund, along with other affiliated funds, makes reimbursement payments, on a pro-rata basis, to the Administrator for a portion of the fees associated with the Office of the Chief Compliance Officer. Such fees are included in Directors’ and Chief Compliance Officer’s fees on the Statement of Operations.
The Fund has adopted a Director Deferred Compensation Plan (the “Plan”) which allows the Independent Directors to defer the receipt of all or a portion of compensation related to performance of their duties as a Director. The deferred fees are invested in various J.P. Morgan Funds until distribution in accordance with the Plan.
4. Line of Credit
The Fund has a line of credit with Credit Suisse International and from time to time may borrow cash under a credit agreement, which has a cap of $280 million. Interest charged on borrowings, which is calculated on any outstanding loan balance, and based on a LIBOR-based rate, is payable on a monthly basis. The Fund also pays a monthly fee on the unused amount of the line of credit. The Fund did not have an outstanding loan balance on this credit facility as of September 30, 2015.
15
J.P. Morgan Access Multi-Strategy Fund, L.L.C.
Notes to Financial Statements September 30, 2015 (Unaudited) (continued)
4. Line of Credit (continued)
During the six months ended September 30, 2015, the Fund had borrowings under the credit agreement as follows:
| | | | | | | | |
Average Daily Loan Balance* | | Weighted
Average Interest
Rate | | Interest
Expense | | Number of Days Borrowings Were Outstanding | | Credit Facility Fee** |
$4,000,000 | | 2.19% | | $2,914 § | | 12 | | $1,066,417 § |
| * | For the days borrowings were outstanding. |
| ** | For the fiscal six months ended September 30, 2015. |
| § | Interest expense and credit facility fees incurred for the six months ended September 30, 2015 are included in the Statement of Operations. | |
The Fund is required to pledge cash or securities to Credit Suisse International in an amount equal to a certain percentage of the available line of credit. Securities segregated as collateral are denoted on the Schedule of Investments. Cash collateral posted by the Fund is invested in an affiliated money market fund and reported on the Statement of Assets, Liabilities and Members’ Capital as Investment in affiliate-restricted, at fair value.
5. Security Transactions
Aggregate purchases and sales of Investment Funds for the six months ended September 30, 2015 amounted to $366,600,000 and $468,213,897, respectively.
At September 30, 2015, the estimated cost of investments for federal income tax purposes was $2,509,030,421. Accordingly, gross unrealized appreciation on investments was $94,265,705 and gross unrealized depreciation was $54,836,398, resulting in net unrealized appreciation of $39,429,307. The estimated cost of investments for federal income tax purposes is adjusted for items of taxable income or loss allocated to the Fund from the Investment Funds. The allocated taxable income or loss is reported to the Fund by the Investment Funds on their respective Schedule K-1. The Fund has not yet received such Schedule K-1’s for the tax year ended December 31, 2015; therefore, the tax basis cost of investments as of September 30, 2015 is estimated based on information available, and will not be finalized by the Fund until after the fiscal year end.
6. Contributions, Redemptions, and Performance Allocation
Generally, initial and additional contributions for Interests (“Interests”) by eligible investors may be accepted at such times as the Fund may determine. The Fund reserves the right to reject any contributions for Interests in the Fund. The initial acceptance for contributions for Interests was April 1, 2004 (the “Initial Closing Date”). After the Initial Closing Date, the Fund generally accepts contributions for Interests as of the first day of each month. At September 30, 2015, the Fund received $21,323,056 in contribution proceeds in advance of the October 1, 2015 contribution date, which included Repurchase Fees, as defined below, related to repurchase of Members’ Interests at September 30, 2015. This amount is included in the Statement of Assets, Liabilities and Members’ Capital.
16
J.P. Morgan Access Multi-Strategy Fund, L.L.C.
Notes to Financial Statements September 30, 2015 (Unaudited) (continued)
6. Contributions, Redemptions, and Performance Allocation (continued)
The Fund from time to time may offer to repurchase Interests pursuant to written tenders by Members. These repurchases will be made at such times, and in such amounts, and on such terms as may be determined by the Board, in its sole discretion. The Investment Manager and the Managing Member expect to typically recommend to the Board that the Fund offer to repurchase Interests from Members of up to 25% of the Fund’s net assets quarterly, effective as of the last day of March, June, September, and December. A 1.5% repurchase fee (the “Repurchase Fee”) payable to the Fund will be charged for repurchases of Members’ Interests at any time prior to the day immediately preceding the one-year anniversary of a member’s purchase of its Interests. For the six months ended September 30, 2015, the Fund earned Repurchase Fees of $40,969, which is included on the Statements of Changes in Members’ Capital.
At the end of each Allocation Period of the Fund, any net capital appreciation or net capital depreciation of the Fund (both realized and unrealized), as the case may be, is allocated to the capital accounts of all of the Members (including the Special Member and the Managing Member) in proportion to their respective opening capital account balances for such Allocation Period. The initial “Allocation Period” began on the Initial Closing Date, with each subsequent Allocation Period beginning immediately after the close of the preceding Allocation Period. Each Allocation Period closes on the first to occur of (1) the last day of each month, (2) the date immediately prior to the effective date of (a) the admission of a new member or (b) an increase in a member’s capital contribution, (3) the effective date of any repurchase of Interests, or (4) the date when the Fund dissolves.
At the end of each calendar year, each member’s return on investment for the year is determined and a portion of the net capital appreciation allocated to each member’s capital account during the year (the “Performance Allocation”) if any, net of the member’s allocable share of the Management Fee and the Administrative Fee, equal to 10% of the portion of such net capital appreciation that exceeds the Preferred Return (as defined below) will be reallocated to the capital account of the Special Member. The “Preferred Return” is equal to the 3-month U.S. Treasury Bill yield (as defined below) for each month during the relevant calendar year (or any shorter period of calculation). The “3-month U.S. Treasury Bill yield” for any month shall equal one-twelfth of the annual yield for the 3-month U.S. Treasury Bill for the first business day of the then current calendar quarter as set forth in the U.S. Federal Reserve Statistical Release H.15 (519) under the caption “Treasury constant maturities”, or if such measurement is not available, such other source as the Managing Member may determine appropriate in its discretion.
No Performance Allocation is made, however, with respect to a member’s capital account until any cumulative net capital depreciation previously allocated to such member’s capital account plus any Management Fees and Administrative Fees charged to such capital account (the “Loss Carry forward”) have been recovered. Any Loss Carry forward of a member is reduced proportionately to reflect the repurchase of any portion of that member’s Interest. Upon a repurchase of an Interest (other than at the end of a calendar year) from a member, a Performance Allocation will be determined and allocated to the Special Member, and in the case of any repurchase of a partial Interest, on a “first in—first out” basis (i.e., the portion of the Interest being repurchased and the amount with respect to which the Performance Allocation is calculated) will be deemed to have been taken from the first capital contribution of such member (as such contribution has been adjusted for net capital appreciation or depreciation, Management Fees, Manager Administrative Fees and other expenses) until it is decreased to zero and from each subsequent capital contribution until such contribution (as adjusted) is decreased to zero.
17
J.P. Morgan Access Multi-Strategy Fund, L.L.C.
Notes to Financial Statements September 30, 2015 (Unaudited) (continued)
6. Contributions, Redemptions, and Performance Allocation (continued)
Performance Allocation is earned on a calendar year basis, and is accrued and presented on the Statement of Changes in Members’ Capital on a fiscal year basis. The Performance Allocation for the fiscal year ended March 31, 2015 and the six months ended September 30, 2015 was $10,096,277 and $(8,859,230), respectively. These amounts are reported as Performance Allocation on the Statements of Changes in Members’ Capital.
The Performance Allocation for the fiscal six months ended September 30, 2015 is comprised of the amounts noted below:
| | | | | | | | | | | | |
| | | Performance Allocation Accrual | | | Performance Allocated
to Special Member | | | Total | |
3/31/2015 | | $ | (9,442,525) | * | | $ | - | | | $ | (9,442,525) | |
| | | |
9/30/2015 | | $ | 4,650 | ** | | $ | 578,645 | | | $ | 583,295 | |
| | | | | | | | | | | | |
| | | |
| | | | | | | | | | $ | (8,859,230) | |
| | * | Represents the reversal of the prior period fiscal year’s accrual, as no actual Performance Allocation occurred. |
| | ** | The amount accrued for the period January 1, 2015 to September 30, 2015. This amount is subject to change as actual Performance Allocation occurs at the end of the calendar year. | |
The Performance Allocation for the fiscal year ended March 31, 2015 is comprised of the amounts noted below:
| | | | | | | | | | | | |
| | | Performance
Allocation Accrual | | | Performance Allocated
to Special Member | | | Total | |
12/31/2014 | | $ | (2,543,568 | ) *** | | $ | 2,547,061 | | | $ | 3,493 | |
| | | |
3/31/2015 | | $ | 9,442,525 | | | $ | 650,259 | | | $ | 10,092,784 | |
| | | | | | | | | | | | |
| | | |
| | | | | | | | | | $ | 10,096,277 | |
| | *** | Represents the reversal of the prior period fiscal year’s accrual, as no actual Performance Allocation occurred. |
7. Risk Exposure
In the normal course of business, the Investment Funds trade various financial instruments and enter into various investment activities with off-balance sheet risk. These include, but are not limited to, short-selling activities, writing option contracts, contracts for differences, and interest rate, credit default and total return equity swaps contracts. The Fund’s risk of loss in these Investment Funds is limited to the value of the Fund’s investments in the Investment Funds.
In pursuing its investment objectives, the Fund invests in Investment Funds that are not registered under the 1940 Act. These Investment Funds may utilize diverse investment strategies, which are not generally managed against traditional investment indices. The Investment Funds selected by the Fund will invest in and actively trade securities
18
J.P. Morgan Access Multi-Strategy Fund, L.L.C.
Notes to Financial Statements September 30, 2015 (Unaudited) (continued)
7. Risk Exposure (continued)
and other financial instruments using a variety of strategies and investment techniques that may involve significant risks. Such risks arise from the volatility of the equity, fixed income, commodity and currency markets, leverage both on and off balance sheet associated with borrowings, short sales and derivative instruments, the potential illiquidity of certain instruments including emerging markets, private transactions, derivatives, and counterparty and broker defaults. Various risks are also associated with an investment in the Fund, including risks relating to the multi-manager structure of the Fund, risks relating to compensation arrangements and risks related to limited liquidity of the Investment Funds. The Investment Funds provide for periodic redemptions generally ranging from monthly to semi-annually, and may be subject to various lock-up provisions and early withdrawal fees.
Because of the Fund’s investment in the Investment Funds, the Fund indirectly pays a portion of the expenses incurred by the Investment Funds. As a result, a cost of investing in the Fund may be higher than the cost of investing in a fund that invests directly in individual securities and financial instruments.
The investments of the Investment Funds are subject to normal market fluctuations and other risks inherent in investing in securities and there can be no assurance that any appreciation in value will occur. The value of investments can fall as well as rise and investors may not realize the amount that they invest.
Although the Investment Manager will seek to select Investment Funds that offer the opportunity to have their shares or units redeemed within a reasonable timeframe, there can be no assurance that the liquidity of the investments of such Investment Funds will always be sufficient to meet redemption requests as, and when, made.
The Investment Manager may invest the Fund’s assets in Investment Funds that invest in illiquid securities and do not permit frequent withdrawals. Illiquid securities owned by Investment Funds are generally riskier than liquid securities because the Investment Funds may not be able to dispose of the illiquid securities if their investment performance deteriorates, or may be able to dispose of the illiquid securities only at a greatly reduced price. Similarly, the illiquidity of the Investment Funds may cause Members to incur losses because of an inability to withdraw their investments from the Fund during or following periods of negative performance.
The Investment Funds may invest in the securities of foreign companies that involve special risks and considerations not typically associated with investing in U.S. companies. These risks include devaluation of currencies, less reliable information about issuers, different securities transaction clearance and settlement practices, and future adverse political and economic developments. Moreover, securities of many foreign companies and their markets may be less liquid and their prices more volatile than those securities of comparable U.S. companies.
Since the Fund is non-diversified, it may invest a greater percentage of its assets in a particular issuer or group of issuers than a diversified fund would. This increased investment in fewer issuers may result in the Fund being more sensitive to economic results of those issuing the securities.
19
J.P. Morgan Access Multi-Strategy Fund, L.L.C.
Notes to Financial Statements September 30, 2015 (Unaudited) (continued)
8. Indemnifications
In the normal course of business, the Fund enters into contracts that contain a variety of representations that provide general indemnifications. The Fund’s maximum exposure under these arrangements is unknown, as this would involve future claims that may be made against the Fund that have not yet occurred. However, the Fund expects the risk of loss to be remote.
9. Concentrations
An affiliate of the Fund’s Investment Manager has investment discretion with respect to their client’s holdings in the Fund, which collectively represent a significant portion of the Fund’s assets. Significant member transactions, if any, may impact the Fund’s performance.
20
J.P. Morgan Access Multi-Strategy Fund LLC
Board Approval of Investment Advisory Agreement (Unaudited)
The Board of Directors has established various standing committees composed of Directors with diverse backgrounds, to which the Board of Directors has assigned specific subject matter responsibilities to further enhance the effectiveness of the Board’s oversight and decision making. The Board of Directors and its investment committees (money market and alternative products, equity, and fixed income) meet regularly throughout the year and consider factors that are relevant to their annual consideration of investment advisory agreements at each meeting. They also meet for the specific purpose of considering investment advisory agreement annual renewals. The Board of Directors held meetings in person in June and August 2015, at which the Directors considered the continuation of the investment management and sub-advisory agreements for the Fund whose semi-annual report is contained herein (each an “Advisory Agreement” and, collectively, the “Advisory Agreements”). At the June meeting, the Board’s investment committees met to review and consider performance, expense and related information for the J.P. Morgan Funds. Each investment committee reported to the full Board, which then considered the investment committee’s preliminary findings. At the August meeting, the Directors continued their review and consideration. The Directors, including a majority of the Directors who are not “interested persons” (as defined in the 1940 Act) of any party to the Advisory Agreements or any of their affiliates, approved the continuation of each Advisory Agreement on August 19, 2015.
As part of their review of the Advisory Agreements, the Directors considered and reviewed performance and other information about the Fund received from the Investment Manager and Sub-Advisor. This information included the Fund’s performance as compared to the performance of its peers and benchmarks and analyses by the Investment Manager of the Fund’s performance. The Investment Manager also periodically provides comparative information regarding the Fund’s expense ratios and those of its peer groups. In addition, in preparation for the June and August meetings, the Directors requested, received and evaluated extensive materials from the Investment Manager and/or Sub-Advisor, including performance and expense information compiled by Lipper Inc. (“Lipper”), an independent provider of investment company data. Before voting on the proposed Advisory Agreements, the Directors reviewed the proposed Advisory Agreements with representatives of the Investment Manager and/or Sub-Advisor, counsel to the Fund and independent legal counsel and received a memorandum from independent legal counsel to the Directors discussing the legal standards for their consideration of the proposed Advisory Agreements. The Directors also discussed the proposed Advisory Agreements in executive sessions with independent legal counsel at which no representatives of the Investment Manager or Sub-Advisor were present. Set forth below is a summary of the material factors evaluated by the Directors in determining whether to approve the Advisory Agreements.
The Directors considered information provided with respect to the Fund over the course of the year. Each Director attributed different weights to the various factors and no factor alone was considered determinative. From year to year, the Directors consider and place emphasis on relevant information in light of changing circumstances in market and economic conditions. The Directors determined that the compensation to be received by the Investment Manager from the Fund and by the Sub-Advisor from the Investment Manager under the Advisory Agreements (as well as any performance allocation the Sub-Advisor received from the Fund) was fair and reasonable and that the continuance of the Advisory Agreements was in the best interests of the
21
J.P. Morgan Access Multi-Strategy Fund LLC
Board Approval of Investment Advisory Agreement (Unaudited) (continued)
Fund and its shareholders.
The factors summarized below were considered and discussed by the Directors in reaching their conclusions:
Nature, Extent and Quality of Services Provided by the Investment Manager and Sub-Advisor
The Directors received and considered information regarding the nature, extent and quality of the services provided to the Fund under the Advisory Agreements. The Directors took into account information furnished throughout the year at Directors’ meetings, as well as the materials furnished specifically in connection with this annual review process. The Directors considered the background and experience of the Investment Manager’s and Sub-Advisor’s senior management and the expertise of, and the amount of attention given to the Fund by, investment personnel of the Investment Manager and Sub-Advisor. In addition, the Directors reviewed the qualifications, backgrounds and responsibilities of the portfolio management team primarily responsible for the day-to-day management of the Fund and the infrastructure supporting the team. The Directors also considered information provided by the Investment Manager and Sub-Advisor about the structure and distribution strategy of the Fund. The Directors reviewed information relating to the Investment Manager’s and Sub-Advisor’s risk governance model and reports showing the Investment Manager’s and Sub-Advisor’s compliance structure and ongoing compliance processes. The Directors also considered the quality of the administrative services provided by JPMorgan Funds Management, Inc. (“JPMFM”), an affiliate of the Investment Manager and Sub-Advisor.
The Directors also considered their knowledge of the nature and quality of the services provided by the Investment Manager and Sub-Advisor and their affiliates to the Fund gained from their experience as Directors of the J.P. Morgan Funds. In addition, they considered the overall reputation and capabilities of the Investment Manager, Sub-Advisor and their affiliates, the commitment of the Investment Manager and Sub-Advisor to provide high quality service to the Fund, their overall confidence in the Investment Manager’s and Sub-Advisor’s integrity and the Investment Manager’s and Sub-Advisor’s responsiveness to questions or concerns raised by them, including the Investment Manager’s and Sub-Advisor’s willingness to consider and implement organizational and operational changes designed to improve investment results and the services provided to the Fund. In addition, the Directors considered the different roles and responsibilities performed by the Investment Manager and Sub-Advisor under the Advisory Agreements, including the Investment Manager’s monitoring and evaluating of the Sub-Advisor to help assure that the Sub-Advisor is managing the Fund consistently with its investment objectives and restrictions.
Based upon these considerations and other factors, the Directors concluded that they were satisfied with the nature, extent and quality of the investment advisory services provided to the Fund by the Investment Manager and Sub-Advisor.
Costs of Services Provided and Profitability to the Investment Manager and its Affiliates
The Directors received and considered information regarding the profitability to the Investment Manager and its affiliates in providing services to the Fund. The Directors reviewed and discussed this data. The Directors recognized that this data is not audited and represents the
22
J.P. Morgan Access Multi-Strategy Fund LLC
Board Approval of Investment Advisory Agreement (Unaudited) (continued)
Investment Manager’s determination of its and its affiliates’ revenues from the contractual services provided to the Fund, less expenses of providing such services. Expenses include direct and indirect costs and are calculated using an allocation methodology developed by the Investment Manager. The Directors also recognized that it is difficult to make comparisons of profitability from fund investment advisory contracts because comparative information is not generally publicly available and is affected by numerous factors, including the structure of the particular adviser, the types of funds it manages, its business mix, numerous assumptions regarding allocations and the fact that publicly-traded fund managers’ operating profits and net income are net of distribution and marketing expenses. Based upon their review, the Directors concluded that the profitability to the Investment Manager under the Advisory Agreement was not unreasonable in light of the services and benefits provided to the Fund.
Fall-Out Benefits
The Directors reviewed information regarding potential “fallout” or ancillary benefits received by the Investment Manager and its affiliates as a result of their relationship with the J.P. Morgan Funds. The Directors also reviewed the Investment Manager’s allocation of fund brokerage for the J.P. Morgan Funds complex, including allocations to brokers who provide research to the Investment Manager.
The Directors also considered that JPMFM, an affiliate of the Investment Manager and Sub-Advisor, earns fees from the Fund for providing administrative services. These fees were shown separately in the profitability analysis presented to the Directors. The Directors also considered the fees that may be paid to JPMorgan Chase Bank, N.A., J.P. Morgan Institutional Investments Inc., J.P. Morgan Securities LLC, J.P. Morgan Trust Company, N.A., and JPMorgan Distribution Services, Inc. for various services.
Economies of Scale
The Directors considered the extent to which the Fund may benefit from economies of scale. The Directors considered that there may not be a direct relationship between economies of scale realized by the Fund and those realized by the Investment Manager as assets increase. The Directors noted that the proposed investment advisory fee schedule for the Fund does not contain breakpoints, but that the fees remain competitive with peer funds. The Directors also considered that the Investment Manager has implemented fee waivers and expense limitations (“Fee Caps”) which allows the Fund’s shareholders to share potential economies of scale from the Fund’s inception. The Directors also considered that the Investment Manager has shared economies of scale by adding or enhancing services to the Fund over time, noting the Investment Manager’s substantial investments in its business in support of the Fund, including investments in trading systems and technology (including cybersecurity improvements), retention of key talent, additions to analyst and portfolio management teams, and regulatory support enhancements. The Directors also considered whether it would be appropriate to add advisory fee breakpoints and the Directors concluded that the current fee structure was reasonable in light of the Fee Caps that the Investment Manager has in place that serve to limit the overall net expense ratios of the Fund at competitive levels. The Directors concluded that the Fund’s shareholders received the benefits of potential economies of scale through the Fee Caps and the Investment Manager’s reinvestment in its operations to serve the Fund and its shareholders.
23
J.P. Morgan Access Multi-Strategy Fund LLC
Board Approval of Investment Advisory Agreement (Unaudited) (continued)
Independent Written Evaluation of the Fund’s Chief Compliance Officer
The Directors noted that, upon their direction, the Chief Compliance Officer for the Fund had prepared an independent written evaluation in order to assist the Directors in determining the reasonableness of the proposed management fees. The Directors considered the written evaluation in determining whether to continue the Advisory Agreements.
Fees Relative to Investment Manager’s Other Clients
The Directors received and considered information about the nature and extent of investment advisory services and fee rates offered to other clients of the Investment Manager, including institutional separate accounts and/or funds sub-advised by the Investment Manager, and for investment management styles substantially similar to that of the Fund. The Trustees considered the complexity of investment management for registered mutual funds relative to the Investment Manager’s other clients and noted differences in the regulatory, legal and other risks and responsibilities of providing services to the different clients. The Directors considered that serving as an adviser to a registered mutual fund involves greater responsibilities and risks than acting as a sub-adviser and observed that sub-advisory fees may be lower than those charged by the Investment Manager to the Fund. The Directors also noted that the adviser, not the mutual fund, pays the sub-advisory fee and that many responsibilities related to the advisory function are retained by the primary adviser. The Directors concluded that the fee rates charged to the Fund in comparison to those charged to the Investment Manager’s other clients were reasonable.
Investment Performance
The Directors received and considered absolute and/or relative performance for the Fund in a report prepared by Lipper. The Directors considered the total return performance information, which included the ranking of the Fund within a performance universe made up of funds with the same Lipper investment classification and objective (the “Universe Group”) by total return for applicable one-, three- and five-year periods. The Directors reviewed a description of Lipper’s methodology for selecting funds in the Fund’s Universe Group. As part of this review, the Directors also reviewed the Fund’s performance against its benchmark and considered the performance information provided for the Fund at regular Board meetings by the Investment Manager and/or Sub-Advisor. The Lipper performance data noted by the Directors as part of their review and the determinations made by the Directors with respect to the Fund’s performance are summarized below:
The Directors noted that the Fund’s performance was in the fourth, third and fourth quintiles for the one-, three-, and five-year periods ended December 31, 2014. The Directors discussed the performance and investment strategy of the Fund with the Investment Manager and/or Sub-Advisor, and, based upon this discussion, the Investment Manager’s and/or Sub-Advisor’s analysis and other factors, concluded that the Fund’s performance was reasonable.
Advisory Fees and Expense Ratios
The Directors considered the contractual advisory fee rate paid by the Fund to the Investment Manager and compared that rate to the information prepared by Lipper concerning management fee rates paid by other funds in the same Lipper category as the Fund. The Directors also considered the fees paid by the Investment Manager to the Sub-Advisor out of the advisory fee and performance allocation the Sub-Advisor is entitled to. The Directors recognized that Lipper
24
J.P. Morgan Access Multi-Strategy Fund LLC
Board Approval of Investment Advisory Agreement (Unaudited) (continued)
reported the Fund’s management fee rate as the combined contractual advisory fee and the administration fee rates. The Directors also reviewed information about other expenses and the expense ratios for the Fund. The Directors considered the fee waiver and/or expense reimbursement arrangements currently in place for the Fund and considered the net advisory fee rate after taking into account any waivers and/or reimbursements. The Directors also considered the fees paid by the Investment Manager to the Sub-Advisor out of the advisory fee. The Directors recognized that it is difficult to make comparisons of advisory fees because there are variations in the services that are included in the fees paid by other funds. The Directors’ also noted the complexity of comparing fees with performance-based components. The Directors’ determinations as a result of the review of the Fund’s advisory fee and expense ratio are summarized below:
The Directors noted that the Fund’s net advisory fee and actual total expenses were in the fourth and second quintiles, respectively, of the Universe Group. After considering the factors identified above, in light of this information, the Directors concluded that the advisory fee paid by the Fund to the Investment Manager and by the Investment Manager to the Sub-Advisor (as well as any performance allocation the Sub-Advisor received from the Fund) was reasonable.
25
J.P. Morgan Access Multi-Strategy Fund, L.L.C.
The Fund’s Forms N-Q are available on the Commission’s web site at http://www.sec.gov, and may be reviewed and copied at the Commission’s Public Reference Room in Washington, DC. Information on the operation of the Public Reference Room may be obtained by calling 1-800-SEC-0330.
A description of the policies and procedures that the Fund uses to determine how to vote proxies relating to portfolio securities, as well as information relating to how the Fund voted proxies relating to portfolio securities during the most recent 12-month period ended June 30, is available without charge, upon request, by calling 1-212-648-1953, and (ii) on the Commission’s website at http://www.sec.gov.
26
Item 2. Code of Ethics.
Not applicable.
Item 3. Audit Committee Financial Expert.
Not applicable.
Item 4. Principal Accountant Fees and Services.
Not applicable.
Item 5. Audit Committee of Listed Registrants.
Not applicable.
Item 6. Investments.
| (a) | Schedule of Investments in securities of unaffiliated issuers as of the close of the reporting period is included as part of the report to shareholders filed under Item 1 of this form. |
Item 7. Disclosure of Proxy Voting Policies and Procedures for Closed-End Management Investment
Companies.
Not applicable.
Item 8. Portfolio Managers of Closed-End Management Investment Companies.
There has been no change, as of the date of this filing, in any of the portfolio managers identified in response to paragraph (a)(1) of this Item in the registrant’s most recently filed annual report on Form N-CSR.
Item 9. Purchases of Equity Securities by Closed-End Management Investment Company and
Affiliated Purchasers.
Not applicable.
Item 10. Submission of Matters to a Vote of Security Holders.
There have been no material changes to the procedures by which the shareholders may recommend nominees to the registrant’s board of directors, where those changes were implemented after the registrant last provided disclosure in response to the requirements of Item 407(c)(2)(iv) of Regulation S-K (17 CFR 229.407) (as required by Item 22(b)(15) of Schedule 14A (17 CFR 240.14a-101)), or this Item.
Item 11. Controls and Procedures.
| | (a) | The registrant’s principal executive and principal financial officers, or persons performing similar functions, have concluded that the registrant’s disclosure controls and procedures (as defined in Rule 30a-3(c) under the Investment Company Act of 1940, as amended (the “1940 Act”) (17 CFR 270.30a-3(c))) are effective, as of a date within 90 days of the filing date of the report that includes the disclosure required by this paragraph, based on their evaluation of these controls and procedures required by Rule 30a-3(b) under the 1940 Act (17 CFR 270.30a-3(b)) and Rules 13a-15(b) or 15d-15(b) under the Securities Exchange Act of 1934, as amended (17 CFR 240.13a-15(b) or 240.15d-15(b)). |
| | (b) | There were no changes in the registrant’s internal control over financial reporting (as defined in Rule 30a-3(d) under the 1940 Act (17 CFR 270.30a-3(d)) that occurred during the registrant’s second fiscal quarter of the period covered by this report that has materially affected, or is reasonably likely to materially affect, the registrant’s internal control over financial reporting. |
Item 12. Exhibits.
| | | | |
| | | (a)(1) | | Not applicable. |
| | |
| | (a)(2) | | Certifications pursuant to Rule 30a-2(a) under the 1940 Act and Section 302 of the Sarbanes-Oxley Act of 2002 are attached hereto. |
| | |
| | (a)(3) | | Not applicable. |
| | |
| | (b) | | Not applicable. |
SIGNATURES
Pursuant to the requirements of the Securities Exchange Act of 1934 and the Investment Company Act of 1940, the registrant has duly caused this report to be signed on its behalf by the undersigned, thereunto duly authorized.
(Registrant) J.P. Morgan Access Multi-Strategy Fund, L.L.C.
By (Signature and Title)* /s/ Robert L. Young
Robert L. Young, Principal Executive Officer
(principal executive officer)
Date December 3, 2015
Pursuant to the requirements of the Securities Exchange Act of 1934 and the Investment Company Act of 1940, this report has been signed below by the following persons on behalf of the registrant and in the capacities and on the dates indicated.
By (Signature and Title)* /s/ Robert L. Young
Robert L. Young, Principal Executive Officer
(principal executive officer)
Date December 3, 2015
By (Signature and Title)* /s/ Laura M. Del Prato
Laura M. Del Prato, Principal Financial Officer
(principal financial officer)
Date December 3, 2015
* Print the name and title of each signing officer under his or her signature.