EXHIBIT 99.2
El Pilar Project Form 43-101F1 Technical Report |  |
DATE AND SIGNATURES PAGE
See Appendix A, Feasibility Study Contributors and Professional Qualifications, for the certificate of the Qualified Person responsible for the content of this report, Michael Broch, FAusIMM, Mercator Minerals. This certificate is considered the date and signature of this report in accordance with Form 43-101F1.
This report is current as of October 18, 2012.
Page i
El Pilar Project Form 43-101F1 Technical Report | |
FORM 43-101F1 TECHNICAL REPORT
2012 FEASIBILITY STUDY UPDATE
TABLE OF CONTENTS
| DATE AND SIGNATURES PAGE | I |
| TABLE OF CONTENTS | II |
| LIST OF FIGURES AND ILLUSTRATIONS | VIII |
| LIST OF TABLES | XII |
| 1 | SUMMARY | 1 |
| | 1.1 | Overall Report Summary | 1 |
| | 1.2 | Introduction Summary | 4 |
| | 1.3 | Reliance on Other Experts | 4 |
| | 1.4 | Property Description and Location | 5 |
| | 1.5 | Accessibility, Climate, Local Resources, Infrastructure & Physiography | 5 |
| | 1.6 | History | 6 |
| | 1.7 | Geological Setting & Mineralization | 7 |
| | 1.8 | Deposit Types | 8 |
| | 1.9 | Exploration | 8 |
| | 1.10 | Drilling | 8 |
| | 1.11 | Sample Preparation, Analyses and Security | 8 |
| | 1.12 | Data Verification | 9 |
| | 1.13 | Mineral Processing and Metallurgical Testing | 9 |
| | 1.14 | Mineral Resource Estimates | 12 |
| | 1.15 | Mineral Reserve Estimates | 13 |
| | 1.16 | Mining Methods | 14 |
| | 1.17 | Recovery Methods | 16 |
| | 1.18 | Project Infrastructure | 16 |
| | 1.19 | Market Studies and Contracts | 18 |
Page ii
El Pilar Project Form 43-101F1 Technical Report | |
| | 1.20 | Environmental Studies, Permitting and Social or Community Impact | 18 |
| | 1.21 | Capital and Operating Costs | 19 |
| | 1.22 | Economic Analysis | 21 |
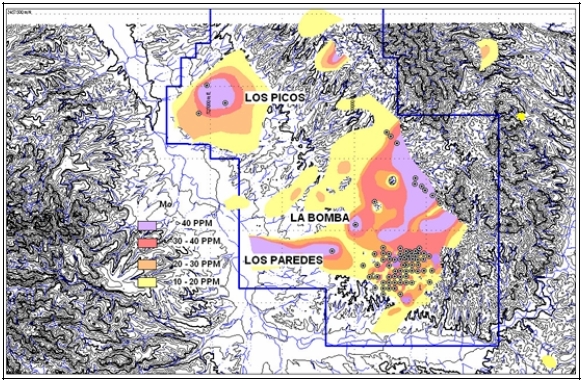
| | 1.23 | Adjacent Properties | 21 |
| | 1.24 | Other Relevant Data and Information | 22 |
| | 1.25 | Interpretation and Conclusions | 22 |
| | 1.26 | Recommendations | 22 |
| | 1.27 | References | 23 |
| 2 | INTRODUCTION | 24 |
| | 2.1 | Issuer | 24 |
| | 2.2 | Purpose of Issue | 24 |
| | 2.3 | Sources of Information | 24 |
| | 2.4 | Personal Inspections | 24 |
| | 2.5 | Units and Terms of Reference | 25 |
| 3 | RELIANCE ON OTHER EXPERTS | 27 |
| | 3.1 | Geology and Resource Definition | 27 |
| | 3.2 | Resources & Reserves | 27 |
| | 3.3 | Metallurgy and Process Engineering | 27 |
| | 3.4 | Environmental and Permitting | 27 |
| | 3.5 | Geotechnical | 28 |
| | 3.6 | Hydrology | 28 |
| 4 | PROPERTY DESCRIPTION AND LOCATION | 29 |
| | 4.1 | Property Description | 29 |
| | 4.2 | Mineral Tenure, Royalties and Agreements | 29 |
| | 4.3 | Location | 32 |
| 5 | ACCESSIBILITY, CLIMATE, LOCAL RESOURCES, INFRASTRUCTURE & PHYSIOGRAPHY | 33 |
| | 5.1 | Accessibility | 33 |
| | 5.2 | Climate | 33 |
| | 5.3 | Local Resources and Infrastructure | 33 |
| | 5.4 | Physiography | 34 |
| 6 | | HISTORY | 35 |
Page iii
El Pilar Project Form 43-101F1 Technical Report | |
| | 6.1 | History Prior to Stingray | 35 |
| | 6.2 | 2001 Polygonal Resources by Normex | 35 |
| | 6.3 | 2003 Block Model Resource Estimate by Magri | 35 |
| | 6.4 | 2007 Inferred Mineral Resource by Woods | 36 |
| | 6.5 | 2009 Stingray Mineral Reserve Feasibility Study | 37 |
| 7 | GEOLOGICAL SETTING & MINERALIZATION | 41 |
| | 7.1 | Regional Geologic Setting – Patagonia Mountains | 41 |
| | 7.2 | Regional Geology of the El Pilar Property | 41 |
| | 7.3 | Geology of the El Pilar Copper Deposit | 43 |
| | 7.4 | Copper Mineralization | 52 |
| 8 | DEPOSIT TYPES | 62 |
| 9 | EXPLORATION | 64 |
| 10 | DRILLING | 70 |
| 11 | SAMPLE PREPARATION, ANALYSES AND SECURITY | 72 |
| | 11.1 | Pre-Stingray Drilling | 72 |
| | 11.2 | Stingray Drilling | 72 |
| | 11.3 | Comparison of Soluble Copper Assays | 73 |
| | 11.4 | Metallurgical Sample Preparation, Analysis and Security | 74 |
| | 11.5 | Conclusion | 74 |
| 12 | DATA VERIFICATION | 75 |
| | 12.1 | IMC Verification of Assay Database | 75 |
| | 12.2 | Quality Assurance and Quality Control for Stingray Drilling Samples | 75 |
| | 12.3 | Data Verification of Metallurgical Samples | 91 |
| 13 | MINERAL PROCESSING AND METALLURGICAL TESTING | 92 |
| | 13.1 | General | 92 |
| | 13.2 | Historic Work - 2004 Noranda & 2009 Stingray Metallurgical Testing | 92 |
| | 13.3 | Evaluation of 2009 Stingray Metallurgical Testing Results | 95 |
| | 13.4 | Additional Metallurgical Testing Done in 2010 and 2011 by Mercator | 96 |
| | 13.5 | Bulk Sample Crib and Column Tests 2010-2011 | 97 |
| | 13.6 | Five Metcon Columns to Back-Up the MP Bulk Sample Crib and Column Tests | 113 |
Page iv
El Pilar Project Form 43-101F1 Technical Report | |
| | 13.7 | Thirteen Columns – Additional Metallurgical Work 2010-2011 | 115 |
| | 13.8 | Metsim Copper Recovery and Acid Consumption Projections | 131 |
| | 13.9 | 2011 Feasibility Study Base Case - 6 Meter Lift Height 180 Day Projected Copper Recovery | 133 |
| | 13.10 | 6 Meter Lift Height 180 Day Height Actual Copper Recovery | 135 |
| | 13.11 | New Base Case - 3 Meter Lift Height 180 Day Copper Recovery | 138 |
| | 13.12 | 3 Meter Lift Height 360 Day Projected Copper Recovery | 141 |
| | 13.13 | New 2012 Data -11 Mini Columns | 144 |
| | 13.14 | El Pilar Lom Acid Consumption Projections | 150 |
| | 13.15 | Discussion of Optimum Acid Precure Amounts | 152 |
| | 13.16 | Copper Recovery Rate Kinetics | 155 |
| | 13.17 | Comparison of Metallurgical Composite Sample Metcon Head Assay to Drillhole Assays | 157 |
| | 13.18 | Summary of El Pilar Metallurgical Results and Project Upsides | 161 |
| 14 | MINERAL RESOURCE ESTIMATES | 161 |
| | 14.1 | Resource Model | 169 |
| | 14.2 | Resource Classification | 170 |
| | 14.3 | Mineral Resource Estimates | 172 |
| | 14.4 | Changes From the July 2008 Resource Model | 175 |
| 15 | MINERAL RESERVE ESTIMATES | 175 |
| | 15.1 | General | 181 |
| | 15.2 | Design Economics and Floating Cone Evaluations | 181 |
| 16 | MINING METHODS | 181 |
| | 16.1 | General | 181 |
| | 16.2 | Operating Parameters and Criteria | 181 |
| | 16.3 | Pit and Mining Phase Design | 181 |
| | 16.4 | Mining Production Schedule | 187 |
| | 16.5 | Pit Wall Slope Stability | 190 |
| | 16.6 | Waste Rock Storage Areas | 193 |
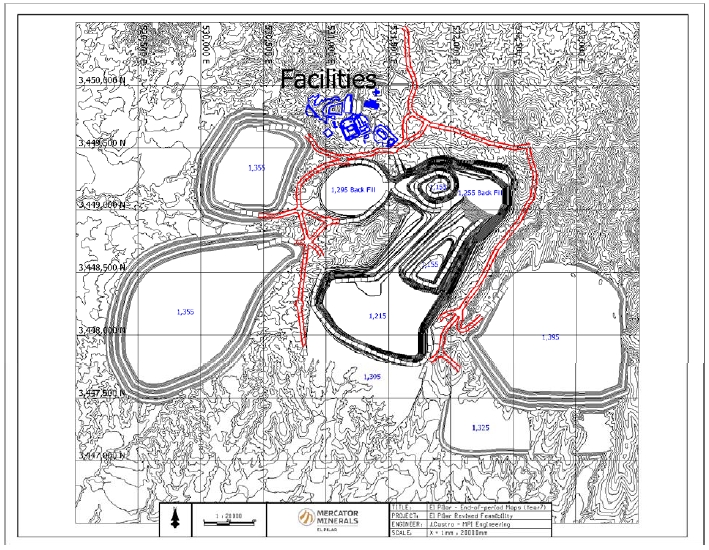
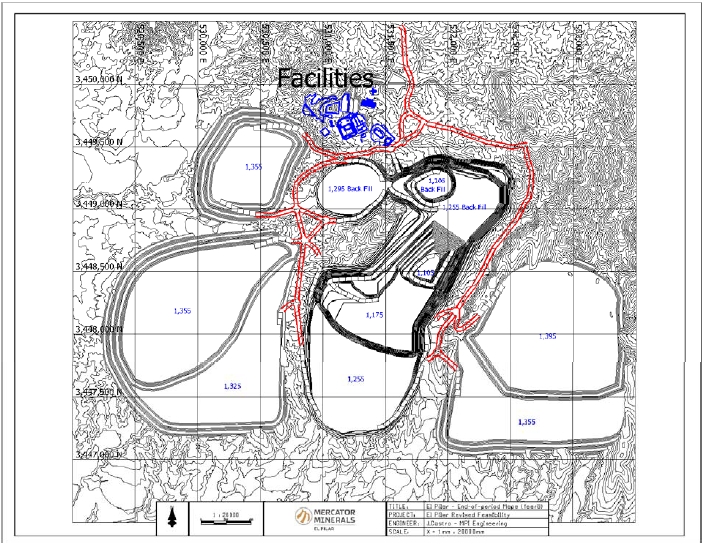
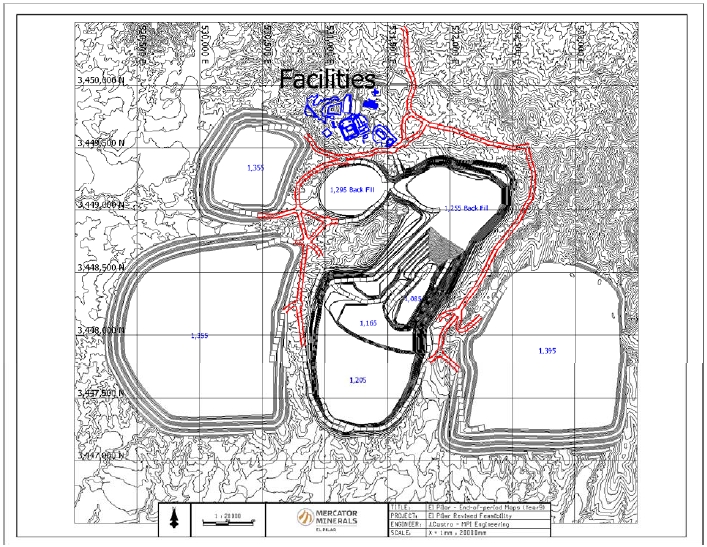
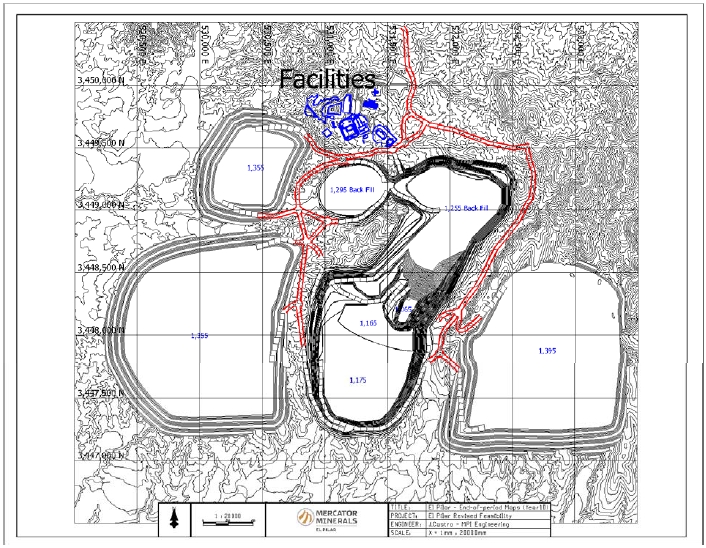
| | 16.7 | Annual Mine Drawings | 195 |
| | 16.8 | Mining Equipment | 208 |
| 17 | RECOVERY METHODS | 226 |
Page v
El Pilar Project Form 43-101F1 Technical Report | |
| | 17.1 | Process Facilities | 226 |
| 18 | PROJECT INFRASTRUCTURE | 240 |
| | 18.1 | Acid Plant | 240 |
| | 18.2 | Access | 247 |
| | 18.3 | Water | 248 |
| | 18.4 | Power Lines | 248 |
| | 18.5 | Railroad Spur | 248 |
| 19 | MARKET STUDIES AND CONTRACTS | 249 |
| | 19.1 | Introduction | 249 |
| | 19.2 | Recommended Marketing Strategy | 249 |
| | 19.3 | Cathode Sales Terms and Net Realizations | 249 |
| 20 | ENVIRONMENTAL STUDIES, PERMITTING AND SOCIAL OR COMMUNITY IMPACT | 251 |
| | 20.1 | General Description of Environmental Conditions | 251 |
| | 20.2 | Waste Management, Site Monitoring and Water | 252 |
| | 20.3 | Project Permitting Requirements and Status | 254 |
| | 20.4 | Reclamation and Closure | 257 |
| 21 | CAPITAL AND OPERATING COSTS | 261 |
| | 21.1 | Capital Costs | 261 |
| | 21.2 | Operating Costs | 268 |
| 22 | ECONOMIC ANALYSIS | 272 |
| | 22.1 | Financial Analysis | 272 |
| | 22.2 | Financial Models | 279 |
| 23 | ADJACENT PROPERTIES | 293 |
| 24 | OTHER RELEVANT DATA AND INFORMATION | 294 |
| 25 | INTERPRETATION AND CONCLUSIONS | 295 |
| | 25.1 | Risks | 296 |
| | 25.2 | Opportunities | 297 |
| 26 | RECOMMENDATIONS | 299 |
| | 26.1 | Mining and Mineral Reserves | 299 |
| | 26.2 | Metallurgy | 299 |
| | 26.3 | Acid Plant | 299 |
| | 26.4 | Environmental | 299 |
Page vi
El Pilar Project Form 43-101F1 Technical Report | |
| 27 | REFERENCES | 300 |
| | | |
| APPENDIX A: FEASIBILITY STUDY CONTRIBUTORS AND PROFESSIONAL QUALIFICATIONS | 302 |
Page vii
El Pilar Project Form 43-101F1 Technical Report | |
LIST OF FIGURES AND ILLUSTRATIONS
| Figure 1 1: El Pilar Location Map | 5 |
| Figure 4 1: El Pilar Mining Concessions Map | 29 |
| Figure 4 2: El Pilar Location Map | 32 |
| igure 7 1: Geologic map of the El Pilar project area | 42 |
| Figure 7 2: Typical Qfy Core Samples | 44 |
| Figure 7 3: Typical Qwu Core Samples - note large mineralized breccia fragments | 45 |
| Figure 7 4: Qwu out crop consisting of poorly sorted and angular wash material | 46 |
| Figure 7 5: Qwt, note red-brown color and angular fragments of volcanic rocks | 49 |
| Figure 7 6: Qwl - Calcite cemented debris flow deposit with volcanic fragments | 50 |
| Figure 7 7: Mineralized silicic breccia in outcrop | 51 |
| Figure 7 8: Precambrian granite | 52 |
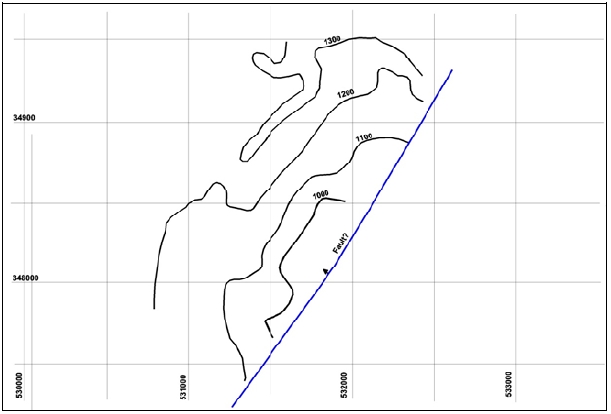
| Figure 7 9: Structural contour map of the top of the El Pilar copper deposit in meters above mean sea level | 53 |
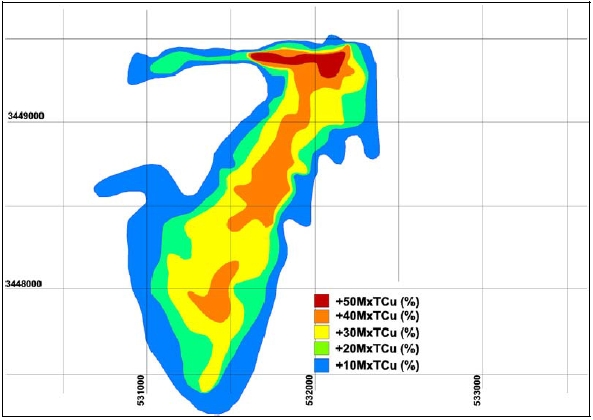
| Figure 7 10: Map of %TCu x thickness (meters) of the El Pilar copper deposit | 53 |
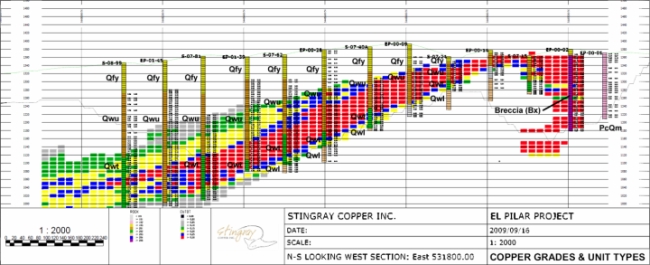
| Figure 7 11: Typical N-S long section showing total copper grade (TCu) and relationship to interpreted sedimentary units | 54 |
| Figure 7 12: Typical E-W cross section showing total copper grade (TCu) and relationship to interpreted sedimentary units | 54 |
| Figure 7 13: El Pilar Drill Hole Location Map | 55 |
| Figure 7 14: Variations in copper grades by bench at El Pilar | 56 |
| Figure 7 15: TCu grades | 57 |
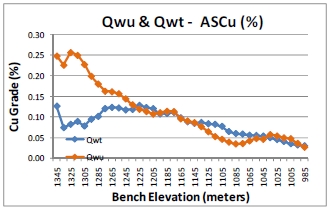
| Figure 7 16: ASCu grades | 57 |
| Figure 7 17: ResCu grades | 57 |
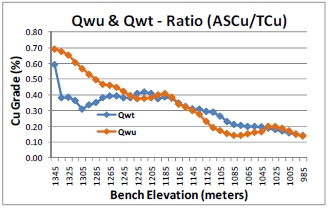
| Figure 7 18: Ratio grades | 57 |
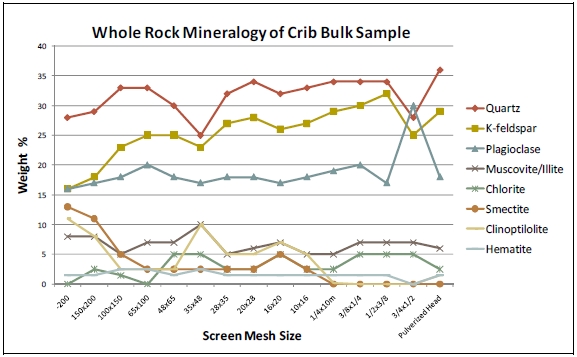
| Figure 7 19: Bulk sample whole rock mineralogy by screen size fraction | 58 |
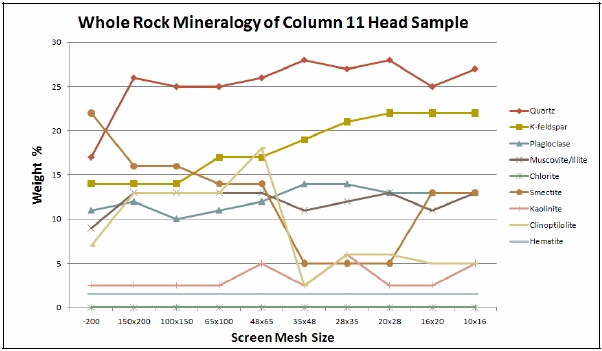
| Figure 7 20: Column 13 sample whole rock mineralogy by screen size fraction | 59 |
| Figure 7 21: Backscatter electron (Bsc) image of Sample 3448-7-8 showing discrete particles of copper-bearing iron oxides (spots a-g) | 60 |
| Figure 8 1: Porphyry Copper Deposits of Southwest North America | 62 |
| Figure 9 1: Regional Mesquite Sample | 65 |
| Figure 9 2: Titan 24 MT-DCIP Line Locations | 67 |
Page viii
El Pilar Project Form 43-101F1 Technical Report | |
| Figure 9 3: Dipole-Dipole Time Domain IP | 68 |
| Figure 10 1: El Pilar Drillhole Locations | 71 |
| Figure 12 1: Total Copper Analyses – Pulp Samples Originally Assayed At ALS Chemex & Re-assayed At METCON | 76 |
| Figure 12 2: Acid Soluble Copper Analyses – Pulp Samples Originally Assayed At ALS Chemex & Re-assayed At METCON | 76 |
| Figure 12 3: Total Copper Analyses – Pulp Samples Originally Assayed At METCON & Re-assayed At ALS Chemex | 76 |
| Figure 12 4: Acid Soluble Copper Analyses – Pulp Samples Originally Assayed At METCON & Re-assayed At ALS Chemex | 77 |
| Figure 12 5: QA/QC on High Grade Standard Sample – Total Copper Analyses | 88 |
| Figure 12 6: QA/QC on High Grade Standard Sample – Acid Soluble Copper Analyses | 89 |
| Figure 12 7: QA/QC on Low Grade Standard Sample – Total Copper Analyses | 80 |
| Figure 12 8: QA/QC on Low Grade Standard Sample – Acid Soluble Copper Analyses | 80 |
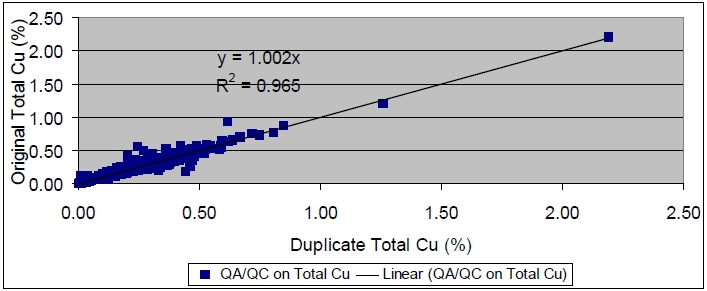
| Figure 12 9: QA/QC on Duplicate Samples – Total Copper Analyses | 81 |
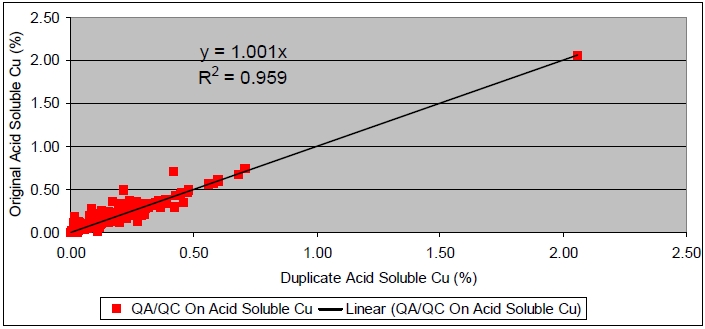
| Figure 12 10: QA/QC on Duplicate Samples – Acid Soluble Copper Analyses | 81 |
| Figure 12 11: QA/QC on Coarse Reject Samples – Total Copper Analyses | 82 |
| Figure 12 12: QA/QC on Coarse Reject Samples – Acid Soluble Copper Analyses | 83 |
| Figure 12 13: Blank Samples - Total Copper Analyses | 83 |
| Figure 12 14: Blank Samples – Acid Soluble Copper Analyses | 94 |
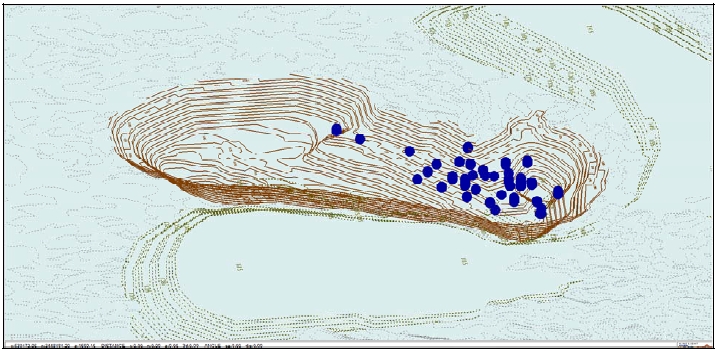
| Figure 13 1: Distribution of Stingray Five Composite Metallurgical Samples | 95 |
| Figure 13 2: Copper Solubility & Recovery – Stingray Yearly Composites | 94 |
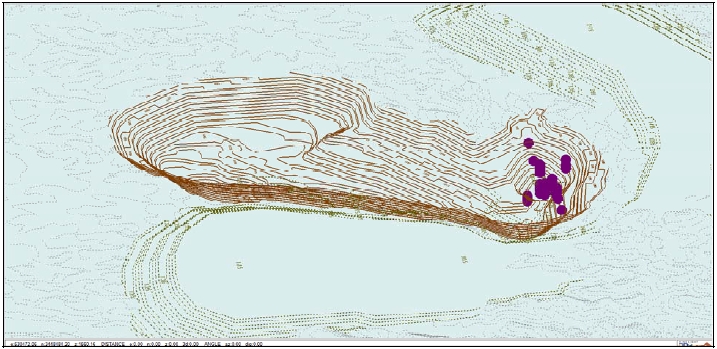
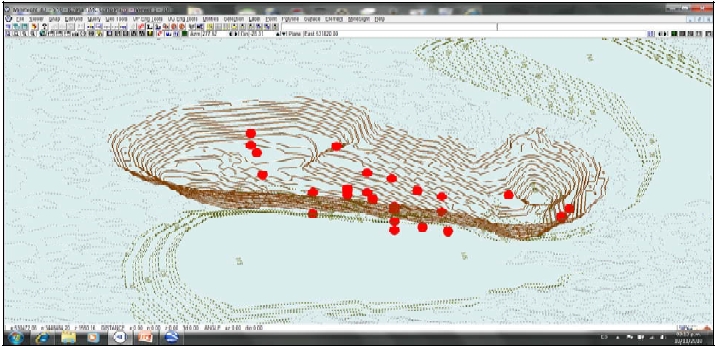
| Figure 13 3: MineSight Screen Capture Showing Bulk Sample Location | 96 |
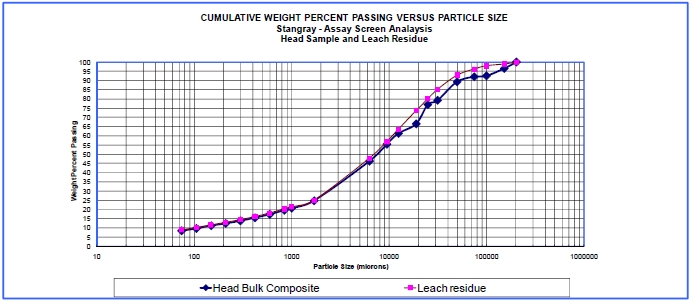
| Figure 13 4: Chart Comparison Bulk Sample Screen Fractions Head vs. Tails | 97 |
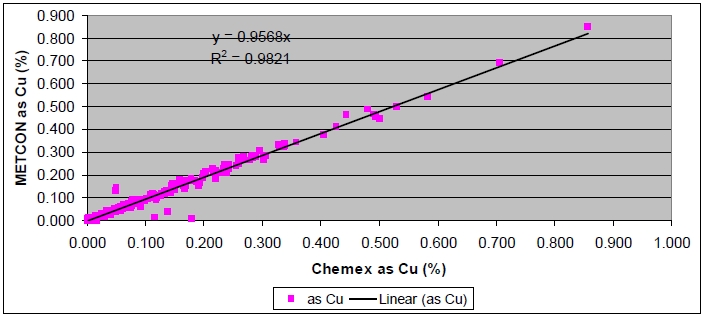
| Figure 13 5: Correlation between METCON and Mercator Copper Assays | 101 |
| Figure 13 6: Copper Recovery Curves for Mineral Park Cribs and Columns | 105 |
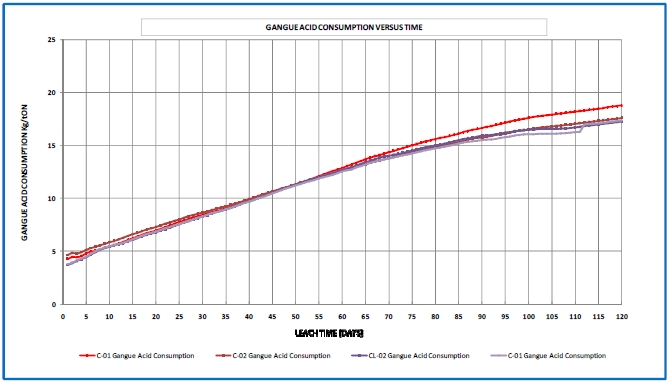
| Figure 13 7: Acid Consumption Curves for Mineral Park Cribs and Columns | 108 |
| Figure 13 8: Sample Composite Locations – Column #1 | 109 |
| Figure 13 9: Sample Composite Locations – Column #2 | 119 |
| Figure 13 10: Sample Composite Locations – Column #3 | 120 |
| Figure 13 11: Sample Composite Locations – Column #5 | 120 |
| Figure 13 12: Sample Composite Locations – Column #6 | 121 |
| Figure 13 13: Sample Composite Locations – Column #8 | 121 |
| Figure 13 14: Sample Composite Locations – Column #9 | 122 |
Page ix
El Pilar Project Form 43-101F1 Technical Report | |
| Figure 13 15: Sample Composite Locations – Column #10 | 122 |
| Figure 13 16: Sample Composite Locations – Column #11 | 123 |
| Figure 13 17: Sample Composite Locations – Column #12 | 123 |
| Figure 13 18: Sample Composite Locations – Column #13 | 124 |
| Figure 13 19: Sample Composite Locations – Column #14 | 124 |
| Figure 13 20: 13 Columns Cumulative Copper Extraction | 130 |
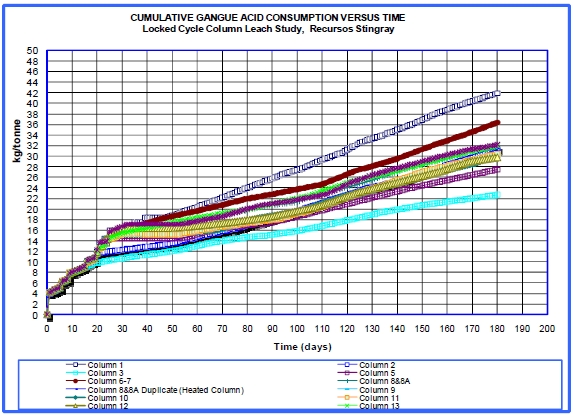
| Figure 13 21: 13 Columns Gangue Acid Consumption | 130 |
| Figure 13 22: 13 Columns PLS pH | 131 |
| Figure 13 23: 2011 Base Case Copper Recovery Algorithm for El Pilar Ores | 135 |
| Figure 13 24: El Pilar Copper Extraction – Actual 180 Day Leach Data | 138 |
| Figure 13 25: Relationship between 3 Meter and 6 Meter Copper Extraction. | 140 |
| Figure 13 26: El Pilar Copper Extraction – 180 Days 3 Meter Lift Height | 141 |
| Figure 13 27: CL-02 Copper Extraction Over 240 Days of Leaching. | 142 |
| Figure 13 28: El Pilar Copper Extraction – 360 Day 3 Meter Lift Height | 144 |
| Figure 13 29: Mini Columns 360 Day Cumulative Copper Extraction | 148 |
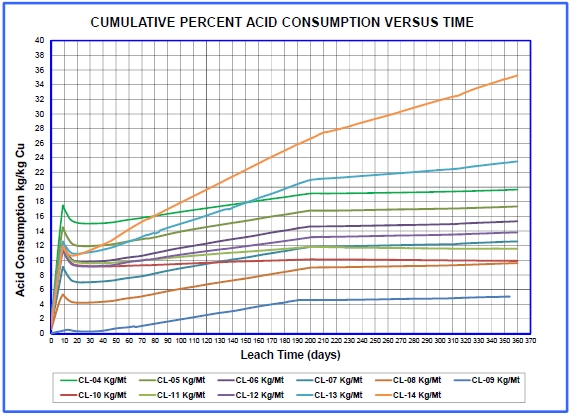
| Figure 13 30: Mini Columns 360 Day Cumulative Acid Consumption | 148 |
| Figure 13 31: Mini Column 5 Acid to Copper Ratio vs. Time | 150 |
| Figure 13 32: Copper Species Eh-pH Diagram for Column MCL-01 | 153 |
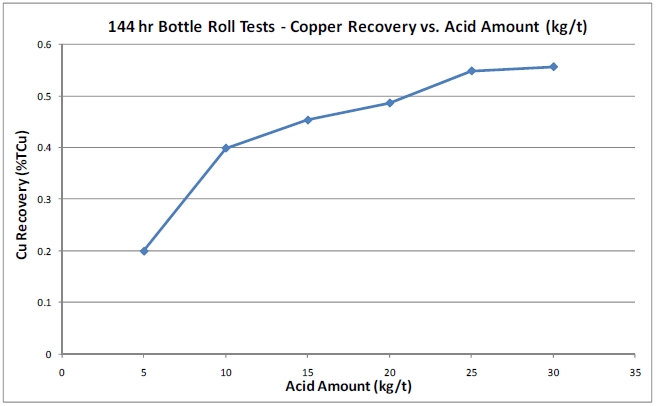
| Figure 13 33: 144 Hour Bottle Rolls Copper Recovery vs. Acid Precure | 154 |
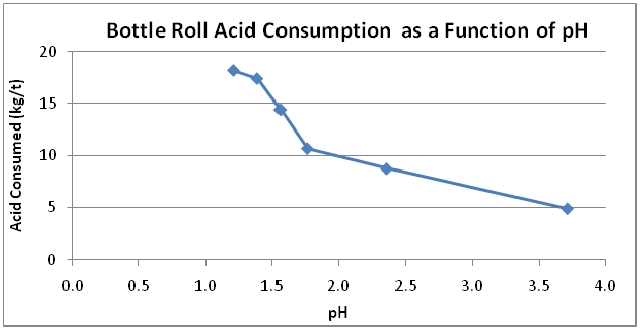
| Figure 13 34: 144 Hour Bottle Roll Acid Consumption & pH | 155 |
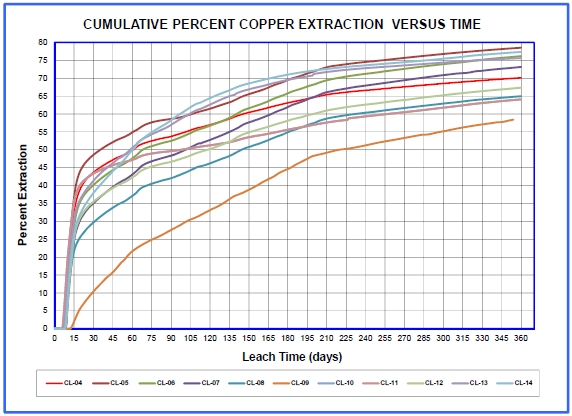
| Figure 13 35: TCu Extraction vs. Time for all Column Tests | 156 |
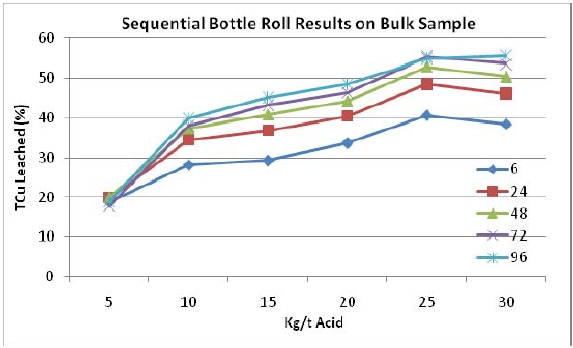
| Figure 13 36: Copper Rate Recoveries from Sequential Bottle Roll Tests | 157 |
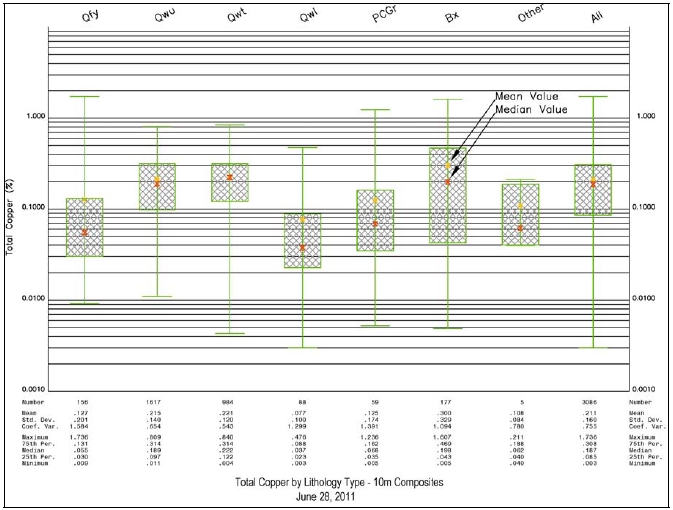
| Figure 14 1: TCu by Lithology Type | 162 |
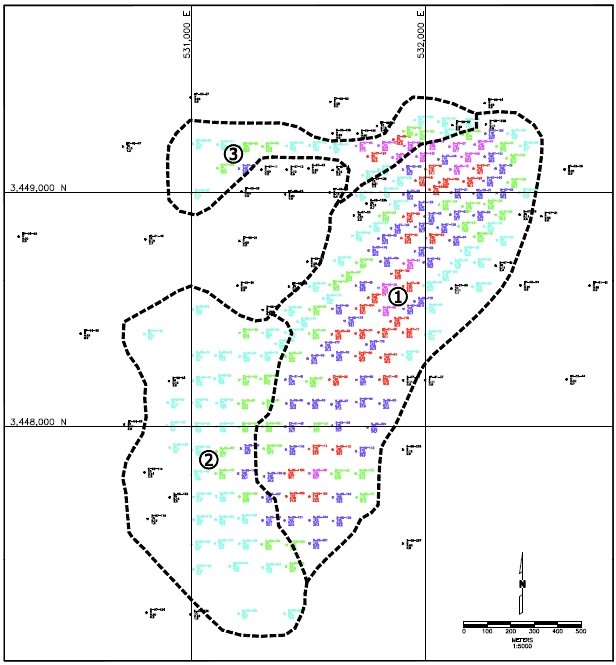
| Figure 14 2: Structural Zones | 164 |
| Figure 14 3: Total Copper - Main Ore Zone Variogram | 165 |
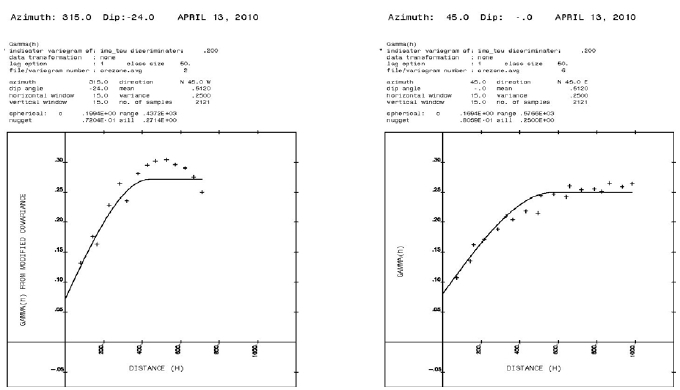
| Figure 14 4: Indicator Variograms Discriminator of 0.2% Cu | 166 |
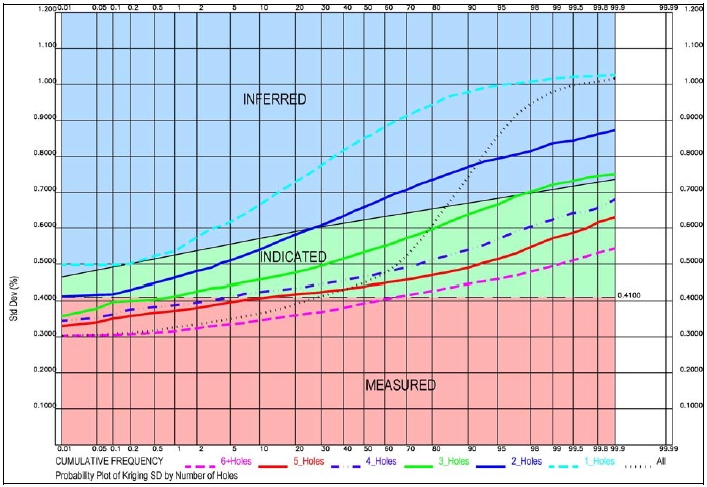
| Figure 14 5: Kriging Standard Deviation | 170 |
| Figure 15 1: Floating Cone Based on Design Price ($2.15 Cu) and Costs. | 178 |
| Figure 15 2: Final Pit Design – Phase 6 | 179 |
| Figure 16 1: Final Pit Design - Starter Pit | 182 |
| Figure 16 2: Final Pit Design – Phase 2 | 183 |
| Figure 16 3: Final Pit Design - Phase 3 | 184 |
Page x
El Pilar Project Form 43-101F1 Technical Report | |
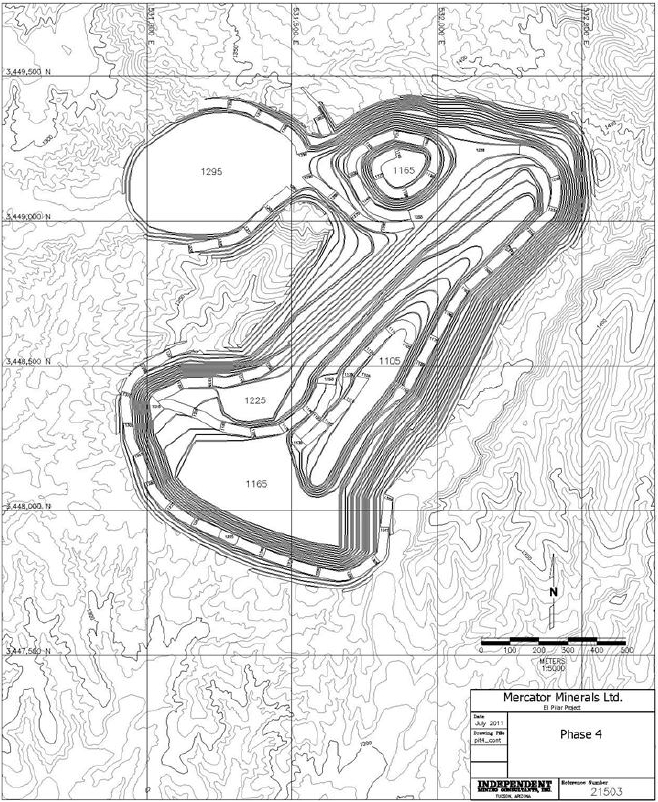
| Figure 16 4: Final Pit Design - Phase 4 | 185 |
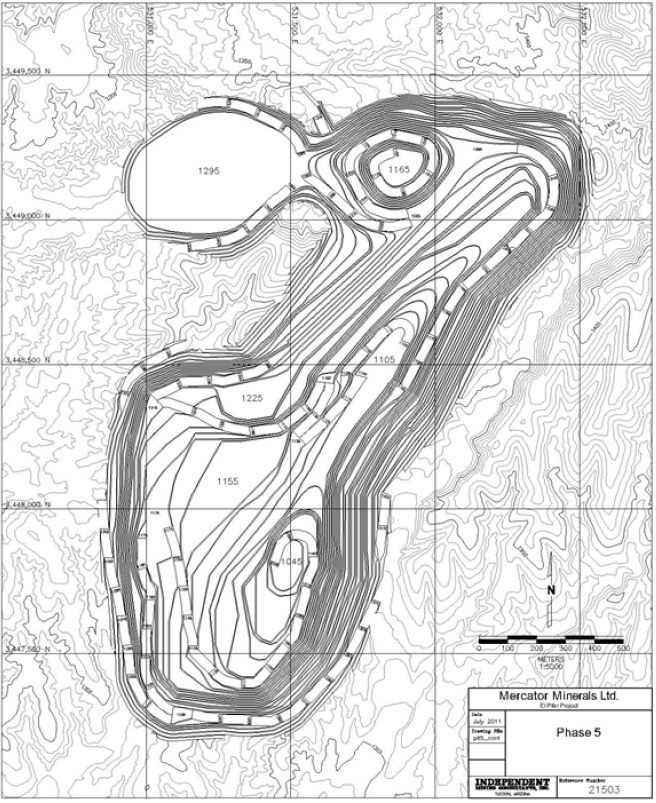
| Figure 16 5: Final Pit Design - Phase 5 | 186 |
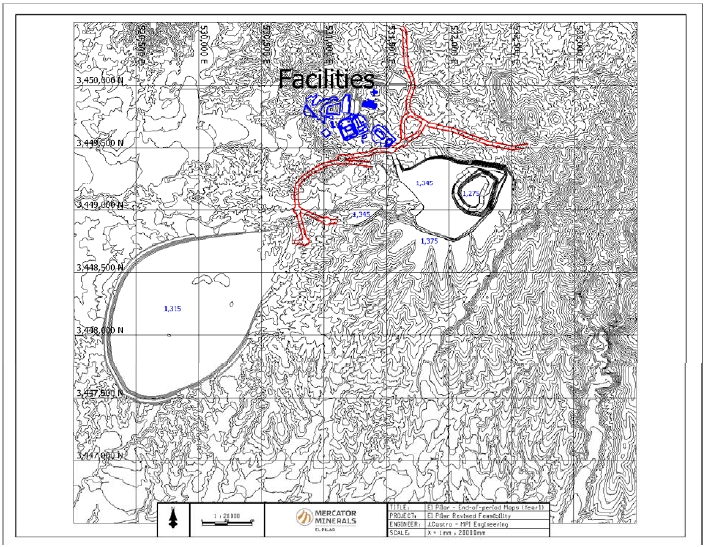
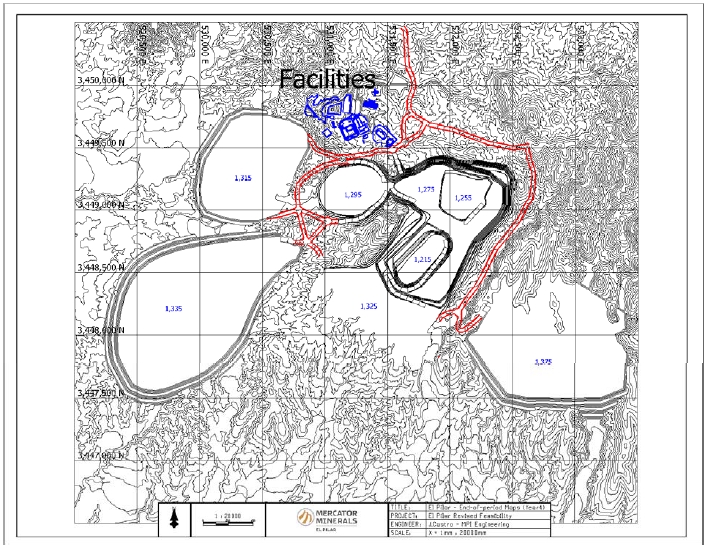
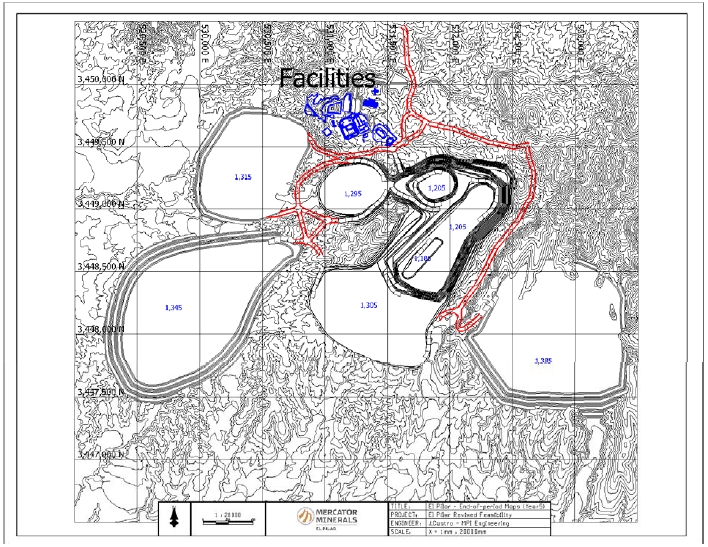
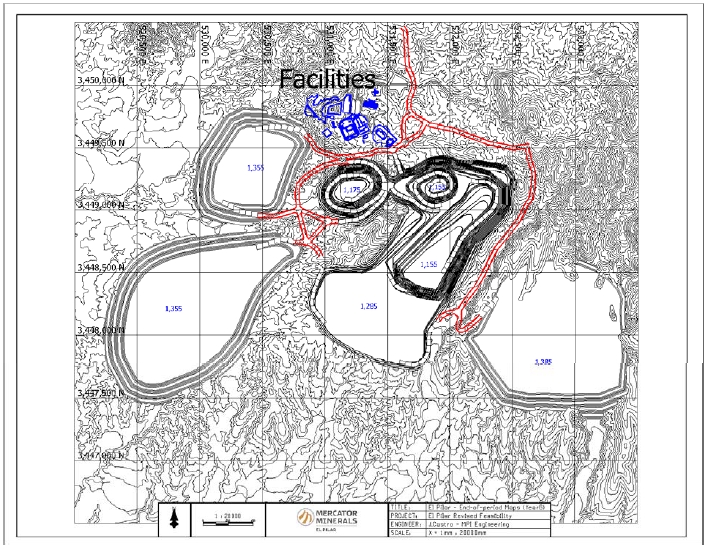
| Figure 16 6: Final Pit and Dumps (Year 13) | 194 |
| Figure 16 7: End of Preproduction Year 0 | 195 |
| Figure 16 8: End of Year 1 | 196 |
| Figure 16 9: End of Year 2 | 197 |
| Figure 16 10: End of Year 3 | 198 |
| Figure 16 11: End of Year 4 | 199 |
| Figure 16 12: End of Year 5 | 200 |
| Figure 16 13: End of Year 6 | 201 |
| Figure 16 14: End of Year 7 | 202 |
| Figure 16 15: End of Year 8 | 203 |
| Figure 16 16: End of Year 9 | 204 |
| Figure 16 17: End of Year 10 | 205 |
| Figure 16 18: End of Year 11 | 206 |
| Figure 16 19: End of Year 12 | 207 |
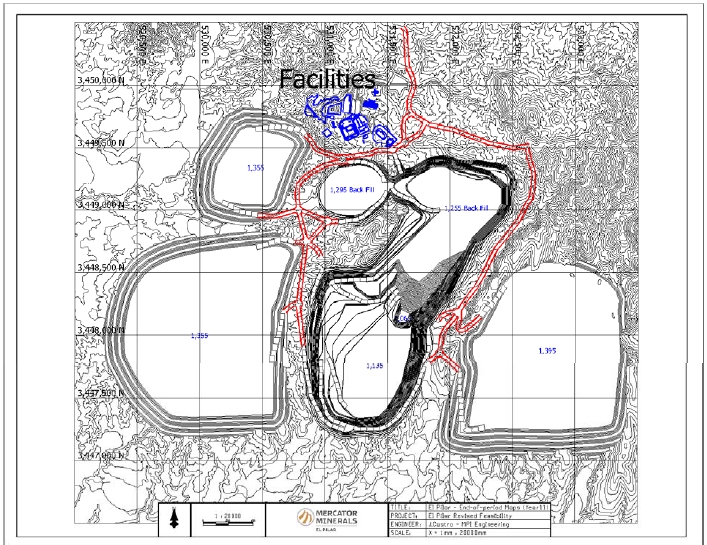
| Figure 17 1: General Site Plan (000-GA-001) | 227 |
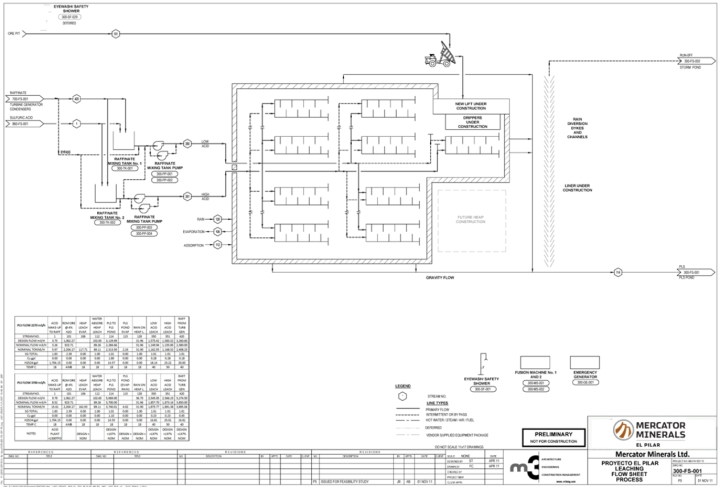
| Figure 17 2: Heap Leaching Flowsheet (300-FS-001) | 230 |
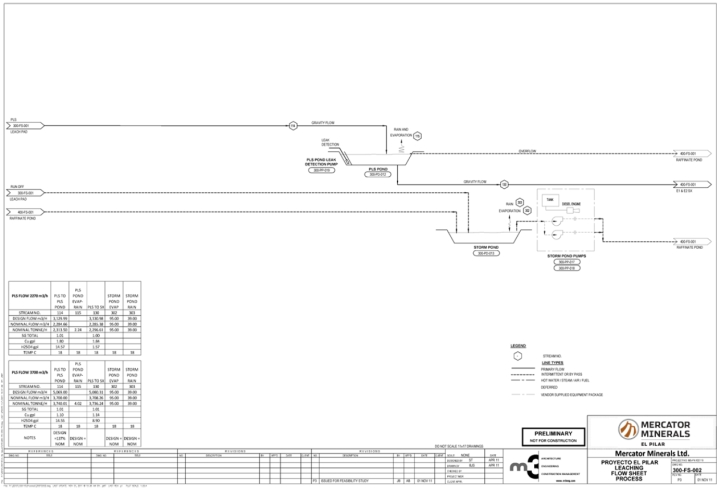
| Figure 17 3: Heap Leaching Flow Sheet (300-FS-002) | 231 |
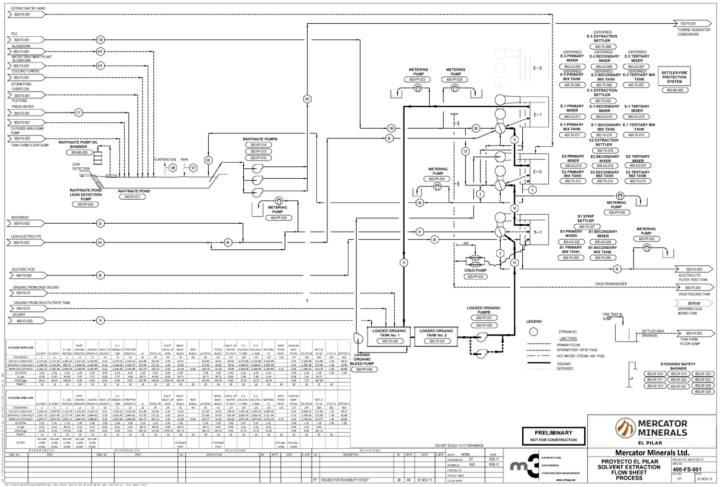
| Figure 17 4: Solvent Extraction Flowsheet (400-FS-001) | 236 |
| Figure 17 5: Solvent Extraction Plan (400-GA-001) | 237 |
| Figure 17 6: Electrowinning Flowsheet (600-FS-001) | 239 |
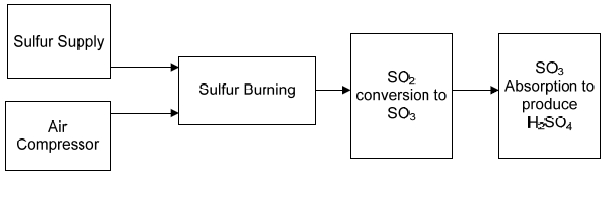
| Figure 18 1: Acid Plant Block Flow Process Diagram. | 241 |
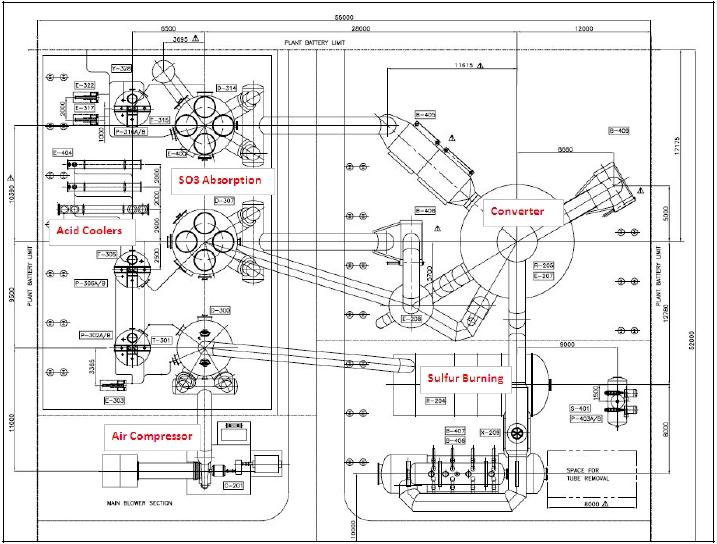
| Figure 18 2: Acid Plant Layout. | 241 |
| Figure 18 3: Sketch of Sulfur Unloading Facilities. | 245 |
| Figure 22 1: Base Case – Chart 1 Sensitivity After-Tax NPV@8% | 277 |
| Figure 22 2: Base Case – Chart 2 Sensitivity After-Tax NPV@8% | 278 |
| Figure 22 3: Base Case – Copper Recovery Sensitivity After-Tax NPV@8% | 279 |
Page xi
El Pilar Project Form 43-101F1 Technical Report | |
LIST OF TABLES
| Table 1 1: El Pilar Mineral Resource – 0.15% Copper Cutoff | 2 |
| Table 1 2: El Pilar Mineral Resource @ Various Copper Cutoff Grades | 2 |
| Table 1 3: El Pilar Mineral Reserves | 3 |
| Table 1 4: El Pilar Economic Summary | 4 |
| Table 1 5: El Pilar Mineral Resource – 0.15% Copper Cutoff | 12 |
| Table 1 6: El Pilar Measured & Indicated Mineral Resources at Different Cutoff Grades | 12 |
| Table 1 7: El Pilar Inferred Mineral Resources at Different Cutoff Grades | 13 |
| Table 1 8: El Pilar Mineral Reserve | 13 |
| Table 1 9: Mine Production Schedule | 15 |
| Table 1 10: Permitting Requirements | 19 |
| Table 1 11: Operating Cash Cost – Contract Mine Site Cost Summary | 19 |
| Table 1 12: Overall Capital Cost Estimate | 20 |
| Table 1 13: Main Parameters Before and After Taxes | 22 |
| Table 2 1: Abbreviations | 26 |
| Table 4 1: Mining Concession Status | 30 |
| Table 6 1: Magri 2003 Kriging Results for Lithological Units | 36 |
| Table 6 2: Woods 2007 Inferred Resource | 37 |
| Table 6 3: Hester 2009 Mineral Resource - 0.15% Copper Cutoff | 38 |
| Table 6 4: Hester 2009 Mineral Resource - 0.20% Copper Cutoff | 38 |
| Table 6 5: Hester 2009 Mineral Resource - 0.25% Copper Cutoff | 38 |
| Table 6 6: Hester 2009 Mineral Reserves at 0.15% Copper Cutoff | 39 |
| Table 6 7: Hester 2009 Mineral Resources (Exclusive of Reserve) | 39 |
| Table 6 8: Hester 2011 Mineral Reserves | 40 |
| Table 7 1: Mineralogy of Qwu by Sieve Size (%) | 46 |
| Table 7 2: Qwu Bulk Sample Size Analysis & Assays | 47 |
| Table 7 3: Mineralogy of Qwt by Sieve Size (%) | 48 |
| Table 7 4: Microprobe data from Crib Head sample showing copper in smectite | 59 |
| Table 10 1: El Pilar Tabulation of Historical Drilling | 70 |
| Table 12 1: Core Recovery Table 1 | 86 |
| Table 12 2: Core Recovery Table 2 | 87 |
Page xii
El Pilar Project Form 43-101F1 Technical Report | |
| Table 12 3: Core Recovery Table 3 | 88 |
| Table 12 4: Core Recovery Table 4 | 89 |
| Table 12 5: Core Recovery Table 5 | 90 |
| Table 13 1: Yearly Composite Bottle Roll Results | 94 |
| Table 13 2: METCON Locked Cycle Test Results – Five Yearly Composites | 95 |
| Table 13 3: Results of Bulk Sample Dry Screening | 98 |
| Table 13 4: Bulk Sample Fractions to METCON & Duplicates | 98 |
| Table 13 5: Bulk Sample (Qwu) Head Size Analysis & Assays | 99 |
| Table 13 6: Bulk Sample (Qwu) Tail Size Analysis & Assays | 100 |
| Table 13 7: Crib Truck Loads & Weights | 102 |
| Table 13 8: Final Acid Curing Data for MP Cribs | 103 |
| Table 13 9: Final Acid Curing Data for MP Columns | 103 |
| Table 13 10: Bulk Sample Bottle Roll Results – Part 1 | 106 |
| Table 13 11: Bulk Sample Bottle Roll Results – Part 2 | 107 |
| Table 13 12: MP Crib & Column Metallurgical Test Results | 108 |
| Table 13 13: C-01 Crib Tail Analysis | 110 |
| Table 13 14: C-02 Crib Tail Analysis | 110 |
| Table 13 15: Summary of Bulk Sample 150 Day Leach Crib & Column Results. | 110 |
| Table 13 16: Summary of Crib Results Sequential Copper Extraction per Layer | 112 |
| Table 13 17: METCON 5 Column Bulk Sample 120 Day Metallurgical Test Results | 113 |
| Table 13 18: METCON 5 Column Bulk Sample 180 Day Metallurgical Test Results | 115 |
| Table 13 19: Composite Selection Criteria for Thirteen New Columns | 117 |
| Table 13 20: 13 Column Final Composite Assays | 125 |
| Table 13 21: 13 Column Bottle Rolls Columns 1 – 7 | 126 |
| Table 13 22: 13 Column Bottle Rolls Columns 8 – 12 | 127 |
| Table 13 23: 13 Columns 120 Day Leach Data | 129 |
| Table 13 24: 13 Columns 180 Day Leach Data | 129 |
| Table 13 25: METSIM Metallurgical Projections for Five Yearly Composites | 132 |
| Table 13 26: METSIM Metallurgical Projections for Five Backup Columns | 132 |
| Table 13 27: METSIM Metallurgical Projections for 13 Columns | 133 |
| Table 13 28: 180 Day Copper Recovery Projections Used for Recovery Algorithm | 134 |
| Table 13 29: Final 180 Day Leach Recovery Data | 136 |
Page xiii
El Pilar Project Form 43-101F1 Technical Report | |
| Table 13 30: Comparison between Assay and Calculated Heads | 137 |
| Table 13 31: Comparison of 6 Meter and 3 Meter Copper Extraction | 139 |
| Table 13 32: 3 Meter Lift Height Projected 180 Day Copper Extraction. | 140 |
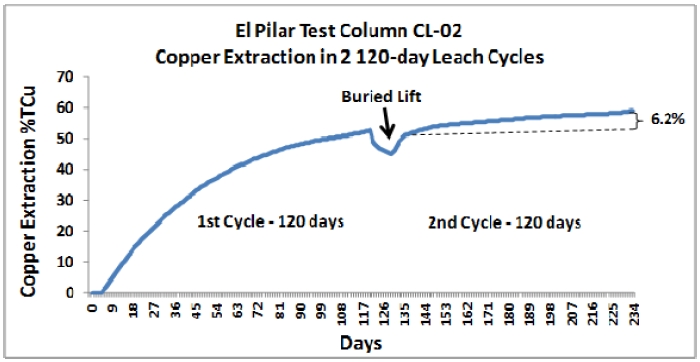
| Table 13 33: Column CL-02 Initial and Buried Lift Results | 142 |
| Table 13 34: 3 Meter Lift Height Projected 360 Day Copper Extraction. | 143 |
| Table 13 35: Mini Column Details. | 145 |
| Table 13 36: Mini Column 180 Day Leach Results. | 146 |
| Table 13 37: Mini Column 360 Day Leach Results. | 147 |
| Table 13 38: Comparison of Mini Column Results | 149 |
| Table 13 39: Bottle Roll Acid Consumptions Used for LOM Acid Consumption | 151 |
| Table 13 40: Acid Consumption Increments Used in the Reserve & Economic Model | 152 |
| Table 13 41: 180 Day Period Copper Recovery of RCu | 156 |
| Table 13 42: Comparison of Metallurgical Composite Drillhole vs. METCON Assays | 158 |
| Table 14 1: Description of El Pilar Rock Types | 162 |
| Table 14 2: Copper Estimation Parameters – Table 1 | 167 |
| Table 14 3: Copper Estimation Parameters – Table 2 | 168 |
| Table 14 4: Specific Gravity Determinations | 169 |
| Table 14 5: El Pilar Mineral Resources – Inclusive of Mineral Reserves | 171 |
| Table 14 6: El Pilar Mineral Resources – Exclusive of Mineral Reserves | 171 |
| Table 14 7: Measured & Indicated Mineral Resources at Various Cutoff Grades | 171 |
| Table 14 8: Inferred Mineral Resources at Various Cutoff Grades | 172 |
| Table 14 9: Comparison of Models for Measured and Indicated Mineral Resources | 173 |
| Table 14 10: Comparison of Models for Inferred Mineral Resources | 174 |
| Table 15 1: Economic Parameters for Reserve Calculation | 175 |
| Table 15 2: 2011 El Pilar Slope Parameters | 177 |
| Table 15 3: El Pilar Mineral Reserve | 180 |
| Table 16 1: El Pilar Mining Phases | 187 |
| Table 16 2 Mine Production Schedule by Year | 188 |
| Table 16 3: Mine Production Schedule Year 0 – Year 2 by Months | 189 |
| Table 16 4: Summary of Recommended Catch Bench Widths and Inter-Ramp Angles | 192 |
| Table 16 5: 2011 El Pilar Pit Slope Parameters | 193 |
| Table 16 6: Major Equipment Requirements | 208 |
Page xiv
El Pilar Project Form 43-101F1 Technical Report | |
| Table 16 7: Summary of Mine Material Movements & Operations Schedule | 210 |
| Table 16 8: Operating Time per Shift | 211 |
| Table 16 9: Material Characteristics. | 211 |
| Table 16 10: Additional Material Characteristics | 212 |
| Table 16 11: Blasting Inputs & Assumptions | 213 |
| Table 16 12: Drilling Inputs & Assumptions | 214 |
| Table 16 13: Drilling Requirements by Year | 216 |
| Table 16 14: Shovel Requirements | 218 |
| Table 16 15: Loader Requirements | 220 |
| Table 16 16: Truck Requirements | 222 |
| Table 16 17: Truck Speed, Loading & Shift Factors | 223 |
| Table 16 18: Support Equipment Requirements | 225 |
| Table 18 1: Acid Plant Key Operating Parameters. | 242 |
| Table 18 2: Expected Performance Characteristics of Turbine Generator. | 242 |
| Table 18 3: Preliminary Well Water Analysis. | 243 |
| Table 18 4: Acid Plant Expected Water Quality | 244 |
| Table 18 5: LOM Economic Model Sulfur Pricing | 246 |
| Table 18 6: Acid Plant Costs & Parameters by Year | 247 |
| Table 20 1: Environmental Monitoring Program | 253 |
| Table 20 2: Permitting Requirements | 254 |
| Table 20 3: Permit Matrix | 256 |
| Table 21 1: Facility Initial Capital Costs | 262 |
| Table 21 2: Capital Cost Expenditures by Month | 263 |
| Table 21 3: Mining Capital Costs | 265 |
| Table 21 4: Unit Costs for Major Mine Equipment | 266 |
| Table 21 5: LOM Capital Costs Summary | 267 |
| Table 21 6: Life-of-Mine Mining Costs | 268 |
| Table 21 7: Incremented LOM Acid Consumption | 269 |
| Table 21 8: Life-of-Mine Processing Costs | 270 |
| Table 21 9: Life-of-Mine Administrative (G&A) Costs | 270 |
| Table 21 10: Comparison between Operating Costs Used for Reserve and Economics | 271 |
| Table 22 1: Life of Mine Ore, Waste Quantities, and Ore Grade | 272 |
Page xv
El Pilar Project Form 43-101F1 Technical Report | |
| Table 22 2: 180 Day Leach Copper Recovery by Period | 273 |
| Table 22 3: Copper Prices Used for Economic Analyses Cases | 274 |
| Table 22 4: Financial Analysis Summary of Base Case and Cases 2-7 Copper Pricing | 276 |
| Table 22 5: Base Case Financial Model, Unlevered, After-Tax | 280 |
| Table 22 6: Constant Copper Price Case 1 @$2.50 Copper Financial Model, Unlevered, After-Tax | 282 |
| Table 22 7: Constant Copper Price Case 2 @$3.00 Copper Financial Model, Unlevered, After-Tax | 283 |
| Table 22 8: Constant Copper Price Case 3 @$3.50 Copper Financial Model, Unlevered, After-Tax | 284 |
| Table 22 9: Constant Copper Price Case 4 @$4.00 Copper Financial Model, Unlevered, After-Tax | 285 |
| Table 22 10: Constant Copper Price Case 5 @$4.50 Copper Financial Model, Unlevered, After-Tax | 286 |
| Table 22 11: Constant Copper Price Case 6 @$5.00 Copper Financial Model, Unlevered, After-Tax | 287 |
| Table 22 12: Financial Model for 3 Meter Lift Height 360 Day Copper Recovery Case. | 289 |
| Table 22 13: Financial Model for LOM Contract Mining | 291 |
| Table 25 1: Main Parameters Before and After Tax | 295 |
| Table 25 2: Sensitivities - After Tax | 295 |
Page xvi
El Pilar Project Form 43-101F1 Technical Report | |
A Feasibility Study Contributors and Professional Qualifications
| Feasibility Study Contributors & Professional Qualifications |
| Responsibility | Author | Registration | Designation | Company |
| Feasibility Study | Michael
Broch | FAusIMM | Qualified Person
(QP) | Mercator Minerals Ltd. |
Data Verification: QA/QC, Resource Modeling, Mine Planning, and Reserves | Mike Hester | FAusIMM | Other Expert | IMC |
| Geology | John Dreier | P. Geo | Other Expert | Exploration, Development and Mining Consultants, Inc. |
Metallurgy, Flow Sheets and Process Plant | Thomas L. Drielick | P. E. | Other Expert | M3 Engineering |
| Process Plant (SX-EW) | Mark Vancas | | Other Expert | |
| Pit Geotechnical | Ken Myers | P. E. | Other Expert | The Mines Group |
Heap Design / Geotechnical | Anthony Crews | P. E. | Other Expert | The Mines Group |
Environmental and Permits | Julian Bennett | M. Sc. | Other Expert | M3M |
| Hydrology | Dr. Miguel Rangel | Ph. D. | Other Expert | IDEAS |
Acid Plant / Power Plant Sulfur Unloading | Eric Partelpoeg | Ph. D. | Other Expert | EHP |
| Sulfur Pricing Study | Robert Boyd | | Other Expert | Elkbury Sulfur Consultants, Inc. |
Page xvii
El Pilar Project Form 43-101F1 Technical Report | |
| 1 | SUMMARY |
| | |
| 1.1 | Overall Report Summary |
This report is an update to the November 2011 Feasibility Study (2011 Study) authored by M3 Engineering and Technology and others. The 2011 Study is substantially repeated herein, with the only significant modification being the incorporation of a new Base Case that utilizes enhanced copper recoveries based on converting the leach pad from 6 meter to 3 meter (m) lift heights. The metallurgical data used for the 3 m copper recoveries were presented in the 2011 Study, but the case was referred to in that report as a “semi-quantified recovery case”, because to fully quantify the 3 m case required redoing the reserve and mine plan under an extended time schedule not available at that time.
As a result of using the 3 m lift height copper recovery algorithm, the primary differences between this report and the 2011 Study are as follows; 1) the 3 m lift height copper recovery algorithm is used for the Base Case reserve and economics, 2) a new mineral reserve is presented, and 3) a new mine plan is included based on the new reserve. These differences result in substantially improved project economics and in one additional year of mine life. Other new information or differences include 1) new metallurgical data from 11 mini columns is presented 2) where needed in the economic model, the acid plant is run at 110% of capacity, from 1300 tpd to a maximum of 1430 tpd, and 3) the timing of the preproduction period has changed from 12 months to 15 months for first cathode and to 18 months for completion of the acid plant, which requires that market acid be purchased during the first three months of leaching.
For ease of comparison, this report is based on the same capital cost estimates as the 2011 Study and utilizes the same copper prices. In other words, this report is an update to higher metallurgical copper recoveries projected for the 3 meter high lifts, but it is not an update to the 2011 capital costs estimated by M3 and others. Although the capital costs utilized herein are the same as the 2011 Study, there are some differences in timing of the costs, due to greater leach pad area being required early in the mine life due to use of the 3 m lifts.
Mercator Minerals Ltd. (ML), through its subsidiary Recursos Stingray de Cobre, S.A. de C.V. (“Stingray”), plans to develop the 100% wholly owned El Pilar oxide copper project into one of Sonora, Mexico’s new copper mines. The El Pilar copper project is a “greenfield” project with no existing mining infrastructure or equipment on the property. The Santa Cruz River flows year around 2 km south of the project. The railway of Ferrocarril Mexicano follows this river basin, as do local roads. Power is available at Nogales approximately 28 km to the northwest of the project area.
The basis of this updated Feasibility Study (“Study”) is the use of mining contractor in Years 0-2 followed by owner mining starting in Year 3 for the remainder of the mine life. Therefore, the mining process assumes the use of haul trucks for mining and stacking onto the ore heap, followed by solvent extraction and electro-winning (SXEW) processing in facilities as outlined in the process flow drawing developed in the 2011 Study.
El Pilar Project Form 43-101F1 Technical Report | |
Michael J. Broch, FAusIMM, of Mercator Minerals Ltd. (the Author”), is the Qualified Person responsible for the technical content of this Study, except where reliance on Other Experts is expressly indicated.
As estimated by Independent Mining Consultants (“IMC”) in the 2011 Study, and unchanged, and still reliable and current from that earlier estimate, Measured and Indicated mineral resources are presented in Table 1-1 and Table 1-2 below:
Table 1-1: El Pilar Mineral Resource – 0.15% Copper Cutoff
| El Pilar Mineral Resources (Inclusive of Reserve) |
| | 0.15% Copper Cutoff |
| Mineral Resource Class | Ore Ktonnes | Total Cu (%) | Sol Cu (%) | Copper (Mlbs) |
| Measured Mineral Resource | 128,094 | 0.307 | 0.128 | 867.0 |
| Indicated Mineral Resource | 231,154 | 0.266 | 0.095 | 1,355.5 |
| Measured/Indicated Resource | 359,248 | 0.281 | 0.107 | 2,222.5 |
| Inferred Mineral Resource | 67,996 | 0.239 | 0.082 | 358.3 |
Table 1-2: El Pilar Mineral Resource @ Various Copper Cutoff Grades
| Measure and Indicated Mineral Resources @ Different Cutoff Grades |
TCu
Cutoff
(%) | Measured Mineral Resource | Indicated Mineral
Resource | Measured/Indicated
Mineral Resource |
| Ore Ktonnes | Total Cu (%) | Soluble Cu (%) | Ore Ktonnes | Total Cu (%) | Soluble Cu (%) | Ore Ktonnes | Total Cu (%) | Soluble Cu (%) |
| 0.30 | 64,377 | 0.385 | 0.193 | 67,814 | 0.366 | 0.172 | 132,191 | 0.375 | 0.182 |
| 0.25 | 86,144 | 0.357 | 0.168 | 119,222 | 0.326 | 0.132 | 205,366 | 0.339 | 0.151 |
| 0.20 | 109,304 | 0.329 | 0.145 | 178,495 | 0.292 | 0.113 | 287,799 | 0.306 | 0.125 |
| 0.15 | 128,094 | 0.307 | 0.128 | 231,154 | 0.266 | 0.095 | 359,248 | 0.281 | 0.107 |
| 0.10 | 137,301 | 0.295 | 0.121 | 255,218 | 0.253 | 0.087 | 392,519 | 0.268 | 0.099 |
Proven and Probable mineral reserves (Table 1-3) planned for mining over a period of 13 years are calculated on the basis of $2.15 per lb copper and are estimated to be 258.5 Mt averaging 0.304% total copper (TCu). This is as compared to the 2011 Study reserve of 230.2 Mt averaging 0.313% TCu, which was calculated on the basis of $2.75 per lb copper. The mine-life waste to ore stripping ratio is currently estimated to be 1.76:1, as compared to the 1.95:1 reported in 2011.
El Pilar Project Form 43-101F1 Technical Report | |
Table 1-3: El Pilar Mineral Reserves
| El Pilar Mineral Reserves |
| | | | Ore | Total Cu | Sol Cu | Copper |
| Reserve Class | | Ktonnes | (%) | (%) | (Mlbs) |
| Proven Mineral Reserve | | 108,546 | 0.322 | 0.143 | 771.2 |
| Probable Mineral Reserve | | 149,999 | 0.291 | 0.121 | 961.8 |
| Proven/Probable Mineral Reserve | 258,545 | 0.304 | 0.13 | 1,733.0 |
| Total Pit Material | 712,311 | Ktonnes. | Waste:Ore | 1.76 | |
The project mine design rate reaches its maximum of 22 Mt of ore per year, or approximately 60,000 tpd in Year 4. The project is expected to produce 998.3 million pounds (Mlbs) of cathode copper over the 13 year mine life. This is an improvement of 116.6 Mlbs over the 881.7 Mlbs of copper projected over a 12 year mine life in the 2011 Study. The cathode product is expected to meet ASTM 115 Grade 1 copper cathode specifications (99.99+% copper) and will be purchased FOB at the El Pilar mine site.
For this report, a 13 year mine schedule was developed. At the process plant design rate, the project is expected to produce a maximum of 39,400 t (87 million pounds) of copper cathode per year. Actual production averages 85.4 and 85.7 Mlbs per year for the first 5 and 8 years of the project, respectively after which copper production declines due to declining acid soluble copper head grades. For economical and practical reasons, the maximum mine ore capacity was designed to be 22 Mt per year. At this capacity, the average copper cathode production over the 13 year LOM is 79.3 Mlbs per year. This production schedule forms the basis for the financial model.
The initial capital cost for the El Pilar Base Case Project is estimated to be US$279.9 million, including a 1300 tpd acid plant and the use of a mining contractor in Years 0-2, followed by owner mining. This is as compared to the US$244 initial capital cost estimated in 2011. The difference is mostly due to the to the requirement that the $26.4 M Phase II heap leach expansion, originally slated for Year 3 in the 2011 Study, now be constructed in Year 0, due to the larger pad area required by the 3 meter lifts. Also, in order to match M3’s contingency estimates, a 15% contingency has been added to the Phase II heap leach capital total, bringing the total amount brought forward to $35.9 M. Sustaining capital of $19.1 million is also estimated over the life of mine.
A cash reserve of $33.8 million is recommended. The operating cash cost for the project is calculated at $1.34 per pound of copper, as compared to $1.37 in 2011. At a Base Case average copper price of $2.82 per pound, the El Pilar Project has an after tax IRR of 36.6%, and an after-tax net present value (NPV), discounted at 8%, of $416.0 million (M). This is compared to the 2011 estimated IRR of 35.7% and an NPV@8% of $335.3 M. The estimated payback of capital is now 1.8 years, as compared to 1.6 years in the 2011 Study. A summary of the project economics is included below in Table 1-4.
El Pilar Project Form 43-101F1 Technical Report | |
Table 1-4: El Pilar Economic Summary
| EL PILAR | ECONOMIC SUMMARY* |
Initial Capital Cost (includes Acid Plant) | $ 279.9 million |
| Cash Reserve | $ 33.8 million |
| Sustaining Capital | $ 19.1 million |
| Cash Operating Cost | $ 1.34 per lb copper |
| IRR (after taxes) | 36.6% |
| NPV@8% (after taxes) | $416.0 M |
| Payback (after taxes) | 1.77 years |
| | * Base case at $3.82/lb copper price per pound Years 0 and 1, $3.44/lb Year 2, $3.14/lb Year 3, and $2.60/lb for the remaining life of mine, averaging $2.82/lb copper over the life of mine. |
In 2011, Mercator Minerals Ltd. (ML) engaged M3 to prepare the updated Feasibility Study of the El Pilar oxide copper project (Project) to assess the viability of commercial operations. That work is essentially repeated herein, except for differences that result from using copper recoveries projected for a 3 meter, rather than a 6 meter, leach pad lift height. Due to the limited number of changes from the 2011 Study, this report is being authored in-house by ML and will be the cornerstone for project financing, permitting, planning and construction of a copper mining operation at El Pilar. The information from the 2011 Study referred to in this report is still reliable and current and there have been no material changes.
ML plans to develop the Project in Sonora, Mexico as an open pit mining heap leach operation with a solvent extraction and electro-winning processing plant (SXEW). The El Pilar deposit contains 258.5 million tonnes (Mt) of ore with a copper content of 0.304%, containing a total of 1.73 billion pounds of copper, of which 998.3 million pounds are estimated to be recoverable. The process plant will be designed to produce up 39,400 tonnes of copper cathode (87 million pounds) per year. ML plans to begin engineering and then construction immediately upon completion of project financing. All environmental permits are in place to begin construction. In parallel with the preparation of this Feasibility Study, ML has been investigating project financing options and plans to complete project construction as soon as practical.
| 1.3 | Reliance on Other Experts |
Reports received from Other Experts have been reviewed for factual errors by ML. Any changes made as a result of these reviews did not involve any alteration to the conclusions made. The statements and opinions expressed in these documents are given in good faith and in the belief that such statements and opinions are true and accurate at the date of these reports. Details on information provided from the Other Experts are found in Section 3 of this report.
El Pilar Project Form 43-101F1 Technical Report | |
| 1.4 | Property Description and Location |
The El Pilar Property is located in north central Sonora Sate, Mexico about 15 km south of the international border with United States of America (See Figure 1-1). The property is situated within lands of Ejido Miguel Hidalgo (also referred to as San Lazaro), in the Santa Cruz Municipality. The property is situated between UTM coordinates 3,446,000N to 3,455,000N and 526,800 E to 534,700 E.
Figure 1-1: El Pilar Location Map
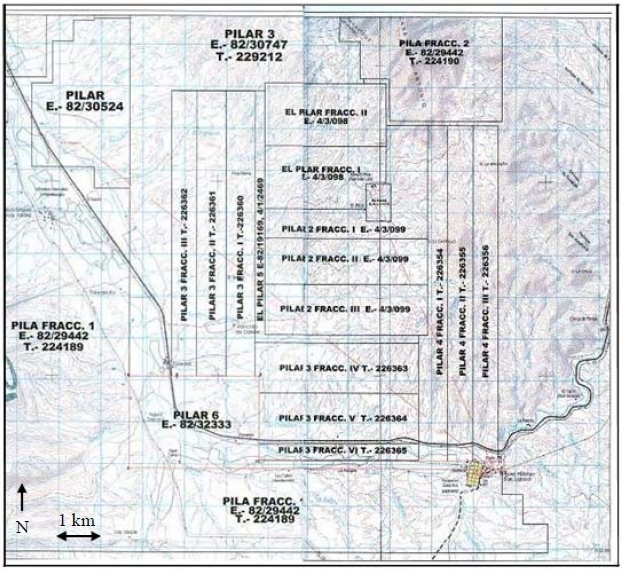
The El Pilar property comprises 7,170 hectares in eighteen concessions (See Section 4.1 for the Concession Map). These concessions are wholly owned by Recursos Stingray de Cobre S.A de C.V. (formerly Normex), the wholly owned Mexican subsidiary of ML.
The status of the mining concessions is outlined in Section 4. A total of 1,926 hectares of surface rights have been successfully negotiated with the Ejido Miguel Hidalgo, which allows for all required land ownership rights needed for project development.
| 1.5 | Accessibility, Climate, Local Resources, Infrastructure & Physiography |
The El Pilar deposit is located at the southwest margin of the Patagonia Mountains near the base of a mountain range. The topography near the deposit permits sufficient surface space for a mining operation, leaching pads, waste disposal areas, and other facilities.
The property can be reached by road from Hermosillo, Sonora in Mexico and from Tucson, Arizona in the USA. The route from Hermosillo to Miguel Hidalgo takes about 3 1/2 hours of
El Pilar Project Form 43-101F1 Technical Report | |
driving time. The route from Tucson to Miguel Hidalgo is currently a 2 hour drive. The site is a green-field mining site with no existing infrastructure. Experienced mining personnel and related contractors are available within driving distance.
The project area’s climate allows year-round mining and processing operations. The climate is classified as semidry with a summer rainy season and limited rains the rest of the year. The average annual temperature is 17.8°C. The project site elevation ranges from 1,250 m to 1,425 m above sea level (masl). The hottest months are June to September. Most of the rainfall occurs in the form of summer storms during the months of July, August and September. Mean annual precipitation is 543.6 mm.
A power line is located 3 km to the south, in the village of Miguel Hidalgo (San Lazaro). The project will require construction of a high voltage power line from the site to connect with the high voltage power lines accessible in Nogales, 29.5 km northwest. A railroad is located four km south of the deposit. Construction of a new railway spur approximately 3.8 km in length is planned for the delivery of molten sulfur or sulfuric acid.
The history of exploration in the El Pilar area before 1992 is not well documented. It is known that in the 1970’s, Cyprus Amax Minerals had claims in the area. According to verbal communications with local people and field evidence, it is clear that a geophysical survey and a few drill holes were completed in the northern part of the El Pilar Discovery area. Results of both the drilling and the geophysical survey are unknown.
Before Normex's direct involvement, there was no mineral resource known, only small old workings following narrow veins with erratic copper and molybdenum mineralization. Other small workings in the area were dug by local miners (gambusinos), searching for azurite and turquoise.
Normex began acquiring ground at El Pilar in 1992. From 1992 to 1997, Normex carried out an exploration program that included regional mapping, sampling and limited geophysical surveying. From 1998 to 1999, Freeport Copper, under an agreement with Normex, carried out an exploration program that included regional mapping, rock and vegetation sampling, and some geophysical surveys. After the exploration agreement with Freeport ended in 2000, Normex continued with a short CSAMT survey and soil sampling exploration program. In addition, Normex carefully assessed the data generated by Freeport, emphasizing lab checks for validating the copper assays from the gravels. From September 2000 to March 2001, Normex completed a drill program. Following Normex’s drilling campaign, resource calculations were undertaken in 2001, and again in 2003. An inferred mineral resource estimate was completed by Magri in 2003. In April 2007, a Form 43-101 F1 Technical Report on the El Pilar Property was completed by Gary Woods, P. Geo.
Preliminary metallurgical test work was carried out at Falconbridge’s Lomas Bayas mine in Chile in 2003 and 2004 and by METCON in 2001 and 2005. This work included bottle roll testing and column leach tests. A scoping level economic evaluation was prepared by AMEC E&C Services Inc. of Phoenix, Arizona in 2005-2006 for Normex. The study concluded that the
El Pilar Project Form 43-101F1 Technical Report | |
El Pilar project demonstrated positive economics and was worthy of further assessment. Stingray acquired the property at that juncture. Mercator Minerals Ltd. purchased Stingray Copper in 2009.
In April 2009, an NI 43-101 compliant Feasibility Study was filed on behalf of Stingray by M3 Engineering. Included within the NI 43-101 are mineral resource and a mineral reserve estimates done independently by Mike Hester of IMC in Tucson.
In 2010 and 2011, additional metallurgical work was undertaken through METCON and new studies were undertaken to better understand the geology and mineralogy of the deposit in order to better estimate LOM and period copper recoveries and acid consumption. In addition, the project was optimized significantly in terms of relocating facilities for maximum efficiency and new engineering work was carried out through M3 Engineering. All of this work resulted in the November 2011 updated Feasibility Study, which is substantially repeated herein.
| 1.7 | Geological Setting & Mineralization |
The deposit is located along the southwest flank of the Patagonia Mountains. The geology of the El Pilar property consists of Precambrian intrusive rocks overlain by Paleozoic sedimentary rocks. These units are overlain by Tertiary sedimentary rocks. Intrusives of granitic to monzonitic composition with some pegmatitic and aplitic facies intrude all the older units. Tertiary and Quaternary alluvial fan and alluvial wash sediments cover the flanks of the ranges and the intervening valleys.
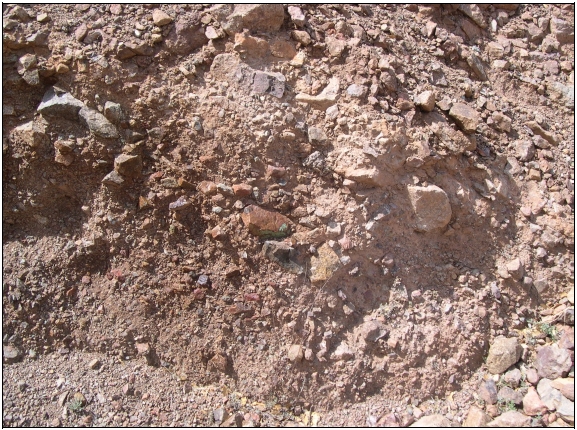
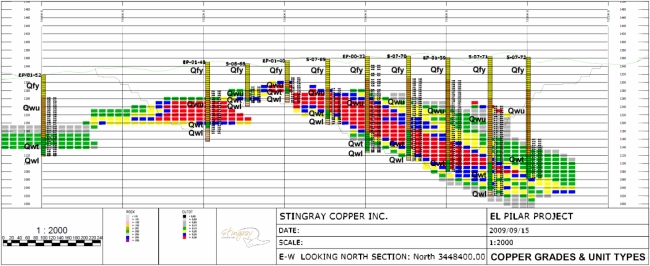
The El Pilar copper deposit occurs within unconsolidated, poorly sorted, poorly bedded, proximal facies alluvial wash deposits that are overlain by dissected younger alluvial fan deposits. The copper bearing sediments at El Pilar are comprised solely of alluvial wash gravels deposited into a paleotopographic range-front depression. At the northern boundary of the deposit, these basin-fill sediments are juxtaposed against unmineralized Precambrian granitic rocks by an east-west to northwest-trending, south dipping zone of faulting and hydrothermal brecciation. The faulting is of unknown displacement. The breccia zone comprises a multi-stage, highly silicified, copper mineralized hydrothermal breccia that is up to 100 m wide and 600 meters long. The El Pilar copper deposit is interpreted to have been formed by erosion of this breccia over time into the range-front topographic depression.
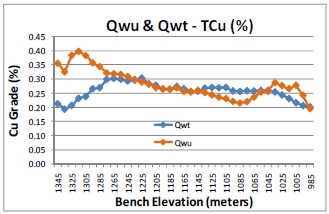
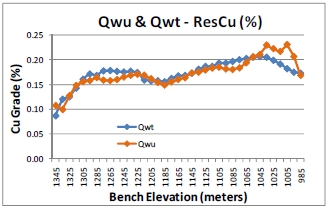
Mineralization predominantly consists of the copper oxide mineral chrysocolla, which occurs as coatings on clasts of highly silicified breccia and as grains in the sedimentary gravel matrix. The main gravel sequence that hosts copper mineralization consists of poorly consolidated angular to sub-rounded fragments of breccia, intrusive rocks and minor volcanic fragments cemented in a sandy matrix. These productive gravels, referred to as Quaternary Alluvial Wash Deposits Upper (Qwu) and Quaternary Alluvial Wash Deposits Transitional (Qwt), range from 30 m to 180 m in thickness. The main zone of copper mineralization occurs within a southwest/south trending channel that extends for more than 2 km.
El Pilar Project Form 43-101F1 Technical Report | |
El Pilar lies within the Sonora-Arizona Porphyry Copper Province, about 45 km northwest of the Cananea copper mine owned by Grupo Mexico. Cananea is the largest porphyry copper deposit in Mexico and one of the largest in the world. Both El Pilar and Cananea are situated in a highly prospective belt of copper deposits that range from La Caridad in the south through to central Arizona. The main types of copper deposits in this belt are related to porphyry copper systems and mineralization typically occurs in hydrothermal breccias pipes and as disseminations and stockworks. The El Pilar property hosts a gravel hosted or transported copper resource that is atypical for the area. Copper at El Pilar is hosted by range front alluvial wash deposits with clasts of intrusive, porphyry and highly silicified rock derived from a proximal, exposed hydrothermal breccia zone. The mineralization is interpreted to have been derived at least in part from that breccia and possibly also in part from a pre-existing porphyry copper deposit on the property that is yet to be identified. Reconstruction of events suggests that the breccia was mechanically weathered and eroded, transported and deposited in a channel and alluvial fan sequence that overlies a lower more indurated alluvial wash unit (Qwl).
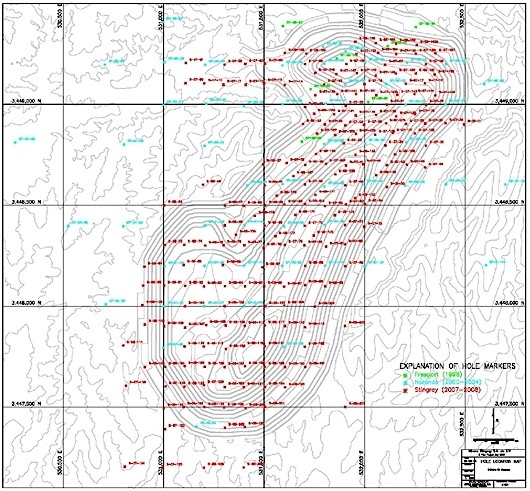
Normex and partners began exploration at the property in the late 1990s, conducting geophysical and geochemical exploration programs over the property. Pre-Stingray drilling amounts to 61 holes representing 11,988 m that were drilled by Freeport and Noranda between 1998 and 2004. In terms of meters of drilling, this represents 23% of the total drilling to date.
The Stingray geologic and drill hole database was provided to IMC for review and included 255 holes that represented 52,810 m of drilling.
During 2007 and 2008, Stingray drilled 194 HQ core holes representing 40,822 m (see Section 10 of this report for figures and details). This drilling represents 77% of the drill hole database in terms of meters drilled. The purpose for the drilling was to: 1) validate the Freeport and Noranda drilling, 2) extend the resource base, and 3) collect samples to perform metallurgical testing over the entire copper deposit.
| 1.11 | Sample Preparation, Analyses and Security |
All of the analytical work that was done for Noranda was performed by the Bondar Clegg Lab in Vancouver, B.C., following sample preparation by Bondar’s affiliate in Hermosillo. For sample security, after splitting of the core, the samples were bagged by project geologists and driven to the sample preparation laboratory in Hermosillo by Noranda personnel. Sample preparation and shipment of the pulps to the Vancouver analytical laboratory was conducted by lab personnel. Noranda personnel were not involved in sample preparation.
Sample preparations and analysis for Stingray drilling was performed at two different laboratories. About 60% of the drilling analyses were done by ALS Chemex laboratories and about 40%, particularly the drilling used for metallurgical testing, were done by the METCON
El Pilar Project Form 43-101F1 Technical Report | |
laboratory in Tucson, Arizona. Sample preparation for ALS Chemex was done at their Hermosillo, Mexico facility, after which the pulps were shipped to Vancouver for analysis. As part of the QA/QC work several hundred pulps were analyzed at both laboratories. ALS Chemex laboratories are highly regarded facilities for sample preparation and analysis. Most laboratories are registered to ISO 9001:2000 standards and many are ISO 17025 accredited.
Total copper analysis was done by a four acid digestion, nitric, perchloric, hydrofluoric, and hydrochloric acid, followed by analysis with Inductively Coupled Plasma - Atomic Emission Spectroscopy (ICP-AES).
To validate the El Pilar database, in 2011 IMC compared the database with assay certificates for eight pre-Stingray holes and eight Stingray holes. This represents 6.3% of all holes and about 8% of the holes with significant mineralization (about 200 of the 255 holes). No significant discrepancies were found. IMC concluded that the database fairly captured the correct assay data.
Stingray conducted a comprehensive program to assure the quality of its sample preparation and analysis (assaying). Standard, blank and duplicate samples from the El Pilar exploration program were subjected to quality assurance. The standard samples were prepared at METCON using interval samples provided by Stingray. The blank sample came from a monzonite outcrop at the El Pilar and is not anomalous in copper. The standard, blank and duplicate samples were generally inserted (used) as follows:
| | ● | Duplicate samples were inserted every ten samples. |
| | ● | Blank samples were inserted every 20 intervals. |
| | ● | Standard samples were inserted every ten interval samples. |
It is the opinion of IMC that the sampling method is appropriate for the nature of mineralization at El Pilar. The current density of drill holes is also appropriate. There are more holes than would typically be drilled into a disseminated copper deposit at the feasibility study level, though much of the drilling was for the collection of metallurgical samples.
| 1.13 | Mineral Processing and Metallurgical Testing |
The El Pilar mine will be an open pit, oxide copper mine, whereby copper is recovered from the heap leach pad via the application of sulfuric acid-bearing raffinate pumped from a raffinate pond. The pregnant leach solution (PLS) is then collected and copper is recovered in the plant via the process of solvent extraction/electrowinning (SXEW) in a two-stage process that first extracts and upgrades copper ions from low-grade leach solutions into a concentrated electrolyte, and then deposits pure copper onto cathodes using an electrolytic procedure. Extensive metallurgical work has been conducted historically and more recently in 2010 and 2011 to best determine how much copper will be recovered from the ores and how much acid will be consumed by the process.
El Pilar Project Form 43-101F1 Technical Report | |
In preparation for the updated 2011 El Pilar Feasibility Study, a detailed review of all technical studies was conducted with particular attention to project metallurgical conclusions and conducted extensive new metallurgical testing. The additional metallurgical testing performed in 2010 and 2011 was done on a 600 tonne bulk sample collected onsite and on 13 new drill core composites. The following was concluded from results of the locked cycle tests conducted on the bulk sample composite, as reported in the 2011 Study.
| | ● | Run of mine particle size distribution at 80 percent passing 1 ¼ inches did not negatively impact copper extraction and gangue acid consumption compared to 80 percent passing 37.5 mm, 19 mm and irrigation flow rates of 6.1 and 7.8 lph/m2, respectively, using a sulfuric acid cured dosage of 4 kilogram per tonne of material. |
| | ● | The copper extractions on the two composites, C-01 and C-02 ranged from 67.9% to 63.7% and gangue acid consumption ranged from 5.7 to 5.0 kilogram per kilogram of copper extracted (kg/kg Cu), and 20.7 to 17.7 kilogram acid per tonne of material (kg/ tonne) after a total leach cycle of 166 days (including 7 days of cure, 150 days of leach, 7 days of wash and 2 days of drain cycles). |
| | ● | The highest copper extraction of approximately 71 percent was achieved at the size distribution of minus 3/4 inches on the crib C-01. |
| | ● | The lowest copper extraction of approximately of 43.5 percent was achieved at the size distribution of plus 3/4 inches on the crib C-02. |
| | ● | Percolation problems were not observed in the cribs during the leach cycle. |
| | ● | There is a good correlation between the calculated head and assay head for copper and iron. |
Combined metallurgical tests from the Stingray 2009 program and from the bulk sample and 13 column composites tested in 2010 and 2011, and reported in the 2011 Study, resulted in the following conclusions:
| | 1. | The El Pilar copper deposit consists of gravels that are poorly cemented and disaggregate almost completely into a “pre-crushed” size distribution on mining. |
| | 2. | As a result of the above and based on the crib results, Run-of-Mine (ROM) leaching should attain recoveries comparable to the column test averages. |
| | 3. | A 180 day leach cycle should be assumed initially, although real operating conditions may show that a shorter leach cycle is viable. |
| | 4. | Copper recoveries at El Pilar are at least initially a function of copper solubility, although mineralogical studies suggest that over longer periods of time a considerable amount of the residual copper may be recovered. |
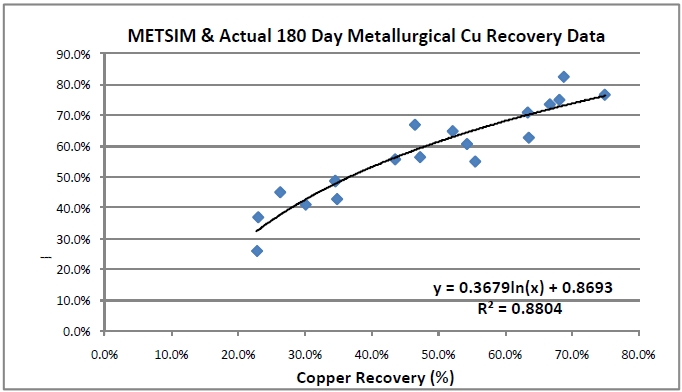
| | 5. | There is a grade recovery relationship for 6 m high lifts leached for 180 days, as defined by the formula, Recovery % (of TCu) = 0.3679ln(X) + 0.8693, where X is the Ratio (%ASCu/%TCu). This formula results in 55.5% copper recovery over the LOM. |
| | 6. | There is a grade recovery relationship for 3 m high lifts leached for 180 days, as defined by the formula, Recovery % (of TCu) = 0.3352ln(X) + 0.8841, where X is the Ratio (%ASCu/%TCu). This formula results in 57.6% copper recovery over the LOM. |
| | 7. | There is a grade recovery relationship for 3 m high lifts leached for 360 days, as defined by the formula, Recovery % (of TCu) = 0.3080ln(X) + 0.92611, where X is the Ratio (%ASCu/%TCu). This formula results in 64.9% copper recovery over the LOM. |
El Pilar Project Form 43-101F1 Technical Report | |
| | 8. | An initial precure rate of about 10 to 15 kg per tonne acid is assumed. |
| | 9. | LOM acid consumption should average approximately 22 kg acid per tonne of ore. |
Additional metallurgical testing on 11 mini columns 3 m high was undertaken in late 2011 and 2012, after the 2011 Study was complete, and this information is reported as new data in this report. Several important considerations can be concluded from the mini column results, as follows:
| | 1. | Copper extraction rates (kinetics) are directly related to the initial acid precure amount up to 15 kg/t, with the best initial copper extraction being Column 5, which was cured at the 15 kg/t acid precure rate. However, for at least for one sample, Column 4, initial copper recovery was not improved by adding 18 kg/t of acid precure. This column actually recovered less copper than Column 5, suggesting that there is no benefit to that level of acid precuring. |
| | 2. | Initial acid consumption in the first 10 days or so is related to the acid precure amount, but ongoing acid consumption is a function raffinate pH, with lower acid consumption related to higher raffinate pH. |
| | 3. | Acid consumption is not directly related to the amount of acid applied. Column 5, with an acid precure amount of 15 kg/t, was run under relatively high raffinate pH conditions of pH 1.8, but had nearly the best overall copper recovery after 180 days of leaching of 69.5% coupled with only modest acid consumption of 16.2 kg/t. |
| | 4. | Importantly, after the solution application rate was halved from 4.0 lph/m2 to 2.0 lph/m2 after leach day 192, which had the effect of halving the amount of acid subsequently added to the columns, copper recovery continued at nearly the same positive rate, whereas acid consumption flat lined. |
| | 5. | At the time of the writing of this report, significant copper continues to be recovered from the columns even after 325 days of total leaching, supporting 360 day projected recoveries. As well. The continued long term copper extraction indicates that the “ultimate” recovery of copper from the El Pilar ores is not yet known and that significant additional copper may be recovered from the buried lifts, which will effectively be “under leach” for years. |
Whereas the 6 meter lift height 180 day copper recovery algorithm was used for the 2011 Study Base Case, this report replaces that Base Case with a new Base Case that utilizes the 3 m lift height 180 day copper recovery algorithm. The difference between these two algorithms is that the 2011 Study estimated that 881.7 M lbs of copper would be recovered over the LOM averaging 55.5 % recovery of total copper. This report projects that 998.3 M lbs of copper will be recovered over the LOM from essentially the same material averaging 57.6% copper recovery.
Several other project upsides are suggested by the metallurgical testing program and results, as flows:
| | 1. | Using longer leach data from two columns and based on 360 copper recovery Metsim projections for the remaining columns, an alternate 3 meter lift height 360 day grade/recovery algorithm results in 1,142.6 M lbs of copper being recovered over the |
El Pilar Project Form 43-101F1 Technical Report | |
| | | LOM, averaging 64.9% LOM total copper recovery. This equates to 144.4M lbs more copper being produced over 360 days of leaching than the Base Case. This case is semi-quantified as an alternate Financial Copper Recovery Case in the Economic Analysis section of this report. |
| | 2. | Under managed pH conditions during real operations, as opposed to the very high acid application rates of 10 gpl free acid used for the metallurgical tests, and also under managed solution application rates, LOM acid consumption may be lower than presently projected. |
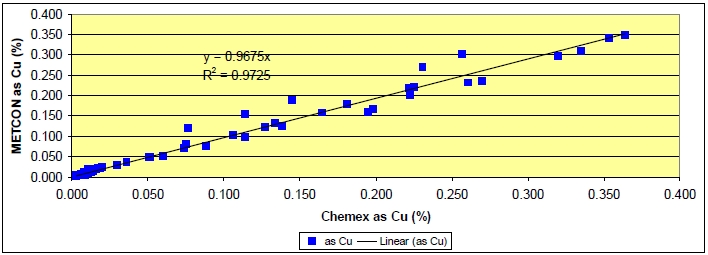
| | 3. | Due apparently to differences in assay procedures between the METCON test results and the drillhole database, up to 3.6 percentage points more soluble copper may be present than modeled. This could equate to as much as 45 M lbs more copper being produced over the LOM. |
| | 4. | Using a 10 to 15 kg per tonne acid precure, rather than the 4 kg per tonne precure used in almost all of the metallurgical tests, will likely result in faster copper recovery rates that could positively impact project economics and allow for a shortened leach cycle, as well as for potentially better copper recoveries over the life of mine. |
| 1.14 | Mineral Resource Estimates |
The following tables (Table 1-5 and Table 1-6) present the mineral resource for the El Pilar Project as calculated by Mike Hester, FAusIMM of IMC and Other Expert for the purposes of this report, under the supervision of the Author. They are inclusive of the mineral reserve.
Table 1-5: El Pilar Mineral Resource – 0.15% Copper Cutoff
| El Pilar Mineral Resources (Inclusive of Reserve) |
| | 0.15% Copper Cutoff |
| Mineral Resource Class | Ore Ktonnes | Total Cu (%) | Sol Cu (%) | Copper (Mlbs) |
| Measured Mineral Resource | 128,094 | 0.307 | 0.128 | 867 |
| Indicated Mineral Resource | 231,154 | 0.266 | 0.095 | 1,356 |
| Measured & Indicated Resource | 359,248 | 0.281 | 0.107 | 2,223 |
| Inferred Mineral Resource | 67,996 | 0.239 | 0.082 | 358 |
Table 1-6: El Pilar Measured & Indicated Mineral Resources at Different Cutoff Grades
| Measure and Indicated Mineral Resources @ Different Cutoff Grades |
TCu Cutoff (%) | Measured Mineral Resource | Indicated Mineral Resource | Measured/Indicated Mineral Resource |
Ore Ktonnes | Total Cu (%) | Soluble Cu (%) | Ore Ktonnes | Total Cu (%) | Soluble Cu (%) | Ore Ktonnes | Total Cu (%) | Soluble Cu (%) |
| 0.30 | 64,377 | 0.385 | 0.193 | 67,814 | 0.366 | 0.172 | 132,191 | 0.375 | 0.182 |
| 0.25 | 86,144 | 0.357 | 0.168 | 119,222 | 0.326 | 0.132 | 205,366 | 0.339 | 0.151 |
| 0.20 | 109,304 | 0.329 | 0.145 | 178,495 | 0.292 | 0.113 | 287,799 | 0.306 | 0.125 |
| 0.15 | 128,094 | 0.307 | 0.128 | 231,154 | 0.266 | 0.095 | 359,248 | 0.281 | 0.107 |
| 0.10 | 137,301 | 0.295 | 0.121 | 255,218 | 0.253 | 0.087 | 392,519 | 0.268 | 0.099 |
El Pilar Project Form 43-101F1 Technical Report | |
Mineral Resources at different cutoff grades are summarized in Table 1-7.
Table 1-7: El Pilar Inferred Mineral Resources at Different Cutoff Grades
Inferred Resources @ Various Cutoffs |
TCu Cutoff (%) | Inferred Mineral Resource |
Ore Ktonnes | Total Cu (%) | Soluble Cu (%) |
| 0.30 | 9,969 | 0.422 | 0.216 |
| 0.25 | 20,898 | 0.344 | 0.153 |
| 0.20 | 39,612 | 0.286 | 0.111 |
| 0.15 | 67,966 | 0.239 | 0.082 |
| 0.10 | 90,333 | 0.212 | 0.068 |
The mineral resources are based on a three-dimensional (3D) block model developed by IMC and ML personnel during July and August 2011. The mineral resource estimates are compliant with the current CIM standards and definitions specified by NI 43-101. The resource also meets the “reasonable prospects for economic extraction” conditions of the NI 43-101 code.
ML does not know of any environmental, permitting, legal, title, taxation, socio-economic, marketing, or political issues which would affect the mineral resource or mineral reserve estimates. Note, however, that mineral resources that are not converted to mineral reserves do not have demonstrated economic viability. Also, inferred mineral resources are speculative in nature and may not be converted to measured and indicated mineral resources or to mineral reserve.
| 1.15 | Mineral Reserve Estimates |
Table 1-8 below summarizes the El Pilar mineral reserves for the new 3 m lift height Base Case as calculated by Mike Hester of IMC under the supervision of the Author. The proven and probable mineral reserves are 258 Mt at 0.304% total copper for 1.73 billion pounds of contained copper.
Table 1-8: El Pilar Mineral Reserve
| El Pilar Mineral Reserve |
| | | | Ore | Total Cu | Sol Cu | Copper |
| Reserve Class | | | Ktonnes | (%) | (%) | (Mlbs) |
| Proven Mineral Reserve | | 108,546 | 0.322 | 0.143 | 771.2 |
| Probable Mineral Reserve | | 149,999 | 0.291 | 0.121 | 961.8 |
| Proven/Probable Mineral Reserve | | 258,545 | 0.304 | 0.13 | 1,773.0 |
| Total Pit Material | 712,311 Ktonnes. | | | Waste:Ore 1.76 | |
The mining reserve used in the Study was determined by Mike Hester of IMC under the supervision of the Author and forms the basis for the Feasibility Study. The El Pilar mining
El Pilar Project Form 43-101F1 Technical Report | |
reserve and mineral resource were determined from the drilling that extended from drill section 9300 North to drill section 7200 North at its southernmost limit. The drill spacing in the northern “Starter Pit” area of the deposit, which represents the initial 3 years of operation, is approximately 70 m and elsewhere in the deposit averages approximately 100 m. Surface topography was determined via an aerial topographic survey completed by Cooper Aerial in 2007. The copper mineralization remains open at its southern limit, albeit it is lower grade and relatively deep. The mineral resource at El Pilar exceeds the mining reserve scheduled for mining in this Study and additional mineral resources and mining reserves may be available at El Pilar, subject to appropriate programs of drilling and confirmation.
Mike Hester of IMC is the Outside Expert responsible for the preparation of the mine plan, the open pit design and the mining schedule used in this Feasibility Study. IMC incorporated the
results of the Mines Group geotechnical report “El Pilar Pit Slope Design” into the open pit design criteria.
The mining reserve of 258.5 Mt is scheduled for an annual forecast of projected ore tonnes and copper grade available in each year. The mining objective is based on moving approximately 34,250 ore t/d during the first full year of operation, gradually increasing to a maximum of 60,270 ore t/d in year 3 and thereafter, over a planned period of 365 operating days per year. This equates to a maximum target of approximately 22 Mt/y of ore being mined.
The basis mine production schedule developed by IMC is shown in Table 1-9 below.
El Pilar Project Form 43-101F1 Technical Report | |
Table 1-9: Mine Production Schedule
| Mine Production Schedule |
| | | Copper Grades | | | | | | | |
Mining Period | Ore Ktonnes | Total Copper % | Soluble
Copper % | Recoverable Copper % | Residual Copper % | Ratio (TCu/ASCu) | Waste Ktonnes | Total Ktonnes | Waste: Ore Ratio | Acid Cons. (kg/t) | Copper Recovery % | Contained Cu (Klbs) | Recovered Cu (Klbs) |
| PP | 2,250 | 0.309 | 0.191 | 0.221 | 0.118 | 0.618 | 12,750 | 15,000 | 5.67 | 16.00 | 71.5% | 15,327 | 10,962 |
| Year 1 | 17,800 | 0.355 | 0.202 | 0.243 | 0.153 | 0.569 | 22,200 | 40,000 | 1.25 | 16.00 | 68.4% | 139,309 | 95,359 |
| Year 2 | 14,650 | 0.382 | 0.206 | 0.256 | 0.176 | 0.539 | 28,350 | 43,000 | 1.94 | 17.00 | 67.0% | 123,376 | 82,682 |
| Year 3 | 20,150 | 0.315 | 0.158 | 0.202 | 0.157 | 0.502 | 47,849 | 67,999 | 2.37 | 18.00 | 64.1% | 139,931 | 89,735 |
| Year 4 | 21,110 | 0.313 | 0.136 | 0.183 | 0.177 | 0.435 | 46,889 | 67,999 | 2.22 | 19.00 | 58.5% | 145,667 | 85,167 |
| Year 5 | 21,900 | 0.31 | 0.127 | 0.174 | 0.183 | 0.410 | 45,099 | 66,999 | 2.06 | 20.00 | 56.1% | 149,670 | 84,009 |
| Year 6 | 23,500 | 0.289 | 0.125 | 0.166 | 0.164 | 0.433 | 49,000 | 72,500 | 2.09 | 21.00 | 57.4% | 149,725 | 86,002 |
| Year 7 | 23,600 | 0.28 | 0.121 | 0.165 | 0.159 | 0.432 | 54,400 | 78,000 | 2.31 | 22.00 | 58.9% | 145,680 | 85,848 |
| Year 8 | 21,800 | 0.312 | 0.136 | 0.181 | 0.176 | 0.436 | 62,200 | 84,000 | 2.85 | 23.00 | 58.0% | 149,948 | 86,990 |
| Year 9 | 20,600 | 0.293 | 0.103 | 0.151 | 0.19 | 0.352 | 51,900 | 72,500 | 2.52 | 24.00 | 51.5% | 133,065 | 68,577 |
| Year 10 | 21,000 | 0.262 | 0.107 | 0.149 | 0.155 | 0.408 | 15,671 | 36,671 | 0.75 | 25.00 | 56.9% | 121,297 | 68,983 |
| Year 11 | 20,200 | 0.278 | 0.098 | 0.143 | 0.18 | 0.353 | 8,907 | 29,107 | 0.44 | 26.00 | 51.4% | 123,802 | 63,683 |
| Year 12 | 19,000 | 0.302 | 0.096 | 0.147 | 0.206 | 0.318 | 4,835 | 23,835 | 0.25 | 27.00 | 48.7% | 126,500 | 61,575 |
| Year 13 | 10,985 | 0.284 | 0.075 | 0.118 | 0.209 | 0.264 | 3,718 | 14,702 | 0.34 | 28.00 | 41.7% | 68,775 | 28,685 |
| Total/Avg. | 258,545 | 0.304 | 0.130 | 0.175 | 0.174 | 0.428 | 453,768 | 712,312 | 1.95 | 21.86 | 57.6% | 1,732,074 | 998,256 |
El Pilar Project Form 43-101F1 Technical Report | |
The Run-of-Mine (ROM) ore from the open pit will be transported to the leach pad facility using contract and owner mine haul trucks. The ROM ore will be end dumped on the Heap Leach Pad (HLP) and spread to nominal 3 meter thick lifts initially, although thicker lifts may be used in the future as real operating conditions become better known. After the initial leach cycle, the lifts will be ripped before new ore is placed on the successive lift.
Leaching will consist of the application of acidic solution to the heaped ore on the lined pad utilizing a distribution network of piping, drip emitters and/or sprinklers. A perforated pipe network embedded in the liner cover fill material will collect the pregnant leachate solution at the base of the heap, above the HLP primary geomembrane liner. The solution collection pipes will transport the solution flows to the PLS pond. From the PLS pond, the pregnant solution will flow to the SX facility via a HDPE pipe.
The PLS coming from the leaching area will be processed to recover copper using conventional solvent extraction, electro-winning (SXEW) technology. The SXEW plant is designed to process a maximum of 3,700 m3/h of PLS and produce an average of 79.3 million pounds of cathode copper per year (35,946 tonnes per year) over the LOM.
The copper will be recovered from the PLS in a SX facility consisting of two parallel extraction stages and one stripping stage as shown in Solvent Extraction Diagram 400-FS-001, below. In the extraction stages the PLS loaded with copper (or aqueous solution) is contacted with a reagent diluted in a solvent, together called the “organic solution”, and then the solutions are left to separate by density difference in the settlers. The reagent extracts the copper from the PLS, the solution depleted of copper, or Raffinate, is pumped back to the leach pad to again recover copper. The organic solution carries the copper to the Stripping Stage, where the organic solution is contacted with a highly acidic solution, called Lean Electrolyte returning from the electro-winning tank house (EW). The high acid concentration in the Lean Electrolyte causes the reagent to release the copper, increasing the copper concentration to produce a Rich Electrolyte, which is pumped to the electro-winning tank house (EW).
The Rich Electrolyte pumped from the SX plant to the EW tank house will be distributed to 92 electrowinning cells each of which contains 67 lead anodes paired with 66 stainless steel cathodes. A direct electrical current will be applied to the cells to plate the copper on the stainless steel blanks. The copper plates will be removed in a 7 day cycle. Copper cathodes will be the final product of the EW circuit. At the planned throughput rate, the plant will produce 35,946 t/y of copper cathode or approximately 98.5 t of copper cathode per operating day.
Copper cathode sheets will be weighed, sampled and assayed, and securely stored on site pending delivery to market. The El Pilar copper cathode product should meet ASTM B115, latest revision, Grade 1 specifications.
| 1.18 | Project Infrastructure |
Project infrastructure beyond the processing plant includes the following:
El Pilar Project Form 43-101F1 Technical Report | |
| | ● | Acid Plant and Power Plant |
The copper production process will require 600 to approximately 1,430 metric tons per day (tpd) of sulfuric acid to support the leaching of copper from the ore. In order to provide these acid requirements at the lowest cost possible, the project includes a sulfur-burning acid plant to provide both acid and power.
The El Pilar property can be reached by road from Hermosillo, Sonora in Mexico and from Tucson, Arizona in the USA. The route from Hermosillo to Miguel Hidalgo takes about 3 1/2 hours of driving time. The route from Tucson to Miguel Hidalgo is currently a two hour drive and utilizes a paved road from Nogales, Sonora to Miguel Hidalgo (30 km).
A main access road to the plant site from the main Nogales access road on west side of the project will be by way of a 6.5 km long gravel road that will be constructed early in the project development schedule. The project access road includes a crossing over the Santa Cruz River bed by way of a concrete dip, with hydraulic/drainage structures as required.
Based on the hydrological study conducted by IDEAS and the process water balance, the project includes three water wells to supply the necessary water volume for processing and services. Two of the three wells have been drilled, cased and tested, with yields of 30 lps and 40 lps, respectively. These wells yield a total of 2.3 Mm3/yr of the 3.5 Mm3/yr required. A third and possibly a fourth well will be drilled to fulfill maximum projected water requirements. All wells are located within the property and are located a relatively short distance from the facilities (about 2.5 km).
Power will be supplied to the project area in part via a 115 KV transmission line from a substation located 21 km south of Nogales, Mexico. The substation is 30 km west of the project area. The substation is owned and operated by Comisión Federal de Electricidad (CFE), which has confirmed power availability and provided an area next to the substation for the installation of switchgear and instrumentation. The power line will be 31 km long and built with dip galvanized structural steel towers, except for along urban areas where steel tapered poles may be used. The line will have capacity to supply all of the power requirements of the project estimated at a maximum of ~20 MW as backup, although most of the project power will be generated onsite by the sulfur burning acid plant.
As part of the infrastructure of the acid plant a railroad spur will be constructed to the plant site. The purpose of the spur is to provide a safe, economic and efficient access to sulfur deliveries by rail. The rail spur will access the property from the Ferromex rail system located on west side of the property, about 3.8 km distance from the sulfur unloading station. Rail facilities will allow for unloading and parking at least 18 railcars, with deliveries expected on a weekly basis.
El Pilar Project Form 43-101F1 Technical Report | |
| 1.19 | Market Studies and Contracts |
The projected production volume is too small to justify a direct marketing effort, and it is recommended that full production be tendered to a selected group of major merchants. This strategy will ensure immediate market entry and expedited payment with little or no credit risk in an increasingly competitive regional market.
| 1.20 | Environmental Studies, Permitting and Social or Community Impact |
The area encompasses modest hilly topography formed by erosion and weathering primarily of unconsolidated range-front sediments. The area is bounded to the west and south by the Santa Cruz River.
Landscape will be affected at first by clearing and grubbing, road construction and construction of mining facilities. Ultimately, impacts will be from the mine pit, waste dumps, and placement of ore on the heap leach pad. The effects of mining are irreversible, although some landscape effects are partially reversible in the long run through planned restoration and reforestation methods.
Surface preservation and mitigation measures planned are: impermeable retention areas where chemical substances or process solutions are handled, implementation of a hazardous and non-hazardous waste handling program, monitoring of surface water and creek sedimentation and water quality, and storm water diversion around disturbed areas where required.
Prevention and mitigation measures contemplated to protect groundwater quality include an impermeable layer in the leach pad, sumps and process areas, as well as installation of water monitoring wells below mining facilities with regular water quality monitoring.
Actions that are planned to mitigate vegetation impacts include compensation payments to the forest fund for land use rights, organic topsoil recovery during clearing and reuse of this material in the closure phase, and implementation of a flora and fauna species protection program during all stages of the project, including soil scarification and planting native species to restore the affected areas.
Waste generated during development and mining operations will be handled according to the provisions of the General Law for Prevention and Integrated Waste Management. A landfill will be built in the western part of the site to manage non-hazardous solid waste that cannot be recycled or reused, in compliance with NOM-083-SEMARNAT-2003.
There are three SEMARNAT permits required prior to construction; Environmental Impact Assessment (MIA), Change of Land Use (CUS) and Risk Analysis (AR). These permits have all been received already and the project is construction ready. Other minor permits required include a construction permit from the local municipality and an archaeological release letter from the National Institute of Anthropology and History (INAH). An explosives permit is required from the Ministry of Defense, SEDENA, before actual mining commences, and this permit is in the process of being attained. The key permits and the stages at which they are required are summarized below in Table 1-10.
El Pilar Project Form 43-101F1 Technical Report | |
Table 1-10: Permitting Requirements
| Key Environmental Permits |
| Permit | Mining Stage | Agency |
| Environmental Impact Manifest - MIA | Construction/Operation/Abandonment | SEMARNAT |
| Land Use Change -CUS | Construction/Operation | SEMARNAT |
| Risk Analysis - AR | Construction/Operation | SEMARNAT |
| Construction Permit | Construction | Santa Cruz Municipality |
| Explosive & Storage Permits | Construction/Operation | SEDENA |
| Archaeological Release | Construction | INAH |
| Water Use Concession | Construction/Operation | CNA |
| Water Discharge Permit | Operation | CNA |
| Unique License | Operation | SEMARNAT |
| Accident Prevention Plan | Operation | SEMARNAT |
In accordance with the general work schedule of the El Pilar Project, the abandonment phase will commence after year 13. As part of the permitting requirements, ML will prepare a detailed Closure and Reclamation Plan, which will be concurrently executed from the operation phase of the project and will be completed during the abandonment phase.
In order to mitigate and minimize potential impacts to the environment, ML will use the best available technology and will comply with all environmental norms and good practices applicable to the different development phases of the El Pilar project.
Environmental impacts resulting from the development of the mine are generally positive with minor negative impacts outweighed by the overall social and economic benefits.
| 1.21 | Capital and Operating Costs |
The El Pilar Project Base Case operating costs are shown in Table 1-11. These costs include the use of a mining contractor in Years 0-2 as well as all other cost areas that include administration, the mine department, the heap leach facility and the acid and SXEW plants.
Table 1-11: Operating Cash Cost – Contract Mine Site Cost Summary
| Operating Cost Component LOM | $/Cu lb |
| Mining Operations | $0.81 |
| Processing | $0.39 |
| General and Administration | $0.08 |
| Transportation | $0.03 |
| Royalty | $0.03 |
| Total Operating Cost | $1.34 |
El Pilar Project Form 43-101F1 Technical Report | |
| | 1.21.2 | Capital Cost Estimate |
Total initial facilities capital cost total $279.9 million. A summary of these capital costs is provided in Table 1-12. The more detailed capital cost estimate is found in Section 21.
Table 1-12: Overall Capital Cost Estimate
| Initial Capital Cost Estimate |
| AREA | AMOUNT |
DIRECT FIELD COST | |
| General Site Plan | 6,697,924 |
| Mine Truck Shop, Fuel, Lube, Truck Wash, etc. | 994,211 |
| Water System | 3,136,426 |
| Heap Leach Phase I & II | 56,943,123 |
| Process Maintenance shop | 200,534 |
| Solvent Extraction | 10,663,438 |
| Tank Farm | 8,093,024 |
| Electrowinning | 29,387,857 |
| Power Plant | 9,548,486 |
| Main Substation | 2,851,814 |
| CFE Substation and 115 kV Power Line | 7,104,716 |
| Water Treatment | 1,352,053 |
| Acid plant | 39,229,766 |
| Sulfur Unloading and Handling | 8,767,569 |
| Cooling Towers | 1,332,652 |
| Acid Storage | 4,608,170 |
| Ancillary Buildings | 673,757 |
| Laboratory | 1,040,964 |
| Offices | 450,448 |
| Security and First Aid | 210,561 |
| Explosives Storage ,etc. | 201,185 |
| Freight | 7,893,550 |
| Duties | 3,335,761 |
| TOTAL DIRECT FIELD COST | $204,717,988 |
| INDIRECT FIELD COSTS & OTHER CONSTRUCTED COSTS | |
| Contractor Mobilization Costs | 1,080,000 |
| Construction Power & Utilities | 250,000 |
| TOTAL CONSTRUCTED COST | $206,047,988 |
| EPCM COST | |
| EPCM & QC | 20,539,000 |
| Site CM Facilities | 268,126 |
| Vendors Commissioning | 144,000 |
| Commissioning & Capital Spare Parts | 777,677 |
| EPCM SUBTOTAL | $21,728,803 |
| TOTAL DIRECT FIELD + EPCM COST | $227,776,791 |
| OWNER'S COST | |
| Owners Cost | 5,360,000 |
| CONTINGENCY (15%) | 34,158,000 |
| TOTAL OWNER'S COST | $39,518,000 |
| CAPITALIZED PRE-STRIPPING COST | 12,608,990 |
| GRAND TOTAL INITIAL CAPITAL COST ESTMATE | $279,903,782 |
El Pilar Project Form 43-101F1 Technical Report | |
The capital and operating cost estimates for the El Pilar project Base Case have been completed along with mine scheduling. There are no known or anticipated environmental or permitting issues that would ultimately affect ML’s ability to construct and operate the project under the assumptions detailed in this report.
The work completed in this Technical Report indicates that the El Pilar project is economically viable for the production of copper from heap leaching. The reserves are sufficient for 13 years of production at an average leaching rate of 50,596 tpd. The project is projected to average 79.3 M lbs of copper production per year and to produce 998.3 M lbs of copper cathode over the LOM.
The Base Case financial model, which incorporates capital and operating estimates along with copper price assumptions, demonstrates that the project is economic with an after-tax net present value of $416.0 million at a discount rate of 8%. Capital pay-back of initial facilities capital is estimated in 1.8 years and the IRR of the project is 36.6%.
One other semi-quantified copper recovery financial case, based on projected 3 meter lift height 360 day leach data, recovers significantly more copper pounds and thus has an even better potential project economic outcome than does the Base Case. This semi-quantified copper recovery case results in 1,141.6 M lbs of copper being recovered over the LOM, averaging 64.9% LOM total copper recovery. This equates to 144.4 M lbs more copper being produced over 360 days of leaching than the Base Case. The result of this copper recovery case is an estimated NPV@8% of 565.6 M, an IRR of 43.3% and a capital payback period of 1.66 years.
A LOM Contractor Mining Case is also presented, based on a bid received from a Mexican mining contractor for LOM contract mining. This case is included to illustrate project impact in the event that financing for owner mining equipment may not be available. This Case results in an estimated NPV@8% of 370.8 M, an IRR of 39.6% and a capital payback period of 1.78 years.
Based on the financial analysis, it can be concluded that El Pilar is an economically robust project and that further development of the project is warranted.
El Pilar is an extensive property (7,169 hectares) consisting of seventeen (17) mining concessions as described in Section 4 of this report. The property extends approximately 8 km east-west and approximately 9 km north-south. The El Pilar mineral reserve is centrally located on the ML concessions. No other mineral concessions are known to exist in the immediate area of ML’s El Pilar property.
There are no known mineral deposits on lands immediately adjacent to the El Pilar property.
El Pilar Project Form 43-101F1 Technical Report | |
| 1.24 | Other Relevant Data and Information |
There is no other relevant data or information to this report that has not already been covered in the other sections.
| 1.25 | Interpretation and Conclusions |
The results of the Financial Model indicates that the El Pilar project is both economically feasible and robust under the assumed market conditions and following the assumptions and considerations noted in the body of the Study. As a result of robust project economics, El Pilar project should be developed and is construction ready, with first cathode scheduled to be produced after a 15 month construction period.
The main parameters, before taxes and after taxes, are as follows in Table 1-13.
Table 1-13: Main Parameters Before and After Taxes
| Parameter | After -Tax | Pre -Tax |
| Total Cash Operating Costs ($/lb Cu) | 1.34 | 1.34 |
| NPV@8% ($M) | 416.0 | 609.0 |
| EBITDA ($M) | 1,501 | 1,501 |
| IRR (%) | 36.6% | 52.9% |
| Capital Payback (Years) | 1.8 | 1.3 |
The following recommendations were included by M3 in the 2011 Study and are substantially repeated herein.
| | ● | It was recommended in the 2011 Study that ML should secure the surface land and water required for the project. Both of these have been done. |
| | ● | ML should implement an early assay and metallurgical data collection program, first directed to evaluate the performance of leaching of the first ore to be placed in the heap, during the preproduction period. This will serve as an early detection of possible problems, and afterwards should be directed to monitoring, reporting and control of Leaching and SXEW plant operation. This could require contracting an outside laboratory to process samples, while the permanent facilities are built. |
| | ● | M3 recommends installation of the acid plant and installation of a steam turbine generator. |
| | ● | ML should confirm a long term sulfur supply contract. |
| | ● | If possible, M3 recommends completing the construction of the acid plant and railroad siding before startup so that the acid facility could provide the initial fill of acid, thereby |
El Pilar Project Form 43-101F1 Technical Report | |
| | eliminating the need to purchase the startup reagents separately, reducing capital cost by approximately $11 million. |
| | ● | There are no recommendations for environmental concerns. |
Referenced documents are listed in Section 27 of this document.
El Pilar Project Form 43-101F1 Technical Report | |
Mercator Minerals Ltd. (ML) is the issuer of this study.
ML plans to develop the 100% wholly owned El Pilar oxide copper project, located in Sonora, Mexico, as a new open pit mining, heap leach project with a solvent extraction and electro-winning processing plant (SXEW). The El Pilar deposit contains 258.5 million tonnes (Mt) of ore with a copper content of 0.304%, containing a total of 1.7 billion pounds of copper, of which 998.3 million pounds are calculated as recoverable. The process plant will be designed to produce up 39,500 tonnes of copper cathode (~87 million pounds) per year. ML plans to begin engineering and construction immediately upon completion of project financing. The key environmental permits have already been received, the land surface rights have been acquired and the project is construction ready. In parallel with the preparation of this Feasibility Study, ML has been investigating project financing options and plans to complete project construction as soon as practical.
Due to the limited number of changes from the 2011 Study, this report is being authored in-house by ML. The information from the 2011 Study that has been referred to in this report is still reliable and current and there have been no material changes. This updated Feasibility Study will be the cornerstone for project financing, permitting, planning and construction of a copper mining operation at El Pilar.
All environmental permits required for project construction have been obtained, including the Environmental Impact Manifest, or Manifiesto de Impacto Ambiental (“MIA”), the Change of Land Use (CUS) and a Water Use Concession for 2.3 million cubic meters of water per year. Approval for an additional 1.2 million cubic meter of water per year is expected imminently. Other permitting documents are pending submittal to the required agencies for power line construction, power generation, access road construction and construction of the rail spur.
| 2.3 | Sources of Information |
ML completed the preparation of the geologic database and model, including the drilling database, data verification, quality assurance and quality control (QA/QC) and contracted key portions of the supporting data through their independent consultants; METCON Research, Inc. (“METCON”) for metallurgical test work and evaluation, Independent Mining Consultants, Inc. (“IMC”) for QA/QC, data and geologic model review, reserve and resource calculations, pit design, mine scheduling and mining tradeoffs, M3 Mexicana (“M3M”) for the Environmental Impact Study(s) and the environmental permitting. The Mines Group was used for heap leach design and geotechnical pit slope design, and Investgación y Desarollo de Acuiferos y Ambiente (“IDEAS”) for the hydrological research study and water permitting.
The following site visits were made by these groups and individuals:
El Pilar Project Form 43-101F1 Technical Report | |
| | ● | August 23, 2011 by Alberto Bennett |
| | ● | February 28, 2011 by Julian Bennett. |
| | ● | July 25, 2008 by Mike Hester. |
| | ● | August 16, 2011 by Michael Broch and numerous other times. |
| 2.5 | Units and Terms of Reference |
The units of production in this report are metric unless otherwise noted. All dollars are November 2011 US dollars along with other variables such as copper price, unless otherwise noted.
Some of the units used in this Study are listed in Table 2-1.
El Pilar Project Form 43-101F1 Technical Report | |
Table 2-1: Abbreviations
| Units | Abbreviations |
| Acid Soluble Copper | ASCu |
| Centimeter | cm |
| Cubic meters | m³ |
| Cubic meters per day | m³/d |
| Cubic meters per hour | m³/h |
| Current density | amp/m² |
| Density | t/m³ |
| Hectares | Ha |
| grams | g |
| grams/liter | gpl |
| Kilo (1000) | k |
| Kilogram | kg |
| Kilometer | km |
| Kilotonne | kt |
| Life of Mine | LOM |
| Liters | l |
| Liters per second | lps |
| Liters per hour | lph |
| Million (1,000,000) | M |
| Meters | m |
| Millimeters | mm |
| Minute | min |
| Parts per million | ppm |
| Percent | % |
| Recoverable Copper | RCu |
| Residual Copper | ResCu |
| Second | s |
| Specific gravity | S.G. |
| Square meter | m² |
| Temperature Celsius | °C |
| Temperature Fahrenheit | °F |
| Tonnage factor or specific volume | m³/t |
| Tonnes | t |
| Tonnes per day | tpd |
| Tonnes per year | tpy |
| Total Copper | TCu |
| Volts | V |
| Watts | W |
| Mega Watts | MW |
| Year | y |
El Pilar Project Form 43-101F1 Technical Report | |
| 3 | RELIANCE ON OTHER EXPERTS |
In cases where the ML Feasibility Study author, Michael J. Broch, FAusIMM, Qualified Person, has relied on the contributions of Other Experts listed in Appendix A, the conclusions and recommendations are exclusively the Qualified Persons’ own. The results and opinions outlined in this report that are dependent on information provided by Other Experts outside the employ of ML are assumed to be current, accurate and complete as of the date of this report.
Reports received from Other Experts have been reviewed for factual errors by ML. Any changes made as a result of these reviews did not involve any alteration to the conclusions made. Hence, the statements and opinions expressed in these documents are given in good faith and in the belief that such statements and opinions are true and accurate at the date of this report.
| 3.1 | Geology and Resource Definition |
Geological characterization of the El Pilar deposit was initially developed by Normex as described by Gary Woods, P. Geo, in an April 2007 NI 43-101 F1 Technical Report on the El Pilar property and filed at SEDAR (“WOODS TECHNICAL REPORT” or “WOODS”). This information was further developed in 2011 by Mr. John Dreier, P. Geo. and Qualified Person for the geology section of the 2011 Study. None of the geological or resource definition data presented in the 2011 Study has been changed in this report and as such, the geological or resource definition data from the 2011 Study is still reliable and current.
The resource and reserve sections of this report were developed by Mike Hester, FAusIMM, from IMC, Other Expert, under the supervision of the Author for the purposes of this report, and all of the work for the updated reserve by Mr. Hester included herein was overseen under the supervision of the Author.
| 3.3 | Metallurgy and Process Engineering |
The metallurgical testing program for the El Pilar deposit was developed under the direction of ML, in consultation with METCON and others. All of the work done prior to 2012 was reviewed by Thomas L. Drielick, P.E. of M3 and Mr. Dreilick is the Qualified Person responsible for the metallurgy, flow sheets, and process plant sections of the 2011 Study, all of which are included in this report. Except for an added section on new metallurgical results from mini columns, and a change of emphasis to the 3 m lift height copper recovery data, all other sections of this report for which Mr. Dreilick was responsible for in the 2011 Study have remained unchanged, and are still reliable and current.
| 3.4 | Environmental and Permitting |
The Environmental Impact Manifest (“MIA”) and Change of Land Use (“CUS”) were prepared for the 2011 Study by M3M. No information from that report has been changed in this study, except for updates on permitting progress, which includes the approval and receipt of both the MIA and CUS permits, and as such, the information from that report is still reliable and current.
El Pilar Project Form 43-101F1 Technical Report | |
The Mines Group provided geotechnical consulting for the pit slope determinations and the heap leach design portion of the 2011 Study. Ken Meyers, P.E. of the Mines Group, was responsible for the pit slope section and Anthony Crews was responsible for the Heap Leach design section of that study. None of the geotechnical information presented in the 2011 Study has been changed in this report and as such, the geotechnical information from that 2011 Study is still reliable and current.
Investigación y Desarrollo de Acuiferos y Ambiente (“IDEAS”) provided the hydrological study for the 2011 Study and is continuing to assist ML with obtaining the last necessary water permit. Dr. Miguel Rangel Medina is the official contact for IDEAS.
El Pilar Project Form 43-101F1 Technical Report | |
| 4 | PROPERTY DESCRIPTION AND LOCATION |
| | |
| 4.1 | Property Description |
This section is unchanged from the 2011 Study, and is still reliable and current. The El Pilar property comprises 7,170 hectares in eighteen mining concessions located in the state of Sonora, Mexico (Figure 4-1). The concessions are owned by Recursos Stingray de Cobre S.A de C.V. (formerly Normex), the wholly owned Mexican subsidiary of ML.
Figure 4-1: El Pilar Mining Concessions Map
| 4.2 | Mineral Tenure, Royalties and Agreements |
The status of the mining concessions is outlined in Table 4-1. Mining concessions in Mexico are granted by the Mexican Federal Government and have tenure of 50 years (renewable) subject to the payment of annual taxes. The El Pilar concession, the oldest of the mining concession that form the El Pilar property, was acquired by staking by Noranda (Normex) in 1999. Stingray
El Pilar Project Form 43-101F1 Technical Report | |
acquired the El Pilar property in April 2007 by purchasing Noranda Mexico (“Normex”) from Xstrata Plc. ML acquired Stingray and these concessions in 2009.
Table 4-1: Mining Concession Status
| MINING CONCESSION | TITLE | AREA (HAS) | FILING DATE | EXPIRY DATE |
| | | | | |
| EL PILAR | 210725 | 54.0 | 26-Nov-99 | 25-Nov-49 |
| | | | | |
| EL PILAR FRACCION I | 226352 | 420.4 | 13-Jan-06 | 9-Apr-51 |
| EL PILAR FRACCION II | 226353 | 450.0 | 13-Jan-06 | 9-Apr-51 |
| | | | | |
| PILAR 2 FRACCION I | 226357 | 455.6 | 13-Jan-06 | 27-Jul-50 |
| PILAR 2 FRACCION II | 226358 | 440.0 | 13-Jan-06 | 27-Jul-50 |
| PILAR 2 FRACCION III | 226359 | 480.0 | 13-Jan-06 | 27-Jul-50 |
| | | | | |
| PILAR 3 FRACCION I | 226360 | 476.0 | 13-Jan-06 | 24-Feb-55 |
| PILAR 3 FRACCION II | 226361 | 476.0 | 13-Jan-06 | 24-Feb-55 |
| PILAR 3 FRACCION III | 226362 | 408.0 | 13-Jan-06 | 24-Feb-55 |
| PILAR 3 FRACCION IV | 226363 | 476.1 | 13-Jan-06 | 24-Feb-55 |
| PILAR 3 FRACCION V | 226364 | 468.0 | 13-Jan-06 | 24-Feb-55 |
| PILAR 3 FRACCION VI | 226365 | 156.0 | 13-Jan-06 | 24-Feb-55 |
| | | | | |
| PILAR 4 FRACCION I | 226354 | 446.7 | 13-Jan-06 | 17-Aug-54 |
| PILAR 4 FRACCION II | 226355 | 480.0 | 13-Jan-06 | 17-Aug-54 |
| PILAR 4 FRACCION III | 226356 | 480.0 | 13-Jan-06 | 17-Aug-54 |
| | | | | |
| EL PILAR 5 | 221639 | 208.1 | 9-Mar-04 | 8-Mar-54 |
| | | | | |
| PILAR 6 | 232447 | 794.0 | 8-Aug-08 | 7-Aug-58 |
| PILAR 7 | 234984 | 1.0 | 23-Sep-09 | 22-Sep-59 |
| | | | | |
| TOTAL | | 7,169.9 | | |
The project area is located within Ejido Miguel Hidalgo. On December 22, 2000, Normex reached an agreement with the Ejido Miguel Hidalgo, giving Normex the right to carry out exploration activities for annual temporary occupation payments of US$10,000 (plus inflation factor).
El Pilar Project Form 43-101F1 Technical Report | |
In January 2010, the Ejido Miguel Hidalgo Assembly approved a purchase agreement with Stingray for 1,632 hectares for permanent ownership of the land. The Ejido initiated the change of status of the land from common use to private parcels, allowing the involved Ejido members to obtain property titles and sell/transfer the property at their convenience. The individual parcel titles were granted to the Ejido members in September 2011 by the National Agrarian Registry (RAN), the Mexican agency in charge of regulating Ejido land issues. The purchase agreement was executed in September 2011 with the individual land owners following a 30-day waiting period as stipulated by Agrarian Law regulations.
Due to the relocation of the heap leach pad facility closer to the pit to the north, additional land was needed to accommodate the new pad area. In March 2011, an agreement was signed with Ejido Miguel Hidalgo to purchase the surface rights of 294 additional hectares. The terms of this agreement were negotiated under two conditions, due to timing of the privatization process, as follows:
The first agreement is for temporary occupation and surface rights, which allows for development of the project under a long-term lease agreement. This agreement will be valid until the ejido members obtain titles to the parcels, which will then allow them to sell/transfer the land rights.
The second portion of the agreement is for purchase of the land, once the Ejido members obtain the titles. This will allow for full land ownership and control of the 294 hectares plus the 1,632 hectares negotiated under the separate agreement totaling 1,926 hectares.
On March 2011, the Ejido Assembly fully approved both agreements described above for the 294 hectares. The temporary occupation agreement already allows ML to commence work once the environmental, State and Local permits are obtained. The final purchase contract will be signed when the Agrarian Registry issues corresponding titles and ownership is transferred to ML. At that time, the lease agreement will be terminated. The time to complete the entire land purchase process is estimated to be 3 to 6 months.
In summary, a total of 1,926 hectares of surface rights have been successfully negotiated with the Ejido Miguel Hidalgo, which allows for all required land ownership rights needed for project development.
Under the terms of the Xstrata agreement to purchase the property, ML will pay a gross metal sales royalty of 1% to Xstrata. The royalty is to be paid after the first 85 million pounds of copper is produced. Xstrata has a right to buy back 50% of the property in the event that more than 3 billion pounds of copper ore are defined in a 43-101 technical report. ML will remain the Operator of the property.
On December 21, 2009, Mercator completed a business combination with Stingray Copper Inc. ("Former Stingray"), a company formerly listed on the Toronto Stock Exchange, by way of plan
El Pilar Project Form 43-101F1 Technical Report | |
of arrangement (the "Arrangement") under the Canada Business Corporations Act. Under the Arrangement, among other things, Former Stingray amalgamated with a subsidiary of Mercator (which subsidiary was formed for the purposes of the Arrangement) to form a corporation under the name "Stingray Copper Inc." ("Stingray") and each common share of former Stingray was exchanged for 0.25 of one common share of Mercator and options exercisable to purchase former Stingray common shares were exchanged for options exercisable to purchase Mercator common shares on the same exchange ratio. Upon completion of the Arrangement, Stingray became a wholly-owned subsidiary of Mercator.
The El Pilar Property is located in north central Sonora State of Mexico approximately 15 km south of the international border with United States of America (Figure 4-2). The property is situated within lands of Ejido Miguel Hidalgo (also referred to as San Lazaro), in Santa Cruz Municipality. The property is situated between UTM coordinates 3,446,000N to 3,455,000N and 526,800 E to 534,700 E.
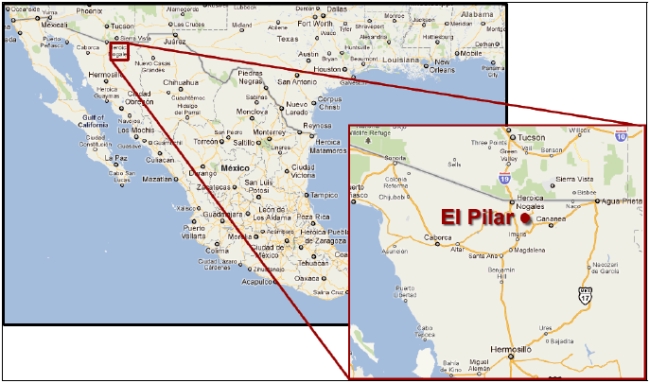
Figure 4-2: El Pilar Location Map
El Pilar Project Form 43-101F1 Technical Report | |
| 5 | ACCESSIBILITY, CLIMATE, LOCAL RESOURCES, INFRASTRUCTURE & PHYSIOGRAPHY |
| | |
| 5.1 | Accessibility |
The El Pilar property can be reached by road from Hermosillo, Sonora in Mexico and from Tucson, Arizona in the USA (Figure 4-2). From Hermosillo, the easiest access is via Hermosillo to Imuris (210 km) and Imuris to San Antonio (36 km), and from San Antonio to Miguel Hidalgo (San Lazaro) (35 km). The route from Hermosillo to Miguel Hidalgo takes about 3 1/2 hours of driving time. The route from Tucson to Miguel Hidalgo is currently a 2 hour drive and utilizes a newly paved road from Nogales, Sonora to Miguel Hidalgo (30 km).
The project area climate is classified as semi-dry, with the rainy season in summer and limited rains the rest of the year. The average annual temperature is 17.8°C, which would allow for year round operations. The project site occurs at elevations between 1250 and 1425 m above sea level (masl). The hottest months are June to September. Mean monthly temperatures vary between 11.2°C (January) and 23.4°C (July). Precipitation at the El Pilar site is bi-seasonal. Most of the rainfall occurs in the form of summer storms during the months of July, August and September with June and October marking the beginning and end of the rainy season. There is a secondary, minor rainy season in the winter, with precipitation occurring primarily in December and January. The spring months, from February to May, typically have no rainfall. Mean annual precipitation, according to the records of the Santa Cruz Railroad Station is 543.6 mm, with July as the wettest month with 138.5 mm and May as the driest month with 7.8 mm. The climate is amenable to year around mining and processing operations.
| 5.3 | Local Resources and Infrastructure |
The site is a green-field mining site with no existing infrastructure. Experienced mining personnel and related contractors are available in Cananea, located 45 km southeast of El Pilar, in Nogales, located 30 km northwest, as well as in several nearby villages. The nearby Mariquita and Milpillas mines have attracted much of their labor force from these nearby villages.
A power line is located three km to the south, in the village of Miguel Hidalgo (San Lazaro) where ML has an office and warehouse facilities. The project will require the construction of a power line from the operation to connect with the high voltage power lines accessible in Nogales, 29.5 km northwest of the property. Detailed engineering for the construction of this power line has been completed and submitted for approval by the Comisión Federal de Electricidad (CFE).
A railroad parallels the Santa Cruz River, and is located three km south of the deposit. Construction of a new railway spur approximately 4 km in length is planned for the delivery of molten sulfur or sulfuric acid. The railway is operated by Ferrocarril Mexicano S.A. de C.V.
El Pilar Project Form 43-101F1 Technical Report | |
El Pilar is situated in the Basin and Range physiographic province of North America, where topography is generally rugged at higher elevations and flat to gentle at lower elevations. The El Pilar deposit is located at the southwest margin of the Patagonia Mountains near the base of a mountain range. The topographic characteristics of deposit area are favorable and permit sufficient surface space for a mining operation with enough flat to gentle topography for building leaching pads, waste disposal areas, etc.
El Pilar Project Form 43-101F1 Technical Report | |
| 6 | HISTORY |
| | |
| 6.1 | History Prior to Stingray |
The history of exploration in the El Pilar area before 1992 is not well documented. It is known that in the 1970’s, Cyprus Amax Minerals had exploration claims in the area. According to verbal communications with local people and field evidence, it is clear that a geophysical survey and a few drill holes were completed in the northern part of the El Pilar discovery area. However, the results of both the drilling and the geophysical surveying are unknown.
Before Normex's direct involvement, there was no mineral resource known, only small old workings following narrow veins with erratic copper and molybdenum mineralization. Other small workings in the area were dug by local miners (gambusinos), searching for azurite and turquoise.
In 1992 Normex began acquiring ground at El Pilar. From 1992 to 1997, Normex carried out an exploration program that included regional mapping, sampling and limited geophysical surveying. From 1998 to 1999, Freeport Copper, under an agreement with Normex, carried out an exploration program that included regional mapping, rock and vegetation sampling, and some geophysical surveys. This exploration program concluded with a short drilling campaign consisting of a total of 1,561 meters drilled in eight (8) reverse circulation holes. This program encountered copper mineralization in three holes, with one intercept in bedrock and two in gravels. After the exploration agreement with Freeport ended in 2000, Normex continued with a short CSAMT survey and soil sampling exploration program. In addition, Normex carefully assessed the data generated by Freeport, emphasizing lab checks for validating the copper assays from the gravels. From September 2000 to March 2001, Normex completed a drill program of 10,336 m in 52 diamond drill holes spaced at 200 m centers.
Following Normex’s drilling campaign, resource calculations were undertaken in 2001, and again in 2003.
| 6.2 | 2001 Polygonal Resources by Normex |
Geological interpretation and modeling of El Pilar was done using 100 m spaced vertical sections in both E-W and N-S directions, as well as horizontal plans every 10 m including composite geology and topography.
A data base of 4,047 samples was captured in GEMCOM format, including 3,318 CuT assays and 1863 CuSol assays. The result of this calculation was an inferred mineral resource of 162,196,370 t @ 0.39% CuT at a 0.25% CuT cutoff grade.
| 6.3 | 2003 Block Model Resource Estimate by Magri |
Geological interpretation was based on 11 north-south sections looking north, 19 east-west sections looking west and level plans at 10 m intervals from level 1080 m to level 1390 m. Sections were spaced every 200 m with a few at 100 m intervals and contained lithology interpreted as polygons. Two sets of three dimensional solids were generated for lithology: solids obtained from the north-south and east-west sections using the 3D ring and tie-lines
El Pilar Project Form 43-101F1 Technical Report | |
technology, and solids obtained from the level plans by “extruding” each plan 5 m above and 5 m below the plan elevation. Once sections and level plan solids were validated on screen, their lithology was assigned to the corresponding drillhole intersections. Thus each drill hole ultimately contained three lithology fields: logged lithology, lithology obtained from the section solids and lithology obtained from the level plan solids. Comparative statistics for total and soluble copper were generated between the logged lithology and the lithology obtained from section and plan solids. Results show that solids generated from plans cover a larger area and are more reliable than solids generated from sections; therefore, they were used for the resource estimation. Any obvious erroneous lithological codes were found and corrected. Basic statistics were made for the different lithologies as part of the resource estimate. Densities varied from 2.17 for the overburden to 2.53 for host rock. The calculated average specific gravities for each lithology were used in the tonnage calculations.
The block model was estimated by ordinary kriging in three passes using appropriate search radii and parameters in each case. As a means of checking the model and declustering the composite data, a nearest neighbor estimation was done in a single pass. The result of the kriging at various cut-off grades is given in Table 6-1.
Table 6-1: Magri 2003 Kriging Results for Lithological Units
| LITHOLOGICAL UNITS: CGI CGI+V F IBX - KRIGING |
CUT-OFF | VOLUME | DENSITY | TONNAGE | TCu KRIG. | FINE TCu |
| 0.50 | 5,196,000 | 2.32 | 12,040,600 | 0.581 | 69,956 |
| 0.40 | 24,283,999 | 2.3 | 55,771,718 | 0.469 | 261,569 |
| 0.35 | 40,755,999 | 2.29 | 93,504,037 | 0.43 | 402,067 |
| 0.30 | 57,499,998 | 2.29 | 131,841,035 | 0.399 | 526,046 |
| | | | | | |
| | | | | | |
| | | | | | |
| 0.25 | 78,447,997 | 2.29 | 179,817,274 | 0.365 | 656,333 |
| 0.20 | 103,663,996 | 2.29 | 237,518,111 | 0.331 | 786,185 |
| 0.15 | 128,923,995 | 2.29 | 295,300,228 | 0.301 | 888,854 |
| 0.10 | 163,143,993 | 2.29 | 373,570,385 | 0.264 | 986,226 |
| 0.001 | 234,371,990 | 2.29 | 536,587,696 | 0.202 | 1,083,907 |
The results of this block model inferred mineral resource estimate completed by Magri in 2003 resulted in a tonnage calculation of 237,518,111 tonnes at 0.331% TCu (total copper) at a cutoff of 0.2% TCu.
| 6.4 | 2007 Inferred Mineral Resource by Woods |
In an April, 2007 43-101 F1 Technical Report on the El Pilar Property, Gary Woods, P. Geo, reviewed the earlier resource estimations and confirmed an estimate of 237,922,918 t at a grade of 0.331% TCu calculated at a 0.20% TCu cutoff (Table 6-2).
El Pilar Project Form 43-101F1 Technical Report | |
Table 6-2: Woods 2007 Inferred Resource
| 2007 INFERRED MINERAL RESOURCE |
Grade
Group | Volume | Density | Tonnage | TCu% | ASCu% |
| Units | m3 | t/m3 | 1,000 t | Grade | Grade |
| >0.50% CuT | 5,196 | 2.32 | 12,041 | 0.58 | 0.51 |
| >0.45% CuT | 11,304 | 2.3 | 26,041 | 0.52 | 0.46 |
| >0.40% CuT | 24,312 | 2.3 | 55,836 | 0.47 | 0.41 |
| >0.35% CuT | 40,792 | 2.29 | 93,587 | 0.43 | 0.38 |
| >0.30% CuT | 57,556 | 2.29 | 131,970 | 0.4 | 0.35 |
| >0.25% CuT | 78,548 | 2.29 | 180,047 | 0.37 | 0.32 |
| >0.20% CuT | 103,840 | 2.29 | 237,923 | 0.33 | 0.29 |
| >0.15% CuT | 129,324 | 2.29 | 296,220 | 0.3 | 0.27 |
| >0.10% CuT | 165,296 | 2.29 | 378,520 | 0.26 | 0.24 |
| >0.05% CuT | 219,244 | 2.29 | 502,032 | 0.22 | 0.2 |
| >0.00% CuT | 480,724 | 2.29 | 1,102,550 | 0.1 | 0.11 |
Preliminary metallurgical test work was carried out at Falconbridge’s Lomas Bayas mine in Chile in 2003 and 2004 and by METCON in 2001 and 2005. This preliminary work included bottle roll testing and column leach tests. A scoping level economic evaluation was prepared by AMEC E&C Services Inc. of Phoenix, Arizona in 2005-2006 for Normex. The study concluded that the El Pilar project demonstrated positive economics and was worthy of further assessment. Stingray acquired the property at that juncture.
| 6.5 | 2009 Stingray Mineral Reserve Feasibility Study |
In April 2009, a NI 43-101 compliant Feasibility Study was filed on behalf of Stingray by M3 Engineering. Included within the NI43-101 are mineral resource and a mineral reserve estimates done independently by Mike Hester of IMC in Tucson. The following summarizes the 2009 Hester resource and reserve estimates:
| | 6.5.1 | 2009 Hester Mineral Resources |
Table 6-3, Table 6-4 and Table 6-5 summarize the mineral resource for the El Pilar Project as calculated in 2009 by Mike Hester, FAusIMM of IMC, the Qualified Person responsible for the resource/reserve portion of the 2009 Technical Report. The resources are inclusive of the mineral reserve and are based on the original Stingray 10-meter (bench height) model, with 5-meter composites.
El Pilar Project Form 43-101F1 Technical Report | |
Table 6-3: Hester 2009 Mineral Resource - 0.15% Copper Cutoff
| 2009 El Pilar Mineral Resource – 0.15% Copper Cutoff |
| Resource Class | Ktonnes | Copper (%) | Copper (Mlbs) |
| Measured Mineral Resource | 103,819 | 0.311 | 712 |
| Indicated Mineral Resource | 241,088 | 0.273 | 1,451 |
| Measured/Indicated Resource | 344,907 | 0.284 | 2,163 |
| Inferred Mineral Resource | 72,848 | 0.240 | 385 |
Table 6-4: Hester 2009 Mineral Resource - 0.20% Copper Cutoff
| 2009 El Pilar Mineral Resource – 0.20% Copper Cutoff |
| Resource Class | Ktonnes | Copper (%) | Copper (Mlbs) |
| Measured Mineral Resource | 87,690 | 0.335 | 646 |
| Indicated Mineral Resource | 188,694 | 0.300 | 1,245 |
| Measured/Indicated Resource | 276,384 | 0.311 | 1,891 |
| Inferred Mineral Resource | 42,556 | 0.287 | 268 |
Table 6-5: Hester 2009 Mineral Resource - 0.25% Copper Cutoff
| 2009 El Pilar Mineral Resource – 0.25% Copper Cutoff |
| Resource Class | Ktonnes | Copper (%) | Copper (Mlbs) |
| Measured Mineral Resource | 68,777 | 0.366 | 553 |
| Indicated Mineral Resource | 129,787 | 0.335 | 956 |
| Measured/Indicated Resource | 198,564 | 0.346 | 1,510 |
| Inferred Mineral Resource | 22,806 | 0.341 | 171 |
| | 6.5.2 | 2009 Hester Mineral Reserves |
Table 6-6 summarizes the El Pilar mineral reserves as calculated by Mike Hester of IMC in the 2009 Stingray Feasibility Study. At a 0.15% TCu cutoff grade, the proven and probable mineral reserves determined by Hester total 229.7 Mt of ore containing 1.55 billion pounds of copper at an average TCu grade of 0.31%. Table 6-7 summarizes additional mineral resources which are exclusive of the mineral reserves. Measured and Indicated mineral resources add 115.2 Mt grading 0.24% TCu or 606 million pounds of contained copper. The Inferred mineral resource adds an additional 72.8 Mt at 0.240% TCu or 385 million pounds of contained copper.
El Pilar Project Form 43-101F1 Technical Report | |
Table 6-6: Hester 2009 Mineral Reserves at 0.15% Copper Cutoff
| 2009 El Pilar Mineral Reserve |
| | 0.15 % Total Copper Cutoff |
| Ore Ktonnes | Total Cu (%) | Copper (Mlbs) |
| Proven Mineral Reserve | 88,434 | 0.323 | 630 |
| Probable Mineral Reserve | 141,290 | 0.298 | 927 |
| Proven/Probable Mineral | 229,724 | 0.307 | 1,557 |
| Total Pit Material | 599,455 | Waste: Ore | 1.6 |
Table 6-7: Hester 2009 Mineral Resources (Exclusive of Reserve)
| 2009 El Pilar Mineral Reserve |
| | 0.15 % Total Copper Cutoff |
| Ktonnes | Total Cu (%) | Copper (Mlbs) |
| Measured Mineral Resource | 15,385 | 0.242 | 82 |
| Indicated Mineral Resource | 99,798 | 0.238 | 524 |
| Measured/Indicated Resource | 115,183 | 0.239 | 606 |
| Inferred Mineral Resource | 72,848 | 0.240 | 385 |
| | 6.5.3 | 2011 Hester Mineral Resources |
In April 2010, the previous block model developed by Stingray in 2008 was modified to composite the assay database to 10 m composites, the same as the bench height, instead of the 5 m composites used for the 2008 block model. No other changes to the database occurred. That new 2010 block model resulted in the El Pilar Mineral Resources reported in the 2011 Study and in this study.
The 2011 resource is unchanged in this report and is summarized in the Resources section of this report, and is still reliable and current.
| | 6.5.4 | 2011 Hester Mineral Reserves |
In the 2011 Study, a new Mineral Reserve was presented based on updated costs and copper recoveries and on a constant copper price of $2.75 per pound. Leach recovery was incorporated into the model on a block by block basis, using the 6 m lift height 180 day copper grade:recovery algorithm, as follows:
Cu Recovery = 86.93% + 36.79%ln (soluble copper/total copper), where ln is the natural logarithm.
Mike Hester, FAusIMM of IMC, was the Qualified Person responsible for the reserve portion of the 2011 Study. Table 6-8 summarizes the mineral reserve calculated by Hester in 2011.
El Pilar Project Form 43-101F1 Technical Report | |
Table 6-8: Hester 2011 Mineral Reserves
| 2011 El Pilar Mineral Reserve |
| Reserve Class | | Ore Ktonnes | Total Copper (%) | Soluble Copper (%) | Copper (Mlbs) |
| Proven Mineral Reserve | | 99,572 | 0.332 | 0.153 | 729 |
| Probable Mineral Reserve | | 130,583 | 0.299 | 0.131 | 861 |
| Proven/Probable Mineral Reserve | 230,155 | 0.313 | 0.140 | 1,590 |
| Total Pit Material | 678,686 | Ktonnes. | | Waste:Ore | 1.95 | |
El Pilar Project Form 43-101F1 Technical Report | |
| 7 | GEOLOGICAL SETTING & MINERALIZATION |
| | |
| 7.1 | Regional Geologic Setting - Patagonia Mountains |
This section is unchanged from the 2011 Study, and is still reliable and current. The El Pilar copper deposit is hosted within unconsolidated sedimentary units located along the southwest flank of the Patagonia Mountains, about 32 km southeast of the U.S.-Mexico border. The Patagonia Mountains are within the Basin and Range province of the western USA and Mexico. The mountains are similar to other nearby ranges in that they were formed in the late Miocene during an ongoing event of crustal extension. This extension resulted in northwest-trending uplifted blocks and intervening, sediment-covered down dropped blocks.
North of the border, extensive geologic work shows that the west side of the Patagonia Mountains is underlain by schist, gneiss and granitic rocks of mid Proterozoic age. The east side is underlain by folded Paleozoic sedimentary rocks, lower Mesozoic sedimentary and volcanic rocks, and Paleocene-Eocene volcanic rocks. All of the above rocks are intruded by the composite Patagonia batholith, which is made up of Jurassic and Early Tertiary granodiorite-monzonite and by dikes and other small bodies that range in composition from andesite to granite.
The Patagonia Mountains north of the US-Mexico border host two well-defined porphyry copper deposits, Red Mountain and Sunnyside (Corn, 1975 and Graybeal, 1996). These deposits are buried beneath ~ 2,000 meter thick lithocaps of intensively altered volcanic rocks of Eocene age. Radiometric dates for the deposits range from 50-55 mya. In addition to the porphyry copper deposits, the Patagonia Mountains also contain many mineralized breccia pipes, including the 3-R, Four Metals, Santo Nino and Line Boy, and, skarn-type base metals deposits, including those at Washington Camp located about 25 km north of El Pilar (Schrader and Hill, 1911; Simons, 1974).
| 7.2 | Regional Geology of the El Pilar Property |
The geology of the El Pilar property (Figure 7-1) has been previously described by Woods (2007) and Sauceda (2010) and this description of geology and mineralization is based on those sources and on a field visit to the property by J. E. Dreier in 2006.
Immediately to north and east of the El Pilar copper deposit, exposed bedrock consists of a coarse-grained biotite hornblende, granite-quartz monzonite intrusive body about 5 km in diameter. This intrusive is similar in composition and texture to mid Proterozoic granites along the west side of the Patagonia Mountains in Arizona about 20 km to the north of the El Pilar property (Drewes, 1972 and Simons, 1974). The granitic rocks at El Pilar, which are herein interpreted to be Precambrian in age, are mostly unmineralized and are variably intruded by a northwest-trending, coarse-grained diorite body about 1.5 km long and 150-200 m wide and by swarms of northwest-trending andesite dikes and northeast-trending felsic dikes. At the southern edge of its outcrop area, the Precambrian granite is intruded by an aplite. The area to the east and northeast of the granite is underlain by rhyolite and rhyodacite ash flow tuffs, which unconformably overly the granitic rocks and are juxtaposed against the granitic rocks by faults.
El Pilar Project Form 43-101F1 Technical Report | |
Based on radiometric dating of similar rocks just to the north of El Pilar, in Arizona, the volcanics are interpreted to be Triassic or Jurassic in age.
The region to the south and west of the above described bedrock area is comprised solely of alluvial deposits interpreted to be preserved within a down-dropped basin filled with unconsolidated sediments. In the area of the El Pilar copper deposit, these basin-fill deposits are interpreted to be of Quaternary age and are juxtaposed against the Precambrian granitic rocks by an east-west to northwest-trending, south dipping zone of faulting and hydrothermal brecciation. The faulting is of unknown displacement. The breccia zone comprises a multi-stage, highly silicified, copper mineralized hydrothermal breccia that is up to 100 m wide and 600 meters long. This breccia is interpreted to be the source of the El Pilar copper deposit.
Figure 7-1: Geologic map of the El Pilar project area
Immediately to the south of the east-west fault and the mineralized breccia zone, exposed materials are comprised of range-front Quaternary alluvial fan and alluvial wash deposits. These basin fill deposits are poorly sorted, poorly bedded, angular to sub-angular weakly cemented sediments with matrix supported clasts up to a maximum of 2 meters in diameter. The matrix consists of clay to sand-sized material that is generally similar in mineralogy to the clasts, but exhibits increasing clay content in the finer sieve sizes. The range front sediments are moderately dissected at the surface by modern drainage valleys up to 30-40 M deep. In the El Pilar copper deposit area, the alluvial deposits have been further subdivided as described in the following sections.
El Pilar Project Form 43-101F1 Technical Report | |
| 7.3 | Geology of the El Pilar Copper Deposit |
Based on the interpretation of cross sections, photos of drill core, the examination of core from eight drill holes (98-05, EP-06, 00-18, 00-23, 00-28, 00-32, 00-59, and 01-01) and mineralized outcrops, the El Pilar copper deposit occurs within unconsolidated, poorly sorted, poorly bedded, proximal facies alluvial wash deposits that are overlain by dissected younger alluvial fan deposits. According to criteria and discussions in Rust, B. R., 1979 and Davis, R. A., 1983, these proximal facies debris flow deposits were formed in a proximal range front alluvial setting.
The El Pilar copper deposit is comprised of mineralized sediments that form a continuous southwest trending body up to 200 m thick. This body extends for 2,300 meters S33W and averages about 750 m wide NW-SE. The mineralized horizon is hosted by unconsolidated to poorly consolidated alluvial wash deposits that are interpreted to have filled an older, range-front topographic depression located proximal to, and to the south of, the exposed hydrothermal breccia zone. The mineralized wash deposits are overlain by unconsolidated younger alluvial fan deposits that are generally similar in character to those in the mineralized horizon. The mineralized deposits overly and rest on more consolidated proximal facies alluvial wash deposits that are cemented by calcite. In general there appears to be a progressive change in the lithology of the fragments within the overall sedimentary sequence, such that rock fragments in the overlying unmineralized alluvial fan sediments are entirely granitic, those in the upper part of the mineralized wash deposits are mostly granitic with some felsic and andesitic volcanic fragments, those in the lower half of the mineralized horizon tend to be more than half volcanic and those in the underlying cemented unit are largely volcanic.
Based on the lithological differences described above, Noranda and Stingray subdivided the alluvial deposits into four units: 1) Qo (Quaternary overburden); 2) Mineralized Conglomerate - Cgi (with granitic intrusive fragments); 3) Transitional Conglomerate - Cgi+v (with granitic intrusive and volcanic fragments); and 4) Lower Conglomerate Cgv (with volcanic fragments). However, because the units described by Noranda are not truly conglomerates, as they are comprised of generally unsorted and angular materials rather than being rounded, the units have been re-designated from top to bottom as follows:
| | 1) | Qfy - Quaternary alluvial fan deposits, younger; |
| | 2) | Qwu - Quaternary alluvial wash deposits, upper; |
| | 3) | Qwt - Quaternary alluvial wash deposits, transitional, and; |
| | 4) | Qwl - Quaternary alluvial wash deposits, lower. |
More detailed descriptions of these units are as follows:
| | 7.3.1 | Qfy - Quaternary Alluvial Fan Deposits Younger (formerly overburden) |
The El Pilar copper deposit is overlain by up to 120 m of unmineralized proximal alluvial fan material deposited as debris flows (Figure 7-2). These alluvial fan sediments are made up of angular to subround, clast-supported fragments derived from nearby intrusive rocks set in an unconsolidated coarse sandy matrix. Qfy is thickest in the southern and eastern portions of the
El Pilar Project Form 43-101F1 Technical Report | |
El Pilar Deposit area and thins toward the north, particularly in the northernmost section of the proposed pit where it provides a thin (<10m) cover over the underlying intrusive rocks.
Figure 7-2: Typical Qfy Core Samples
| | 7.3.2 | Qwu - Quaternary Alluvial Wash Deposits Upper (formerly Mineralized Conglomerate) |
The upper part of the mineral deposit, designated as Qwu, crops out in the bottom of an arroyo near coordinates 3449100N, 532,100 (Figure 7-3 and Figure 7-4). Qwu is a poorly sorted, clast supported sediment with clasts of granodiorite porphyry, aplite, granite porphyry, mineralized silicic breccia, and minor felsic and unaltered andesitic volcanics in a matrix that ranges from 10 mesh to -200 mesh. Qwu is red to tan in outcrop and drill core, due to the presence of hematite and limonite in the matrix and as coatings on some rock fragments. Many fragments, including all breccia, several porphyry types, aplite, and felsic volcanic rocks, show evidence of hypogene mineralization including quartz and quartz + chalcopyrite veins, QSP alteration, and quartz veins with potassic alteration envelopes. Based on the presence of the porphyritic intrusive rocks and associated hypogene alteration and mineralization, it is concluded that mineralization in the Qwu is in part derived from the erosion of a porphyry copper deposit, but a majority of the copper mineralization is believed to be derived from the proximal exposed mineralized breccia zone.
El Pilar Project Form 43-101F1 Technical Report | |
Figure 7-3: Typical Qwu Core Samples - note large mineralized breccia fragments
As determined by petrographic and X-ray diffraction studies (XRD), the matrix of the Qwu consists of quartz, K-feldspar, plagioclase, chlorite, biotite, smectite, fine-grained hematite, limonite and clinoptilolite (Table 7-1). As shown in Table 7-2, Qwu is similar in whole rock chemistry to granite or quartz monzonite and the +10 mesh fraction consists mainly of quartz, K-feldspar and plagioclase, with lesser biotite, chlorite and hornblende. Calcium carbonate minerals are absent from the Qwu. Copper mineralization within the Qwu is present as abundant chrysocolla, with lesser conichalcite (CaCuAsO4OH) and ajoite (Na,K)Cu7AlSi9O24(OH)6·3(H2O) and very minor remnant chalcocite, chalcopyrite, and bornite, and possibly tetrahedrite. The copper mineralization is primarily in the form of chrysocolla, which occurs as coatings to and veins within clasts and as fine disseminations free within the sediment matrix; but copper also occurs together with illite as replacements of plagioclase phenocrysts in granite, quartz monzonite and granodiorite and structurally bound within smectite, biotite, and iron oxides. According to cross sections, in the mineral resource area Qwu ranges in thickness from a few meters up to 80 m.
El Pilar Project Form 43-101F1 Technical Report | |
Figure 7-4: Qwu out crop consisting of poorly sorted and angular wash material
Table 7-1: Mineralogy of Qwu by Sieve Size (%)
| Qwu Mineralogy by Sieve Size |
| Head Bulk Sample | -200 | 150X200 | 100X150 | 65X100 | 48X65 | 35X48 | 28X35 | 20X28 | 16X20 | 10X16 | 1/4X10m | 3/8X1/4 | 1/2X3/8 | 3/4X1/2 | Pulv. Head |
| Quartz | 28 | 29 | 33 | 33 | 30 | 25 | 32 | 34 | 32 | 33 | 34 | 34 | 34 | 28 | 36 |
| K-feldspar | 16 | 18 | 23 | 25 | 25 | 23 | 27 | 28 | 26 | 27 | 29 | 30 | 32 | 25 | 29 |
| Plagioclase | 16 | 17 | 18 | 20 | 18 | 17 | 18 | 18 | 17 | 18 | 19 | 20 | 17 | 30 | 18 |
| Musc. - Illite | 8 | 8 | 5 | 7 | 7 | 10 | 5 | 6 | 7 | 5 | 5 | 7 | 7 | 7 | 6 |
| Chlorite | 0 | 2.5 | 1.5 | 0 | 5 | 5 | 2.5 | 2.5 | 5 | 2.5 | 2.5 | 5 | 5 | 5 | 2.5 |
| Smectite | 13 | 11 | 5 | 2.5 | 2.5 | 2.5 | 2.5 | 2.5 | 5 | 2.5 | 0 | 0 | 0 | 0 | 0 |
| Kaolinite | 1.5 | 0 | 0 | 0 | 0 | 0 | 0 | 0 | 0 | 1.5 | 0 | 0 | 0 | 0 | 0 |
| Clinoptilite | 11 | 8 | 2.5 | 2.5 | 2.5 | 10 | 5 | 5 | 7 | 5 | 0.3 | 0 | 0 | 0 | 1.5 |
| Hematite | 1.5 | 1.5 | 1.5 | 1.5 | 1.5 | 1.5 | 1.5 | 1.5 | 1.5 | 1.5 | 1.5 | 1.5 | 1.5 | 0 | 1.5 |
| Unidentified | 2.5 | 2.5 | 2.5 | 2.5 | 2.5 | 2.5 | 2.5 | 2.5 | 2.5 | 2.5 | 2.5 | 2.5 | 2.5 | 2.5 | 2.5 |
In 2010, a 600 tonne bulk sample was collected at El Pilar for run-of-mine metallurgical crib and column testing. Details regarding this sample will be discussed in a later section, but the sample was collected from the only outcrop of the mineralized Qwu unit available in the project area. The results of dry screening and assaying of the sieve sizes done at METCON Laboratories in Tucson are shown in Table 7-2. About 88% of the sample is comprised of material that is +100 mesh and only 3.5% of the sample is material +100 mm in size (6 inches). In essence, this size distribution of material is considered to be “pre-crushed” with when considering the difference between run-of-mine leaching versus crushing. It is important to note that the bulk sample pre-crushed material size distribution was the result of digging and transportation with no blasting; e.g. these materials are so poorly cemented that they fell apart into segregated particles simply by being disturbed. Also, TCu contents increase significantly in the finer the screen fractions, whereas the Ratio of ASCu/TCu is similar, irrespective of screen size.
El Pilar Project Form 43-101F1 Technical Report | |
Table 7-2: Qwu Bulk Sample Size Analysis & Assays
| SCREEN | Sample: | Head Bulk Composite | Analytical Results |
| ANALYSIS | Size: | As Received at METCON Research |
| NOMINAL OPENINGS | Sample
Weights
(kg) | Weight
Distribution
(%) | Cumulative (%) | Copper Assays |
| mm | Inch | Tyler Mesh | Retained | Passing | TCu | ASCu | ResCu | Ratio |
| | 8 | | 0.00 | | | 100.00 | 0.177 | 0.141 | 0.036 | 0.797 |
| 152.4 | 6 | | 80.00 | 3.47 | 3.47 | 96.53 | 0.452 | 0.371 | 0.081 | 0.821 |
| 100.00 | 4 | | 93.00 | 4.03 | 7.50 | 92.50 | 0.297 | 0.211 | 0.086 | 0.710 |
| 75.00 | 3 | | 12.62 | 0.55 | 8.05 | 91.95 | 0.287 | 0.163 | 0.124 | 0.568 |
| 50.00 | 2 | | 61.90 | 2.69 | 10.74 | 89.26 | 0.363 | 0.238 | 0.125 | 0.656 |
| 31.50 | 1 1/4 | | 231.50 | 10.04 | 20.78 | 79.22 | 0.346 | 0.224 | 0.122 | 0.647 |
| 25.00 | 0.984 | 1 | 53.88 | 2.34 | 23.12 | 76.88 | 0.391 | 0.226 | 0.165 | 0.578 |
| 19.00 | 0.748 | 3/4 | 240.50 | 10.43 | 33.55 | 66.45 | 0.438 | 0.297 | 0.141 | 0.678 |
| 12.50 | 0.492 | 1/2 | 119.00 | 5.16 | 38.71 | 61.29 | 0.466 | 0.317 | 0.149 | 0.680 |
| 9.50 | 0.374 | 3/8 | 136.00 | 5.90 | 44.61 | 55.39 | 0.465 | 0.331 | 0.134 | 0.712 |
| 6.30 | 0.248 | 1/4 | 211.00 | 9.15 | 53.76 | 46.24 | 0.551 | 0.388 | 0.163 | 0.704 |
| 1.70 | 0.067 | 10 | 495.00 | 21.47 | 75.23 | 24.77 | 0.583 | 0.453 | 0.130 | 0.777 |
| 1.00 | 0.039 | 16 | 92.86 | 4.03 | 79.26 | 20.74 | 0.637 | 0.530 | 0.107 | 0.832 |
| 0.84 | 0.033 | 20 | 26.11 | 1.13 | 80.39 | 19.61 | 0.701 | 0.560 | 0.141 | 0.799 |
| 0.60 | 0.023 | 28 | 50.60 | 2.19 | 82.59 | 17.41 | 0.758 | 0.630 | 0.128 | 0.831 |
| 0.42 | 0.017 | 35 | 43.10 | 1.87 | 84.46 | 15.54 | 0.881 | 0.700 | 0.181 | 0.795 |
| 0.30 | 0.012 | 48 | 38.71 | 1.68 | 86.14 | 13.86 | 0.915 | 0.780 | 0.135 | 0.852 |
| 0.21 | 0.008 | 65 | 31.84 | 1.38 | 87.52 | 12.48 | 0.925 | 0.770 | 0.155 | 0.832 |
| 0.15 | 0.006 | 100 | 28.48 | 1.24 | 88.75 | 11.25 | 0.821 | 0.680 | 0.141 | 0.828 |
| 0.11 | 0.004 | 150 | 34.51 | 1.50 | 90.25 | 9.75 | 0.724 | 0.600 | 0.124 | 0.829 |
| 0.07 | 0.003 | 200 | 29.03 | 1.26 | 91.51 | 8.49 | 1.020 | 0.690 | 0.330 | 0.676 |
| M I N U S | -200 | 195.75 | 8.49 | 100.00 | | | | | |
| | TOTALS | 2,305.40 | 100.00 | | | | | | |
| CALCULATED ASSAY | 0.537 | 0.382 | 0.155 | 0.712 |
| | 7.3.3 | Qwt - Quaternary Alluvial Wash Deposits Transitional (formerly Transitional Conglomerate) |
According to previous work, the percentage of volcanic rock fragments gradually increases downward in the mineral deposit. As a result, Noranda and Stingray further subdivided the mineralized horizon into an upper and lower unit based on the percentage of volcanic fragments present in the material. On this basis, the lower mineralized unit was designated Cgi+v (granite + volcanic), but it was also referred to as “Transitional Conglomerate”. In this report the previous designation has been changed to Qwt or Quaternary alluvial wash deposits transitional (Figure 7-5). This material is similar in size distribution and poor cementation to Qwu and exhibits the same tendency to disaggregate into a “pre-crushed” size distribution when split in core.
The Qwt unit ranges in thickness from 10 to +150 m. It does not crop out in the El Pillar deposit area. Based on observed variations in the elevation of the Qwu/Qwt contact and photos of core alleged to represent Qwu or Qwt, it is likely that the criteria used to differentiate the two units
El Pilar Project Form 43-101F1 Technical Report | |
were not applied in a consistent manner during core logging. In core photos, and in the drill holes examined in 2006, Qwt appears to be dominated by debris flow deposits composed of angular fragments of intrusive and volcanic rocks in a matrix of sand and clay-sized particles very similar in form to Qwu. Qwt is red-brown in color due to the presence of hematite and limonite in the matrix and as coatings on some rock fragments. Similar to Qwu, Qwt is interpreted to consist of debris flows emplaced in the proximal portion of an alluvial outflow wash. XRD analysis of material believed to be from Qwt shows the principal minerals in the +10 mesh fraction as quartz, K-feldspar, plagioclase, mica/illite and smectite (Table 7-3). Whereas Qwu is similar in whole rock chemistry to granite, Qwt more closely resembles andesite.
Table 7-3: Mineralogy of Qwt by Sieve Size (%)
| Qwt Mineralogy by Sieve Size |
| Head Bulk Sample | -200 | 150X200 | 100X150 | 65X100 | 48X65 | 35X48 | 28X35 | 20X28 | 16X20 | 10X16 |
| Quartz | 17 | 22 | 26 | 24 | 26 | 27 | 26 | 29 | 29 | 29 |
| K-feldspar | 15 | 12 | 13 | 18 | 18 | 18 | 20 | 23 | 21 | 20 |
| Plagioclase | 8 | 10 | 11 | 11 | 12 | 13 | 14 | 15 | 16 | 14 |
| Musc. - Illite | 6 | 12 | 9 | 9 | 10 | 11 | 9 | 9 | 14 | 11 |
| Chlorite | 0 | 0 | 0 | 0 | 0 | 0 | 0 | 0 | 0 | 0 |
| Smectite | 28 | 20 | 22 | 23 | 20 | 17 | 16 | 12 | 10 | 13 |
| Kaolinite | 0 | 2.5 | 0 | 1.5 | 1.5 | 1.5 | 2.5 | 1.5 | 0 | 2.5 |
| Clinoptilite | 18 | 12 | 10 | 2.5 | 2.5 | 6 | 2.5 | 2.5 | 2.5 | 2.5 |
| Hematite | 1.5 | 3 | 3 | 3 | 1.5 | 1.5 | 1.5 | 1.5 | 1.5 | 1.5 |
| Unidentified | 2.5 | 2.5 | 2.5 | 2.5 | 2.5 | 2.5 | 2.5 | 2.5 | 2.5 | 2.5 |
Similar to the Qwu unit, Qwt also contains copper mineralization that is primarily associated with the oxide minerals chrysocolla, conichalcite and ajoite. Very minor remnant chalcocite, chalcopyrite, bornite, and possibly tetrahedrite also exist. The copper mineralization primarily occurs as coatings to and veins within clasts and as fine disseminations free within the sediment matrix. But copper is also structurally bound within smectite, biotite, and iron oxides. Again, similar to the Qwu unit, the copper mineralization within the Qwt is primarily related to erosion of the exposed mineralized breccia zone.
El Pilar Project Form 43-101F1 Technical Report | |
Figure 7-5: Qwt, note red-brown color and angular fragments of volcanic rocks
| | 7.3.4 | Qwl - Quaternary Alluvial Wash Deposits Lower (formerly Lower Conglomerate) |
Underlying Qwt and the El Pilar copper deposit are unmineralized sediments designated herein as Qwl (Figure 7-6). Although these deposits are similar in overall appearance and origin to Qwu and Qwt, Qwl is a semi-lithified, calcite-cemented rock. The fragments in Qwl are dominantly felsic and andesitic volcanics. Qwl ranges in thickness from 10 to + 100 m and the drill holes that penetrate Qwl terminated within it and did not extend through it.
El Pilar Project Form 43-101F1 Technical Report | |
Figure 7-6: Qwl - Calcite cemented debris flow deposit with volcanic fragments
The east-west to northeast-trending zone that marks the boundary between Precambrian intrusive rocks to the north and the Quaternary alluvial deposits to the south is characterized by a highly eroded and weathered remnant of a mineralized silicic breccia. The breccia(s) consists of highly silicified igneous rock fragments in a multigenerational matrix of repeated hydrothermal brecciation and silicification. The breccia is similar to other breccias that occur in breccia pipes around the world related to porphyry copper deposits, such as the nearby Cananea deposit. However, because the breccia is highly elongate east-west, along a true structural zone rather than a pipe, the area of brecciation is more properly referred to as a breccia zone, rather than a breccia pipe.
The breccia is mineralized throughout its extent with oxide copper and remnant iron oxide minerals. Approximately 11 M tonnes of material scheduled to be mined as part of the El Pilar copper deposit is comprised of the breccia. This material resides along the north wall of the planned pit. Figure 7-7 shows typical mineralized breccia in outcrop.
El Pilar Project Form 43-101F1 Technical Report | |

Figure 7-7: Mineralized silicic breccia in outcrop
| | 7.3.6 | Precambrian Intrusive (I) |
A granitic intrusive interpreted to be Precambrian in age bounds the mineralized breccia zone along the northern side of the El Pilar copper deposit. Within the proposed El Pilar pit, the intrusive will be encountered only in the north wall of the initial starter pit. The intrusive is for the most part unmineralized (Figure 7-8).
El Pilar Project Form 43-101F1 Technical Report | |
Figure 7-8: Precambrian granite
| | 7.4.1 | Description of the El Pilar Copper Deposit |
The El Pilar copper deposit is about 2,300 meters long N33E, 600 to 1,000 meters wide, NW-SE averages 110 m thick (range 5 to 220 meters) and plunges 28o to the southeast (Figure 7-9). Approximately 98% of the copper mineralization at El Pilar is hosted by Quaternary debris flow wash deposits proximal to bedrock and the remainder is within the E-W-trending mineralized breccia – the distribution of which generally corresponds to the +50 mx%TCu zone (see Figure 7-10).
Prior to erosion, the breccia is interpreted to have been much larger than its present extent, and it appears that proximal erosion of this mineralized but now oxidized breccia into the nearby range front depression during weathering was the primary source of the El Pilar copper deposit. Although this erosional/depositional event was largely dilutive of copper mineralization, because a majority of the larger clasts in the sedimentary material are comprised of unmineralized older intrusive and possibly younger volcanic rocks, total copper (TCu) grades are very consistent throughout the sedimentary sequence.
As shown in Figure 7-10, the El Pilar copper deposit has a well-defined metal zoning such that the highest metal values (TCu x thickness) are within the breccia and along the core of the deposit with metal values gradually diminishing away from the core.
El Pilar Project Form 43-101F1 Technical Report | |
Figure 7-9: Structural contour map of the top of the El Pilar copper deposit in meters above mean sea level
Figure 7-10: Map of %TCu x thickness (meters) of the El Pilar copper deposit
The SE plunge of the deposit is illustrated in Figure 7-11, which is an N-S long section drawn at an oblique angle to the true S250W plunge direction of the deposit. In this long section, the
El Pilar Project Form 43-101F1 Technical Report | |
model blocks are color coded by total copper grade (%TCu), whereas the drill holes are color coded by the sedimentary unit designations described previously.
Figure 7-11: Typical N-S long section showing total copper grade (TCu) and relationship to interpreted sedimentary units
As shown in Figure 7-12, which is an E-W section also drawn obliquely to the true dip of the deposit and color coded similarly to Figure 7-11, a majority of the copper mineralization occurs within the main SW trending zone but a smaller, secondary E-W copper zone is also present. The E-W channel is locally covered by 100 m of overburden. Geologic work indicates that the main part of sediment-hosted copper deposit dips about 20o to the southeast into what is interpreted to be the hanging wall of a northeast trending, northwest-dipping normal fault that parallels the southeast margin of the main deposit. This main mineralized channel remains open to the south.
Figure 7-12: Typical E-W cross section showing total copper grade (TCu) and relationship to interpreted sedimentary units
In Section 9100N, located 100 m south of the monzonite outcrop, the best mineralized intercept contained 123.9 m of 0.47% TCu. In Section 8000N, located 1.3 km to the southwest two adjacent drill holes contained intercepts of 67.9 m and 91.8 meters grading 0.38% and 0.36%
El Pilar Project Form 43-101F1 Technical Report | |
TCu respectively. Five hundred (500) m further to the southwest, in Section 7600N, two adjacent drill holes contained 74.25 m of 0.36% total copper and 73.8 m of 0.33% total copper (for section locations see Figure 7-13).
Figure 7-13: El Pilar Drill Hole Location Map
| | 7.4.2 | Consistency of Copper Mineralization & Copper Solubility |
Total copper grades (TCu) are very consistent throughout the core of the mineralized alluvial body at El Pilar. This is illustrated in both of the N-S and E-W sections shown previously in Figure 7-11 and Figure 7-12. In these sections, blocks above 0.30% TCu are coded in red. As is evident in the sections, once the 0.30% TCu envelope is encountered in drilling, essentially all of the material within that envelope grades above 0.30% TCu and the grades consistently fall within a narrow range of ~0.30-0.50% TCu. All other longitudinal sections and cross sections drawn throughout the deposit show the same consistency of grades within the main alluvial channel.
As a precursor to a discussion of other copper assay grades variations at El Pilar, it is first important to understand some relative copper grade terminology used in this report. Very importantly, whereas some of the copper at El Pilar is tied up in minerals that are soluble under laboratory acid soluble assay tests, some of the copper at El Pilar is not easily soluble under the
El Pilar Project Form 43-101F1 Technical Report | |
same acid laboratory procedures. Copper that is assay soluble is referred to in this report as acid soluble copper (ASCu). The less assay soluble copper is referred to herein as residual copper (ResCu). The combination of both ASCU and ResCu is referred to as total copper (TCu). The other important copper grade designation at El Pilar is the ratio of acid soluble copper to total copper, or the ASCu Ratio. This ratio is referred to as the Ratio or %ASCu. The formula for calculating the Ratio is (%)ASCu divided by (%)TCu, or ASCu Ratio = ASCu÷TCu.
Approximately 60% of the drillhole database core samples were assayed by ALS Chemex using a 3-acid digestion procedure and ~40% of the samples were assayed by METCON using a 4-acid digestion. As discussed later in the metallurgical section, this resulted in some differences in acid soluble and residual copper assay results.
At El Pilar the relative amounts of ASCu and ResCu, and as a consequence the acid soluble ratio, vary noticeably from the surface of the deposit downwards. As can be seen in Figure 7-14, bench average ASCu grades decrease with depth, whereas ResCu bench average grades increase. Due to the additive effects of changes in both the ASCu and ResCu grades, the Ratio or percentage of acid soluble copper declines from an average of about 64% ASCu near the top of the deposit to 26% ASCu at the bottom. These grade changes by bench translate to a similar drop in the percentage of acid soluble copper encountered over the mine life, as progressively deeper benches are mined.
TCu is very grade consistent throughout the El Pilar deposit and average bench TCu grades do not change significantly with depth. This is because as ASCu grades decline downward ResCu grades increase by about the same amount.
Figure 7-14: Variations in copper grades by bench at El Pilar
The above described changes in the acid soluble component of the copper mineralization with depth do not appear to be directly related to the known alluvial stratigraphy. Except for at the surface above bench elevation 1285 m, where the tonnages of Qwt are so low as to be
El Pilar Project Form 43-101F1 Technical Report | |
statistically meaningless, copper grades in the two mapped units are essentially identical (see Figures 7-15 to 7-18).
| Figure 7-17: ResCu grades |
| | |
Figure 7-16: ASCu grades | Figure 7-18: Ratio grades |
At least in the upper portions of the El Pilar deposit, copper mineralization is comprised principally of the visible blue copper oxide mineral chrysocolla. Chrysocolla occurs as thin to thick coatings up to 1.0 cm thick on larger rock fragments. It also occurs in small microcrystalline patches between rock-forming minerals and as free chrysocolla grains in the finer size fractions. Chrysocolla is also intimately intergrown with chalcedonic quartz.
Mineralogical observations were carried out as part of an ore characterization - predictive metallurgy study on polished thin sections from fifty-eight (58) samples, using ore microscopy, Scanning Electron Microscopy, SEMEDS beam analyses and Microprobe analyses by DiPrisco in 2001. The results of this detailed study indicated that the samples were characterized by a strong natural permeability/fracturing and strong oxidation. Iron/silica oxy-hydroxides were determined to be pervasive and fairly abundant. Other copper-bearing minerals observed include sulfides (chalcopyrite, bornite, covellite-rare), arsenide (domeykite - rare), carbonates (azurite, malachite) and oxides (cuprite/tennorite). Bornite and chalcopyrite were present exclusively as very fine-grained (<15 micron) relict inclusions in quartz.
El Pilar Project Form 43-101F1 Technical Report | |
Additional mineralogical work done at the Mineral Lab and at Hazen Research in Denver by Dreier in 2011 focused on identifying how ResCu occurs. This study found that the principal copper minerals in the samples evaluated are chrysocolla, conichalcite (CaCu)(AsO4)(OH) and ajoite - (Na,K)Cu7AlSi9O24(OH)6·3(H2O)}. Very minor copper also occurs in the sulfide minerals chalcopyrite, bornite, and chalcocite.
Dreier found that much of the ResCu within the El Pilar deposit is located in clay, biotite, and clinoptilolite (a zeolite) in the fine (<100 mesh) fractions. Microprobe work shows that the Cu content of smectite and biotite ranges from ~1% to 4% and averages about 2%. Some ResCu also undoubtedly occurs as otherwise soluble mineral grains such as chrysocolla completely encapsulated by silica in the larger breccia fragments. The amount of copper that is tied up by encapsulation is not possible to determine but is thought to be a small percentage overall.
Dreier’s 2011 work focused on material collected at the surface for a 600 tonne bulk sample and from core composites for additional bulk crib and column metallurgical testing. These samples will be discussed further in the section on metallurgical testing. Dreier found that the surface bulk head sample material, which is comprised exclusively of Qwu, contains up to a maximum 13% smectite in the finest -200 mesh screen fraction (Figure 7-19). Calculations show that, of the total copper 0.537% TCu content of the head sample, about 0.13% copper is hosted by montmorillonite (Smectite Group clay) and biotite.
Figure 7-19: Bulk sample whole rock mineralogy by screen size fraction
Conversely, Drier generally found that in samples collected for column testing from deeper in the deposit, such as Column 11 (Figure 7-20), there is higher amount of smectite (montmorillonite) and clinoptilolite relative to the surface bulk sample. It is believed that this higher overall clay and zeolite content in the deeper portions of the deposit translates to more copper tied up in the residual fraction (higher ResCu) and less copper in the acid soluble fraction (lower ASCu) at depth. Microprobe data from the crib head sample -200 mesh sieve size fraction
El Pilar Project Form 43-101F1 Technical Report | |
clearly shows that smectite/montmorillonite is copper bearing, averaging 2.24% copper (Table 7-4).
Figure 7-20: Column 13 sample whole rock mineralogy by screen size fraction
Table 7-4: Microprobe data from Crib Head sample showing copper in smectite
| Crib Head Sample Microprobe Data |
| Sample | Mineral Shape | Mineral | Cu(%) |
| Head -200 | FeOx, Clay | Hematite + Smectite | 1.71 |
| Head -200 | FeOx, Clay | Hematite + Smectite | 1.96 |
| Head -200 | FeOx, Clay | Hematite + Smectite | 2.41 |
| Head -200 | Formless | Smectite | 2.58 |
| Head -200 | Formless | Smectite | 1.75 |
| Head -200 | Tabular | Smectite | 0.80 |
| Head -200 | Tabular | Smectite | 2.00 |
| Head -200 | Formless | Smectite | 3.78 |
| Head -200 | grain | Fe-Ox? | 3.54 |
| Head -200 | grain | Fe-Ox? | 3.36 |
| Head -200 | Tabular | Muscovite | 0.00 |
| Head -200 | Tabular | Muscovite | 0.00 |
| Head -200 | Formless | Smectite | 4.13 |
| Head -200 | Formless | Smectite | 1.91 |
| Head -200 | Formless | Smectite | 0.15 |
| Head -200 | Formless | Smectite | 1.03 |
| Head -200 | Formless | Smectite | 2.00 |
| Head -200 | Formless | Smectite | 4.5 |
El Pilar Project Form 43-101F1 Technical Report | |
The higher amounts of copper bearing clay minerals deeper in the deposit, as shown above, are interpreted to be the main reason why ResCu increases not only with depth in the deposit but distally with distance from the probable source of the El Pilar copper mineralization – the mineralized breccia. Because the percentage increase in ResCu grade is essentially the same in both the mineralized Qwu and Qwt units, it is interpreted that the increase in clay minerals is a function of depositional mechanics, with the more distal portion of the channel having been deposited under conditions of lower energy which resulted in a higher clay content with distance from the breccia. It is not as clear why the amount of ASCu decreases in almost a direct straight line relationship to increasing ResCu grade. It may be that under increasingly more distal conditions, the amount of coarse fragments that are chrysocolla bearing decrease at the same rate than the content of fines/clays increases. What is suspected to be residual copper (ResCu) is also partially tied up in iron oxide minerals (see Figure 7-21). Iron oxide amounts do not appear to vary considerably from the top of the deposit to the bottom.
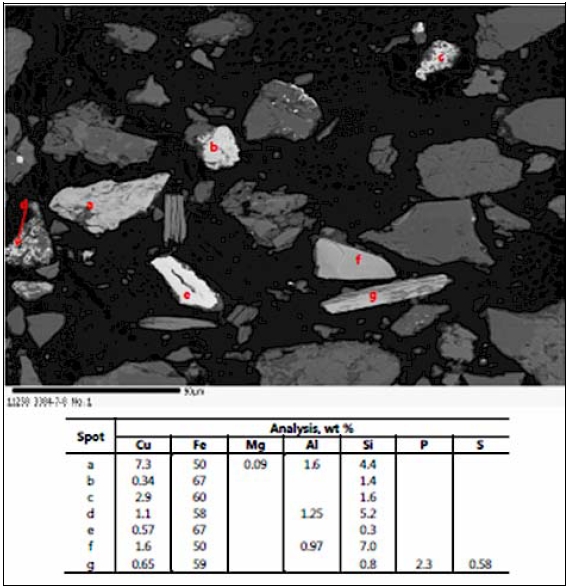
Figure 7-21: Backscatter electron (Bsc) image of Sample 3448-7-8 showing discrete
particles of copper-bearing iron oxides (spots a-g)
El Pilar Project Form 43-101F1 Technical Report | |
| | 7.4.4 | Analysis of Fines Content |
The El Pilar copper deposit comprises relatively high depositional energy gravel deposits. As such the content of sandy to fine material passing a 10 mesh screen is relatively low, averaging about 19 percent of the metallurgical samples collected. Of that coarser fraction, the content of fines, as defined herein as material passing a 100 mesh screen, is very low, constituting only 11.25% of the bulk, which is the best sample collected in terms of overall sample recovery. Based also on good percolation and the general lack of decrepitation found when comparing column leach heads versus tail size fraction results, fines in the deposit do not appear to represent a concern regarding impact on geotechnical heap leach pad stability or raffinate percolation.
El Pilar Project Form 43-101F1 Technical Report | |
This section is unchanged from the 2011 Study, and is still reliable and current. El Pilar lies within the Sonora-Arizona Porphyry Copper province; about 45 km northwest of the Cananea copper mine of Grupo Mexico deposit. Cananea is the largest porphyry copper deposit in Mexico and one of the largest in the world (Figure 8-1). Both El Pilar and Cananea are situated in a highly prospective belt of copper deposits that range from La Caridad in the south through to central Arizona. The main types of economic copper deposits in this belt are related to porphyry copper systems and mineralization typically occurs in hydrothermal breccias pipes and as disseminations and stockworks. Deposits like Cananea also exhibit significant replacement mineralization at contacts with limestone, as well as vein type deposits and high grade pegmatite zones. This belt hosts numerous very large, or what are considered to be “world class”, copper deposits. These large deposits range from the Cananea copper mine (7.1 billion tonnes @ 0.42% copper) in the south to the Morenci copper mine of Phelps Dodge Corp. in the north (4.7 billion tonnes @ 0.52% copper). The Sonora-Arizona porphyry copper trend accounts for the second largest concentration of porphyry copper deposits in the world. Mining for copper in this trend has been continuous for over 100 years.
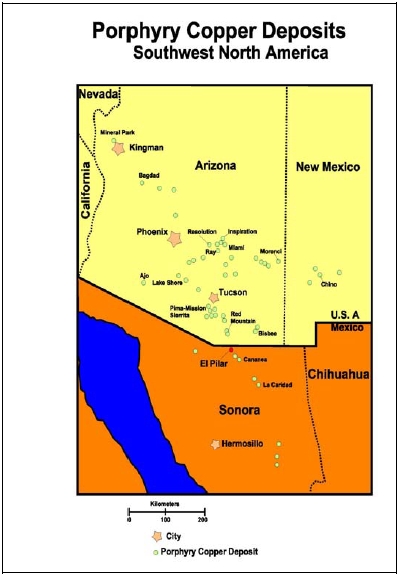
Figure 8-1: Porphyry Copper Deposits of Southwest North America
El Pilar Project Form 43-101F1 Technical Report | |
The El Pilar property hosts an unusual transported copper resource that is atypical for the area. Copper at El Pilar is hosted by range front alluvial wash deposits with clasts of intrusive, porphyry and highly silicified rock derived from a proximal, exposed hydrothermal breccia zone. The mineralization is interpreted to have been derived at least in part from that breccia and possibly also in part from a pre-existing porphyry copper deposit that is yet to be identified on the property. Reconstruction of events suggests that the breccia was mechanically weathered and eroded, transported and deposited in a channel and alluvial fan sequence that overlies a lower more indurated alluvial wash unit (Qwl).
El Pilar Project Form 43-101F1 Technical Report | |
This section is unchanged from the 2011 Study, and is still reliable and current. From 1998 to 1999, Freeport, under agreement with Normex, carried out an exploration program that included regional mapping, rock and vegetation sampling, and geophysical (CSAMT) surveying. This exploration program concluded with a short reverse circulation drilling campaign consisting of a total of 1,560 m drilled in eight (8) drill holes. This program encountered mineralization in three holes, with one in bedrock and two in conglomerate.
In 1999 a semi-reconnaissance mesquite survey was conducted at El Pilar by Freeport's staff. Approximately 117 samples were collected and analyzed by Actlabs-Skyline via hashing/ICP-MS. The sample density for this survey was three to four mesquite samples per square km. The results of this survey clearly outlined the structurally controlled El Pilar bedrock mineralization, the oxide mineralization in the deposit area, and indicated the possibility of blind mineralization in alluvium covered areas.
Detailed and reconnaissance mesquite surveys were conducted in 2001 over the El Pilar oxide mineralization and along the western and eastern alluvial covered pediments of the Sierra San Antonio. A total of 340 mesquite samples were collected on a 100 m X 100 m grid over and around the El Pilar discovery area. Two hundred and eighteen (218) mesquite samples were collected for the reconnaissance survey utilizing a density of approximately two samples per square km. In the detailed mesquite survey anomalous molybdenum characterized the outcropping mineralization to the northeast. Copper in mesquite clearly outlines the drill indicated oxide mineralization in the northeast portion of the sampling grid. Concentrations range from 90 ppm to 193 ppm in a background of 60 ppm. Anomalous copper extends to the west following an east-west ridge, which may reflect a major structure. This west trending anomaly is open to the north and west. Weaker copper anomalies, which trend to the southwest and west, create a horseshoe pattern around the sub cropping alluvial sedimentary sequence (Figure 9-1).
El Pilar Project Form 43-101F1 Technical Report | |
Figure 9-1: Regional Mesquite Sample
In general the results of the reconnaissance survey indicated the following:
| | 1. | Moderate to strongly anomalous molybdenum and copper concentrations in mesquite twigs characterized the concealed El Pilar oxide resource. |
| | 2. | A strongly anomalous west trending molybdenum anomaly, Los Paredes, occurs west of the El Pilar discovery area. |
| | 3. | Weak to moderately anomalous molybdenum and copper values reflect outcropping mineralization in the area of the old El Pilar shaft as well as along the bedrock alluvium contact in the area. |
| | 4. | A moderate molybdenum and weak copper anomaly were outlined northwest of the El Pilar shaft in an area of past drilling by Cyprus. Another weak copper anomaly is located west of this anomaly in pediment south of La Bomba Arroyo. |
| | 5. | An extensive moderate to strong molybdenum anomaly was outlined in alluvium in the Los Picos zone. Molybdenum concentrations ranged from 19 to 52 ppm. This anomaly appears to originate at a topographically projected northwest trending range front structure. Additionally, weak copper in mesquite was outlined along the bedrock-alluvial contact to the northeast. |
| | 6. | Two weak to moderate copper and molybdenum anomalies were outlined along the north end of the reconnaissance survey at the Normex claim boundary (Arroyo El Tubo). |
| | 7. | Strongly anomalous copper and molybdenum characterize the outcropping mineralization in the shear zone of El Pilar de Arriba area. Molybdenum values ranged up to 228 ppm and copper ranged from 100 to 186 ppm. |
The mesquite survey anomalies at Los Paredes, La Bomba and Los Picos were drill tested in 2004 with negative results by Normex.
El Pilar Project Form 43-101F1 Technical Report | |
From September to November 2001, six lines totaling 21.6 km were selected for surveying, employing the Titan 24 MT-DCIP Time Series Distributed Array System (TSDAS). The survey configuration utilized twenty-four 100 m spaced in-line dipoles along with twelve 100 m spaced cross line dipoles (see Figure 9-2). Cross-line (perpendicular to the line) 100 m spaced dipoles were placed every 200 m, or every second station. The QARA (centre-pole) array was used to collect the DCIP data with 100 m current injection points located at the midpoint of each in-line receiver dipole. Current injections were also placed off the ends of the array on lines that required more than a single spread (Line 1NE in this case) to provide some overlap information. Data acquisition and results obtained by Quantec were very high quality and the survey objectives were met. Interesting targets requiring follow-up were identified on Lines 1NE and L51400N. The target on line 1NE was field checked and found to be hosted by weakly altered volcanics. On line 51400N, interpretation of the MT and DCIP resistivity surveys over the center of the large biogeochemistry anomaly suggested that the depth of cover was beyond the limits of an economically viable conventional porphyry deposit. However, it did not rule out near surface mineralized conglomerates as the source of the biogeochemical anomalies situated over areas of deep overburden.
El Pilar Project Form 43-101F1 Technical Report | |
Figure 9-2: Titan 24 MT-DCIP Line Locations
A dipole - dipole IP survey with 200 m A-spacing was conducted in 2003 over the bedrock area north of the conglomerate resource on 300 m spaced lines (Figure 9-2). The survey was conducted by Pacific Geophysics of Vancouver, Canada using a six channel time domain IP/resistivity receiver. A significant TSDAS anomaly had been detected over the bedrock area from the TSDAS survey. This anomaly occurred in the vicinity of an intensely altered hydrothermal breccia that is heavily oxidized and contains iron oxide veinlets and fracture coatings with ‘live limonite’, indicating the presence of copper prior to the weathering. The IP
El Pilar Project Form 43-101F1 Technical Report | |
survey indicated a reasonably strong chargeability source (35 mv) at a roughly 250 m depth southeast of the hydrothermal breccia. This feature was drilled during the 2004 drill campaign, and a pyritic fault zone was encountered with trace amounts of copper in otherwise weakly altered intrusive.
In 2003, a helicopter borne Magnetic Survey was flown over the El Pilar property by McPhar Geosurveys Ltd. of Canada (Figure 9-3). The survey was flown perpendicular to the regional trend of the ranges with the towed magnetic sensor at an elevation of 30 to 40 m. Line spacing was 250 m and a total of 675 line km were flown, including tie lines. With the increased magnetic detail in the El Pilar deposit area, it was possible to outline the extent of the more magnetic volcanic clast unit (Qwl), which underlies the copper bearing intrusive clast conglomerate. Since the TSDAS and Titan surveys both indicated that the depth to bedrock west of the edge of the outcrop was probably >500 meters, the high contrast magnetic features were interpreted to be due to near surface sources. The magnetic high in the vicinity of the copper resource coincided extremely well with the location of the volcanic clast unit (Qwl) paleo high known from drilling and described earlier in the Mineralization section of this report. It was therefore thought that the entire magnetic feature west of the edge of the outcrop could be due to an apron of the more magnetic volcanic clast unit (Qwl). This would signify the probability that the mineralized intrusive clast unit (Qwu) existed in the local areas of lower magnetism surrounding the magnetic highs as was the case in the El Pilar deposit area.
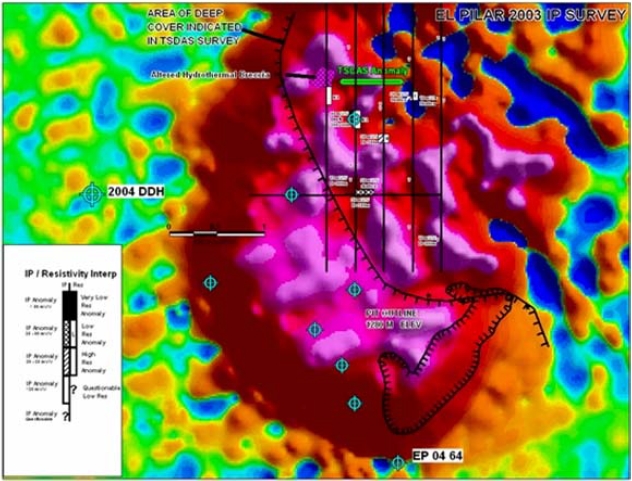
Figure 9-3: Dipole-Dipole Time Domain IP
El Pilar Project Form 43-101F1 Technical Report | |
It was known from the 2001 drill program that low grade mineralization occurred west of the volcanic clast unit (Qwl) paleo high. The 2004 drilling program utilized this data and the high contrast magnetic features to plan drill holes on the flanks of the magnetic highs west of the known paleo high. Other drill holes in the 2004 drilling campaign targeted the mesquite anomalies from the regional survey.
Stingray’s drill program of 2007 and 2008 proceeded to in-fill drill the resource area and to test the southern limit to the copper mineralization.
El Pilar Project Form 43-101F1 Technical Report | |
This section is unchanged from the 2011 Study, and is still reliable and current. The Stingray geologic and drill hole database was provided to IMC for review and included 255 holes that represented 52,810 m of drilling. Table 10-1 summarizes the drilling by date. Figure 10-1 shows the drillhole locations and also distinguishes the Freeport, Noranda, and Stingray drilling.
Table 10-1: El Pilar Tabulation of Historical Drilling
| El Pilar Drilling by Date and Company |
| Year | Company | Type | No. of
Holes | Meters |
| 1998 | Freeport | RC | 7 | 1,369 |
| 2000 | Noranda | HQ Core | 32 | 6,023 |
| 2001 | Noranda | HQ Core | 17 | 3,663 |
| 2004 | Noranda | HQ Core | 5 | 933 |
| Subtotal Freeport/Noranda | 61 | 11,988 |
| 2007 | Stingray | HQ Core | 98 | 19,408 |
| 2008 | Stingray | HQ Core | 96 | 21,414 |
| Subtotal All Stingray | 194 | 40,822 |
| GRAND TOTAL | 255 | 52,810 |
Pre-Stingray drilling amounts to 61 holes representing 11,988 m drilled by Freeport and Noranda between 1998 and 2004. In terms of meters of drilling, this represents 23% of the total drilling to date. Previous reports, such as the WOODS Report, represent pre-Stingray drilling as 82 holes and 15,483 m of drilling, but this total includes drilling that does not pertain to the El Pilar deposit, such as the El Pilar de Arriba area, which is a few kilometers away.
According to the WOODS Report, all of the Noranda drilling at El Pilar was core. The report says that Noranda also drilled 19 reverse circulation (RC) holes, but they were not in the immediate El Pilar area. IMC reviewed the Noranda drilling logs, but the drilling type is not always evident on the drill logs. Therefore, IMC is relying on the WOODS Report for the drilling type for the Noranda holes.
During 2007 and 2008, Stingray drilled 194 HQ core holes representing 40,822 m. This drilling represents 77% of the drillhole database in terms of meters drilled. The purpose for the drilling was to: 1) validate the Freeport and Noranda drilling, 2) extend the resource base, and 3) collect samples to perform metallurgical testing over the entire deposit.
All of the El Pilar drilling was done with vertical holes. The copper deposit is tabular, with dips ranging from flat to about 24 degrees, so width of mineralization from the samples is about 10% greater than the true width. Based on a 0.10% total copper grade as the threshold of interesting
El Pilar Project Form 43-101F1 Technical Report | |
mineralization, the median mineralized width is about 90 m. A summary of the approximate distribution of the mineralized width is as follows:
| | ● | About 25% of holes indicate a mineralized thickness between 5 and 45 m, |
| | ● | About 25% between 45 m and 90 m, |
| | ● | About 25% between 90 m and 120 m, and |
| | ● | About 25% of the holes indicate a mineralized width greater than 120 m. |
Figure 10-1: El Pilar Drillhole Locations
No additional drilling was conducted at El Pilar in 2010 and 2011.
El Pilar Project Form 43-101F1 Technical Report | |
| 11 | SAMPLE PREPARATION, ANALYSES AND SECURITY |
| | |
| 11.1 | Pre-Stingray Drilling |
This section is unchanged from the 2011 Study, and is still reliable and current. All analytical work was performed by the Bondar Clegg Lab in Vancouver, B.C., following sample preparation by Bondar’s affiliate in Hermosillo.
The samples were crushed using a Rhino Crusher to a minimum of 75% passing -10 mesh. At least one sample in every order was sieved through a 10-mesh screen to verify that this standard was met. The crushed sample was then passed through a Jones Splitter, to provide a representative cut of 250 grams. The 250-gram cut was packaged and labeled with a Bondar Clegg order number and sample number. The remaining crushed sample was rebagged in a reject bag and also labeled with the order number and sample number. The 250 gram sample was then pulverized in a ring and puck pulverizer to a minimum standard of 95% passing -150 mesh, re-bagged, and boxed for shipment to the Bondar-Clegg laboratory in Vancouver.
At the Vancouver laboratory, analysis was as follows:
| | ● | All samples were first analyzed for total copper by Bondar-Clegg’s code GA30 method. This is a four acid digestion, hydrochloric, nitric, hydrofluoric, and perchloric, on a 0.25 gram sample. Analysis is by atomic absorption spectrometry (AAS). |
| | ● | For determining soluble copper, samples that reported total copper values over 1,000 ppm but less than 2,000 ppm were analyzed by Bondar-Clegg’s code GA40 procedure. In this procedure 0.10 grams of sample were digested in 30% hot sulfuric acid (80 degrees C), followed by AAS analysis. |
| | ● | Soluble copper analysis for samples that reported over 2,000 ppm total copper was done by a sequential leach copper procedure, code CUSL. A 0.25 gram sample was first digested in 30% sulfuric acid at 80 degrees centigrade for 90 minutes with regular agitation. The solution was then extracted and analyzed by AAS. The residue was then rinsed and neutralized and leached in cyanide with final analysis on the solution by AAS. |
The sequential analysis was discontinued early in the 2001 campaign. The method was somewhat expensive and the incremental copper extracted in the cyanide digestions step was small. Cyanide is not very effective for digesting chrysocolla, one of the main copper minerals at El Pilar.
For sample security, after splitting of the core, the samples were bagged by project geologists and driven to the sample preparation laboratory in Hermosillo by Noranda personnel. Sample preparation and shipment of the pulps to the Vancouver analytical laboratory was conducted by lab personnel. Noranda personnel were not involved in sample preparation.
Sample preparations and analysis for Stingray drilling was performed at two different laboratories. About 60% of the drilling analyses were done by ALS Chemex laboratories and about 40%, particularly the drilling used for metallurgical testing, were done by the METCON
El Pilar Project Form 43-101F1 Technical Report | |
laboratory in Tucson, Arizona. Sample preparation for ALS Chemex was done at their Hermosillo, Mexico facility, after which the pulps were shipped to Vancouver for analysis. As part of the QA/QC work several hundred pulps were analyzed at both laboratories.
The ALS Chemex sample preparation procedure consisted of logging the sample into the system, weighing and drying. The samples were then crushed to 70% passing 2 mm (Tyler 9 mesh or US 10 mesh). A split of 250 grams was removed and then pulverized to 85% passing 75 microns (200 mesh). Periodic screen samples were done for the crushed and pulverized material to make sure that the standards were maintained.
Total copper analysis was done by a four acid digestion, nitric, perchloric, hydrofluoric, and hydrochloric acid, followed by analysis with Inductively Coupled Plasma - Atomic Emission Spectroscopy (ICP-AES). Soluble copper analysis was done by leaching a 0.5 gram sample with 3% sulfuric acid for 15 minutes at room temperature. After leaching, analysis was by Atomic Absorption Spectroscopy (AAS).
ALS Chemex laboratories are highly regarded facilities for sample preparation and analysis. Most laboratories are registered to ISO 9001:2000 standards and many are ISO 17025 accredited. The METCON sample preparation procedure consisted of drying the sample then crushing to a nominal -10 to -20 mesh. This was split and a portion pulverized to 80% passing 125 mesh.
Total copper analysis was done by a three acid digestion of a 0.2 gram pulverized sample with hydrochloric, nitric, and perchloric acid. Final analysis was by atomic absorption (AA) or ICP. Soluble copper analysis was done by leaching a 0.5 gram pulverized sample in 5% sulfuric acid for an hour, agitated and at room temperature. Final analysis was by AA.
Stingray core was collected at the drill rig by Stingray employees and transported to the core shed, a locked and fenced facility. The core was then logged, photographed, split and put in sample bags. The samples were then transported to Hermosillo (Chemex) or Tucson (METCON) for preparation and analysis. Other than initial splitting of the core, Stingray personnel were not involved with sample preparation or analysis. Quality Control samples were also inserted as follows: 1) duplicates were inserted every ten samples, 2) blanks were inserted every 20 samples and 3) standards were inserted every ten samples.
| 11.3 | Comparison of Soluble Copper Assays |
It is important to note that the soluble copper assays from the pre-Stingray versus Stingray drilling are considerably different. The pre-Stingray soluble copper assays used a stronger sulfuric acid concentration and higher temperatures for the digestion; they were significantly more aggressive than the Stingray soluble copper assays. The pre-Stingray and Stingray soluble copper assays should be treated as two different assays and segregated into separate variables in the database. IMC used only the Stingray soluble assays (cold soluble copper) for resource modeling.
El Pilar Project Form 43-101F1 Technical Report | |
| 11.4 | Metallurgical Sample Preparation, Analysis and Security |
Sample preparation, analysis and security for collection of the metallurgical samples are covered separately in Section 13.
It is the Author’s opinion that the sample preparation and analytical procedures are correct and adequate for the purpose of defining mineral resources and mineral reserves for feasibility level studies.
El Pilar Project Form 43-101F1 Technical Report | |
| 12 | DATA VERIFICATION |
| | |
| 12.1 | IMC Verification of Assay Database |
This section is unchanged from the 2011 report, and is still reliable and current. The data verification work and summary in this section of the report was done by Mike Hester (FAusIMM) of IMC.under the supervision of the Author.
To validate the El Pilar database, IMC compared the database with assay certificates for eight pre-Stingray holes and eight Stingray holes. This represents 6.3% of all holes and about 8% of the holes with significant mineralization (about 200 of the 255 holes). No significant discrepancies were found, so IMC concluded that the database fairly captured the correct assay data. The holes reviewed for this work were:
| | EP-98-05 | EP-98-06 | EP-00-02 | EP-00-04 |
| | EP-00-16 | EP-00-19 | EP-00-28 | EP-01-45 |
| | S-07-25 | S-07-60 | S-07-81 | S-07-138 |
| | S-07-143 | S-08-75 | S-08-87 | S-08-97 |
IMC did discover 10 assay intervals in holes EP-00-02 and EP-00-04 with total copper assays of 2.0%. This was the upper detection limit. In these cases the assay certificate included an alternative, and higher, re-assay, but it was not incorporated into the database.
| 12.2 | Quality Assurance and Quality Control for Stingray Drilling Samples |
Stingray conducted a comprehensive program to assure the quality of its sample preparation and analysis (assaying). Standard, blank and duplicate samples from the El Pilar exploration program were subjected to quality assurance. The standard samples were prepared at METCON using interval samples provided by Stingray. The blank sample came from a monzonite outcrop at the El Pilar and is not anomalous in copper. The standard, blank and duplicate samples were generally inserted (used) as follows:
| | ● | Duplicate samples were inserted every ten samples. |
| | ● | Blank samples were inserted every 20 intervals. |
| | ● | Standard samples were inserted every ten interval samples. |
| | 12.2.2 | Chemex vs. METCON Pulp Assays |
Since the interval sample data developed from the El Pilar drill holes was analyzed at two different labs, ALS Chemex and METCON respectively, it was important to establish that there was good correlation between the two labs being used for the copper analyses. It is estimated that about 40% of the total copper assays in the database are METCON assays, and that 60% of the assays are from Chemex. METCON uses a four acid digestion for their soluble copper assays, whereas Chemex uses a three acid aqua reagia method.
El Pilar Project Form 43-101F1 Technical Report | |
Approximately 372 pulp samples originally prepared and assayed at ALS Chemex were reassayed for total copper and acid soluble copper at METCON and 213 pulp samples originally prepared and assayed at METCON were re-assayed at ALS Chemex. Figures 12-1 and 12-2 show the results for total copper and soluble copper for the Chemex pulps re-assayed at METCON.
Figure 12-1: Total Copper Analyses – Pulp Samples Originally Assayed At ALS Chemex &
Re-assayed At METCON
Figure 12-2: Acid Soluble Copper Analyses – Pulp Samples Originally Assayed At ALS
Chemex & Re-assayed At METCON
The analytical data developed by ALS Chemex and METCON showed that there is a good correlation between the two laboratories for all check assays. Of the 372 pulps, about 340 had an assay for both laboratories above the detection limits. For these, the mean percent total copper
El Pilar Project Form 43-101F1 Technical Report | |
for METCON is 0.198 and ALS Chemex is 0.216 and the coefficient of determination (R
2) between the two sets of values is 0.9775. The mean percent acid soluble copper for METCON is 0.080 and ALS Chemex is 0.085 and the coefficient of determination (R
2) between the sets of values is 0.9821.
The comparison plots exhibit a slight upward bias (slightly higher total copper and acid soluble copper values) for ALS Chemex. Based on the means Chemex is about 9.1% higher than METCON for total copper and 6.3% higher for soluble copper. Based on the regressions it is indicated that Chemex assays are about 7.9% higher than METCON for total copper and about 4.3% higher for soluble copper.
IMC calculated a precision or relative error based on the “half absolute relative deviation” (HARD) method of 5.7% for total copper and 7.0% for soluble copper. This is interpreted as a total copper analysis would expected to be within 5.7% of the true value and a soluble copper analysis would expected to be within 7.0% of the true value. IMC used minimum thresholds of 0.01% total copper and 0.005% soluble copper for the precision calculations, i.e. both assays of the sample pair had to be above these values for the pair to be included in the precision calculation. Note that the indicated lab bias could contribute as much of 4% to 4.6% (half the observed bias) of the 5.7% total copper relative error and 2.1% to 3.2% of 7.0% soluble copper relative error.
Figures 12-3 and 12-4 show the results for total copper and soluble copper respectively for the 213 pulps originally prepared and assayed at METCON, then sent to ALS Chemex for re-assay.
Figure 12-3: Total Copper Analyses – Pulp Samples Originally Assayed At METCON &
Re-assayed At ALS Chemex
El Pilar Project Form 43-101F1 Technical Report | |
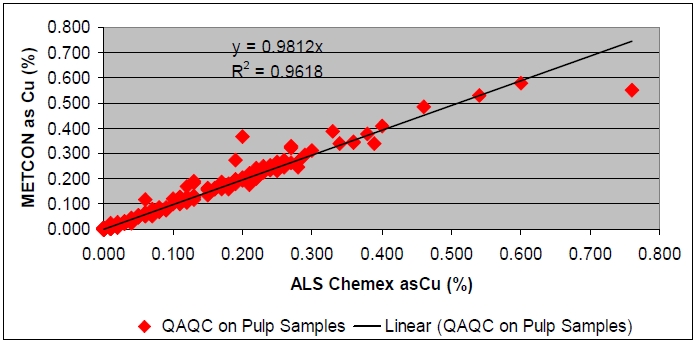
Figure 12-4: Acid Soluble Copper Analyses – Pulp Samples Originally Assayed At METCON &
Re-assayed At ALS Chemex
There is a good correlation between the two laboratories, for all check assays. The mean percent total copper for METCON is 0.205% and ALS Chemex is 0.220% and the coefficient of determination between the two sets of values is 0.9765. The mean percent soluble copper for METCON is 0.095% and ALS Chemex is 0.096% and the coefficient of determination (R2) between the two sets of values is 0.9618.
The comparison plots exhibit a slight upward bias (slightly higher total copper and acid soluble copper values) for ALS Chemex. Based on the means, Chemex assays are about 7.3% higher than METCON for total copper and about 1.1% higher for soluble copper. Based on the regression lines, Chemex is about 6.2% higher for total copper and 1.9% higher for soluble copper.
IMC calculated a precision or relative error of 5.8% for total copper and 7.9% for soluble copper. This is interpreted as a total copper analysis would be expected to be within 5.8% of the true value and a soluble copper analysis would be expected to be within 7.9% of the true value. IMC used minimum thresholds of 0.01% total copper and 0.005% soluble copper for the precision calculations, i.e. both assays of the sample pair had to be above these values for the pair to be included in the precision calculation. Note that these precision estimates are comparable with the estimates derived from the results for the Chemex pulps re-assayed at METCON. As before, the indicated lab bias could contribute 3.1% to 3.7% of the 5.8% total copper relative error and 0.6% to 1.0% of the 7.9% soluble copper relative error.
The analytical data developed by re-assaying the Chemex and METCON pulps indicate there is a good correlation between the assays conducted by both laboratories and also indicated that sample preparation and analytical procedures from both laboratories were conducted according to the mining industry standards. There is, however, a bias between lab results in the range of 6% to 8% for total copper and 1% to 6% for soluble copper.
El Pilar Project Form 43-101F1 Technical Report | |
Two standards were developed for the project from El Pilar materials. Stingray submitted 23 coarse reject samples which were analyzed for total copper and soluble copper by METCON and ALS Chemex. The samples were then composited into a higher grade and lower grade population and pulverized to minus 150 mesh to produce the two standards. Samples of the standards were assayed at four laboratories, METCON, Chemex, SGS Lakefield, and Hazen. The METCON, Chemex, and Hazen analytical results were in agreement and SGS tended to come in about 10% lower than the other labs. The assays from the various labs did not constitute enough samples to be considered as certified values for the standards; for this study the certified values used to establish control limits are based on assays collected during the drilling program.
Approximately 706 high grade standards and 493 low grade standards were inserted into the samples analyzed at METCON and ALS Chemex. Figure 12-5 shows the graph for total copper for the high grade standard. For the 706 samples the mean and standard deviation are 0.344% total copper and 0.018% total copper respectively. This gives Upper Control Limits (UCL) and Lower Control Limits (LCL) of 0.379% copper and 0.309% copper. The control limits are established at the mean + two standard deviations.
Figure 12-5: QA/QC on High Grade Standard Sample – Total Copper Analyses
Approximately 32 assays out of 706 assays reported outside of the upper and lower limit; this is a failure rate of 4.5% which is considered acceptable.
Figure 12-6 shows the graph for soluble copper for the high grade standard. Only 14 assays of the 706 were reported outside the control limits. This is a failure rate of only 2%, which is acceptable. The mean and standard deviation of the 706 assays was 0.272% copper and 0.026% copper, resulting in upper and lower control limits of 0.323% and 0.220% copper.
El Pilar Project Form 43-101F1 Technical Report | |
Figure 12-6: QA/QC on High Grade Standard Sample – Acid Soluble Copper Analyses
Figure 12-7 shows the graph for total copper for the low grade standard. The mean and standard deviation of the 493 assays was 0.183% and 0.009% total copper respectively, resulting in upper and lower control limits of 0.200% and 0.165% total copper. Twenty assays reported outside the control limits. This is a failure rate of 4.1%, which is acceptable.
Figure 12-7: QA/QC on Low Grade Standard Sample – Total Copper Analyses
Figure 12-8 shows the graph for soluble copper for the low grade standard. The mean and standard deviation of the 493 assays was 0.112% and 0.014% soluble copper respectively. This results in upper and lower control limits of 0.139% and 0.085% soluble copper. Only 11 assays report outside the control limits, a failure rate of 2.2%. This is acceptable.
El Pilar Project Form 43-101F1 Technical Report | |
Figure 12-8: QA/QC on Low Grade Standard Sample – Acid Soluble Copper Analyses
Approximately 1,330 sample duplicate assays were conducted at METCON and ALS Chemex on the drill hole interval samples as part of the QA/QC program for the El Pilar Project. There is a good correlation between the analytical data developed by the two laboratories. The results achieved are summarized in Figures 12-9 and 12-10 below.
Figure 12-9: QA/QC on Duplicate Samples – Total Copper Analyses
El Pilar Project Form 43-101F1 Technical Report | |
Figure 12-10: QA/QC on Duplicate Samples – Acid Soluble Copper Analyses
The mean of the 1330 intervals was 0.209% total copper for the original assay and 0.210% for the duplicate. For the soluble copper assays the mean was 0.078% for the original sample and 0.079% for the duplicate. Note that the samples population is slightly lower grade than desired since the mining head grade is anticipated to be closer to 0.3% total copper.
IMC calculated a precision or relative error of 3.5% for total copper and 5.8% for soluble copper. This is interpreted as a total copper analysis would expected to be within 3.5% of the true value and a soluble copper analysis would expected to be within 5.8% of the true value. These are very good results. Note that the relative error of duplicate samples should be higher than the relative error measured on re-assays of pulps which tended to be about 5.7% for total copper and 7% to 8% for soluble copper. Note, however, in the case of the duplicate samples the lab bias is removed from the analysis; METCON did both duplicates for their samples and Chemex did both for theirs.
These analytical results show that the repeatability of the interval sample analyses when duplicated were good at both laboratories. This included results for both the total copper analyses and soluble copper analyses.
| | 12.2.5 | Coarse Reject Duplicates |
As an additional check, IMC requested that about 50 coarse reject samples assayed at METCON be sent to ALS Chemex to prepare a fresh pulp and perform the copper analysis. The sample preparation/analytical precision at this step should be lower than for re-assays on the same pulp, but higher than sample duplicates.
Stingray selected 51 coarse reject samples (minus 10 mesh rejects) previously assayed at METCON. The reject coarse samples were submitted for total copper and acid soluble copper at ALS Chemex. Each sample was pulverized and a sample was split and assayed. The results achieved are summarized in Figures 12-11 and 12-12 below.
El Pilar Project Form 43-101F1 Technical Report | |
Figure 12-11: QA/QC on Coarse Reject Samples – Total Copper Analyses
Figure 12-12: QA/QC on Coarse Reject Samples – Acid Soluble Copper Analyses
For total copper the mean of the Chemex assays was 0.255% versus 0.240% for METCON. This is a 5.9% difference based on the means. The difference based on the regression line is about 4.5%. For soluble copper the mean of the Chemex assays was 0.106% versus 0.104% for METCON. This is only a 1.9% difference. The difference based on the regression line is about 3.3%. The analytical data developed on the coarse reject samples showed that there is a good correlation among the analytical data developed by both laboratories.
Based on the assay data, IMC calculated the precision, or relative error based on these assays of 5.5% for total copper and 7.4% for soluble copper. This is interpreted as a total copper analysis would expected to be within 5.5% of the true value and a soluble copper analysis would expected to be within 7.4% of the true value. The slightly lower soluble copper precision is evident based on the wider scatter on the XY plot above. The lab difference could account for 2.3% to 3.0% of the 5.5% total copper relative error and 1.0% to 1.7% of the 7.4% soluble copper relative error.
The blank samples were prepared from an outcrop on El Pilar property. The material used consistently had little to no copper in the rock. Approximately 684 Blank samples were inserted
El Pilar Project Form 43-101F1 Technical Report | |
in the interval samples and the total copper and acid soluble copper analyses were conducted at METCON and ALS Chemex as part of the QA/QC program for the El Pilar Project.
The analytical data developed on the Blank samples indicate that the Blank samples that were inserted into the sample population were consistently analyzed for both total and soluble copper accurately by both laboratories. The anomalous copper levels of error developed are very low. The total copper analyses (Figure 12-13) showed two anomalous assays above 0.05% total copper which represent 2 assays out of 684 assays (approximately 0.29 percent). Thirteen total copper assays, or 1.9% of the total, were above 0.02%. The value 0.02% total represents about twice the nominal detection limit for ALS Chemex’s conventional total copper analysis. The acid soluble copper assays (Figure 12-14) also showed two anomalous assays above 0.05% soluble copper. Only four soluble copper assays were above the 0.02% threshold.
Figure 12-13: Blank Samples - Total Copper Analyses
El Pilar Project Form 43-101F1 Technical Report | |
Figure 12-14: Blank Samples – Acid Soluble Copper Analyses
A total of 200 drill holes were drilled for assaying, resource and reserve estimation and metallurgical testing. A weighted average drilling recovery of approximately 75 percent was achieved for intervals that contained total copper assay greater than 0.10 percent. Drilling recovery appears to be adequate and to meet or exceed industry standards. The drilling recovery data developed on each drill hole is summarized in the following tables (Tables 12-1 through 12-5).
El Pilar Project Form 43-101F1 Technical Report | |
Table 12-1: Core Recovery Table 1
Table 1 Drilling Recovery For Total Cu > 0.10% |
| Drill Hole ID | Mineralization (meters) | Drilling Recovery % |
| S-01 | 16.0 | 55.12 |
| S-02 | 90.0 | 82.60 |
| S-03 | 60.0 | 84.16 |
| S-04 | 70.8 | 63.17 |
| S-05 | 128.9 | 54.82 |
| S-05A | 63.8 | 47.45 |
| S-06 | 181.8 | 67.44 |
| S-07 | 132.3 | 58.28 |
| S-08 | 122.0 | 74.65 |
| S-09 | 66.0 | 79.54 |
| S-10 | 122.0 | 82.16 |
| S-11 | 0.0 | 0.00 |
| S-12 | 0.0 | 0.00 |
| S-13 | 0.0 | 0.00 |
| S-14 | 14.5 | 52.34 |
| S-15 | 62.0 | 45.30 |
| S-16 | 104.0 | 60.10 |
| S-17 | 140.0 | 82.44 |
| S-18 | 156.0 | 82.95 |
| S-19 | 18.0 | 63.95 |
| S-20 | 76.0 | 75.94 |
| S-21 | 122.7 | 75.96 |
| S-22 | 135.0 | 77.97 |
| S-23 | 18.0 | 64.11 |
| S-24 | 66.0 | 51.03 |
| S-25 | 102.0 | 86.66 |
| S-26 | 112.5 | 45.48 |
| S-27 | 120.4 | 63.49 |
| S-27A | 142.0 | 71.56 |
| S-28 | 148.0 | 87.16 |
| S-29 | 126.0 | 85.54 |
| S-30 | 10.0 | 97.00 |
| S-31 | 0.0 | 0.00 |
| S-33 | 132.0 | 70.70 |
| S-34 | 135.0 | 58.09 |
| S-35 | 78.0 | 86.28 |
| S-37 | 0.0 | 0.00 |
| S-38 | 44.0 | 58.91 |
| S-39 | 76.0 | 65.63 |
| S-40 | 50.5 | 58.81 |
| S-40A | 116.0 | 67.23 |
| S-41 | 152.0 | 79.71 |
| S-42 | 156.0 | 71.47 |
El Pilar Project Form 43-101F1 Technical Report | |
Table 12-2: Core Recovery Table 2
Table 2 Drilling Recovery For Total Cu > 0.10% |
| Drill Hole ID | Mineralization (meters) | Drilling Recovery % |
| S-43 | 92.0 | 53.50 |
| S-44 | 82.0 | 74.17 |
| S-45 | 40.0 | 78.45 |
| S-46 | 0.0 | 0.00 |
| S-47 | 78.0 | 88.81 |
| S-48 | 122.0 | 63.00 |
| S-49 | 167.0 | 54.92 |
| S-50 | 0.0 | 0.00 |
| S-54 | 48.6 | 85.78 |
| S-57 | 0.0 | 0.00 |
| S-58 | 21.4 | 82.33 |
| S-59 | 64.8 | 50.69 |
| S-60 | 100.0 | 78.86 |
| S-61 | 55.5 | 78.20 |
| S-61A | 151.0 | 74.25 |
| S-62 | 164.0 | 75.94 |
| S-63 | 136.5 | 78.06 |
| S-64 | 59.5 | 77.38 |
| S-68 | 26.7 | 64.30 |
| S-69 | 72.0 | 84.00 |
| S-70 | 154.0 | 74.94 |
| S-71 | 199.0 | 80.52 |
| S-72 | 84.0 | 60.50 |
| S-73 | 31.9 | 78.32 |
| S-74 | 55.4 | 65.43 |
| S-75 | 56.4 | 83.42 |
| S-76 | 30.1 | 64.95 |
| S-77 | 66.0 | 85.24 |
| S-78 | 104.0 | 92.86 |
| S-79 | 120.0 | 47.78 |
| S-80 | 152.0 | 57.76 |
| S-81 | 206.0 | 73.99 |
| S-82 | 143.5 | 69.13 |
| S-84 | 23.9 | 65.18 |
| S-85 | 67.5 | 66.20 |
| S-86 | 93.0 | 82.87 |
| S-87 | 96.5 | 76.50 |
| S-88 | 150.2 | 94.32 |
| S-89 | 0.0 | 0.00 |
| S-90 | 37.7 | 76.81 |
| S-91 | 58.9 | 78.85 |
| S-92 | 55.5 | 87.19 |
| S-93 | 81.8 | 71.56 |
| S-94 | 85.5 | 62.84 |
| S-95 | 101.6 | 84.80 |
| S-96 | 120.3 | 87.89 |
| S-97 | 138.8 | 91.08 |
El Pilar Project Form 43-101F1 Technical Report | |
Table 12-3: Core Recovery Table 3
Table 3 Drilling Recovery For Total Cu > 0.10% |
| Drill Hole ID | Mineralization (meters) | Drilling Recovery % |
| S-98 | 177.5 | 93.09 |
| S-99 | 141.8 | 92.68 |
| S-100 | 38.7 | 79.83 |
| S-101 | 73.0 | 74.93 |
| S-102 | 88.3 | 64.97 |
| S-103 | 119.4 | 67.93 |
| S-104 | 136.5 | 81.06 |
| S-105 | 40.8 | 88.26 |
| S-106 | 16.6 | 95.82 |
| S-107 | 86.2 | 86.35 |
| S-108 | 99.4 | 88.86 |
| S-109 | 83.9 | 82.93 |
| S-110 | 119.8 | 80.62 |
| S-111 | 177.7 | 81.85 |
| S-112 | 181.2 | 72.99 |
| S-113 | 181.9 | 86.50 |
| S-114 | 20.4 | 97.51 |
| S-115 | 105.8 | 85.88 |
| S-116 | 83.0 | 71.90 |
| S-116A | 69.9 | 90.26 |
| S-118 | 16.0 | 88.50 |
| S-119 | 34.0 | 51.80 |
| S-120 | 82.0 | 61.15 |
| S-121 | 121.0 | 75.69 |
| S-122 | 32.0 | 84.25 |
| S-123 | 93.7 | 88.61 |
| S-124 | 0.0 | 0.00 |
| S-125 | 10.0 | 76.00 |
| S-126 | 31.7 | 77.66 |
| S-127 | 50.6 | 63.36 |
| S-128 | 100.8 | 77.57 |
| S-129 | 113.9 | 84.04 |
| S-130 | 137.1 | 85.77 |
| S-131 | 118.8 | 81.58 |
| S-132 | 90.0 | 85.20 |
| S-133 | 24.8 | 67.87 |
| S-133A | 11.8 | 87.70 |
| S-134 | 59.6 | 64.53 |
| S-135 | 94.1 | 57.68 |
| S-136 | 102.2 | 64.79 |
| S-137 | 131.1 | 75.71 |
| S-138 | 143.1 | 66.54 |
| S-139 | 8.2 | 16.00 |
| S-140 | 43.9 | 47.14 |
| S-141 | 119.7 | 70.20 |
| S-142A | 136.1 | 65.09 |
| S-143 | 166.3 | 68.93 |
El Pilar Project Form 43-101F1 Technical Report | |
Table 12-4: Core Recovery Table 4
Table 4 Drilling Recovery For Total Cu > 0.10% |
| Drill Hole ID | Mineralization (meters) | Drilling Recovery % |
| S-144 | 162.0 | 78.90 |
| S-145 | 131.9 | 67.33 |
| S-146 | 62.2 | 39.57 |
| S-147 | 103.4 | 64.21 |
| S-148 | 105.7 | 64.09 |
| S-149 | 110.5 | 60.29 |
| S-150 | 138.2 | 69.64 |
| S-151 | 151.5 | 65.65 |
| S-152 | 124.0 | 63.43 |
| S-153 | 81.7 | 72.17 |
| S-154 | 45.3 | 87.31 |
| S-155 | 67.3 | 59.32 |
| S-156 | 121.8 | 53.65 |
| S-157 | 42.2 | 74.17 |
| S-158 | 0.0 | 0.00 |
| S-159 | 0.0 | 0.00 |
| S-160 | 16.0 | 68.28 |
| S-161 | 0.0 | 0.00 |
| S-162 | 44.3 | 88.37 |
| S-163B | 0.0 | 0.00 |
| S-164 | 89.1 | 81.04 |
| S-165 | 138.0 | 79.68 |
| S-166 | 84.4 | 65.85 |
| S-167 | 72.4 | 54.99 |
| S-168 | 147.6 | 65.90 |
| S-169 | 106.5 | 70.18 |
| S-170 | 61.1 | 51.89 |
| S-171 | 152.7 | 78.43 |
| S-172 | 172.6 | 91.72 |
| S-173 | 58.1 | 54.00 |
| S-174 | 127.5 | 83.34 |
| S-175 | 164.7 | 82.20 |
| S-176 | 32.1 | 41.85 |
| S-177 | 104.2 | 78.31 |
| S-178 | 135.1 | 80.33 |
| S-179 | 79.1 | 79.00 |
| S-180 | 127.7 | 80.57 |
| S-181 | 183.0 | 84.21 |
| S-182 | 165.3 | 87.30 |
| S-183 | 21.3 | 16.21 |
| S-184 | 39.6 | 70.78 |
| S-185 | 67.2 | 65.69 |
| S-186 | 102.3 | 83.08 |
| S-187 | 123.8 | 85.13 |
| S-188 | 119.4 | 86.51 |
| S-189 | 92.1 | 89.37 |
| S-190 | 164.6 | 80.29 |
El Pilar Project Form 43-101F1 Technical Report | |
Table 12-5: Core Recovery Table 5
Table 5 Drilling Recovery For Total Cu > 0.10% |
| Drill Hole ID | Mineralization (meters) | Drilling Recovery (%) |
| S-191 | 122.2 | 87.90 |
| S-192 | 59.3 | 91.16 |
| S-193 | 107.7 | 72.21 |
| S-194 | 154.9 | 83.34 |
| S-195 | 151.6 | 86.90 |
| S-196 | 35.4 | 87.21 |
| S-197 | 51.8 | 86.59 |
| S-198 | 71.4 | 65.20 |
| S-199 | 90.7 | 74.93 |
| S-200 GT-05 | 108.5 | 96.36 |
| S-201 | 131.1 | 82.11 |
| S-202 | 70.3 | 88.39 |
| S-203 | 62.3 | 74.84 |
| S-204 | 170.3 | 89.40 |
| S-205 | 0.0 | 0.00 |
| S-207 | 0.0 | 0.00 |
A review of the distribution of poorer versus better core recoveries shows that the best recoveries are from deeper in the deposit, probably due to higher compaction. This means that in the deeper, most distal and lower depositional energy portions of the deposit, where incrementally higher contents of fines were noted mineralogically, core recoveries are good. Conversely, in the shallower, more proximal and higher depositional energy portions of the deposit, where overall lower concentrations of fine particles are noted, core recoveries are poorer due to the difficulty of coring and recovering material from the modestly consolidated gravels. A review of copper grades and grade variations between areas of poorer and better core recoveries shows a very similar copper grade distribution, indicating that core losses occurred across a wide range of size fractions.
| | 12.2.8 | Quality Assurance and Quality Control by IMC |
The following conclusions are based on the results of the QA/QC test program conducted by ML.
| | ● | ML conducted a comprehensive QA/QC program for El Pilar drilling which included insertion of standards, blanks, and duplicates in the sample stream. |
| | ● | Based on the low failure rate for the standards and blanks (< 5 % in all populations), IMC believes that the sample preparation and analytical work were performed to high standards and the data base is acceptable for mineral resource and mineral reserve calculations. |
El Pilar Project Form 43-101F1 Technical Report | |
| | ● | Relative error calculations show that it is relatively easy to replicate assays at El Pilar; this should have positive impacts on ore grade control. |
| | ● | Metallurgical samples are distributed through the deposit and appear to be representative of the material to be extracted. |
| | ● | There is a small lab bias between ALS Chemex, the main laboratory for exploration assays, and METCON, a metallurgical testing facility. About 30% of the ML assay intervals were done by METCON. ALS Chemex tends to be about 5-6% higher than METCON for total copper and 2-5% higher for soluble copper. |
| | ● | ALS Chemex used a four acid digestion for total copper analysis versus a three acid digestion for METCON; this could be a possible source of the bias. |
| | ● | The METCON assays are used for mineral resource and mineral reserve modeling, which would tend to reduce grades slightly compared to Chemex assays. This would tend to be a conservative factor. |
It should also be noted that Noranda had a QA/QC program in place for their drilling. This is described in the previous NI 43-101 Technical Report by Gary Woods filed at SEDAR by Stingray. Since Noranda drilling represents only about 23% of the total and the Stingray drilling validates their results, IMC did not review the Noranda QA/QC results.
| 12.3 | Data Verification of Metallurgical Samples |
Data verification of the metallurgical samples is discussed separately in Section 13.
El Pilar Project Form 43-101F1 Technical Report | |
| 13 | MINERAL PROCESSING AND METALLURGICAL TESTING |
| | |
| 13.1 | General |
The El Pilar mine is a planned open pit, oxide copper mine, whereby copper will be recovered from the heap leach pad via the application of sulfuric acid-bearing raffinate pumped from a raffinate pond. The pregnant leach solution (PLS) will then be collected and the copper recovered in the plant via the process of solvent extraction/electrowinning (SXEW) in a two-stage process that first extracts and upgrades copper ions from low-grade leach solutions into a concentrated electrolyte, and then deposits pure copper onto cathodes using an electrolytic procedure.
Extensive metallurgical work was conducted both historically and more recently in 2010 and 2011 at El Pilar to determine how much copper will be recovered from the ores and how much acid will be consumed by the leaching process. All of this data was presented in the 2011 Study and is repeated herein. Additional metallurgical work on 11 mini columns 3 m tall, which has been in progress since the 2011 Study, is reported as new information in this section of this report.
By way of explanation, the Base Case chosen for the 2011 Study reserve and economics was developed on the basis of a copper grade:recovery algorithm generated mostly from 6 m tall column data (plus one 4 m tall crib). In addition, that algorithm was based on only 150 days of actual column leaching, with the final results projected out to 180 days using the METSIM metallurgical program. During the writing of the 2011 Study, final tear down actual 180 leach day data from the 2010-2011 crib and column tests became available. This new data allowed for two things; 1) a comparison between the projected and actual 6 m 180 day recoveries, and 2) the development of a new 3 m 180 day copper recovery algorithm. The 3 m algorithm is important because it projects much better copper recoveries over the same 180 day leach cycle than did the 6 m data. The 3 m data, and the resulting copper recovery algorithm, were included in the 2011 Study. However, that recovery algorithm and its impact on project economics was included and presented in the 2011 Study only as a “semi-quantified Recovery Case”, rather than as the Base Case. The reason for this is that, to fully quantify the impact of the 3 m recovery algorithm on project reserves and economics, a new reserve and mine schedule would have to be calculated on the basis of that algorithm under an extended time schedule not available at that time.
As described in the following sections, the new Base Case for this study is now the 3m lift height 180 day leach period copper recovery case referred to hereafter in this report as the “Base Case”. This new Base Case is the result of using the 3 m 180 day copper recovery algorithm to calculate a new reserve and mine schedule, as described further in section 14.
| 13.2 | Historic Work - 2004 Noranda & 2009 Stingray Metallurgical Testing |
This section has not been modified from the 2011 Study. In 2004, Noranda, a subsidiary of Falconbridge Ltd., commissioned a preliminary leaching test program at Falconbridge’s Lomas Bayas mine in Chile. That work was reported by WOODS in 2007.
El Pilar Project Form 43-101F1 Technical Report | |
For the purposes of the 2009 NI 43-101 Technical Report and Feasibility Study, Stingray developed an additional program of drilling and metallurgical test work at El Pilar. METCON conducted all the leaching test work, from sample preparation, bottle roll tests, mini-columns, and open-cycle columns to locked-cycle columns. The program is fully documented in Stingray’s 2009 NI43-101 Technical Report entitled; ”El Pilar Project Executive Summary - Sonora, Mexico”, issued by M3.
The metallurgical testing program was on drill core composite samples that simulate the leach material for a simplified Year 1-9 mine schedule taking into account geology, material location and copper grade. METCON received 3,925 interval samples from 75 drill holes. A sample from each interval was split and submitted for total copper and acid soluble copper analysis. ALS Chemex received 9,237 interval samples from 141 drill holes and also conducted total copper and acid soluble copper assays on samples from each interval sample. Drill hole intercepts were selected to be representative of material in the mine schedule for Year 1, Year 2, Year 3, Years 4 through 6, and Years 7 through 9. The three single year composites and the two three-year composites resulted in the five separate drill core composite samples. Figure 13-1 shows the drill holes locations used for the metallurgical composites and illustrates that the five composites are well distributed throughout the deposit area.
The primary objective of the 2009 test program was to generate copper extraction and sulfuric acid consumption data for the composite samples. The leach tests were conducted utilizing bottle roll and column leach techniques in open cycle and locked cycle tests under variable irrigation rates and material crush sizes.
El Pilar Project Form 43-101F1 Technical Report | |

Figure 13-1: Distribution of Stingray Five Composite Metallurgical Samples
The result of the bottle roll tests that were done to assess maximum acid consumption are presented in Table 13-1.
Table 13-1: Yearly Composite Bottle Roll Results
| EL Pilar Bottle Roll Testing Summary of Results |
| Sample Id | Extraction (%) | Gangue Acid
Consumption | Total Acid
Consumption |
| | Cu | Fe | kg/t | Kg/kg Cu | kg/t | Kg/kg Cu |
| Year 1 | 76.44 | 7.37 | 23.97 | 7.48 | 28.92 | 9.02 |
| Year 2 | 75.98 | 6.49 | 24.36 | 7.72 | 29.23 | 9.26 |
| Year 3 | 70.97 | 25.93 | 18.98 | 7.15 | 23.07 | 8.69 |
| Year 4, 5 & 6 | 66.89 | 3.47 | 22.94 | 11.06 | 26.14 | 12.6 |
| Year 7, 8 & 9 | 58.76 | -2.19 | 25.46 | 15.04 | 28.07 | 16.59 |
A total of 20 columns were run in locked cycle with SX for a 120 day leach period, two for each yearly composite at a 37.5 mm and 19.0 mm crush size and two for each composite at a 7.8 and
El Pilar Project Form 43-101F1 Technical Report | |
6.11 lph solution application rate. A detailed summary of the results of the locked cycle test for the five yearly composites is presented in Table 13-2.
Table 13-2: METCON Locked Cycle Test Results – Five Yearly Composites
| Stingray - Five Yearly Composite METCON Locked Cycle Metallurgical Results |
| | | | | Normalized Extraction | Gangue Acid Consumption | | Sequential Copper Analysis (% Cu) | Calculated Copper Extraction
(%) |
| | | | | | Head Sample | Leach Residue Sample |
| Sample
ID. | Crush
Size P80 (mm) | Irrigation Flow Rate (lph/m2) | Leach
Cycle (Days) | Cu (%) | Fe (%) | (kg/t) | (kg/kg Cu) | Comp. Soluble
Test
AsCu | As Cu | ResCu (incl. CNsCu) | Calc TCu | ASCu | ResCu (incl. CNsCu) | Calc TCu | Recovery ASCu (%) | Recovery ResCu (incl. CNsCu) | Calc RCu (%) |
| Year 1 | 37.5 | 6.11 | 128 | 66.0% | 4.8% | 19.32 | 7.12 | 0.321 | 0.295 | 0.019 | 0.429 | 0.050 | 0.004 | 0.129 | 83.1% | 34.8% | 69.9% |
| | 37.5 | 7.8 | 128 | 70.2% | 4.5% | 18.92 | 6.02 | 0.321 | 0.295 | 0.019 | 0.429 | 0.051 | 0.005 | 0.130 | 82.7% | 35.7% | 69.7% |
| | 19.0 | 6.11 | 128 | 73.9% | 2.3% | 15.39 | 4.97 | 0.321 | 0.306 | 0.017 | 0.435 | 0.042 | 0.005 | 0.108 | 86.3% | 45.5% | 75.2% |
| | 19.0 | 7.8 | 128 | 82.4% | 3.0% | 17.54 | 5.12 | 0.321 | 0.306 | 0.017 | 0.435 | 0.024 | 0.005 | 0.079 | 92.2% | 55.4% | 81.8% |
| Year 2 | 37.5 | 6.11 | 128 | 70.1% | 1.9% | 17.83 | 5.92 | 0.263 | 0.267 | 0.013 | 0.392 | 0.045 | 0.004 | 0.125 | 83.1% | 32.1% | 68.1% |
| | 37.5 | 7.8 | 128 | 70.9% | 0.0% | 19.88 | 6.69 | 0.263 | 0.267 | 0.013 | 0.392 | 0.033 | 0.004 | 0.120 | 87.6% | 25.9% | 69.4% |
| | 19.0 | 6.11 | 128 | 74.0% | 1.3% | 16.35 | 5.26 | 0.263 | 0.306 | 0.017 | 0.435 | 0.031 | 0.004 | 0.115 | 89.9% | 28.6% | 73.6% |
| | 19.0 | 7.8 | 128 | 75.2% | 2.4% | 18.63 | 5.89 | 0.263 | 0.306 | 0.017 | 0.435 | 0.027 | 0.003 | 0.105 | 91.2% | 33.0% | 75.9% |
| Year 3 | 37.5 | 6.11 | 128 | 63.7% | 0.6% | 17.33 | 7.58 | 0.218 | 0.237 | 0.008 | 0.374 | 0.033 | 0.003 | 0.122 | 86.1% | 33.3% | 67.4% |
| | 37.5 | 7.8 | 128 | 64.1% | 2.4% | 19.33 | 8.24 | 0.218 | 0.237 | 0.008 | 0.374 | 0.037 | 0.003 | 0.125 | 84.4% | 34.1% | 66.6% |
| | 19.0 | 6.11 | 128 | 70.6% | 2.9% | 14.31 | 5.65 | 0.218 | 0.236 | 0.009 | 0.346 | 0.029 | 0.003 | 0.096 | 87.7% | 36.6% | 72.3% |
| | 19.0 | 7.8 | 128 | 70.2% | 0.2% | 15.27 | 6.24 | 0.218 | 0.236 | 0.009 | 0.346 | 0.033 | 0.004 | 0.103 | 86.0% | 34.7% | 70.2% |
| Year 4-6 | 37.5 | 6.11 | 128 | 59.6% | 3.0% | 15.04 | 7.97 | 0.175 | 0.188 | 0.008 | 0.296 | 0.030 | 0.004 | 0.125 | 84.0% | 9.0% | 57.8% |
| | 37.5 | 7.8 | 128 | 60.1% | 0.6% | 13.68 | 6.96 | 0.175 | 0.188 | 0.008 | 0.296 | 0.031 | 0.004 | 0.130 | 83.5% | 5.0% | 56.1% |
| | 19.0 | 6.11 | 128 | 57.6% | 2.1% | 12.92 | 7.54 | 0.175 | 0.184 | 0.011 | 0.297 | 0.032 | 0.002 | 0.129 | 82.6% | 6.9% | 56.6% |
| | 19.0 | 7.8 | 128 | 60.7% | 2.0% | 16.90 | 9.47 | 0.175 | 0.184 | 0.011 | 0.297 | 0.032 | 0.003 | 0.119 | 82.6% | 17.6% | 59.9% |
| Year 7-9 | 37.5 | 6.11 | 128 | 55.9% | 1.2% | 14.37 | 8.82 | 0.158 | 0.16 | 0.008 | 0.295 | 0.025 | 0.002 | 0.130 | 84.4% | 18.9% | 55.9% |
| | 37.5 | 7.8 | 128 | 61.1% | 2.5% | 16.28 | 9.46 | 0.158 | 0.16 | 0.008 | 0.295 | 0.027 | 0.003 | 0.135 | 83.1% | 17.3% | 54.2% |
| | 19.0 | 6.11 | 128 | 55.0% | -1.0% | 14.10 | 8.58 | 0.158 | 0.154 | 0.008 | 0.287 | 0.021 | 0.002 | 0.137 | 86.4% | 8.8% | 52.3% |
| | 19.0 | 7.8 | 128 | 61.3% | 3.2% | 13.48 | 6.87 | 0.158 | 0.154 | 0.008 | 0.287 | 0.021 | 0.002 | 0.133 | 86.4% | 12.0% | 53.7% |
| 13.3 | Evaluation of 2009 Stingray Metallurgical Testing Results |
This section has not been modified from the 2011 Study. In preparation for the updated El Pilar Feasibility Study presented in 2011, ML conducted a detailed review all technical studies with particular attention to project metallurgical conclusions. An important discovery of the review, and something that was not recognized in the 2009 study, is the positive relationship between ASCu (Acid Soluble Copper) values and percent copper recovery in the column leach tests.
Specifically, the METCON column leach tests recovered an average of 84.3% ASCu with a small variance, but only 27.1% of ResCu (Residual Copper, i.e. copper that is not acid soluble) with a significant variance of 8% to 41% recovery (Figure 13-2). The high variability in ResCu recovery appears to be unrelated to TCu grade, due to the low variability of TCu (Total Copper) for the yearly composites. As a result, the high variability in ResCu recovery indicates that acid solubility must be taken into account in the evaluation of copper recovery at El Pilar.
El Pilar Project Form 43-101F1 Technical Report | |
Figure 13-2: Copper Solubility & Recovery – Stingray Yearly Composites
Also, the review noted that the 2009 El Pilar reserve was based in part on a cutoff grade of 0.15% TCu, whereas the five yearly composites ranged from 0.428 to 0.289% TCu, well above the TCu grade range of many ore blocks.
| 13.4 | Additional Metallurgical Testing Done in 2010 and 2011 by Mercator |
This section has not been modified from the 2011 Study. In 2010 and 2011, ML conducted additional metallurgical testing on mineralized material from El Pilar for the following reasons:
| | 1. | To evaluate the metallurgical viability of using run-of-mine (ROM) leaching, as compared to the higher cost crushing program proposed by Stingray in 2009; |
| | 2. | To develop additional metallurgical copper recovery and acid consumption information from mineralization with a wide range of copper acid solube assays; |
| | 3. | To investigate the metallurgical recovery of copper and consumption of acid from and by lower grade ores near or at the lower end of Hester’s 2009 0.15 TCu% copper cutoff grade; and; |
| | 4. | To assess metallurgically and economically the possibility of attaining better overall copper recoveries using a longer (than 120 day), more optimized leach period. |
The primary objective of points #2 and #3 above was to attempt to develop a grade recovery relationship at El Pilar. Such a relationship, would then allow for the development of one or more recovery algorithms, such that the recovery of copper from both variable grade and variable copper solubility ores could be predicted on a more accurate basis than was done previously.
El Pilar Project Form 43-101F1 Technical Report | |
The additional metallurgical testing performed in 2010 and 2011 was done on a 600 tonne bulk sample collected onsite and on 13 new drill core composites. These programs are discussed separately in the following sections.
| 13.5 | Bulk Sample Crib and Column Tests 2010-2011 |
| | 13.5.1 | Bulk Sample – Objective and Sample Collection Details |
This section has not been modified from the 2011 Study, and is still reliable and current. Starting in Q2 2010, an approximately 600 tonne bulk sample of mineralized Qwu material was collected at El Pilar from surface outcrops. The primary purpose of collecting this sample was to evaluate the metallurgical viability of using run-of-mine (ROM) leaching at El Pilar. The tests were conducted on two cribs and two columns under locked cycle conditions, with the main objective of the locked cycle testing being to determine copper extraction and gangue acid consumption with an irrigation flow rate of 5.2 lph/m2 at four meter lift height in the cribs and an equivalent 7.8 lph/m2 for the seven meter columns.
The bulk sample was collected at El Pilar at coordinates 531,690 E and 3,449,130 N (see Figure 13-3) at a location just within the northern boundary of proposed open pit. This location is the only outcrop area of copper mineralized alluvial wash material (Qwu) on the El Pilar property.
Figure 13-3: MineSight Screen Capture Showing Bulk Sample Location
Details of collecting the bulk sample are included in a separate report entitled QAQC Program – Bulk Sample (McNulty, 2011), but the information in that report is summarized in the following section. Briefly, the bulk sample was collected from an elongate approximately 10 X 60 m surface trench. The sample area was first outlined in the field, then the upper 1 meter of top soil was removed and the sample collected from a depth of from 1 to 4 m by means of a CAT 325
El Pilar Project Form 43-101F1 Technical Report | |
excavator and directly loaded into 10-yard dump trucks. The sample was then hauled to a yard in Naco, Sonora for its final transport to the Mineral Park mine (MP) in Kingman, AZ.
| | 13.5.2 | Bulk Sample – Screening and Results |
After the bulk sample was received onsite at Mineral Park, it was weighed, offloaded and dry screened at a screening plant available onsite. The results of the screening program are tabulated in Table 13-3.
Table 13-3: Results of Bulk Sample Dry Screening
| Results of Bulk Sample Dry Screening |
| Screen | Sample: Bulk Sample |
| Analysis | Size: Screened |
| Nominal Openings | Sample Weights (kg) | Weight Distribution (%) | Cumulative % |
| mm | Inch | Tyler Mesh | Retained | Passing |
| 52.4 | 6 | | 11,249 | 1.95 | 1.95 | 98.05 |
| 100.0 | 4 | | 13,699 | 2.38 | 3.33 | 95.67 |
| 31.5 | 1 1/4 | | 100,979 | 17.53 | 21.86 | 78.14 |
| 19.0 | 3/4 | | 81,565 | 14.16 | 36.02 | 63.98 |
| Minus | 3/4 | 368,581 | 63.98 | 100.00 | |
| TOTALS | 576,072 | 100.00 | | |
Drums containing fraction samples were identified and sealed, and the samples that were assigned to METCON (Table 13-4) for head assay and column testing were shipped in compliance with a sample collection QA/QC program. Also, duplicate samples were sealed and saved for future use.
Table 13-4: Bulk Sample Fractions to METCON & Duplicates
| Bulk Sample Fractions |
| Fraction | Metcon Sample (kg) | Duplicate (kg) |
| +6" | 69.5 | 54.5 |
| +6" to 4" | 90.5 | 97 |
| -4" to +1 1/2" | 307.5 | 293 |
| -1 1/2" to +3/4" | 281.5 | 303.5 |
| -3/4" | 1,537.5 | 1,541 |
| TOTAL (kg) | 2,287.5 | 2,289 |
After the bulk sample was screened and weighed and samples from each fraction had been collected, the bulk sample was reconstituted at Mineral Park by gradually forming a pile with portions from each fraction. Once one pile was formed with all the material from all fractions,
El Pilar Project Form 43-101F1 Technical Report | |
homogenization was done by coning and quartering up to five times to achieve a final homogeneous pile in compliance with the program QA/QC implementation schedule.
In order to independently determine the head grade of the bulk sample and to have material for five additional backup columns (discussed separately), 2,287 kg of screen fraction duplicate material were shipped to METCON in Tucson. This sample was recombined by METCON and then dry screened into 22 screen fractions. Each of the individual screen fractions was then assayed by METCON for TCu and ASCu and a bulk sample head grade was computed from the fraction assay results (see Table 13-5). The head grade of the bulk sample average 0.537% TCu and had an acid soluble/total copper ratio of 74.6%. This material is considered to be representative of ores that will be encountered and mined during the first few years of the mine life. Tail screen size analysis (Table 13-6) of the same head sample after leaching shows that very little degradation of the ores can be expected during the leaching process. This is highlighted by the comparison graph of the head vs. tail results in Figure 13-8.
Table 13-5: Bulk Sample (Qwu) Head Size Analysis & Assays
| SCREEN | Sample: | Head Bulk Composite | Analytical Results |
| ANALYSIS | Size: | As Received at METCON Research | |
| NOMINAL OPENINGS | Sample
Weights
(kg) | Weight
Distribution
(%) | Cumulative (%) | Copper Assays |
| mm | Inch | Tyler Mesh | Retained | Passing | TCu | ASCu | ResCu | Ratio |
| | 8 | | 0.00 | | | 100.00 | 0.177 | 0.141 | 0.036 | 0.797 |
| 152.4 | 6 | | 80.00 | 3.47 | 3.47 | 96.53 | 0.452 | 0.371 | 0.081 | 0.821 |
| 100.00 | 4 | | 93.00 | 4.03 | 7.50 | 92.50 | 0.297 | 0.211 | 0.086 | 0.710 |
| 75.00 | 3 | | 12.62 | 0.55 | 8.05 | 91.95 | 0.287 | 0.163 | 0.124 | 0.568 |
| 50.00 | 2 | | 61.90 | 2.69 | 10.74 | 89.26 | 0.363 | 0.238 | 0.125 | 0.656 |
| 31.50 | 1 1/4 | | 231.50 | 10.04 | 20.78 | 79.22 | 0.346 | 0.224 | 0.122 | 0.647 |
| 25.00 | 0.984 | 1 | 53.88 | 2.34 | 23.12 | 76.88 | 0.391 | 0.226 | 0.165 | 0.578 |
| 19.00 | 0.748 | 3/4 | 240.50 | 10.43 | 33.55 | 66.45 | 0.438 | 0.297 | 0.141 | 0.678 |
| 12.50 | 0.492 | 1/2 | 119.00 | 5.16 | 38.71 | 61.29 | 0.466 | 0.317 | 0.149 | 0.680 |
| 9.50 | 0.374 | 3/8 | 136.00 | 5.90 | 44.61 | 55.39 | 0.465 | 0.331 | 0.134 | 0.712 |
| 6.30 | 0.248 | 1/4 | 211.00 | 9.15 | 53.76 | 46.24 | 0.551 | 0.388 | 0.163 | 0.704 |
| 1.70 | 0.067 | 10 | 495.00 | 21.47 | 75.23 | 24.77 | 0.583 | 0.453 | 0.130 | 0.777 |
| 1.00 | 0.039 | 16 | 92.86 | 4.03 | 79.26 | 20.74 | 0.637 | 0.530 | 0.107 | 0.832 |
| 0.84 | 0.033 | 20 | 26.11 | 1.13 | 80.39 | 19.61 | 0.701 | 0.560 | 0.141 | 0.799 |
| 0.60 | 0.023 | 28 | 50.60 | 2.19 | 82.59 | 17.41 | 0.758 | 0.630 | 0.128 | 0.831 |
| 0.42 | 0.017 | 35 | 43.10 | 1.87 | 84.46 | 15.54 | 0.881 | 0.700 | 0.181 | 0.795 |
| 0.30 | 0.012 | 48 | 38.71 | 1.68 | 86.14 | 13.86 | 0.915 | 0.780 | 0.135 | 0.852 |
| 0.21 | 0.008 | 65 | 31.84 | 1.38 | 87.52 | 12.48 | 0.925 | 0.770 | 0.155 | 0.832 |
| 0.15 | 0.006 | 100 | 28.48 | 1.24 | 88.75 | 11.25 | 0.821 | 0.680 | 0.141 | 0.828 |
| 0.11 | 0.004 | 150 | 34.51 | 1.50 | 90.25 | 9.75 | 0.724 | 0.600 | 0.124 | 0.829 |
| 0.07 | 0.003 | 200 | 29.03 | 1.26 | 91.51 | 8.49 | 1.020 | 0.690 | 0.330 | 0.676 |
| M I N U S | -200 | 195.75 | 8.49 | 100.00 | | | | | |
| | TOTALS | 2,305.40 | 100.00 | | | | | | |
| CALCULATED ASSAY | 0.537 | 0.382 | 0.155 | 0.712 |
El Pilar Project Form 43-101F1 Technical Report | |
Table 13-6: Bulk Sample (Qwu) Tail Size Analysis & Assays
| SCREEN | Sample: | Head Bulk Composite | Analytical Results |
| ANALYSIS | Size: | As Received at METCON Research | |
| NOMINAL OPENINGS | Sample
Weights
(kg) | Weight
Distribution
(%) | Cumulative (%) | Copper Assays |
| mm | Inch | Tyler Mesh | Retained | Passing | TCu | ASCu | ResCu | Ratio |
| | 8 | | 0.00 | | | 100.00 | 0.115 | 0.086 | 0.029 | 0.748 |
| 152.4 | 6 | | 32.06 | 1.04 | 1.04 | 98.96 | 0.205 | 0.135 | 0.070 | 0.659 |
| 100.00 | 4 | | 29.34 | 0.95 | 2.00 | 98.00 | 0.190 | 0.106 | 0.084 | 0.558 |
| 75.00 | 3 | | 54.50 | 1.77 | 3.77 | 96.23 | 0.183 | 0.111 | 0.072 | 0.607 |
| 50.00 | 2 | | 103.04 | 3.35 | 7.12 | 92.88 | 0.221 | 0.142 | 0.079 | 0.643 |
| 31.50 | 1 1/4 | | 236.64 | 7.69 | 14.81 | 85.19 | 0.238 | 0.144 | 0.094 | 0.605 |
| 25.00 | 0.984 | 1 | 158.98 | 5.17 | 19.98 | 80.02 | 0.220 | 0.126 | 0.094 | 0.573 |
| 19.00 | 0.748 | 3/4 | 195.92 | 6.37 | 26.34 | 73.66 | 0.205 | 0.111 | 0.094 | 0.541 |
| 12.50 | 0.492 | 1/2 | 311.50 | 10.13 | 36.47 | 63.53 | 0.198 | 0.107 | 0.091 | 0.540 |
| 9.50 | 0.374 | 3/8 | 204.00 | 6.63 | 43.10 | 56.90 | 0.225 | 0.126 | 0.099 | 0.560 |
| 6.30 | 0.248 | 1/4 | 279.00 | 9.07 | 52.17 | 47.83 | 0.258 | 0.139 | 0.119 | 0.539 |
| 1.70 | 0.067 | 10 | 703.50 | 22.87 | 75.04 | 24.96 | 0.201 | 0.108 | 0.093 | 0.537 |
| 1.00 | 0.039 | 16 | 108.23 | 3.52 | 78.55 | 21.45 | 0.217 | 0.106 | 0.111 | 0.488 |
| 0.84 | 0.033 | 20 | 34.90 | 1.13 | 79.69 | 20.31 | 0.240 | 0.109 | 0.131 | 0.454 |
| 0.60 | 0.023 | 28 | 67.14 | 2.18 | 81.87 | 18.13 | 0.257 | 0.115 | 0.142 | 0.447 |
| 0.42 | 0.017 | 35 | 61.90 | 2.01 | 83.88 | 16.12 | 0.279 | 0.122 | 0.157 | 0.437 |
| 0.30 | 0.012 | 48 | 53.40 | 1.74 | 85.62 | 14.38 | 0.298 | 0.132 | 0.166 | 0.443 |
| 0.21 | 0.008 | 65 | 42.85 | 1.39 | 87.01 | 12.99 | 0.294 | 0.118 | 0.176 | 0.401 |
| 0.15 | 0.006 | 100 | 41.04 | 1.33 | 88.35 | 11.65 | 0.297 | 0.126 | 0.171 | 0.424 |
| 0.11 | 0.004 | 150 | 45.76 | 1.49 | 89.83 | 10.17 | 0.278 | 0.108 | 0.170 | 0.388 |
| 0.07 | 0.003 | 200 | 38.63 | 1.26 | 91.09 | 8.91 | 0.486 | 0.104 | 0.382 | 0.214 |
| M I N U S | -200 | 274.15 | 8.49 | 100.00 | | | | | |
| | TOTALS | 3076.48 | 100.00 | | | | | | |
| CALCULATED ASSAY | 0.273 | 0.134 | 0.139 | 0.491 |
El Pilar Project Form 43-101F1 Technical Report | |
Figure 13-4: Chart Comparison Bulk Sample Screen Fractions Head vs. Tails
| | 13.5.3 | Bulk Sample – Crib & Column Loading |
After the sample was recombined, two ~250 tonne concrete bins or cribs at Mineral Park were loaded with the bulk sample using dump trucks. The cribs measure 7.73 m in length by 4.5 m in width by 4.45 m deep and were loaded to a height of 4.0 m. The cribs were first lined with 80 mil plastic liners and the return piping installed. Representative loading of the dump trucks was accomplished by collecting front-end loader bucket loads from around the pile until each truck was fully loaded. Then the trucks were weighed and unloaded into the designated crib, first with the aid of an excavator to form a bed in the bottom of each crib and then by direct end dumping until each crib was filled to the desired level with the bulk sample material. Table 13-7 is a tabulation of bulk sample truck loads and weights for each crib.
El Pilar Project Form 43-101F1 Technical Report | |
Table 13-7: Crib Truck Loads & Weights
| Crib C-01 Loaded Ore Sample | Crib C-02 Loaded Ore Sample |
| Gross (lb) | Tare (lb) | Ore Weight (lb) | Ore Weight (kg) | Gross (lb) | Tare (lb) | Ore Weight (lb) | Ore Weight (kg) |
| 50,440 | 22,660 | 27,780 | 12,627 | 50580 | 22,360 | 28,220 | 12,827 |
| 50,480 | 22,420 | 28,060 | 12,755 | 42,920 | 22,660 | 20,260 | 9,209 |
| 53,860 | 22,520 | 31,340 | 14,245 | 49,660 | 22,720 | 26,940 | 12,245 |
| 50,920 | 22,480 | 28,440 | 12,927 | 49,340 | 23,140 | 26,200 | 11,909 |
| 51,080 | 22,600 | 28,480 | 12,945 | 51,680 | 22,700 | 28,980 | 13,173 |
| 51,620 | 22,520 | 29,100 | 13,227 | 52,020 | 22,700 | 29,320 | 13,327 |
| 52,580 | 22,480 | 30,100 | 13,682 | 52,040 | 22,760 | 29,280 | 13,309 |
| 48,960 | 22,440 | 26,520 | 12,055 | 49,980 | 22,900 | 27,080 | 12,309 |
| 49,760 | 22,500 | 27,260 | 12,391 | 51,520 | 22,660 | 28,860 | 13,118 |
| 45,420 | 22,340 | 23,080 | 10,491 | 50,580 | 22,620 | 27,960 | 12,709 |
| 49,640 | 22,060 | 27,580 | 12,536 | 54,640 | 21,700 | 32,940 | 14,973 |
| 51,540 | 22,040 | 29,500 | 13,409 | 51,020 | 21,860 | 29,160 | 13,255 |
| 47,680 | 21,900 | 25,780 | 11,718 | 50,020 | 21,800 | 28,220 | 12,827 |
| 50,500 | 21,900 | 28,600 | 13,000 | 51,960 | 21,940 | 30,020 | 13,645 |
| 50,380 | 21,960 | 28,420 | 12,918 | 49,140 | 21,980 | 27,160 | 12,345 |
| 52,780 | 22,040 | 30,740 | 13,973 | 53,140 | 22,020 | 31,120 | 14,145 |
| 49,220 | 22,120 | 27,100 | 12,318 | 51,840 | 22,080 | 29,760 | 13,527 |
| 49,320 | 21,980 | 27,340 | 12,427 | 50,980 | 22,100 | 28,880 | 13,127 |
| 49,080 | 21,980 | 27,100 | 12,318 | 49,240 | 22,280 | 26,960 | 12,255 |
| 49,880 | 21,880 | 28,000 | 12,727 | 50,700 | 22,000 | 28,700 | 13,045 |
| 1,005,140 | 444,820 | 560,320 | 254,689 | 1,013,000 | 446,980 | 566,020 | 257,279 |
| | | +3/4 Filter | 279 | | | +3/4 Filter | 281 |
| | | +1 1/4 Filter | 665 | | | +1 1/4 Filter | 635 |
| | | Total Kg | 255,633 | | | Total Kg | 258,195 |
In addition to the cribs, two columns measuring ~6 meter high (20 feet) by 27 inches I.D. were manually loaded with buckets of the bulk sample material, first by weighing an approximate amount of material to fill each column (~3 tonnes) and then by loading each column independently by filling, weighing and dumping individual buckets after net weights were recorded.
| | 13.5.4 | Bulk Sample – Moisture Content |
Material moisture was determined by using a 12.29 kg split from a sample that was collected when the sample was being mixed. The sample was dried in an oven overnight at a temperature of 105 °C and weighed. The result was a dry weight of 11.82 kg and a moisture content of 3.82%.
El Pilar Project Form 43-101F1 Technical Report | |
| | 13.5.5 | Bulk Sample – Crib & Column Acid Precure |
Both the cribs and the columns were precured with acid. For the cribs, two batches of curing solution were prepared by adding 1,070 kg of sulfuric acid to 5,600 liters of liquid for each batch. The batches in two tanks were mixed by recirculation while the acid was added then and thereafter for two hours to ensure solution homogeneity. Assays for free acid were done using Mineral Park assay procedures. The two bins were left to rest for seven days before leaching (see Table 13-8 for crib acid cure details).
Table 13-8: Final Acid Curing Data for MP Cribs
| Crib Acid Cure Details |
| | kg Acid | Assayed Free Acid (g/L) | kg/t acid |
| Crib 1 | 1,001.2 | 100 | 4.08 |
| Crib 2 | 1,103.9 | 130 | 4.45 |
For the columns, a 100 g/L free acid concentration solution was prepared and then pumped to each column at an average rate of 55 l/day. A total of 120 l of solution were pumped onto each column during the 48 hour precure period. Columns were left to rest for 7 days before leaching (see Table 13-9 for column acid cure details).
Table 13-9: Final Acid Curing Data for MP Columns
| Column Acid Cure Details |
| | kg Acid | Assayed Free Acid (g/L) | kg/t acid |
| Column 1 | 11.10 | 96.2 | 3.59 |
| Column 2 | 11.10 | 94.3 | 3.52 |
| | 13.5.6 | Bulk Sample – Leach Parameters & Assay QAQC |
After the precure process was completed, initially the feed solution to the cribs was prepared at 14 g/L of free acid, which was pumped at an average rate of 3.24 L/min. This initial PLS began to flow out of the bins after 3 days. PLS volume was recorded using a flow meter. After three days the cribs were irrigated initially for 120 days at a rate of 5.3 lph/m2 of raffinate solution maintained at an acid concentration of 10 g/l free acid.
For the columns, feed solution was initially pumped using 10g/l of free acid at a rate of 2.3 lph/m2 using a mixture of water and concentrated sulfuric acid. To adjust the acid concentration on the raffinate tank two assays were conducted each time. The raffinate tank was sampled as is, without additional acid added. Tank volume was estimated from the markings on the tank. Acid to be added was then calculated using the data just mentioned. An Avery Weight-Tronix W1-125 analytical scale was used to weight the acid added to the raffinate tank based on calculations.
El Pilar Project Form 43-101F1 Technical Report | |
After three days the columns were irrigated initially for 120 days at a rate of 7.8 lph/m2 of raffinate solution maintained at an acid concentration of 10 g/l free acid.
Originally, one crib (C-01) and one backup column (CL-01) were intended to represent ROM material and the other crib (C-02) and backup column (CL-02) were intended to represent minus 6” crush material. However, the ROM bulk sample had only 1.95% of the weight at size greater than 6 inches in diameter (see Table 13-7) and thus both crib and column samples were essentially treated as ROM duplicates.
PLS and organic (ACORGA extractant and diluent) from each of the closed cycle cribs and columns was fed to a small onsite SX plant at equal flow rates where they were mixed to extract the recovered copper from the PLS. Copper extraction and acid consumption, as well as other factors, were then computed daily for each of the cribs and columns.
Sampling was done on the PLS solutions for copper, total iron, free acid, pH, ORP and ferrous iron. A strict QA-QC program for sample collection and analysis was implemented and supervised independently by metallurgical consultant Terry McNulty. Samples were collected and split into three portions. One portion was assayed by ML at Mineral Park. One out of 10 samples was sent to METCON and a third sample was stored for future use if necessary. Additionally, a weekly composite using 3 ml from daily samples was assembled to be analyzed by ICP for multiple elements by METCON. A total of 68 samples were sent to METCON, 17 samples from each PLS obtained in the test: Crib 1, Crib 2, Column 1, and Column 2. Samples were also assayed for copper and iron.
Standards for both copper and iron were prepared onsite at Mineral Park using a certified 1000 mg/l (BRAND and CERTIFICATION #) solution. The standards were prepared twice during the duration of the test. The first set of standards was prepared on August 13, 2010 with copper concentrations of 5, 10, 20 and 50 ppm. As PLS grade decreased, a second set of standards was required to measure lower concentrations of copper. The second set of standards was prepared on October 19 2010 with the copper concentrations of 1, 3 and 5 ppm.
Samples were analyzed at Mineral Park using a Perkin Elmer Analyst 200 Spectrometer. The wavelength for copper was set at 324.75 nm with a slit opening of 2.7/0.8 mm using a Copper Lumina Hollow Cathode lamp. Air-acetylene flow was 5:1 for copper. A read delay of three seconds was used sample to sample, with an integration time of four seconds. A linear calibration was used as defined from three standards. Samples were diluted according to the standards to be used so that the sample concentration was in the middle of the standard range.
A comparison of the analytical results from METCON and ML exhibits a good correlation between both laboratories for all check assays done at Mineral Park. The correlation coefficient R2 for copper is 0.9946 and the slope is 0.9966, as shown in Figure 13-5.
El Pilar Project Form 43-101F1 Technical Report | |
Figure 13-5: Correlation between METCON and Mercator Copper Assays
| | 13.5.7 | Bulk Sample – 14 Day Bottle Roll Leach Results |
Bottle roll testing was done on the bulk sample for different size screens and for two different crush sizes from the head sample. Tables 13-10 and 13-11 show the results of the 72-hour bottle roll tests on the screen size fractions. The screens have a simple average acid consumption of 12.31 kg per tonne.
El Pilar Project Form 43-101F1 Technical Report | |
Table 13-10: Bulk Sample Bottle Roll Results – Part 1
SUMMARY OF METALLURGICAL RESULTS - PART 1
Ambient 72 hr. Bottle Roll Leach Tests Bulk Sample-All Fractions- Stingray CopperMETCON Research Project No. M-760-02 |
Test
Number | Sample/
Fraction | Total Acid
Consumption | Gangue Acid
Consumption |
Leach | CUMULATIVE
EXTRACTION(%) |
| kg/t | kg/kgCu | kg/t | kg/kg Cu | Time | Cu | Fe |
| | | (hr) | % | % |
| BR-02 | 6 Inch | 9.83 | 7.13 | 7.71 | 5.59 | 0 | 0.00 | 0.00 |
| | | | | | | 2 | 52.25 | 1.01 |
| | | | | | | 4 | 52.46 | 1.08 |
| | | | | | | 6 | 54.58 | 1.14 |
| | | | | | | 24 | 61.01 | 1.43 |
| | | | | | | 48 | 63.82 | 1.80 |
| | | | | | | 72 | 70.14 | 1.92 |
| BR-03 | 4 Inch | 11.88 | 4.20 | 7.51 | 2.66 | 0 | 0.00 | 0.00 |
| | | | | | | 2 | 41.91 | 0.59 |
| | | | | | | 4 | 45.09 | 0.69 |
| | | | | | | 6 | 46.91 | 0.67 |
| | | | | | | 24 | 54.83 | 0.87 |
| | | | | | | 48 | 59.24 | 1.02 |
| | | | | | | 72 | 62.95 | 1.27 |
| BR-04 | 3 Inch | 9.86 | 5.32 | 7.00 | 3.78 | 0 | 0.00 | 0.00 |
| | | | | | | 2 | 34.63 | 0.53 |
| | | | | | | 4 | 40.69 | 0.64 |
| | | | | | | 6 | 43.76 | 0.75 |
| | | | | | | 24 | 50.76 | 1.13 |
| | | | | | | 48 | 55.46 | 1.46 |
| | | | | | | 72 | 59.67 | 1.63 |
| BR-05 | 2 Inch | 10.23 | 6.83 | 7.92 | 5.29 | 0 | 0.00 | 0.00 |
| | | | | | | 2 | 31.02 | 0.67 |
| | | | | | | 4 | 34.48 | 0.77 |
| | | | | | | 6 | 36.82 | 0.96 |
| | | | | | | 24 | 43.98 | 1.22 |
| | | | | | | 48 | 48.05 | 1.63 |
| | | | | | | 72 | 51.34 | 1.89 |
| BR-06 | 11/4 Inch | 12.39 | 6.17 | 9.29 | 4.62 | 0 | 0.00 | 0.00 |
| | | | | | | 2 | 35.73 | 0.63 |
| | | | | | | 4 | 40.26 | 0.74 |
| | | | | | | 6 | 41.99 | 0.78 |
| | | | | | | 24 | 48.61 | 1.04 |
| | | | | | | 48 | 50.70 | 1.59 |
| | | | | | | 72 | 54.81 | 1.52 |
| BR-07 | 1 Inch | 11.20 | 5.82 | 8.23 | 4.28 | 0 | 0.00 | 0.00 |
| | | | | | | 2 | 36.81 | 0.71 |
| | | | | | | 4 | 38.88 | 0.72 |
| | | | | | | 6 | 40.55 | 0.83 |
| | | | | | | 24 | 48.11 | 1.10 |
| | | | | | | 48 | 51.94 | 1.42 |
| | | | | | | 72 | 54.32 | 1.59 |
El Pilar Project Form 43-101F1 Technical Report | |
Table 13-11: Bulk Sample Bottle Roll Results – Part 2
SUMMARY OF METALLURGICAL RESULTS - PART 2
Ambient 72 hr. Bottle Roll Leach Tests Bulk Sample-All Fractions- Stingray CopperMETCON Research Project No. M-760-02 |
Test
Number | Sample/
Fraction | Total Acid
Consumption | Gangue Acid
Consumption |
Leach | CUMULATIVE
EXTRACTION(%) |
| kg/t | kg/kgCu | kg/t | kg/kg Cu | Time | Cu | Fe |
| | | (hr) | % | % |
| BR-08 | 3/4 Inch | 13.13 | 5.20 | 9.23 | 4.22 | 0 | 0.00 | 0.00 |
| | | | | | | 2 | 38.80 | 0.58 |
| | | | | | | 4 | 43.93 | 0.61 |
| | | | | | | 6 | 47.90 | 0.72 |
| | | | | | | 24 | 54.39 | 0.91 |
| | | | | | | 48 | 58.31 | 1.07 |
| | | | | | | 72 | 57.72 | 1.39 |
| BR-09 | 1/2 Inch | 11.82 | 5.76 | 8.65 | 4.22 | 0 | 0.00 | 0.00 |
| | | | | | | 2 | 37.92 | 0.59 |
| | | | | | | 4 | 42.50 | 0.62 |
| | | | | | | 6 | 47.03 | 0.79 |
| | | | | | | 24 | 52.99 | 0.98 |
| | | | | | | 48 | 55.76 | 1.16 |
| | | | | | | 72 | 54.14 | 1.46 |
| BR-10 | 3/8 Inch | 13.37 | 5.22 | 9.41 | 3.67 | 0 | 0.00 | 0.00 |
| | | | | | | 2 | 29.86 | 0.39 |
| | | | | | | 4 | 45.82 | 0.60 |
| | | | | | | 6 | 51.13 | 0.70 |
| | | | | | | 24 | 56.45 | 0.89 |
| | | | | | | 48 | 57.69 | 0.86 |
| | | | | | | 72 | 56.43 | 1.09 |
| BR-11 | 1/4 inch | 12.84 | 5.14 | 8.98 | 3.59 | 0 | 0.00 | 0.00 |
| | | | | | | 2 | 38.40 | 0.39 |
| | | | | | | 4 | 43.38 | 0.48 |
| | | | | | | 6 | 47.31 | 0.57 |
| | | | | | | 24 | 54.62 | 0.90 |
| | | | | | | 48 | 58.31 | 0.79 |
| | | | | | | 72 | 56.10 | 0.81 |
| BR-12 | 10 Mesh | 13.56 | 4.39 | 8.80 | 2.85 | 0 | 0.00 | 0.00 |
| | | | | | | 2 | 33.25 | 0.23 |
| | | | | | | 4 | 38.93 | 0.30 |
| | | | | | | 6 | 43.98 | 0.32 |
| | | | | | | 24 | 51.23 | 0.44 |
| | | | | | | 48 | 53.99 | 0.42 |
| | | | | | | 72 | 55.85 | 0.59 |
| BR-13 | -10 Mesh | 17.60 | 4.04 | 10.88 | 2.50 | 0 | 0.00 | 0.00 |
| | | | | | | 2 | 27.12 | 0.09 |
| | | | | | | 4 | 33.00 | 0.05 |
| | | | | | | 6 | 35.60 | 0.05 |
| | | | | | | 24 | 41.20 | 0.15 |
| | | | | | | 48 | 42.83 | 0.16 |
| | | | | | | 72 | 48.33 | 0.35 |
El Pilar Project Form 43-101F1 Technical Report | |
| | 13.5.8 | Bulk Sample – Crib & Column 120 Day Leach Results |
The metallurgical results from the Mineral Park locked cycle crib and column leaching program are summarized below. After 120 days of leaching, the two cribs averaged 63% extraction of TCu at an average gangue acid consumption rate of 18.2 kg/tonne (see Table 13-12).
Table 13-12: MP Crib & Column Metallurgical Test Results
| Bulk Sample MP Crib & Column 120 Day Leaching Results |
| | Crib C-01 | Crib C-02 | Column CL-01 | Column CL-02 | Average Cribs | Average Columns |
| Copper Extraction % | 64.2 | 61.8 | 55.0 | 53.1 | 63.0 | 54.1 |
| Gangue Acid Consumption Kg/Tonne | 18.8 | 17.6 | 17.4 | 17.3 | 18.2 | 17.3 |
| Acid Consumption Kg Acid/Kg Cu | 5.4 | 5.3 | 5.9 | 6.0 | 5.4 | 6.0 |
| PLS pH | 1.5 | 1.5 | 1.6 | 1.6 | 1.5 | 1.6 |
| ORP (Mv) | 613 | 609 | 589 | 525 | 611 | 557 |
The rate recovery curves for copper for the two cribs and two columns are shown in Figure 13-6.
Figure 13-6: Copper Recovery Curves for Mineral Park Cribs and Columns
Acid consumption curves for the two cribs and two columns are shown in Figure 13-7.
El Pilar Project Form 43-101F1 Technical Report | |
Figure 13-7: Acid Consumption Curves for Mineral Park Cribs and Columns
| | 13.5.9 | Bulk Sample – Crib & Column Leaching Results 120-150 Days |
After 120 days, the MP cribs were allowed to rest for 28 days and then leaching was continued for another 30 days (150 days total) under modified conditions. The modified conditions were to leach Crib 1 the same as before, by adding 10 g/l free acid and irrigating at 5.3 lph/m2, but Crib 2 was treated as a second lift, with the same irrigation rate but the raffinate acid content was controlled at pH 1.6. This was done to assess whether, under pH controlled conditions for C-02, the same rate of continued copper extraction could be attained but at lower acid consumption rate. The concept of free acid vs. pH-controlled acid management will be discussed in a separate section.
After 150 days, both cribs C-01 and C-02 and column CL-01 were rinsed according to a set of tear-down procedures provided by McNulty and then torn down meter by meter. Both cribs were screened at Mineral Park using the same screening plant as the head sample, and a residue sample sent to METCON for tail assaying (see Tables 13-13 and 13-14 below and compare to head screen analysis in Table 13-5).
El Pilar Project Form 43-101F1 Technical Report | |
Table 13-13: C-01 Crib Tail Analysis
| C-01 Tail Screen & Residue Sample Summary Table |
| Fraction | Ore Weight (kg) | % Fraction | Metcon Residue Sample (kg) |
| +6" | 3,547 | 1.38 | 80 |
| -6" to +4" | 7,212 | 2.82 | 93 |
| -4" to +1 1/4" | 53,914 | 21.04 | 316 |
| -1 1/4" to +3/4" | 31,198 | 12.18 | 302 |
| -3/4" | 160,327 | 62.58 | 1,633 |
| TOTAL | 256,198 | 100 | 2,425 |
Table 13-14: C-02 Crib Tail Analysis
| C-02 Tail Screen & Residue Sample Summary Table |
| Fraction | Ore Weight (kg) | % Fraction | Metcon Residue Sample (kg) |
| +6" | 4,137 | 1.56 | 71 |
| -6" to +4" | 6,305 | 2.38 | 91 |
| -4" to +1 1/4" | 49,587 | 18.74 | 311 |
| -1 1/4" to +3/4" | 32,568 | 12.31 | 281 |
| -3/4" | 172,039 | 65.01 | 1,587 |
| TOTAL | 264,635 | 100 | 2,341 |
The results obtained on the bulk sample composite sample for the additional 30 days of leaching are summarized in Table 13-15. Crib C-01 attained an additional 3.2 percentage points of copper recovery for an additional 1.9 kg/tonne acid consumption. Crib C-02 attained an additional 1.9 percentage points of copper recovery for an additional 0.1 kg/tonne acid consumption.
Table 13-15: Summary of Bulk Sample 150 Day Leach Crib & Column Results.
El Pilar Project Locked Cycle ROM Cribs and Column Leach Test Results |
| Crib | | Particle Size ROM P80 (in) | | | | | Assays | | | | |
| | | | | | | | | | | | | | |
| 1 | 4 | 1 1/4 | 166(1) | 5.3 | Feed Solution (l) | 736,150 | 0.11 | 1.72 | 67.9 | 3.9 | 4.1 | 20.7 | 5.7 |
| | | | | | Pregnant Solution (l) | 712,464 | 1.38 | 2.09 | | | | | |
| | | | | | Leach Residue (kg) | 233,069 | 0.183 | 2.35 | | | | | |
| | | | | | Calculated HeaD | | 0.540 | 2.32 | | | | | |
| | | | | | Assays Head (kg) | 245,665 | 0.537 | 2.42 | | | | | |
| 2 | 4 | 1 1/4 | 166(1) | 5.3 | Feed Solution (l) | 719,917 | 0.11 | 1.51 | 63.7 | 1.6 | 4.5 | 17.7 | 5.0 |
| | | | | | Pregnant Solution (l) | 707,714 | 1.35 | 1.687 | | | | | |
| | | | | | Leach Residue (kg) | 239,964 | 0.209 | 2.49 | | | | | |
| | | | | | Calculated HeaD | | 0.556 | 2.45 | | | | | |
| | | | | | Assays Head (kg) | 248,127 | 0.537 | 2.42 | | | | | |
| Column | | | | | | | | | | | | | |
| 1 | 6 | 1 1/4 | 137(2) | 7.8 | Feed Solution (l) | 7,124 | 0.11 | 1.61 | 52.8 | 1.6 | 3.7 | 17.3 | 5.8 |
| | | | | | Pregnant Solution (l) | 6,737 | 1.46 | 1.88 | | | | | |
| | | | | | Leach Residue (kg) | 2,953 | 0.273 | 2.57 | | | | | |
| | | | | | Calculated HeaD | | 0.574 | 2.59 | | | | | |
| | | | | | Assays Head (kg) | 2,975 | 0.537 | 2.42 | | | | | |
| 2 | 6 | 1 1/4 | 180 | 7.8 | | | TBD | | TBD | | 3.5 | TBD | TBD |
| 3 | 6 | 1 1/4 | 180 | 7.8 | | | TBD | | TBD | | 10.4 | TBD | TBD |
Remarks: (1) Includes 7 days of cure, 150 days of leach, 7 days of wash and 2 days of drain cycles. | | |
(2) Includes 7 days of cure, 150 days of leach, 7 days of wash and 2 days of drain cycles. | | |
El Pilar Project Form 43-101F1 Technical Report | |
| | 13.5.10 | Bulk Sample Metallurgical Test Conclusions |
The following can be concluded from results of the locked cycle tests conducted on the bulk sample composite.
| | ● | Run of mine particle size distribution at 80 percent passing 1 ¼ inches did not negatively impact copper extraction and gangue acid consumption compared to 80 percent passing 37.5 mm, 19 mm and irrigation flow rates of 6.1 and 7.8 lph/m2, respectively, using a sulfuric acid cured dosage of 4 kilogram per tonne of material. |
| | ● | The copper extractions on the two composites, C-01 and C-02 ranged from 67.9% to 63.7% and gangue acid consumption ranged from 5.7 to 5.0 kilogram per kilogram of copper extracted (kg/kg Cu), and 20.7 to 17.7 kilogram acid per tonne of material (kg/ tonne) after a total leach cycle of 166 days (including 7 days of cure, 150 days of leach, 7 days of wash and 2 days of drain cycles). |
| | ● | The highest copper extraction of approximately 71 percent was achieved at the size distribution of minus 3/4 inches on the crib C-01. |
| | ● | The lowest copper extraction of approximately of 43.5 percent was achieved at the size distribution of plus 3/4 inches on the crib C-02. |
| | ● | Percolation problems were not observed in the cribs during the leach cycle. |
| | ● | There is a good correlation between the calculated head and assay head for copper and iron. |
During tear down of the cribs and especially column Cl-01, it was noted that the upper approximately three meters of the cribs and column Cl-01 had very little visible oxide copper after leaching. However, below three meters, and especially in the six meter tall Column Cl-01 very significant amounts of unleached oxide copper were noted on fragment surfaces. To test whether or not this oxide copper was indeed leachable, samples were leached in beakers at Hazen Laboratories in Denver for three days at a pH of 1.6. Within three days all of the visible oxide copper was dissolved.
Sequential copper analyses on the head and leach residue samples were used to calculate the acid soluble copper, residual copper, and calculated total copper extractions for layers one meter thick. These results are summarized in Table 13-16.
El Pilar Project Form 43-101F1 Technical Report | |
Table 13-16: Summary of Crib Results Sequential Copper Extraction per Layer
| MERCATOR MINERALS INC. | | | SUMMARY OF RESULTS | |
| RECURSOS STINGRAY DE COBRE S.A. DE C.V. | | CU EXTRACTION PER LAYER | |
| | TEST No.: | C-01 and C-02 | | | CRUSH SIZE : | ROM | | |
| | SAMPLE : | ROM "Bulk Sample" | | | | | |
| Copper Extraction vs Depth | | | | | | | |
| Locked Cycle Crib Evaluation | | | | | | |
| | | Sample | Sequential Copper | Calculated Extraction |
Head sequential Copper | ID | ASCu | ResCu | TCu | ASCu | ResCu | TCu |
| | | Bulk Sample | 0.382 | 0.155 | 0.537 | | | |
Residue sequential Copper | C-01 | | | | | | |
| Layers | | L-01 | 0.033 | 0.072 | 0.12 | 91.3% | 53.1% | 77.75 |
| | | L-02 | 0.041 | 0.101 | 0.16 | 89.2% | 34.6% | 70.60 |
| | | L-03 | 0.063 | 0.114 | 0.20 | 83.5% | 26.5% | 63.42 |
| | | L-04 | 0.069 | 0.130 | 0.22 | 82.1% | 15.9% | 59.03 |
Residue sequential Copper | C-02 | | | | | | |
| Layers | | L-01 | 0.035 | 0.089 | 0.14 | 91.0% | 42.4% | 74.73 |
| | | L-02 | 0.054 | 0.115 | 0.18 | 85.8% | 25.8% | 65.57 |
| | | L-03 | 0.106 | 0.128 | 0.26 | 72.2% | 17.3% | 51.12 |
| | | L-04 | 0.122 | 0.120 | 0.278 | 68.0% | 22.4% | 48.187 |
The following comments relate to the calculated acid soluble copper, cyanide soluble copper and total residual copper extractions on the bulk sample composite samples C-01 and C-02.
| | ● | Acid soluble copper extraction ranged from the top (1 m) to the bottom (4 m), from 91% to 82% on C-01 and 91% to 68% on C-02, respectively. |
| | ● | Residual copper extraction ranged from the top (1 m) to the bottom (4 m),, from 53% to 16% on C-01 and 42% to 22% on C-02, respectively. |
| | ● | Calculated copper extraction ranged from the top (1 m) to the bottom (4 m), from 78% to 59% on C-01 and 75% to 48% on C-02, respectively. |
| | ● | The metallurgical data developed from this analysis indicated that the distance below surface did impact the acid soluble copper and total copper extractions, with the best recoveries being obtained in the upper three meters of the cribs and columns. |
In conclusion, copper recoveries from the bulk sample metallurgical tests at Mineral Park, and in particular the large sample crib copper recovery results, are interpreted to indicate that ROM leaching of the El Pilar should attain comparable recoveries to those predicted by the Stingray 2009 columns.
El Pilar Project Form 43-101F1 Technical Report | |
The results suggest that, if thin lifts on the order of three meters high are used at El Pilar, significantly better copper recoveries than those attained in the crib and column tests may be realized. Alternative interpretations are that (1) a longer leach time may have dissolved more copper from the lowest layer, and/or (2) more thorough precuring with better contact and a larger volume of curing solution may have improved the copper extraction from the lowest layer.
The impact of treating crib C-02 as a second lift and by managing raffinate pH rather than free acid content shows that copper recoveries similar to the test results may be attained in real operations with lower acid consumption rates. This is discussed separately in a later section.
| 13.6 | Five METCON Columns to Back-up the MP Bulk Sample Crib and Column Tests |
This section has not been modified from the 2011 Study, and is still reliable and current. Five additional columns were run at the METCON Tucson facility in 2010 and 2011 using material from the Bulk Sample already included in the two columns and two crib tests at MP. The objectives of the five METCON column tests were as follows:
| | 1. | Provide backup data for the Mineral Park crib and column tests. |
| | 2. | Evaluate the effect of crush size on copper recovery and acid consumption. |
| | 3. | Evaluate the effect of raffinate type on copper recovery and acid consumption. |
| | 4. | Evaluate the effect of column aeration on copper recovery and acid consumption. |
The five METCON columns were 203.20 mm in diameter by 6.0 m in height. The columns were run under locked cycle conditions at an acid strength of 10 gpl and at an irrigation rate of 5.3 l/hr. The results of leaching the five backup columns for 120 days are summarized in Table 13-17.
Table 13-17: METCON 5 Column Bulk Sample 120 Day Metallurgical Test Results
| METCON 5 Column 120 Day Leach Results on MP Bulk Sample |
| | Column CL-01 | Column CL-02 | Column CL-03 | Column CL-04 | Column CL-05 | Average |
| Column Parameters | P80 0.75"
Artificial Raffinate | P80 0.75" Mature Raffinate | P100 3" Mature Raffinate & Aeration | P100 3" Mature Raffinate | P100 3" Artificial Raffinate | |
| Copper Extraction % | 60.5 | 59.3 | 63.9 | 61.5 | 62.7 | 61.6 |
Gangue Acid Consumption Kg/Tonne | 15.6 | 15.4 | 17.2 | 16.7 | 16.8 | 16.3 |
| Acid Consumption Kg Acid/Kg Cu | 4.7 | 4.8 | 4.7 | 4.8 | 4.7 | 4.7 |
| PLS pH | 2.1 | 2.0 | 1.5 | 1.4 | 1.5 | 1.7 |
| ORP (Mv) | 468 | 480 | 521 | 508 | 520 | 499 |
El Pilar Project Form 43-101F1 Technical Report | |
As backup tests, the five METCON column leach tests resulted in copper recoveries and acid consumptions that essentially duplicated those of the MP cribs, such that the average 120 day extraction of 61.6% copper from the five backup columns is very close to the MP crib average of 63% copper recovery and the gangue acid consumption of the five METCON columns averaged 16.3 kg/tonne compared to 18.2 kg/tonne for the MP cribs, respectively.
As a matter of history regarding some of the duplicate column strategy, the original five yearly composite columns run by METCON/Stingray in 2009 were run using “mature raffinate”. In this case, the mature raffinate used by METCON was from the nearby Silver Bell mine chalcocite copper heap leach operation in Arizona. Because this raffinate was from a mature sulfide bioleach pad, it contains ferric iron in solution. The concern was that using a mature raffinate on the El Pilar samples could conceivably result in enhanced recoveries not otherwise obtainable if natural El Pilar raffinate was allowed to mature. Accordingly, duplicate columns were run at METCON using “mature” raffinate from Silver Bell and “artificial” raffinate that was composed only of acid and water, similar to new mine startup conditions.
Two crush sizes were run in the columns at minus ¾” and minus 3” to evaluate the effect of crush size on copper recovery and acid consumption. One column was run using aeration to see if better copper recoveries might be attainable under more oxygenated column (pad) conditions.
The results of the five column leach tests show that crush size, aeration and raffinate type have little or no effect on copper recovery or acid consumption. In fact, the best overall recoveries were on the coarsest material, again supporting the plan to use ROM leaching at El Pilar.
Leaching of the five backup columns was continued at METCON beyond 120 days. This was done in an effort to look at what might be a real economic leach cycle for the El Pilar ores. The 180 day results are tabulated below in Table 13-18. On the average, the additional 60 days of leaching netted almost an extra 10 percentage points of additional copper recovery, or a very significant 15.9% average increase in copper recovery over the 120 day results. The gangue acid consumption during the same period added 7 kg/tonne of additional acid consumption for that ~15% increase in copper recovery.
El Pilar Project Form 43-101F1 Technical Report | |
Table 13-18: METCON 5 Column Bulk Sample 180 Day Metallurgical Test Results
| METCON 5 Column 180 Day Leach Results on MP Bulk Sample |
| | Column CL-01 | Column CL-02 | Column CL-03 | Column CL-04 | Column CL-05 | Average |
| Column Parameters | P80 0.75" Artificial Raffinate | P80 0.75"
Mature Raffinate | P100 3" Mature Raffinate & Aeration | P100 3" Mature Raffinate | P100 3" Artificial Raffinate | |
| Copper Extraction % | 73.5 | 73.2 | 70.8 | 69.0 | 70.3 | 71.4 |
Gangue Acid Consumption Kg/Tonne | 23.7 | 22.9 | 22.3 | 23.6 | 23.3 | 23.2 |
| Acid Consumption Kg Acid/Kg Cu | 5.8 | 5.6 | 5.4 | 5.9 | 5.7 | 5.7 |
| PLS pH | 1.7 | 1.7 | 1.6 | 1.6 | 1.6 | 1.7 |
| ORP (Mv) | 480 | 491 | 642 | 525 | 640 | 556 |
For information purposes, a complete report of this 5 column program was prepared by METCON but is not included herein.
| 13.7 | Thirteen Columns – Additional Metallurgical Work 2010-2011 |
This section has not been modified from the 2011 Study, and is still reliable and current. In order to develop the best estimate of copper recovery for the El Pilar deposit, 13 additional metallurgical samples were composited from drill core in 2010 for column testing at METCON. The objective of the columns was to determine if there is a deposit-wide relationship between soluble copper grades and copper recovery and to define a mathematical grade-recovery relationship for copper recovery modeling purposes.
| | 13.7.2 | Thirteen Columns - Composite Selection |
To develop the data needed to define the El Pilar copper grade-recovery relationship, the 13 columns were composited on the basis of targeted copper grade “bins” (see Table 13-19). A majority of the new column composites (Columns #’s 2, 3, 5, 6, 8, 9, 10 and 11) where selected on the basis of Ratio (%ASCu/%TCu) grade bins that were not represented/tested by the previous metallurgical work (this work included the original 5 Stingray composites and the MP/METCON bulk sample).
Three columns were selected on the basis of TCu (total copper) grade bins around the 0.15% TCu cutoff grade used for the 2009 reserve calculation. Column #1 was selected on the basis of rock type, in the breccia, to assess the copper recovery and acid consumption of this unit. Except for the breccia, the column composites were targeted from throughout the deposit to be as representative as possible by splitting the deposit vertically into thirds by bench elevation (1375 1275 m, 1265-1165 m & 1155-1055 m). To ensure that samples were representative, the
El Pilar Project Form 43-101F1 Technical Report | |
theoretical target copper grade for each bin was determined using MineSight to average all of the blocks within those bench elevations for the selected grade bins.
El Pilar Project Form 43-101F1 Technical Report | |
Table 13-19: Composite Selection Criteria for Thirteen New Columns
| Grade Bins - For 2011 Metallurgical Columns Composite Selection |
| Category | Grade
Bin | Data? | New
Column # |
Composite Selection Bench Range | Target - from Average Bench Grades |
AVG
TCu | AVG
ASCu | AVG
ResCu | AVG
Ratio |
| Rock Type | NA - IBX | No | 1 | Column #1 - Equally Distributed in IBX | 0.396 | 0.210 | 0.186 | 52.8% |
| % ASCu (Ratio) | .65 - .70 | Yes | | Not needed | - | - | - | - |
| % ASCu (Ratio) | .60 - .65 | Yes | | Not needed | - | - | - | - |
| % ASCu (Ratio) | .55 - .65 | Yes | | Not needed | - | - | - | - |
| % ASCu (Ratio) | .50 - .55 | Yes | | Not needed | - | - | - | - |
| % ASCu (Ratio) | .45 - .50 | No | 2 | Column #2 from 1265-1165 | 0.307 | 0.147 | 0.160 | 47.8% |
| % ASCu (Ratio) | .45 - .50 | No | 3 | Column #3 from 1375-1275 | 0.307 | 0.147 | 0.160 | 47.8% |
| % ASCu (Ratio) | .40 - .45 | No | 4 (IS*) | Column #4 from 1265-1165 | 0.291 | 0.132 | 0.159 | 45.4% |
| % ASCu (Ratio) | .40 - .45 | No | 5 | Column #5 from 1375-1275 | 0.291 | 0.132 | 0.159 | 45.4% |
| % ASCu (Ratio) | .35 - .40 | No | 6 | Column #6 from 1265-1165 | 0.273 | 0.110 | 0.163 | 40.2% |
| % ASCu (Ratio) | .35 - .40 | No | 7 (IS*) | Column #7 from 1375-1275 | 0.273 | 0.110 | 0.163 | 40.2% |
| % ASCu (Ratio) | .30 - .35 | No | 8 & 8A | Column #8 & 8A from 1265-1055 | 0.259 | 0.090 | 0.169 | 34.9% |
| % ASCu (Ratio) | .25 - .30 | No | 9 | Column #9 from 1155-1055 | 0.263 | 0.082 | 0.181 | 31.1% |
| % ASCu (Ratio) | .20 -.25 | No | 10 | Column #10 from 1155-1055 | 0.254 | 0.063 | 0.191 | 24.9% |
| % ASCu (Ratio) | .15 -.20 | No | 11 | Column #11 from 1155-1055 | 0.257 | 0.055 | 0.202 | 21.5% |
| %TCu | .20 - .25 | No | 12 | Column#12 from 1375-1275 | 0.223 | 0.093 | 0.130 | 41.9% |
| %TCu | .15 - .20 | No | 13 | Column#13 from 1375-1275 | 0.174 | 0.049 | 0.126 | 27.9% |
| %TCu | .10 - .15 | No | 14 | Column #14 from throughout deposit. | 0.132 | 0.022 | 0.110 | 16.7% |
| *Note - IS denotes Insufficient Sample | | | | | | |
El Pilar Project Form 43-101F1 Technical Report | |
The 13 samples were composited irrespective of host sediment lithology, due to the work discussed previously that shows that acid soluble copper grades have no apparent relationship to host lithology. Originally, 14 columns were identified to be composited but there was insufficient sample material to composite Columns 4 & 7. Columns 8 and 8a were constructed from the same sample to determine the effect of raffinate temperature on copper recovery.
| | 13.7.3 | Thirteen Columns - Sample Collection QAQC |
A majority of the material for the new composites was comprised of HQ core. The selection, bagging and shipping of these materials was supervised onsite by Rodolfo Sauceda, an independent geologist who was contracted from Resource Geosciences Hermosillo to oversee compositing QAQC. A complete QAQC report of the program was written by Sauceda and that report is summarized briefly herein.
It should be noted that, because some of the targeted composite intervals had been used previously for the original five Stingray composites, some of the material used for the composites were -10 mesh rejects from the previous metallurgical testing. Sauceda in his report summarizes the following sample collection procedures:
| | 1. | The Mineral Park Mine in Kingman, Arizona sent 204 barrels with drill core rejects from previous column tests to the core shack yard at El Pilar. |
| | 2. | The drill core splits were also taken from the same core shack located at San Lazaro ejido outside of Nogales. |
| | 3. | A clearly identified space was allocated for each column in the core shack yard in order to put together the samples for each composite. |
| | 4. | Local staff, under the onsite supervision of the author (Sauceda), identified each sample in the barrels of crushed material or from drill hole cores based on the sample list provided by ML and placed them in their respective site columns (pallets) in the core shack. |
| | 5. | At the end of this process, complete selections of the samples for each column were organized in the respective areas properly identified in the yard. |
| | 6. | Each sample was then weighed and the weights recorded to calculate the combination of weights and copper grade parameters required for each composite. This compilation process was overseen on site by ML. |
| | 7. | After obtaining the proper combination for each composite according to the targets requested by ML, the selected samples were packed in large properly identified plastic bags. |
| | 8. | Finally, the plastic sacks were packed on pallets and then properly secured with plastic strips. |
| | 9. | ML staff subsequently sent the pallets with the selected samples by column to METCON Research Inc. for sample preparation and further metallurgical testing in Tucson. |
| | 10. | The work program resulted in the collection of 688 samples packed in individual plastic bags to make 13 sample composites with a total weight of 5,002.8 kg packed in 13 pallets containing 154 plastic sacks. |
El Pilar Project Form 43-101F1 Technical Report | |
| | 13.7.4 | Thirteen Columns - Sample Locations & Final Composite Assays |
The pit locations and distribution of samples that make up each of the 13 composites are shown in the following figures (Figures 13-8 to 13-19).
Figure 13-8: Sample Composite Locations – Column #1
Figure 13-9: Sample Composite Locations – Column #2
El Pilar Project Form 43-101F1 Technical Report | |
Figure 13-10: Sample Composite Locations – Column #3
Figure 13-11: Sample Composite Locations – Column #5
El Pilar Project Form 43-101F1 Technical Report | |
Figure 13-12: Sample Composite Locations – Column #6
Figure 13-13: Sample Composite Locations – Column #8
El Pilar Project Form 43-101F1 Technical Report | |
Figure 13-14: Sample Composite Locations – Column #9
Figure 13-15: Sample Composite Locations – Column #10
El Pilar Project Form 43-101F1 Technical Report | |
Figure 13-16: Sample Composite Locations – Column #11
Figure 13-17: Sample Composite Locations – Column #12
El Pilar Project Form 43-101F1 Technical Report | |
Figure 13-18: Sample Composite Locations – Column #13
Figure 13-19: Sample Composite Locations – Column #14
The final composites from drill core/pulps for the 13 columns are tabulated in Table 13-20.
El Pilar Project Form 43-101F1 Technical Report | |
Table 13-20: 13 Column Final Composite Assays
| Final Composite Assays - 13 Columns |
| | Weight (kg) | TCu | ASCu | Ratio | ResCu |
| COLUMN 1 | 380.4 | 0.307 | 0.189 | 0.616 | 0.118 |
| COLUMN 2 | 388.2 | 0.314 | 0.145 | 0.461 | 0.169 |
| COLUMN 3 | 388.0 | 0.325 | 0.147 | 0.451 | 0.179 |
| COLUMN 5 | 385.0 | 0.308 | 0.128 | 0.415 | 0.180 |
| COLUMN 6 | 383.9 | 0.275 | 0.105 | 0.380 | 0.171 |
| COLUMN 8 | 385.1 | 0.257 | 0.085 | 0.329 | 0.173 |
| COLUMN 8-A | 390.2 | 0.280 | 0.088 | 0.315 | 0.192 |
| COLUMN 9 | 383.2 | 0.278 | 0.072 | 0.258 | 0.206 |
| COLUMN 10 | 381.5 | 0.260 | 0.063 | 0.244 | 0.197 |
| COLUMN 11 | 380.2 | 0.252 | 0.048 | 0.192 | 0.203 |
| COLUMN 12 | 385.7 | 0.231 | 0.102 | 0.441 | 0.129 |
| COLUMN 13 | 379.8 | 0.169 | 0.052 | 0.306 | 0.117 |
| COLUMN 14 | 391.6 | 0.139 | 0.022 | 0.157 | 0.117 |
| Total/Average | 5,002.8 | 0.261 | 0.096 | 0.351 | 0.165 |
| | 13.7.5 | Thirteen Columns - Leach Parameters |
The 13 columns were leached at METCON according to the following leaching conditions:
| | ● | Irrigation rate: 7.8 lph/m2. |
| | ● | Column height: 6 m (20 ft). |
| | ● | Curing: 4 kg of sulfuric acid per tonne, trickle down curing, |
| | ● | Feed acid concentration: 10 g/l, |
| | ● | Leach solution: fresh (water + acid) |
| | ● | Leach cycle: locked, 180 days |
| | ● | Column #8-A was run with heated solution, at a temperature of 650F. |
| | ● | Because the columns started out for the first ~20 days at high pH levels, due to an insufficient cure dosage, concentrated sulfuric acid was added to the feed by METCON, until the pregnant solution pH was at 2 or below. |
| | 13.7.6 | Thirteen Columns - Bottle Roll Results |
Bottle rolls were conducted on each of the column head samples using material ground to minus 10 mesh. The results of the bottle roll analysis are tabulated in Tables 13-21 and 13-22.
El Pilar Project Form 43-101F1 Technical Report | |
Table 13-21: 13 Column Bottle Rolls Columns 1 – 7
SUMMARY OF METALLURGICAL RESULTS (1) Ambient 72 hr. Bottle Roll Leach Tests (Pulverized) Stingray CopperMETCON Research Project No. M-760-03 |
Test
Number | Sample | Total Acid | Gangue Acid |
Leach | CUMULATIVE
EXTRACTION(%) |
| kg/t | kg/kgCu | kg/t | kg/kg Cu | Time | Cu | Fe |
| | | (hr) | % | % |
| BR-01 | Column 1 | 42.01 | 16.48 | 38.07 | 14.94 | 0 | 0.00 | 0.00 |
| | | | | | | 2 | 24.88 | 12.49 |
| | | | | | | 4 | 49.04 | 16.68 |
| | | | | | | 6 | 64.72 | 17.10 |
| | | | | | | 24 | 66.90 | 17.82 |
| | | | | | | 48 | 69.46 | 18.93 |
| | | | | | | 72 | 75.39 | 16.88 |
| BR-02 | Column 2 | 33.02 | 20.47 | 30.53 | 18.93 | 0 | 0.00 | 0.00 |
| | | | | | | 2 | 26.96 | 13.32 |
| | | | | | | 4 | 42.47 | 15.32 |
| | | | | | | 6 | 47.61 | 16.84 |
| | | | | | | 24 | 49.53 | 16.45 |
| | | | | | | 48 | 51.21 | 18.16 |
| | | | | | | 72 | 52.20 | 19.63 |
| BR-03 | Column 3 | 25.95 | 17.97 | 23.72 | 16.43 | 0 | 0.00 | 0.00 |
| | | | | | | 2 | 23.15 | 10.28 |
| | | | | | | 4 | 38.98 | 11.86 |
| | | | | | | 6 | 42.62 | 12.46 |
| | | | | | | 24 | 44.07 | 12.15 |
| | | | | | | 48 | 44.56 | 13.91 |
| | | | | | | 72 | 44.79 | 15.83 |
| BR-04 | Column 5 | 30.31 | 22.72 | 28.25 | 21.18 | 0 | 0.00 | 0.00 |
| | | | | | | 2 | 21.60 | 10.07 |
| | | | | | | 4 | 38.62 | 12.08 |
| | | | | | | 6 | 41.73 | 12.53 |
| | | | | | | 24 | 43.01 | 12.43 |
| | | | | | | 48 | 43.10 | 13.50 |
| | | | | | | 72 | 45.62 | 14.99 |
| BR-05 | Column 6 | 29.93 | 27.44 | 28.25 | 25.90 | 0 | 0.00 | 0.00 |
| | | | | | | 2 | 21.35 | 7.84 |
| | | | | | | 4 | 34.16 | 9.12 |
| | | | | | | 6 | 37.87 | 9.58 |
| | | | | | | 24 | 40.61 | 9.59 |
| | | | | | | 48 | 40.54 | 10.28 |
| | | | | | | 72 | 41.35 | 11.08 |
| BR-06 | Column 8-8A | 28.65 | 33.63 | 27.33 | 32.09 | 0 | 0.00 | 0.00 |
| | | | | | | 2 | 11.73 | 8.63 |
| | | | | | | 4 | 25.18 | 10.13 |
| | | | | | | 6 | 29.39 | 10.76 |
| | | | | | | 24 | 31.01 | 10.60 |
| | | | | | | 48 | 32.01 | 11.26 |
| | | | | | | 72 | 33.87 | 12.33 |
| BR-07 | Column 9 | 24.29 | 31.54 | 23.10 | 30.00 | 0 | 0.00 | 0.00 |
| | | | | | | 2 | 10.63 | 7.69 |
| | | | | | | 4 | 22.76 | 8.66 |
| | | | | | | 6 | 25.86 | 9.18 |
| | | | | | | 24 | 27.70 | 9.05 |
| | | | | | | 48 | 28.64 | 10.90 |
| | | | | | | 72 | 29.00 | 10.78 |
El Pilar Project Form 43-101F1 Technical Report | |
SUMMARY OF METALLURGICAL RESULTS (2) Ambient 72 hr. Bottle Roll Leach Tests (Pulverized) Stingray CopperMETCON Research Project No. M-760-03 |
| BR-08 | Column 10 | 26.65 | 43.96 | 25.71 | 42.42 | 0 | 0.00 | 0.00 |
| | | | | | | 2 | 8.28 | 7.33 |
| | | | | | | 4 | 19.31 | 8.22 |
| | | | | | | 6 | 22.32 | 8.66 |
| | | | | | | 24 | 23.85 | 8.70 |
| | | | | | | 48 | 25.81 | 9.76 |
| | | | | | | 72 | 25.53 | 10.10 |
| BR-09 | Column 11 | 29.72 | 65.46 | 29.02 | 63.92 | 0 | 0.00 | 0.00 |
| | | | | | | 2 | 6.38 | 7.90 |
| | | | | | | 4 | 16.40 | 8.99 |
| | | | | | | 6 | 18.41 | 9.43 |
| | | | | | | 24 | 20.98 | 9.22 |
| | | | | | | 48 | 23.30 | 10.58 |
| | | | | | | 72 | 21.43 | 10.57 |
| BR-10 | Column 12 | 40.43 | 28.88 | 38.27 | 27.34 | 0 | 0.00 | 0.00 |
| | | | | | | 2 | 10.99 | 14.20 |
| | | | | | | 4 | 37.24 | 16.96 |
| | | | | | | 6 | 37.41 | 18.75 |
| | | | | | | 24 | 50.72 | 18.20 |
| | | | | | | 48 | 51.08 | 19.42 |
| | | | | | | 72 | 48.54 | 20.02 |
| BR-11 | Column 13 | 37.27 | 77.46 | 36.53 | 75.91 | 0 | 0.00 | 0.00 |
| | | | | | | 2 | 3.90 | 11.07 |
| | | | | | | 4 | 20.40 | 14.52 |
| | | | | | | 6 | 27.76 | 15.73 |
| | | | | | | 24 | 30.51 | 15.91 |
| | | | | | | 48 | 34.41 | 17.44 |
| | | | | | | 72 | 30.21 | 18.35 |
| BR-12 | Column 14 | 42.29 | 141.05 | 41.82 | 139.51 | 0 | 0.00 | 0.00 |
| | | | | | | 2 | 2.31 | 46.19 |
| | | | | | | 4 | 11.57 | 53.70 |
| | | | | | | 6 | 13.31 | 57.21 |
| | | | | | | 24 | 19.77 | 58.75 |
| | | | | | | 48 | 20.14 | 65.32 |
| | | | | | | 72 | 18.37 | 67.00 |
| | 13.7.7 | Thirteen Columns - Laboratory QAQC |
The 13 column leach tests and assaying were conducted at METCON Laboratories in Tucson using in-house QAQC procedures summarized in a separate report - these procedures will not be summarized further herein.
| | 13.7.8 | Thirteen Columns - Results |
The results of leaching the 13 columns are shown below for both 120 days of leaching (Table 13-23) and for 180 days of leaching (Table 13-24). The following tabulations are based on daily
El Pilar Project Form 43-101F1 Technical Report | |
column leach data for the 13 columns and not on tail results. Leaching of the columns was completed during the writing of this report, but column tear down and tail results were not yet available.
El Pilar Project Form 43-101F1 Technical Report | |
Table 13-23: 13 Columns 120 Day Leach Data
| 13 Column METCON - 120 Day Leach Results |
| Column Number | Column CL-01 | Column CL-02 | Column CL-03 | Column CL-05 | Column CL-06 | Column CL-08 | Column CL-08A | Column CL-09 | Column CL-10 | Column CL-11 | Column CL-12 | Column CL-13 | Column CL-14 | Average |
| Copper Extraction % | 69.9 | 60.9 | 52.8 | 64.3 | 53.1 | 46.4 | 45.2 | 37.3 | 40.5 | 32.9 | 52.5 | 39.9 | 22.3 | 47.5 |
| Gangue Acid Consumption Kg/Tonne | 31.2 | 22.8 | 17.8 | 20.9 | 26.6 | 24.1 | 22.2 | 21.9 | 22.5 | 22.2 | 22.4 | 25.0 | 24.7 | 23.4 |
| Acid Consumption Kg Acid/Kg Cu | 14.2 | 12.6 | 10.5 | 12.4 | 19.2 | 20.0 | 18.9 | 20.4 | 24.3 | 29.5 | 16.4 | 40.4 | 72.8 | 24.0 |
| PLS pH | 1.9 | 1.6 | 1.4 | 1.5 | 1.6 | 1.5 | 1.5 | 1.5 | 1.6 | 1.6 | 1.5 | 1.5 | 1.6 | 1.6 |
| ORP (Mv) | 433 | 557 | 500 | 460 | 567 | 579 | 577 | 460 | 462 | 463 | 456 | 471 | 474 | 497 |
Table 13-24: 13 Columns 180 Day Leach Data
| 13 Column METCON - 180 Day Leach Results |
| Column Number | Column CL-01 | Column CL-02 | Column CL-03 | Column CL-05 | Column CL-06 | Column CL-08 | Column CL-08A | Column CL-09 | Column CL-10 | Column CL-11 | Column CL-12 | Column CL-13 | Column CL-14 | Average |
| Copper Extraction % | 77.2 | 65.4 | 57.2 | 69.4 | 58.4 | 51.1 | 50.5 | 42.0 | 46.3 | 38.2 | 57.1 | 45.3 | 27.1 | 52.7 |
| Gangue Acid Consumption Kg/Tonne | 41.9 | 31.3 | 22.7 | 27.5 | 36.4 | 31.4 | 31.3 | 29.8 | 30.3 | 30.4 | 29.8 | 32.0 | 32.2 | 31.3 |
| Acid Consumption Kg Acid/Kg Cu | 17.2 | 16.1 | 12.3 | 15.1 | 23.9 | 23.6 | 23.8 | 24.7 | 28.5 | 34.8 | 20.1 | 45.6 | 77.7 | 28.0 |
| PLS pH | 1.7 | 1.5 | 1.4 | 1.5 | 1.5 | 1.5 | 1.5 | 1.5 | 1.5 | 1.5 | 1.5 | 1.5 | 1.5 | 1.5 |
| ORP (Mv) | 476 | 616 | 638 | 616 | 639 | 652 | 625 | 666 | 666 | 615 | 666 | 548 | 603 | 617 |
El Pilar Project Form 43-101F1 Technical Report | |
Figures 13-21 through 13-23 show cumulative copper extraction, gangue acid consumption and PLS pH, respectively.
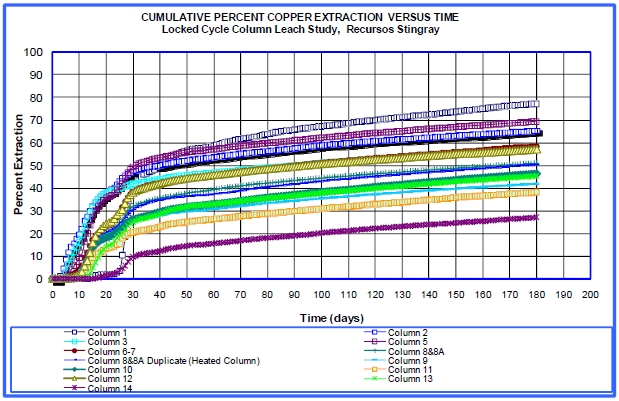 Figure 13-20: 13 Columns Cumulative Copper Extraction
Figure 13-21: 13 Columns Gangue Acid Consumption
El Pilar Project Form 43-101F1 Technical Report | |
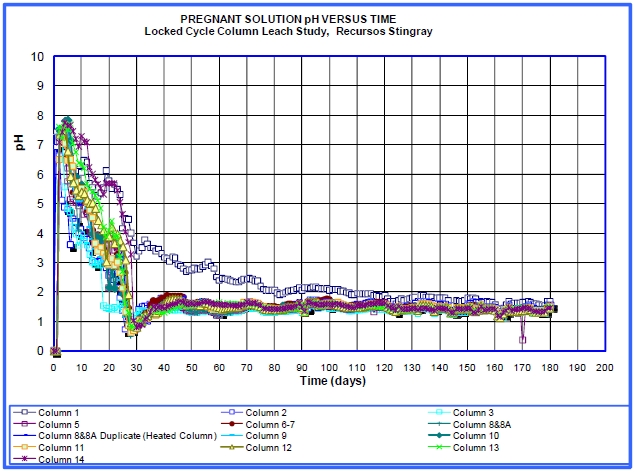
Figure 13-22: 13 Columns PLS pH
Results of the 13 column leach tests are as follows:
| | 1. | Recovery of TCu averaged 47.5% at 120 days and 52.7% at 180 days. |
| | 2. | Recovery of TCu is directly proportional to TCu grade. |
| | 3. | Recovery of TCu is directly proportional to the sample Ratio: the correlation coefficient between %ASCu and column recovery is 0.9436. |
| | 4. | Acid consumption averaged 23.4 kg/t at 120 days and 31.3 kg/t at 180 days. |
| | 5. | There is no apparent relationship between gangue acid consumption and copper grade: the correlation coefficient between gangue acid consumption and the Ratio (percentage of ASCu) is 0.2639. |
Again, it should be noted that the material for these columns was selected on the basis of grade bins, in an attempt to define a grade-recovery relationship, and as such these column recovery results are not intended to be indicative of overall average deposit recovery. This is discussed in more detail in a following section.
| 13.8 | METSIM Copper Recovery and Acid Consumption Projections |
This section has not been modified from the 2011 Study, and is still reliable and current. Based on an evaluation of column leach test data of 120-155 day duration, it appeared that the optimal leach cycle should be about 180 days. In order to evaluate the effect of a 180 day leach cycle without 180 day test data, METCON was retained to make the appropriate projections using
El Pilar Project Form 43-101F1 Technical Report | |
METSIM, the industry accepted computer model for such metallurgical recovery projections. The new projections were to augment others completed by METCON in 2009 using data from the original five Stingray columns. During the modeling, 200 day data became available from the Mineral Park cribs.
The results of the 180 day METSIM projections are tabulated below (see Tables 13-25 - 13-27): It should be noted that, due to project timing, the projections for the 2010 and 2011 columns and crib tests are based on daily solution data, not on tear down calculated head results, and on 155 days of actual leach data for the 13 columns, not on finalized 180 day leach data.
Table 13-25: METSIM Metallurgical Projections for Five Yearly Composites
Stingray Resources Inc. - El Pilar Project
Locked Cycle Column Leach Study On Starter Pit Composite SampleCrush Size & Irrigation Flow Rate Versus Copper ExtractionMETCON PROJECT No. M679-03 |
| | | | | | | | | | | | Copper Extraction
(%) | Gangue Acid Consumption |
| Test No. | Sample ID | Test Charge Grade (%) | Crush Size P80 (mm) | Irrigation Flow Rate (lph/sq m) | Cure | Leach
Cycle (Days) | PLS
Grade
(gpl) | Projected | Actual(1) | Projected | Actual(1) |
| Total | Soluble | Recoverable | Dosage (kg/t) | Time (Days) | Projected | Actual(1) | (kg/t) | (kg/kg Cu) |
| CL-35 | Year 1 | 0.434 | 0.314 | 72.35023041 | 37.5 | 6.11 | 4 | 5 | 180 | 0.96 | 67.71 | 65.26 | 23.35 | 19.32 | 7.94 | 7.20 |
| CL-36 | Year 1 | 0.434 | 0.314 | 72.35023041 | 37.5 | 7.80 | 4 | 5 | 180 | 0.92 | 72.47 | 69.64 | 24.87 | 21.44 | 7.91 | 6.88 |
| CL-41 | Year 1 | 0.448 | 0.323 | 72.09821429 | 19.0 | 6.11 | 4 | 5 | 180 | 1.23 | 74.17 | 72.37 | 22.58 | 19.55 | 6.79 | 6.45 |
| CL-42 | Year 1 | 0.448 | 0.323 | 72.09821429 | 19.0 | 7.80 | 4 | 5 | 180 | 1.02 | 82.51 | 81.80 | 25.02 | 22.42 | 6.77 | 6.60 |
| CL-37 | Year 2 | 0.39 | 0.28 | 71.79487179 | 37.5 | 6.11 | 4 | 5 | 180 | 1.07 | 70.63 | 69.64 | 26.03 | 20.51 | 9.45 | 6.87 |
| CL-38 | Year 2 | 0.39 | 0.28 | 71.79487179 | 37.5 | 7.80 | 4 | 5 | 180 | 0.88 | 71.95 | 70.50 | 27.43 | 22.97 | 9.77 | 7.78 |
| CL-43 | Year 2 | 0.405 | 0.323 | 79.75308642 | 19.0 | 6.11 | 4 | 5 | 180 | 1.19 | 74.14 | 73.56 | 24.13 | 20.24 | 8.04 | 6.56 |
| CL-44 | Year 2 | 0.405 | 0.323 | 79.75308642 | 19.0 | 7.80 | 4 | 5 | 180 | 0.93 | 75.03 | 74.76 | 26.53 | 23.65 | 8.73 | 7.48 |
| CL-39 | Year 3 | 0.341 | 0.245 | 71.84750733 | 37.5 | 6.11 | 4 | 5 | 180 | 0.84 | 63.80 | 63.23 | 24.18 | 20.25 | 11.11 | 8.93 |
| CL-40 | Year 3 | 0.341 | 0.245 | 71.84750733 | 37.5 | 7.80 | 4 | 5 | 180 | 0.67 | 64.03 | 63.62 | 25.43 | 22.76 | 11.65 | 9.77 |
| CL-45 | Year 3 | 0.358 | 0.245 | 68.43575419 | 19.0 | 6.11 | 4 | 5 | 180 | 0.90 | 71.70 | 70.21 | 22.59 | 18.16 | 8.80 | 7.24 |
| CL-46 | Year 3 | 0.358 | 0.245 | 68.43575419 | 19.0 | 7.80 | 4 | 5 | 180 | 0.77 | 70.94 | 69.69 | 21.32 | 19.90 | 8.40 | 8.21 |
| CL-51 | Year 4,5 & 6 | 0.31 | 0.196 | 63.22580645 | 19.0 | 6.11 | 4 | 5 | 180 | 0.71 | 61.24 | 57.02 | 17.35 | 15.58 | 9.14 | 9.19 |
| CL-52 | Year 4,5 & 6 | 0.31 | 0.196 | 63.22580645 | 19.0 | 7.80 | 4 | 5 | 180 | 0.56 | 61.33 | 60.19 | 24.53 | 20.75 | 12.90 | 11.72 |
| CL-53 | Year 4,5 & 6 | 0.31 | 0.196 | 63.22580645 | 37.5 | 6.11 | 4 | 5 | 180 | 0.69 | 62.01 | 59.02 | 19.99 | 17.93 | 10.40 | 9.60 |
| CL-54 | Year 4,5 & 6 | 0.31 | 0.196 | 63.22580645 | 37.5 | 7.80 | 4 | 5 | 180 | 0.58 | 62.77 | 59.65 | 18.81 | 17.24 | 9.67 | 8.84 |
| CL-55 | Year 7,8 & 9 | 0.299 | 0.162 | 54.18060201 | 19.0 | 6.11 | 4 | 5 | 180 | 0.65 | 54.65 | 54.48 | 19.78 | 18.02 | 12.11 | 11.08 |
| CL-56 | Year 7,8 & 9 | 0.299 | 0.162 | 54.18060201 | 19.0 | 7.80 | 4 | 5 | 180 | 0.57 | 61.63 | 60.92 | 19.72 | 18.49 | 10.70 | 9.49 |
| CL-57 | Year 7,8 & 9 | 0.298 | 0.162 | 54.36241611 | 37.5 | 6.11 | 4 | 5 | 180 | 0.59 | 57.32 | 55.40 | 21.07 | 16.81 | 12.33 | 10.42 |
| CL-58 | Year 7,8 & 9 | 0.298 | 0.162 | 54.36241611 | 37.5 | 7.80 | 4 | 5 | 180 | 0.52 | 61.47 | 60.69 | 21.07 | 19.49 | 11.50 | 11.41 |
| Remarts (1) Actual data is only up to 128/120 days of column leachings | | | | | | | | | |
Table 13-26: METSIM Metallurgical Projections for Five Backup Columns
Recursos Stingray de Cobre S.A. de C.V. - El Pilar Project Locked Cycle Column Leach Study On Bulk Composite Sample Crush Size, Aeration & Lixiviant Type Versus Copper Extraction METCON PROJECT No. M760-02 |
| | | | | | | | | | | | Copper Extraction
(%) | Gangue Acid Consumption |
| Test No. | Sample ID | Test Charge Grade (%) | Crush Size P80 (mm) | Irrigation Flow Rate (lph/sq m) | Cure | Leach
Cycle (Days) | PLS
Grade
(gpl) | Projected | Actual(1) | Projected | Actual(1) |
| Total | Soluble | Recoverable | Dosage (kg/t) | Time (Days) | Projected | Actual(1) | (kg/t) | (kg/kg Cu) |
CL-01(1) | Bulk Sample | 0.54 | 0.37 | 67.60 | 19.0 | 5.20 | 4 | 5 | 180 | 1.78 | 73.58 | 73.53 | 22.00 | 22.84 | 5.49 | 5.71 |
CL-02(2) | Bulk Sample | 0.54 | 0.37 | 67.60 | 19.0 | 5.20 | 4 | 5 | 180 | 1.83 | 72.92 | 73.24 | 20.81 | 21.42 | 5.24 | 5.37 |
CL-03(2)3) | Bulk Sample | 0.57 | 0.43 | 75.16 | 38.1 | 5.20 | 4 | 5 | 180 | 1.78 | 71.63 | 70.76 | 21.76 | 21.53 | 5.32 | 5.33 |
CL-04(2) | Bulk Sample | 0.57 | 0.43 | 75.16 | 38.1 | 5.20 | 4 | 5 | 180 | 1.68 | 69.44 | 69.02 | 22.57 | 22.67 | 5.69 | 5.75 |
CL-05(1) | Bulk Sample | 0.57 | 0.43 | 75.16 | 38.1 | 5.20 | 4 | 5 | 180 | 1.71 | 71.37 | 70.26 | 22.30 | 22.38 | 5.47 | 5.58 |
Remarks | (1) Artificial Raffinate (Water and Sulfuric Acie) (2) Mature Raffinate (3) Aeration (4) Actual data is only up to 200 days of column leaching | | | | | | | | | | |
El Pilar Project Form 43-101F1 Technical Report | |
Table 13-27: METSIM Metallurgical Projections for 13 Columns
Recursos Stingray de Cobre S.A. de C.V. - El Pilar ProjectLocked Cycle Column Leach Study On 13 Composite Samples Crush Size & Irrigation Flow Rate Versus Copper Extraction METCON PROJECT No. M760-03 |
Test No. | Sample ID | Test Charge Grade (%) | Crush Size P100 (mm) | Irrigation Flow Rate (lph/sq m) | Cure | Leach Cycle (Days) | PLS Grade (gpl) | Copper Extraction (%) | Gangue Acid Consumption |
| Total | Soluble | Recoverable | Dosage (kg/t) | Time (Days) | METSIM | Actual(4) | METSIM | | METSIM | Actual(4) |
| | | | | | | | | | | | | | (kg/t) | (kg/kg Cu) |
| | Column 1 | 0.32 | 0.24 | 73.83 | 76.2 | 7.20 | 4 | 5 | 180 | 0.79 | 69.84 | 70.27 | 29.69 | 27.97 | 13.24 | 12.64 |
| | Column 2 | 0.30 | 0.16 | 53.67 | 76.2 | 7.20 | 4 | 5 | 180 | 0.62 | 61.37 | 61.12 | 21.13 | 19.47 | 11.48 | 10.72 |
| | Column 3 | 0.32 | 0.17 | 51.55 | 76.2 | 7.20 | 4 | 5 | 180 | 0.59 | 53.71 | 52.99 | 16.80 | 15.93 | 9.71 | 9.29 |
| | Column 5(3) | 0.30 | 0.17 | 54.61 | 76.2 | 7.20 | 4 | 5 | 180 | 0.59 | 65.23 | 64.50 | 19.36 | 18.32 | 9.76 | 10.83 |
| | Column 6-7 | 0.25 | 0.12 | 48.21 | 76.2 | 7.20 | 4 | 5 | 180 | 0.49 | 54.15 | 52.75 | 30.05 | 24.75 | 22.11 | 18.03 |
| | Column 8 and 8A(2)(3) | 0.25 | 0.10 | 40.16 | 76.2 | 7.20 | 4 | 5 | 180 | 0.43 | 45.68 | 46.63 | 23.46 | 22.08 | 20.22 | 18.20 |
| | Column 8 and 8A(1)(2)(3) | 0.25 | 0.10 | 40.16 | 76.2 | 7.20 | 4 | 5 | 180 | 0.44 | 45.09 | 45.45 | 23.37 | 20.67 | 20.40 | 17.48 |
| | Column 9 | 0.27 | 0.09 | 35.21 | 76.2 | 7.20 | 4 | 5 | 180 | 0.39 | 36.88 | 37.60 | 23.27 | 20.42 | 23.63 | 18.89 |
| | Column 10 | 0.24 | 0.07 | 31.36 | 76.2 | 7.20 | 4 | 5 | 180 | 0.35 | 39.96 | 40.77 | 22.84 | 20.49 | 24.22 | 21.93 |
| | Column 11(3) | 0.23 | 0.06 | 26.55 | 76.2 | 7.20 | 4 | 5 | 180 | 0.28 | 33.29 | 33.21 | 20.89 | 19.38 | 27.77 | 25.52 |
| | Column 12 | 0.26 | 0.15 | 57.58 | 76.2 | 7.20 | 4 | 5 | 180 | 0.48 | 52.00 | 52.75 | 21.47 | 19.86 | 15.64 | 14.52 |
| | Column 13(3) | 0.16 | 0.06 | 37.58 | 76.2 | 7.20 | 4 | 5 | 180 | 0.23 | 40.49 | 40.20 | 25.35 | 23.43 | 39.88 | 37.65 |
| | Column 14 | 0.16 | 0.05 | 33.54 | 76.2 | 7.20 | 4 | 5 | 180 | 0.14 | 22.31 | 22.51 | 24.46 | 22.58 | 69.38 | 65.72 |
| Remarks: | (1) Duplicate Column From Column 8 and Column 8A (Heating Feed Solution) | |
| | (2) Artifitial feed solution (acid and water) .Average Temperature until leach day 116 | | | |
| | (3) A white precipitate was observed in these columns tests. This precipitate was filtered, dried and sent to the lab for ICP analysis |
| | (4) Actual data is only upto 123 days of column leaching | | | | | | | |
| 13.9 | 2011 Feasibility Study Base Case - 6 Meter Lift Height 180 Day Projected Copper Recovery |
This section has not been modified from the 2011 Study, and is still reliable and current. The Metsim projections detail in the previous section were used to project copper recoveries for 19 total metallurgical samples over a 180 day leach period in the 2011. In order to compile the most accurate recovery projections, actual 180 day data was used where possible (five backup columns) and 180 day METSIM projections were used for the yearly composites and for the 13 new columns. In the latter case, if the METSIM 180 day projection was less than the actual data (this occurred on five of the 13 column projections) actual 155 day recoveries were used instead.
The data used are tabulated below in Table 13-28.
El Pilar Project Form 43-101F1 Technical Report | |
Table 13-28: 180 Day Copper Recovery Projections Used for Recovery Algorithm
180 Day Leach Projected Copper Recovery Data |
| Sample | Ratio (ASCu/TCu) | Copper Recovery (%) |
| COLUMN 1 | 74.9% | 76.7% |
| COLUMN 2 | 52.1% | 64.9% |
| COLUMN 3 | 47.2% | 56.4% |
| COLUMN 5 | 46.4% | 66.9% |
| COLUMN 6 | 43.4% | 55.7% |
| COLUMN 8 | 34.5% | 48.8% |
| COLUMN 8-A | 34.5% | 48.6% |
| COLUMN 9 | 30.0% | 41.0% |
| COLUMN 10 | 26.2% | 45.1% |
| COLUMN 11 | 22.9% | 36.9% |
| COLUMN 12 | 55.5% | 55.0% |
| COLUMN 13 | 34.7% | 42.9% |
| COLUMN 14 | 22.7% | 26.0% |
| Year 1 | 68.8% | 82.5% |
| Year 2 | 68.1% | 75.0% |
| Year 3 | 63.4% | 70.9% |
| Years 4-6 | 63.5% | 62.8% |
| Years 7-9 | 54.2% | 60.7% |
| C-01 | 66.7% | 73.6% |
While there are many different ways that the metallurgical recovery projections could have been used at El Pilar to project copper recoveries, the relationship between the Ratio (ASCu/TCu) and the projected or actual copper recovery data from the metallurgical tests shows the best correlation. The correlation coefficient of that data set shown in Table 13-28 is 0.9271.
Graphing the information presented in Table 13-28 shows that the samples selected for metallurgical testing define a grade-recovery curve; or a relationship between grade and recovery at El Pilar (see Figure 13-23). That relationship is: Recovery % (of TCu) = 0.3679ln(X) + 0.8693, where X is the Ratio (%ASCu/%TCu). When applied to the reserve model, this recovery relationship is used by MineSight for each block to assign RCu(%), which is then multiplied times TCu grade for that block to calculate recovered copper (RCu). This 2011 Base Case grade-recovery relationship has a significant advantage over the yearly composite approach used by Stingray, because this relationship takes into account copper solubility and variations in solubility with depth, and is the most accurate way to predict copper recoveries from mineralized materials with variable soluble copper amounts and grades.
El Pilar Project Form 43-101F1 Technical Report | |
As discussed in more detail in later sections, the 2011 Base Case recovery algorithm results in a mineral reserve in which 881.7 M lbs of copper are recovered over the LOM, averaging a LOM copper recovery of 55.5%.
Figure 13-23: 2011 Base Case Copper Recovery Algorithm for El Pilar Ores
As discussed previously, the 2011 Base Case recovery algorithm was based on 180 day recovery projections using 155 day solution data for a majority of the data - the 13 columns - and on daily solution data, rather than on finalized calculated head results. The resulting preliminary recovery algorithm charted above was adopted for the 2011 Base Case due to project timing - because there was a long time period between the final 180 day column results, column tear down and receipt of the more accurate finalized calculated head recovery data.
| 13.10 | 6 Meter Lift Height 180 Day Height Actual Copper Recovery |
This section has not been modified from the 2011 Study, and is still reliable and current. As a final check of the formula used for the 2011 Base Case reserve and project economics, the copper recovery algorithm was recalculated based on actual 180 day, 6 meter column leach results, which included utilizing the finalized calculated head data for the 5 bulk sample backup columns and for the 13 columns (see Tables 13-29 and 13-30). These data fit the algorithm Figure 13-24): Recovery % (of TCu) = 0.3410ln(X) + 0.8460, which is as compared to the 2011 Base Case algorithm: Recovery % (of TCu) = 0.3679ln(X) + 0.8693. This actual 180 day data algorithm projects incrementally better copper recoveries than does the algorithm used for the 2011 Base Case reserve, because the actual 180 day copper recoveries for the columns met or exceeded the METSIM projections, especially when the calculated heads were taken into consideration.
El Pilar Project Form 43-101F1 Technical Report | |
Table 13-29: Final 180 Day Leach Recovery Data
| 180 Day Leach Actual Copper Recovery Data |
| Sample | Ratio (ASCu/TCu) | Copper Recovery (%) |
| COLUMN 1 | 74.9% | 77.2% |
| COLUMN 2 | 52.1% | 65.4% |
| COLUMN 3 | 47.2% | 57.2% |
| COLUMN 5 | 46.4% | 69.4% |
| COLUMN 6 | 43.4% | 58.4% |
| COLUMN 8 | 34.5% | 51.1% |
| COLUMN 8-A | 34.5% | 50.5% |
| COLUMN 9 | 30.0% | 42.0% |
| COLUMN 10 | 26.2% | 46.3% |
| COLUMN 11 | 22.9% | 38.2% |
| COLUMN 12 | 55.5% | 57.1% |
| COLUMN 13 | 34.7% | 45.3% |
| COLUMN 14 | 22.7% | 27.1% |
| *Year 1 | 68.8% | 82.5% |
| *Year 2 | 68.1% | 75.0% |
| *Year 3 | 63.4% | 70.9% |
| *Years 4-6 | 63.5% | 62.8% |
| *Years 7-9 | 54.2% | 60.7% |
| C-01 | 66.7% | 73.6% |
| * Denoted Mestim projected data - all other data is based on actual 180 day leach column results |
El Pilar Project Form 43-101F1 Technical Report | |
Table 13-30: Comparison between Assay and Calculated Heads
| 2010-2011 Metallurgical Results - Comparison Assay to Calculated Heads |
| ` | | | | Assay Hd | Calc. Hd | Metallurgical |
| | Column | Assay Hd | Calc. Hd | TCu Ext | TCu Ext | Accountability |
| Description | No. | % TCu | % TCu | % | % | Calc./Assay Hd |
| ROM Crib | C-01 | 0.537 | 0.540 | 68.27 | 67.87 | 1.01 |
| ROM Crib | C-02 | 0.537 | 0.556 | 65.61 | 63.67 | 1.04 |
| ROM Column | CL-01 | 0.537 | 0.574 | 56.44 | 52.80 | 1.07 |
| ROM Column | CL-02 | 0.537 | 0.546 | 59.91 | 58.94 | 1.02 |
| ROM Column | CL-03 | 0.537 | 0.542 | 61.47 | 60.91 | 1.01 |
| Bulk ROM | CL-03 | 0.571 | 0.570 | 73.45 | 75.44 | 1.00 |
| Bulk ROM | CL-04 | 0.571 | 0.570 | 71.85 | 74.24 | 1.00 |
| Bulk ROM | CL-05 | 0.571 | 0.570 | 72.86 | 74.69 | 1.00 |
| Ore Composite | C1 | 0.315 | 0.322 | 78.05 | 76.41 | 1.02 |
| Ore Composite | C2 | 0.297 | 0.309 | 65.98 | 63.38 | 1.04 |
| Ore Composite | C3 | 0.324 | 0.309 | 57.84 | 57.84 | 0.95 |
| Ore Composite | C5 | 0.262 | 0.285 | 70.06 | 64.40 | 1.09 |
| Ore Composite | C6-7 | 0.260 | 0.256 | 59.09 | 59.97 | 0.98 |
| Ore Composite | C8 | 0.260 | 0.248 | 57.76 | 54.28 | 0.95 |
| Ore Composite | C8A | 0.260 | 0.249 | 51.19 | 53.49 | 0.96 |
| Ore Composite | C9 | 0.288 | 0.234 | 42.63 | 52.28 | 0.81 |
| Ore Composite | C10 | 0.229 | 0.220 | 47.02 | 49.02 | 0.96 |
| Ore Composite | C11 | 0.229 | 0.207 | 39.00 | 43.09 | 0.90 |
| Ore Composite | C12 | 0.259 | 0.247 | 57.86 | 60.83 | 0.95 |
| Ore Composite | C13 | 0.155 | 0.154 | 46.55 | 46.67 | 0.99 |
| Ore Composite | C14 | 0.153 | 0.133 | 28.09 | 32.18 | 0.87 |
| | AVG | 0.366 | 0.364 | 58.62 | 59.16 | 0.98 |
El Pilar Project Form 43-101F1 Technical Report | |
Figure 13-24: El Pilar Copper Extraction – Actual 180 Day Leach Data
The actual 180 day copper recovery algorithm was applied to the 2011 Study mine schedule to assess LOM copper recovery impact. This formula resulted in 901.6 M lbs of copper being recovered over the LOM, averaging 56.7% LOM copper recovery. This equates to 19.9 M lbs more copper being produced than the 2011 Base Case.
| 13.11 | New Base Case - 3 Meter Lift Height 180 Day Copper Recovery |
The data in this section has not been modified from the 2011 Study, but the results have been updated on the basis of the new reserve calculation.
Column and crib tear down metallurgical recovery data by tear down increment (from one to two meters) received from METCON during the writing of the 2011 Study showed that the upper 3 meters of the columns and cribs tested in 2010 and 2011 experienced significantly better copper recoveries than did the materials at the bottom. As a result, a 3 meter lift height was adopted for the El Pilar leach pad stacking plan. This 3 meter recovery metallurgical data was not received in time to be used for the 2011 Base Case reserve, but it is the basis for the new Base Case presented in this report.
In order to estimate the expected copper extraction using 3 meter lifts under actual mine operating conditions, a database of the existing metallurgical test results was first selected. This selection was based on similar column height, application rate, acid addition method and the largest particle sizing. The column tests used include the following:
| | 1. | 2009 Stingray Tests – 5 bench composite samples tested in 10 column tests; two columns per sample run in parallel. Samples composited to represent expected ore characteristics by year in the mine plan. |
El Pilar Project Form 43-101F1 Technical Report | |
| | 2. | 2011 Mineral Park Crib Tests – 2 large scale (+600 tonnes) crib tests run at the Mineral Park facilities. The sample was taken as a bulk ROM sample collected in the area of the proposed starter pit. |
| | 3. | 2011 Mineral Park ROM Columns – 3 large columns run in parallel with the MP Crib tests at Mineral Park. |
| | 4. | 2011 Bulk ROM – 3 large columns run at the Metcon Lab facilities using the same bulk sample taken for the MP Crib Tests. |
| | 5. | 2011 Composite Columns – 13 large columns run at Metcon Laboratories. Samples were selected from core samples and composited to reflect the expected range of total and soluble copper values of the deposit. |
The test column results were first evaluated to assess copper recovery by lift height. This review did not include the 2009 Stingray columns, as those columns had not been torn down by height increment. The results from the MP Cribs, MP ROM and Bulk ROM tests were then averaged for each sample grouping to represent a single point in the database, because the results were from the same bulk sample collected in the starter pit area. A comparison of the resulting 6 meter and 3 meter copper recoveries is tabulated in Table 13-31.
Table 13-31: Comparison of 6 Meter and 3 Meter Copper Extraction
| Comparison of 6 Meter and 3 Meter Copper Extraction from 2010 and 2011 Metallurgical Test Results |
| | | | | | | | | | TCu Extraction |
| | | Column | TCu | ASCu | ASCU/TCu | Sizing | Height | Days | Full Column | Top 3 Meters |
| Date | Description | No. | % | % | Ratio | P80 mm | m | No. | % | % |
| 2011 | MP ROM Crib | C-01/02 | 0.54 | 0.38 | 0.72 | 31.8 | 4 | 166 | 65.77 | 67.90 |
| 2011 | MP ROM | CL-1,2 & 3 | 0.54 | 0.38 | 0.71 | 31.8 | 6 | 139 | 57.55 | 67.46 |
| 2011 | Bulk ROM | CL-3,4 & 5 | 0.57 | 0.36 | 0.63 | 38.1 | 6 | 225 | 74.79 | 78.25 |
| 2011 | Ore Composite | C1 | 0.32 | 0.23 | 0.71 | 38.7 | 6 | 195 | 76.41 | 80.83 |
| 2011 | Ore Composite | C2 | 0.31 | 0.15 | 0.49 | 37.9 | 6 | 195 | 63.38 | 68.45 |
| 2011 | Ore Composite | C3 | 0.31 | 0.15 | 0.49 | 24.4 | 6 | 195 | 57.84 | 59.83 |
| 2011 | Ore Composite | C5 | 0.29 | 0.15 | 0.53 | 27.6 | 6 | 195 | 64.40 | 68.65 |
| 2011 | Ore Composite | C6-7 | 0.26 | 0.11 | 0.43 | 36.4 | 6 | 195 | 59.97 | 64.59 |
| 2011 | Ore Composite | C8 | 0.25 | 0.09 | 0.37 | 31.0 | 6 | 195 | 54.28 | 58.24 |
| 2011 | Ore Composite | C8A | 0.25 | 0.09 | 0.37 | 31.0 | 6 | 195 | 53.49 | 58.25 |
| 2011 | Ore Composite | C9 | 0.23 | 0.09 | 0.37 | 28.6 | 6 | 195 | 52.28 | 56.14 |
| 2011 | Ore Composite | C10 | 0.22 | 0.07 | 0.30 | 34.1 | 6 | 195 | 49.02 | 53.21 |
| 2011 | Ore Composite | C11 | 0.21 | 0.05 | 0.26 | 36.0 | 6 | 195 | 43.09 | 47.35 |
| 2011 | Ore Composite | C12 | 0.25 | 0.14 | 0.57 | 28.6 | 6 | 195 | 60.83 | 64.27 |
| 2011 | Ore Composite | C13 | 0.15 | 0.05 | 0.35 | 29.6 | 6 | 195 | 46.67 | 54.22 |
| 2011 | Ore Composite | C14 | 0.13 | 0.04 | 0.26 | 27.0 | 6 | 195 | 32.18 | 36.03 |
| | | AVG | 0.30 | 0.16 | 0.47 | 32.0 | 5.9 | 192 | 57.0 | 61.5 |
The results above include all the test work for which copper extraction was determined by height. Extraction was determined for each meter of column or crib depth, and the extraction results of the entire column was then compared to the copper extracted from the top 3 meters. When plotted, the difference between the top 3 meter extraction and the entire column extraction defines a linear relationship (Figure 13-25), which was then applied to the 2009 Stingray columns, because for these columns extraction results were not determined by height increment.
El Pilar Project Form 43-101F1 Technical Report | |
 Figure 13-25: Relationship between 3 Meter and 6 Meter Copper Extraction.
Also taken into consideration was the fact that a majority of the 2010 and 2011 metallurgical tests were performed for periods longer than the 180 day leach cycle adopted in the mine plan. In order to include these longer cycle tests in the 180 day copper recovery estimate, the recoveries were adjusted by using the actual day-to-day solution data recovery ratios to back calculated 180 day recovery. For shorter duration columns, which only included the five 2009 Stingray columns, 180 day recoveries were projected using METSIM software. The results of the 3 meter, 180 day projections are tabulated below in Table 13-32.
Table 13-32: 3 Meter Lift Height Projected 180 Day Copper Extraction.
| 3 Meter Lift Height 180 Day Projected Copper Extraction |
| | | | | | | | | Actual | 180 Day |
| | | Column | TCu | ASCu | ASCU/TCu | Sizing | Days | TCu Ext. | 3 Meter Extr. |
| Date | Description | No. | % | % | Ratio | P80 mm | No. | % | %TCu |
| 2009 | Year 1 | CL-35/36 | 0.43 | 0.30 | 0.69 | 37.5 | 128 | 68.10 | 72.16 |
| 2009 | Year 2 | CL-37/38 | 0.39 | 0.27 | 0.68 | 37.5 | 128 | 70.54 | 82.16 |
| 2009 | Year 3 | CL-39/40 | 0.37 | 0.24 | 0.63 | 37.5 | 128 | 63.86 | 68.44 |
| 2009 | Year 4-6 | CL-53/54 | 0.30 | 0.19 | 0.64 | 37.5 | 128 | 59.86 | 68.26 |
| 2009 | Year 7-9 | CL-57/58 | 0.30 | 0.16 | 0.54 | 37.5 | 128 | 58.48 | 64.09 |
| 2011 | Bulk ROM | CL-3,4 & 5 | 0.56 | 0.36 | 0.65 | 38.1 | 225 | 74.79 | 76.03 |
| 2011 | Ore Composite | C1 | 0.32 | 0.23 | 0.71 | 38.7 | 195 | 76.41 | 80.38 |
| 2011 | Ore Composite | C2 | 0.31 | 0.15 | 0.49 | 37.9 | 195 | 63.38 | 69.58 |
| 2011 | Ore Composite | C3 | 0.31 | 0.15 | 0.49 | 24.4 | 195 | 57.84 | 61.46 |
| 2011 | Ore Composite | C5 | 0.29 | 0.15 | 0.53 | 27.6 | 195 | 64.40 | 72.42 |
| 2011 | Ore Composite | C6-7 | 0.26 | 0.11 | 0.43 | 36.4 | 195 | 59.97 | 63.50 |
| 2011 | Ore Composite | C8 & 8A | 0.25 | 0.09 | 0.37 | 31.0 | 195 | 53.88 | 57.49 |
| 2011 | Ore Composite | C9 | 0.23 | 0.09 | 0.37 | 28.6 | 195 | 52.28 | 55.87 |
| 2011 | Ore Composite | C10 | 0.22 | 0.07 | 0.30 | 34.1 | 195 | 49.02 | 52.69 |
| 2011 | Ore Composite | C11 | 0.21 | 0.05 | 0.26 | 36.0 | 195 | 43.09 | 46.73 |
| 2011 | Ore Composite | C12 | 0.25 | 0.14 | 0.57 | 28.6 | 195 | 60.83 | 64.27 |
| 2011 | Ore Composite | C13 | 0.15 | 0.05 | 0.35 | 29.6 | 195 | 46.67 | 49.92 |
| 2011 | Ore Composite | C14 | 0.13 | 0.04 | 0.26 | 27.0 | 195 | 32.18 | 35.80 |
| | | AVG | 0.29 | 0.16 | 0.50 | 33.6 | 178 | 58.64 | 63.40 |
El Pilar Project Form 43-101F1 Technical Report | |
The 3 meter 180 day copper recovery data listed above fit the grade/recovery algorithm: Recovery % (of TCu) = 0.3352ln(X) + 0.8841 (see Figure 13-26) and this is the copper recovery algorithm used as the basis for the new El Pilar reserves and economics presented in this report.
.
Figure 13-26: El Pilar Copper Extraction – 180 Days 3 Meter Lift Height
In 2012, the 3 m 180 day algorithm presented above, was used to generate the new El Pilar reserves reported herein. This formula results in 998.3 M lbs of copper being recovered over the LOM, averaging 57.6% LOM total copper recovery. This equates to 116.6 M lbs more copper being produced over the LOM than the 2011 Base Case, which averaged 55.5% recovery of total copper.
| 13.12 | 3 Meter Lift Height 360 Day Projected Copper Recovery |
This section has not been modified from the 2011 Study, and is still reliable and current. Based in part on the results of the longer term metallurgical testing of Columns 2 and 3 done in 2010 and 2011 at Mineral Park, and on mineralogical data that indicates copper should continue to be recovered from the heaps over time with low acid consumption, a “what if” projection was done using METSIM analyses to assess copper recoveries that might be attained over 360 days of leaching at El Pilar, or two combined 180 day leach cycles. This projection was done to illustrate what the real copper recovery upside may be at El Pilar, considering that a majority of the heaps will continue to see raffinate over a long period of time measured in years.
First, in addition to the 2010 and 2011, 180 leach cycle testing, additional metallurgical test work was performed at Mineral Park to evaluate copper extraction in a column set up to simulate a buried lift, in order to test the impact of the planned multiple lift heap configuration for El Pilar leaching. A large 61 cm diameter by 6 meter high column, Column CL-02, was loaded at the Mineral Park test facility using the ROM sample and was then leached initially for 120 days using the same leach solution that was applied to the two cribs, C-01 and C-02, and Column CL-
El Pilar Project Form 43-101F1 Technical Report | |
01. Following the initial 120 days of leaching, a new column, CL-03, which also contained the same bulk sample ROM material, was placed under leach. The pregnant leach solution (PLS) that reported out of CL-03 was then applied to the top of CL-02. By doing this, CL-02 in effect simulated a buried lift which received PLS solutions from a “fresh lift” above, Column CL-03. Column CL-02 was leached in this mode for another 120 days. The results of the first and second leach cycles are tabulated below in Table 13-33.
Table 13-33: Column CL-02 Initial and Buried Lift Results
| Column Cl-02 Initial & Buried Lift Results |
| | Initial | Buried | Extended Cycle |
| | 1st Cycle (120 days) | 2nd Cycle (120 days) | Difference |
| Copper Extraction % | 52.7 | 58.9 | 6.2 |
| Gangue Acid Consumption kg/t | 17.2 | 18.5 | 1.3 |
| Gangue Acid Consumption kg/kg | 6.0 | 6.2 | 0.2 |
These combined 240 day column leach results, also shown in chart format below (Figure 13-27), demonstrate that copper continues to be recovered over 240 days of leaching and that additional acid consumption (1.3 kg/tonne) is minimal for the amount of additional copper recovered (6.2% more copper recovery). The modest upward slope of the curve from the 120 to 240 day period suggests that even more copper will be recovered beyond the 240 days of actual leaching. These results clearly indicate that copper will continue to be extracted over time from buried lifts at El Pilar, because they are in a permanent multiple-lift, heap configuration.
Figure 13-27: CL-02 Copper Extraction Over 240 Days of Leaching.
METSIM projections were developed by METCON for the entire metallurgical dataset so that the recovery results tabulated above could be projected out to two leach cycles, or 360 days. This METSIM 360 day copper recovery projection data is tabulated below in Table 13-34.
El Pilar Project Form 43-101F1 Technical Report | |
Table 13-34: 3 Meter Lift Height Projected 360 Day Copper Extraction.
| 3 Meter Lift Height 360 Day Projected Copper Extraction |
| | | | | | | | | Actual | 360 Day |
| | | Column | TCu | ASCu | ASCU/TCu | Sizing | Days | TCu Ext. | 3 Meter Extr. |
| Date | Description | No. | % | % | Ratio | P80 mm | No. | % | %TCu |
| 2009 | Year 1 | CL-35/36 | 0.43 | 0.30 | 0.69 | 37.5 | 128 | 68.10 | 75.11 |
| 2009 | Year 2 | CL-37/38 | 0.39 | 0.27 | 0.68 | 37.5 | 128 | 70.54 | 84.13 |
| 2009 | Year 3 | CL-39/40 | 0.37 | 0.24 | 0.63 | 37.5 | 128 | 63.86 | 68.82 |
| 2009 | Year 4-6 | CL-53/54 | 0.30 | 0.19 | 0.64 | 37.5 | 128 | 59.86 | 80.97 |
| 2009 | Year 7-9 | CL-57/58 | 0.30 | 0.16 | 0.54 | 37.5 | 128 | 58.48 | 71.05 |
| 2011 | Bulk ROM | CL-3,4 & 5 | 0.56 | 0.36 | 0.65 | 38.1 | 225 | 74.79 | 81.31 |
| 2011 | Ore Composite | C1 | 0.32 | 0.23 | 0.71 | 38.7 | 195 | 76.41 | 83.46 |
| 2011 | Ore Composite | C2 | 0.31 | 0.15 | 0.49 | 37.9 | 195 | 63.38 | 79.86 |
| 2011 | Ore Composite | C3 | 0.31 | 0.15 | 0.49 | 24.4 | 195 | 57.84 | 71.82 |
| 2011 | Ore Composite | C5 | 0.29 | 0.15 | 0.53 | 27.6 | 195 | 64.40 | 80.23 |
| 2011 | Ore Composite | C6-7 | 0.26 | 0.11 | 0.43 | 36.4 | 195 | 59.97 | 69.20 |
| 2011 | Ore Composite | C8 & 8A | 0.25 | 0.09 | 0.37 | 31.0 | 195 | 53.88 | 62.14 |
| 2011 | Ore Composite | C9 | 0.23 | 0.09 | 0.37 | 28.6 | 195 | 52.28 | 60.17 |
| 2011 | Ore Composite | C10 | 0.22 | 0.07 | 0.30 | 34.1 | 195 | 49.02 | 63.07 |
| 2011 | Ore Composite | C11 | 0.21 | 0.05 | 0.26 | 36.0 | 195 | 43.09 | 53.73 |
| 2011 | Ore Composite | C12 | 0.25 | 0.14 | 0.57 | 28.6 | 195 | 60.83 | 68.43 |
| 2011 | Ore Composite | C13 | 0.15 | 0.05 | 0.35 | 29.6 | 195 | 46.67 | 58.23 |
| 2011 | Ore Composite | C14 | 0.13 | 0.04 | 0.26 | 27.0 | 195 | 32.18 | 40.44 |
| | | AVG | 0.29 | 0.16 | 0.50 | 33.6 | 178 | 58.64 | 69.57 |
Using the data above from Table 13-34, the projected 3 meter, 360 day copper recovery data fit a new 360 day grade/recovery algorithm (see Figure 13-28) of: Recovery % (of TCu) = 0.3089ln(X) + 0.9261. This 3 meter, 360 day copper recovery algorithm was applied to the current mine schedule to assess LOM copper recovery impact. The formula results in 1,142.6 M lbs of copper being recovered over the LOM, averaging 64.9% LOM total copper recovery. This equates to 144.4 M lbs more copper being produced over 360 days of leaching than the 3 m 180 day new Base Case presented in this report.
El Pilar Project Form 43-101F1 Technical Report | |
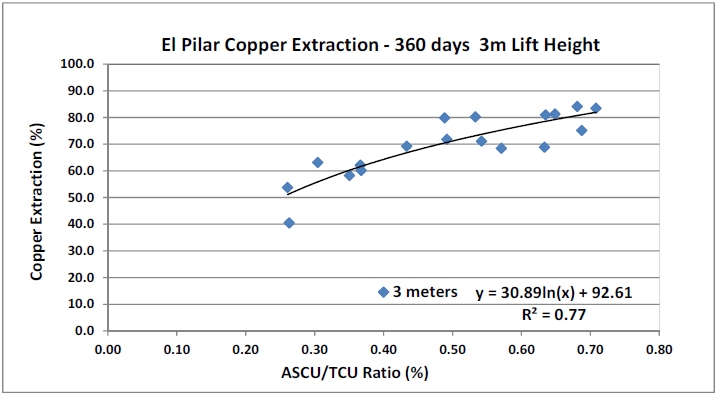
Figure 13-28: El Pilar Copper Extraction – 360 Day 3 Meter Lift Height
In order to assess the economic impact of this 360 day projected recovery upside, this 3 meter 360 day copper recovery case is presented as an alternate Financial Copper Recovery Case in the financial section of this report. This case is not fully quantified herein, because the reserves have not been recalculated using this algorithm. Due to the projected nature of this 360 day copper recovery data, the reserves will not be recalculated using this algorithm, unless actual 360 day supporting data is generated. However, this copper recovery and economic projection illustrates the magnitude of copper recovery and economic upside that may be realized at El Pilar, with ores under leach for a long period of time in a successive lift heap leach pad configuration.
| 13.13 | New 2012 Data -11 Mini Columns |
In order to better assess optimum operating conditions for actual startup of the El Pilar heap leach, both in terms of pH and in terms of acid application rates, 11 mini columns were set up and leached at Mineral Park in 2011 and 2012. These mini columns were 3 m tall and have a diameter of 8 inches (20.3 cm). The same bulk sample used for the Mineral Park cribs and columns was used to load all of the mini columns, so as to allow direct comparisons by leaching the same material under different conditions. Details that pertain to the columns and leach conditions are shown below in Table 13-35.
El Pilar Project Form 43-101F1 Technical Report | |
Table 13-35: Mini Column Details.
| Mini Columns - Locked Cycle Column Leach Study (3 meter Height) on ROM bulk Sample |
| Test No. | Cured | ROM Size P100 (in) | TCu (%) | AsCu
(%) | CNsCu
(%) | pH Control | Irrigation
Flow Rate
(lph/sq m) | Initial Leach Cycle
(Days) | Final Leach
Cycle
(Days) |
Dosage
(kg/t) | Time
(Days) |
| Column 4 | 18 | 10 | 2.0 | 0.56 | 0.40 | 0.08 | 1.8 | 4.00 | 180 | 360 |
| Column 5 | 15 | 10 | 2.0 | 0.56 | 0.40 | 0.08 | 1.8 | 4.00 | 180 | 360 |
| Column 6 | 12 | 10 | 2.0 | 0.56 | 0.40 | 0.08 | 1.8 | 4.00 | 180 | 360 |
| Column 7 | 9 | 10 | 2.0 | 0.56 | 0.40 | 0.08 | 1.8 | 4.00 | 180 | 360 |
| Column 8 | 6 | 10 | 2.0 | 0.56 | 0.40 | 0.08 | 1.8 | 4.00 | 180 | 360 |
| Column 9 | 0 | 0 | 2.0 | 0.56 | 0.40 | 0.08 | 1.8 | 4.00 | 180 | 360 |
| Column 10 | 12 | 10 | 2.0 | 0.56 | 0.40 | 0.08 | 2.2 | 4.00 | 180 | 360 |
| Column 11 | 12 | 10 | 2.0 | 0.56 | 0.40 | 0.08 | 2.0 | 4.00 | 180 | 360 |
| Column 12 | 12 | 10 | 2.0 | 0.56 | 0.40 | 0.08 | 1.8 | 4.00 | 180 | 360 |
| Column 13 | 12 | 10 | 2.0 | 0.56 | 0.40 | 0.08 | 1.6 | 4.00 | 180 | 360 |
| Column 14 | 12 | 10 | 2.0 | 0.56 | 0.40 | 0.08 | 1.4 | 4.00 | 180 | 360 |
Six of the columns were run under fixed raffinate pH conditions (1.8 pH), but these columns were precured at different acid application rates ranging from 0 to 18 kg/t of acid precure. The remaining five columns were each precured using the same 12 kg/t of acid precure, but were run under variable raffinate pH conditions of from 1.4 to 2.2 pH. For the first 192 days, all of the columns were run using the same irrigation flow rate of 4.0 lph/m2. However, due to the observation that, using this flow rate, too much acid was being plied to the columns, the solution application rate was halved at day 192 to 2.0 lph/m2.
The results of the mini columns after both 180 days and 360 days of leaching are shown below in Tables 13-36 and 13-37. The two different test groups are grouped with the same color background for clarity. However, Column 5 is highlighted separately, as discussed further below.
El Pilar Project Form 43-101F1 Technical Report | |
Table 13-36: Mini Column 180 Day Leach Results.
| Mini Columns - Locked Cycle Column Leach 180 Day Leach Results |
| |
| Test No. | Cured | ROM
Size
P100
(in) | TCu (%) | AsCu
(%) | CNsCu
(%) | | Irrigation Flow Rate (lph/sq m) | Leach
Cycle (Days) | PLS Grade (g/L) | Pregnant Solution pH | Pregnant Solution ORP(mV) | Indicated Extraction | Gangue Acid Consumption |
| pH Control |
| Dosage (kg/t) | Time
(Days) | Raffinate | Cu (%) | Fe (%) | (kg/t) | (kg/kg Cu) |
| |
| Column 4 | 18 | 10 | 2.0 | 0.56 | 0.40 | 0.08 | 1.8 | 4.00 | 180 | 0.351 | 1.90 | 615 | 63.1 | -0.1 | 18.6 | 5.2 |
| Column 5 | 15 | 10 | 2.0 | 0.56 | 0.40 | 0.08 | 1.8 | 4.00 | 180 | 0.409 | 2.07 | 622 | 69.5 | -2.8 | 16.2 | 4.1 |
| Column 6 | 12 | 10 | 2.0 | 0.56 | 0.40 | 0.08 | 1.8 | 4.00 | 180 | 0.485 | 2.07 | 625 | 65.8 | -4.5 | 14.1 | 3.8 |
| Column 7 | 9 | 10 | 2.0 | 0.56 | 0.40 | 0.08 | 1.8 | 4.00 | 180 | 0.514 | 2.13 | 627 | 61.9 | -5.3 | 11.3 | 3.2 |
| Column 8 | 6 | 10 | 2.0 | 0.56 | 0.40 | 0.08 | 1.8 | 4.00 | 180 | 0.455 | 2.07 | 626 | 54.9 | -4.6 | 8.4 | 2.7 |
| Column 9 | 0 | 0 | 2.0 | 0.56 | 0.40 | 0.08 | 1.8 | 4.00 | 180 | 0.467 | 2.35 | 626 | 44.6 | -6.2 | 4.2 | 1.7 |
| Column 10 | 12 | 10 | 2.0 | 0.56 | 0.40 | 0.08 | 2.2 | 4.00 | 180 | 0.125 | 2.75 | 606 | 47.4 | -1.2 | 10.0 | 3.7 |
| Column 11 | 12 | 10 | 2.0 | 0.56 | 0.40 | 0.08 | 2.0 | 4.00 | 180 | 0.232 | 2.41 | 621 | 55.6 | -2.1 | 11.6 | 3.7 |
| Column 12 | 12 | 10 | 2.0 | 0.56 | 0.40 | 0.08 | 1.8 | 4.00 | 180 | 0.374 | 2.26 | 626 | 58.1 | -3.9 | 12.6 | 3.8 |
| Column 13 | 12 | 10 | 2.0 | 0.56 | 0.40 | 0.08 | 1.6 | 4.00 | 180 | 0.236 | 1.78 | 632 | 69.6 | -1.2 | 19.7 | 5.0 |
| Column 14 | 12 | 10 | 2.0 | 0.56 | 0.40 | 0.08 | 1.4 | 4.00 | 180 | 0.221 | 1.67 | 631 | 71.0 | 2.2 | 25.0 | 6.2 |
El Pilar Project Form 43-101F1 Technical Report | |
Table 13-37: Mini Column 360 Day Leach Results.
| Mini Columns - Locked Cycle Column Leach 360 Day Leach Results |
| |
| Test No. | Cured | ROM Size P100 (in) | TCu (%) | AsCu (%) | CNsCu (%) | | Irrigation Flow Rate (lph/sq m) | Leach
Cycle (Days) | PLS Grade (g/L) | Pregnant Solution pH | Pregnant Solution ORP(mV) | Indicated Extraction | Gangue Acid Consumption |
| pH Control |
| Dosage (kg/t) | Time (Days) | Raffinate | Cu (%) | Fe (%) | (kg/t) | (kg/kg Cu) |
| |
| Column 4 | 18 | 10 | 2.0 | 0.56 | 0.40 | 0.08 | 1.8 | 2.00 | 360 | 0.160 | 2.05 | 571 | 70.1 | -0.2 | 19.7 | 5.0 |
| Column 5 | 15 | 10 | 2.0 | 0.56 | 0.40 | 0.08 | 1.8 | 2.00 | 360 | 0.171 | 2.09 | 549 | 78.5 | -3.3 | 17.4 | 3.9 |
| Column 6 | 12 | 10 | 2.0 | 0.56 | 0.40 | 0.08 | 1.8 | 2.00 | 360 | 0.201 | 2.14 | 573 | 76.2 | -5.4 | 15.3 | 3.6 |
| Column 7 | 9 | 10 | 2.0 | 0.56 | 0.40 | 0.08 | 1.8 | 2.00 | 360 | 0.235 | 2.17 | 568 | 73.2 | -6.4 | 12.6 | 3.1 |
| Column 8 | 6 | 10 | 2.0 | 0.56 | 0.40 | 0.08 | 1.8 | 2.00 | 360 | 0.204 | 2.09 | 575 | 65.0 | -5.0 | 9.6 | 2.6 |
| Column 9 | 0 | 0 | 2.0 | 0.56 | 0.40 | 0.08 | 1.8 | 2.00 | 360 | 0.361 | 2.32 | 560 | 58.4 | -7.7 | 5.0 | 1.5 |
| Column 10 | 12 | 10 | 2.0 | 0.56 | 0.40 | 0.08 | 2.2 | 2.00 | 360 | 0.158 | 2.82 | 524 | 53.5 | -1.6 | 9.9 | 3.3 |
| Column 11 | 12 | 10 | 2.0 | 0.56 | 0.40 | 0.08 | 2.0 | 2.00 | 360 | 0.193 | 2.42 | 556 | 64.1 | -2.8 | 11.6 | 3.2 |
| Column 12 | 12 | 10 | 2.0 | 0.56 | 0.40 | 0.08 | 1.8 | 2.00 | 360 | 0.202 | 2.18 | 578 | 67.4 | -4.8 | 13.8 | 3.6 |
| Column 13 | 12 | 10 | 2.0 | 0.56 | 0.40 | 0.08 | 1.6 | 2.00 | 360 | 0.142 | 2.00 | 591 | 75.6 | -0.1 | 23.5 | 5.5 |
| Column 14 | 12 | 10 | 2.0 | 0.56 | 0.40 | 0.08 | 1.4 | 2.00 | 360 | 0.192 | 1.82 | 595 | 77.4 | 3.8 | 35.2 | 8.1 |
El Pilar Project Form 43-101F1 Technical Report | |
Figures 13-29 and 13-30 below show what the cumulative copper extractions and acid consumptions are for the mini columns after 360 days of leaching.
Figure 13-29: Mini Columns 360 Day Cumulative Copper Extraction
Figure 13-30: Mini Columns 360 Day Cumulative Acid Consumption
El Pilar Project Form 43-101F1 Technical Report | |
Especially interesting is to compare the mini column results during the period that the acid application rate was cut in half, in other words for the period from 192 – 360 days (see Table 13-38). Highlighted especially by Column 5, during the 168 days that the solution application rate was halved, an additional 7.60% copper recovery was attained with only 0.76 kg/t of additional acid being consumed.
Table 13-38: Comparison of Mini Column Results
| Comparison of Mini Column Results |
| | 192 Days | 360 Days | Delta 168 Days |
Column
No. | Rec % | Acid Cons. | Rec % | Acid Cons. | Rec % | Acid Cons. |
| Cu (%) | (kg/t) | Cu (%) | (kg/t) | Cu (%) | (kg/t) |
| Column 4 | 64.02 | 18.94 | 70.12 | 19.66 | 6.10 | 0.72 |
| Column 5 | 70.94 | 16.59 | 78.54 | 17.35 | 7.60 | 0.76 |
| Column 6 | 67.30 | 14.44 | 76.18 | 15.33 | 8.88 | 0.89 |
| Column 7 | 63.61 | 11.63 | 73.16 | 12.59 | 9.56 | 0.96 |
| Column 8 | 56.44 | 8.78 | 64.99 | 9.62 | 8.55 | 0.84 |
| Column 9 | 44.97 | 4.29 | 58.42 | 5.05 | 13.45 | 0.76 |
| Column 10 | 47.90 | 10.08 | 53.51 | 9.93 | 5.61 | -0.15 |
| Column 11 | 56.41 | 11.73 | 64.09 | 11.59 | 7.68 | -0.15 |
| Column 12 | 59.27 | 12.94 | 67.35 | 13.82 | 8.09 | 0.88 |
| Column 13 | 70.32 | 20.55 | 75.63 | 23.51 | 5.31 | 2.96 |
| Column 14 | 71.72 | 25.92 | 77.36 | 35.24 | 5.64 | 9.32 |
Several items can be concluded from the mini column results, as follows:
| | 1. | Copper extraction rates (kinetics) are directly related to the initial acid precure amount up to 15 kg/t, with the best initial copper extraction being Column 5, which was cured at the 15 kg/t acid precure rate. However, for at least for one sample, Column 4, initial copper recovery was not improved by adding 18 kg/t of acid precure. This column actually recovered less copper than Column 5, suggesting that there is no benefit to that level of acid precuring. |
| | 2. | Initial acid consumption in the first 10 days or so is related to the acid precure amount, but ongoing acid consumption is a function raffinate pH, with lower acid consumption related to higher raffinate pH. |
| | 3. | Acid consumption is not directly related to the amount of acid applied. Column 5, with an acid precure amount of 15 kg/t, was run under relatively high raffinate pH conditions of pH 1.8, but had nearly the best overall copper recovery after 180 days of leaching of 69.5% coupled with only modest acid consumption of 16.2 kg/t. |
| | 4. | Importantly, after the solution application rate was halved from 4.0 lph/m2 to 2.0 lph/m2 after leach day 192, which had the effect of halving the amount of acid subsequently added to the columns, copper recovery continued at nearly the same positive rate, whereas acid consumption flat lined. |
El Pilar Project Form 43-101F1 Technical Report | |
��
| | 5. | Significant copper continued to be recovered from the columns up to the 360 days of total leaching, supporting the 360 day projected recoveries referenced in the 2011 Study and in this report. As well, the continued long term copper extraction indicates that the “ultimate” recovery of copper from the El Pilar ores is not yet known and that significant amounts of additional copper may be recovered from the buried lifts over time beyond 360 days, because the lifts will effectively be “under leach” for years. |
A closer evaluation of data from the mini columns, and as well for all of the El Pilar test work, indicates that too much acid was being added to all of the columns and cribs during the testing process. Particularly the mini column data shows that, after the initial acid precure, high acid application rates are not required for long term copper recovery. This is best illustrated by the acid to Cu ratio of Column 5, shown below in Figure 13-31. The spike in the acid to copper ratio after about day 70 suggests that under real heap leach operating conditions the planned acid application rate of 3.4 lph/m2 can perhaps be dropped significantly. This will result in less acid being added and likely will result is less acid being consumed by the heaps overall. This data clearly supports the possibility that acid consumption at El Pilar can be managed under real operating conditions and that the “ultimate” consumption of acid may well be less than presented in this report. For example, for Column 5, if the acid application rate were to have been halved on day 70 it is possible that acid consumption may not have exceeded ~13.5 kg/t, because on day 70 acid consumption was only 12.88 kg/t and for the ensuing 168 days of leaching after halving of the application only 0.76 kg/t of additional acid was consumed.

Figure 13-31: Mini Column 5 Acid to Copper Ratio vs. Time
| 13.14 | El Pilar LOM Acid Consumption Projections |
This section is unchanged from the 2011 Study, except for the addition at the end that summarizes the new 11 mini column data, and is still reliable and current.
Long-term acid consumption in this study is based on a value of 90% of the acid consumed in bottle roll tests performed on material used in the original five Stingray yearly composites and in the 13 columns. The rationale in using the bottle roll acid consumption data, rather than actual
El Pilar Project Form 43-101F1 Technical Report | |
column acid consumption, is that all of the reactive gangue material will react with the leach solution during the life of the test because it is at a high fluid-solid ratio. The bottle roll tests used to determine the LOM acid consumption were run using 500 gram samples at both -10 mesh and pulverized sizes, under conditions of 45% solids, iso-pH (1.4-1.8) and 72-hour test duration. Results used to calculate the 90% of bottle roll LOM acid consumption are shown in Table 13-39. The very low bottle roll acid consumption of 12.31 kg per tonne for the bulk sample was not included to avoid biasing results on the low acid consumption side. The ultimate LOM average acid consumption of 90% of the bottle roll average is 21.95 kg/t. By comparison, M3 used an average long-term acid consumption value of 17.2 kg/t in the 2009 Stingray Feasibility.
Table 13-39: Bottle Roll Acid Consumptions Used for LOM Acid Consumption
| EL Pilar Bottle Roll Testing Summary of Results |
| Sample Id | Extraction (%) | Gangue Acid Consumption | Total Acid Consumption |
| | Cu | Fe | kg/t | Kg/kg Cu | kg/t | Kg/kg Cu |
| Year 1 | 76.44 | 7.37 | 23.97 | 7.48 | 28.92 | 9.02 |
| Year 2 | 75.98 | 6.49 | 24.36 | 7.72 | 29.23 | 9.26 |
| Year 3 | 70.97 | 25.93 | 18.98 | 7.15 | 23.07 | 8.69 |
| Year 4, 5 & 6 | 66.89 | 3.47 | 22.94 | 11.06 | 26.14 | 12.6 |
| Year 7, 8 & 9 | 58.76 | -2.19 | 25.46 | 15.04 | 28.07 | 16.59 |
| Average | 69.81 | 8.21 | 23.14 | 9.69 | 27.09 | 11.23 |
| 13 Column Average | | | 30.61 | | | |
| Average All | | | 24.39 | | | |
| 90% of Average | | | 21.95 | | | |
In addition, the bottle rolls, as opposed to the column test data, were used because most of the columns were run under very high acid conditions wherein pH descended to levels as low as 1.0. Under such conditions, the kinetics of gangue dissolution may be increased by a factor of ten or more than what they may be under managed actual operating conditions and most acid production precipitation reactions, such as that for ferrihydrite where the precipitation of 56 grams of iron produce 147 grams of sulfuric acid as shown below, are prevented.
Fe+3 + 3H20 = Fe(OH)3 + 3H+ (the precipitation of ferrihydrite, a goethite precursor).
The acid consumption based on bottle roll data is in line with estimates of acid consumption based on gangue mineralogy. The principal gangue minerals are quartz, which is inert to leach solutions, and K and Na-feldspars which have very low rates of dissolution as shown by various laboratory studies. Based on quantitative X-ray diffraction (XRD) studies of material from heads
El Pilar Project Form 43-101F1 Technical Report | |
and column leach tails, the principal acid consuming minerals are located in the -10 mesh fraction and consist of biotite, smectite, and clinoptilolite, which together make up less than about 10% of the total gangue. As shown by the XRD work, smectite and biotite are converted to illite, a mineral that is relatively stable in the leach solution. By contrast, clinoptilolite probably acts as an ion exchange medium in which hydrogen ions are taken up and copper and other ions are expelled. As shown by core logging and quantitative XRD study, the percentage of reactive gangue minerals increases with depth in the deposit. For this reason, the mine model uses higher acid consumption values for progressively deeper benches in the mine as shown in Table 13-40.
Table 13-40: Acid Consumption Increments Used in the Reserve & Economic Model
| El Pilar Acid Consumption Increments |
| | Acid Consumption |
| # Benches | 30 |
| Benches/yr | 2.3 |
| Avg. LOM | 21.948 |
| Increment/yr | 0.4296 |
| Increment/bench | 0.1861 |
| Year | |
| 1 | 16.00 |
| 2 | 16.99 |
| 3 | 17.98 |
| 4 | 18.97 |
| 5 | 19.97 |
| 6 | 20.96 |
| 7 | 21.95 |
| 8 | 22.94 |
| 9 | 23.93 |
| 10 | 24.92 |
| 11 | 25.91 |
| 12 | 26.90 |
| 13 | 27.90 |
| 13.15 | Discussion of Optimum Acid Precure Amounts |
It is important to note that all of the El Pilar metallurgical column and crib tests were run using a relatively low acid precure amount of 4 kgs acid per tonne of mineralized material. The effect of this was twofold. First, essentially all of the columns run in 2010 and 2011 spent significant periods of time (up to ~20 days) under Eh-pH conditions outside the field of copper solubility, meaning no copper was being dissolved into solution. And second, acid precure can have a significant impact on copper rate recovery kinetics and as well may also have an impact on ultimate copper recovery.
El Pilar Project Form 43-101F1 Technical Report | |
To show how important initial Eh-pH conditions are to copper recovery at El Pilar, below is a Copper Species Eh-pH diagram (Figure 13-32) for 120 days of leach results for column MCL-01 (the first column in the 13 column series). For the first 25 days, the PLS solutions from the column stayed under high Eh-pH conditions well within the stability fields of both chrysocolla (yellow) and antlerite-brochantite (green). That means that the solutions were not in the field of copper aqueous solubility (blue) and that, for the most part, copper was not being dissolved. To highlight this point, during that 25 day initial period the column experienced only 3.48% cumulative copper recovery. For this column, the high Eh-pH conditions were the result of high pH (the solutions after 25 days were still at pH 4.16). While the column actually attained 77% recovery of copper after 180 days of leaching, final recoveries might have been higher if an optimal precure was used (see the previous section on the mini column results).

Figure 13-32: Copper Species Eh-pH Diagram for Column MCL-01
The diagram above illustrates why acid precuring is used and why the right amount of acid precure should be selected for the El Pilar ores. The concept behind a precure is to move the material under leach as quickly as possible into the right pH conditions for copper dissolution. If this is not done correctly, copper can be dissolved at the top of the leach pad, where new acid being applied is concentrated, but then can be reprecipitated lower in the leach pad, where pH conditions are high. When this occurs, some of the copper can be reprecipitated in mineral/rock sites from which further copper dissolution may not easily occur. Figure 13-33 shows the results
El Pilar Project Form 43-101F1 Technical Report | |
of 144-hour, sequential bottle roll tests run at Hazen Research on the Mineral Park bulk sample. These tests were run using different acid precures starting at 5 kg/tonne. The graph illustrates that twice as much copper was recovered using a 10 kg/tonne acid precure (40%) compared to using 5 kg/tonne (20%).
Figure 13-33: 144 Hour Bottle Rolls Copper Recovery vs. Acid Precure
Figure 13-34 also shows the results of bottle roll tests that were run at Hazen Research to assess the amount of acid needed to bring the bulk sample material to a pH of 1.5.
El Pilar Project Form 43-101F1 Technical Report | |
Figure 13-34: 144 Hour Bottle Roll Acid Consumption & pH
Within the test range, the above referenced bottle roll results indicate that acid consumption and period copper recovery are linear functions of the amount of acid added to the ore and that the optimal cure strength is between 10 and 15 kg/t of ore. For the purposes of this report, an initial acid precure rate of 10 kg/tonne is planned for the startup of El Pilar operations. The El Pilar heap leach pad will undergo a top-down precure, which is facilitated and made more efficient by using the previously referenced three meter lift height for the stacking plan.
The min column results discussed in the previous section especially highlight the actual test results of different acid precures on the same ore sample. The optimum precure amount from the mini columns is 15 kg/t, followed by potentially halving the solution application rate after the first ~70 days of leaching. The data from the mini columns suggests that acid consumption at El Pilar can be managed and that the LOM acid consumption may well be less than the 21.95 kg/t LOM acid consumption assumed in this study.
| 13.16 | Copper Recovery Rate Kinetics |
In order to develop a copper rate/recovery relationship for the purposes of calculating recovered copper by period from the heap leach pad, an algorithm was developed that utilized all of the column data developed for the project, including open cycle and locked cycle column results. This data, charted below in Figure 13-35, results in an average rate-recovery algorithm of: RCu(%) = 0.11ln(x) + 0.0359, where x is the number of days under leach.
El Pilar Project Form 43-101F1 Technical Report | |
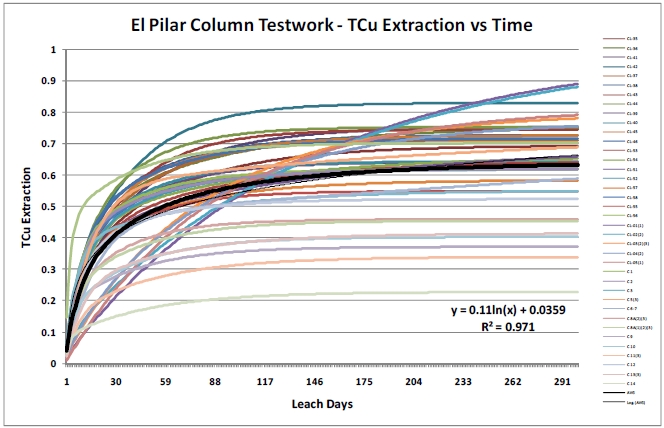 Figure 13-35: TCu Extraction vs. Time for all Column Tests
This rate-recovery algorithm was then used to develop 30-day period copper recoveries, which were then normalized to RCu (Table 13-41) for the purposes of determining copper production by month from the mine stacking schedule. The results are the period recoveries used in the El Pilar economic model referenced in this report to calculate copper by period from the heap leach pad.
Table 13-41: 180 Day Period Copper Recovery of RCu
| 180 Day Projected Leach Recovery by Period |
| Days | Cumulative Recovery (%) | Period Recovery (%) | Adjusted Recovery (to Rcu) |
| 30 | 41.0% | 41.0% | 67.5% |
| 60 | 48.6% | 7.6% | 12.6% |
| 90 | 53.1% | 4.5% | 7.3% |
| 120 | 56.3% | 3.2% | 5.2% |
| 150 | 58.7% | 2.5% | 4.0% |
| 180 | 60.7% | 2.0% | 3.3% |
| | Total | 60.7% | 100.0% |
It is important to note that the period recoveries calculated above are based on the column test results. However, as discussed previously, the test results were run using low acid precure amounts of 4 kg of acid per tonne of mineralized material. Additional optimization tests are being run on El Pilar mineralization to determine the optimum precure amount(s), but the
El Pilar Project Form 43-101F1 Technical Report | |
precure recommended in this report (10 kg/tonne) will result in enhanced copper recovery rate kinetics and thus in improved period recoveries from the heap leach pad. This conclusion is supported by sequential bottle roll tests run by Dreier in 2011 on the bulk sample at Hazen Research in Denver (Figure 13-36). These data show that copper recovery kinetics are almost doubled by going from an acid precure of 5 kg/tonne to 10 kg/tonne (note that the different curves represent bottle roll test hours of from 6 to 96 hours).
Figure 13-36: Copper Rate Recoveries from Sequential Bottle Roll Tests
The end result of potential improved recovery kinetics at El Pilar may be modestly better project economics, because copper would be recovered at a faster rate from the leach pad than presently modeled.
| 13.17 | Comparison of Metallurgical Composite Sample METCON Head Assay to Drillhole Assays |
As pointed out in Section 12.2.2, approximately 60% of the assays in the El Pilar drillhole database were done by Chemex using a four acid digestion for copper, and 40% of the assays were done by METCON using a three acid copper digestion. In terms of comparing the copper assay results for the metallurgical samples, it is very important to note that a significant disparity exists between the composite average drillhole assays and the METCON metallurgical sample head assays. Also, because the El Pilar copper recovery estimates are based on the METCON assays, but are then applied to the drillhole database in MineSight to determine recovered copper (RCu), the differences shown below imply a real potential upside for the total amount of copper that may be recovered ultimately at El Pilar.
Table 13-42 is a compilation of and comparison between copper assay data from all relevant metallurgical composites – the original five Stingray composites and composites for the 13 columns composited by ML in 2010.
El Pilar Project Form 43-101F1 Technical Report | |
Table 13-42: Comparison of Metallurgical Composite Drillhole vs. METCON Assays
| 13 Column Composite Comparison - Drill Hole Assays vs. METCON Assays |
| SUMMARY OF DRILL HOLE SAMPLES | SUMMARY OF HEAD ANALYSIS | METCON vs DRILL HOLE COMPS. |
| COMPOSITED IN SAN LAZARO | METCON (from Screen Assays) | % VARIATION |
| | TCu | ASCu | Ratio | ResCu | Cu Tot | As Cu | Ratio | ResCu | Cu Tot | As Cu | Ratio | ResCu |
| COLUMN 1 | 0.307 | 0.189 | 0.616 | 0.118 | 0.315 | 0.236 | 0.749 | 0.079 | 2.4% | 24.6% | 21.7% | -33.2% |
| COLUMN 2 | 0.314 | 0.145 | 0.461 | 0.169 | 0.297 | 0.155 | 0.521 | 0.142 | -5.4% | 6.9% | 13.0% | -15.9% |
| COLUMN 3 | 0.325 | 0.147 | 0.451 | 0.179 | 0.324 | 0.153 | 0.472 | 0.171 | -0.5% | 4.2% | 4.8% | -4.4% |
| COLUMN 5 | 0.308 | 0.128 | 0.415 | 0.180 | 0.262 | 0.122 | 0.464 | 0.140 | -15.0% | -5.0% | 11.8% | -22.1% |
| COLUMN 6-7 | 0.275 | 0.105 | 0.380 | 0.171 | 0.260 | 0.113 | 0.434 | 0.147 | -5.5% | 8.2% | 14.4% | -13.8% |
| COLUMN 8 | 0.257 | 0.085 | 0.329 | 0.173 | 0.260 | 0.090 | 0.345 | 0.171 | 1.1% | 6.0% | 4.8% | -1.3% |
| COLUMN 8-A | 0.280 | 0.088 | 0.315 | 0.192 | 0.260 | 0.090 | 0.345 | 0.171 | -7.1% | 1.7% | 9.5% | -11.2% |
| COLUMN 9 | 0.278 | 0.072 | 0.258 | 0.206 | 0.288 | 0.086 | 0.300 | 0.201 | 3.6% | 20.6% | 16.4% | -2.3% |
| COLUMN 10 | 0.260 | 0.063 | 0.244 | 0.197 | 0.229 | 0.060 | 0.262 | 0.169 | -12.0% | -5.4% | 7.4% | -14.1% |
| COLUMN 11 | 0.252 | 0.048 | 0.192 | 0.203 | 0.229 | 0.052 | 0.229 | 0.176 | -9.1% | 8.1% | 19.0% | -13.2% |
| COLUMN 12 | 0.231 | 0.102 | 0.441 | 0.129 | 0.259 | 0.144 | 0.555 | 0.116 | 12.5% | 41.5% | 25.8% | -10.4% |
| COLUMN 13 | 0.169 | 0.052 | 0.306 | 0.117 | 0.155 | 0.054 | 0.347 | 0.101 | -8.2% | 4.4% | 13.7% | -13.7% |
| COLUMN 14 | 0.139 | 0.022 | 0.157 | 0.117 | 0.153 | 0.035 | 0.227 | 0.118 | 9.7% | 58.7% | 44.8% | 0.5% |
| Average | 0.261 | 0.096 | 0.351 | 0.165 | 0.253 | 0.107 | 0.404 | 0.146 | -2.6% | 13.4% | 15.9% | -11.9% |
| Stingray 2009 Yearly Column Composite Comparison - Drill Hole Assays vs. METCON Assays |
| | Drill Hole Composite Assays | METCON Composite Assays | METCON vs DRILL HOLE COMPS. |
| Composite Year | TCu | ASCu | Ratio | ResCu | TCu | ASCu | Ratio | ResCu | TCu | ASCu | Ratio | ResCu |
| 1 | 0.498 | 0.323 | 64.9% | 0.175 | 0.441 | 0.301 | 68.3% | 0.140 | -11.4% | -6.8% | 5.2% | -20.0% |
| 2 | 0.421 | 0.263 | 62.5% | 0.158 | 0.398 | 0.271 | 68.1% | 0.127 | -5.5% | 3.0% | 9.0% | -19.6% |
| 3 | 0.371 | 0.215 | 58.0% | 0.156 | 0.350 | 0.236 | 67.4% | 0.114 | -5.7% | 9.8% | 16.4% | -26.9% |
| 4-6 | 0.341 | 0.174 | 51.0% | 0.167 | 0.310 | 0.186 | 60.0% | 0.124 | -9.1% | 6.9% | 17.6% | -25.7% |
| 7-9 | 0.332 | 0.158 | 47.6% | 0.174 | 0.298 | 0.157 | 52.7% | 0.141 | -10.2% | -0.6% | 10.7% | -19.0% |
| Average | 0.393 | 0.227 | 56.8% | 0.166 | 0.359 | 0.230 | 63.3% | 0.129 | -8.4% | 2.5% | 11.8% | -22.3% |
| Grand Total 13 Column & Stingray Yearly Composites - Drill Hole Assays vs. METCON Assays |
| Average | 0.298 | 0.132 | 0.411 | 0.166 | 0.283 | 0.141 | 0.468 | 0.142 | -4.2% | 10.4% | 14.8% | -14.8% |
El Pilar Project Form 43-101F1 Technical Report | |
In comparing the average copper assays from the drillhole database to the METCON assays done for head sample assay purposes, it is evident that, although there are variations in total copper grades (TCu), the METCON assays total only about 4.2% less TCu grade than do the drillhole database assays. This is a relatively close comparison and a good check on both composite integrity and the accuracy of the drillhole database.
However, in comparing the soluble copper assays (both ASCu and ResCu) between the drillhole and METCON composites very significant differences are noted. The METCON assays average 10.4% more acid soluble copper (ASCu) and 14.8% less residual copper (ResCu) than do the drillhole composites. This means that the METCON assays result in a 14.8% average higher Ratio of acid soluble copper (ASCu/TCu).
These differences in acid soluble copper assays have significant implications for the amount of copper that may be recovered at El Pilar. For example, for every block in the block model a recovered copper value (RCu) is assigned based on the formula: Copper Recovery% (as % of TCu) = 0.3679ln(x) + 0.8693, where x is the Ratio (%ASCu/%TCu). This means that if all of the drillhole intervals had been assayed by METCON using their three-acid digestion procedure, and the same results realized, significantly more copper might be recovered over the LOM at El Pilar. In fact, using the numbers detailed in the previous paragraph, calculations show that copper recovery would increase by approximately 3.6 percentage points. This equates to about 45 M more lbs of copper produced over the LOM. This potential project upside cannot be quantified at this point and thus is not included in any projections presented in this report. In part this is because METCON’s three acid digestion procedure should theoretically result in less copper being dissolved in the acid soluble fraction, not the other way around.
| 13.18 | Summary of El Pilar Metallurgical Results and Project Upsides |
Combined metallurgical tests from the Stingray 2009 program and from the bulk sample and additional 13 column composites tested in 2010 and 2011and from the 11 mini column tests conducted in 2012, result in the following conclusions:
| | 1. | The El Pilar copper deposit consists of gravels that are poorly cemented and disaggregate almost completely into a “pre-crushed” size distribution on mining. |
| | 2. | As a result of the pre-crushed nature of the ore, and based on the crib bulk sample results, ROM leaching should attain recoveries comparable to the column test averages. |
| | 3. | A 180 day leach cycle is initially assumed, although real operating conditions may show that a shorter leach cycle is viable, especially under the successive lift pad configuration. |
| | 4. | Copper recoveries at El Pilar are at least initially a function of copper solubility, although mineralogical studies suggest that over longer periods of time a considerable amount of the residual copper will be recovered. |
| | 5. | There is a grade recovery relationship for 180 days of leaching utilizing 3 m lefts, as defined by the formula, Recovery % (of TCu) = 0.3352ln(X) + 0.8841, where X is the Ratio (%ASCu/%TCu). |
| | 6. | An initial precure rate of about 10 to 15 kg per tonne acid is assumed. |
| | 7. | LOM acid consumption should average approximately 22 kg acid per tonne of ore, but may be less under managed pH and solution application rate conditions. |
El Pilar Project Form 43-101F1 Technical Report | |
Several potential project upsides are suggested by the metallurgical testing program and results. While these potential project enhancements are not fully quantified in this study, they are significant and include the following:
| | 1. | Using longer leach data from two columns and based on 360 copper recovery Metsim projections, an alternate 3 meter lift height, 360 day grade/recovery algorithm was calculated as: Recovery % (of TCu) = 0.3089ln(X) + 0.9261. This 3 meter, 360 day copper recovery algorithm, when applied to the current mine schedule, results in 1,142.6M lbs of copper being recovered over the LOM, averaging 64.9% LOM total copper recovery. This equates to 144.4 M lbs more copper being produced over 360 days of leaching than the Base Case. This case is presented as a semi-quantified alternate Financial Copper Recovery Case in the Economic Analysis section of this report. |
| | 2. | Under managed pH conditions during real operations, as opposed to the very high acid application rates of 10 gpl free acid used for the metallurgical tests, LOM acid consumption may be lower than presently projected, as suggested by the new mini column test results. |
| | 3. | Due apparently to differences in assay procedures between the METCON test results and the drillhole database, up to 3.6 percentage points more soluble copper may be present than modeled. This could equate to as much as 45 M lbs more copper being produced over the LOM. |
| | 4. | Using a 10 to 15 kg per tonne acid precure, rather than the 4 kg per tonne precure used in the metallurgical tests, will likely result in faster copper recovery rates than presently modeled even in the 3 m lift height algorithm. This could positively impact project economics by allowing for a shorter leach cycle, as well as potentially for even better copper recoveries over the life of mine. |
El Pilar Project Form 43-101F1 Technical Report | |
| 14 | MINERAL RESOURCE ESTIMATES |
| | |
| 14.1 | Resource Model |
The work and writing in this section is based upon work done by Mike Hester (FAusIMM) of IMC (Tucson), an independent mining engineer an Outside Expert relied upon for this section of the report. This data is mostly unchanged from the 2011 Study, except for changes related to the new reserve, and is still reliable and current.
The mineral resources are based on a new 3D block model developed by IMC and ML personnel in 2010. The block model is based on 20m by 20m by 10m high blocks. The model is not rotated.
The drillhole database consists of 255 drill holes representing 52,810 m of drilling.
The highest total copper assays were examined to determine if any grade caps or cuts were warranted. It was determined that capping was not required. The highest total copper value in the database was a one meter interval that assayed 6.4% total copper.
A soluble copper to total copper ratio was calculated for each assay interval and stored in the database. Examination of the data revealed a significant difference in the soluble copper assays for the Stingray drilling (cold soluble copper assays) versus the Noranda drilling (hot soluble copper assays). Database variables were created to segregate the two types of soluble copper assays.
Hole S-07-30 contained 21 consecutive assay intervals with soluble copper greater than total copper. These were corrected by swapping total copper and soluble copper based on discussions with the assay lab. After correcting these, there were 11 assay intervals where the soluble copper assay exceeded the total copper assay. In these cases the soluble copper assay was set equal to the total copper assay. This was done in new variables to maintain the integrity of the original data.
The assay database was composited to 10 m down-hole composites. Composited values included the total copper assays, the soluble copper to total copper ratios, and the lithology code.
An interpretation of the rock types was done by ML personnel and incorporated into the block model. IMC reviewed and accepted the interpretation. Table 14-1 provides a brief description of the rock types. Figure 14-1 shows a box plot representation of the basic statistics of total copper in the various units for 10 m composites. The most important ore-grade material hosts are the Qwu and Qwt units. The breccia unit also has a relatively high mean total copper grade, but is a relatively low volume of the known copper deposit. The rock types are important for density determination, but they were not directly used for block grade estimation.
El Pilar Project Form 43-101F1 Technical Report | |
Table 14-1: Description of El Pilar Rock Types
| Description of Rock Types |
| Rock | Code | Description |
| Qfy | 103 | Quaternary Younger Alluvial Fan Deposits |
| Qwu | 201 | Quaternary Alluvial Wash Deposits Upper |
| Qwt | 202 | Quaternary Alluvial Wash Deposits Transitional |
| Qwl | 203 | Quaternary Alluvial Wash Deposits Lower |
| PCGr | 102 | Precambrian Granitic Intrusive Rocks |
| Bx | 205 | Breccia |
| Fz | 204 | Fault Zone |
| Fd | 301 | Felsic Dikes |
| Ad | 302 | Andesite Dikes |
Figure 14-1: TCu by Lithology Type
The El Pilar deposit was divided into three “structural zones” by IMC (Figure 14-2). Examination of cross sections indicated the following:
El Pilar Project Form 43-101F1 Technical Report | |
| ● | Over most of the main portion of the deposit (Zone 1), the trend of copper mineralization appears to parallel the Qwu, Qwt contact which strikes N45oE and dips about 24o SE. The Qwu is the main host for the deposit. Copper mineralization also generally extends 15 to 20 m or so into the Qwt, then generally terminates fairly abruptly. |
| ● | In the southwest (Zone 2), the Qwu, Qwt contact appears to turn and have a northwest strike and a southwest dip. There also appears to be some offset in the location of the main geologic units in Zone 2 versus Zone 1. In spite of the apparent orientation of the contact, the trend of the copper mineralization appears to be more horizontal than in Zone 1. Excluding the Zone 1 - Zone 2 boundary for grade estimation allows mineralization from Zone 2 drilling to spread into Zone 1 below the bottom of the drill holes into probable poorly mineralized ground, so the boundary provides useful control. |
| ● | In Zone 3, especially on the east side, near the Zone 1 boundary, the trend of the copper mineralization appears to be fairly flat lying. Lithology is also different in Zone 3. The Breccia (Bx) and Granite (PCGr) occur in Zone 3 near the contact with Zone 1, so the Qwu and Qwt rock types are not always present in the drill holes. |
IMC digitized the three structural zones and incorporated them into the model. The outer boundary of the structural zones was established at a maximum distance of 100 m from the last mineralized holes. This also provided a limit on how far mineral grades would be extrapolated during grade estimation.
IMC also developed an ore zone, at a total copper cutoff of 0.1%, to control block grade estimation. An indicator kriging was done to develop the boundary as follows:
| ● | 10 m drillhole composites greater than (or equal to) 0.1% total copper were assigned a value of 1 and drillhole composites below 0.1% total copper were assigned a value of 0. Un-assayed composites were also set to 0 (not mineralized); inspection of the data showed that the un-assayed intervals occurred in areas that were non-mineral in character. The codes were then manually adjusted so that one waste composite inside an ore zone was set to 1 (internal waste or dilution). |
| ● | The ones and zeros were then assigned to blocks using an inverse distance cubed estimator. The result for each block was a value between 0 and 1 that may be interpreted as the probability the block is mineralized at the 0.1% copper threshold. Blocks with a probability over 0.5 were considered “in the ore zone” and assigned a code to mark them as such. For structural Zone 1 the search radius for the estimation was 175 m along strike, 115 m down dip, and 20 m perpendicular to the plane. For Zones 2 and 3 the search radius was circular with a 140 m horizontal search and a 20 m vertical search. A maximum of eight composites, a minimum of one composite, and a maximum of two composites per hole were used for the estimation. |
The controls used for block grade estimations of copper were the ore zone and structural zones.
El Pilar Project Form 43-101F1 Technical Report | |
Figure 14-2: Structural Zones
El Pilar Project Form 43-101F1 Technical Report | |
Total copper grades of the blocks in the 0.1% ore zone were estimated by ordinary kriging, using only the ore zone composites. The three structural zones were treated as hard boundaries for the estimations since ore zones did not always tend to line up very well across the boundaries.
IMC ran variograms of total copper in Zone 1, which comprises a majority of the data (Figure 14-3). The best variograms were in the directions that corresponded with the along strike and down dip directions of the Qwu/Qwt contact, which agrees with the visual inspection discussed above. The variogram range along strike was roughly 1.5 times the range in the dip direction. Though the ore zone boundary was established by inverse distance cubed estimation, Figure 14-4 shows indicator variograms for total copper at a 0.2% discriminator, approximately the median of the main zone distribution. This also shows a longer range, and better variogram clarity, for the along strike direction versus down dip.
For Zone 1, search radii of 175 m along strike, 115 m down dip, and 20 m in the perpendicular direction were used for the kriging. These search radii are well within the variogram ranges and area adequate to fill in the block grades. For Zones 2 and 3, 140 m circular searches were used with a 20 m vertical search. The 140 m search radius is approximately the same search volume as the 175 m by 115 m search used for Zone 1. A maximum of eight composites, a minimum of one composite, and a maximum of two composites per hole were used. Note that these are the same search radii and number of composites parameters as were used to develop the ore zone. Tables 14-2 and 14-3 show the details of the estimation parameters.
Figure 14-3: Total Copper - Main Ore Zone Variogram
El Pilar Project Form 43-101F1 Technical Report | |
Figure 14-4: Indicator Variograms Discriminator of 0.2% Cu
El Pilar Project Form 43-101F1 Technical Report | |
Table 14-2: Copper Estimation Parameters – Table 1
| Kriging Estimation Parameters Table 1 |
| | | | | Rotation Angles (Note 1) | Search Radius (meters) | Composites |
Structural Zone | Rock
Type | Value Estimated | Description | Theta | Phi | Psi | Major | Minor | Tertiary | Min | Max | Maz/Hole |
| 1 | All | Ore Zone | Ore Zone Definition | 45 | 0 | 24 | 175 | 115 | 20 | 8 | 1 | 2 |
| 2 | All | Ore Zone | Ore Zone Definition | 0 | 0 | 0 | 140 | 140 | 20 | 8 | 1 | 2 |
| 3 | All | Ore Zone | Ore Zone Definition | 0 | 0 | 0 | 140 | 140 | 20 | 8 | 1 | 2 |
| 1 | All | TCu | TCu - Inside Ore Zone | 45 | 0 | 24 | 175 | 115 | 20 | 8 | 1 | 2 |
| 2 | All | TCu | TCu - Inside Ore Zone | 0 | 0 | 0 | 140 | 140 | 20 | 8 | 1 | 2 |
| 3 | All | TCu | TCu - Inside Ore Zone | 0 | 0 | 0 | 140 | 140 | 20 | 8 | 1 | 2 |
| 1 | All | Ratio | ASCu/TCu - Inside Ore Zone | 45 | 0 | 24 | 215 | 145 | 20 | 8 | 1 | 2 |
| 2 | All | Ratio | ASCu/TCu - Inside Ore Zone | 0 | 0 | 0 | 175 | 175 | 20 | 8 | 1 | 2 |
| 3 | All | Ratio | ASCu/TCu - Inside Ore Zone | 0 | 0 | 0 | 175 | 175 | 20 | 8 | 1 | 2 |
| 1 | All | Conf | Resource Classification | 45 | 0 | 24 | 175 | 115 | 20 | 8 | 1 | 1 |
| 2 | All | Conf | Resource Classification | 0 | 0 | 0 | 140 | 140 | 20 | 8 | 1 | 1 |
| 3 | All | Conf | Resource Classification | 0 | 0 | 0 | 140 | 140 | 20 | 8 | 1 | 1 |
| Note 1: | IMC Convention for Rotation Angles. Same as GSLIB convention except sign of Psi is opposite | | | | |
| | Theta - rotation of y (north) axis clockwise to principal direction in horizontal plane. | | | | | |
| | Phi - dip of principal axis, negative is down. | | | | | | | | | |
| | Psi - rotation around principal axis, clockwise is negative. Perspective is outside system looking toward origin (GSLIB is inside system). |
El Pilar Project Form 43-101F1 Technical Report | |
Table 14-3: Copper Estimation Parameters – Table 2
| Kriging Estimation Parameters Table 2 |
| | | | | | Primary Axis Variogram (Note 2) |
Structural Zone | Rock Type | Value Estimated | Description | ID Power | Nugget | C1 | C2 | Sill | Range 1 | Range 2 | Range 3 |
| 1 | All | Ore Zone | Ore Zone Definition | 3 | NA | NA | NA | NA | NA | NA | NA |
| 2 | All | Ore Zone | Ore Zone Definition | 3 | NA | NA | NA | NA | NA | NA | NA |
| 3 | All | Ore Zone | Ore Zone Definition | 3 | NA | NA | NA | NA | NA | NA | NA |
| 1 | All | TCu | TCu - Inside Ore Zone | NA | 0.0044 | 0.0124 | NA | 0.0168 | 440 | 300 | 50 |
| 2 | All | TCu | TCu - Inside Ore Zone | NA | 0.0044 | 0.0124 | NA | 0.0168 | 360 | 360 | 50 |
| 3 | All | TCu | TCu - Inside Ore Zone | NA | 0.0044 | 0.0124 | NA | 0.0168 | 360 | 360 | 50 |
| 1 | All | Ratio | ASCu/TCu - Inside Ore Zone | NA | 0.0044 | 0.0124 | NA | 0.0168 | 440 | 300 | 50 |
| 2 | All | Ratio | ASCu/TCu - Inside Ore Zone | NA | 0.0044 | 0.0124 | NA | 0.0168 | 360 | 360 | 50 |
| 3 | All | Ratio | ASCu/TCu - Inside Ore Zone | NA | 0.0044 | 0.0124 | NA | 0.0168 | 360 | 360 | 50 |
| 1 | All | Conf | Resource Classification | NA | 0.2 | 0.8 | NA | 1.0 | 440 | 300 | 50 |
| 2 | All | Conf | Resource Classification | NA | 0.2 | 0.8 | NA | 1.0 | 360 | 360 | 50 |
| 3 | All | Conf | Resource Classification | NA | 0.2 | 0.8 | NA | 1.0 | 360 | 360 | 50 |
| Note 2: | Range 1, Range 2 and Range 3 are in the major, minor and tertiary directions, respectively. | | | | |
El Pilar Project Form 43-101F1 Technical Report | |
| | 14.1.5 | Soluble Copper Estimation |
As discussed above, the Noranda soluble copper assays were considerably more aggressive than the Stingray soluble copper assays. It is not appropriate to mix the assays in the resource model. IMC did an estimate of the cold soluble copper assays (the Stingray assays) for the resource model. The estimate was done as follows:
| ● | The soluble copper to total copper ratio was estimated for each block by ordinary kriging. Only the Stingray assays were used for the estimation. The search orientations were the same as for total copper but the search radii were increased to 215 m along strike and 145 m down dip for Zone 1 and 175 m circular for Zones 2 and 3. This was done to compensate for the excluded drill holes. |
| ● | The soluble copper/total copper ratio was multiplied by the total copper block grade estimate to derive the soluble copper grade estimate for each block. |
Dry bulk densities were assigned to model blocks based on 3,289 specific gravity determinations on core performed by Noranda and reported by lithology type. Table 14-4 shows these results. The specific gravity data is assumed to approximate dry bulk density without additional adjustments.
Table 14-4: Specific Gravity Determinations
| Summary of Noranda Specific Gravity Determinations |
Lithology
Code | Description | Bulk
Density
(t/m3) | Ktonnes
Per Block |
| 103 | Qfy - Quat. Younger Alluvial Fan Deposit | 2.17 | 8.68 |
| 102 | PCGr – Precambrian Granite | 2.53 | 10.12 |
| 201 | Qwu – Quat Alluvial Wash Dep Upper | 2.29 | 9.16 |
| 202 | Qwt – Quat Alluvial Wash Dep Transition | 2.28 | 9.12 |
| 203 | Qwl – Quat Alluvial Wash Dep Lower | 2.3 | 9.2 |
| 204 | Fault Zone | 2.36 | 9.44 |
| 205 | Bx – Breccia | 2.46 | 9.84 |
| 14.2 | Resource Classification |
This section is unchanged from the 2011 Study, and is still reliable and current. A special copper grade kriging was done, specifically for the purpose of resource classification. The copper grade from this kriging was not used, but the number of holes and kriging standard deviation were used for the resource classification. For this kriging the variogram was normalized to a sill of 1 and a nugget of 0.2 (20% of sill). A maximum of eight composites and a minimum of one composite, with a maximum of one composite per hole were used in the kriging. This counts the number of
El Pilar Project Form 43-101F1 Technical Report | |
holes available to krige the block and also calculates a kriging standard deviation. The number of holes and standard deviation were stored in the model.
Probability plots of the kriging standard deviation by the number of holes were plotted. Figure 14-5 shows the plots.
First, all blocks with kriged copper grade (from the regular block kriging) were set to the inferred resource class. Second, the following blocks were upgraded to indicated resource: 1) blocks estimated with four or more holes, 2) blocks estimated with three holes and with a kriged standard deviation less than 0.7, 3) blocks estimated with two holes and a kriged standard deviation less than 0.6, and 4) blocks estimated with one hole and a kriged standard deviation less than 0.5. Then, third, blocks with a kriged standard deviation less than 0.41 were upgraded to measured resource.
IMC examined the classification on cross sections and believes it is reasonable. It is the opinion of IMC that the block model is adequate for feasibility level evaluations of the El Pilar Project.
Figure 14-5: Kriging Standard Deviation
| 14.3 | Mineral Resource Estimates |
Table 14-5 presents the mineral resource for the El Pilar Project. It is inclusive of the mineral reserve.
El Pilar Project Form 43-101F1 Technical Report | |
Table 14-5: El Pilar Mineral Resources – Inclusive of Mineral Reserves
| El Pilar Mineral Resources (Inclusive of Reserve) |
| | 0.15% Copper Cutoff |
| Mineral Resource Class | Ore Ktonnes | Total Cu (%) | Sol Cu (%) | Copper (Mlbs) |
| Measured Mineral Resource | 128,094 | 0.307 | 0.128 | 867.0 |
| Indicated Mineral Resource | 231,154 | 0.266 | 0.095 | 1,355.5 |
| Measured/Indicated Resource | 359,248 | 0.281 | 0.107 | 2,222.5 |
| Inferred Mineral Resource | 67,996 | 0.239 | 0.082 | 358.3 |
Table 14-6 presents the mineral resource for the El Pilar Project, exclusive of the mineral reserve.
Table 14-6: El Pilar Mineral Resources – Exclusive of Mineral Reserves
| El Pilar Mineral Resources (Exclusive of Reserve) |
| | 0.15% Copper Cutoff |
| Mineral Resource Class | Ktonnes | Total Cu (%) | Sol Cu (%) | Copper (Mlbs) |
| Measured Mineral Resource | 20,162 | 0.221 | 0.042 | 98.4 |
| Indicated Mineral Resource | 82,432 | 0.219 | 0.046 | 398.2 |
| Measured/Indicated Resource | 102,594 | 0.221 | 0.046 | 496.5 |
| Inferred Mineral Resource | 67,996 | 0.239 | 0.082 | 358.3 |
Tables 14-7 and 14-8 shows the tabulation of measured and indicated and inferred resources, respectively, contained in the block model at various total copper cutoff grades. The formal mineral resource, at a cutoff grade of 0.15% total copper, is highlighted in yellow.
Table 14-7: Measured & Indicated Mineral Resources at Various Cutoff Grades
| Measure and Indicated Mineral Resources @ Different Cutoff Grades |
TCu
Cutoff (%) | Measured Mineral Resource | Indicated Mineral Resource | Measured/Indicated Mineral Resource |
Ore
Ktonnes | Total Cu
(%) | Soluble Cu
(%) | Ore
Ktonnes | Total Cu
(%) | Soluble Cu
(%) | Ore
Ktonnes | Total Cu
(%) | Soluble Cu (%) |
| 0.30 | 64,377 | 0.385 | 0.193 | 67,814 | 0.366 | 0.172 | 132,191 | 0.375 | 0.182 |
| 0.25 | 86,144 | 0.357 | 0.168 | 119,222 | 0.326 | 0.132 | 205,366 | 0.339 | 0.151 |
| 0.20 | 109,304 | 0.329 | 0.145 | 178,495 | 0.292 | 0.113 | 287,799 | 0.306 | 0.125 |
| 0.15 | 128,094 | 0.307 | 0.128 | 231,154 | 0.266 | 0.095 | 359,248 | 0.281 | 0.107 |
| 0.10 | 137,301 | 0.295 | 0.121 | 255,218 | 0.253 | 0.087 | 392,519 | 0.268 | 0.099 |
El Pilar Project Form 43-101F1 Technical Report | |
Table 14-8: Inferred Mineral Resources at Various Cutoff Grades
| Inferred Resources @ Various Cutoffs |
TCu Cutoff (%) | Inferred Mineral Resource |
| Ore Ktonnes | Total Cu (%) | Soluble Cu (%) |
| 0.30 | 9,969 | 0.422 | 0.216 |
| 0.25 | 20,898 | 0.344 | 0.153 |
| 0.20 | 39,612 | 0.286 | 0.111 |
| 0.15 | 67,966 | 0.239 | 0.082 |
| 0.10 | 90,333 | 0.212 | 0.068 |
The mineral resource estimates are compliant with the current CIM standards and definitions specified by NI 43-101. The resource also meets the “reasonable prospects for economic extraction” conditions of the NI 43-101 code. About 77% of the total measured and indicated mineral resource is included in the reserve pit and mineral reserve.
IMC does not know of any environmental, permitting, legal, title, taxation, socio-economic, marketing, or political issues which would affect the mineral resource or mineral reserve estimates. Note, however, that mineral resources that are not converted to mineral reserves do not have demonstrated economic viability. Also, inferred mineral resources are speculative in nature and may not be converted to measured and indicated mineral resources or to mineral reserve.
| 14.4 | Changes from the July 2008 Resource Model |
This section is unchanged from the 2011 Study, and is still reliable and current. The current El Pilar resource block model was developed in April 2010. The previous model was developed in July 2008. There is not any sampling data in the 2010 model that was not available for the 2008 model. The changes in procedure from the previous model are as follows.
The main change was that IMC was requested to composite the assay database to 10 m composites, the same as the bench height, instead of the 5 m composites used for the 2008 model.
IMC also updated topography in the block model to the most current available. IMC was provided with an updated topography near the end of the 2008 Feasibility Study. Since differences with the existing topography were minor, and the mine production schedule for the project was completed, the new topography was not incorporated into that study.
IMC was asked to review the use of the structural boundaries as hard boundaries for grade estimation purposes. They were used as hard boundaries for the 2008 study. From a geological perspective the boundaries are not obvious, but in long sections, there are several sections were there is a shift in the vertical position of the main mineralized zone across the central/southwest zone boundary. There are places where removing the boundary would allow mineralization from the one zone to spread into the other, below the drill coverage into apparently unmineralized
El Pilar Project Form 43-101F1 Technical Report | |
ground. The structural zones developed by IMC are still considered hard boundaries for the updated model.
Variograms were re-examined based on the 10 m composites. For the July 2008 model, an along strike to down dip anisotropy of about 2:1 was assumed for the main zone and search radii of 200 m along strike and 100 m down dip were used. Variograms with the 10 m composites indicate an along strike to down dip anisotropy of closer to 1.5:1. Preserving the search volume, IMC used search radii of 175 m along strike and 115 m down dip for this update. For Zones 2 and 3 (southwest and northeast) the search radius was still 140 m circular. The revised search radii were applied to both the indicator kriging to establish the mineralized zone and the grade estimations.
For the July 2008 model, a maximum of 10 composites, a minimum of one composite, and a maximum of three composites per hole was used for estimation. Given the longer composites, this was changed to a maximum of eight composites, a minimum of one, and a maximum of two per hole. The impact of this change is not significant, at least on a global basis.
The resource classification for measured resource was made slightly more lenient. In the 2008 model, blocks estimated with four holes or more and a kriged standard deviation less than 0.45 were categorized as measured. For the 2010 model, all blocks with a kriged standard deviation less than 0.41 were so categorized. For the 2008 model, the measured resource was about 28% of the measured/indicated total in the pit. For the 2010 model, measured resource is about 47% of measured/indicated resource in the IMC pit.
Tables 14-9 and 14-10 compare resources inside the IMC design pit by resource class at a 0.15% total copper cutoff grade. For the sum of measured and indicated resources the 2010 model contains 2.8% more ore tonnes at a 1.6% lower grade for 1.1% more contained copper pounds. This is effectively the net change for compositing to 10 m lengths instead of the 5 m lengths used for the 2008 model.
Table 14-9: Comparison of Models for Measured and Indicated Mineral Resources
| Comparison of Models by Measured & Indicated Resource Class Inside IMC 2008 Final Pit - 0.15% TCu Cutoff |
Model
Case | Description | Measured Mineral Resource | | Indicated Mineral Resource | Measured/Indicated Resource |
Ore
Ktonnes | Total Cu
(%) | Copper
(Mlbs) | Ore
Ktonnes | Total Cu
(%) | Copper
(Mlbs) | Ore
Ktonnes | Total Cu
(%) | Copper
(Mlbs) |
| 1 | 2008 Model | 88,420 | 0.323 | 629.6 | 141,277 | 0.298 | 928.1 | 229,267 | 0.308 | 1,557.8 |
| 2 | 2010 Model | 110,715 | 0.316 | 771.3 | 125,373 | 0.291 | 804.3 | 236,088 | 0.303 | 1,575.6 |
| | %Diff vs. Case 1 | 25.2% | -2.2% | 22.5% | -11.3% | -2.3% | -13.3% | 2.8% | -1.6% | 1.1% |
El Pilar Project Form 43-101F1 Technical Report | |
Table 14-10: Comparison of Models for Inferred Mineral Resources
| Model Comparison - Inferred Resources @ 0.15% Cutoff |
| Model Case | Description | Inferred Mineral Resource |
| Ore Ktonnes | Total Cu (%) | Copper (Mlbs) |
| 1 | 2008 Model | 4,308 | 0.31 | 29.4 |
| 2 | 2010 Model | 3,554 | 0.312 | 24.3 |
| | %Diff vs. Case 1 | -17.5% | 0.6% | -17.0% |
El Pilar Project Form 43-101F1 Technical Report | |
| 15 | MINERAL RESERVE ESTIMATES |
| | |
| 15.1 | General |
The mineral resources are based on calculations done using MineSight. This work was reviewed and vetted by Mike Hester (FAusIMM) of IMC under the supervision of the Author, , including running duplicate cones and analyses where appropriate to ensure confirmed accuracy. The Author has relied on work done by Mr. Hester as an Other Expert for this section of the report.
| 15.2 | Design Economics and Floating Cone Evaluations |
Table 15-1 shows the economic parameters used for mine design and mine production scheduling. Note that these are the parameters used to initiate the mine design process and are not necessarily the final parameters used for economic evaluation of the project.
Table 15-1: Economic Parameters for Reserve Calculation
| Economic Parameters for Reserve Calculation & Mine Design |
| Parameter | Units | Value |
| Base Copper Price per Pound (for Design) | (US$) | 2.15 |
| Mining Costs per Total Tonne (Average) | (US$) | 1.101 |
| | Base Mining Cost per Total Tonne(Note 5) | (US$) | 1.05 |
| | Incremental Haulage Cost (Average) (Note 1) | (US$) | 0.004 |
| Processing Cost per Ore Tonne (Average) (Notes 2 & 3) | (US$) | 1.550 |
| | Base Leach/SXEW Cost per Ore Tonne (less Acid) | (US$) | 1.31 |
| | Incremental Acid Cost (Average) per Ore Tonne | (US$) | 0.12 |
| | FS&R (Sales & Freight) per Ore Tonne (Average) | (US$) | 0.12 |
| G&A Cost per Ore Tonne | (US$) | 0.460 |
| | Base G&A Cost per Ore Tonne | (US$) | 0.34 |
| | Royalty Cost per Ore Tonne (Note 6) | (US$) | 0.120 |
| Process & G&A Cost | (US$) | 2.706 |
| Average Coper Recovery (Note 4) | (%TCu) | 57.6% |
| Approximate Total Cutoff for Mineral Reserve | (%TCu) | 0.18 |
| 1 | Based on $0.00376/tonne/bench below the 1385 bench. |
| 2 | Processing Cost incremented by $0.00699 per bench below the 1385 bench starting @ $1.55/tonne to reflect increased acid consumption with depth. |
| 3 | Acid Consumption estimated at 16 kg/t plus 0.1993 kg/t/bench below 1385. Average acid consumption of 19.3 kg/t, but cost included in processing cost. |
| 4 | Recovery estimated at 88.41% + 33.52%ln (soluble copper/total copper) |
| 5 | Based on deisel fuel price of $3.00/gallon. |
| 6 | Xastra Royalty - 1% of Gross Revenues aafter 1st 35 M lbs |
The table shows that the base case copper price for the mine design was established at $2.15 per pound.
El Pilar Project Form 43-101F1 Technical Report | |
Leach recovery was incorporated into the model on a block by block basis, using the equation:
| | Cu Recovery = 88.41% + 33.52%ln (soluble copper/total copper), where ln is the natural logarithm. |
The equation was developed by Mercator personnel and was only applied to blocks with a total copper grade greater than or equal to 0.05% total copper. Note also that with this equation the recovery goes negative when the soluble copper to total copper ratio is less than 0.072. Also, 88.41% is the upper limit of recovery, corresponding to a soluble copper to total copper ratio of 1. Soluble copper is the cold soluble copper grades in the model. Given this equation, the average recovery for blocks in the mineral reserve is about 57.6%.
The process costs were also provided by ML. The base process cost is $1.31 per ore tonne. This cost is increased by $0.00699 per tonne per bench below the 1385 bench to reflect higher acid consumption with depth. In addition, there is a charge of $0.12 per tonne for sales and freight costs.
The G&A cost of $0.46 per ore tonne is based on the November 2011 Feasibility Study. This is made up of the base G&A cost of $0.34 per ore tonne plus about $0.12 per tonne for royalties. For blocks in the mineral reserve, the process plus G&A cost averages $2.71 per ore tonne.
Since recovery is calculated on a block by block basis and process/G&A costs vary by bench, a net of processing (NOP) value was calculated for each block to route blocks to ore versus waste. Net of processing is in units of US$/tonne and is the block revenue per ore tonne less the process/G&A cost per ore tonne. Blocks with a net of process value greater than zero are considered to be ore. This assumes routing to ore versus waste at the pit rim, i.e. mining cost is a sunk cost for blocks that have to be mined.
The mining cost of $1.05 per total tonne plus $0.00376 per tonne per bench below the 1385 bench was also calculated by Mercator personnel. This results in a $1.10 average mining cost, which is comparable to the life of mine estimate of $1.08 per total tonne calculated for the November 2011 Feasibility Study. Both the 2011 and the 2012 cost estimates are based on a diesel fuel price of $3.00 per US gallon, or $0.793 per liter. As of the writing of this report, spot diesel fuel prices are about $3.25 per gallon.
In terms of total copper grades, a 0.175% total copper cutoff grade provides a good approximation to the economic cutoff. Tabulating blocks in the design pit at a 0.175% total copper cutoff grade is a good approximation of the mineral reserve.
| | 15.2.2 | Slope Angles and Hydrologic Conditions |
Slope angles are based on the report “Pit Slope Stability Review for El Pilar” by The Mines Group dated November 2010. Table 15-2 summarizes the design recommendations for the El Pilar pit chosen on the basis of that report. Note that these are inter-ramp, not overall, slope angles.
El Pilar Project Form 43-101F1 Technical Report | |
Table 15-2: 2011 El Pilar Slope Parameters
| Pit Slope Parameters for El Pilar 2012 Reserve |
| Material | Inter-Ramp Angle (deg) | Bench Ht (m) | Bench Face Angle (deg) | Catch Bench Width (m) | Toe to Toe Width (m) |
| Overburden | 38 | 10 | 63.4 | 8 | |
| All Other | 52.8 | 10 | 75 | 5 | 7.6 |
Exploration holes drilled at El Pilar were typically dry; there are no known hydrological concerns that affect the mine design.
| | 15.2.3 | Floating Cone Results & Mineral Reserves |
Mercator personnel ran a series of Lerches-Grossman (LG) runs at copper prices of US$ 1.75, 2.00, 2.15, 2.20, 2.25, 2.50, and 2.75 per pound and the economic and recovery parameters shown on Table 15-1 to evaluate shells to use as a guide for final pit design. The inter-ramp slope angles shown on Table 15-2 were used for the runs. The LG shell at a copper price of $2.15 per pound copper was chosen as a guide to the final pit design. Figure 15-1 shows this base case LG shell. The LG shell contains 238.1 million tonnes of ore at 0.309% total copper and 0.136% soluble copper. Total material in the shell is 663.2 million tonnes. This tabulation includes only measured and indicated resource; inferred resource is considered as waste for mine design.
Mercator personnel then designed a final pit, with haul roads, based on the $2.15 cone shell. Figure 15-2 shows this design. The reserve pit contains 258.5 million tonnes of ore at 0.304% total copper and 0.130% soluble copper. Total material in the final pit is 712.3 million tonnes. Compared with the LG shell this is an 8.6% increase in ore tonnes and 12.8% increase in total material. .
IMC also ran a series of floating cones, using the same price and economic parameters, to confirm the Mercator shell. However, IMC ran the cones using overall slope angles based on the actual slope angle (with roads) from the design pit. On the key southeast high wall the overall slope angle was about 46 degrees versus the design inter-ramp angle of 52.8 degrees. An IMC floating cone at a copper price of $2.40 per pound contained 254.8 million total tonnes at 0.304% total copper and 0.132% soluble copper, very similar to the results for the Mercator design pit. The IMC cone also contained 715.4 million total tonnes, again similar to the design pit results. The conclusion is that the Mercator shell is acceptable for pit design purposes, but IMC would consider the applicable design price to be about $2.40 per pound copper. For future analysis, IMC suggests that LG runs should be done with estimated overall slope angles, not inter-ramp angles.
El Pilar Project Form 43-101F1 Technical Report | |
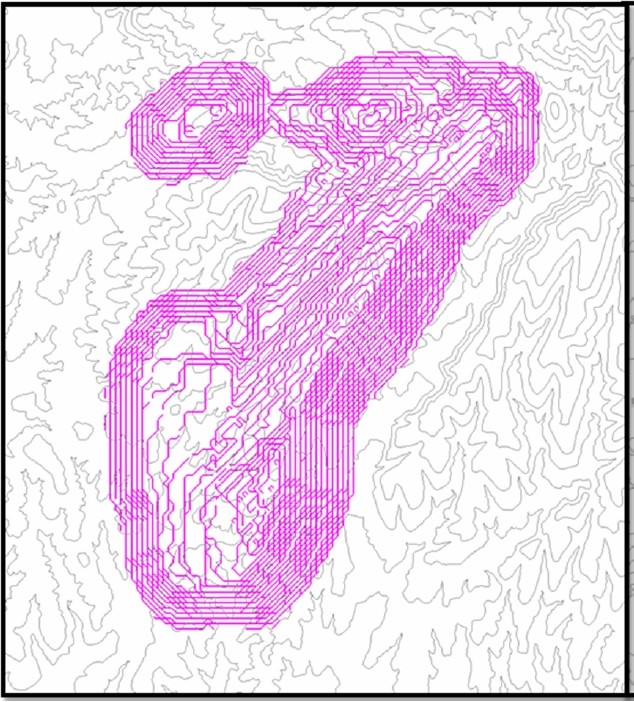 Figure 15-1: Floating Cone Based on Design Price ($2.15 Cu) and Costs.
El Pilar Project Form 43-101F1 Technical Report | |
Figure 15-2: Final Pit Design – Phase 6
Table 15-3 presents the mineral reserve for the El Pilar copper project. The mineral reserve amounts to 258.5 million tonnes at 0.304% total copper and 0.130% soluble copper for 1.73 billion pounds of contained copper. Total material in the pit is 712.3 million tonnes for a waste to ore ratio of 1.76. The schedule is based on routing all blocks that pay for full processing costs to the leach pad.
For this mineral reserve estimate, measured mineral resources inside the reserve pit were converted to proven mineral reserve and indicated mineral resources inside the reserve pit were converted to probable mineral reserve. The mineral reserves are calculated at a constant copper price of $2.15 per pound.
El Pilar Project Form 43-101F1 Technical Report | |
Table 15-3: El Pilar Mineral Reserve
| El Pilar Mineral Reserve |
| | Ore | Total Cu | Sol Cu | Copper |
| Reserve Class | Ktonnes | (%) | (%) | (Mlbs) |
| Proven Mineral Reserve | 108,546 | 0.322 | 0.143 | 771.2 |
| Probable Mineral Reserve | 149,999 | 0.291 | 0.121 | 961.8 |
| Proven/Probable Mineral Reserve | 258,545 | 0.304 | 0.13 | 1,733.0 |
| Total Pit Material | 712,311 Ktonnes. | Waste:Ore 1.76 | |
IMC does not know of any mining, metallurgical, infrastructure, or other factors that might materially affect the mineral reserve. It is also the opinion of IMC that the resource block model was developed in such a way as to account for potential ore loss and mining dilution, so these mining factors have been accounted for. The mineral reserve is consistent with current CIM and NI 43-101 guidelines.
It should be noted herein that the El Pilar Mineral Reserve stated above, if added to the M&I Resource Exclusive of Reserve (Table 14-5), does not add up to M&I Resource Inclusive of Reserve (Table 14-6). There is a difference of 1.9 million tonnes (1,891 Ktonnes) between the two totals. But, technically these do not have to add up to the same total. The reason for this is that the reserve cutoff is calculated in terms of dollars net of process. As such, in the case of the El Pilar reserve, there are 1.9 million tonnes in the reserve that fall below the 0.15% total copper resource cutoff grade. Further, resources are reported in-situ, exclusive of mining factors whereas reserves include mining factors such as dilution, ore loss, etc. Thus, the difference between the two tabulations is to be expected and, for the El Pilar reserves and resources, the difference is minor.
El Pilar Project Form 43-101F1 Technical Report | |
| 16 | MINING METHODS |
| | |
| 16.1 | General |
Mining of the El Pilar copper deposit will be by open pit, with ore and waste blasting and shovel and truck loading and hauling. Waste material will be routed to one of two waste dumps and ore will be routed to the leach pad. This section of the report was prepared under the supervision of the Author, who has relied on work done by Mike Hester, independent mining engineer, IMC (Tucson), an Other Expert for the purposes of this report.
| 16.2 | Operating Parameters and Criteria |
A life of mine plan was developed for El Pilar based on the delivery of ore containing an average of 39,5000 tonnes of recoverable copper per year to a run-of-mine (ROM) leach pad for the first eight years of commercial production. Commercial production in Years 9 through 12 averages about 30,000 tonnes of recoverable copper per year. Annual ore tonnage rates range from 14.65 million tonnes in Year 2 to 23.6 million tonnes during Year 7, averaging about 20 million tonnes per year over the mine life. The peak total material movement is 84.0 million tonnes during Year 8. With this plan, the commercial life of the pit is about 12.5 years. Preproduction stripping is 15.0 million tonnes and is expected to require about six months during the preproduction period (Year 0).
The mine is scheduled to operate 365 days per year. Each day will consist of three 8-hour shifts.
| 16.3 | Pit and Mining Phase Design |
Figure 15-2 in the previous section shows the final pit design for this study based on the Lerches-Grossman (LG) shell at a copper price of $2.15 per pound. The final pit, as well as the mining phases, was designed by Mercator personnel.
Haul roads are 30 m wide, at a maximum grade of 10%. The road width will accommodate trucks up to about the Caterpillar 789C (180 tonne) or Komatsu 830E (220 tonne).
A series of six mining phases were designed to develop the mine from the starter pit in the north to the final pit.
| ● | Phase 1, the starter pit Figure 16-1, mines the highest value ores within about a $1.25 LG shell; |
| ● | Phase 2, Figure 16-2, pushes the pit southwest with ore mining to the north end of a $1.75 shell. The east wall (waste) is pushed to final pit limits; |
| ● | Phase 3, Figure 16-3. In the north this mines out the wedge between phases 1 and 2 and mines the north and east wall to final limits. Phase 1 is also deepened to final pit limits and part of the west satellite pit is mined to establish roads. In the south, phase 2 is deepened to final limits; |
| ● | Phase 4, Figure 16-4, pushes the wall southwest between the $1.75 and $2.00 limits. The east wall is mined to final limits; |
| ● | Phase 5 Figure 16-5, mines the main pit to the final $2.15 limits, and; |
El Pilar Project Form 43-101F1 Technical Report | |
| ● | Phase 6, Figure 15-2, also final pit, mines the west satellite pit to final limits. |
Figure 16-1: Final Pit Design - Starter Pit
El Pilar Project Form 43-101F1 Technical Report | |
Figure 16-2: Final Pit Design – Phase 2
El Pilar Project Form 43-101F1 Technical Report | |
Figure 16-3: Final Pit Design - Phase 3
El Pilar Project Form 43-101F1 Technical Report | |
Figure 16-4: Final Pit Design - Phase 4
El Pilar Project Form 43-101F1 Technical Report | |
Figure 16-5: Final Pit Design - Phase 5
In general, the phase designs are adequate for feasibility study purposes. Phases 1 and 2 can be mined as shown.
In Phase 3 the northeast wedge of material between Phases 1 and 2 will be a bit problematic to mine. Initially a road will be required on the east wall until mining gets down to the 1305 m or
El Pilar Project Form 43-101F1 Technical Report | |
1295 m elevations and a connection can be made with the Phase 1 road. The west wall road could then be mined out to get to the Phase 3 design.
In the Phase 4 design, as shown, the access roads into the pit will be cut off when mining goes below the 1255 m bench. In the actual mining plan a fill road is constructed on the north wall to exit the pit through the north exits.
Phases 5 and 6 can be mined as shown.
Table 16-1 shows the resources in the mining phases at ore cutoff, i.e. a positive net of processing value. The final pit design contains 258.5 million tonnes of ore at 0.304% total copper and 0.130% soluble copper. Total material is 712.3 million tonnes for a waste to ore ratio of 1.76.
Table 16-1: El Pilar Mining Phases
| Mining Phases |
Mining Phase | Ore
Ktonnes | Net of
Process
(US$/t) | Total
Copper
(%) | Soluble Copper
(%) | Recov. Copper (%) | Copper Recov . (%) | Waste Ktonnes | Total Ktonnes | Waste:Ore Ratio |
| 1 | 43,344 | 9.3 | 0.355 | 0.193 | 0.237 | 66.8% | 47,821 | 91,165 | 1.1 |
| 2 | 29,920 | 7.01 | 0.317 | 0.143 | 0.19 | 59.9% | 57,900 | 87,820 | 1.94 |
| 3 | 43,161 | 5.96 | 0.304 | 0.123 | 0.168 | 55.3% | 77,824 | 120,985 | 1.8 |
| 4 | 56,596 | 5.98 | 0.3 | 0.123 | 0.169 | 56.3% | 115,619 | 172,215 | 2.04 |
| 5 | 77,391 | 4.74 | 0.278 | 0.098 | 0.143 | 51.4% | 138,118 | 215,509 | 1.78 |
| 6 | 8,132 | 6.24 | 0.253 | 0.145 | 0.174 | 68.8% | 16,485 | 24,617 | 2.03 |
| Total | 258,544 | 6.29 | 0.304 | 0.13 | 0.175 | 57.6% | 453,767 | 712,311 | 1.76 |
| 16.4 | Mining Production Schedule |
The mine production schedule is based on providing sufficient ore to the heap leach/SXEW facility to produce an average of 39,500 tonnes of finished copper cathode per year for Years 1 through 8 and 30,000 tonnes of copper per year during Years 9 through 12.
Table 16-2 shows the details of the annual production schedule. Preproduction is assumed to be eight months and consists of 15 million tonnes total material of which 2,250 Ktonnes is ore. Table 16-3 shows the Year 0 through Year 2 mine production schedule broken out by month.
El Pilar Project Form 43-101F1 Technical Report | |
Table 16-2 Mine Production Schedule by Year
| Mine Production Schedule |
| | | Copper Grades | | | | | | | |
Mining Period | Ore Konnes | Total Copper % | Soluble Copper % | Recoverable Copper % | Residual Copper % | Ratio (TCu/ASCu) | Waste
Konnes | Total Konnes | Waste: Ore Ratio | Acid Cons. (kg/t) | Copper Recovery (%) | Contained Cu (Klbs) | Recovered Cu (Klbs) |
| PP | 2,250 | 0.309 | 0.191 | 0.221 | 0.118 | 0.618 | 12,750 | 15,000 | 5.67 | 16.00 | 71.5% | 15,327 | 10,962 |
| Year 1 | 17,800 | 0.355 | 0.202 | 0.243 | 0.153 | 0.569 | 22,200 | 40,000 | 1.25 | 16.00 | 68.4% | 139,309 | 95,359 |
| Year 2 | 14,650 | 0.382 | 0.206 | 0.256 | 0.176 | 0.539 | 28,350 | 43,000 | 1.94 | 17.00 | 67.0% | 123,376 | 82,682 |
| Year 3 | 20,150 | 0.315 | 0.158 | 0.202 | 0.157 | 0.502 | 47,849 | 67,999 | 2.37 | 18.00 | 64.1% | 139,931 | 89,735 |
| Year 4 | 21,110 | 0.313 | 0.136 | 0.183 | 0.177 | 0.435 | 46,889 | 67,999 | 2.22 | 19.00 | 58.5% | 145,667 | 85,167 |
| Year 5 | 21,900 | 0.31 | 0.127 | 0.174 | 0.183 | 0.410 | 45,099 | 66,999 | 2.06 | 20.00 | 56.1% | 149,670 | 84,009 |
| Year 6 | 23,500 | 0.289 | 0.125 | 0.166 | 0.164 | 0.433 | 49,000 | 72,500 | 2.09 | 21.00 | 57.4% | 149,725 | 86,002 |
| Year 7 | 23,600 | 0.28 | 0.121 | 0.165 | 0.159 | 0.432 | 54,400 | 78,000 | 2.31 | 22.00 | 58.9% | 145,680 | 85,848 |
| Year 8 | 21,800 | 0.312 | 0.136 | 0.181 | 0.176 | 0.436 | 62,200 | 84,000 | 2.85 | 23.00 | 58.0% | 149,948 | 86,990 |
| Year 9 | 20,600 | 0.293 | 0.103 | 0.151 | 0.19 | 0.352 | 51,900 | 72,500 | 2.52 | 24.00 | 51.5% | 133,065 | 68,577 |
| Year 10 | 21,000 | 0.262 | 0.107 | 0.149 | 0.155 | 0.408 | 15,671 | 36,671 | 0.75 | 25.00 | 56.9% | 121,297 | 68,983 |
| Year 11 | 20,200 | 0.278 | 0.098 | 0.143 | 0.18 | 0.353 | 8,907 | 29,107 | 0.44 | 26.00 | 51.4% | 123,802 | 63,683 |
| Year 12 | 19,000 | 0.302 | 0.096 | 0.147 | 0.206 | 0.318 | 4,835 | 23,835 | 0.25 | 27.00 | 48.7% | 126,500 | 61,575 |
| Year 13 | 10,985 | 0.284 | 0.075 | 0.118 | 0.209 | 0.264 | 3,718 | 14,702 | 0.34 | 28.00 | 41.7% | 68,775 | 28,685 |
| Total/Avg. | 258,545 | 0.304 | 0.130 | 0.175 | 0.174 | 0.428 | 453,768 | 712,312 | 1.95 | 21.86 | 57.6% | 1,732,074 | 998,256 |
El Pilar Project Form 43-101F1 Technical Report | |
Table 16-3: Mine Production Schedule Year 0 – Year 2 by Months
| Mine Production Schedule |
Mining
Period | Ore
Ktonnes | Copper Grades | Waste
Ktonnes | Total
Ktonnes | Waste: Ore
Ratio | Acid Cons. (kg/t) | Copper Recovery
(%) | Contained Cu (Mlbs) | Recovered Cu (Mlbs) |
Total Copper (%) | Soluble Copper (%) | Recov. Copper (%) | Residual Copper (%) | Ratio TCu/ASCu (%) |
| PP -3 | - | - | - | - | - | - | - | - | - | - | - | - | - |
| PP -4 | - | - | - | - | - | - | - | - | - | - | - | - | - |
| PP -5 | - | - | - | - | - | - | 383 | 383 | - | - | - | - | - |
| PP -6 | - | - | - | - | - | - | 738 | 738 | - | - | - | - | - |
| PP -7 | - | - | - | - | - | - | 1,220 | 1,220 | - | - | - | - | - |
| PP -8 | - | - | - | - | - | - | 1,985 | 1,985 | - | - | - | - | - |
| PP -9 | - | - | - | - | - | - | 2,259 | 2,259 | - | - | - | - | - |
| PP -10 | 1,896 | 0.297 | 0.176 | 0.208 | 0.121 | 0.594 | 2,218 | 4,114 | 1.17 | 16.0 | 70.4% | 12.4 | 0.0 |
| PP -11 | 244 | 0.393 | 0.286 | 0.306 | 0.107 | 0.728 | 1,501 | 1,745 | 6.16 | 16.0 | 63.8% | 2.1 | 7.1 |
| PP -12 | 110 | 0.335 | 0.236 | 0.258 | 0.099 | 0.705 | 1,397 | 1,507 | 12.66 | 16.0 | 73.4% | 0.8 | 1.7 |
| Year 1 -1 | 1,540 | 0.346 | 0.229 | 0.257 | 0.118 | 0.660 | 1,858 | 3,399 | 1.21 | 16.0 | 74.29% | 11.8 | 1.0 |
| Year 1 -2 | 1,572 | 0.323 | 0.208 | 0.237 | 0.114 | 0.646 | 1,497 | 3,068 | 0.95 | 16.0 | 73.39% | 11.2 | 6.4 |
| Year 1 -3 | 1,379 | 0.351 | 0.231 | 0.260 | 0.120 | 0.658 | 2,017 | 3,397 | 1.46 | 16.0 | 74.03% | 10.7 | 7.0 |
| Year 1 -4 | 1,352 | 0.340 | 0.206 | 0.242 | 0.134 | 0.605 | 1,936 | 3,288 | 1.43 | 16.0 | 71.03% | 10.1 | 7.2 |
| Year 1 -5 | 1,454 | 0.402 | 0.248 | 0.289 | 0.154 | 0.617 | 1,943 | 3,397 | 1.34 | 16.0 | 71.98% | 12.9 | 7.0 |
| Year 1 -6 | 1,607 | 0.329 | 0.170 | 0.216 | 0.159 | 0.518 | 1,680 | 3,287 | 1.05 | 16.0 | 65.67% | 11.7 | 8.5 |
| Year 1 -7 | 1,506 | 0.284 | 0.127 | 0.171 | 0.156 | 0.449 | 1,891 | 3,397 | 1.26 | 16.0 | 60.40% | 9.4 | 7.9 |
| Year 1 -8 | 1,495 | 0.282 | 0.120 | 0.163 | 0.163 | 0.424 | 1,903 | 3,397 | 1.27 | 16.0 | 57.60% | 9.3 | 6.5 |
| Year 1 -9 | 1,627 | 0.386 | 0.204 | 0.252 | 0.183 | 0.527 | 1,662 | 3,289 | 1.02 | 16.0 | 65.15% | 13.9 | 5.9 |
| Year 1 -10 | 1,580 | 0.359 | 0.203 | 0.244 | 0.156 | 0.564 | 1,817 | 3,397 | 1.15 | 16.0 | 68.08% | 12.5 | 8.2 |
| Year 1 -11 | 1,351 | 0.496 | 0.284 | 0.344 | 0.212 | 0.574 | 1,937 | 3,288 | 1.43 | 16.0 | 69.38% | 14.8 | 8.2 |
| Year 1 -12 | 1,336 | 0.379 | 0.208 | 0.256 | 0.171 | 0.549 | 2,059 | 3,395 | 1.54 | 16.0 | 67.63% | 11.2 | 9.4 |
| Year 2 -1 | 1,249 | 0.434 | 0.258 | 0.308 | 0.176 | 0.595 | 2,401 | 3,651 | 1.92 | 17.0 | 71.02% | 12.0 | 7.9 |
| Year 2 -2 | 1,229 | 0.442 | 0.257 | 0.310 | 0.185 | 0.582 | 2,068 | 3,297 | 1.68 | 17.0 | 70.19% | 12.0 | 8.4 |
| Year 2 -3 | 1,201 | 0.382 | 0.208 | 0.260 | 0.174 | 0.544 | 2,450 | 3,651 | 2.04 | 17.0 | 67.94% | 10.1 | 8.5 |
| Year 2 -4 | 1,193 | 0.455 | 0.268 | 0.319 | 0.187 | 0.589 | 2,342 | 3,535 | 1.96 | 17.0 | 70.16% | 12.0 | 7.4 |
| Year 2 -5 | 1,218 | 0.346 | 0.173 | 0.224 | 0.173 | 0.501 | 2,434 | 3,652 | 2.00 | 17.0 | 64.61% | 9.3 | 8.2 |
| Year 2 -6 | 1,255 | 0.452 | 0.267 | 0.320 | 0.185 | 0.590 | 2,280 | 3,536 | 1.82 | 17.0 | 70.70% | 12.5 | 6.6 |
| Year 2 -7 | 1,238 | 0.311 | 0.159 | 0.202 | 0.152 | 0.510 | 2,414 | 3,652 | 1.95 | 17.0 | 64.90% | 8.5 | 8.3 |
| Year 2 -8 | 1,230 | 0.436 | 0.228 | 0.288 | 0.208 | 0.523 | 2,423 | 3,654 | 1.97 | 17.0 | 66.24% | 11.8 | 6.3 |
| Year 2 -9 | 1,261 | 0.338 | 0.184 | 0.227 | 0.154 | 0.543 | 2,269 | 3,530 | 1.80 | 17.0 | 67.08% | 9.4 | 7.5 |
| Year 2 -10 | 1,233 | 0.272 | 0.123 | 0.163 | 0.150 | 0.451 | 2,421 | 3,654 | 1.96 | 17.0 | 59.76% | 7.4 | 6.6 |
| Year 2 -11 | 1,238 | 0.379 | 0.195 | 0.248 | 0.184 | 0.515 | 2,296 | 3,535 | 1.85 | 17.0 | 65.52% | 10.4 | 5.2 |
| Year 2 -12 | 1,103 | 0.333 | 0.147 | 0.198 | 0.186 | 0.442 | 2,551 | 3,654 | 2.31 | 17.0 | 59.51% | 8.1 | 6.5 |
Ore production fluctuates by year to level cathode production at relatively consistent rates. The schedule also ramps up the total material movement over the first several years of mining from 40 million tonnes in Year 1 to 84 million tonnes during Year 8. The commercial life of the pit is about 12.5 years.
IMC could replicate the El Pilar mine production schedule using the Mercator phases. The mine production schedule is reasonable. It is not overly aggressive in terms of benches mined from a phase in a year or total tonnes mined from a phase in a year.
The ultimate copper recovery and acid consumption (kg acid per ore tonne) are also shown by time period based on the values incorporated into the block model. The indicated life of mine
El Pilar Project Form 43-101F1 Technical Report | |
recovery is 57.6%. Life of mine acid consumption used for the reserve model is about 21.9 kg per ore tonne or about 12.5 kg acid per kg copper.
| 16.5 | Pit Wall Slope Stability |
The following is a summary of slope stability recommendations by independent geotechnical consultant, Ken Meyers of The Mines Group (Reno) in a 2010 report entitled “Pit Slope Stability Review for El Pilar Project”. In that report Meyers evaluated previous work done by Golder Associates for ML and came up with his own slope stability recommendations on the basis of new field work and geotechnical modeling. This section is unchanged from the 2011 Study, and is still reliable and current. The following paragraphs are excerpted from Meyers’ report, until noted otherwise:
The information extracted from the Golder report combined with the numerous models, analyses, Factors of Safety, reliabilities, and potential inter-ramp angles has produced an almost dizzying array of design choices. The [Golder] recommendations are limited to slopes in the cemented alluvium which includes the cemented portions of the overburden (Qfy), Qwu, Qwt, and Qwl. The uncemented portions of the alluvium or overburden are limited to an approach that will ultimately leave a uniform angle of repose inter-ramp slope at about 38°. The number of benches affected by the uncemented overburden is expected to vary, ranging from as little as 1, to as many as 4 single bench heights. Based on new field work and geotechnical modeling by The Mines Group completed in 2010, a description of the range of design choices based on this new modeling is as follows:
| | 16.5.2 | Conservative Status Quo –IRA = 45° |
This is the current recommendation from the Golder report which they describe as conservative but reasonable for the feasibility level of design. It is based on an assumed effective stress cohesion value of 138 kN/m2, which is more than one (1) standard deviation below the mean. Although the report implies it has a Factor of Safety on the order of 1.3, new analysis indicates that this inter-ramp angle has a Factor of Safety closer to 1.4.
| | 16.5.3 | Reasonably Safe –IRA = 53° |
This inter-ramp slope allows either a single bench height or double bench height to be used with a bench face angle of 75° (although the single bench height would require use of the practical minimum catch bench width of 5 m). It assures a deterministic Factor of Safety of at least 1.2 even if the mobilized effective stress cohesion is a full standard deviation below the mean (i.e., 152.5 kN/m2). Failures are certainly possible, even likely, but should be infrequent and scattered, most often associated with limited pockets of weak cementation. Most if not all failures should be contained on a single bench.
| | 16.5.4 | Practical Maximum –IRA = 58° |
This inter-ramp slope can be constructed using a single bench height, but only if an 82° bench face angle can be maintained and combined with the use of the practical minimum catch bench
El Pilar Project Form 43-101F1 Technical Report | |
width of 5m. Otherwise a double bench configuration will be necessary with a 75° bench face angle or steeper. A deterministic Factor of Safety of 1.2 can be achieved, but only if the full mean cohesive strength value of 191.5 kN/m2 is mobilized. Failures are likely to be a common occurrence and fairly widespread (forming wherever the cohesive strength drops substantially below the mean).
| | 16.5.5 | High Risk Maximum –IRA = 63° |
This inter-ramp slope can only be achieved by using a double bench configuration while maintaining a bench face angle of at least 75° or steeper in combination with the use of the practical minimum catch bench width of 5 m. The deterministic Factor of Safety is slightly less than 1.1, even if the full mean cohesive strength value of 191.5 kN/m2 is mobilized. The operator is likely to be fighting failures throughout the pit with many areas in various stages of failure development and cleanup of failure debris would be an ongoing, daily activity. Keeping haul roads open will become difficult. Operational safety will be a major concern.
| | 16.5.6 | Absolute Maximum –IRA = 68° |
This inter-ramp slope can only be achieved by using a double bench configuration while maintaining a bench face angle of at least 82° or steeper in combination with the use of the practical minimum catch bench width of 5 m. Even if the full mean cohesive strength of 191.5 kN/m2 is mobilized, the deterministic Factor of Safety will be at 1.0 (incipient failure). The probability of failure will be at 50% (and reliability at only 50%). In theory about half the pit surface will be in a failure state. Catch benches will fill with debris and disappear over time. Keeping haul roads open will become a continuous struggle and interruptions in operations will be common. Operational safety will remain a major concern and will become particularly dangerous as the pit deepens and the pit floor narrows. There will be little room to get out of the way of a developing slide. Escape routes out of the pit will be unreliable as will ingress for emergency response personnel.
Although we have attempted to characterize the full range of pit design alternatives, we would not recommend implementation of any pit slope design alternative beyond the Practical Maximum IRA of 58°. We strongly agree with Golder’s recommendation to attempt to optimize the pit slope design through performance observations during operations. An effective monitoring program will also be necessary to accomplish optimization. We would further like to reiterate the importance of controlled blasting near the final pit wall. Blast designs that would induce damaging particle velocities behind the bench face are likely to break the cementation bonds in the matrix of fines surrounding the gravel and cobble sized clasts of the conglomerate, effectively reducing the cohesive shear strength. This would result in an increase in raveling and slide activity and would quickly begin to fill catch benches.
Table 16-4 is a summary table of recommended catch bench widths and inter-ramp angles.
El Pilar Project Form 43-101F1 Technical Report | |
Table 16-4: Summary of Recommended Catch Bench Widths and Inter-Ramp Angles
| Recommended Catch Bench Widths and Inter-Ramp Angles |
Inter-Ramp Angle (deg) | Bench Height (m) | Bench Face Angle (deg) | Catch Bench Width (m) | Total Toe to Toe Width (m) |
| 45 | 10 | 75 | 7.3 | 10.0 |
| 46 | 10 | 75 | 7.0 | 9.7 |
| 47 | 10 | 75 | 6.6 | 9.3 |
| 48 | 10 | 75 | 6.3 | 9.0 |
| 49 | 10 | 75 | 6.0 | 8.7 |
| 50 | 10 | 75 | 5.7 | 8.4 |
| 51 | 10 | 75 | 5.4 | 8.1 |
| 52 | 10 | 75 | 5.1 | 7.8 |
| 53 | 10 | 75 | 4.9 | 7.5 |
| 54 | 10 | 75 | - | - |
| 55 | 10 | 75 | - | - |
| 56 | 10 | 75 | - | - |
| 57 | 10 | 75 | - | - |
| 58 | 10 | 75 | - | - |
| | | | | |
| 45 | 20 | 75 | 14.6 | 20.0 |
| 46 | 20 | 75 | 14.0 | 19.3 |
| 47 | 20 | 75 | 13.3 | 18.7 |
| 48 | 20 | 75 | 12.6 | 18.0 |
| 49 | 20 | 75 | 12.0 | 17.4 |
| 50 | 20 | 75 | 11.4 | 16.8 |
| 51 | 20 | 75 | 10.8 | 16.2 |
| 52 | 20 | 75 | 10.3 | 15.6 |
| 53 | 20 | 75 | 9.7 | 15.1 |
| 54 | 20 | 75 | 9.2 | 14.5 |
| 55 | 20 | 75 | 8.6 | 14.0 |
| 56 | 20 | 75 | 8.1 | 13.5 |
| 57 | 20 | 75 | 7.6 | 13.0 |
| 58 | 20 | 75 | 7.1 | 12.5 |
| | 16.5.7 | Pit Slope Parameters Chosen for El Pilar Reserve Model |
Using the MineSight program, a number of Lerches Grossman reserve scenarios were run under a wide variety of pit slope angles that Meyers (see previous sections) considered to be within low to acceptable risk limits. The objective was to determine risk vs. reward; for example, if going to a steep inter-ramp angle did not diminish waste stripping substantially, the added risk of the steeper bench face clearly would not be warranted.
El Pilar Project Form 43-101F1 Technical Report | |
Table 16-5 summarizes the final parameters chosen for the EL Pilar pit benches and slopes. The 380 inter-ramp angle in overburden (Qfy) was utilized only for the first four benches from the top down. After the upper 40 m, the overburden material becomes increasingly more consolidated and competent with depth and an inter-ramp angle of 52.8 degrees is assumed, which is on the upper end of Meyers’ “conservative” designation for slope stability risk.
Table 16-5: 2011 El Pilar Pit Slope Parameters
| Pit Slope Parameters for El Pilar 2012 Reserve |
| Material | Inter-Ramp
Angle (deg) | Bench Ht
(m) | Bench Face
Angle (deg) | Catch Bench
Width (m) | Toe to Toe
Width (m) |
| Overburden | 38 | 10 | 63.4 | 8 | |
| All Other | 52.8 | 10 | 75 | 5 | 7.6 |
| 16.6 | Waste Rock Storage Areas |
The 453.8 million tonnes of mine waste is stored in various waste storage facilities. Figure 16-6 shows the final configuration of the pit and waste storage facilities. The waste storage facility to the east of the pit contains 151.7 million tonnes of waste. The facility to the west of the pit contains 172.0 million tonnes, and the north facility contains 46.7 million tonnes. In addition to these, 83.3 million tonnes of waste is stored in the north end of the pit during Years 7 through 13.
The waste storage facilities are built in two 10 m lifts at the angle of repose of 36o (1.38H:1V) with a 22 m setback between every other lift, i.e. every 20 m vertically. This gives an overall angle of about 22o (2.5H:1V) which is conducive to long term stability and re-vegetation. The volume calculations also assumed a material swell of about 30% on the facilities. This is slightly less swell than is assumed for mine equipment requirements calculations (40%); some re-compaction of the waste is assumed.
El Pilar Project Form 43-101F1 Technical Report | |
Figure 16-6: Final Pit and Dumps (Year 13)
El Pilar Project Form 43-101F1 Technical Report | |
Figure 16-7 through Figure 16-19 show end of year mine and dump drawings for the project years.
Figure 16-7: End of Preproduction Year 0
El Pilar Project Form 43-101F1 Technical Report | |
Figure 16-8: End of Year 1
El Pilar Project Form 43-101F1 Technical Report | |
Figure 16-9: End of Year 2
El Pilar Project Form 43-101F1 Technical Report | |
Figure 16-10: End of Year 3
El Pilar Project Form 43-101F1 Technical Report | |
Figure 16-11: End of Year 4
El Pilar Project Form 43-101F1 Technical Report | |
Figure 16-12: End of Year 5
El Pilar Project Form 43-101F1 Technical Report | |
Figure 16-13: End of Year 6
El Pilar Project Form 43-101F1 Technical Report | |
Figure 16-14: End of Year 7
El Pilar Project Form 43-101F1 Technical Report | |
Figure 16-15: End of Year 8
El Pilar Project Form 43-101F1 Technical Report | |
Figure 16-16: End of Year 9
El Pilar Project Form 43-101F1 Technical Report | |
Figure 16-17: End of Year 10
El Pilar Project Form 43-101F1 Technical Report | |
Figure 16-18: End of Year 11
El Pilar Project Form 43-101F1 Technical Report | |
Figure 16-19: End of Year 12
El Pilar Project Form 43-101F1 Technical Report | |
| | 16.8.1 | Summary of Equipment Requirements |
Mine major equipment requirements, irrespective of whether the equipment is part of an owner operated or contract mining mine, were sized and estimated on a first principals basis based on the mine production schedule, the mine work schedule, and estimated equipment productivity rates. The work schedule is based on three 8-hour shifts per day for 365 days per year. The mine equipment estimate assumes a well-managed mining operation with a well-trained labor pool, and that all equipment is new at the start of mining.
Table 16-6 shows major equipment requirements by time period.
Table 16-6: Major Equipment Requirements
| Mine Major Equipment Requirements |
| | | Commercial | Peak |
| | | Production | Commercial |
| Equipment Type: | Preproduction | Years 1-3 | Production |
| Blasthole Drill (229mm) | 2 | 3 | 3 |
| Hydraulic Shovel (31 cu m) | 2 | 4 | 4 |
| Rubber Tired Loader (18 cu m) | 1 | 1 | 1 |
| Haul Truck (186 mt) | 5 | 15 | 21 |
| Track Dozer (451 kw) | 4 | 5 | 5 |
| Wheel Dozer (362 kw) | 2 | 3 | 3 |
| Motor Grader (4.9 m) | 2 | 2 | 2 |
| Water Truck (50,000 liter) | 2 | 2 | 2 |
This represents the equipment required to perform the following duties:
| ● | Construct roads to the initial mining areas as well as to the crusher and waste storage facilities; |
| ● | Preproduction development required to expose ore for initial production; |
| ● | Mine and transport ore to the crusher. Mine and transport waste material to the appropriate waste storage areas; |
| ● | Maintain all the mine work areas, in-pit haul roads, and external haul roads. Also maintain the waste storage areas. |
The equipment list does not include equipment required for construction of the leach pad or plant area. That equipment is included in the capital requirements tabulated by M3. It also does not include any equipment required for the leach pad during commercial operations. Current plans are to contract mining to an independent mining contractor for the preproduction period (Year 0) and for Years 1 and 2. Starting in Year 3 and extending throughout the LOM owner mining is planned. The option of whether to use contract mining in the first two and one half years, or to consider other options, remains under review. However, a contract mining financial case option
El Pilar Project Form 43-101F1 Technical Report | |
is included in the Economic Analysis section of this report, based on a LOM contract mining bid from a Mexican mining contractor.
| | 16.8.2 | Production and Operating Parameters |
| 16.8.2.1 | Mine Operating Schedule |
Table 16-7 shows the mine operating schedule used as the basis of the equipment calculations. The left half of the table shows the mine material movements by material type by time period. Waste is broken out by overburden and rock waste. There is a small amount of re-handle during the 4th quarter of preproduction. In the IMC cost model the ore mined during the 2nd and 3rd quarters of preproduction are re-handled, crushed, and placed on the pad during the 4th quarter.
The right half of Table 16-7 shows the mine operating schedule. It can be seen that the mine is scheduled to operate three 8-hour shifts per day, 365 days per year, for 1,095 available shifts per year. Four mining crews are required.
El Pilar Project Form 43-101F1 Technical Report | |
Table 16-7: Summary of Mine Material Movements & Operations Schedule
| Summary of Mine Material Movements and Mine Operations Schedule |
| | Mine Material Movements | Mine Operations Schedule |
| Time | Ore | Waste | Total | Hours/ | Shifts/ | Days/ | Weeks/ | Days/ | Shifts/ | Years/ | Avail. | Crews |
| Period | ROM | Qfy | Qw | Bx | (kt) | Shift | Day | Week | Year | Year | Year | Period | Shifts | Reqd. |
| PP Q2 | - | 1,068 | - | - | 1,068 | 8 | 3 | 7 | 52 | 365 | 1,095 | 0.25 | 274 | 4 |
| PP Q3 | - | 2,933 | - | - | 2,933 | 8 | 3 | 7 | 52 | 365 | 1,095 | 0.25 | 274 | 4 |
| PP Q4 | 2,250 | 4,587 | 616 | 361 | 5,563 | 8 | 3 | 7 | 52 | 365 | 1,095 | 0.25 | 274 | 4 |
| Year 1 Q1 | 4,492 | 3,260 | 1,432 | 680 | 5,372 | 8 | 3 | 7 | 52 | 365 | 1,095 | 0.25 | 274 | 4 |
| Year 1 Q2 | 4,413 | 3,886 | 1,011 | 662 | 5,559 | 8 | 3 | 7 | 52 | 365 | 1,095 | 0.25 | 274 | 4 |
| Year 1 Q3 | 4,627 | 2,434 | 2,096 | 926 | 5,456 | 8 | 3 | 7 | 52 | 365 | 1,095 | 0.25 | 274 | 4 |
| Year 1 Q4 | 4,267 | 2,432 | 2,426 | 955 | 5,812 | 8 | 3 | 7 | 52 | 365 | 1,095 | 0.25 | 274 | 4 |
| Year 2 Q1 | 3,680 | 2,899 | 2,848 | 1,172 | 6,920 | 8 | 3 | 7 | 52 | 365 | 1,095 | 0.25 | 274 | 4 |
| Year 2 Q2 | 3,667 | 4,999 | 752 | 1,305 | 7,055 | 8 | 3 | 7 | 52 | 365 | 1,095 | 0.25 | 274 | 4 |
| Year 2 Q3 | 2,469 | 1,856 | 2,304 | 677 | 4,837 | 8 | 3 | 7 | 52 | 365 | 1,095 | 0.25 | 274 | 4 |
| Year 2 Q4 | 3,574 | 3,126 | 3,464 | 679 | 7,269 | 8 | 3 | 7 | 52 | 365 | 1,095 | 0.25 | 274 | 4 |
| Year 3 | 20,150 | 32,663 | 14,575 | 611 | 47,849 | 8 | 3 | 7 | 52 | 365 | 1,095 | 0.25 | 274 | 4 |
| Year 4 | 21,110 | 22,730 | 23,171 | 988 | 46,889 | 8 | 3 | 7 | 52 | 365 | 1,095 | 1 | 274 | 4 |
| Year 5 | 21,900 | 20,914 | 22,516 | 1,668 | 45,099 | 8 | 3 | 7 | 52 | 365 | 1,095 | 1 | 274 | 4 |
| Year 6 | 23,500 | 27,177 | 21,334 | 488 | 49,000 | 8 | 3 | 7 | 52 | 365 | 1,095 | 1 | 274 | 4 |
| Year 7 | 23,600 | 22,120 | 32,280 | 0 | 54,400 | 8 | 3 | 7 | 52 | 365 | 1,095 | 1 | 274 | 4 |
| Year 8 | 21,800 | 48,734 | 13,466 | 0 | 62,200 | 8 | 3 | 7 | 52 | 365 | 1,095 | 1 | 274 | 4 |
| Year 9 | 20,600 | 9,074 | 42,826 | 0 | 51,900 | 8 | 3 | 7 | 52 | 365 | 1,095 | 1 | 274 | 4 |
| Year 10 | 21,000 | 0 | 15,671 | 0 | 15,671 | 8 | 3 | 7 | 52 | 365 | 1,095 | 1 | 274 | 4 |
| Year 11 | 20,200 | 0 | 8,907 | 0 | 8,907 | 8 | 3 | 7 | 52 | 365 | 1,095 | 1 | 274 | 4 |
| Year 12 | 19,000 | 0 | 4,835 | 0 | 4,835 | 8 | 3 | 7 | 52 | 365 | 1,095 | 1 | 274 | 4 |
| Year 13 | 10,985 | 0 | 3,718 | 0 | 3,718 | 8 | 3 | 7 | 52 | 365 | 1,095 | 1 | 274 | 4 |
| TOTAL | 257,284 | 216,893 | 220,249 | 11,172 | 448,313 | | | | | | | | | |
El Pilar Project Form 43-101F1 Technical Report | |
| 16.8.2.2 | Operating Time per Shift |
Operating time per shift (see Table 16-8) represents the actual time during the shift that the equipment is “productive”. This is equal to the total shift time less all scheduled and unscheduled delays.
Table 16-8: Operating Time per Shift
| Operating Time Per Shift |
| | Hours | Minutes |
| Scheduled Time Per Shift | 8 | 480 |
| Less Scheduled Nonproductive Times | | |
| Travel Time/Shift Change/Blasting Equipment Inspection Lunch/Breaks | 0.5 | 30 |
| Fueling, Lube, & Service | 0.5 | 30 |
| Net Scheduled Productive Time (Metered Operating Time) | 7 | 420 |
| Job Efficiency (50 Productive Minutes Per Metered Hour) | 83.3% | 83.3% |
| Net Productive Operating Time Per Shift | 5.83 | 350 |
| Overall Efficiency Factor | 72.92% | 72.92% |
| 16.8.2.3 | Material Characteristics |
Table 16-9 summarizes the material characteristics used for equipment productivity calculations. Bulk density information was stored in the resource model on a block by block basis, based on rock type. The in situ densities are averages of the blocks incorporated in each material type. IMC assumed a material handling swell factor of 40% for material mined from the pit. Moisture content of the material is considered negligible from the mine material handling standpoint.
Table 16-9: Material Characteristics.
| Material Characteristics |
| Parameter | Ore | OB Waste | Rock Waste |
| In-situ Density (tonnes/cu m) | 2.31 | 2.17 | 2.31 |
| Swell Factor | 40% | 40% | 40% |
| Loose Density (tonnes/cu m) | 1.65 | 1.55 | 1.65 |
El Pilar Project Form 43-101F1 Technical Report | |
Table 16-10: Additional Material Characteristics
| Material Characteristics |
| | Units | ROM Ore | Crush Ore | Overburden Waste | Rock Waste | Breccia Waste |
| Parameter |
| BULK DENSITY: | | | | | | |
| Dry Bank Density | (mt/cu m) | 2.31 | 2.45 | 2.17 | 2.31 | 2.45 |
| Material Handling Swell | (%) | 40.00% | 40.00% | 40.00% | 40.00% | 40.00% |
| Moisture Content | (%) | 4.00% | 4.00% | 4.00% | 4.00% | 4.00% |
| Dry Loose Density | (mt/cu m) | 1.65 | 1.75 | 1.55 | 1.65 | 1.75 |
| Wet Loose Density | (mt/cu m) | 1.72 | 1.82 | 1.61 | 1.72 | 1.82 |
| MATERIAL STRENGTH: | | | | | | |
| Strength Index 1-5 | (none) | 5 | 3 | 6 | 5 | 3 |
| Nominal Compressive Strength | (psi) | 5,000 | 15,000 | 1,500 | 5,000 | 15,000 |
| Nominal Compressive Strength | (mpa) | 34 | 103 | 10 | 34 | 103 |
| Drill/Blast This Material? | (none) | yes | yes | yes | yes | yes |
| NOTES: | | | | | | |
| Strength Index: 1=very strong, 2=strong, 3=moderate, 4=weak, 5=very weak, 6= not drill/blasted. |
| Description of Strength Index: | | | | | | |
| IMC Brown | | | | | | |
| Index Description | | | | | | |
| 1R6 Specimen can only be chipped with a hammer. | | | |
| 2R5 Specimen requires many blows with a hammer to fracture. | | |
| 3R4 More than one blow to fracture. | | | | | |
| 4R3 Can be fractured with a single blow. | | | | | |
| 5R2 Can be peeled with a knife with difficulty, can indent with firm hammer blow. | |
| 16R0-R1 Crumbles under firm blow with hammer, can be peeled with pocket knife | |
| 16.8.2.4 | Drilling & Blasting |
The primary drilling fleet consists of diesel powered drills with a pull-down of about 60,000 pounds or about 27,300 kg, such as the Atlas Copco DML drill. Material will be drilled with 229 mm diameter holes on 10m mining benches with 1.5 m of sub-grade drilling.
Tables 16-11 and 16-12 show detailed blasting and drill productivity calculations that were used for an eight hour shift, respectively. Shift productivities are estimated at 21,357 tonnes for ore and rock waste and 30,963 tonnes for overburden waste. Annual production per drill is estimated at 15.9 million tonnes for ore and rock waste and 23.1 million tonnes for overburden.
El Pilar Project Form 43-101F1 Technical Report | |
Table 16-11: Blasting Inputs & Assumptions
| Blasting Inputs & Assumptions |
| | | Waste |
| Parameters | Ore Leach Ore | Qty | Qw | Bx |
| In-situ density (tonnes/cu m) | 2.31 | 2.17 | 2.31 | 2.45 |
| Blasting Inputs & Assumptions | | | | |
| Bench height (m) | 10.00 | 10.00 | 10.00 | 10.00 |
| Subgrade drilling (m) | 1.50 | 1.50 | 1.50 | 1.50 |
| Hole depth (m) | 11.50 | 11.50 | 11.50 | 11.50 |
| Hole diameter (in) | 9.00 | 9.00 | 9.00 | 9.00 |
| (mm) | 229 | 229 | 229 | 229 |
| Explosives density (g/cc) | 0.82 | 0.82 | 0.82 | 0.82 |
| Powder factor (lb/ton) | 0.40 | 0.30 | 0.40 | 0.50 |
| (g/tonne) | 200 | 150 | 200 | 250 |
| Column load (kg/m) | 33.66 | 33.66 | 33.66 | 33.66 |
| Stemming height (m) | 6.21 | 6.90 | 6.21 | 5.66 |
| Burden (m) | 6.21 | 6.90 | 6.21 | 5.66 |
| Spacing (m) | 6.21 | 6.90 | 6.21 | 5.66 |
| Spacing (ft) | 20.37 | 22.63 | 20.37 | 18.58 |
| Powder rise (m) | 5.29 | 4.60 | 5.29 | 5.84 |
| Holes per Shot | 150 | 150 | 150 | 150 |
| Dry tonnes per hole | 890 | 1,033 | 890 | 786 |
| Dry tonnes per meter drilled | 77.43 | 89.79 | 77.43 | 68.33 |
| Prill cost ($/tonne)= | 800.00 | | | |
| Prill cost ($/kg)= | 0.800 | | | |
| Diesel Cost ($/liter)= | 0.793 | | | |
| ANFO: Prill | 94% | $/kg | | |
| ANFO: Diesel | 6% | $/kg | | |
| ANFO: Total | 100% | $/kg | | |
| Supplies and down-the-hole delivery. | 40% | | | |
El Pilar Project Form 43-101F1 Technical Report | |
Table 16-12: Drilling Inputs & Assumptions
| Drilling Inputs & Assumptions |
| Parameters | Leach Ore | Waste |
| | | Qfy | Qw | Bx |
| Productivity per hole | | | | |
| Move & setup time (min) | 2.00 | 2.00 | 2.00 | 2.00 |
| DTH Penetration rate (m/min) | | | | |
| Rock strength index (see below) | 5 | 6 | 5 | 2 |
| Uniaxial comp. strength (MPa) | 35 | 10 | 35 | 175 |
| Penetration rate (m/min) | 1.0 | 1.5 | 1.0 | 0.4 |
| Drilling time (min) | 11.50 | 7.67 | 11.50 | 28.75 |
| Couple new rod (min) | 0.00 | 0.00 | 0.00 | 0.00 |
| Retract time (min) | 0.50 | 0.50 | 0.50 | 0.50 |
| Total time per hole (min) | 14.00 | 10.17 | 14.00 | 31.25 |
| Productivity per shift | | | | |
| Shift length (hrs) | 8 | 8.0 | 8.0 | 8.0 |
| Less shift change (min) | 30 | 30.0 | 30.0 | 30.0 |
| Less meal break (min) | 30 | 30.0 | 30.0 | 30.0 |
| Effective min/hr for remaining | 50 | 50.0 | 50.0 | 50.0 |
| Available time (min/shift) | 350 | 350 | 350 | 350 |
| Overall operating efficiency (%) | 73 | 73 | 73 | 73 |
| Overall operating efficiency (min/hr) | 43.8 | 43.8 | 43.8 | 43.8 |
| Holes drilled per shift | 25 | 34 | 25 | 11 |
| D-T-H drilling time/shift (min) | 288 | 264 | 288 | 322 |
| Meters drilled per operating shift | 288 | 396 | 288 | 129 |
| Dry tonnes drilled per operating shift | 22,261 | 35,547 | 22,261 | 8,801 |
| Productivity per hour | | | | |
| Scheduled hours per shift | 8.00 | 8.00 | 8.00 | 8.00 |
| Meters drilled per scheduled hour | 36 | 49 | 36 | 16 |
| Tonnes drilled per scheduled hour | 2,783 | 4,443 | 2,783 | 1,100 |
| Machine hours per shift | 7.00 | 7.00 | 7.00 | 7.00 |
| Meters drilled per machine hour | 41 | 57 | 41 | 18 |
| Tonnes drilled per machine hour | 3,180 | 5,078 | 3,180 | 1,257 |
| 60-minute hours per shift | 5.83 | 5.83 | 5.83 | 5.83 |
| Meters drilled per 60-min hour | 49 | 68 | 49 | 22 |
| Tonnes drilled per 60-min hour | 3,816 | 6,094 | 3,816 | 1,509 |
| Productivity per year | | | | |
| Scheduled days per week | 7 | 7 | 7 | 7 |
| Scheduled shifts per day | 3 | 3 | 3 | 3 |
| Scheduled shifts per week | 21 | 21 | 21 | 21 |
| Scheduled days per year | 365 | 365 | 365 | 365 |
| Scheduled shifts per year | 1,095 | 1,095 | 1,095 | 1,095 |
| Availability (%) | 85 | 85 | 85 | 85 |
| Use of availability (%) | 90.0 | 90.0 | 90.0 | 90.0 |
| Maximum effective utilization (%) | 76.5 | 76.5 | 76.5 | 76.5 |
| Dry tonnes per year per drill (x1000) | 18,647 | 29,777 | 18,647 | 7,372 |
| Dry tonnes per day per drill (x1000) | 51.1 | 81.6 | 51.1 | 20.2 |
| Rock strength index: 1 = very strong; 2 = strong; 3 = average; 4 = weak; 5 = very weak | | |
El Pilar Project Form 43-101F1 Technical Report | |
The productivity calculations are also based on a powder factor of 150 grams per tonne for rock and 100 grams per tonne for overburden. Drill penetration was assumed as 0.8 m/min for rock and 1.0 m/min for overburden. The powder factor and penetration assumptions assume a weak material which is consistent with the friable nature of the core observed by IMC.
Table 16-13 summarizes drilling requirements by year. This includes the required drilling shifts per year, the fractional drill fleet, the actual drill fleet, and the fleet utilization. A peak requirement of three drills is indicated during most commercial production years. Two drills are required for most of preproduction through the first quarter of Year 2.
El Pilar Project Form 43-101F1 Technical Report | |
Table 16-13: Drilling Requirements by Year
| Drill Requirements - Atlas Copco PV 271 Drill |
| | Units | Year 0 | Year 1 | Year 2 | Year 3 | Year 4 | Year 5 | Year 6 | Year 7 | Year 8 | Year 9 | Year 10 | Year 11 | Year 12 | Year 13 | TOTAL |
| DRILLED MATERIAL: | | | | | | | | | | | | | | | | |
| ROM Leach Ore | (kt) | 1,362 | 15,206 | 11,706 | 18,062 | 20,122 | 20,328 | 23,066 | 23,600 | 21,800 | 20,600 | 21,000 | 20,200 | 19,000 | 10,985 | 247,037 |
| Breccia Ore | (kt) | 888 | 2,594 | 2,944 | 2,088 | 988 | 1,572 | 434 | 0 | 0 | 0 | 0 | 0 | 0 | 0 | 11,508 |
| Ore Rehandle | (kt) | 0 | 0 | 0 | 0 | 0 | 0 | 0 | 0 | 0 | 0 | 0 | 0 | 0 | 0 | 0 |
| Overburden Waste | (kt) | 8,588 | 12,013 | 12,880 | 32,663 | 22,730 | 20,914 | 27,177 | 22,120 | 48,734 | 9,074 | 0 | 0 | 0 | 0 | 216,893 |
| Rock Waste | (kt) | 2,779 | 6,965 | 11,637 | 14,575 | 23,171 | 22,516 | 21,334 | 32,280 | 13,466 | 42,826 | 15,671 | 8,907 | 4,835 | 3,718 | 224,680 |
| Breccia Waste | (kt) | 1,383 | 3,222 | 3,834 | 611 | 988 | 1,668 | 488 | 0 | 0 | 0 | 0 | 0 | 0 | 0 | 12,194 |
| Total Material | (kt) | 15,000 | 40,000 | 43,001 | 67,999 | 67,999 | 66,998 | 72,499 | 78,000 | 84,000 | 72,500 | 36,671 | 29,107 | 23,835 | 14,703 | 712,312 |
| REQUIRED DRILL SHIFTS: | | | | | | | | | | | | | | | |
| ROM Leach Ore | (shifts) | 49 | 550 | 424 | 654 | 728 | 736 | 835 | 854 | 789 | 746 | 760 | 731 | 688 | 398 | 8,941 |
| Breccia Ore | (shifts) | 67 | 197 | 224 | 159 | 75 | 119 | 33 | 0 | 0 | 0 | 0 | 0 | 0 | 0 | 874 |
| Ore Rehandle | (shifts) | 0 | 0 | 0 | 0 | 0 | 0 | 0 | 0 | 0 | 0 | 0 | 0 | 0 | 0 | 0 |
| Overburden Waste | (shifts) | 193 | 270 | 289 | 733 | 510 | 470 | 610 | 497 | 1,094 | 204 | 0 | 0 | 0 | 0 | 4,871 |
| Rock Waste | (shifts) | 101 | 252 | 421 | 528 | 839 | 815 | 772 | 1,168 | 487 | 1,550 | 567 | 322 | 175 | 135 | 8,132 |
| Breccia Waste | (shifts) | 105 | 245 | 291 | 46 | 75 | 127 | 37 | 0 | 0 | 0 | 0 | 0 | 0 | 0 | 926 |
| Total Shifts | (shifts) | 515 | 1,514 | 1,649 | 2,120 | 2,227 | 2,266 | 2,287 | 2,519 | 2,371 | 2,499 | 1,327 | 1,053 | 863 | 532 | 23,745 |
| PRODUCTIVITY CALCULATIONS: | | | | | | | | | | | | | | |
| Available Shifts Per Period | (shifts) | 548 | 1,095 | 1,095 | 1,095 | 1,095 | 1,095 | 1,095 | 1,095 | 1,095 | 1,095 | 1,095 | 1,095 | 1,095 | 1,095 | 14,783 |
| Mechanical Availability | (%) | 85.0% | 85.0% | 85.0% | 85.0% | 85.0% | 85.0% | 85.0% | 85.0% | 85.0% | 85.0% | 85.0% | 85.0% | 85.0% | 85.0% | 85.0% |
| Utilization of Availability | (%) | 90.0% | 90.0% | 90.0% | 90.0% | 90.0% | 90.0% | 90.0% | 90.0% | 90.0% | 90.0% | 90.0% | 90.0% | 90.0% | 90.0% | 90.0% |
| Maximum Utilization Per Drill | (%) | 76.5% | 76.5% | 76.5% | 76.5% | 76.5% | 76.5% | 76.5% | 76.5% | 76.5% | 76.5% | 76.5% | 76.5% | 76.5% | 76.5% | 76.5% |
| Available Shifts Per Drill | (shifts) | 419 | 838 | 838 | 838 | 838 | 838 | 838 | 838 | 838 | 838 | 838 | 838 | 838 | 838 | |
| Fractional Number of Drills | (none) | 1.23 | 1.81 | 1.97 | 2.53 | 2.66 | 2.71 | 2.73 | 3.01 | 2.83 | 2.98 | 1.58 | 1.26 | 1.03 | 0.64 | |
| Actual Number of Drills | (none) | 2 | 2 | 2 | 3 | 3 | 3 | 3 | 3 | 3 | 3 | 2 | 2 | 1 | 1 | |
| Fleet Utilization | (%) | 47.1% | 69.1% | 75.3% | 64.5% | 67.8% | 69.0% | 69.6% | 76.7% | 72.2% | 76.1% | 60.6% | 48.1% | 78.8% | 48.6% | 68.9% |
| NUMBER OF OPERATORS: | | | | | | | | | | | | | | | |
| Number of Mining Crews | (none) | 4 | 4 | 4 | 4 | 4 | 4 | 4 | 4 | 4 | 4 | 4 | 4 | 4 | 4 | |
| Number of Drill Operators | (none) | 4 | 8 | 8 | 8 | 8 | 9 | 9 | 12 | 9 | 12 | 8 | 4 | 4 | 4 | |
El Pilar Project Form 43-101F1 Technical Report | |
The primary loading fleet is based on hydraulic shovels with a 30.6 cubic meter bucket. Typical models would be the O&K RH200 and the Hitachi EX5500 shovel. The shovel will be matched with trucks with a nominal capacity of about 180 metric tonnes such as the Caterpillar 789C or Komatsu 730E. The shift productivities for the shovel are estimated at 18,721 tonnes for overburden waste, 19,348 tonnes for rock waste and 20,337 tonnes for ore. Annual productivity per shovel is 16.5 million tonnes for overburden, 17.1 million tonnes for rock waste, and 18.0 million tonnes for ore.
Table 16-14 summarizes the shovel requirements by year, including required shifts, fractional fleet, actual fleet, and fleet utilization. Four shovels will be required for most years. Two will be required for most of preproduction through the 1st quarter of Year 2.
El Pilar Project Form 43-101F1 Technical Report | |
Table 16-14: Shovel Requirements
| Shovel Requirements - Bucyrus RH200 Hydraulic Shovel (26 cu m) |
| | | | Units | Year 0 | Year 1 | Year 2 | Year 3 | Year 4 | Year 5 | Year 6 | Year 7 | Year 8 | Year 9 | Year 10 | Year 11 | Year 12 | Year 13 | TOTAL |
| PERCENT LOADED BY SHOVEL: | | | | | | | | | | | | | | | | |
| ROM Leach Ore | 85.0% | (%) | 85.0% | 85.0% | 85.0% | 85.0% | 85.0% | 85.0% | 85.0% | 85.0% | 85.0% | 85.0% | 85.0% | 85.0% | 85.0% | 85.0% | |
| Breccia Ore | 85.0% | (%) | 85.0% | 85.0% | 85.0% | 85.0% | 85.0% | 85.0% | 85.0% | 85.0% | 85.0% | 85.0% | 85.0% | 85.0% | 85.0% | 85.0% | |
| Overburden Waste | 85.0% | (%) | 85.0% | 85.0% | 85.0% | 85.0% | 85.0% | 85.0% | 85.0% | 85.0% | 85.0% | 85.0% | 85.0% | 85.0% | 85.0% | 85.0% | |
| Rock Waste | 85.0% | (%) | 85.0% | 85.0% | 85.0% | 85.0% | 85.0% | 85.0% | 85.0% | 85.0% | 85.0% | 85.0% | 85.0% | 85.0% | 85.0% | 85.0% | |
| Breccia Waste | 85.0% | (%) | 85.0% | 85.0% | 85.0% | 85.0% | 85.0% | 85.0% | 85.0% | 85.0% | 85.0% | 85.0% | 85.0% | 85.0% | 85.0% | 85.0% | |
| LOADED BY SHOVEL: | | | | | | | | | | | | | | | | | |
| ROM Leach Ore | | (kt) | 1,158 | 12,925 | 9,950 | 15,353 | 17,104 | 17,279 | 19,606 | 20,060 | 18,530 | 17,510 | 17,850 | 17,170 | 16,150 | 9,337 | 209,981 |
| Breccia Ore | | (kt) | 755 | 2,205 | 2,502 | 1,775 | 840 | 1,336 | 369 | 0 | 0 | 0 | 0 | 0 | 0 | 0 | 9,782 |
| Overburden Waste | | (kt) | 7,300 | 10,211 | 10,948 | 27,764 | 19,321 | 17,777 | 23,100 | 18,802 | 41,424 | 7,713 | 0 | 0 | 0 | 0 | 184,359 |
| Rock Waste | | (kt) | 2,362 | 5,920 | 9,891 | 12,389 | 19,695 | 19,139 | 18,134 | 27,438 | 11,446 | 36,402 | 13,320 | 7,571 | 4,110 | 3,160 | 190,978 |
| Breccia Waste | | (kt) | 1,176 | 2,739 | 3,259 | 519 | 840 | 1,418 | 415 | 0 | 0 | 0 | 0 | 0 | 0 | 0 | 10,365 |
| Total Material | | (kt) | 12,750 | 34,000 | 36,551 | 57,799 | 57,799 | 56,948 | 61,624 | 66,300 | 71,400 | 61,625 | 31,170 | 24,741 | 20,260 | 12,498 | 605,465 |
| REQUIRED SHOVEL SHIFTS: | | | | | | | | | | | | | | | | |
| ROM Leach Ore | | (shifts) | 51 | 566 | 436 | 673 | 749 | 757 | 859 | 879 | 812 | 767 | 782 | 752 | 708 | 409 | 9,201 |
| Breccia Ore | | (shifts) | 37 | 107 | 121 | 86 | 41 | 65 | 18 | 0 | 0 | 0 | 0 | 0 | 0 | 0 | 475 |
| Overburden Waste | | (shifts) | 364 | 509 | 545 | 1,383 | 963 | 886 | 1,151 | 937 | 2,064 | 384 | 0 | 0 | 0 | 0 | 9,185 |
| Rock Waste | | (shifts) | 103 | 259 | 433 | 543 | 863 | 839 | 795 | 1,202 | 502 | 1,595 | 584 | 332 | 180 | 138 | 8,368 |
| Breccia Waste | | (shifts) | 57 | 133 | 158 | 25 | 41 | 69 | 20 | 0 | 0 | 0 | 0 | 0 | 0 | 0 | 503 |
| Total Shifts | | (shifts) | 612 | 1,574 | 1,694 | 2,710 | 2,656 | 2,615 | 2,842 | 3,018 | 3,377 | 2,746 | 1,366 | 1,084 | 888 | 548 | 27,731 |
| PRODUCTIVITY ALCULATIONS: | | | | | | | | | | | | | | | | |
| Available Shifts Per Period | (shifts) | 548 | 1,095 | 1,095 | 1,095 | 1,095 | 1,095 | 1,095 | 1,095 | 1,095 | 1,095 | 1,095 | 1,095 | 1,095 | 1,095 | 14,783 |
| Mechanical Availability | (%) | 85.0% | 85.0% | 85.0% | 85.0% | 85.0% | 85.0% | 85.0% | 85.0% | 85.0% | 85.0% | 85.0% | 85.0% | 85.0% | 85.0% | 85.0% |
| Utilization of Availability | (%) | 90.0% | 90.0% | 90.0% | 90.0% | 90.0% | 90.0% | 90.0% | 90.0% | 90.0% | 90.0% | 90.0% | 90.0% | 90.0% | 90.0% | 90.0% |
| Maximum Utilization Per Shovel | (%) | 76.5% | 76.5% | 76.5% | 76.5% | 76.5% | 76.5% | 76.5% | 76.5% | 76.5% | 76.5% | 76.5% | 76.5% | 76.5% | 76.5% | 76.5% |
| Available Shifts Per Shovel | (shifts) | 419 | 838 | 838 | 838 | 838 | 838 | 838 | 838 | 838 | 838 | 838 | 838 | 838 | 838 | 11,309 |
| Fractional Number of Shovel | (none) | 1.46 | 1.88 | 2.02 | 3.24 | 3.17 | 3.12 | 3.39 | 3.60 | 4.03 | 3.28 | 1.63 | 1.29 | 1.06 | 0.65 | |
| Actual Number of Shovels | (none) | 2 | 2 | 2 | 4 | 4 | 4 | 4 | 4 | 4 | 4 | 2 | 2 | 1 | 1 | |
| Fleet Utilization | (%) | 55.8% | 71.9% | 77.4% | 61.9% | 60.6% | 59.7% | 64.9% | 68.9% | 77.1% | 62.7% | 62.4% | 49.5% | 81.1% | 50.0% | 65.9% |
| NUMBER OF OPERATORS: | | | | | | | | | | | | | | | | |
| Number of Mining Crews | (none) | 4 | 4 | 4 | 4 | 4 | 4 | 4 | 4 | 4 | 4 | 4 | 4 | 4 | 4 | |
| Number of Shovel Operators | (none) | 5 | 8 | 8 | 12 | 12 | 12 | 12 | 12 | 13 | 12 | 8 | 4 | 4 | 4 | |
El Pilar Project Form 43-101F1 Technical Report | |
Table 16-15 summarizes the requirements for an 18 cubic meter wheel loader, such as the Komatsu WA1200, which is used for backup for the shovels. It is relatively lightly scheduled and only one unit is required.
El Pilar Project Form 43-101F1 Technical Report | |
Table 16-15: Loader Requirements
| Loader Requirements - Komatsu WA1200 Wheel Loader (20 cu m) |
| | | | Units | Year 0 | Year 1 | Year 2 | Year 3 | Year 4 | Year 5 | Year 6 | Year 7 | Year 8 | Year 9 | Year 10 | Year 11 | Year 12 | Year 13 | TOTAL |
| PERCENT LOADED BY LOADER: | | | | | | | | | | | | | | | | |
| ROM Leach Ore | 15.0% | (%) | 15.0% | 15.0% | 15.0% | 15.0% | 15.0% | 15.0% | 15.0% | 15.0% | 15.0% | 15.0% | 15.0% | 15.0% | 15.0% | 15.0% | |
| Breccia Ore | 15.0% | (%) | 15.0% | 15.0% | 15.0% | 15.0% | 15.0% | 15.0% | 15.0% | 15.0% | 15.0% | 15.0% | 15.0% | 15.0% | 15.0% | 15.0% | |
| Overburden Waste | 15.0% | (%) | 15.0% | 15.0% | 15.0% | 15.0% | 15.0% | 15.0% | 15.0% | 15.0% | 15.0% | 15.0% | 15.0% | 15.0% | 15.0% | 15.0% | |
| Rock Waste | 15.0% | (%) | 15.0% | 15.0% | 15.0% | 15.0% | 15.0% | 15.0% | 15.0% | 15.0% | 15.0% | 15.0% | 15.0% | 15.0% | 15.0% | 15.0% | |
| Breccia Waste | 15.0% | (%) | 15.0% | 15.0% | 15.0% | 15.0% | 15.0% | 15.0% | 15.0% | 15.0% | 15.0% | 15.0% | 15.0% | 15.0% | 15.0% | 15.0% | |
| LOADED BY LOADER: | | | | | | | | | | | | | | | | | |
| ROM Leach Ore | | (kt) | 204 | 2,281 | 1,756 | 2,709 | 3,018 | 3,049 | 3,460 | 3,540 | 3,270 | 3,090 | 3,150 | 3,030 | 2,850 | 1,648 | 37,056 |
| Breccia Ore | | (kt) | 133 | 389 | 442 | 313 | 148 | 236 | 65 | 0 | 0 | 0 | 0 | 0 | 0 | 0 | 1,726 |
| Overburden Waste | | (kt) | 1,288 | 1,802 | 1,932 | 4,899 | 3,410 | 3,137 | 4,077 | 3,318 | 7,310 | 1,361 | 0 | 0 | 0 | 0 | 32,534 |
| Rock Waste | | (kt) | 417 | 1,045 | 1,746 | 2,186 | 3,476 | 3,377 | 3,200 | 4,842 | 2,020 | 6,424 | 2,351 | 1,336 | 725 | 558 | 33,702 |
| Breccia Waste | | (kt) | 207 | 483 | 575 | 92 | 148 | 250 | 73 | 0 | 0 | 0 | 0 | 0 | 0 | 0 | 1,829 |
| Total Material | | (kt) | 2,250 | 6,000 | 6,450 | 10,200 | 10,200 | 10,050 | 10,875 | 11,700 | 12,600 | 10,875 | 5,501 | 4,366 | 3,575 | 2,205 | 106,847 |
| REQUIRED LOADER SHIFTS: | | | | | | | | | | | | | | | | |
| ROM Leach Ore | | (shifts) | 15 | 166 | 128 | 198 | 220 | 222 | 252 | 258 | 238 | 225 | 230 | 221 | 208 | 120 | 2,702 |
| Breccia Ore | | (shifts) | 10 | 30 | 34 | 24 | 11 | 18 | 5 | 0 | 0 | 0 | 0 | 0 | 0 | 0 | 131 |
| Overburden Waste | | (shifts) | 101 | 141 | 151 | 382 | 266 | 245 | 318 | 259 | 571 | 106 | 0 | 0 | 0 | 0 | 2,539 |
| Rock Waste | | (shifts) | 30 | 76 | 127 | 159 | 253 | 246 | 233 | 353 | 147 | 468 | 171 | 97 | 53 | 41 | 2,457 |
| Breccia Waste | | (shifts) | 16 | 37 | 44 | 7 | 11 | 19 | 6 | 0 | 0 | 0 | 0 | 0 | 0 | 0 | 139 |
| Total Shifts | | (shifts) | 172 | 449 | 483 | 770 | 762 | 750 | 814 | 870 | 956 | 800 | 401 | 318 | 261 | 161 | 7,968 |
| PRODUCTIVITY CALCULATIONS: | | | | | | | | | | | | | | | | |
| Available Shifts Per Period | (shifts) | 548 | 1,095 | 1,095 | 1,095 | 1,095 | 1,095 | 1,095 | 1,095 | 1,095 | 1,095 | 1,095 | 1,095 | 1,095 | 1,095 | 14,783 |
| Mechanical Availability | (%) | 85.0% | 85.0% | 85.0% | 85.0% | 85.0% | 85.0% | 85.0% | 85.0% | 85.0% | 85.0% | 85.0% | 85.0% | 85.0% | 85.0% | 85.0% |
| Utilization of Availability | (%) | 90.0% | 90.0% | 90.0% | 90.0% | 90.0% | 90.0% | 90.0% | 90.0% | 90.0% | 90.0% | 90.0% | 90.0% | 90.0% | 90.0% | 90.0% |
| Maximum Utilization Per Loader | (%) | 76.5% | 76.5% | 76.5% | 76.5% | 76.5% | 76.5% | 76.5% | 76.5% | 76.5% | 76.5% | 76.5% | 76.5% | 76.5% | 76.5% | 76.5% |
| Available Shifts Per Loader | (shifts) | 419 | 838 | 838 | 838 | 838 | 838 | 838 | 838 | 838 | 838 | 838 | 838 | 838 | 838 | 11,309 |
| Fractional Number of Loadersl | (none) | 0.41 | 0.54 | 0.58 | 0.92 | 0.91 | 0.90 | 0.97 | 1.04 | 1.14 | 0.95 | 0.48 | 0.38 | 0.31 | 0.19 | |
| Actual Number of Loaders | (none) | 1 | 1 | 1 | 1 | 1 | 1 | 1 | 1 | 1 | 1 | 1 | 1 | 1 | 1 | |
| Fleet Utilization | | (%) | 31.4% | 41.0% | 44.1% | 70.3% | 69.6% | 68.5% | 74.4% | 79.5% | 87.3% | 73.0% | 36.6% | 29.1% | 23.8% | 14.7% | 63.7% |
| NUMBER OF OPERATORS: | | | | | | | | | | | | | | | | |
| Number of Mining Crews | (none) | 4 | 4 | 4 | 4 | 4 | 4 | 4 | 4 | 4 | 4 | 4 | 4 | 4 | 4 | |
| Number of Loader Operators | (none) | 4 | 4 | 4 | 4 | 4 | 4 | 4 | 4 | 4 | 4 | 4 | 4 | 4 | 1 | |
El Pilar Project Form 43-101F1 Technical Report | |
Table 16-16 summarizes haul truck requirements by year. It includes required truck shifts, the fractional fleet, actual fleet and effective utilization. Five trucks are required for preproduction and Year 1. It should be noted that the truck requirements shown in this table, which were calculated by Mike Hester under the supervision of the Author, do not match the truck requirements in the economic model, which were more accurately calculated by MineSight using actual haul profiles. In the economic model, fifteen trucks are required for Year 2 and the fleet builds to a peak of 21 trucks for Years 7 through 10.
El Pilar Project Form 43-101F1 Technical Report | |
Table 16-16: Truck Requirements
| Truck Requirements - Komatsu 730E Truck (184 mt) |
| | Units | Year 0 | Year 1 | Year 2 | Year 3 | Year 4 | Year 5 | Year 6 | Year 7 | Year 8 | Year 9 | Year 10 | Year 11 | Year 12 | Year 13 | TOTAL |
| PRODUCTION REQUIREMENTS: | | | | | | | | | | | | | | | | |
| ROM Leach Ore | (kt) | 1,362 | 15,206 | 11,706 | 18,062 | 20,122 | 20,328 | 23,066 | 23,600 | 21,800 | 20,600 | 21,000 | 20,200 | 19,000 | 10,985 | 247,037 |
| Breccia Ore | (kt) | 888 | 2,594 | 2,944 | 2,088 | 988 | 1,572 | 434 | 0 | 0 | 0 | 0 | 0 | 0 | 0 | 11,508 |
| Overburden Waste | (kt) | 8,588 | 12,013 | 12,880 | 32,663 | 22,730 | 20,914 | 27,177 | 22,120 | 48,734 | 9,074 | 0 | 0 | 0 | 0 | 216,893 |
| Rock Waste | (kt) | 2,779 | 6,965 | 11,637 | 14,575 | 23,171 | 22,516 | 21,334 | 32,280 | 13,466 | 42,826 | 15,671 | 8,907 | 4,835 | 3,718 | 224,680 |
| Breccia Waste | (kt) | 1,383 | 3,222 | 3,834 | 611 | 988 | 1,668 | 488 | 0 | 0 | 0 | 0 | 0 | 0 | 0 | 12,194 |
| Total Material | (kt) | 15,000 | 40,000 | 43,001 | 67,999 | 67,999 | 66,998 | 72,499 | 78,000 | 84,000 | 72,500 | 36,671 | 29,107 | 23,835 | 14,703 | 712,312 |
| PRODUCTIVITY CALCULATIONS: | | | | | | | | | | | | | | | | |
| Tons Per Truck Shift | (tpts) | 4,458 | 4,672 | 5,175 | 4,247 | 3,655 | 3,517 | 3,442 | 3,761 | 4,069 | 3,432 | 2,986 | 2,478 | 3,135 | 2,072 | 3,631 |
| Required Truck Shifts | (shifts) | 3,365 | 8,562 | 8,309 | 16,011 | 18,604 | 19,050 | 21,063 | 20,739 | 20,644 | 21,125 | 12,281 | 11,746 | 7,603 | 7,096 | 196,198 |
| Required Truck Hours | (hours) | 26,918 | 68,493 | 66,475 | 128,089 | 148,835 | 152,398 | 168,504 | 165,913 | 165,151 | 168,998 | 98,248 | 93,969 | 60,823 | 56,768 | 1,569,583 |
| Available Shifts Per Period | (shifts) | 548 | 1,095 | 1,095 | 1,095 | 1,095 | 1,095 | 1,095 | 1,095 | 1,095 | 1,095 | 1,095 | 1,095 | 1,095 | 1,095 | 14,783 |
| Mechanical Availability | (%) | 85.0% | 85.0% | 85.0% | 85.0% | 85.0% | 85.0% | 85.0% | 85.0% | 85.0% | 85.0% | 85.0% | 85.0% | 85.0% | 85.0% | 85.0% |
| Utilization of Availability | (%) | 90.0% | 90.0% | 90.0% | 90.0% | 90.0% | 90.0% | 90.0% | 90.0% | 90.0% | 90.0% | 90.0% | 90.0% | 90.0% | 90.0% | 90.0% |
| Maximum Utilization Per Truck | (%) | 76.5% | 76.5% | 76.5% | 76.5% | 76.5% | 76.5% | 76.5% | 76.5% | 76.5% | 76.5% | 76.5% | 76.5% | 76.5% | 76.5% | 76.5% |
| Available Shifts Per Truck | (hours) | 419 | 838 | 838 | 838 | 838 | 838 | 838 | 838 | 838 | 838 | 838 | 838 | 838 | 838 | 11,309 |
| Fractional Number of Trucks | (none) | 8.03 | 10.22 | 9.92 | 19.11 | 22.21 | 22.74 | 25.14 | 24.76 | 24.64 | 25.22 | 14.66 | 14.02 | 9.08 | 8.47 | |
| Actual Number of Trucks | (none) | 8 | 11 | 10 | 20 | 23 | 23 | 26 | 25 | 25 | 26 | 15 | 14 | 9 | 9 | |
| Fleet Utilization | (%) | 76.8% | 71.1% | 75.9% | 73.1% | 73.9% | 75.6% | 74.0% | 75.8% | 75.4% | 74.2% | 74.8% | 76.6% | 77.1% | 72.0% | 74.7% |
| NUMBER OF OPERATORS: | | | | | | | | | | | | | | | | |
| Number of Mining Crews | (none) | 4 | 4 | 4 | 4 | 4 | 4 | 4 | 4 | 4 | 4 | 4 | 4 | 4 | 4 | |
| Number of Truck Operators | (none) | 25 | 32 | 32 | 60 | 68 | 72 | 80 | 76 | 76 | 80 | 48 | 44 | 28 | 28 | |
El Pilar Project Form 43-101F1 Technical Report | |
To develop the truck haulage requirements, the truck haulage profiles were measured for each material type, for each mining bench, for each mining phase per year. Data collected was the total distance, vertical lift and distance, and vertical fall and distance. This data was converted to an equivalent flat haul (EFH) in kilometers for each profile based on relative speeds for the uphill, downhill, and flat portions of the profile for the loaded and empty portions of the cycle. Life of project, the effective, one-way, equivalent flat haul averages 5.4 km per cycle. The following in Table 16-17 shows various parameters used for the calculations.
Table 16-17: Truck Speed, Loading & Shift Factors
| Truck Speed, Loading & Shift Factors |
| Truck Speeds |
| Loaded | Empty |
| Up | Flat | Down | Up | Flat | Down |
| 12 | 44 | 29 | 26 | 54 | 47 |
| Truck Factors: | | | | |
| | Acceleration/Deceleration = 12 kph | |
| | Ramp Gradient = 8% | | |
| | Truck Capacity = 181.44 tonnes | | |
| | Truck Load Factor = 95.0% | | |
| | Tonnes per Truck Load = 172.4 (dry) | |
| | Availability = 85% | | | |
| | Ues of Availability = 90% | | |
| Loading Factors: | | | | |
| | Queue = 0.50 min | | | |
| | Spot = 30 sec | | | |
| | Passes to Load = 4 | | | |
| | Time per Pass = 27 sec | | |
| | Turn & Dump = 1.50 min | | |
| | Fixed Time = 4.30 min | | |
| Shift Factors: | | | | |
| | Shift Length = 8 hours | | |
| | Shift Change = 30 min | | |
| | Meal Break = 30 min | | | |
| | Balance @ 50 min/hr | | |
| | Effective Time = 350 min/shift | | |
| 16.8.2.7 | Support Equipment |
The mine support equipment includes the following equipment types. This equipment is used to maintain roads and dumps and to support the primary drilling, loading, and hauling fleet.
El Pilar Project Form 43-101F1 Technical Report | |
| ● | Track Dozer, 451 kw (5 units) |
| ● | Wheel Dozer, 362 kw (3 units) |
| ● | Motor Grader, 4.9 m (2 units) |
| ● | Water Truck, 50,000 liter (2 units) |
Table 16-18 shows the shift allocations and number of units by time period. Shift allocations are IMC estimates; these tend to vary widely depending on operator preferences.
El Pilar Project Form 43-101F1 Technical Report | |
Table 16-18: Support Equipment Requirements
| Support Equipment Requirements |
| | | | Units | Year 0 | Year 1 | Year 2 | Year 3 | Year 4 | Year 5 | Year 6 | Year 7 | Year 8 | Year 9 | Year 10 | Year 11 | Year 12 | Year 13 | TOTAL |
| Scheduled Shifts | (none) | 548 | 1095 | 1095 | 1095 | 1095 | 1095 | 1095 | 1095 | 1095 | 1095 | 1095 | 1095 | 1095 | 1095 | 14,783 |
| Komatsu D375 A5 Track Dozer | | | | | | | | | | | | | | | | |
| Required Operating Units / Shift | (none) | 3 | 3 | 3 | 3 | 3 | 3 | 3 | 3 | 3 | 3 | 3 | 3 | 3 | 3 | |
| Mechanical Availability | (%) | 85.0% | 85.0% | 85.0% | 85.0% | 85.0% | 85.0% | 85.0% | 85.0% | 85.0% | 85.0% | 85.0% | 85.0% | 85.0% | 85.0% | |
| Utilization of Availability | (%) | 75.0% | 75.0% | 75.0% | 75.0% | 75.0% | 75.0% | 75.0% | 75.0% | 75.0% | 75.0% | 75.0% | 75.0% | 75.0% | 75.0% | |
| Maximum Utilization | (%) | 63.75% | 63.75% | 63.75% | 63.75% | 63.75% | 63.75% | 63.75% | 63.75% | 63.75% | 63.75% | 63.75% | 63.75% | 63.75% | 63.75% | |
| Fractional Number of Units | (none) | 4.71 | 4.71 | 4.71 | 4.71 | 4.71 | 4.71 | 4.71 | 4.71 | 4.71 | 4.71 | 4.71 | 4.71 | 4.71 | 4.71 | |
| Actual Number of Units | (none) | 5 | 5 | 5 | 5 | 5 | 5 | 5 | 5 | 5 | 5 | 5 | 5 | 5 | 5 | |
| Total Operating Shifts | (none) | 1,643 | 3,285 | 3,285 | 3,285 | 3,285 | 3,285 | 3,285 | 3,285 | 3,285 | 3,285 | 3,285 | 3,285 | 3,285 | 3,285 | 44,348 |
| Metered Hours @ | 7.00 | (hr) | 11,498 | 22,995 | 22,995 | 22,995 | 22,995 | 22,995 | 22,995 | 22,995 | 22,995 | 22,995 | 22,995 | 22,995 | 22,995 | 22,995 | 310,433 |
| Fleet Utilization | (%) | 60.0% | 60.0% | 60.0% | 60.0% | 60.0% | 60.0% | 60.0% | 60.0% | 60.0% | 60.0% | 60.0% | 60.0% | 60.0% | 60.0% | 60.00% |
| Cat 834H Wheel Dozer | | | | | | | | | | | | | | | | |
| Required Operating Units / Shift | (none) | 1.33 | 1.33 | 1.33 | 1.33 | 1.33 | 1.33 | 1.33 | 1.33 | 1.33 | 1.33 | 1.33 | 1.33 | 1.33 | 1.33 | |
| Mechanical Availability | (%) | 85.0% | 85.0% | 85.0% | 85.0% | 85.0% | 85.0% | 85.0% | 85.0% | 85.0% | 85.0% | 85.0% | 85.0% | 85.0% | 85.0% | |
| Utilization of Availability | (%) | 75.0% | 75.0% | 75.0% | 75.0% | 75.0% | 75.0% | 75.0% | 75.0% | 75.0% | 75.0% | 75.0% | 75.0% | 75.0% | 75.0% | |
| Maximum Utilization | (%) | 63.75% | 63.75% | 63.75% | 63.75% | 63.75% | 63.75% | 63.75% | 63.75% | 63.75% | 63.75% | 63.75% | 63.75% | 63.75% | 63.75% | |
| Fractional Number of Units | (none) | 2.09 | 2.09 | 2.09 | 2.09 | 2.09 | 2.09 | 2.09 | 2.09 | 2.09 | 2.09 | 2.09 | 2.09 | 2.09 | 2.09 | |
| Actual Number of Units | (none) | 2 | 2 | 2 | 2 | 2 | 2 | 2 | 2 | 2 | 2 | 2 | 2 | 2 | 2 | |
| Total Operating Shifts | (none) | 728 | 1,456 | 1,456 | 1,456 | 1,456 | 1,456 | 1,456 | 1,456 | 1,456 | 1,456 | 1,456 | 1,456 | 1,456 | 1,456 | 19,661 |
| Metered Hours @ | 7.00 | (hr) | 5,097 | 10,194 | 10,194 | 10,194 | 10,194 | 10,194 | 10,194 | 10,194 | 10,194 | 10,194 | 10,194 | 10,194 | 10,194 | 10,194 | 137,625 |
| Fleet Utilization | (%) | 66.5% | 66.5% | 66.5% | 66.5% | 66.5% | 66.5% | 66.5% | 66.5% | 66.5% | 66.5% | 66.5% | 66.5% | 66.5% | 66.5% | 66.50% |
| Komatsu GD825A Motor Grader | | | | | | | | | | | | | | | | |
| Required Operating Units / Shift | (none) | 1.33 | 1.33 | 1.33 | 1.33 | 1.33 | 1.33 | 1.33 | 1.33 | 1.33 | 1.33 | 1.33 | 1.33 | 1.33 | 1.33 | |
| Mechanical Availability | (%) | 85.0% | 85.0% | 85.0% | 85.0% | 85.0% | 85.0% | 85.0% | 85.0% | 85.0% | 85.0% | 85.0% | 85.0% | 85.0% | 85.0% | |
| Utilization of Availability | (%) | 75.0% | 75.0% | 75.0% | 75.0% | 75.0% | 75.0% | 75.0% | 75.0% | 75.0% | 75.0% | 75.0% | 75.0% | 75.0% | 75.0% | |
| Maximum Utilization | (%) | 63.75% | 63.75% | 63.75% | 63.75% | 63.75% | 63.75% | 63.75% | 63.75% | 63.75% | 63.75% | 63.75% | 63.75% | 63.75% | 63.75% | |
| Fractional Number of Units | (none) | 2.09 | 2.09 | 2.09 | 2.09 | 2.09 | 2.09 | 2.09 | 2.09 | 2.09 | 2.09 | 2.09 | 2.09 | 2.09 | 2.09 | |
| Actual Number of Units | (none) | 2 | 2 | 2 | 2 | 2 | 2 | 2 | 2 | 2 | 2 | 2 | 2 | 2 | 2 | |
| Total Operating Shifts | (none) | 728 | 1,456 | 1,456 | 1,456 | 1,456 | 1,456 | 1,456 | 1,456 | 1,456 | 1,456 | 1,456 | 1,456 | 1,456 | 1,456 | 19,661 |
| Metered Hours @ | 7.00 | (hr) | 5,097 | 10,194 | 10,194 | 10,194 | 10,194 | 10,194 | 10,194 | 10,194 | 10,194 | 10,194 | 10,194 | 10,194 | 10,194 | 10,194 | 137,625 |
| Fleet Utilization | (%) | 66.5% | 66.5% | 66.5% | 66.5% | 66.5% | 66.5% | 66.5% | 66.5% | 66.5% | 66.5% | 66.5% | 66.5% | 66.5% | 66.5% | 66.50% |
| Water Truck - 20,000 gal | | | | | | | | | | | | | | | | |
| Required Operating Units / Shift | (none) | 1.33 | 1.33 | 1.33 | 1.33 | 1.33 | 1.33 | 1.33 | 1.33 | 1.33 | 1.33 | 1.33 | 1.33 | 1.33 | 1.33 | |
| Mechanical Availability | (%) | 85.0% | 85.0% | 85.0% | 85.0% | 85.0% | 85.0% | 85.0% | 85.0% | 85.0% | 85.0% | 85.0% | 85.0% | 85.0% | 85.0% | |
| Utilization of Availability | (%) | 75.0% | 75.0% | 75.0% | 75.0% | 75.0% | 75.0% | 75.0% | 75.0% | 75.0% | 75.0% | 75.0% | 75.0% | 75.0% | 75.0% | |
| Maximum Utilization | (%) | 63.75% | 63.75% | 63.75% | 63.75% | 63.75% | 63.75% | 63.75% | 63.75% | 63.75% | 63.75% | 63.75% | 63.75% | 63.75% | 63.75% | |
| Fractional Number of Units | (none) | 2.09 | 2.09 | 2.09 | 2.09 | 2.09 | 2.09 | 2.09 | 2.09 | 2.09 | 2.09 | 2.09 | 2.09 | 2.09 | 2.09 | |
| Actual Number of Units | (none) | 2 | 2 | 2 | 2 | 2 | 2 | 2 | 2 | 2 | 2 | 2 | 2 | 2 | 2 | |
| Total Operating Shifts | (none) | 728 | 1,456 | 1,456 | 1,456 | 1,456 | 1,456 | 1,456 | 1,456 | 1,456 | 1,456 | 1,456 | 1,456 | 1,456 | 1,456 | 19,661 |
| Metered Hours @ | 7.00 | (hr) | 5,097 | 10,194 | 10,194 | 10,194 | 10,194 | 10,194 | 10,194 | 10,194 | 10,194 | 10,194 | 10,194 | 10,194 | 10,194 | 10,194 | 137,625 |
| Fleet Utilization | (%) | 66.5% | 66.5% | 66.5% | 66.5% | 66.5% | 66.5% | 66.5% | 66.5% | 66.5% | 66.5% | 66.5% | 66.5% | 66.5% | 66.5% | 66.50% |
El Pilar Project Form 43-101F1 Technical Report | |
| 17 | RECOVERY METHODS |
| | |
| 17.1 | Process Facilities |
This section has not been modified from the 2011 Study, except for updates to LOM production numbers, where applicable. This report section was prepared by M3 Engineering by Alberto Bennett, who is relied on for this section of the report as an Other Expert, except where otherwise noted.
The planned process facilities for the El Pilar project, shown in the overall site plan in Figure 17-1, include the following:
| ● | Leaching Facility, Heap Leach Pad, (HLP) |
| ● | Process Plant: Solvent Extraction (SX); Tank Farm (TF) and Electrowinning (EW) |
| ● | Acid Plant and Power Plant |
| ● | Ancillary Facilities and Services |
El Pilar Project Form 43-101F1 Technical Report | |
Figure 17-1: General Site Plan (000-GA-001)
El Pilar Project Form 43-101F1 Technical Report | |
ML retained the Mines Group to complete the geotechnical design of the heap leach pad and ponds in support of this NI 43-101 compliant feasibility study. Anthony Crews, P.E., of the Mines Group is the Other Expert relied upon for this section of the report. The Mines Group’s work was based on the information provided by ML and the Mines Group’s experience on other similar projects, and included a program of site investigation, laboratory testing, and engineering analyses.
The Mines Group carried out a geotechnical evaluation and basic level design study for the heap leach facility at El Pilar. All geotechnical testing for the pad location and design was completed by Geomex. The relevant geotechnical information is presented in Section 0 of this report. The location of the heap leach pad is shown on Drawing No. 000-GA-001 (Figure 17-1).
Standard heap leaching technology, extensively used throughout the international mining community, is being proposed for the recovery of copper resources. The mine is expecting to process a total of 258.5 million tonnes of ore at the proposed heap leach facility located about 0.5 kilometers north of the open pit. Run of mine ore removed from the open pit will be conveyed via mine haul trucks and stacked on the lined leach pad facility in 3-meter high lifts and then irrigated with a weak acid solution to extract copper metal. The acidic solutions will be contained on, and within, a synthetically lined pad with an underlying geosynthetic clay liner and in double lined solution ponds with leak detection. After metal extraction, the solutions will be recycled to the heap after supplementing the barren solution with acidified raffinate as necessary. The leach pad facility will consist of the following:
| ● | A leach pad to accommodate a total of approximately 260 million tonnes of truck dumped run of mine ore. The leach pad will be lined using a composite liner system consisting of prepared subgrade overlain by a geosynthetic clay liner overlain by a 2 mm thick textured LLDPE synthetic liner. |
| ● | A solution collection system consisting of perforated corrugated HDPE pipes placed on top of the primary liner and covered with a 0.5 meter thickness of liner cover fill material. |
| ● | A PLS pond and raffinate pond to collect and manage solution flows from the leach pad and SX processing plant. |
| ● | The fluid management ponds described above shall have primary and secondary synthetic liners with a synthetic leak detection layer installed between the pond liners. The pond leak detection system will report to a leak detection sump, which shall be monitored on a regular basis. |
| ● | A storm event pond shall be constructed as an emergency overflow pond that has been designed for runoff from the active, exposed and non-reclaimed leach pad area, and to contain solution drain-down for a period of 24 hours in the event of a power outage. This storm event pond will have a single synthetic HDPE liner installed for primarycontainment and will not have a leak detection system as this pond is intended to be managed to be empty except in the case of emergency fluid management. |
| ● | The heap leach pad and solution ponds are expected to have an operational life of 13 to 14 years at a nominal ore production rate of 50,596 metric tonnes per day. The PLS has a |
El Pilar Project Form 43-101F1 Technical Report | |
| | planned flow rate of 2,271 cubic meters per hour (m3/hr) (10,000 gallons per minute) and with an installed capacity of up to 3,700 m3/hr (16,000 gpm). |
Graphical description of the leaching process is shown in drawing 300-FS-001 (Figure 17-2), and the Heap Leaching Flow Sheet is summarized in Figure 17-3.
El Pilar Project Form 43-101F1 Technical Report | |
Figure 17-2: Heap Leaching Flowsheet (300-FS-001)
El Pilar Project Form 43-101F1 Technical Report | |
Figure 17-3: Heap Leaching Flow Sheet (300-FS-002)
El Pilar Project Form 43-101F1 Technical Report | |
| 17.1.1.2 | Project Description |
Process
The Run-of-Mine (ROM) ore from the open pit will be transported to the leach pad facility using contract and owner mine haul trucks. The ROM ore will be end dumped on the HLP and spread to nominal 3 meter thick lifts initially, although thicker lifts may be used in the future as real operating conditions become better known. Each leached lift will be ripped prior to the placement of new ore on the successive lift.
Leaching will consist of the application of acidic solution to the heaped ore on the lined pad utilizing a distribution network of piping, drip emitters and/or sprinklers. A perforated pipe network embedded in the liner cover fill material will collect the pregnant leachate solution at the base of the heap, above the HLP primary geomembrane liner. The solution collection pipes will transport the solution flows to the PLS pond. From the PLS pond, the pregnant solution will flow to the SX facility via a HDPE pipe.
Copper in the pregnant solution will be recovered using an SXEW process. The resulting barren solution will be circulated to the raffinate pond. The raffinate solution will be supplemented with acid and then recirculated to the heap, continuing the leach cycle at an average solution application rate of 3.4 liters/m2/hour, the actual application rate will vary depending on controlled raffinate pH conditions. The SX plant will process at an average rate of 2,271 m3/hour.
Heap Leach Pad Design Criteria
Based on the criteria developed by ML and the mining regulatory environment in Mexico, the following criteria were used for the feasibility design of HLP:
| ● | ore production rate: 50,596 tonnes per day average, |
| ● | dry density of ore: 1.77 tonnes per cubic meter, |
| ● | nominal ROM initial ore lift height: 3 meters, |
| ● | acid precure: 10 kg/tonne, |
| ● | average final ore heap height: 100 meters above the leach pad liner, |
| ● | overall heap side slopes of 2.5 horizontal to 1 vertical |
| ● | conveyance of all pad drainage by gravity flow to the PLS pond, |
| ● | PLS solution flow: 2,271 cubic meters per hour (m3/hr), variable |
| ● | Average leach application rate: 3.4 liters per hour per square meter, variable |
| ● | PLS pond volume: 24 hours containment at 2,271 m3/hr – 54,504 cubic meters, |
| ● | Raffinate pond volume: 12 hour containment at 2,271 m3/hr – 27,252 cubic meters, |
| ● | Storm Pond: total containment for the 100-year, 24 hour storm event. |
The following considerations were made for the layout of the proposed heap leach pad facility:
| ● | Earthwork construction requirements (cuts and fills) will be minimized based upon grading requirements. The majority of fill material required will be obtained from |
El Pilar Project Form 43-101F1 Technical Report | |
| | stripping of overburden in the open pit and from contour grading within the leach pad phases, |
| ● | Location of the PLS pond to provide a minimum of five meters of head to the SX plant, |
| ● | Initially the leach pad facility will occupy the western portion of the site and will expand in a easterly direction, |
| ● | The toe grades for the liner for the heap leach facility will be designed to minimize grading and earthwork volumes, and also ensure stability of the pad, |
| ● | Open channel ditches will be located to convey storm water around the HLP. |
Heap Leach Pad Liner System Design
Heap Leach Pad Liner System
The leach pad will be prepared for construction by first clearing, grubbing, and stripping the area of growth medium. Site grading will involve local cuts and fill of native alluvial materials. The limited area where the natural slopes within the leach pad footprint area are steeper than 2.0 horizontal to 1.0 vertical (2.0H:1.0V) will be flattened to a maximum slope of 2.0H:1.0V to facilitate the construction of the liner system and ore placement. Site grading in the leach pad area will be done primarily with engineered placed compacted mine waste fill to create a foundation that will accommodate the placement of the liner cover material and ROM ore.
The liner for the proposed El Pilar Leach Pad will be a composite system consisting of the following (from the foundation upward):
| ● | Prepared and compacted subgrade, |
| ● | a geosynthetic clay liner (GCL) secondary liner |
| ● | a 2.0 mm thick LLDPE geomembrane primary liner |
| ● | a minimum thickness of 0.5 meter crushed or (Liner Cover Fill) |
Solution Ponds Liner System
The liner system for the PLS and Raffinate solution ponds will be constructed with a double high-density polyethylene (HDPE) geomembrane liner system. The secondary HDPE liner will be of a geonet design as drain liner to provide regular spacing along the liner. The void space between the primary liner and the secondary liner will function as the high transmissivity layer component of the leak collection and recovery system (LCRS) system for the process ponds and will convey solution that migrates through the upper geomembrane liner to the gravel filled LCRS sump located in the lowest corner of each pond.
The LCRS sump can be monitored on a regular basis for the presence of solution and, if observed, a LCRS pump will be lowered down the access port to remove the solution and quantify the volume of solution removed. As long as the LCRS sump is monitored and evacuated as needed to maintain a minimum volume, hydraulic head on the lower geomembrane will be very low.
The liner system for the PLS and Raffinate ponds will consist of:
El Pilar Project Form 43-101F1 Technical Report | |
| ● | Prepared and compacted subgrade, |
| ● | a geosynthetic clay liner, |
| ● | a 1.5 mm HDPE secondary liner/ LCRS, |
| ● | a 1.5 mm thick HDPE geomembrane primary liner. |
Alberto Bennett of M3 Engineering is relied upon as an Other Expert for this report section. The locations of the heap leach, process plant, and other process facilities are shown on Drawing No. 000-GA-001 (Figure 17-1).
The PLS coming from the leaching area will be processed to recover copper using conventional solvent extraction, electro-winning (SXEW) technology. The SXEW plant is designed to process a maximum of 3,700 m3/h of PLS and produce an average of 79.3 million pounds of cathode copper per year (35,946 tpy) over the LOM.
The copper will be recovered from the PLS in a SX facility consisting of two parallel extraction stages and one stripping stage as shown in Solvent Extraction Diagram 400-FS-001, below. In the extraction stages the PLS loaded with copper (or aqueous solution) is contacted with a reagent diluted in a solvent, together called the “organic solution”, and then the solutions are left to separate by density difference in the settlers. The reagent extracts the copper from the PLS, the solution depleted of copper, or Raffinate, is pumped back to the leach pad to again recover copper. The organic solution carries the copper to the Stripping Stage, where the organic solution is contacted with a highly acidic solution, called Lean Electrolyte returning from the electro-winning tank house (EW). The high acid concentration in the Lean Electrolyte causes the reagent to release the copper, increasing the copper concentration to produce a Rich Electrolyte, which is pumped to the electro-winning tank house (EW).
The Rich Electrolyte pumped from the SX plant to the EW tank house will be distributed to 92 electrowinning cells each of which contains 67 lead anodes paired with 66 stainless steel cathodes. A direct electrical current will be applied to the cells to plate the copper on the stainless steel blanks. The copper plates will be removed in a 7 day cycle. Copper cathodes will be the final product of the EW circuit. At the planned throughput rate, the plant will produce 35,946 tpy of copper cathode or approximately 98 tonnes of copper cathode per operating day.
Copper cathode sheets will be weighed, sampled and assayed, and securely stored on site pending delivery to market. The El Pilar copper cathode product should meet ASTM B115, latest revision, Grade 1 specifications.
M3 used the METSIM™ process simulation system to perform the mass balance for the El Pilar leaching and SX-EW plant. METSIM™ is a metallurgical process simulation computer program written to perform mass balances around process unit operations.
El Pilar Project Form 43-101F1 Technical Report | |
| 17.1.2.2 | Solvent Extraction Plant |
The Solvent Extraction Plant (SX) is located immediately southwest of the leach pad. The prevailing wind direction in the project area is from the southwest. The general location of the SX Plant with respect to the other process facilities is such that no major facilities are downwind from or completely adjacent to the SX Plant. Although there have been only four plant fires reported since the commissioning of the first SX-EW plant in 1968, this is a precaution taken in recent plant designs to help protect the rest of the plant.
The plant consists of one train with three individual mixer-settler stages. There are two parallel stages of extraction (El and E2) and one stage of stripping (S1). Each extraction stage includes a primary mixer/tank, a secondary mixer/tank, a tertiary mixer/tank and a settler. The stripping stage only has primary secondary mixers and a settler.
The PLS storage pond is located in the southwest corner of the leach pad, at an elevation higher than the SX plant. The PLS will flow by gravity to the plant. This arrangement was dictated by the need to optimize earthworks in the area available for construction of the leach pad and the process plant.
Process flowsheet 400-FS-001 (Figure 17-4) below shows the flow distribution and drawing 400-GA-001 (Figure 17-5) shows the proposed arrangement.
The purpose of the tank farm (TF) is to filter rich electrolyte, heat rich electrolyte and recover organics.
Rich electrolyte is filtered to remove solids and organics. The rich electrolyte flows by gravity from the S1 stripper to the electrolyte filter feed tank. The collected electrolyte is pumped through electrolyte filters and collected in the filtered electrolyte feed tank.
The filtered electrolyte solution is pumped to the EW tank house through 2 heat exchangers operating in series. The first heat exchanger warms the rich electrolyte using lean electrolyte returning from the EW tank house. The second heat exchanger heats the solution using heat supplied from the acid plant steam system.
A system to process solvent extraction crud is installed in the TF. Crud is the material which accumulates at the organic/aqueous interface in the SX settlers. This material is treated to recover the valuable organics. The crud is removed from the settlers via an air operated pump and transferred to a crud decant tank.
The crud is diluted with diluents and allowed to settle in the decant tank. If required, clay may be added to remove impurities in the crud. The upper organic in the decant tank is recovered and sent to the loaded organic plant. The sediment at the bottom of the tank is pumped thru a clay filter and the filter cake removed.
El Pilar Project Form 43-101F1 Technical Report | |
Figure 17-4: Solvent Extraction Flowsheet (400-FS-001)
El Pilar Project Form 43-101F1 Technical Report | |
Figure 17-5: Solvent Extraction Plan (400-GA-001)
El Pilar Project Form 43-101F1 Technical Report | |
| 17.1.2.4 | Electrowinning Plant |
The electro-winning facility (EW) is located south of the tank farm and the SX Plant. The plant will utilize the permanent cathode technology, with 92 cells, each containing 67 lead anodes and 66 stainless steel cathodes. Located on the south end of the tank house building is the cathode washing and stripping machine. The tank house orientation allows the long axis of the building to be almost parallel to the prevailing winds. As of the writing of this report, an additional six cells will be added to the EW plant.
The EW tank house cells are arranged in 2 parallel banks of 46 cells each. In the hydraulic circuit all 92 cells are arranged in parallel allowing each cell to have the same feed solution and lean electrolyte discharge solution. In the electrical circuit all 92 cells are arranged in series. The electrical current is supplied by 2 rectifiers, electrical current flows from the rectifiers through a bus bar to the bank of cells. Each cell is equipped with inter cell bas bars, 66 cathode plates and 67 anode plates arranged in parallel. The cathodes are made of stainless steel and the anodes of rolled lead. Within each bank direct electrical current flows from an inter-cell bus bar to the anode and then through the electrolyte to the cathode plates, to an inter-cell bus bar and onto the next cell successively and finally returns to the rectifiers.
Heated filtered rich electrolyte flows from the tank farm heat exchangers into the electrolyte recirculation tank where it mixes with overflow from the lean electrolyte tank. The solution from this tank is pumped to the tank house cells where copper in solution is plated onto the cathode plates.
As a result of the electrochemical reaction at the anode, oxygen evolves from the EW cells creating an acid mist. To control the mist generated polypropylene balls and a surfactant are utilized. Cobalt sulfate is also added to passivate the anode and guar (a bean powder) is added as a surface modifier for the cathode.
The major components of the electro-winning process are listed below and a graphical description of the process is shown in drawing 600-FS-001 (Figure 17-6):
| ● | Electrolyte Circulation tank. |
| ● | Cathode washing and stripping machine. |
| ● | EW cell ventilation system. |
| ● | Anode/cathode refurbishment area. |
El Pilar Project Form 43-101F1 Technical Report | |
Figure 17-6: Electrowinning Flowsheet (600-FS-001)
El Pilar Project Form 43-101F1 Technical Report | |
| 18 | PROJECT INFRASTRUCTURE |
| | |
| 18.1 | Acid Plant |
| | 18.1.1 | Acid Plant – Introduction |
Alberto Bennett of M3 Engineering is relied upon as an Other Expert for this report section, except where otherwise noted.
In the 1980’s-1990’s, acid from copper smelters was the predominant source of sulfuric acid supply to copper leaching operations. In the 2000’s, the supply of smelter-produced acid has decreased due to smelter shutdowns and copper leaching acid demand has increased due to new copper leaching mine developments and higher acid consuming ores. This has led to the integration of sulfur-burning acid plant technology into copper leaching mine developments, including the design of the El Pilar Project.
The copper production process will require 600 to 1430 metric tons per day (tpd) of sulfuric acid to fully support the leaching of copper from the ore, with no purchase of market acid required except for the first three months when leaching is planned prior to final construction of the acid plant. In order to provide these acid requirements at the lowest cost possible, the project includes a 1300 tpd initial design capacity sulfur-burning acid plant to provide both acid and power.
Based on engineering design parameters, the 1300 tpd acid plant can be run at up to 110% of the design capacity, if needed. This results in a full design capacity of 1430 tpd, with additional power output commensurate with the 110% full design factor. Based on initial estimates, with a plant upgrade of about $9.0 M, which could be undertaken at any time during the mine life, a maximum plant capacity of 1600 tpd could be achieved. While this upgrade is not included in the project economics outlined in this report, such an upgrade is possible if additional acid plant capacity is required at any time during the project life, due to increased production rates or to other factors.
| | 18.1.2 | Acid Plant – Design and Layout |
Sulfur burning acid plant technology is a proven technology and every component within the El Pilar acid plant will be selected based on proven designs. The process is depicted in a simplified manner by the following block flow diagram (Figure 18-1). The diagram shows the following process steps:
| 1. | Molten sulfur and compressed air react in the sulfur burning step to produce sulfur dioxide (SO2). Excess air is supplied to the burner to ensure that burning is complete and that there is sufficient oxygen for the conversion step. |
| 2. | The SO2 gas is converted to sulfur trioxide (SO3) by reacting with residual oxygen in the process gases. |
| 3. | The SO3 is absorbed into a recirculating acid flow where it reacts with water (H2O) to produce sulfuric acid (H2SO4) in a liquid form. |
El Pilar Project Form 43-101F1 Technical Report | |
Figure 18-1: Acid Plant Block Flow Process Diagram.
The layout of the acid plant is shown below (Figure 18-2). The plant will occupy an area of approximately 55 meters by 53 meters.
Figure 18-2: Acid Plant Layout.
Key acid plant operating parameters are tabulated in Table 18-1.
El Pilar Project Form 43-101F1 Technical Report | |
Table 18-1: Acid Plant Key Operating Parameters.
| Acid Plant - Key Operating Parameters |
| Acid Production (as 100% H2SO4): | 1,300 mtpd |
| Steam Production: | 69,840 kg/h |
| Sulfur Consumption: | 433 mtpd |
SO2 Emission @ Final Absorption Tower: | <400 ppm (vol) |
| Acid Plant Turndown: | 50% (650 tpd) |
As discussed above, the acid plant will produce approximately 70,000 kg/hour of superheated steam, which will be directed to a turbine generator. Budgetary proposals from several established turbine generator manufacturers have confirmed that design power production of approximately 15.6 MW can be expected from this steam flow. The following table (Table 18-2) summarizes the power output of the turbine generator at the design (flowsheet) steam input associated with 1,300 tpd acid production, along with performance examples at lower and higher steam input rates.
Table 18-2: Expected Performance Characteristics of Turbine Generator.
| Turbine Data |
| Turbine Frame | R |
| Number of Stages | 10 |
| Inlet Valves | Multiple |
| Inlet Size/Rating | 8" / 600# |
| Bleed Size/Rating | 3" / 300# |
| Exhaust Size/Rating | 72" Rectangular |
| Generator Temp Rise | 80 degrees C |
| Generator Power Factor | 0.85 |
| Performance Data |
| | 50% Turndown | Flowsheet | Maximum |
| Inlet Pressure (Bar A) | 49 | 49 | 49 |
| Inlet Temperature (Deg C) | 403 | 403 | 403 |
| Bleed Pressure (Bar A) | 5 | 10.1 | 10.9 |
| Bleed Enthalpy (KJ/Kg) | 2,865 | 2,928 | 2,929 |
| Exhaust Pressure (Bar A) | 0.12 | 0.12 | 0.12 |
| Exhaust Enthalpy (KJ/Kg) | 2,386 | 2,332 | 2,330 |
| Inlet Steam Flow (Kg/Hr) | 35,000 | 69,840 | 75,000 |
| Bleed Flow (Kg/Hr) | 1,400 | 2,800 | 3,000 |
| Exhaust Flow (Kg/Hr) | 22,600 | 67,040 | 72,000 |
| Turbine Speed (RPM) | 4,500 | 4,500 | 4,500 |
| Generator Output (KW) | 7,135 | 15,615 | 16,920 |
El Pilar Project Form 43-101F1 Technical Report | |
The turbine exhaust will be directed to a steam condenser operating under vacuum. The condenser will be a shell and tube type heat exchanger. The vapor enters the shell side of the heat exchanger and reports as condensate to the condensate pumps for recycling through the water treatment system. The cooling for the steam condenser will be provided by raffinate solution entering the tubes of the heat exchanger from the SX processing plant at a rate of approximately 2,270 m3/hour (10,000 gpm). The materials used for construction of the condenser will be selected to ensure compatibility with raffinate chemistry and temperature.
The power plant will include a dump condenser that will condense steam, in the event steam flow is required to by-pass the turbine generator. The dump condenser cooling will also be provided by raffinate solution (the raffinate will flow in series, first through the turbine’s condenser followed by the dump condenser).
| | 18.1.4 | Acid Plant - Water Treatment Plant |
Expected water quality is shown below in Table 18-3.
Table 18-3: Preliminary Well Water Analysis.
| Preliminary Water Analysis |
| Parameter | Levels |
| pH | 7.72 mg/L |
| Conductivity | 284 microsiemens |
| Total Dissolved Solids (TDS) | 204 mg/L |
| Magnesium (Mg) | 5.08 mg/L |
| Calcium (Ca) | 35.4 mg/L |
Hardness (CaCO3) | 107 mg/L |
| Iron (Fe) | 0.05 mg/L |
| Silica (Si) | 25 mg/L |
Alkalinity (CaCO3) | 110 mg/L (est.) |
| Chlorine (Cl) | 12 mg/L |
The well water quality will be upgraded to protect the acid plant’s steam system and the power plant’s turbine from scaling and corrosion. The water treatment plant will be designed produce a water quality that is fully compliant with industry standards for steam and turbine system. Expected water quality is shown below in Table 18-4.
El Pilar Project Form 43-101F1 Technical Report | |
Table 18-4: Acid Plant Expected Water Quality
| Expected Water Quality |
| Parameter | Levels | 2% BD Goal | Expected |
| TDS | 100 ppm | 20 ppm | 3 ppm |
| Alkalinity | 0.0 ppm as CaCO3 | 1.2 ppm | 0.5 ppm |
| Hardness | 61 ppm as CaCO3 | 0.0 ppm | 0.00 ppm |
Phosphate (PO4) | 25 ppm | 0.5 ppm | Unknown |
Sulfite (SO3) | 25 ppm | 0.5 ppm | Unknown |
Silica (SiO2) | 25 ppm | 0.5 ppm | 0.25 ppm |
| Cl | 150 ppm | 3.0 ppm | 0.25 ppm |
| | 18.1.5 | Acid Plant - Boiler Water Quality Requirement |
During normal operations, most of the steam that is produced in the boiler and condensed in the power plant is recycled as boiler feed water. This recycling stream of condensate will be treated through a condensate polishing system as a precautionary measure to ensure the quality of the boiler feed water. Approximately 2% of the total steam production is diverted as boiler blow-down. This bleed stream is required to avoid the build-up of impurities in the steam. The make-up water to the boiler feed system will be treated by:
| 1. | Cartridge filtration to remove particulates. |
| 2. | Cation exchange water softening to remove scale producing ions. |
| 3. | Chemical treatment of the softened water with a dispersant and anti-scalant. |
| 4. | Reverse Osmosis (RO) treatment of the softened water to achieve the target water quality. |
Normal water make-up rates will be 5 m3/hour (22 gpm) to balance the steam system losses. This flow can be achieved through one of the three RO skids. The redundancy of RO systems will allow higher rates of treated water generation during possible process upset conditions.
| | 18.1.6 | Acid Plant - Cooling Water System |
The acid plant will require approximately 2,500 m3/hour of cooling water to provide approximately 100,000 MJ/hour of cooling duty. The cooling water is contained in a closed circuit system which will include a conventional three or four cell cooling tower system complete with cooling fans and a skid-mounted chemical treatment system. To maintain the proper level of dissolved solids in the recirculating flow of cooling water, approximately 42 m3/hour of water will be bled from the system. This water will report to the solvent extraction (SX) raffinate pond and hence will impart to the mine’s overall water balance. The evaporative losses from the cooling tower are projected to be 90 m3/hour. The cooling tower will be specified as a fiberglass system to provide a lower maintenance cost and lower fire risk system compared to cooling towers constructed from wood.
El Pilar Project Form 43-101F1 Technical Report | |
| | 18.1.7 | Acid Plant – Sulfur Unloading Storage |
The 430 tpd sulfur requirement for the acid plant will be delivered to the site by rail. Approximately 30 rail cars per week will be required. The origin of the sulfur will likely be from Texas where molten sulfur is produced as a by-product of oil refining. The sulfur deliveries will occur in batches of 10-15 rail cars. During the transit time, a portion of the molten sulfur in the rail car will solidify. Accordingly, the sulfur unloading system will include propane-fired boilers to produce steam that is required for rail-car heating.
The unloading system will be designed to accommodate 18 rail-cars on steam heating (Figure 18-3). Cars will be weighed full as they are received on the property and then positioned at the steaming stations (two rows of nine cars). After 12-24 hours of steaming, the cars will be sequentially emptied into a pit. From the pit, sulfur will be pumped to a sulfur storage tank or transferred to a truck where the sulfur will be hauled approximately 1.5 kilometers to the sulfur storage tanks adjacent to the acid plant.
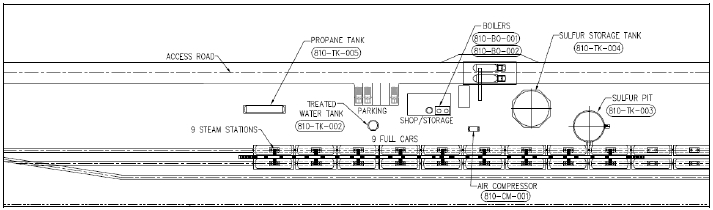 Figure 18-3: Sketch of Sulfur Unloading Facilities.
Sulfur storage in the acid plant area will be accomplished in two storage tanks, each with a usable capacity of 5000 m3 or approximately 9,000 tons of molten sulfur.
Operating cost categories to produce acid include:
| 2. | Power costs (these are actually more than off-set by the power credit from the acid plant), |
| 3. | Propane costs to produce steam at the sulfur unloading facility, |
| 4. | Reagent costs to treat water, and, |
| 5. | Operating and maintenance labor and supplies. |
Sulfur Costs - Sulfur is an internationally traded commodity and its pricing is monitored and forecast by several industry-recognized firms. The project commissioned a recognized industry consultant firm, Elkbury, to perform marketing and supply study with a delivered price forecast for molten sulfur in the Northern Mexico and Southwestern United States region for the life of the project. The study developed the projection of expected sulfur prices CFR (cost plus freight to the site).
El Pilar Project Form 43-101F1 Technical Report | |
The project’s cash flow model is based on the sulfur forecasts as summarized below in Table 18-5. Note that each ton of sulfur produces approximately three tons of acid. The average sulfur cost for the mine life is $126/ton. This sulfur cost results in an average LOM cost of $42 per ton of acid.
Table 18-5: LOM Economic Model Sulfur Pricing
| Project Sulfur Pricing |
| Year | $/ton |
| 2013 | $225 |
| 2014 | $150 |
| 2015 | $100 |
| 2016 | $115 |
| 2017 | $115 |
| 2018 | $115 |
| 2019 | $115 |
| 2020 | $115 |
| 2021 | $115 |
| 2022 | $115 |
| 2023 | $115 |
| 2024 | $115 |
| Average | $126 |
| $/ton acid | $42 |
Power Costs and Credits - Power requirements of approximately 3,800 kW are expected to produce acid.at the rate of 1,300 tpd. The major power draw is the acid plant’s combustion air compressor at 2,300 kW. The balance of the remaining power required is for boiler feed water pumping, cooling water pumping, acid pumping, and miscellaneous power demands, such as the cooling tower fans, sulfur pumping and water treatment requirements.
The turbine generator is projected to generate 15,600 kW. The net power credit from the acid plant installation is estimated at approximately 11,800 kW.
Propane Costs - Sulfur will be delivered to the project in rail-cars that are equipped with steam heating coils. The sulfur will likely be purchased from oil refineries, where molten sulfur is produced as a by-product of oil refining. It will leave the refineries in the molten state. Typically only a small percentage (less than 25%) of the sulfur will solidify during transit. Before the rail-cars are emptied, the rail-cars will be steamed for 16-24 hours to ensure that the contents are completely molten. Since the sulfur unloading facilities are remote from the main acid plant, a dedicated propane-fired boiler will be operated to generate the steam required for sulfur melting and heating.
Reagent Costs - Reagents are primarily required to treat water. The water treatment plant will require chemicals to soften the water and scale inhibitors to reduce fouling of the RO system. The cooling tower will require chemicals that include algaecides and dispersants. The boiler feed water system will require chemicals including oxygen scavengers.
El Pilar Project Form 43-101F1 Technical Report | |
Operating Cost Summary - The operating and maintenance costs discussed above are summarized below in Table 18-6. True variable operating costs are estimated at $2/ton acid ($2,600 per day). These include the cost items discussed above, as well as operating and maintenance labor. A $1,000 per day allowance is allocated for equipment repair parts and to accrue funds for maintenance repairs that will be required every 18 months to two years. This accrual does not include maintenance costs for the steam and power plant areas of the plant. The $0.01/kWh allowance for power plant operating and maintenance costs is allocated for all costs associated with power generation. This table shows that high sulfur prices and thus high acid costs are expected in 2013. Acid costs will then decrease from the 2013 level of $57/ton to a net cost that is less than $30/ton for most of the project life.
Table 18-6: Acid Plant Costs & Parameters by Year
| Projected Acid Plant Costs & Parameters by Year |
| | Design 2013 | Design 2014 | Design 2015- 2019 | Design 2020- 2025 |
| tpd acid | 1300 | 1300 | 1300 | 1300 |
| tpd sulfur | 426.1 | 426.1 | 426.1 | 426.1 |
| Total Acid Plant Area Power, MW | 3.8 | 3.8 | 3.8 | 3.8 |
| TG Generation MW | 15.6 | 15.6 | 15.6 | 15.6 |
| Net Power Export | 11.8 | 11.8 | 11.8 | 11.8 |
| "Other" acid cost, $/ton | $2 | $2 | $2 | $2 |
| "Other" acid costs, $/day | $1,000 | $1,000 | $1,000 | $1,000 |
| Total Sulfur Price | $225 | $150 | $100 | $115 |
| Total Sulfur Cost | $95,869 | $63,912 | $42,608 | $49,000 |
| Sulfur cost, $/ton acid | $73.70 | $49.20 | $32.80 | $37.70 |
| Total Cost, $/day | $99,469 | $67,512 | $46,208 | $52,600 |
| Total Acid Costs, $/ton | $76.50 | $51.90 | $35.50 | $40.50 |
| Purchased Power Cost | $0.10 | $0.10 | $0.10 | $0.10 |
| Power Plant O&M cost | $0.01 | $0.01 | $0.01 | $0.01 |
| Net Power Credit | $0.09 | $0.09 | $0.09 | $0.09 |
| Power Credit, $/day | $25,429 | $25,429 | $25,429 | $25,429 |
| Net AP/PP costs, $/day | $74,040 | $42,083 | $20,779 | $27,171 |
| Net AP/PP costs, $/ton acid | $57.00 | $32.40 | $16.00 | $20.90 |
The El Pilar property can be reached by road from Hermosillo, Sonora in Mexico and from Tucson, Arizona in the USA. From Hermosillo, the easiest access is via Hermosillo to Imuris (210 km) and Imuris to San Antonio (36 km), and from San Antonio to Miguel Hidalgo (San Lazaro) (35 km). Road access is by paved highway except for the final section of an all-season gravel road. The route from Hermosillo to Miguel Hidalgo takes about 3 1/2 hours of driving
El Pilar Project Form 43-101F1 Technical Report | |
time. The route from Tucson to Miguel Hidalgo is currently a two hour drive and utilizes a paved road from Nogales, Sonora to Miguel Hidalgo (30 km).
A main access road to the plant site from the main Nogales access road on west side of the project will be by way of a 6.5 Km long gravel road that will be constructed early in the project development schedule. The project access road includes a crossing over the Santa Cruz River bed by way of a concrete dip, with hydraulic/drainage structures as required.
Based on the hydrological study conducted by IDEAS and the process water balance, the project includes three water wells to supply necessary water for processing and services. Two of the three wells have been drilled, cased and tested, with yields of 30 lps and 40 lps, respectively. These yields total 2.3 Mm3/yr of the 3.5Mm3/yr required. A third and possibly a fourth well will be drilled to fulfill maximum projected water requirements. All wells are located within the property and are located a relatively short distance from the facilities (about 2.5 km).
Power will be supplied to the project area via a 115 KV transmission line from a substation located 21 Km south of Nogales, Mexico. The substation is ~30 Km west of the project area. The substation is owned and operated by Comisión Federal de Electricidad (CFE), which has confirmed power availability and provided an area next to the substation for the installation of switchgear and instrumentation. The power line will be 29.5 Km long and built by dip galvanized structural steel towers, except for along urban areas where steel tapered poles will be used. The line will have capacity to supply all of the power requirements of the project as backup, although most of the project power will be generated onsite by the sulfur burning acid plant.
As part of the infrastructure of the acid plant a railroad spur will be constructed to the plant site. The purpose of the spur is to provide a safe, economic and efficient access to sulfur deliveries by rail. The rail spur will access the property from the Ferromex rail system located on west side of the property, about 3.8 km distance from the sulfur unloading station. Rail facilities will allow for unloading and parking at least 18 railcars, with deliveries expected on a weekly basis.
El Pilar Project Form 43-101F1 Technical Report | |
| 19 | MARKET STUDIES AND CONTRACTS |
| | |
| 19.1 | Introduction |
Robert J. Loewen & Associates prepared this section for Stingray Copper Inc. in support of the 2009 feasibility study. This analysis is based on a projected annual capacity of 33,147 metric tonnes per year of ASTM B115 Grade 1 quality cathode. There are no contracts in place or required for the sale of copper cathode for this project.
| 19.2 | Recommended Marketing Strategy |
The projected production volume is too small to justify a direct marketing effort, and it is recommended that full production tendered to a selected group of major merchants. This strategy will ensure immediate market entry and expedited payment with little or no credit risk in an increasingly competitive regional market.
Metal merchants have generally been eager to source new production from non-integrated producers in order to displace higher cost imported cathode, and to provide more competitive prices to their US and Mexican customers. Consequently, new US and Mexican electrowin cathode producers such as Frontera Copper (Piedras Verdes), Nord Resources (Johnson Camp) and Quadra Mining (Carlota) and Zaruma Resources (Luz del Cobre) had obtained reasonable terms under long-term off-take contracts from major US merchants, most for 100% of production.
These contracts include provisions for very prompt payment facilities. With a suitable counterparty these contracts could also be tied to bridge loans, senior or subordinated project debt facilities and/or corporate or project equity purchase agreements.
| 19.3 | Cathode Sales Terms and Net Realizations |
Based on current cathode premium levels, estimated average freight costs to major consuming points in the southwest and southeast US and northern and central Mexico, and long-term cathode off-take terms negotiated recently by new electrowinning cathode producers, El Pilar can expect to realize terms similar to the following:
Delivery: FCA Refinery. Buyer arranges and pays for cathode transportation.
Price: COMEX average price during the Quotational Period less a discount of 3.0 cents /lb. for rod mill quality ASTM Grade 1 quality material, with negotiated discounts for lesser quality material. This estimate is based on a rough weighted average freight and marketing costs (including merchant profit margins) in serving to the most likely regional end-users for this quality of cathode, and factors in the more competitive nature of the regional market with the growth in new SX-EW capacity.
Quotation Period: Month of shipment, or month following month of shipment declarable by Buyer once or twice per year, depending on market conditions.
Payment: On date of shipment (equivalent).
El Pilar Project Form 43-101F1 Technical Report | |
Merchants provide useful services to the market. In recent years consumers have shifted a larger share of their cathode requirements to them for three main reasons:
| 1. | There are still only a few consumers that are equipped and willing to buy imported cathode on a CIF Port basis because of insufficient or inadequately trained staff and/or a desire to avoid lengthy pipeline financing. Nor are they willing to take on the performance risk in dealing with relatively small independent cathode producers. |
| 2. | Consumers use merchants as a way of managing inventory at relatively low cost – buying unanticipated requirements from them and selling them back excess stocks as required to minimize these costs. |
| 3. | Some merchants are more flexible on payment terms than producers who now all sell on a net cash basis. |
El Pilar Project Form 43-101F1 Technical Report | |
| 20 | ENVIRONMENTAL STUDIES, PERMITTING AND SOCIAL OR COMMUNITY IMPACT |
| | |
| 20.1 | General Description of Environmental Conditions |
| | 20.1.1 | Geomorphologic Conditions |
Morphologically, the area encompasses modest hilly topography formed by erosion and weathering primarily of unconsolidated range-front sediments. The area is bounded to the west and south by the Santa Cruz River.
Landscape will be affected at first by clearing and grubbing, road construction and construction of mining facilities. Ultimately, impacts will be from the mine pit, waste dumps, and placement of ore on the heap leach pad. The effects of mining are irreversible, although some landscape effects are partially reversible in the long run through planned restoration and reforestation methods.
Most soils in the area are poorly developed C-horizon gravels. The project area shows moderate surface erosional degradation with some top soil erosion due to over grazing activities.
In order to avoid adverse effects to the surface during mining, a series of prevention and mitigation measures will be taken, including proper waste collection and disposal and machinery and equipment maintenance. In the closure stage, restoration activities will be carried out as defined in the MIA permit. Ground quality will be monitored and a Ground Preservation Plan will be implemented.
The Santa Cruz River is the main hydrologic resource in the area, with permanent flow in the study area and intermittent ephemeral flow to the south. During the rainy season, wash runoff drains into the Santa Cruz River.
Three locations alongside the Santa Cruz River were sampled in April, 2011 for water quality purposes; one location is upstream NW of the Miguel Hidalgo town and two are downstream of the town. Results from one location show elevated values slightly above allowable norms (NOM-001-SEMARNAT-1996) in fat and oil content but all other locations and parameters are within norm limits.
Surface preservation and mitigation measures planned are: impermeable retention areas where chemical substances or process solutions are handled, implementation of a hazardous and non-hazardous waste handling program, monitoring of surface water and creek sedimentation and water quality, and storm water diversion around disturbed areas where required.
El Pilar Project Form 43-101F1 Technical Report | |
In a hydrological study carried out by Rangel (2008) a total of 196 groundwater sources are considered to be available to the Santa Cruz River aquifer, providing an average annual extraction rate of 26.38 hm3, mainly for public-urban and agriculture uses. The hydrological study which included extensive fieldwork, discovered an aquifer parallel and independent to the Santa Cruz River stream, this newly found aquifer is confined within a basin originated during the Cretaceous-Tertiary and filled during the Pleistocene-Holocene. An availability of 12.907 Mm3 of groundwater per year from this new aquifer was determined as a baseline for permitting purposes. The groundwater static level depth was determined to range between 1.99 m to 48.93 m with a 7.46 m, average.
Groundwater sampling results show that water quality in the area is good, although one of the area wells sampled has iron concentrations above norm and three of them have total coli forms above the limits stated by NOM-127-SSA1-1994.
Prevention and mitigation measures contemplated to protect groundwater quality include a waterproof layer in the leach pad, sumps and process areas, as well as installation of water monitoring wells below mining facilities with regular water quality monitoring.
The project area surface is covered mainly by grazing land and to a lesser degree by scrub oak and bushes comprised mostly of mesquite. Currently, the land is used for cattle grazing. Because the area is semi-arid and not easily suitable for large scale agriculture, mining is a preferred development activity. An independent review of the area vegetation done for permitting purposes found that no protected species are present.
Actions that are planned to mitigate vegetation impacts include compensation payments to the forest fund for land use rights, organic topsoil recovery during clearing and reuse of this material in the closure phase, and implementation of a flora and fauna species protection program during all stages of the project, including soil scarification and planting native species to restore the affected areas.
An independent regional survey found 305 species of fauna, none of which have an impact on planned operations in the area.
| 20.2 | Waste Management, Site Monitoring and Water |
Waste generated during development and mining operations will be handled according to the provisions of the General Law for Prevention and Integrated Waste Management. A landfill will be built in the western part of the site to manage non-hazardous solid waste that cannot be recycled or reused, in compliance with NOM-083-SEMARNAT-2003.
El Pilar Project Form 43-101F1 Technical Report | |
Hazardous waste will be disposed of offsite in full compliance with NOM-052-SEMARNAT-2005, NOM-053-SEMARNAT-1995 and NOM-054-SEMARNAT-1995. Wastewater from sanitation services will be collected by a septic tank system constructed in compliance with NOM-006-CNA-1997.
Testing of waste rock by the Analítica del Noroeste lab analysis under NOM-141-SEMARNAT-2003 shows that the material is not an acid generator and thus requires no special provisions for handling and disposal.
Mexican laws require that mandatory monitoring programs are implemented under the Environmental Protection Agency SEMARNAT. For El Pilar, the following monitoring programs have been established by SEMARNAT for the life of the mine (Table 20-1).
Table 20-1: Environmental Monitoring Program
| Action | Criteria/Variables to Consider | Applicable Norms | Monitoring Point | Frequency |
| Groundwater quality monitoring | Parameters stated by applicable norm | NOM-127-SSA1-1994 Compared with baseline | Monitoring wells | Quarterly |
| Surface water quality monitoring | In accordance with quality criteria which depend on the use of the receiving body of water | NOM-001-SEMARNAT-1996 Consider criteria for aquatic life use quality on Santa Cruz River) | 3 monitoring sites along Santa Cruz River | Biannual |
| Creek sediment quality monitoring | Total metals (As, Cu, Ni, Cd, Pb, Au, Ag, Se, Hg, Cr) | Baseline conditions | 6 sediment sampling sites | Annual |
| Air quality monitoring | SO2, SO3, H2SO4 fog prticles | NOM-039-SEMARNAT-1993 NOM-043-SEMARNAT-1993 | Smokestack emissions | Annual |
| Perimetral noise | Decibels | NOM-081-SEMARNAT-1994 | Project boundary towards Miguel Hidalgo ejido | Annual |
| Fauna registry | Species and amount | Compensation commitment | All the project areas | Biannual |
Flora species rescue records and nursery plant production | % of survival, amount and type of plants produced | Compensation/ restoration commitment | Replanting and safeguard areas | Biannual |
| Soil | Collection and safeguard of organic soils Application of remediation techniques on pollute oils Erosion control works | Compensation commitment | Soil safeguard areas Remediation sites Roads and banks | Biannual |
| Cleared surface and restored/reforested registry | Surface (hectares) | Compensation/ restoration commitment | Affected areas | Biannual or as required |
El Pilar Project Form 43-101F1 Technical Report | |
| 20.3 | Project Permitting Requirements and Status |
There are a number of environmental permits required to put the project into operation. Most of the mining regulations are at a federal level but there are also a number regulated and approved at state and local level.
There are three SEMARNAT permits required prior to construction; MIA, CUS and AR. A construction permit is required from the local municipality and an archaeological release letter from the National Institute of Anthropology and History (INAH). An explosives permit is required from the Ministry of defense before construction as well. The key permits and the stage at which they are required are summarized below in Table 20-2.
Table 20-2: Permitting Requirements
| Key Environmental Permits |
| Permit | Mining Stage | Agency |
| Environmental Impact Manifest - MIA | Construction/Operation/Abandonment | SEMARNAT |
| Land Use Change -CUS | Construction/Operation | SEMARNAT |
| Risk Analysis - AR | Construction/Operation | SEMARNAT |
| Construction Permit | Construction | Santa Cruz Municipality |
| Explosive & Storage Permits | Construction/Operation | SEDENA |
| Archaeological Release | Construction | INAH |
| Water Use Concession | Construction/Operation | CNA |
| Water Discharge Permit | Operation | CNA |
| Unique License | Operation | SEMARNAT |
| Accident Prevention Plan | Operation | SEMARNAT |
Environmental Impact Manifest (MIA) – Regulations within Mexico require that an Environmental Impact Manifest (Manifestacion de Impacto Ambiental) (MIA) be prepared by a third-party contractor for submittal to SEMARNAT. The MIA must include a detailed analysis of climate, air quality, water, soil, vegetation, wildlife, cultural resources and socio-economic impacts.
Analysis of Risk – A second required permit is Risk Analysis (RA). A study needs to be developed to obtain this permit. This study identifies potential environmental releases of hazardous substances and evaluates the risks in order to establish methods to prevent, respond to, and control environmental emergencies. In El Pilar Project, no hazardous substances will be used or processed, thus SEMARNAT will not need a Risk Analysis to be done for current project conditions.
Land Use Change (CUS) – The third permit is Change of Land Use Study (Cambio de Uso de Suelo) (CUS). In Mexico, all land has a designated use. The various areas comprising the project site are designated as forest land, cattle grazing, and agriculture. The CUS is a formal
El Pilar Project Form 43-101F1 Technical Report | |
instrument for changing the designation to allow mining on these areas. The CUS study is based on the Forestry Law and its regulations. It requires that an evaluation be made of the existing conditions of the land, including a plant and wildlife study, an evaluation of the current and proposed use of the land and impacts on natural resources and an evaluation of the reclamation and revegetation plans. The establishment of agreements with all affected surface land owners is also required.
To date, the El Pilar project is ready to begin construction activities, with all major Environmental, Federal, State and local permits having been obtained for the project, including the access road and railroad spur environmental permits (MIA and CUS). The power line environmental studies (MIA and CUS) are at an advanced stage and will be filed as soon as the power line right of way agreements and detailed engineering are completed.
Water concession approval has been obtained for 2.3 M m3/yr, and an additional concession for 1.2 M m3/yr is in the final stage of approval by Comision Nacional del Agua (CNA), which will result in the total 3.5 M m3/yr required for the LOM.
Other approvals, licenses and permits required for various aspects of a mine development, and their status, are shown in Table 20-3.
El Pilar Project Form 43-101F1 Technical Report | |
Table 20-3: Permit Matrix
| Permit | Agency | Date Required by: | Description / Comments | Agency Fee | Process Time | Status Completion Est. | Applied by |
| Environmental Impact Assessment (MIA) Mining and Access Road/RR Spur , Particular modality | SEMARNAT Environmental and Risk Ministry SEMARNAT State Office | Prior to construction | Similar to an EIA in US NEPA terms. Requires an evaluation of baseline conditions and predicted effects with regard to air, water, soils, wildlife, plants, cultural resources and socioeconomic factors. Requires a discussion and evaluation of mitigation measures such as avoidance strategies, control equipment, monitoring plans, and reclamation plans. | For application: A $ 23,343.00 B $ 46,687.00 C $ 70,031.00 Valid fees from January of 2011 A, B, or C according to environmental criteria | NA | Approved, Release Delivered Sept 26, 2011 (mining) and Sept 21, 2012 (access road and RR spur) | M3 |
| Change of Land Use (CUS) Mining and Access road/RR Spur | SEMARNATForestry Resources SEMARNAT State Office | Prior to construction | This permit from SEMARNAT is required to change the use of land where such a change might have a serious adverse impact on soil or ecology. For example, stripping of vegetation in preparation for mine construction would require such a permit.The permit application process requires submittal of a justification for the change that takes into account not only the predicted effects on soil and ecology, but also the economic benefits that would arise should the change be permitted. | Final cost: $36,500,000 pesos (mining) and $351,515 (access road and RR spur) | NA | Approved by SEMARNAT, Resolution received on January 30 2012 (mining) and Aug 23 2012 (access road and RR spur) | M3 |
| Archaeological release letter(Mining, access road and RR spur) | INAH (State offices) | Prior to construction | INAH will review project plans and inspect project area for historic and archaeological resources. Following inspection they will issue a clearance letter or advise on requirements for protection or recovery of resource. | No cost. | NA | Approved Release Delivered Apr 29, 2011 | M3 |
| Environmental Impact Assessment (Power Line) | SEMARNAT Environmental and Risk Ministry SEMARNAT State Office Municipality FERROMEX/SCT | Prior to construction | Similar to an EIA in US NEPA terms. Requires an evaluation of baseline conditions and predicted effects with regard to air, water, soils, wildlife, plants, cultural resources and socioeconomic factors. Requires a discussion and evaluation of mitigation measures. Also requires an evaluation of project alternatives. Ferromex, SCT and municipality approve crossings and routes within city limits. Power lines do not require a Risk Analysis. | For application: A $ 23,343.00 B $ 46,687.00 C $ 70,031.00 Valid fees from January of 2011A, B, or C according to environmental criteria | Approx. 90 days | Progress to date 70%, study to be resumed by Jan 2013, approval expected by May 2013 | M3 |
El Pilar Project Form 43-101F1 Technical Report | |
| Permit | Agency | Date Required by: | Description / Comments | Agency Fee | Process Time | Status Completion Est. | Applied by |
| Archaeological release letter (Power Line) | INAH (State offices) | Prior to construction | INAH will review project plans and inspect project area for historic and archaeological resources. Following inspection they will issue a clearance letter or advise on requirements for protection or recovery of resource. | No cost. | NA | Approved Release Delivered Aug 29, 2011 | M3 |
| New Concession of Ground Water | SEMARNAT CNA | Prior Construction | Allocation of surface water for beneficial use. | $2,745.00 pesos / January of 2011 | Approx. 90 days | Title for 2.3 Million cubic meters received on Dec 15 2011. Title for additional 1.2 million cubic meters in Process CONAGUA Mexico City | El Pilar |
| Use of Explosives | SEDENA | In order to buy transport, store or use explosives | Permission required, in writing, from the Governor of the State. Security clearance required. Must inform of location of powder magazines and the closest human activity. Requires monthly reports on usage and inventory . | $9,134.00 pesos/ January of 2011.Letter of notification from the Sate Governor and a Municipal Certificate of Security. Has a variable cost, part of which is a site inspection by a SEDENA representative. | Approx. 30 days remaining | Permit expected by October 2012 | El Pilar |
| Residual Water Discharge Registration and Permission | SEMARNAT CNA | Before using water | Waste water discharge permit for release to surface or ground water. Permit not required, all residual water to be incorporated in the process areas (leaching). | NA | NA | NA | NA |
| Construction License | Municipality | Prior to construction | Building permits. | Varies | NA | Obtained | El Pilar |
| License of Land Use | Municipality | Prior to construction | Approval of County for land use. Equivalent to zoning approval. | Varies | NA | Obtained | El Pilar |
| Unique Environmental License | SEMARNAT State Office | Six months after operation starts | Required for new operations, planned expansions of existing operations or operations that need regulation. This is a Federal requirement. | For application$ 1,870.00 pesos / January of 2011 | 150 days | NA | El Pilar or consultant |
| Hazardous Wastes Disposal | SEMARNAT State Office | Prior to operation | Generators of hazardous waste must be licensed. Generators are responsible for ultimate safe disposition of wastes. | NA | NA | NA | El Pilar or consultant |
| 20.4 | Reclamation and Closure |
In accordance with the general work schedule of the El Pilar Project, the abandonment phase will commence after year 12. As part of the permitting requirements, ML will prepare a detailed Closure and Reclamation Plan, which will be concurrently executed from the operation phase of the project and will be completed in the abandonment phase.
El Pilar Project Form 43-101F1 Technical Report | |
Conditions of the final closure and reclamation plan will depend on land use after the mining operations. It is anticipated that designated uses will be one or a combination of the following:
| ● | Natural habitat for wild flora and fauna. |
| ● | Land with potential for livestock activities. |
| ● | Sites with touristic-recreational potential (includes the banks of the Santa Cruz river). |
General guidelines and criteria for closure and reclamation are described in the following:
Pit banks must be structurally stable and a barrier will be built around the pit for safety. If necessary, there will be designated viewpoints. Also, signals will be placed around the pit perimeter to warn about the area risks. Other important pit restoration activities will include detouring or channeling of rain water towards pit, closing of access roads and scarification and cultivation of native seeds and plants. The northeastern portion of the pit will be filled partially with waste rock during the final mine phase.
Waste rock dumps will remain onsite and piles and banks will be smoothed to prevent ponding. Earthworks will be constructed if necessary to control and deflect drainage routes towards natural creeks.
The waste dumps will be covered with recovered topsoil from the initial construction phase. Where needed and when operationally possible, land will be scarified and native species will be planted.
Acid-base accountability (ABA) testing results show that waste rock will not generate acid mine drainage and, therefore, is not classified as hazardous waste. This means that no isolation or special treatment during the closure stage will be required.
Characteristics of the exhausted ore will be evaluated at the end of the mine life to define requirements of a leach pad restoration program. For baseline purposes, several acid-base accountability and toxicity tests were carried out (ABA) with leached material subject to metallurgic tests. A composite of the material to be mined during the first years of operation and results show that the exhausted ore is not acid generating and thus is not characterized as hazardous waste. Nevertheless, annual composites will be extracted from the leach pads during the LOM to monitor exhausted ore behavior.
The following is the preliminary plan for leach pad reclamation.
| ● | Once leaching is complete the pad will be rinsed. The rinsing process will conclude when metal and metalloid concentrations at the ponds are below top limits defined in NOM-001-SEMARNAT-1996. Sampling must be done in accordance with this norm. |
El Pilar Project Form 43-101F1 Technical Report | |
| | Hydrogen ion potential (pH) in the rinse solution must be between 5 and 10 pH. Equilibrium is reached when values remain the same over a sufficient period of time. |
| ● | Pond washing will take place commensurately with pad rinsing. Once this process is complete, prevention and control measures will be implemented to guarantee long term pond physical stability. |
| ● | In order to reduce wind and water erosion, reclamation work will be performed at the base and banks of the system, including: |
| a) | Bank reconfiguration will occur based on a bank stability analysis supported by geo-technical studies erosion. |
| b) | Construction of bank berms to reduce and channel wind and water erosion. |
| c) | Construction of waterworks within the perimeter of the pond in order to avoid inclusion of water from washes. |
| ● | The following safety measures will be taken for surface restoration: |
| a) | Cover pond surfaces with recovered soil, if applicable, or with materials that allow the proliferation of flora. |
| b) | Promote reforestation or re-vegetation with regional native species in order to guarantee succession and permanence with minimum preservation efforts. |
| c) | Create a geometric area with reduced visual effects. |
| ● | Pregnant and raffinate ponds will be reclaimed as follows: |
| a) | Filled with non-hazardous material where applicable. |
| b) | Surface water drainage capacity handled compliance with pre-mining levels. |
Remaining process pond solutions will be removed and unloaded in compliance with NOM-001-SEMARNAT-1996. Remnant sludge will be left at the bottom of ponds and then covered and buried with a plastic membrane. All ponds will be filled with waste from different mining phases. The land will then be scarified and prepared for seeding or planting with native species. Surface water drainage will be in compliance with pre-mining levels.
| | 20.4.6 | Process Plant and Service Facilities |
Recovery plant cleaning, dismantling and closure will be carried out, as well as will the recovery of equipment and material useful for the company or third parties.
All facilities will be dismantled or demolished. Major production equipment will be dismantled and sold at closure. Foundations will be removed and holes filled to restore natural topography where possible. The land will be scarified and native species planted and cultivated.
Some roads will be left to access main areas of the site to facilitate closure and monitoring. Internal roads will be leveled and scarified to promote local plant growth via the addition of topsoil and native species planting or cultivation with seeds.
El Pilar Project Form 43-101F1 Technical Report | |
Groundwater monitoring will be conducted for two years post closure using operation wells and surface water monitoring will be conducted on the main creeks and the Santa Cruz River.
The El Pilar project is located within lands controlled by the Miguel Hidalgo Ejido, a municipality comprising a population of 520 in Santa Cruz, Sonora State.
During the MIA permitting process, mine socioeconomic impacts were considered over a 20 km radius in which 16 communities are located consisting of 3,314 inhabitants. The independent review process included interviewing the entire population of Miguel Hidalgo and a representative population from nearby towns of Santa Cruz and Mascarenas, and as well smaller communities within a 10 km radius. Most of the local population is concerned by the lack of employment, education and services in the area and 95% of the people interviewed indicated support for development of the El Pilar project.
The El Pilar project will offer over 200 potential temporary and permanent jobs to the region. Special effort will be taken during the project to provide support to the local communities, including assisting with introducing and improving basic services and educational institutions.
El Pilar Project Form 43-101F1 Technical Report | |
| 21 | CAPITAL AND OPERATING COSTS |
| | |
| 21.1 | Capital Costs |
| 21.1.1.1 | Facilities Initial Capital Costs |
Facility capital cost estimates were developed independently by M3 Engineering for the 2011 Study and are not modified herein, except for bringing the estimated cost of the Phase II heap leach pad build-out forward from Year 3 to Year 0, due to the added heap leach pad space required by the 3 m lifts. The facility capital costs include pre-stripping, construction of the heap leach pad, building of the SXEW and acid plants and costs for infrastructure requirements, including the access road, rail spur, power line and water source and distribution system. Costs for engineering of the SXEW plant assume that drawings from the SXEW plant at Piedras Verdas are used, with modifications made to those plans as required to match the El Pilar plant and topographic layout. ML has already purchased those drawings and that cost is included in the M3 estimate of owner’s costs.
Table 21-1 is a tabulation of facility initial capital costs, including the capitalized prestripping. Total initial facilities capital cost total $279.9 M.
El Pilar Project Form 43-101F1 Technical Report | |
Table 21-1: Facility Initial Capital Costs
| Initial Capital Cost Estimate |
| AREA | AMOUNT |
DIRECT FIELD COST | |
| General Site Plan | 6,697,924 |
| Mine Truck Shop, Fuel, Lube, Truck Wash, etc. | 994,211 |
| Water System | 3,136,426 |
| Heap Leach Phase I & II | 56,943,123 |
| Process Maintenance shop | 200,534 |
| Solvent Extraction | 10,663,438 |
| Tank Farm | 8,093,024 |
| Electrowinning | 29,387,857 |
| Power Plant | 9,548,486 |
| Main Substation | 2,851,814 |
| CFE Substation and 115 kV Power Line | 7,104,716 |
| Water Treatment | 1,352,053 |
| Acid plant | 39,229,766 |
| Sulfur Unloading and Handling | 8,767,569 |
| Cooling Towers | 1,332,652 |
| Acid Storage | 4,608,170 |
| Ancillary Buildings | 673,757 |
| Laboratory | 1,040,964 |
| Offices | 450,448 |
| Security and First Aid | 210,561 |
| Explosives Storage ,etc. | 201,185 |
| Freight | 7,893,550 |
| Duties | 3,335,761 |
| TOTAL DIRECT FIELD COST | $204,717,988 |
| INDIRECT FIELD COSTS & OTHER CONSTRUCTED COSTS | |
| Contractor Mobilization Costs | 1,080,000 |
| Construction Power & Utilities | 250,000 |
| TOTAL CONSTRUCTED COST | $206,047,988 |
| EPCM COST | |
| EPCM & QC | 20,539,000 |
| Site CM Facilities | 268,126 |
| Vendors Commissioning | 144,000 |
| Commissioning & Capital Spare Parts | 777,677 |
| EPCM SUBTOTAL | $21,728,803 |
| TOTAL DIRECT FIELD + EPCM COST | $227,776,791 |
| OWNER'S COST | |
| Owners Cost | 5,360,000 |
| CONTINGENCY (15%) | 34,158,000 |
| TOTAL OWNER'S COST | $39,518,000 |
| CAPITALIZED PRE-STRIPPING COST | 12,608,990 |
| GRAND TOTAL INITIAL CAPITAL COST ESTMATE | $279,903,782 |
El Pilar Project Form 43-101F1 Technical Report | |
The initial capital costs are scheduled to be expended over an 18 month period, with estimated monthly expenditures outlined in Table 21-2.
Table 21-2: Capital Cost Expenditures by Month
| Initial Capital Expenditures by Month ($M) |
| | January | February | March | April | May | June | July | August | September | October | November | December |
| Year -1 | - | - | - | - | - | - | - | 7.11 | 10.88 | 11.89 | 13.47 | 18.00 |
| Year 0 | 20.33 | 22.66 | 22.46 | 23.27 | 23.29 | 18.99 | 17.48 | 17.52 | 16.45 | 13.00 | 8.14 | 7.82 |
| Year 1 | 7.14 | | | | | | | | | | | |
| 21.1.1.2 | Facilities Mine Development/Prestripping Capital Costs |
Operations during the first five months of site activities in Year 0 (May-September) will consist of prestripping of waste by a mining contractor. The total amount of waste material that is scheduled to be moved during this period is 8.6 M tonnes. At a cost of $1.46 per tonne for contractor mining, this equates to $12.6 M in capitalized prestripping costs. These costs are included in facilities capital costs as capitalized pre-stripping.
| 21.1.1.3 | Facilities Sustaining Capital Costs |
Facility sustaining capital is now zero dollars, due to moving the $26.4 M originally planned in Year 3 for Phase II expansion of the leach pad to Year 0. This change was required due to the extra pad space needed for construction of the 3 meter lifts.
| 21.1.1.4 | Working Capital Costs |
Working capital requirements are calculated on the basis of inventories and accounts receivable and payables by year. Working capital costs in Year 0 total $33.8 M.
| 21.1.1.5 | Mine Capital Costs Summary |
The estimated mine capital costs originally developed by IMC in 2011, and not modified herein, include the following items:
| ● | Mine preproduction development expense. |
The estimated cost of the following mining facilities is also included in this estimate.
| ● | The mine shop and warehouse, and shop tools. |
| ● | Fuel and lubricant storage facilities. |
| ● | Explosive storage facilities. |
El Pilar Project Form 43-101F1 Technical Report | |
Table 21-3 summarizes the mine capital cost by category for initial and sustaining capital. The initial mine capital period is considered to be first year of owner mining (Year 3).
El Pilar Project Form 43-101F1 Technical Report | |
Table 21-3: Mining Capital Costs
| Mining Capital - Mine Equipment and Mine Development (US$x1000) |
| | | Initial Capital by Time Period | | | |
| Category | | Year 3 | Year 4 | Year 5 | Year 6 | Year 7 | Year 8 | Year 9 | Year 10 | Year 11 | Year 12 | Year 13 | Initial Capital | Sustaining Capital | Total Capital |
| Major Equipment | | 99,946 | 5,566 | 5,566 | 2,783 | - | - | 1,500 | - | - | - | - | 99,946 | 15,415 | 115,361 |
| Support Equipment @ | 10.0% | 9,995 | 557 | 557 | 278 | - | - | 150 | - | - | - | - | 9,995 | 1,542 | 11,536 |
| Initial Spare Parts @ | 5.0% | 4,997 | 278 | 278 | 139 | - | - | 75 | - | - | - | - | 4,997 | 771 | 5,768 |
| Mine Facilities | | 6,837 | - | - | - | - | - | - | - | - | - | - | 6,837 | - | 6,837 |
| Equipment Subtotal | | 121,775 | 6,401 | 6,401 | 3,200 | - | - | 1,725 | - | - | - | - | 114,938 | 17,727 | 132,665 |
| Contingency @ | 8.0% | 9,742 | 512 | 512 | 256 | - | - | 138 | - | - | - | - | 4,997 | 1,418 | 6,415 |
| TOTAL MINE CAPITAL | | 131,517 | 6,913 | 6,913 | 3,456 | - | - | 1,863 | - | - | - | - | 131,517 | 19,145 | 150,663 |
| Inclusions: Mine shop and warehouse, fuel and lubricant storage, explosives storage, and offices. | | | | | |
The costs are based on Q4 2011 US dollars.
El Pilar Project Form 43-101F1 Technical Report | |
| 21.1.1.6 | Mine Equipment Capital Costs |
The initial cost of mine major equipment is $121.8 million in Year 3. Sustaining capital cost for major equipment is $19.1 million. Total capital for mine major equipment is $150.7 million over the mine life. These estimates are unchanged from the 2011 Study, except for the need to purchase one additional shovel in Year 3, rather than in Year 5 in the 2011 Study, and are still reliable and current. Because owner mining is only planned for a total of 11 years, no mining equipment is scheduled for replacement. Rather, the mine sustaining capital consists of additional equipment required after Year 3, due to more tonnes being mined in certain later years of the mine schedule (Years 4, 5 and 6).
The mine capital equipment estimate is based on vendor quotes for all equipment except the blasthole drill, which is estimated. Table 21-4 shows the unit costs for the major equipment.
Table 21-4: Unit Costs for Major Mine Equipment
| Major Equipment Prices |
| Equipment | Delivered Price ($,000) |
| Atlas Copco DML Drill, 229mm | 1,500 |
| Cat RH200 Hydraulic Shovel, 26 cu m | 8,935 |
| Komatsu 730E Haul Truck, 190 ton | 2,783 |
| Komatsu WA1200-3 Wheel Loader, 18 cu m | 4,051 |
| Komatsu D375A5 Track Dozer, 451 kW | 966 |
| Komatsu WD600-3 Wheel Dozer, 362 kW | 753 |
| Komatsu GD825A2 Motor Grader | 645 |
| Komatsu HD785-7 Water Truck, 100 ton | 1,375 |
| 21.1.1.7 | Support Equipment & Initial Spare Part Allowance |
An allowance for support equipment is based on 10% of major equipment purchases for each year. Support equipment includes items such as mechanics trucks, welding trucks, cranes, shop forklifts, pickup trucks, etc. This also includes mine engineering and safety equipment such as a GPS system, surveying equipment, computers, etc.
Initial spare parts are estimated at 5% of major equipment purchases.
A contingency of 8% is added to the equipment cost estimate.
Total initial facilities (Year 0), mine (Year 3) and sustaining capital costs over the LOM are summarized below in Table 21-5.
El Pilar Project Form 43-101F1 Technical Report | |
Table 21-5: LOM Capital Costs Summary
| Life of Mine Capital Requirements (US$000's) |
| | Capital by Time Period | Initial Capital (Year 0) | Mine Capital Year 3 | Sustaining Capital |
| Category | Year 0 | Year 1 | Year 2 | Year 3 | Year 4 | Year 5 | Year 6 | Year 7 | Year 8 | Year 9 | Year 10 | Year 11 | Year 12 | Year 13 |
| Facilities Capital | 267,295 | - | - | - | - | - | - | - | - | - | - | - | - | - | 267,295 | - | - |
| Prestripping Capital | 12,609 | - | - | - | - | - | - | - | - | - | - | - | - | - | 12,609 | - | - |
| Facilities Capital Total | 279,904 | - | - | - | - | - | - | - | - | - | - | - | - | - | 279,904 | - | - |
| Mine Equipment Capital | - | - | - | 131,517 | 6,913 | 6,913 | 3,456 | - | - | 1,863 | - | - | - | - | | 131,517 | 19,145 |
| Working Capital | 33,871 | (22,434) | (328.38) | 3,736 | (1,757) | (403) | (437) | (601) | 166 | (374) | 2,170 | 139 | 154 | (13,901) | 33,871 | - | - |
| TOTAL CAPITAL (Exc. WC) | 279,904 | - | - | 131,517 | 6,913 | 6,913 | 3,456 | - | - | 1,863 | - | - | - | - | 279,904 | 131,517 | 19,145 |
| Total Depreciable Capital | 396,695 | | | | | | | | | | | | | | | | |
El Pilar Project Form 43-101F1 Technical Report | |
Operating costs used for the economic analysis are based on a robust engineering cost/economic model developed specifically for the El Pilar project. This model calculates and projects all project costs using equipment and personnel requirements and costs, reagent and power costs and consumptions, haul profiles for mining, ancillary costs for laboratory assaying and administrative costs and requirements. Details of the cost analyses results are summarized in the flowing subsections.
Mine operating costs are calculated on the basis of all costs required for drilling and blasting, loading and hauling, dumps and roads and mine supervision. Fuel costs are based on using a constant diesel price of $3.00 per gallon ($0.793 per liter). Two different mining fleet sizes were compared, a 220 metric tonne hauling fleet with commensurately sized loading units, and a 180 tonne hauling fleet. For the Base Case, the 180 tonne fleet was chosen due to a high capital cost premium associated with buying the larger equipment for the 220 tonne fleet.
Also for the Base Case, a 100 tonne contractor mining fleet is used for mining in Years 0, 1 and 2. The mining cost for this period is $1.46 per tonne of ore, based on a 2011 bid from a Mexican mining contractor.
Personnel costs for owner mining, starting in Year 3 are based on a 24-7 schedule, with three eight hour shifts per day. It is estimated that and average of 216 people will be required for owner mining over the LOM. Labor rates are based on best estimates of labor rates in Mexico and carry a 48.0% burden for benefits. Equipment requirements and other details that pertain to the development of the mining cost model are summarized in Section 16.8. Haul profiles were developed and used for each mining period, to better calculate hauling costs from deeper portions of the mine.
The average mining cost modeled for the LOM, including 2.5 years of contractor mining and 11 years of owner mining is $1.13 per tonne for ore and waste, with projected costs per year tabulated below in Table 21-6.
Table 21-6: Life-of-Mine Mining Costs
| Life-of-Mine Processing Costs by Year |
| Year 0 | Year 1 | Year 2 | Year 3 | Year 4 | Year 5 | Year 6 | Year 7 | Year 8 | Year 9 | Year 10 | Year 11 | Year 12 | Year 13 | Average |
| 2.84 | 1.55 | 1.45 | 1.32 | 1.34 | 1.35 | 1.37 | 1.52 | 1.59 | 1.52 | 1.54 | 1.58 | 1.63 | 1.89 | 1.51 |
| | 21.2.2 | Processing Operating Costs |
Processing costs are projected on the basis of running the 1300 tpd acid plant 100% of the time and taking full benefit of the 11.8 MW of power produced at a cost of $0.01 per Kwh. This assumes that any excess acid generated will be sold on the market at cost and, conservatively, that any excess power produced does not generate revenue. In certain years in which more acid is required than is supplied by the 1300 tpd plant capacity, it is assumed that the acid plant can be run up to 110% of full capacity, or at a rate of 1430 tpd producing 12.98 MW of power. This
El Pilar Project Form 43-101F1 Technical Report | |
extra acid generating capacity is already built into the acid plant design. The cost of any grid power that may be required is $0.11 per Kwh. This grid power cost is based on power costs currently being assessed by CFE in northern Mexico.
Personnel required for heap leaching and SXEW process average 81 over the LOM. Labor rates are based on best estimates of labor rates in Mexico and carry a 48.0% burden for benefits.
The reagent costs and consumptions used for leaching and for the SXEW plant are detailed in the Processing section of this report. Acid consumption for the economic model assumes the 21.95 kg/tonne average acid consumption over the LOM, as discussed in the metallurgical section. This acid consumption is incremented higher each year, starting with 16 kg/tonne in Year 0 and ending with 27.9 kg/tonne acid consumption in Year 13, according to the schedule shown below in Table 21-7. The acid consumption increments are an estimate used to better reflect higher projected acid consumption by ores at depth and to account for the possibility of incrementally higher acid consumption by successively stacked lifts.
Table 21-7: Incremented LOM Acid Consumption
| Incremented Acid Consumption |
| | Acid Consumption |
| Avg. LOM | 21.95 |
| Increment/yr | 0.4296 |
| Year | Kg/tonne |
| 1 | 16.00 |
| 2 | 16.99 |
| 3 | 17.98 |
| 4 | 18.97 |
| 5 | 19.97 |
| 6 | 20.96 |
| 7 | 21.95 |
| 8 | 22.94 |
| 9 | 23.93 |
| 10 | 24.92 |
| 11 | 25.91 |
| 12 | 26.90 |
| 13 | 27.90 |
Acid costs are based on projected delivered sulfur costs tabulated in Table 18-5 and on projected delivered market acid costs tabulated in Table 18-6. The average price of delivered sulfur over the LOM, based on the projected costs, is $126 per tonne. The average resultant price of acid produced from the acid plant over the LOM is $39.45 per tonne. Based on the anticipated 15 month startup period for the heap leach facility and the SXEW plant, coupled with the 18 month startup for the acid plant, it is assumed that acid from the market will be purchased in Year 0. The estimated cost of this market acid is $130 per tonne delivered to the mine site.
El Pilar Project Form 43-101F1 Technical Report | |
The average processing cost per tonne of ore over the LOM is $1.51/tonne, with projected costs per year tabulated below in Table 21-8.
Table 21-8: Life-of-Mine Processing Costs
| Life-of-Mine Processing Costs by Year |
| Year 0 | Year 1 | Year 2 | Year 3 | Year 4 | Year 5 | Year 6 | Year 7 | Year 8 | Year 9 | Year 10 | Year 11 | Year 12 | Year 13 | Average |
| 2.84 | 1.55 | 1.45 | 1.32 | 1.34 | 1.35 | 1.37 | 1.52 | 1.59 | 1.52 | 1.54 | 1.58 | 1.63 | 1.89 | 1.51 |
| | 21.2.3 | Administrative (G&A) Operating Costs |
Administrative costs assume an average of 47 personnel over the LOM and labor rates are based on best estimates of labor rates in Mexico and carry a 48.0% burden for benefits. Other administrative costs include the costs associated with a laboratory, including sample preparation and analysis, and other costs for insurance, license, fees and permits and for property taxes, including all other costs related to mine administration.
The average administrative cost projected for the LOM is $0.33 per ore tonne, with projected costs per year tabulated below in Table 21-9.
Table 21-9: Life-of-Mine Administrative (G&A) Costs
| Life-of-Mine Administrative Costs by Year |
| Year 0 | Year 1 | Year 2 | Year 3 | Year 4 | Year 5 | Year 6 | Year 7 | Year 8 | Year 9 | Year 10 | Year 11 | Year 12 | Year 13 | Average |
| 1.51 | 0.36 | 0.43 | 0.32 | 0.30 | 0.29 | 0.27 | 0.27 | 0.30 | 0.31 | 0.30 | 0.31 | 0.33 | 0.38 | 0.33 |
| | 21.2.4 | Cathode Transportation and Royalty Operating Costs |
Costs for the transportation of copper cathode to a buyer are assumed in the economic model to be $0.03 per pound of copper, or approximately $0.12 per tonne average. Depending on how a copper cathode contract is arranged, this cost may or may not be realized, but it is included in the economic analysis for the purpose of conservative modeling.
As part of a previous agreement between Xstrata and Stingray Copper, a 1% of gross revenues royalty is owed to Xstrata from El Pilar production. This royalty is not payable until after the first 35 M lbs of copper produced and, as a result, does not become a cost in the economic model as presently scheduled until the last month of Year 1. The Xstrata royalty for the remainder of the mine life amounts to an additional cost of $0.03 per pound of copper, or approximately $0.12 per tonne average.
| | 21.2.5 | Cost per Pound of Copper Production |
Based on the cumulative operating costs detailed above, it is projected that the Total Cash Operating Costs per pound of copper will average $1.34 per pound for the El Pilar project over the LOM.
| | 21.2.6 | Operating Costs Used in Economic Model Compared to Reserve |
Costs used to generate the reserve are very similar to those used in the economic model, except some costs in the reserve model were incremented equally by bench to allow for higher mining costs due to higher fuel consumption deeper in the mine and to possible higher acid consumption by deeper ores stacked on successive lifts. As a result of assigning these cost increments by
El Pilar Project Form 43-101F1 Technical Report | |
bench in the block model, the average costs for all of the mined material varies slightly from the target price, due to the fact that more material is mined from the higher benches than from the lower benches. A comparison of the prices used to calculate the reserve and those used for the economic model are shown below in Table 21-10.
Table 21-10: Comparison between Operating Costs Used for Reserve and Economics
| Comparison of Economic Parameters for Reserve Calculation & Economic Analysis |
| Parameter | | | | Units | Used for Reserve | Used for Economics (Average LOM) |
| Mining Costs per Total Tonne Average (Note 1) | (US$) | 1.10 | 1.59 |
| Processing & FS&R Cost per Ore Tonne Average | (US$) | 1.67 | 1.63 |
| | Base Processing Cost per Ore Tonne (Note 2) | (US$) | 1.55 | 1.51 |
| | FS&R (Sales & Freight) per Ore Tonne (Average) | (US$) | 0.12 | 0.12 |
| G&A & Royalty Cost per Ore Tonne | (US$) | 0.46 | 0.45 |
| | Base G&A Cost per Ore Tonne | (US$) | 0.34 | 0.33 |
| | Royalty Cost per Ore Tonne (Note 4) | (US$) | 0.12 | 0.12 |
| Process & G&A Cost | (US$) | 2.13 | 2.07 |
| Acid Cost (Note 3) | (US$) | 40.46 | 40.46 |
| Notes: | | | | | | |
| 1 | Based on $0.00376/tonne/bench below the 1385 bench. | | | |
| 2 | Processing Cost incremented by $0.00699 per bench below the 1385 bench starting @ $1.55/tonne to reflect increased acid consumption with depth. |
| 3 | Acid Consumption estimated at 16 kg/t plus 0.1993 kg/t/bench below 1385. Average acid consumption of 19.3 kg/t, but cost included in processing cost. |
| 4 | Xastra Royalty - 1% of Gross Revenues after 1st 35 M lbs | | | |
El Pilar Project Form 43-101F1 Technical Report | |
| 22 | ECONOMIC ANALYSIS |
| | |
| 22.1 | Financial Analysis |
The financial evaluation presents the determination of the Net Present Value (NPV), payback period (time in years to recapture the initial capital investment), and the Internal Rate of Return (IRR) for the revised Base Case project. Annual cash flow projections were estimated over the life of the mine based on the estimates of capital expenditures and on production cost and sales revenue. The sales revenue is based on the production of copper cathode. The estimates of capital expenditures and site production costs have been developed specifically for this project and the costs have been presented in earlier sections of this report. All amounts are in US dollars.
Several financial “cases” are presented. The Base Case summarizes the outcome of using variable copper prices with a backwardation of prices in the latter years. The other six cases (Cases 2-7) use different constant copper prices over the LOM.
The economic analysis is done on an unlevered or full equity basis. Actual project financing, as yet undecided, may include a single financing option or a combination of different financing instruments. Any acquisition cost or expenditures prior to the full project production decision have been treated as “sunk” cost and are not included in the analysis.
| | 22.1.2 | Mine Production Statistics |
Mine production is reported as ore and waste material from the mining operation. The annual production figures were obtained from the mine plan as reported earlier in this report.
The life of mine ore and waste quantities and ore grade are presented in the Table 22-1.
Table 22-1: Life of Mine Ore, Waste Quantities, and Ore Grade
| LOM Ore & Waste Quantities and Ore Grades |
| | Ktonnes | Total Copper (%) | Soluble Copper (%) | Recov. Copper (%) |
| Ore | 258,545 | 0.304 | 0.130 | 0.175 |
| Waste | 453,768 | - | - | - |
| Total | 712,312 | - | - | - |
| W:O | 1.76 | | | |
| | 22.1.3 | Plant Production Statistics |
The oxide ore will be processed using heap leaching and SX-EW plant recovery technology to produce copper cathode. In the current plan, the oxide ore is being leached starting one month after it is mined and stacked, and the recovery of copper in the economic model is scheduled
El Pilar Project Form 43-101F1 Technical Report | |
over a 180 day leach cycle according to the recoveries shown in Table 22-2. The average overall recoveries of copper are expected to be 57.6% of TCu.
Table 22-2: 180 Day Leach Copper Recovery by Period
| Leach Recovery by Period |
Days Leached | Adjusted Recovery (to RCu) |
| 30 | 67.5% |
| 60 | 12.6% |
| 90 | 7.3% |
| 120 | 5.2% |
| 150 | 4.0% |
| 180 | 3.3% |
The estimated cathode production for the life of the mine is 998.3 million pounds of copper cathode.
| 22.1.4.1 | Initial Facility and Mining Equipment Capital |
The cash flow for the new construction is shown being expended in the year prior to production (Year 0) and includes five months of contractor capitalized prestripping. Initial mining equipment capital is not required until Year 3, because contractor mining is assumed in Years 0, 1 and 2. The total capital in the financial model for the initial facility construction plus prestripping is $279.9 million. Year 3 mining capital totals $121.8 M.
The financial indicators have been determined on the basis of 100% equity financing of the initial capital.
| 22.1.4.2 | Sustaining Capital |
Sustaining capital is considered to be any facility capital required after build out in Year 0, the preproduction period. It also includes any mining fleet capital required after the main components of the mining fleet are acquired in Year 3. The total life of mine sustaining capital is estimated to be $19.1 million.
Operating cost expenditures accrued for working capital purposes include the first six months of operations. Expenditures for working capital are defined as commencing when the first ore is placed on the heap leach pad; the cost for contractor waste mining prior to that period is included as capitalized prestripping cost. The total life of mine working capital is estimated on the basis of inventory and accounts receivable and payable and is adjusted on this basis by year. Initial working capital required in Year 0 totals $33.8 M. This amount is not included in the initial facilities capital total summarized in Section 22.1.4.1.
El Pilar Project Form 43-101F1 Technical Report | |
| | 22.1.5 | Revenue and Copper Prices |
Annual revenue is determined by applying a copper price to the annual payable metal for each operating year. Sales prices have been applied to all life of mine production without escalation or hedging. The copper price used for the Base Case evaluation is a consensus price deck that averages $2.82 per lb copper, starting with $3.83 in Year 1 and declining to $2.60 in Year 4, with a constant $2.60 price for the remainder of the LOM. The copper prices for the Base Case and other Cases used, Cases 2-7, are shown below in Table 22-3. The copper prices were provided by Mercator Minerals Ltd.
Table 22-3: Copper Prices Used for Economic Analyses Cases
Copper Prices Used for Economic Analysis Cases |
| Case | Year 0-1 | Year 2 | Year 3 | Year 4-13 |
| Base Case | $3.83 | $3.44 | $3.14 | $2.60 |
| Case 2 | $2.50 | $2.50 | $2.50 | $2.50 |
| Case 3 | $3.00 | $3.00 | $3.00 | $3.00 |
| Case 4 | $3.50 | $3.50 | $3.50 | $3.50 |
| Case 5 | $4.00 | $4.00 | $4.00 | $4.00 |
| Case 6 | $4.50 | $4.50 | $4.50 | $4.50 |
| Case 7 | $5.00 | $5.00 | $5.00 | $5.00 |
| | 22.1.6 | Total Cash Operating Cost |
The average Total Cash Operating Cost over the life of the mine is estimated to be $1.34 per copper pound. The Total Cash Operating Cost includes mine operations, process operations, general administrative cost, cathode shipping and royalty charges.
Mine operating cost was based on a detailed estimate previously discussed in Section 21.2.2.
The SX-EW operating costs were based on a detailed estimate previously discussed in Section 21.2.3.
| 22.1.6.3 | Cathode Shipping and Royalty |
The cost for cathode shipping of $0.03 per pound of copper is included in cash operating costs. Under the terms of the Xstrata agreement to purchase the property, ML will pay a gross metal sales royalty of 1% to Xstrata after production of the first 35 million pounds of copper. The royalty payments for the life of the mine are estimated to be $25.2 million. Both of these costs are discussed in Section 21.2.5.
El Pilar Project Form 43-101F1 Technical Report | |
An allowance of $300,000 per year for property tax is included in the Total Cash Operating Cost as an administrative (G&A) cost.
The average Total Cash Cost over the life of the mine is estimated to be $1.33 per copper pound. Total Cash Cost is the Total Cash Operating Cost, plus reclamation & closure expense and salvage sales.
| 22.1.7.1 | Reclamation & Closure |
An allowance of $5.1 million for the cost of final reclamation and closure of the property has been included in the cash flow projection; continual early reclamation is done throughout the life of the mine and cost have included for such, e.g. borrow pits.
An allowance was made for the salvage value of assets of $10.5 million. This represents 3% of the total LOM constructed cost and mine capital equipment cost.
Depreciation is calculated using the Straight Line method starting with first year of production. All assets are depreciated by the end of the last year of production. Other forms of depreciation are permissible in Mexico.
Taxes are calculated on the basis of a separate tax module prepared specifically for the El Pilar project by independent tax consultants PricewaterhouseCoopers LLP, Vancouver, BC. This tax module takes into account a higher depreciation rate for taxes in Mexico (12%), as compared to fixed assets (life of mine) and also takes into account inflation (4%) and employee profit sharing (5%). It includes the same basic assumption of a 28% Mexican corporate tax rate.
Table 22-4 summarizes the financial results of the project under Base Case and Cases 2-7 copper pricing. Cases 2-7 assume constant LOM copper prices of $2.50, $3.00, $3.50, $4.00, $4.50 and $5.00, respectively.
El Pilar Project Form 43-101F1 Technical Report | |
Table 22-4: Financial Analysis Summary of Base Case and Cases 2-7 Copper Pricing
| Financial Analysis of Base Case and Cases 2-7 Copper Pricing |
| Parameter | Units | Base Case* | Price Case 2 | Price Case 3 | Price Case 4 | Price Case 5 | Price Case 6 | Price Case 7 |
| Average LOM Copper Price | ($/lb) | 2.80 | 2.50 | 3.00 | 3.50 | 4.00 | 4.50 | 5.00 |
| Total Material Mine | (Ktonnes) | 712,312 | 712,312 | 712,312 | 712,312 | 712,312 | 712,312 | 712,312 |
| Ore Mined | (Ktonnes) | 258,545 | 258,545 | 258,545 | 258,545 | 258,545 | 258,545 | 258,545 |
| Waste Mine | (Ktonnes) | 453,768 | 453,768 | 453,768 | 453,768 | 453,768 | 453,768 | 453,768 |
| Cu Recovery | (% of Tcu) | 57.6% | 57.6% | 57.6% | 57.6% | 57.6% | 57.6% | 57.6% |
| Cathode Produced | (Klbs) | 998,256 | 998,256 | 998,256 | 998,256 | 998,256 | 998,256 | 998,256 |
| Cash Costs | | | | | | | | |
| Mining Cost | ($/tonne) | 1.13 | 1.13 | 1.13 | 1.13 | 1.13 | 1.13 | 1.13 |
| Processing Cost | ($/tonne) | 1.51 | 1.51 | 1.51 | 1.51 | 1.51 | 1.51 | 1.51 |
| G&A Cost | ($/tonne) | 0.33 | 0.33 | 0.33 | 0.33 | 0.33 | 0.33 | 0.33 |
| Transportation Cost | ($/lb Cu) | 0.03 | 0.03 | 0.03 | 0.03 | 0.03 | 0.03 | 0.03 |
| Royalty Cost | ($/lb Cu) | 0.02 | 0.02 | 0.02 | 0.02 | 0.02 | 0.02 | 0.02 |
| Total Cash Operating Cost | ($/lb Cu) | 1.34 | 1.34 | 1.34 | 1.34 | 1.34 | 1.34 | 1.34 |
| Capital Total | ($,000) | 430,567 | 430,567 | 430,567 | 430,567 | 430,567 | 430,567 | 430,567 |
| Capital Total | ($,000) | 411,421 | 411,421 | 411,421 | 411,421 | 411,421 | 411,421 | 411,421 |
| Initial Facilities Capital | ($,000) | 279,904 | 279,904 | 279,904 | 279,904 | 279,904 | 279,904 | 279,904 |
| Mine Capital (Yr 3) | ($,000) | 131,517 | 131,517 | 131,517 | 131,517 | 131,517 | 131,517 | 131,517 |
| Sustaining Capital | ($,000) | 19,145 | 19,145 | 19,145 | 19,145 | 19,145 | 19,145 | 19,145 |
| Facilities | ($,000) | - | - | - | - | - | - | - |
| Mine | ($,000) | 19,145 | 19,145 | 19,145 | 19,145 | 19,145 | 19,145 | 19,145 |
| Working Capital | ($,000) | 33,871 | 33,871 | 33,871 | 33,871 | 33,871 | 33,871 | 33,871 |
| Economic Analysis - NPV | | | | | | | | |
| Pre-Tax | | | | | | | | |
| NPV@8% | ($,000) | 609,025 | 343,607 | 657,008 | 970,408 | 1,283,809 | 1,597,209 | 1,910,610 |
| NPV@5% | ($,000) | 746,094 | 459,979 | 827,231 | 1,194,484 | 1,561,736 | 1,928,989 | 2,296,241 |
| NPV@0% (Undiscounted) | ($,000) | 1,053,358 | 724,420 | 1,217,709 | 1,710,998 | 2,204,287 | 2,697,576 | 3,190,866 |
| After-Tax | | | | | | | | |
| NPV@8% | ($,000) | 415,984 | 226,230 | 451,210 | 676,190 | 901,065 | 1,125,907 | 1,350,748 |
| NPV@5% | ($,000) | 526,679 | 322,003 | 585,758 | 849,512 | 1,113,187 | 1,376,836 | 1,640,486 |
| NPV@0% (Undiscounted) | ($,000) | 771,156 | 535,949 | 890,120 | 1,244,292 | 1,598,430 | 1,952,557 | 2,306,684 |
| Economic Analysis - IROR | | | | | | | | |
| Pre-Tax | | | | | | | | |
| IROR | (%) | 52.9% | 26.6% | 42.9% | 58.6% | 74.1% | 89.5% | 104.8% |
| After-Tax | | | | | | | | |
| IROR | (%) | 36.6% | 20.2% | 32.0% | 43.2% | 54.2% | 65.0% | 75.6% |
| Capital Payback Period | | | | | | | | |
| Pre-Tax | | | | | | | | |
| Payback | (Years) | 1.32 | 3.00 | 1.84 | 1.46 | 1.20 | 1.02 | 0.89 |
| After-Tax | | | | | | | | |
| Payback | (Years) | 1.77 | 3.00 | 3.00 | 1.88 | 1.57 | 1.35 | 1.19 |
| *Note: Base Case Copper Price Deck as Follows: Year 0 & 1=$3.83, Year 2=$3.44, Year 3=$3.14, Years 4-12=$2.60. | |
| | 22.1.10 | Base Case: Sensitivity Analyses |
Figures 22-1 and 22-2 show the sensitivity analyses for the after-tax base case option for copper prices, total operating costs and initial capital expenditures (Chart 1) and at various operating costs, sulfur prices and acid consumptions (Chart 2). Chart 3 (Figure 22-3) is project sensitivity to copper recovery percentage.
El Pilar Project Form 43-101F1 Technical Report | |
Figure 22-1: Base Case – Chart 1 Sensitivity After-Tax NPV@8%
El Pilar Project Form 43-101F1 Technical Report | |
Figure 22-2: Base Case – Chart 2 Sensitivity After-Tax NPV@8%
El Pilar Project Form 43-101F1 Technical Report | |
Figure 22-3: Base Case – Copper Recovery Sensitivity After-Tax NPV@8%
| | 22.2.1 | Financial Model for Base Case |
The financial model for the Base Case is shown in Table 22-5.
El Pilar Project Form 43-101F1 Technical Report | |
Table 22-5: Base Case Financial Model, Unlevered, After-Tax
| Base Case - Financial Model - Unlevered, After-Tax |
| | Units | Total/Avg. | PP | Year 1 | Year 2 | Year 3 | Year 4 | Year 5 | Year 6 | Year 7 | Year 8 | Year 9 | Year 10 | Year 11 | Year 12 | Year 13 |
| Tons Mined | | | | | | | | | | | | | | | | |
| Leach Ore | k-tonnes | 258,545 | 2,250 | 17,800 | 14,650 | 20,150 | 21,110 | 21,900 | 23,500 | 23,600 | 21,800 | 20,600 | 21,000 | 20,200 | 19,000 | 10,985 |
| Waste Total | k-tonnes | 453,768 | 12,750 | 22,200 | 28,350 | 47,849 | 46,889 | 45,099 | 49,000 | 54,400 | 62,200 | 51,900 | 15,671 | 8,907 | 4,835 | 3,718 |
| Total Mined | k-tonnes | 712,312 | 15,000 | 40,000 | 43,000 | 67,999 | 67,999 | 66,999 | 72,500 | 78,000 | 84,000 | 72,500 | 36,671 | 29,107 | 23,835 | 14,702 |
| | | | | | | | | | | | | | | | | |
| Head Grades | | | | | | | | | | | | | | | | |
| Total Copper Grade | % | 0.304 | 0.309 | 0.355 | 0.382 | 0.315 | 0.313 | 0.310 | 0.289 | 0.280 | 0.312 | 0.293 | 0.262 | 0.278 | 0.302 | 0.284 |
| Soluble Copper Grade | % | 0.130 | 0.191 | 0.202 | 0.206 | 0.158 | 0.136 | 0.127 | 0.125 | 0.121 | 0.136 | 0.103 | 0.107 | 0.098 | 0.096 | 0.075 |
| Recovered Copper Grade | % | 0.175 | 0.221 | 0.243 | 0.256 | 0.202 | 0.183 | 0.174 | 0.166 | 0.165 | 0.181 | 0.151 | 0.149 | 0.143 | 0.147 | 0.118 |
| | | | | | | | | | | | | | | | | |
| Recovery | | | | | | | | | | | | | | | | |
| Copper Recovery | % | 0.576 | 0.715 | 0.685 | 0.670 | 0.641 | 0.585 | 0.561 | 0.574 | 0.589 | 0.580 | 0.515 | 0.569 | 0.514 | 0.487 | 0.417 |
| | | | | | | | | | | | | | | | | |
| Payable Production | | | | | | | | | | | | | | | | |
| Copper - Leaching | k-lbs | 998,256 | 8,822 | 83,220 | 87,508 | 86,058 | 85,836 | 84,179 | 85,711 | 85,870 | 86,823 | 71,271 | 68,923 | 64,458 | 61,883 | 37,694 |
| | | | | | | | | | | | | | | | | |
| Prices | | | | | | | | | | | | | | | | |
| Copper price | $/lb | 2.82 | 3.83 | 3.83 | 3.44 | 3.14 | 2.60 | 2.60 | 2.60 | 2.60 | 2.60 | 2.60 | 2.60 | 2.60 | 2.60 | 2.60 |
| | | | | | | | | | | | | | | | | |
| FS&R Charges | | | | | | | | | | | | | | | | |
| Copper | $/lb | 0.03 | 0.03 | 0.03 | 0.03 | 0.03 | 0.03 | 0.03 | 0.03 | 0.03 | 0.03 | 0.03 | 0.03 | 0.03 | 0.03 | 0.03 |
| | | | | | | | | | | | | | | | | |
| Operating Costs/ton | | | | | | | | | | | | | | | | |
| Mining Cost Ore & Waste | $/tonne | 1.13 | 1.46 | 1.46 | 1.46 | 0.96 | 1.02 | 1.07 | 1.04 | 1.02 | 0.94 | 1.03 | 1.23 | 1.38 | 1.55 | 1.59 |
| Processing | $/tonne | 1.51 | 2.84 | 1.55 | 1.45 | 1.32 | 1.34 | 1.35 | 1.37 | 1.52 | 1.59 | 1.52 | 1.54 | 1.58 | 1.63 | 1.89 |
| Administration/ton leach only | $/tonne | 0.33 | 1.51 | 0.36 | 0.43 | 0.32 | 0.30 | 0.29 | 0.27 | 0.27 | 0.30 | 0.31 | 0.30 | 0.31 | 0.33 | 0.38 |
| | | | | | | | | | | | | | | | | |
| Revenue | | | | | | | | | | | | | | | | |
| Copper - Leaching | M$ | 2,828 | 33.8 | 318.5 | 301.1 | 269.9 | 223.2 | 218.9 | 222.8 | 223.3 | 225.7 | 185.3 | 179.2 | 167.6 | 160.9 | 98.0 |
| Total Revenue | M$ | 2,828 | 33.8 | 318.5 | 301.1 | 269.9 | 223.2 | 218.9 | 222.8 | 223.3 | 225.7 | 185.3 | 179.2 | 167.6 | 160.9 | 98.0 |
| | | | | | | | | | | | | | | | | |
| Freight Shippng & Refining | | | | | | | | | | | | | | | | |
| Cathode Transportation | M$ | (30) | (0.3) | (2.5) | (2.6) | (2.6) | (2.6) | (2.5) | (2.6) | (2.6) | (2.6) | (2.1) | (2.1) | (1.9) | (1.9) | (1.1) |
| Net Smelter Return | M$ | 2,798 | 33.5 | 316.0 | 298.5 | 267.3 | 220.6 | 216.4 | 220.2 | 220.7 | 223.1 | 183.2 | 177.1 | 165.7 | 159.0 | 96.9 |
| | | | | | | | | | | | | | | | | |
| Mine Operating Costs | | | | | | | | | | | | | | | | |
| Mining | M$ | (805) | (21.9) | (58.4) | (62.8) | (65.4) | (69.6) | (71.8) | (75.7) | (79.6) | (79.4) | (74.4) | (45.1) | (40.1) | (37.0) | (23.4) |
| Processing - Heap Leach | M$ | (389) | (6.4) | (27.5) | (21.2) | (26.6) | (28.2) | (29.5) | (32.2) | (35.8) | (34.7) | (31.3) | (32.3) | (31.9) | (31.0) | (20.7) |
| Administration | M$ | (84) | (3.4) | (6.3) | (6.3) | (6.4) | (6.4) | (6.4) | (6.4) | (6.4) | (6.4) | (6.4) | (6.3) | (6.3) | (6.3) | (4.1) |
| Reclamation | M$ | (5) | - | - | - | - | - | - | - | - | - | - | - | - | - | (5.1) |
| Salvage | M$ | (11) | - | - | - | - | - | - | - | - | - | - | - | - | - | (11.0) |
| Total Mine Operating Costs | M$ | (1,294) | (31.7) | (92.2) | (90.3) | (98.4) | (104.2) | (107.7) | (114.3) | (121.8) | (120.5) | (112.1) | (83.7) | (78.3) | (74.3) | (48.2) |
| | | | | | | | | | | | | | | | | |
| Xastra Royalty | | | | | | | | | | | | | | | | |
| Royalty | M$ | (25) | - | (0.3) | (3.2) | (2.7) | (2.2) | (2.2) | (2.2) | (2.2) | (2.3) | (1.9) | (1.8) | (1.7) | (1.6) | (1.0) |
| Total Operating Costs | M$ | (1,303) | (31.7) | (92.5) | (93.5) | (101.1) | (106.4) | (109.9) | (116.5) | (124.0) | (122.8) | (114.0) | (85.5) | (80.0) | (75.9) | (49.2) |
| | | | | | | | | | | | | | | | | |
| EBITDA | M$ | 1,495 | 1.8 | 223.5 | 205.0 | 166.2 | 114.2 | 106.5 | 103.7 | 96.7 | 100.3 | 69.2 | 91.6 | 85.7 | 83.1 | 47.7 |
| | | | | | | | | | | | | | | | | |
| Interest Income | M$ | - | - | - | - | - | - | - | - | - | - | - | - | - | - | - |
| Interest Expense | M$ | - | - | - | - | - | - | - | - | - | - | - | - | - | - | - |
| D.D. & A | M$ | 430.8 | - | 21.5 | 21.5 | 33.5 | 34.2 | 34.9 | 35.4 | 35.4 | 35.4 | 35.8 | 35.8 | 35.8 | 35.8 | 35.8 |
| Income Tax | M$ | 282.3 | 0.6 | 54.7 | 47.2 | 31.4 | 16.0 | 13.3 | 11.9 | 9.3 | 9.8 | 9.0 | 19.3 | 21.5 | 23.0 | 15.3 |
| Net Income | M$ | 782.2 | 1.2 | 147.3 | 136.3 | 101.3 | 64.0 | 58.3 | 56.4 | 52.0 | 55.1 | 24.4 | 36.5 | 28.4 | 24.3 | (3.4) |
| | | | | | | | | | | | | | | | | |
| Capital Expenditure | M$ | (430.6) | (272.8) | (7.1) | - | (131.5) | (6.9) | (6.9) | (3.5) | - | - | (1.9) | - | - | - | - |
| Capital - Working Capital | M$ | (13.9) | (33.9) | 22.4 | 0.3 | (3.7) | 1.8 | 0.4 | 0.4 | 0.6 | (0.2) | 0.4 | (2.2) | (0.1) | (0.2) | |
| Debt Repayment | M$ | - | - | - | - | - | - | - | - | - | - | - | - | - | - | - |
| D.D. & A | M$ | 430.6 | - | 21.5 | 21.5 | 33.5 | 34.2 | 34.9 | 35.4 | 35.4 | 35.4 | 35.8 | 35.8 | 35.8 | 35.8 | 35.8 |
| Net Cash Flow | M$ | 768.3 | (305.4) | 184.2 | 158.1 | (0.4) | 93.0 | 86.7 | 88.8 | 88.0 | 90.3 | 58.6 | 70.1 | 64.0 | 59.9 | 32.4 |
| Financial Results | | | | | | | | | | | | | | | | |
| Net Present Value | | | | | | | | | | | | | | | | |
| NPV@8% | M$ | 416.0 | | | | | | | | | | | | | | |
| NPV@5% | M$ | 355.6 | | | | | | | | | | | | | | |
| NPV@0% | M$ | 238.6 | | | | | | | | | | | | | | |
| Internal Rate of Return | % | 36.6% | | | | | | | | | | | | | | |
| Payback | Yrs | 1.77 | | | | | | | | | | | | | | |
El Pilar Project Form 43-101F1 Technical Report | |
| | 22.2.2 | Financial Models for Cases 2-7 |
The financial models for the Constant Copper Price Cases 1-6 are shown in Tables 22-6 through 22-11.
El Pilar Project Form 43-101F1 Technical Report | |
Table 22-6: Constant Copper Price Case 1 @$2.50 Copper Financial Model, Unlevered, After-Tax
El Pilar Life of Mine Economic Model Case 2 @$2.50 Cu - Financial Model - Unlevered, After-Tax |
| | Units | Total/Avg. | PP | Year 1 | Year 2 | Year 3 | Year 4 | Year 5 | Year 6 | Year 7 | Year 8 | Year 9 | Year 10 | Year 11 | Year 12 | Year 13 |
| Tons Mined | | | | | | | | | | | | | | | | |
| Leach Ore | k-tonnes | 258,545 | 2,250 | 17,800 | 14,650 | 20,150 | 21,110 | 21,900 | 23,500 | 23,600 | 21,800 | 20,600 | 21,000 | 20,200 | 19,000 | 10,985 |
| Waste Total | k-tonnes | 453,768 | 12,750 | 22,200 | 28,350 | 47,849 | 46,889 | 45,099 | 49,000 | 54,400 | 62,200 | 51,900 | 15,671 | 8,907 | 4,835 | 3,718 |
| Total Mined | k-tonnes | 712,312 | 15,000 | 40,000 | 43,000 | 67,999 | 67,999 | 66,999 | 72,500 | 78,000 | 84,000 | 72,500 | 36,671 | 29,107 | 23,835 | 14,702 |
| | | | | | | | | | | | | | | | | |
| Head Grades | | | | | | | | | | | | | | | | |
| Total Copper Grade | % | 0.304 | 0.309 | 0.355 | 0.382 | 0.315 | 0.313 | 0.310 | 0.289 | 0.280 | 0.312 | 0.293 | 0.262 | 0.278 | 0.302 | 0.284 |
| Soluble Copper Grade | % | 0.130 | 0.191 | 0.202 | 0.206 | 0.158 | 0.136 | 0.127 | 0.125 | 0.121 | 0.136 | 0.103 | 0.107 | 0.098 | 0.096 | 0.075 |
| Recovered Copper Grade | % | 0.175 | 0.221 | 0.243 | 0.256 | 0.202 | 0.183 | 0.174 | 0.166 | 0.165 | 0.181 | 0.151 | 0.149 | 0.143 | 0.147 | 0.118 |
| | | | | | | | | | | | | | | | | |
| Recovery | | | | | | | | | | | | | | | | |
| Copper Recovery | % | 0.576 | 0.715 | 0.685 | 0.670 | 0.641 | 0.585 | 0.561 | 0.574 | 0.589 | 0.580 | 0.515 | 0.569 | 0.514 | 0.487 | 0.417 |
| | | | | | | | | | | | | | | | | |
| Payable Production | | | | | | | | | | | | | | | | |
| Copper - Leaching | k-lbs | 998,256 | 8,822 | 83,220 | 87,508 | 86,058 | 85,836 | 84,179 | 85,711 | 85,870 | 86,823 | 71,271 | 68,923 | 64,458 | 61,883 | 37,694 |
| | | | | | | | | | | | | | | | | |
| Prices | | | | | | | | | | | | | | | | |
| Copper price | $/lb | 2.50 | 2.50 | 2.50 | 2.50 | 2.50 | 2.50 | 2.50 | 2.50 | 2.50 | 2.50 | 2.50 | 2.50 | 2.50 | 2.50 | 2.50 |
| | | | | | | | | | | | | | | | | |
| FS&R Charges | | | | | | | | | | | | | | | | |
| Copper | $/lb | 0.03 | 0.03 | 0.03 | 0.03 | 0.03 | 0.03 | 0.03 | 0.03 | 0.03 | 0.03 | 0.03 | 0.03 | 0.03 | 0.03 | 0.03 |
| | | | | | | | | | | | | | | | | |
| Operating Costs/ton | | | | | | | | | | | | | | | | |
| Mining Cost Ore & Waste | $/tonne | 1.13 | 1.46 | 1.46 | 1.46 | 0.96 | 1.02 | 1.07 | 1.04 | 1.02 | 0.94 | 1.03 | 1.23 | 1.38 | 1.55 | 1.59 |
| Processing | $/tonne | 1.51 | 2.84 | 1.55 | 1.45 | 1.32 | 1.34 | 1.35 | 1.37 | 1.52 | 1.59 | 1.52 | 1.54 | 1.58 | 1.63 | 1.89 |
| Administration/ton leach only | $/tonne | 0.33 | 1.51 | 0.36 | 0.43 | 0.32 | 0.30 | 0.29 | 0.27 | 0.27 | 0.30 | 0.31 | 0.30 | 0.31 | 0.33 | 0.38 |
| | | | | | | | | | | | | | | | | |
| Revenue | | | | | | | | | | | | | | | | |
| Copper - Leaching | M$ | 2,496 | 22.1 | 208.1 | 218.8 | 215.1 | 214.6 | 210.4 | 214.3 | 214.7 | 217.1 | 178.2 | 172.3 | 161.1 | 154.7 | 94.2 |
| Total Revenue | M$ | 2,496 | 22.1 | 208.1 | 218.8 | 215.1 | 214.6 | 210.4 | 214.3 | 214.7 | 217.1 | 178.2 | 172.3 | 161.1 | 154.7 | 94.2 |
| | | | | | | | | | | | | | | | | |
| Freight Shippng & Refining | | | | | | | | | | | | | | | | |
| Cathode Transportation | M$ | (30) | (0.3) | (2.5) | (2.6) | (2.6) | (2.6) | (2.5) | (2.6) | (2.6) | (2.6) | (2.1) | (2.1) | (1.9) | (1.9) | (1.1) |
| Net Smelter Return | M$ | 2,466 | 21.8 | 205.6 | 216.2 | 212.5 | 212.0 | 207.9 | 211.7 | 212.1 | 214.5 | 176.1 | 170.2 | 159.2 | 152.8 | 93.1 |
| | | | | | | | | | | | | | | | | |
| Mine Operating Costs | | | | | | | | | | | | | | | | |
| Mining | M$ | (805) | (21.9) | (58.4) | (62.8) | (65.4) | (69.6) | (71.8) | (75.7) | (79.6) | (79.4) | (74.4) | (45.1) | (40.1) | (37.0) | (23.4) |
| Processing - Heap Leach | M$ | (389) | (6.4) | (27.5) | (21.2) | (26.6) | (28.2) | (29.5) | (32.2) | (35.8) | (34.7) | (31.3) | (32.3) | (31.9) | (31.0) | (20.7) |
| Administration | M$ | (84) | (3.4) | (6.3) | (6.3) | (6.4) | (6.4) | (6.4) | (6.4) | (6.4) | (6.4) | (6.4) | (6.3) | (6.3) | (6.3) | (4.1) |
| Reclamation | M$ | (5) | - | - | - | - | - | - | - | - | - | - | - | - | - | (5.1) |
| Salvage | M$ | (11) | - | - | - | - | - | - | - | - | - | - | - | - | - | (11.0) |
| Total Mine Operating Costs | M$ | (1,294) | (31.7) | (92.2) | (90.3) | (98.4) | (104.2) | (107.7) | (114.3) | (121.8) | (120.5) | (112.1) | (83.7) | (78.3) | (74.3) | (48.2) |
| | | | | | | | | | | | | | | | | |
| Xastra Royalty | | | | | | | | | | | | | | | | |
| Royalty | M$ | (23) | - | (0.2) | (2.3) | (2.2) | (2.1) | (2.1) | (2.1) | (2.1) | (2.2) | (1.8) | (1.7) | (1.6) | (1.5) | (0.9) |
| Total Operating Costs | M$ | (1,301) | (31.7) | (92.4) | (92.6) | (100.6) | (106.3) | (109.8) | (116.4) | (123.9) | (122.7) | (113.9) | (85.4) | (79.9) | (75.8) | (49.1) |
| | | | | | | | | | | | | | | | | |
| EBITDA | M$ | 1,165 | (9.9) | 113.2 | 123.6 | 111.9 | 105.7 | 98.1 | 95.3 | 88.2 | 91.8 | 62.2 | 84.8 | 79.3 | 77.0 | 44.0 |
| | | | | | | | | | | | | | | | | |
| Interest Income | M$ | - | - | - | - | - | - | - | - | - | - | - | - | - | - | - |
| Interest Expense | M$ | - | - | - | - | - | - | - | - | - | - | - | - | - | - | - |
| D.D. & A | M$ | 430.8 | - | 21.5 | 21.5 | 33.5 | 34.2 | 34.9 | 35.4 | 35.4 | 35.4 | 35.8 | 35.8 | 35.8 | 35.8 | 35.8 |
| Income Tax | M$ | 188.5 | - | 19.8 | 24.4 | 16.2 | 13.7 | 11.0 | 9.5 | 7.0 | 7.4 | 7.0 | 17.4 | 19.7 | 21.2 | 14.2 |
| Net Income | M$ | 546.0 | (9.9) | 71.9 | 77.7 | 62.2 | 57.8 | 52.2 | 50.4 | 45.8 | 49.0 | 19.4 | 31.6 | 23.8 | 20.0 | (6.0) |
| | | | | | | | | | | | | | | | | |
| Capital Expenditure | M$ | (430.6) | (272.8) | (7.1) | - | (131.5) | (6.9) | (6.9) | (3.5) | - | - | (1.9) | - | - | - | - |
| Capital - Working Capital | M$ | (13.8) | (22.1) | 13.7 | (0.4) | (4.5) | 0.5 | 0.4 | 0.4 | 0.6 | (0.2) | 0.3 | (2.2) | (0.2) | (0.2) | |
| Debt Repayment | M$ | - | - | - | - | - | - | - | - | - | - | - | - | - | - | - |
| D.D. & A | M$ | 430.6 | - | 21.5 | 21.5 | 33.5 | 34.2 | 34.9 | 35.4 | 35.4 | 35.4 | 35.8 | 35.8 | 35.8 | 35.8 | 35.8 |
| Net Cash Flow | M$ | 532.2 | (304.8) | 100.1 | 98.8 | (40.3) | 85.6 | 80.6 | 82.8 | 81.8 | 84.2 | 53.5 | 65.2 | 59.4 | �� 55.6 | 29.8 |
| Financial Results | | | | | | | | | | | | | | | | |
| Net Present Value | | | | | | | | | | | | | | | | |
| NPV@8% | M$ | 226.2 | | | | | | | | | | | | | | |
| NPV@5% | M$ | 174.5 | | | | | | | | | | | | | | |
| NPV@0% | M$ | 75.8 | | | | | | | | | | | | | | |
| Internal Rate of Return | % | 20.2% | | | | | | | | | | | | | | |
| Payback | Yrs | 3.00 | | | | | | | | | | | | | | |
El Pilar Project Form 43-101F1 Technical Report | |
Table 22-7: Constant Copper Price Case 2 @$3.00 Copper Financial Model, Unlevered, After-Tax
El Pilar Life of Mine Economic Model Case 3 @$3.00 Cu - Financial Model - Unlevered, After-Tax |
| | Units | Total/Avg. | PP | Year 1 | Year 2 | Year 3 | Year 4 | Year 5 | Year 6 | Year 7 | Year 8 | Year 9 | Year 10 | Year 11 | Year 12 | Year 13 |
| Tons Mined | | | | | | | | | | | | | | | | |
| Leach Ore | k-tonnes | 258,545 | 2,250 | 17,800 | 14,650 | 20,150 | 21,110 | 21,900 | 23,500 | 23,600 | 21,800 | 20,600 | 21,000 | 20,200 | 19,000 | 10,985 |
| Waste Total | k-tonnes | 453,768 | 12,750 | 22,200 | 28,350 | 47,849 | 46,889 | 45,099 | 49,000 | 54,400 | 62,200 | 51,900 | 15,671 | 8,907 | 4,835 | 3,718 |
| Total Mined | k-tonnes | 712,312 | 15,000 | 40,000 | 43,000 | 67,999 | 67,999 | 66,999 | 72,500 | 78,000 | 84,000 | 72,500 | 36,671 | 29,107 | 23,835 | 14,702 |
| | | | | | | | | | | | | | | | | |
| Head Grades | | | | | | | | | | | | | | | | |
| Total Copper Grade | % | 0.304 | 0.309 | 0.355 | 0.382 | 0.315 | 0.313 | 0.310 | 0.289 | 0.280 | 0.312 | 0.293 | 0.262 | 0.278 | 0.302 | 0.284 |
| Soluble Copper Grade | % | 0.130 | 0.191 | 0.202 | 0.206 | 0.158 | 0.136 | 0.127 | 0.125 | 0.121 | 0.136 | 0.103 | 0.107 | 0.098 | 0.096 | 0.075 |
| Recovered Copper Grade | % | 0.175 | 0.221 | 0.243 | 0.256 | 0.202 | 0.183 | 0.174 | 0.166 | 0.165 | 0.181 | 0.151 | 0.149 | 0.143 | 0.147 | 0.118 |
| | | | | | | | | | | | | | | | | |
| Recovery | | | | | | | | | | | | | | | | |
| Copper Recovery | % | 0.576 | 0.715 | 0.685 | 0.670 | 0.641 | 0.585 | 0.561 | 0.574 | 0.589 | 0.580 | 0.515 | 0.569 | 0.514 | 0.487 | 0.417 |
| | | | | | | | | | | | | | | | | |
| Payable Production | | | | | | | | | | | | | | | | |
| Copper - Leaching | k-lbs | 998,256 | 8,822 | 83,220 | 87,508 | 86,058 | 85,836 | 84,179 | 85,711 | 85,870 | 86,823 | 71,271 | 68,923 | 64,458 | 61,883 | 37,694 |
| | | | | | | | | | | | | | | | | |
| Prices | | | | | | | | | | | | | | | | |
| Copper price | $/lb | 3.00 | 3.00 | 3.00 | 3.00 | 3.00 | 3.00 | 3.00 | 3.00 | 3.00 | 3.00 | 3.00 | 3.00 | 3.00 | 3.00 | 3.00 |
| | | | | | | | | | | | | | | | | |
| FS&R Charges | | | | | | | | | | | | | | | | |
| Copper | $/lb | 0.03 | 0.03 | 0.03 | 0.03 | 0.03 | 0.03 | 0.03 | 0.03 | 0.03 | 0.03 | 0.03 | 0.03 | 0.03 | 0.03 | 0.03 |
| | | | | | | | | | | | | | | | | |
| Operating Costs/ton | | | | | | | | | | | | | | | | |
| Mining Cost Ore & Waste | $/tonne | 1.13 | 1.46 | 1.46 | 1.46 | 0.96 | 1.02 | 1.07 | 1.04 | 1.02 | 0.94 | 1.03 | 1.23 | 1.38 | 1.55 | 1.59 |
| Processing | $/tonne | 1.51 | 2.84 | 1.55 | 1.45 | 1.32 | 1.34 | 1.35 | 1.37 | 1.52 | 1.59 | 1.52 | 1.54 | 1.58 | 1.63 | 1.89 |
| Administration/ton leach only | $/tonne | 0.33 | 1.51 | 0.36 | 0.43 | 0.32 | 0.30 | 0.29 | 0.27 | 0.27 | 0.30 | 0.31 | 0.30 | 0.31 | 0.33 | 0.38 |
| | | | | | | | | | | | | | | | | |
| Revenue | | | | | | | | | | | | | | | | |
| Copper - Leaching | M$ | 2,995 | 26.5 | 249.7 | 262.5 | 258.2 | 257.5 | 252.5 | 257.1 | 257.6 | 260.5 | 213.8 | 206.8 | 193.4 | 185.7 | 113.1 |
| Total Revenue | M$ | 2,995 | 26.5 | 249.7 | 262.5 | 258.2 | 257.5 | 252.5 | 257.1 | 257.6 | 260.5 | 213.8 | 206.8 | 193.4 | 185.7 | 113.1 |
| | | | | | | | | | | | | | | | | |
| Freight Shippng & Refining | | | | | | | | | | | | | | | | |
| Cathode Transportation | M$ | (30) | (0.3) | (2.5) | (2.6) | (2.6) | (2.6) | (2.5) | (2.6) | (2.6) | (2.6) | (2.1) | (2.1) | (1.9) | (1.9) | (1.1) |
| Net Smelter Return | M$ | 2,965 | 26.2 | 247.2 | 259.9 | 255.6 | 254.9 | 250.0 | 254.5 | 255.0 | 257.9 | 211.7 | 204.7 | 191.5 | 183.8 | 112.0 |
| | | | | | | | | | | | | | | | | |
| Mine Operating Costs | | | | | | | | | | | | | | | | |
| Mining | M$ | (805) | (21.9) | (58.4) | (62.8) | (65.4) | (69.6) | (71.8) | (75.7) | (79.6) | (79.4) | (74.4) | (45.1) | (40.1) | (37.0) | (23.4) |
| Processing - Heap Leach | M$ | (389) | (6.4) | (27.5) | (21.2) | (26.6) | (28.2) | (29.5) | (32.2) | (35.8) | (34.7) | (31.3) | (32.3) | (31.9) | (31.0) | (20.7) |
| Administration | M$ | (84) | (3.4) | (6.3) | (6.3) | (6.4) | (6.4) | (6.4) | (6.4) | (6.4) | (6.4) | (6.4) | (6.3) | (6.3) | (6.3) | (4.1) |
| Reclamation | M$ | (5) | - | - | - | - | - | - | - | - | - | - | - | - | - | (5.1) |
| Salvage | M$ | (11) | - | - | - | - | - | - | - | - | - | - | - | - | - | (11.0) |
| Total Mine Operating Costs | M$ | (1,294) | (31.7) | (92.2) | (90.3) | (98.4) | (104.2) | (107.7) | (114.3) | (121.8) | (120.5) | (112.1) | (83.7) | (78.3) | (74.3) | (48.2) |
| | | | | | | | | | | | | | | | | |
| Xastra Royalty | | | | | | | | | | | | | | | | |
| Royalty | M$ | (28) | - | (0.2) | (2.8) | (2.6) | (2.6) | (2.5) | (2.6) | (2.6) | (2.6) | (2.1) | (2.1) | (1.9) | (1.9) | (1.1) |
| Total Operating Costs | M$ | (1,305) | (31.7) | (92.4) | (93.1) | (101.0) | (106.8) | (110.2) | (116.9) | (124.4) | (123.1) | (114.2) | (85.8) | (80.2) | (76.2) | (49.3) |
| | | | | | | | | | | | | | | | | |
| EBITDA | M$ | 1,660 | (5.5) | 154.8 | 166.8 | 154.6 | 148.1 | 139.8 | 137.6 | 130.6 | 134.8 | 97.5 | 118.9 | 111.3 | 107.6 | 62.7 |
| | | | | | | | | | | | | | | | | |
| Interest Income | M$ | - | - | - | - | - | - | - | - | - | - | - | - | - | - | - |
| Interest Expense | M$ | - | - | - | - | - | - | - | - | - | - | - | - | - | - | - |
| D.D. & A | M$ | 430.8 | - | 21.5 | 21.5 | 33.5 | 34.2 | 34.9 | 35.4 | 35.4 | 35.4 | 35.8 | 35.8 | 35.8 | 35.8 | 35.8 |
| Income Tax | M$ | 327.7 | - | 33.1 | 36.6 | 28.2 | 25.6 | 22.6 | 21.4 | 18.9 | 19.4 | 16.9 | 27.0 | 28.6 | 29.8 | 19.6 |
| Net Income | M$ | 901.2 | (5.5) | 100.2 | 108.7 | 92.9 | 88.3 | 82.3 | 80.8 | 76.3 | 80.0 | 44.8 | 56.1 | 46.9 | 42.0 | 7.3 |
| | | | | | | | | | | | | | | | | |
| Capital Expenditure | M$ | (430.6) | (272.8) | (7.1) | - | (131.5) | (6.9) | (6.9) | (3.5) | - | - | (1.9) | - | - | - | - |
| Capital - Working Capital | M$ | (14.6) | (26.5) | 17.0 | (0.5) | (4.5) | 0.5 | 0.4 | 0.4 | 0.6 | (0.2) | 0.5 | (2.1) | (0.1) | (0.1) | |
| Debt Repayment | M$ | - | - | - | - | - | - | - | - | - | - | - | - | - | - | - |
| D.D. & A | M$ | 430.6 | - | 21.5 | 21.5 | 33.5 | 34.2 | 34.9 | 35.4 | 35.4 | 35.4 | 35.8 | 35.8 | 35.8 | 35.8 | 35.8 |
| Net Cash Flow | M$ | 886.7 | (304.8) | 131.6 | 129.7 | (9.6) | 116.1 | 110.7 | 113.2 | 112.3 | 115.2 | 79.2 | 89.7 | 82.5 | 77.7 | 43.1 |
| Financial Results | | | | | | | | | | | | | | | | |
| Net Present Value | | | | | | | | | | | | | | | | |
| NPV@8% | M$ | 451.2 | | | | | | | | | | | | | | |
| NPV@5% | M$ | 378.4 | | | | | | | | | | | | | | |
| NPV@0% | M$ | 238.9 | | | | | | | | | | | | | | |
| Internal Rate of Return | % | 32.0% | | | | | | | | | | | | | | |
| Payback | Yrs | 3.00 | | | | | | | | | | | | | | |
El Pilar Project Form 43-101F1 Technical Report | |
Table 22-8: Constant Copper Price Case 3 @$3.50 Copper Financial Model, Unlevered, After-Tax
El Pilar Life of Mine Economic Model Case 4 @$3.50 Cu - Financial Model - Unlevered, After-Tax |
| | Units | Total/Avg. | PP | Year 1 | Year 2 | Year 3 | Year 4 | Year 5 | Year 6 | Year 7 | Year 8 | Year 9 | Year 10 | Year 11 | Year 12 | Year 13 |
| Tons Mined | | | | | | | | | | | | | | | | |
| Leach Ore | k-tonnes | 258,545 | 2,250 | 17,800 | 14,650 | 20,150 | 21,110 | 21,900 | 23,500 | 23,600 | 21,800 | 20,600 | 21,000 | 20,200 | 19,000 | 10,985 |
| Waste Total | k-tonnes | 453,768 | 12,750 | 22,200 | 28,350 | 47,849 | 46,889 | 45,099 | 49,000 | 54,400 | 62,200 | 51,900 | 15,671 | 8,907 | 4,835 | 3,718 |
| Total Mined | k-tonnes | 712,312 | 15,000 | 40,000 | 43,000 | 67,999 | 67,999 | 66,999 | 72,500 | 78,000 | 84,000 | 72,500 | 36,671 | 29,107 | 23,835 | 14,702 |
| | | | | | | | | | | | | | | | | |
| Head Grades | | | | | | | | | | | | | | | | |
| Total Copper Grade | % | 0.304 | 0.309 | 0.355 | 0.382 | 0.315 | 0.313 | 0.310 | 0.289 | 0.280 | 0.312 | 0.293 | 0.262 | 0.278 | 0.302 | 0.284 |
| Soluble Copper Grade | % | 0.130 | 0.191 | 0.202 | 0.206 | 0.158 | 0.136 | 0.127 | 0.125 | 0.121 | 0.136 | 0.103 | 0.107 | 0.098 | 0.096 | 0.075 |
| Recovered Copper Grade | % | 0.175 | 0.221 | 0.243 | 0.256 | 0.202 | 0.183 | 0.174 | 0.166 | 0.165 | 0.181 | 0.151 | 0.149 | 0.143 | 0.147 | 0.118 |
| | | | | | | | | | | | | | | | | |
| Recovery | | | | | | | | | | | | | | | | |
| Copper Recovery | % | 0.576 | 0.715 | 0.685 | 0.670 | 0.641 | 0.585 | 0.561 | 0.574 | 0.589 | 0.580 | 0.515 | 0.569 | 0.514 | 0.487 | 0.417 |
| | | | | | | | | | | | | | | | | |
| Payable Production | | | | | | | | | | | | | | | | |
| Copper - Leaching | k-lbs | 998,256 | 8,822 | 83,220 | 87,508 | 86,058 | 85,836 | 84,179 | 85,711 | 85,870 | 86,823 | 71,271 | 68,923 | 64,458 | 61,883 | 37,694 |
| | | | | | | | | | | | | | | | | |
| Prices | | | | | | | | | | | | | | | | |
| Copper price | $/lb | 3.50 | 3.50 | 3.50 | 3.50 | 3.50 | 3.50 | 3.50 | 3.50 | 3.50 | 3.50 | 3.50 | 3.50 | 3.50 | 3.50 | 3.50 |
| | | | | | | | | | | | | | | | | |
| FS&R Charges | | | | | | | | | | | | | | | | |
| Copper | $/lb | 0.03 | 0.03 | 0.03 | 0.03 | 0.03 | 0.03 | 0.03 | 0.03 | 0.03 | 0.03 | 0.03 | 0.03 | 0.03 | 0.03 | 0.03 |
| | | | | | | | | | | | | | | | | |
| Operating Costs/ton | | | | | | | | | | | | | | | | |
| Mining Cost Ore & Waste | $/tonne | 1.13 | 1.46 | 1.46 | 1.46 | 0.96 | 1.02 | 1.07 | 1.04 | 1.02 | 0.94 | 1.03 | 1.23 | 1.38 | 1.55 | 1.59 |
| Processing | $/tonne | 1.51 | 2.84 | 1.55 | 1.45 | 1.32 | 1.34 | 1.35 | 1.37 | 1.52 | 1.59 | 1.52 | 1.54 | 1.58 | 1.63 | 1.89 |
| Administration/ton leach only | $/tonne | 0.33 | 1.51 | 0.36 | 0.43 | 0.32 | 0.30 | 0.29 | 0.27 | 0.27 | 0.30 | 0.31 | 0.30 | 0.31 | 0.33 | 0.38 |
| | | | | | | | | | | | | | | | | |
| Revenue | | | | | | | | | | | | | | | | |
| Copper - Leaching | M$ | 3,494 | 30.9 | 291.3 | 306.3 | 301.2 | 300.4 | 294.6 | 300.0 | 300.5 | 303.9 | 249.4 | 241.2 | 225.6 | 216.6 | 131.9 |
| Total Revenue | M$ | 3,494 | 30.9 | 291.3 | 306.3 | 301.2 | 300.4 | 294.6 | 300.0 | 300.5 | 303.9 | 249.4 | 241.2 | 225.6 | 216.6 | 131.9 |
| | | | | | | | | | | | | | | | | |
| Freight Shippng & Refining | | | | | | | | | | | | | | | | |
| Cathode Transportation | M$ | (30) | (0.3) | (2.5) | (2.6) | (2.6) | (2.6) | (2.5) | (2.6) | (2.6) | (2.6) | (2.1) | (2.1) | (1.9) | (1.9) | (1.1) |
| Net Smelter Return | M$ | 3,464 | 30.6 | 288.8 | 303.7 | 298.6 | 297.8 | 292.1 | 297.4 | 297.9 | 301.3 | 247.3 | 239.1 | 223.7 | 214.7 | 130.8 |
| | | | | | | | | | | | | | | | | |
| Mine Operating Costs | | | | | | | | | | | | | | | | |
| Mining | M$ | (805) | (21.9) | (58.4) | (62.8) | (65.4) | (69.6) | (71.8) | (75.7) | (79.6) | (79.4) | (74.4) | (45.1) | (40.1) | (37.0) | (23.4) |
| Processing - Heap Leach | M$ | (389) | (6.4) | (27.5) | (21.2) | (26.6) | (28.2) | (29.5) | (32.2) | (35.8) | (34.7) | (31.3) | (32.3) | (31.9) | (31.0) | (20.7) |
| Administration | M$ | (84) | (3.4) | (6.3) | (6.3) | (6.4) | (6.4) | (6.4) | (6.4) | (6.4) | (6.4) | (6.4) | (6.3) | (6.3) | (6.3) | (4.1) |
| Reclamation | M$ | (5) | - | - | - | - | - | - | - | - | - | - | - | - | - | (5.1) |
| Salvage | M$ | (11) | - | - | - | - | - | - | - | - | - | - | - | - | - | (11.0) |
| Total Mine Operating Costs | M$ | (1,294) | (31.7) | (92.2) | (90.3) | (98.4) | (104.2) | (107.7) | (114.3) | (121.8) | (120.5) | (112.1) | (83.7) | (78.3) | (74.3) | (48.2) |
| | | | | | | | | | | | | | | | | |
| Xastra Royalty | | | | | | | | | | | | | | | | |
| Royalty | M$ | (32) | - | (0.2) | (3.2) | (3.0) | (3.0) | (2.9) | (3.0) | (3.0) | (3.0) | (2.5) | (2.4) | (2.3) | (2.2) | (1.3) |
| Total Operating Costs | M$ | (1,310) | (31.7) | (92.4) | (93.5) | (101.4) | (107.2) | (110.6) | (117.3) | (124.8) | (123.5) | (114.6) | (86.1) | (80.6) | (76.5) | (49.5) |
| | | | | | | | | | | | | | | | | |
| EBITDA | M$ | 2,154 | (1.1) | 196.4 | 210.2 | 197.2 | 190.6 | 181.5 | 180.1 | 173.1 | 177.8 | 132.7 | 153.0 | 143.1 | 138.2 | 81.3 |
| | | | | | | | | | | | | | | | | |
| Interest Income | M$ | - | - | - | - | - | - | - | - | - | - | - | - | - | - | - |
| Interest Expense | M$ | - | - | - | - | - | - | - | - | - | - | - | - | - | - | - |
| D.D. & A | M$ | 430.8 | - | 21.5 | 21.5 | 33.5 | 34.2 | 34.9 | 35.4 | 35.4 | 35.4 | 35.8 | 35.8 | 35.8 | 35.8 | 35.8 |
| Income Tax | M$ | 466.8 | - | 46.5 | 48.7 | 40.1 | 37.5 | 34.3 | 33.3 | 30.8 | 31.4 | 26.8 | 36.5 | 37.5 | 38.4 | 25.0 |
| Net Income | M$ | 1,256.6 | (1.1) | 128.4 | 140.0 | 123.6 | 118.9 | 112.3 | 111.4 | 106.9 | 111.0 | 70.1 | 80.7 | 69.8 | 64.0 | 20.5 |
| | | | | | | | | | | | | | | | | |
| Capital Expenditure | M$ | (430.6) | (272.8) | (7.1) | - | (131.5) | (6.9) | (6.9) | (3.5) | - | - | (1.9) | - | - | - | - |
| Capital - Working Capital | M$ | (15.4) | (31.0) | 20.3 | (0.6) | (4.5) | 0.5 | 0.4 | 0.4 | 0.6 | (0.2) | 0.8 | (2.1) | (0.0) | (0.1) | |
| Debt Repayment | M$ | - | - | - | - | - | - | - | - | - | - | - | - | - | - | - |
| D.D. & A | M$ | 430.6 | - | 21.5 | 21.5 | 33.5 | 34.2 | 34.9 | 35.4 | 35.4 | 35.4 | 35.8 | 35.8 | 35.8 | 35.8 | 35.8 |
| Net Cash Flow | M$ | 1,241.2 | (304.8) | 163.1 | 160.9 | 21.1 | 146.7 | 140.8 | 143.8 | 142.9 | 146.2 | 104.7 | 114.4 | 105.5 | 99.7 | 56.3 |
| Financial Results | | | | | | | | | | | | | | | | |
| Net Present Value | | | | | | | | | | | | | | | | |
| NPV@8% | M$ | 676.2 | | | | | | | | | | | | | | |
| NPV@5% | M$ | 582.3 | | | | | | | | | | | | | | |
| NPV@0% | M$ | 402.0 | | | | | | | | | | | | | | |
| Internal Rate of Return | % | 43.2% | | | | | | | | | | | | | | |
| Payback | Yrs | 1.88 | | | | | | | | | | | | | | |
El Pilar Project Form 43-101F1 Technical Report | |
Table 22-9: Constant Copper Price Case 4 @$4.00 Copper Financial Model, Unlevered, After-Tax
El Pilar Life of Mine Economic Model Case 5 @$4.00 Cu - Financial Model - Unlevered, After-Tax |
| | Units | Total/Avg. | PP | Year 1 | Year 2 | Year 3 | Year 4 | Year 5 | Year 6 | Year 7 | Year 8 | Year 9 | Year 10 | Year 11 | Year 12 | Year 13 |
| Tons Mined | | | | | | | | | | | | | | | | |
| Leach Ore | k-tonnes | 258,545 | 2,250 | 17,800 | 14,650 | 20,150 | 21,110 | 21,900 | 23,500 | 23,600 | 21,800 | 20,600 | 21,000 | 20,200 | 19,000 | 10,985 |
| Waste Total | k-tonnes | 453,768 | 12,750 | 22,200 | 28,350 | 47,849 | 46,889 | 45,099 | 49,000 | 54,400 | 62,200 | 51,900 | 15,671 | 8,907 | 4,835 | 3,718 |
| Total Mined | k-tonnes | 712,312 | 15,000 | 40,000 | 43,000 | 67,999 | 67,999 | 66,999 | 72,500 | 78,000 | 84,000 | 72,500 | 36,671 | 29,107 | 23,835 | 14,702 |
| | | | | | | | | | | | | | | | | |
| Head Grades | | | | | | | | | | | | | | | | |
| Total Copper Grade | % | 0.304 | 0.309 | 0.355 | 0.382 | 0.315 | 0.313 | 0.310 | 0.289 | 0.280 | 0.312 | 0.293 | 0.262 | 0.278 | 0.302 | 0.284 |
| Soluble Copper Grade | % | 0.130 | 0.191 | 0.202 | 0.206 | 0.158 | 0.136 | 0.127 | 0.125 | 0.121 | 0.136 | 0.103 | 0.107 | 0.098 | 0.096 | 0.075 |
| Recovered Copper Grade | % | 0.175 | 0.221 | 0.243 | 0.256 | 0.202 | 0.183 | 0.174 | 0.166 | 0.165 | 0.181 | 0.151 | 0.149 | 0.143 | 0.147 | 0.118 |
| | | | | | | | | | | | | | | | | |
| Recovery | | | | | | | | | | | | | | | | |
| Copper Recovery | % | 0.576 | 0.715 | 0.685 | 0.670 | 0.641 | 0.585 | 0.561 | 0.574 | 0.589 | 0.580 | 0.515 | 0.569 | 0.514 | 0.487 | 0.417 |
| | | | | | | | | | | | | | | | | |
| Payable Production | | | | | | | | | | | | | | | | |
| Copper - Leaching | k-lbs | 998,256 | 8,822 | 83,220 | 87,508 | 86,058 | 85,836 | 84,179 | 85,711 | 85,870 | 86,823 | 71,271 | 68,923 | 64,458 | 61,883 | 37,694 |
| | | | | | | | | | | | | | | | | |
| Prices | | | | | | | | | | | | | | | | |
| Copper price | $/lb | 4.00 | 4.00 | 4.00 | 4.00 | 4.00 | 4.00 | 4.00 | 4.00 | 4.00 | 4.00 | 4.00 | 4.00 | 4.00 | 4.00 | 4.00 |
| | | | | | | | | | | | | | | | | |
| FS&R Charges | | | | | | | | | | | | | | | | |
| Copper | $/lb | 0.03 | 0.03 | 0.03 | 0.03 | 0.03 | 0.03 | 0.03 | 0.03 | 0.03 | 0.03 | 0.03 | 0.03 | 0.03 | 0.03 | 0.03 |
| | | | | | | | | | | | | | | | | |
| Operating Costs/ton | | | | | | | | | | | | | | | | |
| Mining Cost Ore & Waste | $/tonne | 1.13 | 1.46 | 1.46 | 1.46 | 0.96 | 1.02 | 1.07 | 1.04 | 1.02 | 0.94 | 1.03 | 1.23 | 1.38 | 1.55 | 1.59 |
| Processing | $/tonne | 1.51 | 2.84 | 1.55 | 1.45 | 1.32 | 1.34 | 1.35 | 1.37 | 1.52 | 1.59 | 1.52 | 1.54 | 1.58 | 1.63 | 1.89 |
| Administration/ton leach only | $/tonne | 0.33 | 1.51 | 0.36 | 0.43 | 0.32 | 0.30 | 0.29 | 0.27 | 0.27 | 0.30 | 0.31 | 0.30 | 0.31 | 0.33 | 0.38 |
| | | | | | | | | | | | | | | | | |
| Revenue | | | | | | | | | | | | | | | | |
| Copper - Leaching | M$ | 3,993 | 35.3 | 332.9 | 350.0 | 344.2 | 343.3 | 336.7 | 342.8 | 343.5 | 347.3 | 285.1 | 275.7 | 257.8 | 247.5 | 150.8 |
| Total Revenue | M$ | 3,993 | 35.3 | 332.9 | 350.0 | 344.2 | 343.3 | 336.7 | 342.8 | 343.5 | 347.3 | 285.1 | 275.7 | 257.8 | 247.5 | 150.8 |
| | | | | | | | | | | | | | | | | |
| Freight Shippng & Refining | | | | | | | | | | | | | | | | |
| Cathode Transportation | M$ | (30) | (0.3) | (2.5) | (2.6) | (2.6) | (2.6) | (2.5) | (2.6) | (2.6) | (2.6) | (2.1) | (2.1) | (1.9) | (1.9) | (1.1) |
| Net Smelter Return | M$ | 3,963 | 35.0 | 330.4 | 347.4 | 341.6 | 340.7 | 334.2 | 340.2 | 340.9 | 344.7 | 283.0 | 273.6 | 255.9 | 245.6 | 149.7 |
| | | | | | | | | | | | | | | | | |
| Mine Operating Costs | | | | | | | | | | | | | | | | |
| Mining | M$ | (805) | (21.9) | (58.4) | (62.8) | (65.4) | (69.6) | (71.8) | (75.7) | (79.6) | (79.4) | (74.4) | (45.1) | (40.1) | (37.0) | (23.4) |
| Processing - Heap Leach | M$ | (389) | (6.4) | (27.5) | (21.2) | (26.6) | (28.2) | (29.5) | (32.2) | (35.8) | (34.7) | (31.3) | (32.3) | (31.9) | (31.0) | (20.7) |
| Administration | M$ | (84) | (3.4) | (6.3) | (6.3) | (6.4) | (6.4) | (6.4) | (6.4) | (6.4) | (6.4) | (6.4) | (6.3) | (6.3) | (6.3) | (4.1) |
| Reclamation | M$ | (5) | - | - | - | - | - | - | - | - | - | - | - | - | - | (5.1) |
| Salvage | M$ | (11) | - | - | - | - | - | - | - | - | - | - | - | - | - | (11.0) |
| Total Mine Operating Costs | M$ | (1,294) | (31.7) | (92.2) | (90.3) | (98.4) | (104.2) | (107.7) | (114.3) | (121.8) | (120.5) | (112.1) | (83.7) | (78.3) | (74.3) | (48.2) |
| | | | | | | | | | | | | | | | | |
| Xastra Royalty | | | | | | | | | | | | | | | | |
| Royalty | M$ | (37) | - | (0.3) | (3.7) | (3.4) | (3.4) | (3.4) | (3.4) | (3.4) | (3.5) | (2.9) | (2.8) | (2.6) | (2.5) | (1.5) |
| Total Operating Costs | M$ | (1,315) | (31.7) | (92.5) | (94.0) | (101.8) | (107.6) | (111.1) | (117.7) | (125.2) | (124.0) | (115.0) | (86.5) | (80.9) | (76.8) | (49.7) |
| | | | | | | | | | | | | | | | | |
| EBITDA | M$ | 2,648 | 3.3 | 237.9 | 253.4 | 239.8 | 233.1 | 223.1 | 222.5 | 215.7 | 220.7 | 168.0 | 187.1 | 175.0 | 168.8 | 100.0 |
| | | | | | | | | | | | | | | | | |
| Interest Income | M$ | - | - | - | - | - | - | - | - | - | - | - | - | - | - | - |
| Interest Expense | M$ | - | - | - | - | - | - | - | - | - | - | - | - | - | - | - |
| D.D. & A | M$ | 430.8 | - | 21.5 | 21.5 | 33.5 | 34.2 | 34.9 | 35.4 | 35.4 | 35.4 | 35.8 | 35.8 | 35.8 | 35.8 | 35.8 |
| Income Tax | M$ | 605.9 | 1.0 | 58.8 | 60.8 | 52.0 | 49.4 | 46.0 | 45.1 | 42.7 | 43.5 | 36.6 | 46.1 | 46.5 | 47.0 | 30.4 |
| Net Income | M$ | 1,611.8 | 2.3 | 157.6 | 171.1 | 154.3 | 149.5 | 142.2 | 142.0 | 137.6 | 141.8 | 95.6 | 105.2 | 92.7 | 86.0 | 33.8 |
| | | | | | | | | | | | | | | | | |
| Capital Expenditure | M$ | (430.6) | (272.8) | (7.1) | - | (131.5) | (6.9) | (6.9) | (3.5) | - | - | (1.9) | - | - | - | - |
| Capital - Working Capital | M$ | (16.3) | (35.4) | 23.5 | (0.6) | (4.4) | 0.5 | 0.5 | 0.4 | 0.6 | (0.2) | 1.0 | (2.1) | 0.0 | (0.1) | |
| Debt Repayment | M$ | - | - | - | - | - | - | - | - | - | - | - | - | - | - | - |
| D.D. & A | M$ | 430.6 | - | 21.5 | 21.5 | 33.5 | 34.2 | 34.9 | 35.4 | 35.4 | 35.4 | 35.8 | 35.8 | 35.8 | 35.8 | 35.8 |
| Net Cash Flow | M$ | 1,595.5 | (305.8) | 195.6 | 192.0 | 51.9 | 177.3 | 170.7 | 174.3 | 173.6 | 177.0 | 130.4 | 138.9 | 128.4 | 121.7 | 69.6 |
| Financial Results | | | | | | | | | | | | | | | | |
| Net Present Value | | | | | | | | | | | | | | | | |
| NPV@8% | M$ | 901.1 | | | | | | | | | | | | | | |
| NPV@5% | M$ | 786.0 | | | | | | | | | | | | | | |
| NPV@0% | M$ | 564.9 | | | | | | | | | | | | | | |
| Internal Rate of Return | % | 54.2% | | | | | | | | | | | | | | |
| Payback | Yrs | 1.57 | | | | | | | | | | | | | | |
El Pilar Project Form 43-101F1 Technical Report | |
Table 22-10: Constant Copper Price Case 5 @$4.50 Copper Financial Model, Unlevered, After-Tax
El Pilar Life of Mine Economic Model Case 6 @$4.50 Cu - Financial Model - Unlevered, After-Tax |
| | Units | Total/Avg. | PP | Year 1 | Year 2 | Year 3 | Year 4 | Year 5 | Year 6 | Year 7 | Year 8 | Year 9 | Year 10 | Year 11 | Year 12 | Year 13 |
| Tons Mined | | | | | | | | | | | | | | | | |
| Leach Ore | k-tonnes | 258,545 | 2,250 | 17,800 | 14,650 | 20,150 | 21,110 | 21,900 | 23,500 | 23,600 | 21,800 | 20,600 | 21,000 | 20,200 | 19,000 | 10,985 |
| Waste Total | k-tonnes | 453,768 | 12,750 | 22,200 | 28,350 | 47,849 | 46,889 | 45,099 | 49,000 | 54,400 | 62,200 | 51,900 | 15,671 | 8,907 | 4,835 | 3,718 |
| Total Mined | k-tonnes | 712,312 | 15,000 | 40,000 | 43,000 | 67,999 | 67,999 | 66,999 | 72,500 | 78,000 | 84,000 | 72,500 | 36,671 | 29,107 | 23,835 | 14,702 |
| | | | | | | | | | | | | | | | | |
| Head Grades | | | | | | | | | | | | | | | | |
| Total Copper Grade | % | 0.304 | 0.309 | 0.355 | 0.382 | 0.315 | 0.313 | 0.310 | 0.289 | 0.280 | 0.312 | 0.293 | 0.262 | 0.278 | 0.302 | 0.284 |
| Soluble Copper Grade | % | 0.130 | 0.191 | 0.202 | 0.206 | 0.158 | 0.136 | 0.127 | 0.125 | 0.121 | 0.136 | 0.103 | 0.107 | 0.098 | 0.096 | 0.075 |
| Recovered Copper Grade | % | 0.175 | 0.221 | 0.243 | 0.256 | 0.202 | 0.183 | 0.174 | 0.166 | 0.165 | 0.181 | 0.151 | 0.149 | 0.143 | 0.147 | 0.118 |
| | | | | | | | | | | | | | | | | |
| Recovery | | | | | | | | | | | | | | | | |
| Copper Recovery | % | 0.576 | 0.715 | 0.685 | 0.670 | 0.641 | 0.585 | 0.561 | 0.574 | 0.589 | 0.580 | 0.515 | 0.569 | 0.514 | 0.487 | 0.417 |
| | | | | | | | | | | | | | | | | |
| Payable Production | | | | | | | | | | | | | | | | |
| Copper - Leaching | k-lbs | 998,256 | 8,822 | 83,220 | 87,508 | 86,058 | 85,836 | 84,179 | 85,711 | 85,870 | 86,823 | 71,271 | 68,923 | 64,458 | 61,883 | 37,694 |
| | | | | | | | | | | | | | | | | |
| Prices | | | | | | | | | | | | | | | | |
| Copper price | $/lb | 4.50 | 4.50 | 4.50 | 4.50 | 4.50 | 4.50 | 4.50 | 4.50 | 4.50 | 4.50 | 4.50 | 4.50 | 4.50 | 4.50 | 4.50 |
| | | | | | | | | | | | | | | | | |
| FS&R Charges | | | | | | | | | | | | | | | | |
| Copper | $/lb | 0.03 | 0.03 | 0.03 | 0.03 | 0.03 | 0.03 | 0.03 | 0.03 | 0.03 | 0.03 | 0.03 | 0.03 | 0.03 | 0.03 | 0.03 |
| | | | | | | | | | | | | | | | | |
| Operating Costs/ton | | | | | | | | | | | | | | | | |
| Mining Cost Ore & Waste | $/tonne | 1.13 | 1.46 | 1.46 | 1.46 | 0.96 | 1.02 | 1.07 | 1.04 | 1.02 | 0.94 | 1.03 | 1.23 | 1.38 | 1.55 | 1.59 |
| Processing | $/tonne | 1.51 | 2.84 | 1.55 | 1.45 | 1.32 | 1.34 | 1.35 | 1.37 | 1.52 | 1.59 | 1.52 | 1.54 | 1.58 | 1.63 | 1.89 |
| Administration/ton leach only | $/tonne | 0.33 | 1.51 | 0.36 | 0.43 | 0.32 | 0.30 | 0.29 | 0.27 | 0.27 | 0.30 | 0.31 | 0.30 | 0.31 | 0.33 | 0.38 |
| | | | | | | | | | | | | | | | | |
| Revenue | | | | | | | | | | | | | | | | |
| Copper - Leaching | M$ | 4,492 | 39.7 | 374.5 | 393.8 | 387.3 | 386.3 | 378.8 | 385.7 | 386.4 | 390.7 | 320.7 | 310.2 | 290.1 | 278.5 | 169.6 |
| Total Revenue | M$ | 4,492 | 39.7 | 374.5 | 393.8 | 387.3 | 386.3 | 378.8 | 385.7 | 386.4 | 390.7 | 320.7 | 310.2 | 290.1 | 278.5 | 169.6 |
| | | | | | | | | | | | | | | | | |
| Freight Shippng & Refining | | | | | | | | | | | | | | | | |
| Cathode Transportation | M$ | (30) | (0.3) | (2.5) | (2.6) | (2.6) | (2.6) | (2.5) | (2.6) | (2.6) | (2.6) | (2.1) | (2.1) | (1.9) | (1.9) | (1.1) |
| Net Smelter Return | M$ | 4,462 | 39.4 | 372.0 | 391.2 | 384.7 | 383.7 | 376.3 | 383.1 | 383.8 | 388.1 | 318.6 | 308.1 | 288.2 | 276.6 | 168.5 |
| | | | | | | | | | | | | | | | | |
| Mine Operating Costs | | | | | | | | | | | | | | | | |
| Mining | M$ | (805) | (21.9) | (58.4) | (62.8) | (65.4) | (69.6) | (71.8) | (75.7) | (79.6) | (79.4) | (74.4) | (45.1) | (40.1) | (37.0) | (23.4) |
| Processing - Heap Leach | M$ | (389) | (6.4) | (27.5) | (21.2) | (26.6) | (28.2) | (29.5) | (32.2) | (35.8) | (34.7) | (31.3) | (32.3) | (31.9) | (31.0) | (20.7) |
| Administration | M$ | (84) | (3.4) | (6.3) | (6.3) | (6.4) | (6.4) | (6.4) | (6.4) | (6.4) | (6.4) | (6.4) | (6.3) | (6.3) | (6.3) | (4.1) |
| Reclamation | M$ | (5) | - | - | - | - | - | - | - | - | - | - | - | - | - | (5.1) |
| Salvage | M$ | (11) | - | - | - | - | - | - | - | - | - | - | - | - | - | (11.0) |
| Total Mine Operating Costs | M$ | (1,294) | (31.7) | (92.2) | (90.3) | (98.4) | (104.2) | (107.7) | (114.3) | (121.8) | (120.5) | (112.1) | (83.7) | (78.3) | (74.3) | (48.2) |
| | | | | | | | | | | | | | | | | |
| Xastra Royalty | | | | | | | | | | | | | | | | |
| Royalty | M$ | (41) | - | (0.3) | (4.1) | (3.9) | (3.9) | (3.8) | (3.9) | (3.9) | (3.9) | (3.2) | (3.1) | (2.9) | (2.8) | (1.7) |
| Total Operating Costs | M$ | (1,319) | (31.7) | (92.5) | (94.4) | (102.3) | (108.1) | (111.5) | (118.2) | (125.7) | (124.4) | (115.3) | (86.8) | (81.2) | (77.1) | (49.9) |
| | | | | | | | | | | | | | | | | |
| EBITDA | M$ | 3,143 | 7.7 | 279.5 | 296.8 | 282.4 | 275.6 | 264.8 | 264.9 | 258.1 | 263.7 | 203.3 | 221.3 | 207.0 | 199.5 | 118.6 |
| | | | | | | | | | | | | | | | | |
| Interest Income | M$ | - | - | - | - | - | - | - | - | - | - | - | - | - | - | - |
| Interest Expense | M$ | - | - | - | - | - | - | - | - | - | - | - | - | - | - | - |
| D.D. & A | M$ | 430.8 | - | 21.5 | 21.5 | 33.5 | 34.2 | 34.9 | 35.4 | 35.4 | 35.4 | 35.8 | 35.8 | 35.8 | 35.8 | 35.8 |
| Income Tax | M$ | 744.8 | 2.3 | 70.9 | 72.9 | 63.9 | 61.2 | 57.6 | 57.0 | 54.6 | 55.5 | 46.5 | 55.6 | 55.4 | 55.6 | 35.8 |
| Net Income | M$ | 1,967.7 | 5.4 | 187.1 | 202.4 | 185.0 | 180.2 | 172.3 | 172.5 | 168.1 | 172.8 | 121.0 | 129.9 | 115.8 | 108.1 | 47.0 |
| | | | | | | | | | | | | | | | | |
| Capital Expenditure | M$ | (430.6) | (272.8) | (7.1) | - | (131.5) | (6.9) | (6.9) | (3.5) | - | - | (1.9) | - | - | - | - |
| Capital - Working Capital | M$ | (17.1) | (39.8) | 26.8 | (0.7) | (4.4) | 0.5 | 0.5 | 0.4 | 0.6 | (0.2) | 1.2 | (2.0) | 0.1 | - | |
| Debt Repayment | M$ | - | - | - | - | - | - | - | - | - | - | - | - | - | - | - |
| D.D. & A | M$ | 430.6 | - | 21.5 | 21.5 | 33.5 | 34.2 | 34.9 | 35.4 | 35.4 | 35.4 | 35.8 | 35.8 | 35.8 | 35.8 | 35.8 |
| Net Cash Flow | M$ | 1,950.6 | (307.1) | 228.3 | 223.2 | 82.6 | 208.0 | 200.8 | 204.8 | 204.1 | 208.0 | 156.0 | 163.6 | 151.6 | 143.9 | 82.8 |
| Financial Results | | | | | | | | | | | | | | | | |
| Net Present Value | | | | | | | | | | | | | | | | |
| NPV@8% | M$ | 1125.9 | | | | | | | | | | | | | | |
| NPV@5% | M$ | 989.7 | | | | | | | | | | | | | | |
| NPV@0% | M$ | 727.7 | | | | | | | | | | | | | | |
| Internal Rate of Return | % | 65.0% | | | | | | | | | | | | | | |
| Payback | Yrs | 1.35 | | | | | | | | | | | | | | |
El Pilar Project Form 43-101F1 Technical Report | |
Table 22-11: Constant Copper Price Case 6 @$5.00 Copper Financial Model, Unlevered, After-Tax
El Pilar Life of Mine Economic Model Case 7 @$5.00 Cu - Financial Model - Unlevered, After-Tax |
| | Units | Total/Avg. | PP | Year 1 | Year 2 | Year 3 | Year 4 | Year 5 | Year 6 | Year 7 | Year 8 | Year 9 | Year 10 | Year 11 | Year 12 | Year 13 |
| Tons Mined | | | | | | | | | | | | | | | | |
| Leach Ore | k-tonnes | 258,545 | 2,250 | 17,800 | 14,650 | 20,150 | 21,110 | 21,900 | 23,500 | 23,600 | 21,800 | 20,600 | 21,000 | 20,200 | 19,000 | 10,985 |
| Waste Total | k-tonnes | 453,768 | 12,750 | 22,200 | 28,350 | 47,849 | 46,889 | 45,099 | 49,000 | 54,400 | 62,200 | 51,900 | 15,671 | 8,907 | 4,835 | 3,718 |
| Total Mined | k-tonnes | 712,312 | 15,000 | 40,000 | 43,000 | 67,999 | 67,999 | 66,999 | 72,500 | 78,000 | 84,000 | 72,500 | 36,671 | 29,107 | 23,835 | 14,702 |
| | | | | | | | | | | | | | | | | |
| Head Grades | | | | | | | | | | | | | | | | |
| Total Copper Grade | % | 0.304 | 0.309 | 0.355 | 0.382 | 0.315 | 0.313 | 0.310 | 0.289 | 0.280 | 0.312 | 0.293 | 0.262 | 0.278 | 0.302 | 0.284 |
| Soluble Copper Grade | % | 0.130 | 0.191 | 0.202 | 0.206 | 0.158 | 0.136 | 0.127 | 0.125 | 0.121 | 0.136 | 0.103 | 0.107 | 0.098 | 0.096 | 0.075 |
| Recovered Copper Grade | % | 0.175 | 0.221 | 0.243 | 0.256 | 0.202 | 0.183 | 0.174 | 0.166 | 0.165 | 0.181 | 0.151 | 0.149 | 0.143 | 0.147 | 0.118 |
| | | | | | | | | | | | | | | | | |
| Recovery | | | | | | | | | | | | | | | | |
| Copper Recovery | % | 0.576 | 0.715 | 0.685 | 0.670 | 0.641 | 0.585 | 0.561 | 0.574 | 0.589 | 0.580 | 0.515 | 0.569 | 0.514 | 0.487 | 0.417 |
| | | | | | | | | | | | | | | | | |
| Payable Production | | | | | | | | | | | | | | | | |
| Copper - Leaching | k-lbs | 998,256 | 8,822 | 83,220 | 87,508 | 86,058 | 85,836 | 84,179 | 85,711 | 85,870 | 86,823 | 71,271 | 68,923 | 64,458 | 61,883 | 37,694 |
| | | | | | | | | | | | | | | | | |
| Prices | | | | | | | | | | | | | | | | |
| Copper price | $/lb | 5.00 | 5.00 | 5.00 | 5.00 | 5.00 | 5.00 | 5.00 | 5.00 | 5.00 | 5.00 | 5.00 | 5.00 | 5.00 | 5.00 | 5.00 |
| | | | | | | | | | | | | | | | | |
| FS&R Charges | | | | | | | | | | | | | | | | |
| Copper | $/lb | 0.03 | 0.03 | 0.03 | 0.03 | 0.03 | 0.03 | 0.03 | 0.03 | 0.03 | 0.03 | 0.03 | 0.03 | 0.03 | 0.03 | 0.03 |
| | | | | | | | | | | | | | | | | |
| Operating Costs/ton | | | | | | | | | | | | | | | | |
| Mining Cost Ore & Waste | $/tonne | 1.13 | 1.46 | 1.46 | 1.46 | 0.96 | 1.02 | 1.07 | 1.04 | 1.02 | 0.94 | 1.03 | 1.23 | 1.38 | 1.55 | 1.59 |
| Processing | $/tonne | 1.51 | 2.84 | 1.55 | 1.45 | 1.32 | 1.34 | 1.35 | 1.37 | 1.52 | 1.59 | 1.52 | 1.54 | 1.58 | 1.63 | 1.89 |
| Administration/ton leach only | $/tonne | 0.33 | 1.51 | 0.36 | 0.43 | 0.32 | 0.30 | 0.29 | 0.27 | 0.27 | 0.30 | 0.31 | 0.30 | 0.31 | 0.33 | 0.38 |
| | | | | | | | | | | | | | | | | |
| Revenue | | | | | | | | | | | | | | | | |
| Copper - Leaching | M$ | 4,991 | 44.1 | 416.1 | 437.5 | 430.3 | 429.2 | 420.9 | 428.6 | 429.4 | 434.1 | 356.4 | 344.6 | 322.3 | 309.4 | 188.5 |
| Total Revenue | M$ | 4,991 | 44.1 | 416.1 | 437.5 | 430.3 | 429.2 | 420.9 | 428.6 | 429.4 | 434.1 | 356.4 | 344.6 | 322.3 | 309.4 | 188.5 |
| | | | | | | | | | | | | | | | | |
| Freight Shippng & Refining | | | | | | | | | | | | | | | | |
| Cathode Transportation | M$ | (30) | (0.3) | (2.5) | (2.6) | (2.6) | (2.6) | (2.5) | (2.6) | (2.6) | (2.6) | (2.1) | (2.1) | (1.9) | (1.9) | (1.1) |
| Net Smelter Return | M$ | 4,961 | 43.8 | 413.6 | 434.9 | 427.7 | 426.6 | 418.4 | 426.0 | 426.8 | 431.5 | 354.3 | 342.5 | 320.4 | 307.5 | 187.4 |
| | | | | | | | | | | | | | | | | |
| Mine Operating Costs | | | | | | | | | | | | | | | | |
| Mining | M$ | (805) | (21.9) | (58.4) | (62.8) | (65.4) | (69.6) | (71.8) | (75.7) | (79.6) | (79.4) | (74.4) | (45.1) | (40.1) | (37.0) | (23.4) |
| Processing - Heap Leach | M$ | (389) | (6.4) | (27.5) | (21.2) | (26.6) | (28.2) | (29.5) | (32.2) | (35.8) | (34.7) | (31.3) | (32.3) | (31.9) | (31.0) | (20.7) |
| Administration | M$ | (84) | (3.4) | (6.3) | (6.3) | (6.4) | (6.4) | (6.4) | (6.4) | (6.4) | (6.4) | (6.4) | (6.3) | (6.3) | (6.3) | (4.1) |
| Reclamation | M$ | (5) | - | - | - | - | - | - | - | - | - | - | - | - | - | (5.1) |
| Salvage | M$ | (11) | - | - | - | - | - | - | - | - | - | - | - | - | - | (11.0) |
| Total Mine Operating Costs | M$ | (1,294) | (31.7) | (92.2) | (90.3) | (98.4) | (104.2) | (107.7) | (114.3) | (121.8) | (120.5) | (112.1) | (83.7) | (78.3) | (74.3) | (48.2) |
| | | | | | | | | | | | | | | | | |
| Xastra Royalty | | | | | | | | | | | | | | | | |
| Royalty | M$ | (46) | - | (0.4) | (4.6) | (4.3) | (4.3) | (4.2) | (4.3) | (4.3) | (4.3) | (3.6) | (3.4) | (3.2) | (3.1) | (1.9) |
| Total Operating Costs | M$ | (1,324) | (31.7) | (92.6) | (94.9) | (102.7) | (108.5) | (111.9) | (118.6) | (126.1) | (124.8) | (115.7) | (87.1) | (81.5) | (77.4) | (50.1) |
| | | | | | | | | | | | | | | | | |
| EBITDA | M$ | 3,638 | 12.1 | 321.0 | 340.0 | 325.0 | 318.1 | 306.5 | 307.4 | 300.7 | 306.7 | 238.6 | 255.4 | 238.9 | 230.1 | 137.3 |
| | | | | | | | | | | | | | | | | |
| Interest Income | M$ | - | - | - | - | - | - | - | - | - | - | - | - | - | - | - |
| Interest Expense | M$ | - | - | - | - | - | - | - | - | - | - | - | - | - | - | - |
| D.D. & A | M$ | 430.8 | - | 21.5 | 21.5 | 33.5 | 34.2 | 34.9 | 35.4 | 35.4 | 35.4 | 35.8 | 35.8 | 35.8 | 35.8 | 35.8 |
| Income Tax | M$ | 884.2 | 3.7 | 83.0 | 85.0 | 75.9 | 73.1 | 69.3 | 68.9 | 66.5 | 67.5 | 56.4 | 65.2 | 64.3 | 64.1 | 41.3 |
| Net Income | M$ | 2,322.9 | 8.4 | 216.5 | 233.5 | 215.6 | 210.8 | 202.3 | 203.1 | 198.8 | 203.8 | 146.4 | 154.4 | 138.8 | 130.2 | 60.2 |
| | | | | | | | | | | | | | | | | |
| Capital Expenditure | M$ | (430.6) | (272.8) | (7.1) | - | (131.5) | (6.9) | (6.9) | (3.5) | - | - | (1.9) | - | - | - | - |
| Capital - Working Capital | M$ | (18.0) | (44.2) | 30.1 | (0.7) | (4.4) | 0.5 | 0.5 | 0.3 | 0.6 | (0.2) | 1.4 | (2.0) | 0.2 | - | |
| Debt Repayment | M$ | - | - | - | - | - | - | - | - | - | - | - | - | - | - | - |
| D.D. & A | M$ | 430.6 | - | 21.5 | 21.5 | 33.5 | 34.2 | 34.9 | 35.4 | 35.4 | 35.4 | 35.8 | 35.8 | 35.8 | 35.8 | 35.8 |
| Net Cash Flow | M$ | 2,304.9 | (308.5) | 261.0 | 254.3 | 113.2 | 238.6 | 230.8 | 235.4 | 234.8 | 238.9 | 181.6 | 188.2 | 174.7 | 166.0 | 96.0 |
| Financial Results | | | | | | | | | | | | | | | | |
| Net Present Value | | | | | | | | | | | | | | | | |
| NPV@8% | M$ | 1350.7 | | | | | | | | | | | | | | |
| NPV@5% | M$ | 1193.4 | | | | | | | | | | | | | | |
| NPV@0% | M$ | 890.6 | | | | | | | | | | | | | | |
| Internal Rate of Return | % | 75.6% | | | | | | | | | | | | | | |
| Payback | Yrs | 1.19 | | | | | | | | | | | | | | |
El Pilar Project Form 43-101F1 Technical Report | |
| | 22.2.3 | Financial Model for 3 Meter Lift Height 360 Day Copper Recovery Case |
The financial model for the alternate Financial Copper Recovery 3 Meter Lift Height 360 day copper recovery case is shown in Table 22-12. This semi-quantified copper recovery case results in 1,141.6 M lbs of copper being recovered over the LOM, averaging 64.9% LOM total copper recovery. This equates to 144.4 M lbs more copper being produced over 360 days of leaching than the Base Case. The result of this copper recovery case is an estimated NPV@8% of 565.6 M, an IRR of 43.3% and a capital payback period of 1.66 years. It should be noted that the annual production for this case averages 90.2 M lbs of copper, which is higher than the current capacity of the planned SXEW plant. As such, additional capital would be required to upgrade the SXEW plant. This additional capital is not included in this financial estimate.
This 3 m 360 day case will not be fully quantified in the future, unless actual 360 day test leach data is developed, but it is included herein to illustrate the potential for the project to recover more copper pounds than projected in the Base Case under the 3 meter lift height, multiple lift configuration planned for the project.
El Pilar Project Form 43-101F1 Technical Report | |
Table 22-12: Financial Model for 3 Meter Lift Height 360 Day Copper Recovery Case.
El Pilar Life of Mine Economic Model 3 m Lift Height, 360 Leach Days - Financial Model - Unlevered, After-Tax |
| | Units | Total/Avg. | PP | Year 1 | Year 2 | Year 3 | Year 4 | Year 5 | Year 6 | Year 7 | Year 8 | Year 9 | Year 10 | Year 11 | Year 12 | Year 13 |
| Tons Mined | | | | | | | | | | | | | | | | |
| Leach Ore | k-tonnes | 258,545 | 2,250 | 17,800 | 14,650 | 20,150 | 21,110 | 21,900 | 23,500 | 23,600 | 21,800 | 20,600 | 21,000 | 20,200 | 19,000 | 10,985 |
| Waste Total | k-tonnes | 453,768 | 12,750 | 22,200 | 28,350 | 47,849 | 46,889 | 45,099 | 49,000 | 54,400 | 62,200 | 51,900 | 15,671 | 8,907 | 4,835 | 3,718 |
| Total Mined | k-tonnes | 712,312 | 15,000 | 40,000 | 43,000 | 67,999 | 67,999 | 66,999 | 72,500 | 78,000 | 84,000 | 72,500 | 36,671 | 29,107 | 23,835 | 14,702 |
| | | | | | | | | | | | | | | | | |
| Head Grades | | | | | | | | | | | | | | | | |
| Total Copper Grade | % | 0.304 | 0.309 | 0.355 | 0.382 | 0.315 | 0.313 | 0.310 | 0.289 | 0.280 | 0.312 | 0.293 | 0.262 | 0.278 | 0.302 | 0.284 |
| Soluble Copper Grade | % | 0.130 | 0.191 | 0.202 | 0.206 | 0.158 | 0.136 | 0.127 | 0.125 | 0.121 | 0.136 | 0.103 | 0.107 | 0.098 | 0.096 | 0.075 |
| Recovered Copper Grade | % | 0.200 | 0.239 | 0.266 | 0.281 | 0.225 | 0.210 | 0.202 | 0.193 | 0.187 | 0.209 | 0.177 | 0.170 | 0.168 | 0.173 | 0.147 |
| | | | | | | | | | | | | | | | | |
| Recovery | | | | | | | | | | | | | | | | |
| Copper Recovery | % | 0.659 | 0.772 | 0.750 | 0.735 | 0.714 | 0.669 | 0.651 | 0.668 | 0.668 | 0.670 | 0.604 | 0.650 | 0.605 | 0.573 | 0.516 |
| | | | | | | | | | | | | | | | | |
| Payable Production | | | | | | | | | | | | | | | | |
| Copper - Leaching | k-lbs | 1,141,564 | 8,468 | 84,749 | 96,621 | 95,168 | 98,015 | 97,480 | 99,462 | 97,864 | 99,815 | 84,747 | 79,205 | 75,759 | 73,018 | 51,193 |
| | | | | | | | | | | | | | | | | |
| Prices | | | | | | | | | | | | | | | | |
| Copper price | $/lb | 2.82 | 3.83 | 3.83 | 3.44 | 3.14 | 2.60 | 2.60 | 2.60 | 2.60 | 2.60 | 2.60 | 2.60 | 2.60 | 2.60 | 2.60 |
| | | | | | | | | | | | | | | | | |
| FS&R Charges | | | | | | | | | | | | | | | | |
| Copper | $/lb | 0.03 | 0.03 | 0.03 | 0.03 | 0.03 | 0.03 | 0.03 | 0.03 | 0.03 | 0.03 | 0.03 | 0.03 | 0.03 | 0.03 | 0.03 |
| | | | | | | | | | | | | | | | | |
| Operating Costs/ton | | | | | | | | | | | | | | | | |
| Mining Cost Ore & Waste | $/tonne | 1.13 | 1.46 | 1.46 | 1.46 | 0.96 | 1.02 | 1.07 | 1.04 | 1.02 | 0.94 | 1.03 | 1.23 | 1.38 | 1.55 | 1.59 |
| Processing | $/tonne | 1.59 | 2.81 | 1.56 | 1.55 | 1.39 | 1.44 | 1.46 | 1.48 | 1.61 | 1.70 | 1.63 | 1.62 | 1.64 | 1.67 | 1.96 |
| Administration/ton leach only | $/tonne | 0.33 | 1.51 | 0.36 | 0.43 | 0.32 | 0.30 | 0.29 | 0.27 | 0.27 | 0.30 | 0.31 | 0.30 | 0.31 | 0.33 | 0.38 |
| | | | | | | | | | | | | | | | | |
| Revenue | | | | | | | | | | | | | | | | |
| Copper - Leaching | M$ | 3,214 | 32.4 | 324.3 | 332.4 | 298.4 | 254.8 | 253.4 | 258.6 | 254.4 | 259.5 | 220.3 | 205.9 | 197.0 | 189.8 | 133.1 |
| Total Revenue | M$ | 3,214 | 32.4 | 324.3 | 332.4 | 298.4 | 254.8 | 253.4 | 258.6 | 254.4 | 259.5 | 220.3 | 205.9 | 197.0 | 189.8 | 133.1 |
| | | | | | | | | | | | | | | | | |
| Freight Shippng & Refining | | | | | | | | | | | | | | | | |
| Cathode Transportation | M$ | (34) | (0.3) | (2.5) | (2.9) | (2.9) | (2.9) | (2.9) | (3.0) | (2.9) | (3.0) | (2.5) | (2.4) | (2.3) | (2.2) | (1.5) |
| Net Smelter Return | M$ | 3,180 | 32.1 | 321.8 | 329.5 | 295.5 | 251.9 | 250.5 | 255.6 | 251.5 | 256.5 | 217.8 | 203.5 | 194.7 | 187.6 | 131.6 |
| | | | | | | | | | | | | | | | | |
| Mine Operating Costs | | | | | | | | | | | | | | | | |
| Mining | M$ | (804) | (21.9) | (58.4) | (62.8) | (65.4) | (69.5) | (71.7) | (75.7) | (79.6) | (79.4) | (74.4) | (45.1) | (40.1) | (37.0) | (23.4) |
| Processing - Heap Leach | M$ | (411) | (6.3) | (27.8) | (22.7) | (28.1) | (30.4) | (31.9) | (34.7) | (37.9) | (37.1) | (33.7) | (33.9) | (33.2) | (31.8) | (21.5) |
| Administration | M$ | (84) | (3.4) | (6.3) | (6.3) | (6.4) | (6.4) | (6.4) | (6.4) | (6.4) | (6.4) | (6.4) | (6.3) | (6.3) | (6.3) | (4.1) |
| Reclamation | M$ | (5) | - | - | - | - | - | - | - | - | - | - | - | - | - | (5.1) |
| Salvage | M$ | (11) | - | - | - | - | - | - | - | - | - | - | - | - | - | (11.0) |
| Total Mine Operating Costs | M$ | (1,315) | (31.6) | (92.5) | (91.8) | (99.9) | (106.3) | (110.0) | (116.8) | (123.9) | (122.9) | (114.5) | (85.3) | (79.6) | (75.1) | (49.0) |
| | | | | | | | | | | | | | | | | |
| Xastra Royalty | | | | | | | | | | | | | | | | |
| Royalty | M$ | (29) | - | (0.3) | (3.6) | (3.0) | (2.5) | (2.5) | (2.6) | (2.5) | (2.6) | (2.2) | (2.1) | (2.0) | (1.9) | (1.3) |
| Total Operating Costs | M$ | (1,328) | (31.6) | (92.8) | (95.4) | (102.9) | (108.8) | (112.5) | (119.4) | (126.4) | (125.5) | (116.7) | (87.4) | (81.6) | (77.0) | (50.3) |
| | | | | | | | | | | | | | | | | |
| EBITDA | M$ | 1,852 | 0.5 | 229.0 | 234.1 | 192.6 | 143.1 | 138.0 | 136.2 | 125.1 | 131.0 | 101.1 | 116.1 | 113.1 | 110.6 | 81.3 |
| | | | | | | | | | | | | | | | | |
| Interest Income | M$ | - | - | - | - | - | - | - | - | - | - | - | - | - | - | - |
| Interest Expense | M$ | - | - | - | - | - | - | - | - | - | - | - | - | - | - | - |
| D.D. & A | M$ | 430.5 | - | 21.5 | 21.5 | 32.5 | 33.2 | 33.9 | 35.8 | 35.8 | 35.8 | 36.1 | 36.1 | 36.1 | 36.1 | 36.1 |
| Income Tax | M$ | 382.6 | 0.2 | 56.3 | 55.4 | 39.2 | 24.5 | 22.6 | 21.0 | 17.3 | 18.4 | 17.9 | 26.2 | 28.9 | 30.2 | 24.5 |
| Net Income | M$ | 1,038.7 | 0.3 | 151.2 | 157.2 | 120.9 | 85.4 | 81.5 | 79.4 | 72.0 | 76.8 | 47.1 | 53.8 | 48.1 | 44.3 | 20.7 |
| | | | | | | | | | | | | | | | | |
| Capital Expenditure | M$ | (430.6) | (272.8) | (7.1) | - | (120.4) | (6.9) | (6.9) | (14.6) | - | - | (1.9) | - | - | - | - |
| Capital - Working Capital | M$ | (14.6) | (32.5) | 21.0 | (0.3) | (3.7) | 1.7 | 0.3 | 0.4 | 0.7 | (0.2) | 0.3 | (2.0) | (0.2) | (0.2) | |
| Debt Repayment | M$ | - | - | - | - | - | - | - | - | - | - | - | - | - | - | - |
| D.D. & A | M$ | 430.5 | - | 21.5 | 21.5 | 32.5 | 33.2 | 33.9 | 35.8 | 35.8 | 35.8 | 36.1 | 36.1 | 36.1 | 36.1 | 36.1 |
| Net Cash Flow | M$ | 1,024.0 | (305.0) | 186.6 | 178.5 | 29.3 | 113.3 | 108.8 | 101.0 | 108.4 | 112.3 | 81.6 | 87.9 | 84.0 | 80.2 | 56.8 |
| Financial Results | | | | | | | | | | | | | | | | |
| Net Present Value | | | | | | | | | | | | | | | | |
| NPV@8% | M$ | 567.0 | | | | | | | | | | | | | | |
| NPV@5% | M$ | 490.2 | | | | | | | | | | | | | | |
| NPV@0% | M$ | 342.2 | | | | | | | | | | | | | | |
| Internal Rate of Return | % | 43.7% | | | | | | | | | | | | | | |
| Payback | Yrs | 1.66 | | | | | | | | | | | | | | |
El Pilar Project Form 43-101F1 Technical Report | |
| | 22.2.4 | Financial Model for Life-of-Mine Contract Mining |
A financial model for a LOM Contractor Mining Case option is shown in Table 22-13. This model economic analysis is based on a bid received from a Mexican mining contractor for LOM contract mining, in is included to illustrate the impact to the project in the event that financing may not be available for owner mining equipment. This Case results in an estimated NPV@8% of 370.8 M, an IRR of 39.6% and a capital payback period of 1.78 years.
El Pilar Project Form 43-101F1 Technical Report | |
Table 22-13: Financial Model for LOM Contract Mining
El Pilar Life of Mine Economic Model LOM Contractor Mining - Base Case - Financial Model - Unlevered, After-Tax |
| | Units | Total/Avg. | PP | Year 1 | Year 2 | Year 3 | Year 4 | Year 5 | Year 6 | Year 7 | Year 8 | Year 9 | Year 10 | Year 11 | Year 12 | Year 13 |
| Tons Mined | | | | | | | | | | | | | | | | |
| Leach Ore | k-tonnes | 258,545 | 2,250 | 17,800 | 14,650 | 20,150 | 21,110 | 21,900 | 23,500 | 23,600 | 21,800 | 20,600 | 21,000 | 20,200 | 19,000 | 10,985 |
| Waste Total | k-tonnes | 453,768 | 12,750 | 22,200 | 28,350 | 47,849 | 46,889 | 45,099 | 49,000 | 54,400 | 62,200 | 51,900 | 15,671 | 8,907 | 4,835 | 3,718 |
| Total Mined | k-tonnes | 712,312 | 15,000 | 40,000 | 43,000 | 67,999 | 67,999 | 66,999 | 72,500 | 78,000 | 84,000 | 72,500 | 36,671 | 29,107 | 23,835 | 14,702 |
| | | | | | | | | | | | | | | | | |
| Head Grades | | | | | | | | | | | | | | | | |
| Total Copper Grade | % | 0.304 | 0.309 | 0.355 | 0.382 | 0.315 | 0.313 | 0.310 | 0.289 | 0.280 | 0.312 | 0.293 | 0.262 | 0.278 | 0.302 | 0.284 |
| Soluble Copper Grade | % | 0.130 | 0.191 | 0.202 | 0.206 | 0.158 | 0.136 | 0.127 | 0.125 | 0.121 | 0.136 | 0.103 | 0.107 | 0.098 | 0.096 | 0.075 |
| Recovered Copper Grade | % | 0.175 | 0.221 | 0.243 | 0.256 | 0.202 | 0.183 | 0.174 | 0.166 | 0.165 | 0.181 | 0.151 | 0.149 | 0.143 | 0.147 | 0.118 |
| | | | | | | | | | | | | | | | | |
| Recovery | | | | | | | | | | | | | | | | |
| Copper Recovery | % | 0.576 | 0.715 | 0.685 | 0.670 | 0.641 | 0.585 | 0.561 | 0.574 | 0.589 | 0.580 | 0.515 | 0.569 | 0.514 | 0.487 | 0.417 |
| | | | | | | | | | | | | | | | | |
| Payable Production | | | | | | | | | | | | | | | | |
| Copper - Leaching | k-lbs | 998,256 | 8,822 | 83,220 | 87,508 | 86,058 | 85,836 | 84,179 | 85,711 | 85,870 | 86,823 | 71,271 | 68,923 | 64,458 | 61,883 | 37,694 |
| | | | | | | | | | | | | | | | | |
| Prices | | | | | | | | | | | | | | | | |
| Copper price | $/lb | 2.82 | 3.83 | 3.83 | 3.44 | 3.14 | 2.60 | 2.60 | 2.60 | 2.60 | 2.60 | 2.60 | 2.60 | 2.60 | 2.60 | 2.60 |
| | | | | | | | | | | | | | | | | |
| FS&R Charges | | | | | | | | | | | | | | | | |
| Copper | $/lb | 0.03 | 0.03 | 0.03 | 0.03 | 0.03 | 0.03 | 0.03 | 0.03 | 0.03 | 0.03 | 0.03 | 0.03 | 0.03 | 0.03 | 0.03 |
| | | | | | | | | | | | | | | | | |
| Operating Costs/ton | | | | | | | | | | | | | | | | |
| Mining Cost Ore & Waste | $/tonne | 1.59 | 1.53 | 1.64 | 1.30 | 1.33 | 1.52 | 1.52 | 1.48 | 1.47 | 1.47 | 1.48 | 2.26 | 2.61 | 2.63 | 1.12 |
| Processing | $/tonne | 1.51 | 2.84 | 1.55 | 1.45 | 1.32 | 1.34 | 1.35 | 1.37 | 1.52 | 1.59 | 1.52 | 1.54 | 1.58 | 1.63 | 1.89 |
| Administration/ton leach only | $/tonne | 0.33 | 1.51 | 0.36 | 0.43 | 0.32 | 0.30 | 0.29 | 0.27 | 0.27 | 0.30 | 0.31 | 0.30 | 0.31 | 0.33 | 0.38 |
| | | | | | | | | | | | | | | | | |
| Revenue | | | | | | | | | | | | | | | | |
| Copper - Leaching | M$ | 2,828 | 33.8 | 318.5 | 301.1 | 269.9 | 223.2 | 218.9 | 222.8 | 223.3 | 225.7 | 185.3 | 179.2 | 167.6 | 160.9 | 98.0 |
| Total Revenue | M$ | 2,828 | 33.8 | 318.5 | 301.1 | 269.9 | 223.2 | 218.9 | 222.8 | 223.3 | 225.7 | 185.3 | 179.2 | 167.6 | 160.9 | 98.0 |
| | | | | | | | | | | | | | | | | |
| Freight Shippng & Refining | | | | | | | | | | | | | | | | |
| Cathode Transportation | M$ | (30) | (0.3) | (2.5) | (2.6) | (2.6) | (2.6) | (2.5) | (2.6) | (2.6) | (2.6) | (2.1) | (2.1) | (1.9) | (1.9) | (1.1) |
| Net Smelter Return | M$ | 2,798 | 33.5 | 316.0 | 298.5 | 267.3 | 220.6 | 216.4 | 220.2 | 220.7 | 223.1 | 183.2 | 177.1 | 165.7 | 159.0 | 96.9 |
| | | | | | | | | | | | | | | | | |
| Mine Operating Costs | | | | | | | | | | | | | | | | |
| Mining | M$ | (1,131) | (22.9) | (65.6) | (55.8) | (90.8) | (103.3) | (101.8) | (107.0) | (114.9) | (123.6) | (107.4) | (83.0) | (76.0) | (62.6) | (16.5) |
| Processing - Heap Leach | M$ | (389) | (6.4) | (27.5) | (21.2) | (26.6) | (28.2) | (29.5) | (32.2) | (35.8) | (34.7) | (31.3) | (32.3) | (31.9) | (31.0) | (20.7) |
| Administration | M$ | (84) | (3.4) | (6.3) | (6.3) | (6.4) | (6.4) | (6.4) | (6.4) | (6.4) | (6.4) | (6.4) | (6.3) | (6.3) | (6.3) | (4.1) |
| Reclamation | M$ | (5) | - | - | - | - | - | - | - | - | - | - | - | - | - | (5.1) |
| Salvage | M$ | (11) | - | - | - | - | - | - | - | - | - | - | - | - | - | (11.0) |
| Total Mine Operating Costs | M$ | (1,620) | (32.7) | (99.4) | (83.3) | (123.8) | (137.9) | (137.7) | (145.6) | (157.1) | (164.7) | (145.1) | (121.6) | (114.2) | (99.9) | (41.3) |
| | | | | | | | | | | | | | | | | |
| Xastra Royalty | | | | | | | | | | | | | | | | |
| Royalty | M$ | (25) | - | (0.3) | (3.2) | (2.7) | (2.2) | (2.2) | (2.2) | (2.2) | (2.3) | (1.9) | (1.8) | (1.7) | (1.6) | (1.0) |
| Total Operating Costs | M$ | (1,630) | (32.7) | (99.7) | (86.5) | (126.5) | (140.1) | (139.9) | (147.8) | (159.3) | (167.0) | (147.0) | (123.4) | (115.9) | (101.5) | (42.3) |
| | | | | | | | | | | | | | | | | |
| EBITDA | M$ | 1,169 | 0.8 | 216.3 | 212.0 | 140.8 | 80.5 | 76.5 | 72.4 | 61.4 | 56.1 | 36.2 | 53.7 | 49.8 | 57.5 | 54.6 |
| | | | | | | | | | | | | | | | | |
| Interest Income | M$ | - | - | - | - | - | - | - | - | - | - | - | - | - | - | - |
| Interest Expense | M$ | - | - | - | - | - | - | - | - | - | - | - | - | - | - | - |
| D.D. & A | M$ | 279.5 | - | 21.5 | 21.5 | 21.5 | 21.5 | 21.5 | 21.5 | 21.5 | 21.5 | 21.5 | 21.5 | 21.5 | 21.5 | 21.5 |
| Income Tax | M$ | 238.0 | 0.2 | 52.6 | 49.2 | 28.9 | 11.6 | 10.1 | 8.6 | 5.1 | 3.3 | 5.9 | 15.0 | 13.9 | 16.1 | 17.5 |
| Net Income | M$ | 651.2 | 0.6 | 142.2 | 141.3 | 90.4 | 47.4 | 44.9 | 42.3 | 34.8 | 31.3 | 8.8 | 17.2 | 14.4 | 19.9 | 15.6 |
| | | | | | | | | | | | | | | | | |
| Capital Expenditure | M$ | (279.9) | (272.8) | (7.1) | - | - | - | - | - | - | - | - | - | - | - | - |
| Capital - Working Capital | M$ | (11.8) | (33.5) | 22.7 | (0.8) | (1.1) | 2.4 | 0.1 | 0.5 | 0.9 | 0.6 | (0.6) | (1.8) | (0.3) | (1.0) | |
| Debt Repayment | M$ | - | - | - | - | - | - | - | - | - | - | - | - | - | - | - |
| D.D. & A | M$ | 279.9 | - | 21.5 | 21.5 | 21.5 | 21.5 | 21.5 | 21.5 | 21.5 | 21.5 | 21.5 | 21.5 | 21.5 | 21.5 | 21.5 |
| Net Cash Flow | M$ | 639.4 | (305.7) | 179.3 | 162.0 | 110.9 | 71.4 | 66.5 | 64.4 | 57.3 | 53.4 | 29.7 | 37.0 | 35.6 | 40.5 | 37.1 |
| Financial Results | | | | | | | | | | | | | | | | |
| Net Present Value | | | | | | | | | | | | | | | | |
| NPV@8% | M$ | 370.8 | | | | | | | | | | | | | | |
| NPV@5% | M$ | 322.8 | | | | | | | | | | | | | | |
| NPV@0% | M$ | 227.7 | | | | | | | | | | | | | | |
| Internal Rate of Return | % | 39.6% | | | | | | | | | | | | | | |
| Payback | Yrs | 1.78 | | | | | | | | | | | | | | |
El Pilar Project Form 43-101F1 Technical Report | |
| | 22.2.5 | Financial Analysis Summary |
The capital and operating cost estimates for the El Pilar project case have been completed along with mine scheduling. There are no known or anticipated environmental or permitting issues that would ultimately affect ML’s ability to construct and operate the project under the assumptions detailed in this report.
The work completed in this Technical Report indicates that the El Pilar project is economically viable for the production of copper from heap leaching. The reserves, which are based on a $2.15 copper price, are sufficient for 13 years of production at an average leaching rate of 50,596 tpd. The project is projected to average 79.3 M lbs of copper production per year and to produce 998.3 M lbs of copper cathode over the LOM. During the first five years, the project averages 85.6 M lbs of copper production per year at an average cost of $1.22 per pound of copper..
The financial model, which incorporates capital and operating estimates along with copper price assumptions, demonstrates that the project is economic and robust, with an after-tax net present value of $416.0 million at a discount rate of 8%. Capital pay-back of initial facilities capital is estimated in 1.77 years and the IRR of the project is 36.6%.
The other copper recovery financial case, based on projected 3 meter lift height 360 day copper recovery data, illustrates that even higher copper recoveries may be attained and, as a result, economic upsides to the project may be very significant. Based on the financial analysis, it can be concluded that El Pilar is a robust project economically and that further development of the project is warranted.
El Pilar Project Form 43-101F1 Technical Report | |
El Pilar is an extensive property position (7,169 hectares) that comprises eighteen (18) mining concessions as described in Section 4. The property extends approximately 8 km east-west and approximately 9 km north-south. The El Pilar mineral reserve is centrally located on the ML concessions. No other concessions are known to exist immediately adjacent to the property, and there are no other known mineral deposits close to El Pilar.
El Pilar Project Form 43-101F1 Technical Report | |
| 24 | OTHER RELEVANT DATA AND INFORMATION |
There is no other relevant data or information to this report that has not already been covered in the other sections.
El Pilar Project Form 43-101F1 Technical Report | |
| 25 | INTERPRETATION AND CONCLUSIONS |
The results of the Financial Model, which is presented in Section 22, shows that El Pilar project is both economically feasible and robust under the market conditions assumed and following the assumptions and considerations noted in the body of this Study. The main economic parameters, before tax and after tax are shown in Table 25-1:
Table 25-1: Main Parameters Before and After Tax
| Parameter | After - Tax | Pre -Tax |
| Total Cash Operating Costs ($/lb Cu) | 1.34 | 1.34 |
| NPV@8% ($M) | 416.6 | 609.0 |
| EBITDA ($M) | 1,501 | 1,501 |
| IRR (%) | 36.6% | 52.9% |
| Capital Payback (Years) | 1.8 | 1.3 |
Table 25-2 illustrates the sensitivity of project economics to various percentage cost changes.
Table 25-2: Sensitivities - After Tax
PARAMETER OR
PERCENTAGE
VARIATION | VALUE | AFTER TAX | |
IRR
(%) | NPV @8% ($M) |
| Copper Price ($/lb) | | | |
| -20% | $2.25 | 18.6% | $152.4 |
| -10% | $2.54 | 27.8% | $284.6 |
| Base Case | $2.82 | 36.6% | $416.0 |
| 10% | $3.10 | 45.2% | $547.3 |
| 20% | $3.38 | 53.7% | $678.7 |
| Total Operating Costs ($/lb) | | |
| -20% | $1.08 | 43.2% | $530.7 |
| -10% | $1.21 | 40.0% | $473.3 |
| Base Case | $1.34 | 36.6% | $416.0 |
| 10% | $1.46 | 33.2% | $358.6 |
| 20% | $1.59 | 29.6% | $301.1 |
| Initial Capital Costs ($M) | | | |
| -20% | $223.9 | 48.2% | $471.9 |
| -10% | $251.9 | 41.8% | $443.9 |
| Base Case | $279.9 | 36.6% | $416.0 |
| 10% | $307.9 | 32.4% | $388.0 |
| 20% | $335.9 | 28.8% | $360.1 |
El Pilar Project Form 43-101F1 Technical Report | |
| ● | ML has secured the surface land rights and is in the processing of acquiring all of the water rights needed by the project. |
| | 25.1.2 | Mineral Resource, Reserves and Mining |
| ● | Overall, the risk to slope failures in gravels is more a risk to bench cleanup due to material raveling than it is to large scale failures that can occur in rocks with failure plans. As such the risk to major slope failures at El Pilar is deemed to be minimal. |
| ● | The main potential risks are associated with copper recovery and acid consumption. Overall, however, risks to higher than expected acid consumption and costs have been significantly decreased by the planned construction of the onsite acid plant. There is a risk with respect to sulfur pricing. |
| ● | The main risk for the acid plant and supply of acid is delivery of elemental sulfur feed to the plant. Although the railroad passes by the project, the most probable source is from the USA and there could be delays associated with importation and border crossing at Nogales. |
| ● | No risks were found to be associated with the climate data. |
| ● | Because the MIA, CUS and water permits have been attained/approved, the overall risk to environmental issues/permitting is deemed to be low. |
| ● | The mining industry is very active in Mexico and the market for trained personnel is getting to be very competitive. As such, there is a potential for the local market to see higher competition for employers in order to retain employees. This could potentially drive up the operating cost, albeit the percentage increase to the operating cost would be small. |
| ● | A full contractor option economic analysis of the Base Case was performed using an bid received from a Mexican mining contractor for LOM contract mining, in the event that financing could not be obtained for mining equipment. The full contract mining option |
El Pilar Project Form 43-101F1 Technical Report | |
| | averages $1.53 over the LOM and results in an NPV@8% of $370.8 M, an IRR of 39.6% and a capital payback of 1.78 years. |
| | 25.2.1 | Mineral Resource, Reserves and Mining |
| ● | There is the potential beyond the known resource/reserve to further expand the deposit by drilling to the south and south-east. |
| ● | There is potential to find the ultimate source of copper mineralization believed to be a higher grade breccia and/or porphyry copper deposit. |
In general, an increase in copper recovery in leaching could lead to an optimization of the production schedule, eventually helping to smooth out the drop in plant production expected after Year 9 of the project. Additionally, an increase in recovery has a direct effect on the unit cost of operation, because more copper is produced from proportionally less ore. Copper recovery and other potential metallurgical upsides include the following:
| ● | Using 3 meter lift height, 360 day copper recovery projections result in 1,141.6 M lbs of copper being recovered over the LOM, averaging 64.9% LOM total copper recovery. This equates to 144.4 M lbs more copper being produced over 360 days of leaching than the Base Case. |
| ● | Under managed pH conditions during real operations, as opposed to the very high acid application rates of 10 gpl free acid used for the metallurgical tests, LOM acid consumption may be lower than presently projected. |
| ● | Due apparently to differences in assay procedures between the METCON test results and the drillhole database, up to 3.6 percentage points more soluble copper may be present than modeled. This could equate to as much as 45 M lbs more copper being produced over the LOM. |
| ● | Using a 10 to 15 kg per tonne precure, rather than the 4 kg per tonne precure used in the metallurgical tests, will likely result in faster copper recovery rates. This could positively impact project economics and allow for a shortened leach cycle and potentially for better copper recoveries over the life of mine. Also, the planned 3 meter lift height combined with the higher acid precure will result in potentially faster copper recoveries than presently projected, thus positively impacting copper recovery rate kinetics and project economics. |
| ● | An opportunity exists to reduce the capital cost of the acid plant, related to engineering, materials and construction. It is thought that the costs of detailed engineering, fabrication and construction could be reduced in Mexico. |
El Pilar Project Form 43-101F1 Technical Report | |
| ● | Installation of a turbine and generator of 15MW capacity to generate power from the waste heat resulting from burning sulfur in the acid plant is an unsurpassable opportunity to reduce overall project power supply costs. |
| ● | The 110% capacity of the proposed acid plant at 1430 tpd was estimated as the maximum acid consumption for the project. |
| ● | The capital cost estimate is based on budgetary quotes for equipment. An opportunity exists for capital cost reduction with the negotiation of firm purchase orders. Most quotes were received in 2011. |
| ● | The development of detail engineering, with a possible optimization of the arrangement of facilities, could show savings in the expected quantities for excavation and fill. Some costs relocated to engineering may become sunk costs as payments will be incurred prior to project financing. |
| ● | The capital cost of the main power line from CFE-Nogales was estimated by CFE. Local independent contractors tend to be lower cost than CFE. |
| The power line was estimated based on steel structures; there is a potential to negotiate with CFE and get their approval to build the power line with wood poles, which will save some capital. |
| As mentioned before, the possible optimization of copper recovery and acid consumption based on operating experience could result in a reduction of unit operating cost. |
| Mine operating costs represent a significant portion (65%) of the total operating cost according to the financial model. There is an opportunity for improvement during final contract negotiations and also during detail development of the detail mine plan and schedule. |
El Pilar Project Form 43-101F1 Technical Report | |
| 26 | RECOMMENDATIONS |
| | |
| 26.1 | Mining and Mineral Reserves |
| ● | Other than further study of the above opportunities and risks, there are no specific recommendations. |
| ● | ML should implement an early assay and metallurgical data collection program, first directed to evaluate the performance of leaching of the first ore to be placed in the heap, during the preproduction period. This will serve as an early detection of possible problems, and afterwards should be directed to monitoring, reporting and control of Leaching and SXEW plant operation. This could require contracting an outside laboratory to process samples, while the permanent facilities are built. |
| ● | M3 recommends the installation of the acid plant and the installation of a turbine and generator. |
| ● | ML should confirm a long term sulfur supply contract. |
| ● | M3 recommends completing the construction of the acid plant and railroad siding before startup so that the acid facility could provide the initial fill of acid, thereby eliminating the need to purchase the startup reagents separately, reducing capital cost by $11 million. |
| ● | There are no recommendations for environmental concerns. |
El Pilar Project Form 43-101F1 Technical Report | |
AMEC, 2006. El Pilar Preliminary Economic Scoping Study Evaluation. AMEC Mining and Metals, Inc., January 2006.
Compañía Minera Falconbridge, 2005. El Pilar Metallurgical Report. Compañía Minera Falconbridge – Lomas Bayas, July 2005.
Corn, RM., 1975. Alteration-mineralization zoning, Red Mountain, Arizona: Economic Geology, v. 70; no. 8; p. 1437-1447.
Davis, R. A., 1983. Depositional Systems: Prentice-Hall, Englewood Cliffs, N. J., USA.
DiPrisco, Giovanni, 2001. El Pilar Mineralogical Report, El Pilar Thin Section Location Map. Terra Mineralogical Services, September 2001.
Drewes, H. 1972. Structural geology of the Santa Rita Mountains, Southeast of Tucson, Arizona. U.S. Geology Survey Professional Paper 748. Washington.
Fleck, 2011. Stingray Resources – El Pilar Project Conceptual Engineering & Cost Estimate for a 1,300 MTPD Double Absorption Sulfuric Acid Plant. Fleck Chemical Industries, Inc. June 2011.
Golder Associates, Inc., 2008. Report on Slope Design Recommendations, El Pilar Discovery Project, Sonora, Mexico. September 2008.
Golder Associates, Inc., 2009. El Pilar Project, Copper Leach Facility, Feasibility Design Report. February 2009.
Graybeal, F.T., 1996, Sunnyside, a vertically-preserved porphyry copper system, Patagonia Mountains, Arizona: Society of Economic Geologists Newsletter, no. 26, p. 1 and 10–14.
Independent Mining Consultants, Inc., 2009. El Pilar Copper Project, Feasibility Study Mining. March 2009.
Joewen, Robert J., 2008. El Pilar Project, Feasibility Study Input, Copper Cathode Marketing. December 2008.
M3 Engineering & Technology Corporation. NI 43-101 Technical Report, El Pilar Project, Sonora, Mexico. April 2009.
M3 Engineering & Technology Corporation. NI 43-101 Technical Report, El Pilar Project, Sonora, Mexico. November 2011.
M3 Mexicana, 2011. Manifestación de Impacto Ambiental, Modalidad Particular, Proyecto Minera “El Pilar”, Municipio de Santa Cruz Sonora, México. April 2011.
El Pilar Project Form 43-101F1 Technical Report | |
M3 Mexicana, 2011a. Estudio Técnico Justificativo para Solicitar la Autorización de Cambio de Uso de Suelo para el Proyecto Minero “El Pilar” de 963.40 ha de Terrenos Forestales. 2011.
METCON Research, 2009. Metallurgical Reports, Volumes I to III. February 2009.
Rangel, Dr. Miguel, 2008. Hydrological Study. Dr. Miguel Rangel (IDEAS), July 2008.
Rust, B.R., 1979, Coarse alluvial deposits: in Walker, R. G., Facies Models: Geoscience Canada, Geological Society of Canada.
Sauceda, Rodolfo, 2010. Independent Geologist Report from Resource Geosciences Hermosillo.
Schrader, F.C. & J.M. Hill (1915). Mineral deposits of the Santa Rita and Patagonia Mountains, Arizona, USGS Bull. 582.
Simons, F.S., 1974. Geologic map and sections of the Nogales and Lochiel quadrangles, Santa Cruz County, Arizona: USGS Miscellaneous Investigations Series Map I-762, 9 p., 1 sheet, scale 1:48,000.
Stingray Copper, Inc., 2008. El Pilar Project QA/QC Report. November 2008 (Reviewed by IMC).
The Mines Group, 2010. Pit Slope Stability Review for El Pilar. Ken Meyers, P.E. November 2010.
The Mines Group, 2011. El Pilar Project Heap Leach Facility Feasibility Design Report. Anthony Crews, P.E. September 2011.
Woods, Gary, 2007. NI 43-101 El Pilar Technical Report, El Pilar Property, Sonora State, Mexico. April 2007.
El Pilar Project Form 43-101F1 Technical Report | |
APPENDIX A: FEASIBILITY STUDY CONTRIBUTORS AND PROFESSIONAL
QUALIFICATIONS
| Feasibility Study Contributors & Professional Qualifications |
| Responsibility | Author | Registration | Designation | Company |
| Feasibility Study | Michael Broch | FAusIMM | Qualified Person (QP) | Mercator Minerals Ltd. |
| | | | | |
Data Verification: QA/QC, Resource Modeling,
Mine Planning, and Reserves | Mike Hester | FAusIMM | Other Expert | IMC |
| | | | | |
| Geology | John Dreier | P. Geo | Other Expert | Exploration, Development and Mining Consultants, Inc. |
| | | | | |
| Metallurgy, Flow Sheets and Process Plant | Thomas L. Drielick | P. E. | Other Expert | M3 Engineering |
| | | | | |
| Process Plant (SX-EW) | Mark Vancas | | Other Expert | |
| | | | | |
| Pit Geotechnical | Ken Myers | P. E. | Other Expert | The Mines Group |
| | | | | |
| Heap Design / Geotechnical | Anthony Crews | P. E. | Other Expert | The Mines Group |
| | | | | |
| Environmental and Permits | Julian Bennett | M. Sc. | Other Expert | M3M |
| | | | | |
| Hydrology | Dr. Miguel Rangel | Ph. D. | Other Expert | IDEAS |
| | | | | |
| Acid Plant / Power Plant Sulfur Unloading | Eric Partelpoeg | Ph. D. | Other Expert | EHP |
| | | | | |
| Sulfur Pricing Study | Robert Boyd | | Other Expert | Elkbury Sulfur Consultants, Inc. |
The certificate for the Qualified Person (QP) for this report is included in this section. The QP for this report is:
| ● | Michael J. Broch, FAusIMM, Mercator Minerals. |
El Pilar Project Form 43-101F1 Technical Report | |
Michael J. Broch, BSc, Geology, Msc, Economic Geology, FAusIMM
Vice-President, Exploration and Evaluations
Mercator Minerals Ltd.
2785 Sagittarius Drive
Reno, Nevada. 89509
Telephone: 775-846-6326
CONSENT OF QUALIFIED PERSON
TO: All securities regulatory authorities
I, Michael J. Broch, BSc, Geology, Msc, Economic Geology, FAusIMM, do hereby consent to the filing by Mercator Minerals, Ltd. of the written disclosure of the Technical Report titled "Technical Report, Feasibility Study. El Pilar Project, Sonora, Mexico," dated October 18, 2012, by me, with the above securities regulatory authorities.
I also certify that I have read the written disclosure being filed and that it fairly and accurately represents the information in the Technical Report that supports the disclosure.
Dated this 18th day of October 2012
/s/ “Michael J. Broch”
Signature of Qualified Person
Michael J. Broch
Print name of Qualified Person
El Pilar Project Form 43-101F1 Technical Report | |
Certificate of Qualified Person
I, Michael J. Broch, BSc, Geology, Msc, Economic Geology, FAusIMM do hereby certify:
1. I am Vice President Exploration & Evaluations and work for:
Mercator Minerals Ltd.
1050-625 Howe Street
Vancouver, BC V6C 2T6
Email: mjbroch@mercatorminerals.com
| 2. | This certificate is provided in connection with the Technical Report, Feasibility Study. El Pilar Project, Sonora, Mexico dated October 18, 2012 (the "Technical Report"). |
| 3. | I graduated with a degree of Bachelor of Science in Geology from Washington State University in 1976. I obtained a Master of Science in Economic Geology from Washington State University in 1979. |
| 4. | I am a Fellow member of Australian Institute of Mining and Metallurgy (Number 302134). |
| 5 | I have worked as an economic geologist for a total of 32 years since my graduation from university. My relevant experiences for the purposes of the Technical Report are as follows: |
| a) | I have worked for operating companies that include US Borax, Anaconda Copper Company, Cyprus Minerals, Amoco Minerals, Duval Corporation, Battle Mountain Gold Company and Equatorial Copper. |
| b) | I have worked as an economic geologist on various mining projects for approximately 30 years, with duties including exploration and mine development, reserves, project evaluations and acquisitions, economic analyses, geo-metallurgy and prefeasibility and feasibility studies. |
| 6. | I have read the definition of “qualified person” set out in National Instrument 43-101 (“NI-43-101”) and certify that by reason of my education, current affiliation with a professional organization (as defined by NI 43-101) and past relevant work experience, I am a “Qualified Person” as that term is defined in NI 43-101. |
| 7. | I am the author of and responsible for the all of the sections of this Technical Report. I have visited the El Pilar property numerous times since 2009 since it was acquired by Mercator Minerals Ltd., most recently being August 5 through August 8, 2012. I have been directly involved with the property that is the subject of the Technical Report since it was acquired by Mercator Minerals Ltd. in 2009, and have been responsible for determining and supervising work programs and evaluations of the Property. |
El Pilar Project Form 43-101F1 Technical Report | |
| 8. | As of the date of the Technical Report, to the best of my knowledge, information and belief, the Technical Report contains all of the scientific and technical information that is required to be disclosed to make the Technical Report not misleading. |
| 9. | I am not independent of the issuer, Mercator Minerals Ltd., as that term is described in NI-43-101. |
| 10. | I have read NI 43-101 and Form 43-101F1, and the Technical Report has been prepared in compliance with that instrument and the prescribed form. |
Dated this 18th day October 2012
/s/ “Michael J. Broch”
Name of Qualified Person
(Effective Date: October 18, 2012)