
ANNUAL INFORMATION FORM
of
Yukon-Nevada Gold Corp.
#900, 688 West Hastings Street
Vancouver, BC, V6B 1P1
Tel: (604) 688-9427
March 31, 2011
TABLE OF CONTENTS
Page No.
ii
3
ITEM 1: PRELIMINARY NOTES
1.1Incorporation of Financial Statements and Proxy Circular
Specifically incorporated by reference and forming a part of this annual information form (the “AIF”) are the audited consolidated financial statements, including the accompanying notes and the auditor’s report, for the Issuer for the period ended December 31, 2010, together with the auditors’ report thereon, and the Management Proxy Circular, dated April 24, 2010, previously filed with the British Columbia, Alberta and Ontario Securities Commissions.
All financial information in this AIF is prepared in accordance with accounting principles generally accepted in Canada (“Canadian GAAP”).
This report contains “forward-looking statements”, including all statements that are not historical facts, and forward looking information within the meaning of the United States Private Securities Litigation Reform Act of 1995 and applicable Canadian Securities legislation. Forward-looking statements include, but are not limited to, statements with respect to the future price of gold, the realization of mineral reserve estimates, the timing and amount of estimated future production, costs of production, capital expenditures, costs and timing of the development of deposits, success of exploration activities, permitting time lines, currency exchange rate fluctuations, requirements for additional capital, government regulation of mining operations, environmental risks, unanticipated reclamation expenses, title disputes or claims and limitations on insurance coverage. Generally, these forward-looking statements can be identified by the use of forward-looking terminology such as “plans”, “expects” or “does not expect”, “is expected”, “budget”, “scheduled”, “estimates”, “forecasts”, “intends”, “anticipates” or “does not anticipate”, or “believes”, or variations of such words and phrases or state that certain actions, events or results “may”, “could”, “would”, “might” or “will be taken”, “occur” or “be achieved”.
With respect to forward-looking statements and the information included in this MD&A, we have made numerous assumptions, including, among other things, assumptions about the price of gold, anticipated costs and expenditures and our ability to achieve our goals, even though our management believes that the assumptions made and the expectations represented by such statements or information will prove to be accurate. By their nature, forward-looking statements and information are based on assumptions and involve known and unknown risks, uncertainties and other factors that may cause our actual results, performance or achievements, or industry results, to be materially different from future results, performance or achievements expressed or implied by such forward-looking information. Such risks, uncertainties and other factors include among other things the following: gold price volatility; discrepancies between actual and estimated production and mineral reserves and resources; the speculative nature of gold exploration; mining operational and development risk; and regulatory risks. See our Annual Information Form for additional information on risks, uncertainties and other factors related.
Although the Company has attempted to identify important factors that could cause actual results to differ materially from those contained in forward-looking statements, there may be other factors that cause results not to be as anticipated, estimated or intended. There can be no assurance that such statements will prove to be accurate, as actual results and future events could differ materially from those anticipated in such statements. Accordingly, readers should not place undue reliance on forward-looking statements. The Company does not undertake to update any forward-looking statements that are incorporated by reference herein, except in accordance with applicable securities laws.
1.2Date of Information
All information in this AIF is as of March 28, 2011 unless otherwise indicated.
4
1.3Glossary of Abbreviations and Terms
Certain abbreviations and terms used throughout this Annual Information Form are defined below:
| Abbreviation | Unit or Term | | Abbreviation | Unit or Term |
| A | ampere | | m3 | cubic meter |
| AA | atomic absorption | | mg/l | milligrams/liter |
| Ag | silver | | mm | millimeter |
| Au | gold | | mm2 | square millimeter |
| AuEq | gold equivalent grade | | mm3 | cubic millimeter |
| °C | degrees Centigrade | | NI 43-101 | Canadian National Instrument 43-101 |
| cm | centimeter | | OSC | Ontario Securities Commission |
| cm2 | square centimeter | | oz | troy ounce |
| cm3 | cubic centimeter | | % | percent |
| cfm | cubic feet per minute | | ppb | parts per billion |
| ° | degree (degrees) | | ppm | parts per million |
| dia. | diameter | | QA/QC | Quality Assurance/Quality Control |
| ft | foot (feet) | | RC | rotary circulation drilling |
| g | gram | | RQD | Rock Quality Description |
| gal | gallon | | SEC | U.S. Securities & Exchange Commission |
| gpm | gallons per minute | | s | second |
| g/t | grams per tonne | | SG | specific gravity |
| ha | hectares | | st | short ton (2,000 pounds) |
| hp | horsepower | | t | tonne (metric ton) (2,204.6 pounds) |
| kg | kilograms | | tph | tonnes per hour |
| km | kilometer | | tpd | tonnes per day |
| km2 | square kilometer | | tpy | tonnes per year |
| koz | thousand troy ounce | | TSF | tailings storage facility |
| kt | thousand tonnes | | µ | micron or microns |
| l | liter | | V | volts |
| lb | pound | | W | watt |
| LoM | Life-of-Mine | | yr | year |
| lps | liters per second | | | |
| m | meter | | | |
| m2 | square meter | | | |
| Term | Meaning |
| Assay: | The chemical analysis of mineral samples to determine the metal content |
| Capital Expenditure: | All other expenditures that are not classified as operating costs. |
| Composite: | Combining more than one sample result to give an average result over a larger distance or area. |
| Concentrate: | A metal-rich product resulting from a mineral enrichment process such as gravity concentration or flotation, in which most of the desired mineral has been separated from the waste material in the ore. |
| Crushing: | Initial process of reducing ore particle size to render it more amenable for further processing. |
| Cutoff Grade (CoG): | The grade of mineralized rock, which determines whether or not it is economic to recover its gold content by further concentration. |
| Dilution: | Waste, which is unavoidably mined with ore. |
5
| Term | Meaning |
| Dip: | Angle of inclination of a geological feature/rock from the horizontal. |
| Fault: | The surface of a fracture along which movement has occurred. |
| Footwall: | The underlying side of an orebody or stope. |
| Gangue: | Non-valuable components of the ore. |
| Grade: | The measure of concentration of gold within mineralized rock. |
| Haulage: | A horizontal underground excavation which is used to transport mined ore. |
| Igneous: | Primary crystalline rock formed by the solidification of magma. |
| Kriging: | An interpolation method of assigning values from samples to blocks that minimizes the estimation error. |
| Level: | Horizontal tunnel the primary purpose of which is the transportation of personnel and materials. |
| Lithological: | Geological description pertaining to different rock types. |
| LoM Plans: | Life-of-Mine plans. |
| Material Properties: | Mine properties. |
| Milling: | A general term used to describe the process in which the ore is crushed and ground and subjected to physical or chemical treatment to extract the valuable metals to a concentrate or finished product. |
| Mineral/MiningLease: | A lease area for which mineral rights are held. |
| Mining Assets: | The Material Properties and Significant Exploration Properties. |
| Ongoing Capital: | Capital estimates of a routine nature, which is necessary for sustaining operations. |
| Ore Reserve: | That part of a mineral resource that is considered economic in terms of tonnage and grade following an appropriately detailed study at given commodities prices. |
| Pillar: | Rock left behind to help support the excavations in an underground mine. |
| Sedimentary: | Pertaining to rocks formed by the accumulation of sediments, formed by the erosion of other rocks. |
| Sill: | A thin, tabular, horizontal to sub-horizontal body of igneous rock formed by the injection of magma into planar zones of weakness. |
| Stope: | Underground void created by mining. |
| Stratigraphy: | The study of stratified rocks in terms of time and space. |
| Strike: | Direction of line formed by the intersection of strata surfaces with the horizontal plane, always perpendicular to the dip direction. |
| Sulfide: | A sulfur bearing mineral. |
| Tailings: | Finely ground waste rock from which valuable minerals or metals have been extracted. |
| Thickening: | The process of concentrating solid particles in suspension. |
| Total Expenditure: | All expenditures including those of an operating and capital nature. |
| Variogram: | A statistical representation of the characteristics (usually grade). |
6
1.4Conversion Table
In this AIF a combination of Imperial and metric measures are used with respect to mineral properties located in North America. Conversion rates from Imperial measure to metric and from metric to Imperial are provided below:
| Imperial Measure | = | Metric Unit | Metric Measure | = | Imperial Unit |
| 2.47 acres | | 1 hectare | 0.4047 hectares | | 1 acre |
| 3.28 feet | | 1 metre | 0.3048 metres | | 1 foot |
| 0.62 miles | | 1 kilometre | 1.609 kilometres | | 1 mile |
| 0.032 ounces (troy) | | 1 gram | 31.1 grams | | 1 ounce (troy) |
| 1.102 tons (short) | | 1 tonne | 0.907 tonnes | | 1 ton |
| 0.029 ounces (troy)/ton | | 1 gram/tonne | 34.28 grams/tonne | | 1 ounce (troy/ton) |
1.5Currency
Unless otherwise indicated, all dollar amounts are in Canadian dollars.
1.6Share Capital
On January 5, 2004 the Issuer consolidated its Common Share capital on the basis of one post-consolidated share for five pre-consolidated Shares. Unless otherwise expressed, all references in this Annual Information Form are to post-consolidated Shares.
ITEM 2: CORPORATE STRUCTURE
2.1Name, Address and Incorporation
The full corporate name of the issuer is Yukon-Nevada Gold Corp. (the “Issuer”).
| The address of the head office is: | #900, 688 West Hastings Street |
| | Vancouver, BC, V6B 1P1 |
| | |
| and the address of the registered office is: | #1040, 999 West Hastings Street |
| | Vancouver, B.C. V6C 2W2 |
The Issuer was incorporated under the laws of the Province of British Columbia under the name “YGC Resources Ltd.” (“YGC”) on May 30, 1988. On January 25, 2002, the Issuer was struck from the Register of Companies for British Columbia and dissolved. The Issuer was restored to the Register on August 1, 2003. On January 5, 2004 the Issuer consolidated its share capital on a five (5) old for one (1) new basis and increased its authorized share capital from 4,000,000 Shares without par value to 100,000,000 Shares without par value. On June 23, 2005, the Issuer increased its authorized share capital from 100,000,000 Shares without par value to an unlimited number of Shares without par value.
By Combination Agreement dated March 16, 2007 with Queenstake Resources Ltd. (“Queenstake”), the Issuer entered into an Arrangement with Queenstake, providing for, among other things, the acquisition by the Issuer of all of the issued and outstanding shares of Queenstake. The Arrangement closed on June 20, 2007, at which time the Issuer changed its name to its current name.
7
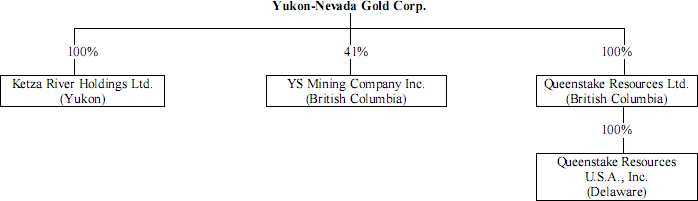
2.2Intercorporate Relationships
Set forth below are the names of the Issuer’s subsidiaries:
ITEM 3: GENERAL DEVELOPMENT OF THE BUSINESS
The Shares of the Issuer were called for trading on the Toronto Stock Exchange (the “TSX”) on April 13, 2005. The Issuer is active in the evaluation, development and commercial production of mineral properties. The Issuer’s principal assets are the Jerritt Canyon Gold Mine, Nevada and the Ketza River Property, Yukon Territory. The favourable price for gold has enabled the Issuer to raise equity financing, the proceeds of which are used to fund improvements to the Jerritt Canyon concentrator facilities and exploration of the Ketza River Property.
3.1Three-Year History
The principal business of the Issuer is the production of gold in Nevada and the acquisition, exploration and development of mineral properties of merit with a particular focus on gold, silver, zinc and copper properties in the Yukon Territory and British Columbia in Canada and in Arizona and Nevada in the United States.
The Issuer acquired the Jerritt Canyon gold mine upon completion of its plan of arrangement with Queenstake on June 20, 2007. On May 30, 2003, Queenstake entered into a definitive asset purchase and sale agreement with subsidiaries of AngloGold Limited and Meridian Gold Inc. (collectively, the “Sellers”) pursuant to which Queenstake agreed to acquire the Sellers’ respective 70% and 30% interests in the assets comprising the operating Jerritt Canyon gold mine. The acquisition closed on June 30, 2003.
Jerritt Canyon is a gold property with two underground mines, ore stockpiles and a 1.5 million ton per year capacity processing plant. In addition, the approximately 119 square miles that comprise the Jerritt Canyon property offer a significant number of advanced, early stage and district-scale exploration targets and potential to expand the currently defined mineral reserves and resources proximal to the producing mines.
The Issuer has owned the Ketza River Gold Property in the Yukon, since 1994. This former producing mine was shut down in November 1990, due to the depletion of known oxide ore reserves identified at that time. The Ketza River Gold Property includes 593 mineral claims and leases, a gold mill and all associated chattels, tools, equipment and licences. The Issuer’s Chief Operating Officer, Mr. Dickson, who is also a chemist and a professional mining consultant, identified areas which were under-explored and which could be mined and processed by different methods than those employed in the past. In particular, he identified the possibility of discovering significant quantities of sulphide ore. The Issuer has completed diamond drilling that resulted in the discovery of the Chimney and Fork zones and geologic mapping, prospecting, sampling and diamond drilling on the Shamrock zone. The Issuer has also carried out an aggressive diamond drill program in an effort to increase mineral resources, to prepare a feasibility study and, if the results of the feasibility study are positive, to return the Ketza Property to commercial production as a mine. An updated reserve report is expected in 2011 that will show the results of extensive metallurgical work and additional exploration drilling. Currently the Issuer is focusing is on completing the application to the Yukon Environmental and Socio-economic Assessment Board (YESAB) to approve the Issuer’s development plan and allow for the commencement of mining activity at the property.
8
Year ending December 31, 2008
On February 1, 2008 the Issuer’s Board of Directors approved the appointment of David Drips, B.Sc. Mining Engineering, as its new Vice President Mining. The Issuer also promoted Sam Ash, B.Sc. Mining Engineering, to Manager of New Operations.
The Issuer’s Jerritt Canyon Mine operated continuously from the date of acquisition on June 20, 2007 until February 22, 2008 when it shut down to address infrastructure and safety concerns. In May 2008, Jerritt Canyon recommenced commercial production at reduced levels. On August 8, 2008 mining at Jerritt Canyon ceased again as a result of increasing costs and dilution resulting from the mine plan as well as the ongoing required development and infrastructure expenditures resulting from years of neglect. Subsequent to the closure of the mines, as a result of a dirty air fan that was damaged in the following week, the milling operation was also shutdown. Mining and milling operations did not resume for the remainder of 2008 while management pursued additional financing and continued work on addressing environmental concerns raised by the Nevada Division of Environmental Protection (the “NDEP”) in their stop order issued in March of 2008.
On May 12, 2008 the Issuer closed a non-brokered private placement of 10,050,000 Flow-Through Shares (the “FT Shares”) at a price of $2.00 per FT Share for gross proceeds of $20,100,000. No commission was paid.
At the Issuer’s 2008 Annual General Meeting held May 27, 2008, Graham Dickson, Peter Holbek, John R.W. Fox, Neil J.F. Steenberg, E. Lynn Patterson, R.J. (Don) MacDonald, Iain Harris and Robert Chafee were re-elected to the Issuer’s Board of Directors. Peter Bojtos and Dorian Nicol ceased to be directors on May 27, 2008.
On July 2, 2008 Dorian L. Nicol resigned as the Issuer’s Vice President of Exploration. On August 14, 2008 Christopher Oxner resigned as the Issuer’s Chief Financial Officer and on August 15, 2008 David Dripps resigned as the Issuer’s Vice President of Mining.
On July 27, 2008 the Issuer issued 250,000 Warrants which are exercisable at a price of $3.00 per share on or before June 20, 2012.
On November 1, 2008 Shaun Heinrichs was appointed the Issuer’s Chief Financial Officer.
On December 12, 2008 E. Lynn Patterson resigned as the Chairman and a Director of the Issuer.
On December 18, 2008 the Issuer closed a non-brokered private placement of 79,800,000 units (the “Units”) at a price of $0.05 per unit, each Unit comprising one common share (a “Share”), one series “A” share purchase warrant (the ““A” Warrant”), each “A” Warrant entitling the holder to purchase one additional share at a price of $0.07 for a period of 12 months from the closing and one series “B” share purchase warrant (the ““B” Warrant”), each “B” Warrant entitling the holder to purchase one additional share at a price of $0.09 for a period of 18 months from the closing for gross proceeds of 3,990,000. A commission of 7,400,000 Units were issued.
Year Ending December 31, 2009
On February 24, 2009 the Issuer closed a non-brokered private placement of 10,000,000 units (the “Units”) at a price of $0.05 per unit, each Unit comprising one common share (a “Share”), one series “A” share purchase warrant (“A” Warrant”), each “A” Warrant entitling the holder to purchase one additional share at a price of $0.07 for a period of 12 months from the closing and one series “B” share purchase warrant (“B” Warrant”), each “B” Warrant entitling the holder to purchase one additional share at a price of $0.09 for a period of 18 months from the closing for gross proceeds of 3,990,000. A commission of 1,000,000 Shares and 1,000,000 “A” Warrants were issued.
9
On February 25, 2009, the Issuer closed a non-brokered private placement of 17,333,333 Units (the “Units”) at a price of $0.06 per Unit, each Unit comprising one common share (a “Share”) and one share purchase warrant (the “Warrant”), each Warrant entitling the holder to purchase one additional share at a price of $0.08 for a period of 24 months from the closing. A commission of 400,000 Units were issued.
Milling operations at the Issuer’s Jerritt Canyon Mine resumed March 25, 2009 when approvals were received from NDEP on the progress and plans developed by the Issuer.
On April 12, 2009 Robert F. Baldock was appointed to the Issuer’s Board of Directors.
On April 24, 2009 the Issuer closed a non-brokered private placement of 12,000,000 Unit (the “Units”) at a price of $0.06 per Unit, each Unit comprising one common share (a “Share”) and one share purchase warrant (the “Warrant”), each Warrant entitling the holder to purchase one additional share at a price of $0.08 for a period of 24 months from the closing. A commission of 400,000 Units were issued.
At an Annual General Meeting of the Issuer held on May 21, 2009, Graham Dickson, Robert F. Baldock, Peter Holbek, John R.W. Fox, Neil J.F. Steenberg, R.J. (Don) MacDonald, Iain Harris and Robert Chafee were elected to the Issuer’s Board of Directors. Mr. Dickson concurrently resigned as the Issuer’s President and Chief Executive Officer and was appointed the Issuer’s Chief Operating Officer and Robert F. Baldock was appointed the Issuer’s President and Chief Executive Officer. Mr. Iain Harris resigned as a director on May 21, 2009.
On May 30, 2009, Jerritt Canyon shutdown roaster operations due to a delay in the fabrication of certain fiberglass ductwork required in the construction of the new mercury emission control system, resulting in the failure to meet the deadline for this equipment to be installed as set by the NDEP in their March restart order. The Issuer was able to complete the installation of a calomel emission system and the system instrumentation on July 20, 2009.
On June 12, 2009 R.J. (Don) MacDonald resigned as a director of the Issuer and on August 1, 2009 Neil J.F. Steenberg and Peter Holbek resigned as directors of the Issuer and Terry Eisenman, Symeon Solomonidis and Jean-Edgar de Trentinian were appointed to the Issuer’s Board of Directors.
On August 6 and 28, 2009 the Issuer closed two tranches of a non-brokered private placement of an aggregate of 41,050,000 Units at a price of $0.10 per unit, each unit comprising one common share (a “Share”) and one share purchase warrant (the “Warrant”), each Warrant entitling the holder to purchase one additional share at a price of $0.125 for a period of 30 months from the closing. No commission was paid.
On December 1, 2009, the Issuer closed a non-brokered private placement of 10,000,000 Units at a price of $0.10 per unit, each unit comprising one common share (a “Share”) and one share purchase warrant (the “Warrant”), each Warrant entitling the holder to purchase one additional share at a price of $0.125 for a period of 18 months from the closing. No commission was paid.
After coming to an agreement with the NDEP in the form of a Consent Decree, the Issuer resumed operations on October 20, 2009. The Consent Decree resolves all of the compliance concerns of the NDEP in relation to the mill and surrounding land holdings of the Issuer, as well as related environmental concerns and gives the Issuer the right to operate the milling facility from the effective date.
10
The Issuer incurred exploration expenditures of approximately US $15 million on the Ketza River project and approximately US $1.2 million on the Silver Valley property. Both of these properties are located in the Yukon.
Year Ending December 31, 2010
At the Issuer’s Special Meeting held January 12, 2010, shareholders approved the issuance of Inducement Warrants to holders of existing warrants who elected to exercise their warrants prior to their expiration date. The Issuer issued 170,400,000 warrants exercisable at a price of $0.32 per share, 10,250,000 warrants exercisable at a price of $0.26 per share and 10,000,000 warrants exercisable at a price of $0.128 per share. All of the warrants expire January 12, 2012.
On April 1, 2010 the Issuer’s Board of Directors approved the appointment of Todd W. Johnson as its Vice President of Exploration.
At the Issuer’s 2010 Annual General Meeting held May 13, 2010 Graham Dickson, Robert F. Baldock, Pierre Besuchet, Jay Schnyder, John Greenslade, Symeon Solomonidis, Jean-Edgar de Trentinian and Gerald Ruth were appointed to the Board of Directors. Robert Chafee, Terry Eisenman and John Fox resigned as directors and John Greenslade was also appointed the Issuer’s Chairman.
On July 2, 2010 François Marland was appointed to the Issuer’s Board of Directors and was appointed the Issuer’s Vice Chairman.
In March 26, 2010 the Issuer closed a non-brokered private placement of 22,727,272 Shares (the “Shares”) at $0.22 per Share for gross proceeds of $5,000,000. There was no commission paid.
On May 6 and 12, 2010, the Issuer closed two tranches of a brokered private placement of 34,559,090 Flow-Through Shares (the “FT Shares”) at a price of $0.275 per FT Share for gross proceeds of $9,503,750. A commission was paid on a portion of the private placement of 7.5% cash and 700,000 warrants exercisable at a price of $0.275 per share on or before May 12, 2012.
On August 13, 2010 the Issuer closed a Senior Secured Note financing, issuing US$25,000,000 principal amount senior secured notes (the “Notes”) and 25,000,000 common share purchase warrants (the “Warrants”), raising gross proceeds of US$25,000,000. Each Warrant entitles the holder to purchase one common share of the Issuer at a price of $0.40 per share for a period of three years following closing. The Notes have a maturity date of December 31, 2012 and are secured by a charge over all the assets of the Issuer’s wholly owned subsidiaries, Queenstake Resources Ltd. (“QRL”) and Queenstake Resources U.S.A. Inc. (“Queenstake US”) as well as a share pledge over all shares in QRL and Queenstake US. A commission of 4% of the gross proceeds raised was paid in Shares of the Issuer.
By Agreement dated October 25, 2010, the Issuer entered into an ore purchase agreement with Newmont USA Limited whereby the Issuer will accept delivery of approximately 2,000 tons of gold bearing ore per day from several of Newmont's mines in Nevada.
On October 27, 2010 KPMG LLP resigned as the Issuer’s auditor and Deloitte & Touche LLP was appointed as the Issuer’s successor auditor.
Jerritt Canyon: For the first time since the second quarter of 2008, the Issuer re-opened the Smith Mine using a contract mining company, Small Mine Developers, in the first quarter of 2010. The Issuer began processing the ore in late February 2010.
11
In May 2010, the Issuer shutdown the mill at Jerritt Canyon in order to carry out a significant overhaul of key mill components for compliance with the Consent Decree and as well performed critical maintenance that had been identified subsequent to restart in 2009. During the shutdown, the Issuer replaced one quench tank completely, began upgrade work on the roaster control system, drained and relined the thickener tank, and refurbished the north tertiary cone crusher. After restarting operations it was determined that the cone crusher needed to be replaced entirely, with a new crusher being installed and put into operation in late July. This replacement subsequently resulted in an improvement in the production rates and the Issuer achieved steady state of operations during the third quarter.
In the fourth quarter of 2010 the Issuer successfully negotiated a trial three month contract with Newmont for the delivery of 2,000 tons of gold bearing ore per day commencing October 30, 2010. During the quarter the Issuer purchased 86,257 tons of ore from Newmont under this contract containing 16,905 ounces, at an average cost of $198.53 per dry ton. Due to the success of this initial contract, Newmont is continuing to deliver at a rate of 1,000 tons per day in 2011 while finalizing a longer term contract.
At the beginning of 2010 the Issuer prepared a capital budget that included significant expenditures for the commencement of the construction of a second tailings facility (construction to be completed in 2011), completion of several Consent Decree requirements, and also the winterization of and improvements to the mill facility. This winterization would be achieved by installing heat tracing materials on all piping, housing key areas of the crushing circuit (such as fine crushing), construction of an improved ore dryer which would also be protected from the weather, and increasing the level of materials and supplies on hand to reduce the down time caused by a lack of spare parts. In the second quarter the Issuer made significant progress in completing this capital budget but required additional funding to complete a large portion of the required work. To finance this budget the Issuer negotiated with several lenders during the year but was unable to obtain debt financing until late in the third quarter of 2010. Due to the timing of closing this financing and also the requirement to settle outstanding claims against the Issuer to clear title to the property, a substantial portion of the winterization project was not completed and the Issuer was forced to delay commencement of contruction of the second tailings facility. As well, due to the early onset of severe weather certain Consent Decree projects such as the reclamation of one of the off-take ponds (referred to as the Duck Pond) and the construction of a water treatment facility for acid rock clean up were not completed by their scheduled time.
The delay in these capital investments impacted the milling operations of the Issuer and the corresponding financial results for most of 2010. As a result of being unable to complete the full winterization project and restock materials and supplies to higher levels prior to the onset of severe winter conditions, the operations at Jerritt Canyon experienced significant downtime as sections of the mill, primarily fine crushing and the refinery (where the heat tracing work was not completed prior to winter), were exposed to severe cold and snow resulting in additional strain on equipment, breakdowns, and clogged chutes (due to the freezing of wet ore). This problem was aggravated by the need to freight in necessary parts to complete repair work due to the lack of in house inventories. The delays in completing key environmental projects required by the Consent Decree also resulted in the NDEP levying a significant fine against the Issuer ($0.8 million) late in the fourth quarter. As a result of these issues and resulting low throughput the Issuer continues to experience higher than normal production costs that will need further investment to correct in 2011.
Ketza River: During 2010, a total of 86 exploration diamond drill holes were completed at the Ketza River Project in the Yukon Territory, Canada. This Ketza River drill program tested 11 target areas and consisted of both step-out drilling from existing resources and the testing of new geochemical and geophysical targets. The drilling program contained a Quality Assurance and Quality Control (QA/QC) program including the insertion of certified gold standards and blanks as defined in the previously published Year-end 2007 NI 43-101 report.
12
| Target | Drill Holes Completed | Total Meters | Total Footage |
| Bluff Zone | 8 | 782 | 2,566 |
| QB Deep IP | 3 | 1,601 | 5,251 |
| Vertical Vein | 7 | 1,181 | 3,876 |
| Connector Zone | 10 | 1,755 | 5,758 |
| Break Zone | 11 | 2,297 | 7,537 |
| B-Mag Zone | 14 | 996 | 3,268 |
| Peel Zone | 7 | 771 | 2,529 |
| Hoodoo Zone | 9 | 1,456 | 4,778 |
| Fred’s Vein | 3 | 500 | 1,642 |
| Penguin | 13 | 2,101 | 6,892 |
| Peel Creek Gravity | 1 | 174 | 572 |
| Total | 86 | 13,614 | 44,670 |
Following up on the successful 2008 drill hole intercepts, a series of 2010 step out drill holes were completed in the Bluff Zone which is located in between the Peel and Lab resource zones. Strong gold mineralization was encountered in some of the 2010 drill holes; however, this phase of drilling defined the bottom of the mineralized zone. The QB Zone – Deep Induced Polarization (IP) target was generated from a Titan-24 survey conducted in August of 2009. The survey identified an extensive zone of anomalous chargeability and conductivity located greater than 700 meters below the surface and beneath the drilled QB Zone resource. The Issuer completed several drill holes that successfully penetrated the geophysical anomaly and indicated strong anomalous gold throughout much of its length.
A series of 11 drill holes were completed in the Break Zone in the Peel resource that tested a magnetic anomaly caused by sulfide minerals lying below the existing oxide resource. All but two of the drill holes intersected significant gold mineralization but only from the oxide-rich material.
A total of fourteen step-out drill holes were completed in the southeastern margin of the B-Mag Zone located in the east side of the Peel resource. These drill holes were successful in extending gold mineralization by 15 to 33 meters laterally to the southeast from the existing resource.
Nine exploration drill holes were targeted as infill holes and local mineralization extensions in the planned high wall of the Lab-Hoodoo open-pit near the top of the ridge. Three fans of three drill holes each tested above, below and to either side of the 2008 drill holes which contained 9.14 meters averaging 32.98 g/t Au. All of the 2010 drill holes in this zone contained strong oxide mineralization. Assay result highlights in this zone include drill holes which intercepted 9.14 meters averaging 37.37 g/t Au, 1.43 m averaging 15.64 g/t Au, and a third which intercepted 2.30 meters averaging 17.60 g/t Au. Cross sections suggest that these drill hole assay intersections approximate true thickness.
A total of 13 drill holes were completed in 2010 at the Penguin Zone. Six of the drill holes tested Very Low Frequency (VLF) geophysical and soil anomalies that were coincident with a zone of massive pyrite and arsenopyrite boulders on the surface. Some of these drill holes contained significant gold mineralization. Seven of the other drill holes in this zone tested three strong magnetic high anomalies. Some of these drill holes encountered several significant gold intercepts containing massive pyrrhotite and pyrite.
Other exploration targets such as Fred’s Vein and the Peel gravity anomaly were also drill tested in 2010 with some indication of gold mineralization but no significant assay intersections.
Several inlying claims located within the large Ketza River property were purchased in the summer of 2010 and helped consolidate the ownership into one contiguous block owned or leased by Ketza River Holdings. The Issuer is pursuing other opportunities to extend the claim block at Ketza River.
13
Geophysical and Geochemical Surveys
As noted in the table below (results shown in kilometers, except for soil sampling which shows number of samples) four areas were targeted in 2010 for geophysical and soil exploration: the Shamrock, South Hill target, OK target, and lower tailings option site. The 2010 geophysical studies included Induced Polarization (IP) and ground magnetics.
| Target | South Hill | Shamrock | OK Target | Lower Tailings Site | Total |
| Technique | | | | | |
| Ground Magnetics | 71 | 45.1 | 71 | 41.1 | 157.2 |
| IP | 6.8 | | 36.9 | | 41.3 |
| Line Cutting | | | 34.5 | | 34.5 |
| Soil Sampling | 814 | | | | 814 |
The results of this work will be used to help target a good portion of the 2011 Ketza River drill hole program. The north side of Shamrock, the South Hill Target and the proposed tailings site were covered by a ground magnetic survey which identified numerous strong anomalies and helped refine targets north of the Shamrock Zone. Two Induced Polarization (IP) lines were conducted across the South Hill Target to investigate the possible presence of mineralized pyrite-bearing manto zones that do not have enough pyrrhotite to generate a magnetic anomaly. The 2010 IP survey results were successful at identifying a number of potential sulfide-bearing and mineralized zones.
Drill Hole Database and Resource Modeling
Significant work on the Ketza drill hole database was conducted in 2010 to help support an updated resource estimate. Drill hole assay data were reviewed, database software was upgraded, and assay importing routines were optimized during 2010. An extensive update process was completed as well to integrate all assays for historical drill holes (assays from 1985 to 1997 were digitally compiled from the paper drill hole files). Primary lab assay data for these early drill hole years were selected and methodically entered into the drill hole database and used for the revised 2010 resource model calculation. An updated resource calculation for the Ketza River project is currently in progress and targeted for completion in 2011 which will incorporate all of the previous years drilling information and will include a summary of the metallurgy testing program conducted in 2008. This resource estimate will form the basis of the mine design for the Project Proposal that has a targeted submission date to the Yukon Environmental and Socio-economic Assessment Board (YESAB) of August 2011.
2010 YESAB Project Proposal Work Summary
A number of studies relating to YESAB Project Proposal were continued in 2010. A third party engineering firm is handling the completion of this application with a targeted submission date in the third quarter of 2011.
In support of the project proposal a total of 1,233 meters of geotechnical and hydrogeology drilling (see table below) was conducted for the pit-wall stability program. The results of this drilling was combined with the geotechnical drilling information gathered in 2008 to help support pit-wall slope recommendations for the proposed mine design. Two draft geotechnical reports, one on the manto zone deposits and one on the Shamrock zone deposits, were completed for in-house review in December 2010. A few of these 2010 geotechnical drill holes contained significant assay intervals (e.g. a drill hole in Tarn intersected 6.21 m averaging 2.24 g/t Au).
| Area | Drill Holes Completed | Total Meters | Total Footage |
| Peel Zone Geotechnical | 3 | 524 | 1,721 |
| Penguin Zone Geotechnical | 1 | 77 | 252 |
| Tarn Zone Geotechnical | 2 | 145 | 476 |
| Tarn Zone Hydrogeology | 1 | 72 | 236 |
| 3-M Zone Geotechnical | 1 | 103 | 337 |
| Gully Vein Geotechnical | 2 | 312 | 1,024 |
| Total Geotechnical - Open Pits | 10 | 1,233 | 4,046 |
14
A total of 32 drill holes were also completed in and around the footprint of the proposed lower tailings site to help support the YESAB project proposal. Sixteen were diamond drill holes that targeted magnetic anomalies and were designed for either exploration or condemnation purposes. All of these drill holes were logged for geotechnical data and some were used to gather hydrogeology information to help support engineering design studies. Fourteen of the drill holes were completed with a Becker drill and diamond drill core at depth to gather geotechnical information. Some of these drill holes were completed as groundwater monitoring wells. Two additional monitoring wells were installed at the toe berm of the existing tailings dam as requested by the Yukon Water Board.
Various other YESAB work was completed during the year including a site water quality control and assurance program, compilation of hydrogeology data compilation and analysis, Socio-economic, wildlife, fish and aquatic studies, tailings design and tradeoff studies, and conceptual engineering and design studies. Several meetings with local communities (Ross River and Faro) and local First Nations (Ross River Dena and Teslin) were held in November and December to update everyone on the Issuer’s proposed Ketza River Mine Project; additional meetings also took place in early 2011 at Teslin. Numerous meetings were also held with the Water Board, YESAA, Water Resources, and Energy, Mines and Resources to help advance the progress for the YESAB Project Proposal and the water license application for the existing tailings pond.
Silver Valley: A total of 7 diamond drill holes were conducted at the Silver Valley project in 2010.
| Target | Drill Holes Completed | Total Meters | Total Footage |
| River’s Edge | 5 | 817 | 2,680 |
| K-18B South | 2 | 428 | 1,404 |
| Total | 7 | 1,245 | 4,084 |
The 2010 drill holes tested two horizontal-loop electromagnetic (HLEM) geophysical anomalies identified during the 2007 field season. Five drill holes were completed at the River’s Edge target which identified three sub-parallel quartz-siderite-pyrite veins with minor amounts of galena and tetrahedrite. Two other 2010 drill holes tested the north end of the K-18B South target which is a possible fault offset of the K-18B Vein resource that was drilled in 2007. The two 2010 drill holes intersected two pyrite-dominant veins approximately 3 meters in width containing minor galena, sphalerite, stibnite, and tetrahedrite.
YS Mining Company: During 2009, the Issuer, in conjunction with the joint venture partner, Northwest Mining and Geology Group Co., Ltd. for Nonferrous Minerals (“NWME”) performed geological and geophysical work at the Skukum property owned by Tagish Lake Gold (“Tagish”) (see Related Party Transaction section) as part of the ongoing due diligence for a possible merger. In September of 2009, the Amalgamation Agreement was terminated and Yukon-Shaanxi Mining Company (”YSM”), through negotiations with MacQuarie Bank Limited, acquired a credit agreement from MacQuarie Bank with Tagish for total payment of C$1.5 million, secured by the Skukum property. This was funded through an additional equity contribution from NWME of C$1 million and cash from treasury. The Issuer did not participate in this equity contribution and as a result diluted its economic interest from 50% to 37.5% at December 31, 2009. The Issuer continues to have the option to purchase further shares in order to regain its 50% interest.
In April 2010, the joint venture received additional contributions of C$2 million, C$1 million of which was on behalf of the Issuer, and resulted in an increase in its ownership percentage from 37.5% to 41.67% . These funds were used to invest in the shares of Tagish Lake and fund exploration work on the Skukum property. Due to the poor working capital conditions of Tagish Lake and actions taken by other creditors, Tagish Lake was placed into Companies Creditors’ Arrangement Act (“CCAA”), utilizing the proceeds provided from the investment by YSM. During the CCAA process a takeover bid was received from New Pacific Metals Ltd. (“NUX”) for the shares of Tagish Lake which included full payout of any debts. Although the joint venture provided a competing takeover offer and funds were transferred from NWME to support the offer, insufficient shares were tendered to this competing offer to reach the required level of ownership and the majority of the shares were tendered to an improved offer made subsequently by NUX. Both joint venture partners had set a specific fair market value for the Tagish Lake property and the bid was based on these estimates, so an improved offer was not made. Subsequent to the successful take over by NUX, in October 2010 Tagish Lake completed a plan of arrangement under the CCAA with a loan from NUX and the joint venture has recovered all funds that were loaned to Tagish Lake with applicable interest. The joint venture will pursue other opportunities to explore and develop resources in the Yukon.
15
Events Subsequent to December 31, 2010
On March 2, 2011, the Issuer completed a $7.1 million non-brokered flow-through private placement for 8,334,882 flow-through shares (the “FT Shares”) at $0.85 per FT Share. The proceeds of this placement will be for used for new resource exploration at Ketza River at new targets as well as at the Silver Valley property.
At a Special Meeting of the Issuer held March 8, 2011, shareholders approved the temporary reduction of the exercise price of eight series of unlisted warrants issued between April 2009 and August 2010 by approximately 18%. The holders of the warrants have 30 days from March 14, 2011 to exercise their warrants. After 30 days, the exercise prices of the warrants will revert to their original respective exercise prices. The original prices ranged from $0.08 to $0.40 per share and the reduced prices range from $0.07 to $0.33 per share. There are an aggregate of 235,823,053 warrants eligible to be exercised at the reduced rate.
3.2Significant Acquisitions
The Issuer did not complete a significant acquisition in 2010.
ITEM 4: DESCRIPTION OF THE BUSINESS
4.1General
The principal businesses of the Issuer are the continued mining of the Jerritt Canyon gold mine in Nevada, as well as the acquisition, exploration and development of natural resource properties with a particular focus on the Ketza River and Silver Valley Properties in the Yukon Territory.
Jerritt Canyon is an operating gold complex with two producing underground mines, ore stockpiles and a 1.5 million ton per year capacity processing plant. In addition, the approximately 119 square miles that comprise the Jerritt Canyon property offer a significant number of advanced, early stage and district-scale exploration targets and potential to expand the currently defined mineral reserves and resources proximal to the producing mines. The Issuer intends to seek and acquire additional near production stage properties worthy of development and within economic trucking distance of the Jerritt Canyon mill.
Summary
The Issuer is engaged in the acquisition, exploration, development and operation of precious metal properties. The Issuer continues to investigate and negotiate the acquisition of additional precious metal mining properties or interests in such properties in order to increase the reserve life. There is no assurance that any such investigations or negotiations will result in the completion of an acquisition.
Production and Services
The Issuer’s principal product is gold, with gold production forming the primary source of revenues. There is a global gold market into which the Issuer can sell gold and, as a result, the Issuer is not dependent on a particular purchaser with regard to the sale of the gold that it produces.
16
Specialized Skill and Knowledge
In order to carry on exploration, mining and milling activities the Issuer draws on the expertise of various personnel including geologists, engineers, and metallurgists.
Competitive Conditions
The precious metal mineral exploration and mining business is a competitive business. The Issuer must compete with numerous other companies and individuals in the search for and the acquisition of attractive precious metal mineral properties, especially in the current market. The ability of the Issuer to acquire precious metal mineral properties in the future will depend not only on its ability to develop its present properties and provide necessary ore to the current facilities, but also on its ability to select and acquire suitable producing properties or prospects for precious metal development or mineral exploration.
Economic Dependence
Not applicable to the Issuer.
Changes to Contracts
Not applicable to the Issuer.
Environmental Protection
The Jerritt Canyon facilities have been designed to mitigate environmental impacts. The operations have processes, procedures or facilities in place to manage substances that have the potential to be harmful to the environment. In order to prevent and control spills and protect water quality, the mine utilizes multiple levels of spill containment procedures and routine inspection and monitoring of its facilities. The mine has installed air pollution control devices on its facilities that exceeds the minimum requirements significantly and, in the case of mercury emissions, has set the new standard for the state of Nevada. The mine also has various programs to reuse and conserve water at its operations.
In 2009 the Issuer reached an agreement with the Nevada Division of Environmental Protection (“NDEP”) in the form of a Consent Decree issued by the Attorney General of the State of Nevada, representing the NDEP. The Consent Decree resolved all of the environmental compliance concerns of the NDEP in relation to the Jerritt Canyon mill and surrounding land holdings, as well as related environmental concerns, and gives the Issuer the right to operate the Jerritt Canyon milling facility from the effective date. The Consent Decree records and agrees both parties to the terms of an environmental work program and includes penalties for not completing these work programs. The Issuer is carrying out significant work programs under the Consent Decree, including the following key projects to be completed in 2010:
For 2011 the Issuer has budgeted significant environmental expenditures (approximately $63.4 million) in order to not only meet the requirements of the Consent Decree but also to meet commitments made to the state to improve the compliance of the operations. Although significant progress has been made on the containment of mercury emissions at the facility, the Issuer must make significant investments in the management of fluids in order to ensure the long term viability of the project and increase the capacity of the mill. One of the most significant projects in 2011 is the construction of a new tailings facility as well as a second water storage facility to facilitate the reclamation of the first tailings pond. The issuer is also planning to perform approximately $3.9 million in restoration projects at the mine site, including the reclamation of the first tailings facility.
17
Employees
As of December 31, 2010, the Issuer had twelve (12) full-time employees at the head office in Vancouver, fourteen (14) full-time employees at the Ketza River location (this number is subject to some seasonality), and approximately 188 employees at the Jerritt Canyon gold mine. The Issuer uses a number of consultants and contractors for a variety of specialized tasks.
Foreign Operations
The Issuers principal operations are within North America.
Bankruptcy and Similar Procedures
As at the date hereof, neither the Issuer, nor its subsidiaries, has been subjected to any bankruptcy, receivership or similar proceedings.
Reorganization
Commencing in December 2003, Graham Dickson, the president of the Issuer, took the initiative in reorganizing the Issuer by restoring it with the Register of Companies and returning the Issuer to good standing as a reporting issuer in the provinces of British Columbia and Alberta. On January 5, 2004, the Issuer’s share capital was consolidated on a five (5) old for one (1) new basis and its authorized share capital was increased from 4,000,000 Shares without par value to 100,000,000 Shares without par value; subsequently the Issuer’s share capital was increased to an unlimited number if Shares without par value. On April 13, 2005, the Issuer’s Shares commenced trading on the TSX. In 2007 the Issuer amalgamated with Queenstake Resources Ltd. by way of a Plan of Arrangement and renamed the Issuer from YGC Resources Ltd. to Yukon-Nevada Gold Corp.
Social or Environmental Policies
The Issuer believes in hiring the majority of the workforce from within the local community at both the Canadian and US properties to the extent possible. The Issuer has a policy of working with environmental agencies as closely as possible to ensure compliance with the ever-evolving environmental regulations.
Jerritt Canyon Property
The Issuer conducts ongoing exploration, mine production, closure, and restoration on the Jerritt Canyon Property. Precious metals production has been conducted continuously on the Jerritt Canyon Property for thirty years and the Issuer is now preparing for a new phase of productive life for the Jerritt Canyon Property. Several major permits have been renewed in the last two years and are being modified further to support ongoing operations while establishing the base for future growth. The Issuer and the NDEP entered into a Consent Decree in October of 2009 to address legacy issues and environmental controls. Several, but not all, modifications to operations are parts of that Consent Decree (CD). The Issuer has also responded to information requests from the United States Environmental Protection Agency (USEPA) on two issues described later in this section.
The Nevada mining permit which regulates water pollution control was renewed in June of 2009 for five years. In December of 2010 the Issuer submitted an application for a major modification to this permit to allow the construction of a new tailings storage facility (TSF2) that included another full update. This new TSF2 will replace the current tailings storage facility (TSF1) first constructed in 1981 and last modified in 1998 which is nearing capacity. The second tailings facility is anticipated to provide six years of storage at planned production rates. All current and planned mining operations have been incorporated into this permit.
18
An application to renew the site wide Title V Air Quality Permit was accepted by the State of Nevada in June 2008, also for five years. The issuer is addressing new information requirements under that permit. New air pollution control technologies have been developed under the CD to control mercury emissions and the State of Nevada is modifying air pollution control permits for these emissions controls. Construction of the new controls is planned for 2011. These modifications will allow compliance with State and Federal air pollution control regulations. The end result will be a fully compliant and permitted Title V permit for the operations in latter 2012.
A large portion of the Jerritt Canyon mine is located on public land administered by the U.S. Forest Service. The Jerritt Canyon staff maintains a proactive relationship with the U.S. Forest Service personnel, which includes frequent site inspections and up-dates. A majority of the Jerritt Canyon mining district has undergone a formal National Environmental Policy Act (“NEPA”) review as part of the 30 year mining and exploration history of the District. Environmental resources and issues are well defined in this documentation and appropriate mitigation strategies are in place to support and expand operations. Evolving regulatory programs may result in additional review of environmental issues associated with ongoing or planned future operations. Periodic NEPA review of these issues may be required for future expansions and modifications in the operations.
The Issuer’s operations on public lands managed by the US Bureau of Land Management (BLM) are limited to a very small area associated with the Starvation Canyon Mine access road. The Issuer has the necessary approvals from the BLM. Additional approvals may be required for expanded exploration plans in the future.
In September, 2010, the site wide Reclamation Permit with the State of Nevada was renewed and includes all current activities at the Jerritt Canyon Property on public and private lands. A modification of this permit is planned for early 2011 to allow construction of TSF2 and a water storage reserve and to add Starvation Canyon Mine operations.
TSF1 is scheduled to enter closure during 2012 independent of the obligations under the CD. The Issuer is completing closure of certain legacy facilities at the Jerritt Canyon Property in accordance with the CD. The Issuer will improve surface water controls for legacy waste rock disposal areas in 2011 under the CD. Reclamation projects are scheduled annually and are completed concurrently with the completion of mining activities. To date over 1,500 acres of mined lands have been reclaimed.
Reclamation and closure activities are defined and surety is provided to the Federal Government and the State of Nevada for the associated site restoration obligations in the total amount of US$54.88 million. These surety bonds are collateralized by a reclamation and closure insurance policy independently administered by Chartis Insurance Company (Chartis), formerly American Insurance Group (AIG). As reclamation is completed, payment for completing the insured activity is paid to the Issuer from a pre-funded Commutation Account administered by Chartis. The capacity of this collateralized bond was surpassed in 2010 and was supplemented with cash to make the collateral sufficient. The surety requirements are anticipated to increase as new facilities become necessary and older facilities have not yet been closed and reclaimed. The Issuer will ensure additional surety capacity as new mines and plant expansions develop in the future
The Issuer temporarily halted operations on the Jerritt Canyon Property in 2009. The State of Nevada then issued a regulatory Stop Order for the operations. The Issuer negotiated a Consent Decree with the State of Nevada to lift the Stop Order and resume operations. The Consent Decree required closure of certain legacy facilities, improvement of engineered controls for water pollution and development of new air pollution controls for mercury as a condition for lifting the Stop Order. At the time of writing this AIF, the Issuer was preparing to negotiate an extension and new terms for the CD for those actions not yet completed.
In 2009, the US Department of Justice (DOJ) signed a complaint against the Issuer but offered not to file the case with a court if the Issuer agreed to negotiate a settlement. The Issuer has maintained this agreement, the filing of the case has been held in abeyance, and the agreement is renewed on a 6-month basis. The complaint was not provided to the Issuer by the DOJ but the Issuer was informed that the complaint relates to mercury handling at the Jerritt Canyon Property. The Issuer has been improving mercury controls under the CD with the State of Nevada with operating and monitoring provided under the agreement with EPA. Monitoring of the effectiveness of mercury controls will be performed after the controls are constructed in 2011.
19
In 2009, the Jerritt canyon Property was selected by the USEPA for a „desktop’ audit of annual reports submitted for its Toxic Release Inventory program. The Issuer worked with the USEPA to satisfy information requests in 2010. The Issuer has received no response from the USEPA regarding the results of the audit on December 31, 2010.
The Issuer is committed to conducting its operations with high environmental values, ethics as well as to social issues. The Issuer operates in the following manner:
| | | Complies with applicable laws, regulations, and permit conditions and, where practicable, exceed their minimum requirements; |
| | | Establishes and maintains management systems to monitor all environmental aspects of its activities; |
| | | Reviews these management systems regularly to evaluate their effectiveness and modify them as appropriate to optimize their effectiveness; |
| | | Proactively pursues and evaluates engineering alternatives to better address closure and reclamation obligations; |
| | | Ensures that financial resources are available to meet environmental and reclamation obligations; |
| | | Ensures that the Issuer’s employees and contractors are aware of the Issuer’s environmental policies and understand their relevant responsibilities; and |
| | | Actively participates in the ongoing public and private sector debate on environmental and social matters that relate to the mining industry. |
The Issuer is continually striving to improve its environmental performance. Planned environmental capital expenditures and restoration expenditures for 2011 are US$67.3 million.
Ketza River Property
The Issuer currently manages the environmental compliance program in the Yukon Territory through a contracted environmental engineering firm and has onsite personnel to administer the monitoring requirements needed. There are regular consultations with the Yukon Territorial Government to ensure the Issuer is complying with regulatory requirements. During 2010 the Issuer conducted a number of environmental and social impact studies relating to the Yukon Environmental and Socio-economic Assessment Board project proposal to be submitted in 2011. Approval of this project proposal will allow the Issuer to commence construction of the tailings facility at the site to allow for mine production in the future.
4.2Risk Factors
The Issuer operates in a dynamic and rapidly changing environment that involves numerous risks and uncertainties. Shareholders should carefully consider the risks described below before purchasing its Shares. The occurrence of any of the following events could harm the Issuer. If these events occur, the trading price of its Shares could decline, and shareholders may lose part or even all of their investment.
Precious Metal Price Fluctuations
The Issuer's profitability from proposed operations will be dependent in part on:
| | | the market price of precious metals; |
20
| | the price of metals or interests related thereto has fluctuated widely and is affected by numerous factors beyond our control including: |
| | | | international economic and political conditions; |
| | | | expectations of inflation; |
| | | | international currency exchange rates; |
| | | | interest rates; |
| | | | global or regional consumptive patterns; |
| | | | speculative activities; |
| | | | levels of supply and demand; |
| | | increased production due to new mine developments and improved mining and production methods; |
| | | | availability and costs of metal substitutes; and |
| | | | metal stock levels maintained by producers and others and inventory carrying costs. |
Although it cannot predict the exact effect of these factors, the combination of these may result in the Issuer not receiving an adequate return on invested capital or an investment retaining its value.
Operating Hazards and Risks
Mining operations involve a high degree of risk, such as unusual or unexpected formations and other conditions, which even a combination of experience, knowledge and careful evaluation may not be able to overcome. Operations in which the Issuer has a direct or indirect interest are subject to all the hazards and risks normally incidental to exploration, development and production of precious metals, any of which could result in work stoppages, damage to or destruction of mines and other producing facilities, damage to life and property, environmental damage and possible legal liability for any or all damage. The Issuer presently carries a limited amount of liability insurance, and may become subject to liability for pollution, cave-ins or other hazards, and the payment of such liabilities could have a material adverse effect on its financial position.
Exploration and Development
Mineral exploration and development involves a high degree of risk as few properties which are explored are developed into producing mines. The Issuer cannot provide assurance that its continuing mineral exploration and development activities will result in any discoveries of bodies of commercial ore. The long-term profitability of the operations will be in part directly related to the cost and success of its exploration and development programs, which may be adversely affected by a number of factors.
The Issuer may require funding for the substantial expenditures which are required to establish reserves through drilling, to evaluate metallurgical processes to extract metal from ore and to develop the mining and processing facilities and infrastructure at any site chosen for mining. Although substantial benefits may be derived from the discovery of a major mineralized deposit, no assurance can be given that minerals will be discovered in sufficient quantities to justify commercial operations or that the funds required for development can be obtained on a timely basis.
Numerous factors will affect the marketability of any minerals acquired or discovered which are beyond the Issuer’s control and cannot be accurately predicted, including market fluctuations, the proximity and capacity of milling facilities, mineral markets and processing equipment, and such other factors as government regulations, including regulations relating to royalties, allowable production, importing and exporting minerals and environmental protection.
21
Calculation of Reserves, Resources and Metal Recoveries
There is a degree of uncertainty attributable to the calculation of reserves and resources and corresponding grades being mined or dedicated to future production. Until reserves or resources are actually mined and processed, the quantity of mineralization and grades must be considered as estimates only. In addition, the quantity of reserves and resources may vary depending on metal prices. Any material change in quantity of reserves, resources, grade, stripping ratio, or metallurgical recoveries may affect the economic viability of our properties. In addition, the Issuer cannot provide assurance that metallurgical recoveries in small scale laboratory tests will be duplicated in larger scale tests under on-site conditions or during production.
Title to Mining Properties
Although the Issuer has taken steps to verify title to its mineral properties in a manner consistent with industry practice for the current stage of its evaluation of our properties, there is no guarantee that its title to the properties will not be challenged or impugned. The Issuer has not conducted surveys of some of the claims in which it holds a direct or indirect interest, therefore the precise area and location of the claims may be in doubt. There could be prior unregistered agreements or transfers or native land claims and its title may be affected by undetected defects.
Issuance of Debt
The Issuer may enter into transactions to acquire assets or the shares of other corporations which may be financed partially or wholly with debt, which may increase its debt levels above industry standards. The Issuer’s articles do not limit the amount of indebtedness that it can incur. The level of the Issuer’s indebtedness could impair its ability to obtain additional financing in the future to take advantage of business opportunities that may arise.
Dilution
In order to finance its working capital requirements and to raise equity for the development of its projects the Issuer may enter into commitments which would require the issuance of additional Shares, options, warrants and convertible debt. These commitments will comply with securities laws and could require the approval of the securities regulatory bodies, and in some cases, its shareholders.
Regulatory and environmental matters
The following discussion is necessarily brief and must not be taken to constitute a complete discussion of the various statutes, rules and governmental orders to which our operations may be subject. The Issuer’s existing properties are located in Canada and the United States, and are subject to extensive federal, state, provincial and local governmental regulations in these countries. These regulations may be revised or expanded at any time. A broad number of matters are subject to regulation. Generally, compliance with these regulations requires it to obtain permits issued by federal, state, provincial and local regulatory agencies. Certain permits require periodic renewal or review of their conditions. It is impossible to predict whether it will be possible to obtain or renew such permits or whether material changes in permit conditions will be imposed. The inability to obtain or renew permits or the imposition of additional conditions could have a material adverse effect on its ability to develop and operate its properties.
Environmental laws and regulations to which the Issuer is subject as it progresses from the development stage to the production stage give rise to additional concerns and requirements. Failure to comply with applicable laws, regulations and permits can result in injunctive actions, suits for damages, and civil and criminal penalties. The laws and regulations applicable to its activities change frequently and it is not possible to predict the potential impact to the Issuer from any such future changes.
22
Passive Foreign Investment Company (“PFIC”)
The Issuer has not determined whether it meets the definition of PFIC, within the meaning of Sections 1291 through 1298 of the U.S. Internal Revenue Code of 1986, as amended, for the current tax year and any prior tax years. It may or may not qualify as a PFIC in subsequent years due to changes in its assets and business operations. A U.S. shareholder who holds stock in a foreign corporation during any year in which such corporation qualifies as a PFIC is subject to numerous special U.S. federal income taxation rules and may elect to be taxed under two alternative tax regimes. A U.S. shareholder should consult their own U.S. tax advisor with respect to an investment in the Issuer’s Shares and to ascertain which of the alternative tax regimes, if any, might be beneficial to the U.S. shareholder’s own facts and circumstances.
Enforcement of Civil Liabilities
The Issuer was incorporated under the laws of British Columbia, Canada. Some of its assets are located outside Canada and its directors and officers are residents of countries other than Canada. It could be difficult for its investors to effect service of process within Canada upon the Issuer and its directors and officers, or to realize in Canada upon judgments of courts of Canada predicated upon civil liability of it and its directors and officers under Canadian federal securities laws.
Likewise, given that the Issuer is incorporated under the laws of British Columbia and some of its assets are located in Canada, it may also be difficult for U.S. investors to effect service of process within the United States upon the Issuer or any of its directors and officers who are not residents of the United States, or to realize in the United States upon judgments of U.S. courts predicated upon civil liabilities under U.S. securities laws. A judgment of a U.S. court predicated solely upon such civil liabilities may be enforceable in Canada by a Canadian court if the U.S. court in which the judgment was obtained had jurisdiction, as determined by the Canadian court, in the matter.
4.3Companies with Asset-backed Securities Outstanding
The Issuer has not historically held any asset-backed securities and does not have any plans to hold this security in the future.
4.4Companies with Mineral Projects
(a) Jerritt Canyon Mine, Nevada
On June 20, 2007 the Issuer acquired Queenstake Resources Ltd. (“Queenstake”) which owns the Jerritt Canyon mine located in Nevada. The Jerritt Canyon mine is an operating gold property with two producing underground mines and ore stock piles, currently feeding ore to a 1.5 million ton per year capacity processing plant.
Within the description below are references to "NI 43-101" and "SRK Report" which specifically refer to the December 31, 2007 period covered by the NI 43-101 report prepared by SRK Consulting and filed by the Issuer on April 18, 2008. Data or information noted below subsequent December 31, 2007 has not been reviewed or prepared by SRK Consulting but rather by management of the Issuer from previously published results, and has not been incorporated to date within any NI 43-101 report.
23
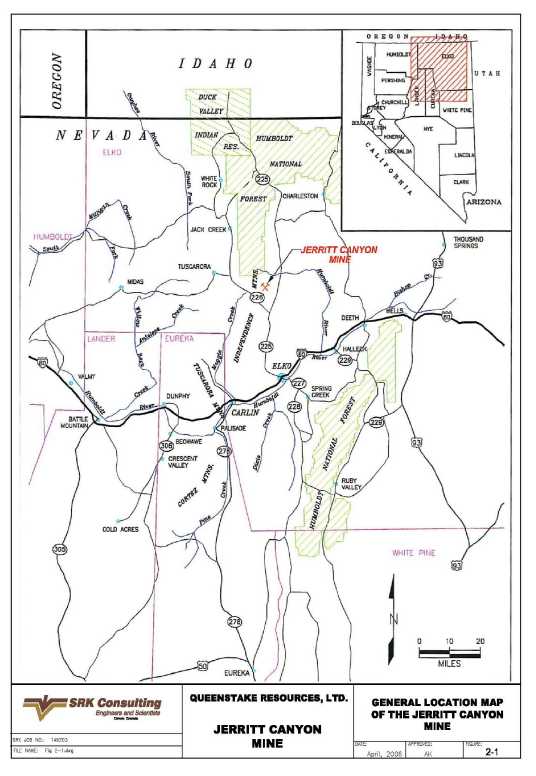
Figure 1: General Location Map of the Jerritt Canyon Mine
24
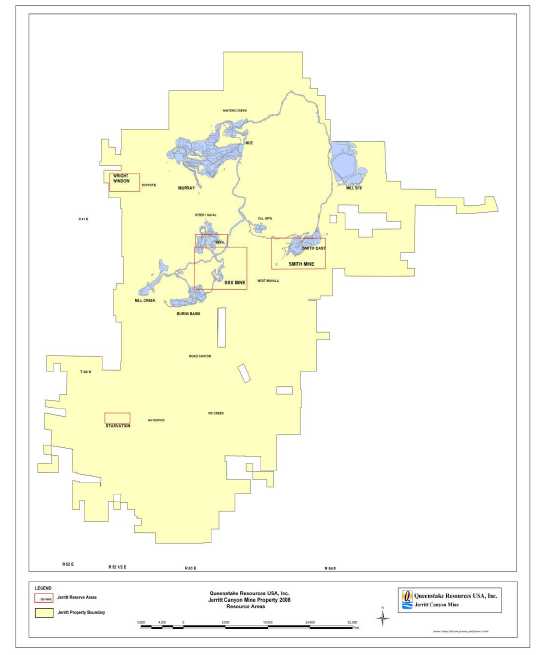
Figure 2: General Land Map of the Jerritt Canyon District
Accessibility, Climate, Local Resources, Infrastructure and Physiography
The Jerritt Canyon Mine is located in Elko County, Nevada, approximately 50 miles north of Elko. Access to the property is by State Road 225 to the mine access road. The roads are paved and in excellent condition all the way to the main gate where the administrative offices, process plant, warehouse, and tailings impoundment are located. The mines are accessed by haul roads on Queenstake controlled land.
The climate is temperate with winter temperatures between 0ºF and 40ºF and summer temperatures between 35ºF and 90ºF. Average annual precipitation at the tailings impoundment is estimated at 14 inches per year with an estimated annual average evaporation of 43 inches. A significant amount of the total precipitation falls as snow and increases with elevation to the mining areas. Mine operations are only rarely halted by weather conditions, although ore haulage from the mines may be slowed. The mill, warehouse, shop, and administrative facilities are at a lower elevation and therefore are less exposed to weather extremes.
25
The vegetation is typical of the Basin and Range province with sagebrush vegetation dominant at the lower elevations. Small stands of aspen and isolated fir trees grow in canyons and drainages.
Jerritt Canyon mine is located in the Independence Mountain Range in the Basin and Range province of northern Nevada. The topography ranges from about 6,400 feet at the administrative facilities and mill site to about 8,000 feet at the highest point of the haul road to the mines.
Elko, Nevada with a population of about 36,000 is the closest city to the mine. The city is on Interstate 80 and is serviced by daily commercial flights to Salt Lake City, Utah. Elko is a center for the mining operations in northern Nevada and services necessary for the mine are readily available there.
History
The Jerritt Canyon mine is wholly owned by Queenstake Resources USA, Inc. after the purchase by that company from the joint venture of Anglo Gold and Meridian Gold in June 2003. The joint venture was formed in 1976 between Freeport Minerals Company, later Freeport McMoran Inc., and FMC, later Meridian Gold. In 1990, Freeport sold its interest in Jerritt Canyon to Minorco and their wholly owned subsidiary, Independence Mining Company, which became the new joint venture partner and operator of the mine. In 1998, Minorco’s North American gold assets, including a 70% interest in Jerritt Canyon were sold to Anglo Gold.
Prospectors explored the district for antimony in the 1910’s. Thirty to forty tons of stibnite as antimony ore were reportedly mined and shipped from the Burns Basin mine in the Jerritt Canyon district between 1918 and 1945. In the early 1970’s there was a renewed interest in antimony exploration when its price reached historic highs of $40 per pound. Around 1971, FMC began exploring for antimony in the Independence Mountains. In 1972, FMC, later known as Meridian, discovered a disseminated gold deposit in the Jerritt Canyon area. In 1976, a joint venture was formed with Freeport Minerals Company to explore and develop the area, and mining commenced at Jerritt Canyon in 1981.
Open pit mining was conducted at the site from startup in 1981 until 1999. The first underground operation at Jerritt Canyon started up in 1993 at West Generator. The mine during 2007 consisted of three underground mining operations feeding ore to a process plant consisting of a roaster followed by carbon-in-leach processing. The mines are mechanized operations using backfill for ground control and to increase ore recovery. In the early years, the ores mined at the operation were less refractory and were processed through a “wet” mill. This “wet” mill continued to operate until 1997 and is still located on site. With ores becoming more carbonaceous and refractory, as well as with the introduction of higher-grade ore from underground operations, a dry mill with an ore roasting circuit was added in 1989 and is currently in operation.
Since its inception, the Jerritt Canyon Mine has produced over eight million ounces of gold. Annual production has historically averaged between 125,000 and 350,000 ounces of gold. During 2010 only one mine, the Smith mine, was operating and produced 71,173 tons of ore containing 14,919 ounces of gold at Jerritt Canyon as the Issuer raises additional capital to purchase mining equipment for the second mine (the SSX/Steer). During 2010 the Jerritt Canyon mill processed a total of 578,089 tons of ore through the roasters containing 73,876 ounces of gold.
Surface exploration drilling and underground core drilling which is also used as an exploration tool, decreased from 2001 to 2002, when the former owner, Anglo Gold shifted focus from exploration to reserve development. In 2000, about 445,000 feet of exploration and development were completed, of which 165,000 feet consisted of surface Reverse Circulation (RC) drilling and the remainder was underground (UG) core and RC drilling. In 2001, a total of about 500,450 feet were drilled, 65,450 of which were surface RC holes. In 2002, 435,000 feet were drilled, all of which were from underground. After the acquisition of Jerritt Canyon at mid-2003, Queenstake started more aggressive exploration and mine development programs and those programs continued after the merger of Queenstake Resources Ltd. and YGC in June 2007. Due to the shutdown of the Jerritt Canyon operations in 2008 exploration activity at Jerritt Canyon was not performed in 2009 and for the first half of 2010 until adequate funding could be obtained. In July of 2008 the Issuer recommenced underground exploration and began updating the bonding requirements to recommence surface drilling. This bonding was subsequently placed in the first quarter of 2011.
26
The measured and indicated mineral resources, including reserves, at Jerritt Canyon during Queenstake’s ownership, as documented in NI 43-101 filings are given in Table 1.
Table 1: Historic Measured and Indicated Mineral Resources during Queenstake’s Ownership
| Year | Tons | Grade | Ounces |
| 2003 | 9,497,000 | 0.242 | 2,295,000 |
| 2004 | 9,988,000 | 0.241 | 2,410,000 |
| 2005 | 8,812,000 | 0.236 | 2,079,000 |
| 2006 | 8,203,000 | 0.232 | 1,907,000 |
The proven and probable reserves at Jerritt Canyon during Queenstake’s ownership, as documented in NI 43-101 filings are given in Table 2.
Table 2: Historic Proven and Probable Mineral Reserves during Queenstake’s Ownership
| Year | Tons | Grade | Ounces |
| 2003 | 3,065,000 | 0.268 | 820,000 |
| 2004 | 3,511,000 | 0.249 | 875,000 |
| 2005 | 3,723,000 | 0.236 | 878,000 |
| 2006 | 1,985,000 | 0.245 | 486,000 |
Geological Setting
The Jerritt Canyon mining district is located in the Independence Mountain Range in northern Nevada. The range is part of the Basin and Range province of Nevada and is a horst block consisting primarily of Paleozoic sedimentary rocks with lesser Tertiary volcanics and intrusive dikes. A district geologic map is shown in Figure 3 and a stratigraphic column is shown in Figure 4.
There are four distinct assemblages in the district, characterized by their position relative to the Roberts Mountains thrust, a Devonian to Mississippian structure formed during the Antler orogeny:
- The western facies, or upper plate of the thrust, consists of the Cambrian to Ordovician Valmy Group and forms about 70% of the exposed rock in the area. In the Jerritt Canyon district, the Valmy Group consists of the Snow Canyon formation, a chert, argillite, greenstone, and carbonaceous siltstone sequence, and the McAfee Quartzite, a sequence of massive quartzite and shale;
- The eastern facies, or lower plate of the thrust, consists of a sequence of Ordovician to Devonian shallow water sedimentary rocks that are exposed in tectonic and erosional windows through the upper plate. The gold mineralization in the district is contained with the eastern facies rocks. The Pogonip Group rock is exposed in the west-central part of the district and is composed of fossiliferous limestone with calcareous shale and dolomite interbeds. The Eureka Quartzite is a massive quartzite with minor interbeds of siltstone. The Hansen Creek Formation is one of two principal ore hosts in the district. It is divided into five units, with the contacts between the units being the favorable sites of gold mineralization. The Hansen Creek consists of interbedded silty limestone, calcareous siltstone, dolomite, chert, and carbonaceous limestone. The Roberts Mountains Formation is the second ore host and consists of calcareous, carbonaceous siltstone and thinly bedded, silty limestone. The Waterpipe Canyon formation is thought to have been deposited in a synkinematic foreland basin that formed during the Antler orogeny; it consists of carbonaceous shale with interbedded greywacke, chert pebble conglomerate, bedded chert, sandstone, and siltstone;
27
- The Schoonover sequence occurs north of the district and consists of basaltic and andesitic greenstone, chert, tuff, volcaniclastics, and siliciclastic and limestone turbidites of Devonian to Permian age; and
- The Antler overlap sequence is restricted to the north end of the range and consists of conglomerates, argillite, siltstone and limestone.
There are four sets of dikes: Pennsylvanian basalt dikes, Eocene basalt and quartz monzonite dikes and a Miocene basalt dike. The Pennsylvanian and Eocene basaltic dikes are altered and mineralized in most of the mines.
The regional structural setting of the Jerritt Canyon district is complex, with several regional deformation events being evident. The Devonian to Mississippian Antler orogeny, resulting from west to east compression, is represented in the upper plate Snow Canyon Formation with north-south folds in both the hanging wall and footwall of the thrust. The Permian to Triassic Sonoma orogeny emplaced the Golconda allochthon over parts of the Roberts Mountains allochthon to the north of the district. The northwest to southeast compression associated with this deformation is rarely seen in the district. The Jurassic to Cretaceous Nevadan orogeny resulted in east-west folds that are often associated with mineralization.
Within the Jerritt Canyon area, gold can locally occur within all sedimentary formations, but is preferentially hosted by the Roberts Mountains and Hansen Creek Formations of the eastern facies in the lower plate of the Roberts Mountains thrust . The Roberts Mountains Formation consists of calcareous to dolomitic siltstones and silty limestones. The Hansen Creek Formation is divided into five members, numbered I through V from the top of the formation to the bottom. Hansen Creek I is a thinly bedded sequence of gray, medium-grained limestones and continuous blocky chert beds; it is typically brecciated. Hansen Creek II is a dark to light gray, irregularly bedded to massive, vuggy, dolomitic limestone. Hansen Creek III consists of intercalated carbonaceous micrites and laminated argillaceous limestones. Hansen Creek IV is a thickly bedded, medium to coarse-grained, carbonaceous limestone with discontinuous black chert nodules. Hansen Creek V consists of laminated, carbonaceous siltstone with chert lenses.
The contact between the Roberts Mountains Formation and the overlying Snow Canyon Formation is a regional thrust fault which transported the Snow Canyon eastward over the Roberts Mountains Formation. The contact between the Roberts Mountain Formation and the underlying Hansen Creek Formation is a discontinuity locally known as the Saval discontinuity. The discontinuity may be an angular unconformity of local extent or a thrust fault. The base of the Hansen Creek is gradational into the Eureka Quartzite. Locally, the stratigraphic section has been repeated by thrust faulting as seen in the cross-section through the SSX mine in Figure 5.
Alteration in the Jerritt Canyon district includes silicification, dolomitization, remobilization, and reconstitution of organic carbon, decalcification, and argillization. The rocks also exhibit hypogene and supergene oxidation and bleaching. The most importation alteration types relative to gold deposition are silicification, remobilization and redeposition of organic carbon and decalcification.
28
Figure 3: General Geology Map of the Jerritt Canyon District

29
Figure 4: Stratigraphic Column of the Jerritt Canyon District

30
Figure 5: Typical Cross-Section through the Jerritt Canyon District
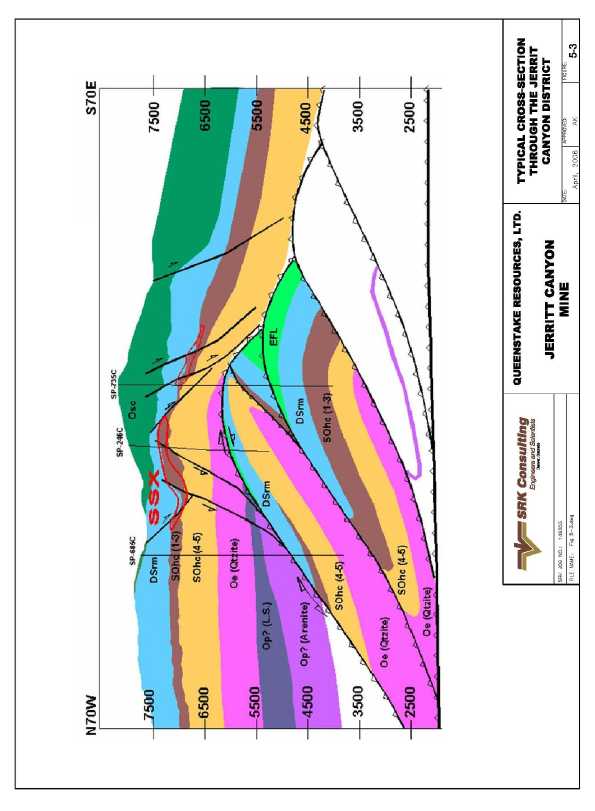
31
Exploration
The Jerritt Canyon district was explored by prospectors looking for antimony in the early 1900’s. FMC Corporation, exploring for antimony in the 1970’s, discovered gold occurrences similar to those in the nearby Carlin trend. In 1976, FMC, then known as Meridian Mining, formed a joint venture with Freeport Minerals to explore and develop the deposits. Mining commenced in 1981 with the North Generator open pit.
Since then, the operators of Jerritt Canyon have conducted exploration programs for the identification and development of new mineralized areas. Several open pit deposits were discovered, developed, and mined during the 1980’s and 1990’s, including North Generator, Alchem, Marlboro Canyon, Burns, Steer, Saval and Dash. Underground targets were also identified, and the first to be exploited was the West Generator underground deposit in 1993. The Murray deposit, originally discovered by condemnation drilling, has produced over 1 million ounces. The SSX deposit was discovered in the early 1990’s by geologists following the structural trends between Burns Basin and California Mountain open pits. The SSX mine has also produced over 1 million ounces. The MCE, Smith, and Steer extension of SSX are more recent discoveries.
The Jerritt Canyon operation has had a history of exploration and discovery since the 1970’s. In the last few years until Queenstake’s acquisition of the property, most of the exploration efforts have been concentrated at and around the existing underground mines. Exploration efforts in the southern part of the range were directed to areas such as Water Pipe, Pie Creek, and Starvation Canyon. Queenstake has increased the exploration effort near the mine areas and also in the south. As a result, the known mineralization at Starvation Canyon has increased in size and quality so that a portion of it was included in the end of 2005 reserves and again in the 2008 reserves. Additional drilling at Starvation Canyon in 2007 and early 2008 was targeted toward further definition and expansion of the resource.
Queenstake has carried out an aggressive program of exploration since its acquisition, with the following footages drilled in the past four years of its ownership of the property:
| 2003: | 280,151 feet of underground and surface RC and Core Drilling; |
| 2004: | 710,896 feet of underground and surface RC and Core Drilling; |
| 2005: | 450,694 feet of underground and surface RC and Core Drilling; |
| 2006: | 396,063 feet of underground and surface RC and Core Drilling, |
| 2007: | 467,242 feet of underground and surface RC and Core Drilling, |
| 2008: | 237,517 feet of underground and surface RC and Core Drilling, |
| 2009: | No drilling activity in 2009, and |
| 2010: | 79,691 feet of underground RC and Core Drilling. |
Queenstake continues to evaluate its landholdings with the objective of focusing future exploration and drilling the most promising areas both near and away from the existing mines.
Mineralization
SSX Mine
The drift connecting the SSX and Steer mines was completed in the latter half of 2005 and the mines have been operated as a single unit referred to as the SSX complex since then. In 2007 a drift was completed to the Saval 3 portal allowing access to the resource extending in the pit wall.
The SSX deposit was discovered in the early 1990’s following the northeast structural trends between the Burns Basin and California Mountain deposits and the west-northwest trends from the Steer/Saval deposits. Mining started in 1997, and SSX has been the main ore producer for the last few years.
32
Mineralization at the SSX mine occurs mostly in the micritic unit III of the Hansen Creek Formation. A smaller portion of the mineralization occurs in calcareous siltstone at the base of the Roberts Mountains Formation or in the upper two cherty and dolomitic members of the Hansen Creek Formation. Mineralized zones are localized in and near west-northwest trending steeply dipping dikes (e.g. South Boundary Dike); however, dike material is a minor component of the ore at SSX. Mineralization is also localized along cross-cutting northeast trending faults (the Purple Fault in Zones 4 and 6, and the Crestline Fault in Zone 1). Folding of the mineralized horizons is apparent along axes parallel to the west-northwest dike trend and, more prominently, parallel to the northeast fault set. Gold occurs in decarbonitized rock, commonly in association with variable amounts of orpiment and realgar. Silicification with stibnite can also be associated with gold in portions of the upper cherty member of the Hansen Creek Formation. The intersection of the northeast and west-northwest structural trends remain a primary target for resource expansion. The westward extension of the South Boundary Dike and the West Mahala resource to the east represent exploration opportunities.
Gold mineralization in the Steer portion of the SSX complex has been identified in an area stretching approximately 3,000 feet east from the old Steer pit to halfway along the connection drift to SSX Zone 5. Most gold mineralization at Steer is associated with gently dipping structures cutting through the Hansen Creek III unit. These structures strike northeast and dip southeast, offsetting individual strata. Typical ore zones follow the structures and tend to be broad and relatively thin. The mineralized zones are usually at the contact between the Hansen Creek units III and IV and occasionally follow the structures up through the Hansen III. Both within the Steer portion and the western side of SSX several low-angle features have been observed. These features are at least partly responsible for the gold mineralization at the contact of the Hansen Creek Units III and IV.
In the eastern portion of the Steer area, high-grade mineralization is associated with the Husky fault, a major northeast trending normal fault with at least 300 feet of normal dip-slip displacement to the southeast. Major northwest trending dikes appear to have locally compartmentalized high-grade mineralization. The intersection of these dikes with the Hansen III unit and the Husky fault and its related structures offers excellent exploration potential. One of these dikes is interpreted to be the western extension of the South Boundary dike, which is an important ore-controlling structure at the SSX mine to the east.
At Steer and SSX the structural intersections are the primary targets for resource expansion, as well as the westward extension of the South Boundary dike. In the eastern part of the SSX complex, the West Mahala mineral resource remains an excellent exploration opportunity.
Smith Mine
The Smith Mine, accessed from the Dash open pit, was started in 1999 as the pit was being mined out. The Smith Mine complex consists of several distinct areas that are accessed from the Smith portal, as well as an area to the east, East Dash, that will be accessed from a separate portal in the Dash pit. During 2006 the portal was developed to access mineralization in the east highwall of the Dash pit.
Gold mineralization in the main Smith, Mahala, and West Dash deposits is associated with the northeast trending Coulee Fault and west-northwest trending faults and dikes. In Zone 1, high-grade gold mineralization is hosted in the upper and middle portions of the Hansen Creek Formation unit III within a northwest trending horst block between the South Graben fault and the 170 fault. Mineralization in Zones 2 and 3 is directly associated with west-northwest trending dikes. High-grade mineralization occurs within the Hansen Creek units II and III along the steeply dipping dikes. Lesser amounts of mineralization exist at higher levels where the dikes intersect favorable beds in the Roberts Mountains Formation. An exception to the tight elevation controls on mineralization is at the intersection of the west-northwest trending dikes and Coulee fault. Here, high-grade mineralization blows out into the Hansen Creek unit III along the west plunging intersection of the dikes and the fault for a down-dip depth of 600 ft.
Gold mineralization in the Mahala area is spatially associated with the west-northwest trending Mahala fault and associated dikes and favorable ore-host stratigraphy including units II and III of the Hansen Creek Formation and lower beds of the Roberts Mountains Formation. Mineralization at East Mahala occurs primarily in broad, SE-dipping lenses in Roberts Mountains Formation in the hanging wall of the Coulee Fault
The B-Pit deposit occurs as gently dipping, thin lenses of mineralized material north of the main Smith deposit. Three of the four lenses occur are stratigraphically bound within the Roberts Mountains Formation. The fourth lens occurs at the top of the Hansen unit III in the wall of a NW-trending horst block just to the south of the other three zones.
33
The West and East Dash deposits occur at the extreme ends of the west-northwest trending Dash Fault system which formed the mineralization mined in the Dash pit. The West Dash deposit occurs at the intersection of the Coulee fault and the west-northwest trending Dash fault. Most gold mineralization at West Dash occurs in fault-bounded slices of Hansen Creek unit III with minor amounts in the overlying Hansen Creek unit II and Roberts Mountains Formation. West Dash is accessed through the Smith Portal. The East Dash deposit lies to the east of the Dash pit. A portion of this deposit has been accessed by a small portal in the pit. At East Dash, most gold occurs in two lenses parallel to the Dash Fault and dipping to the northeast. The largest lens is about 1,100 feet and is 15 feet to 25 feet thick. The north edge of the lens seems to be bounded by a steep east-west trending fault that is locally mineralized with high-grade material. The second lens is smaller at about 350 feet across, but much thicker, up to 120 feet.
In 2007, surface and underground drilling along the western extension of the Coulee and Mahala Dike Trends, revealed additional mineralization which was brought into the resource category during the year.
Murray Mine
The Murray Mine occurs within the Roberts Mountains Formation and the top three units of the Hansen Creek Formation. A minor amount of mineralization also occurs within the silicified unit IV of the Hansen Creek Formation. It was originally discovered by condemnation drilling for a waste dump for one of the early open pits. Mineralization in the main Murray deposit occurs along the New Deep Fault which is a wrench fault striking west -northwest and dipping 50º to 60º to the northeast. Mineralization in Zone 7 located about 750 feet north of the New Deep Fault occurred within calcareous siltstone beds of the Roberts Mountains Formation. Zone 7 and the main Murray have been largely mined out, with remnant pockets of mineralization remaining.
Zone 9 mineralization is located immediately west of the main Murray deposit and is associated with a westward projection of the New Deep Fault and several northeast trending faults. It was the focus of drilling campaigns in 2002-2005. Although there was no additional drilling in this resource it was removed from reserves in 2006 because of economics and possible water issues. It consists of two separate areas, a relatively flat-lying zone at the base of the Roberts Mountains Formation and a main zone which is associated with the New Deep fault. Mineralization is hosted by the Hansen Creek III which is locally overlain by the Snow Canyon Formation
Starvation Canyon
Mineralization at the Starvation Canyon project occurs at the Hansen II-III contact and is localized along a west-northwest fault zone at northeast structural intersections. The majority of the mineralization is within the interbedded micrite and argillaceous limestone of the Hansen Creek III, starting at or just beneath the contact. There are instances where mineralization has formed within the massive limestone of the basal Hansen Creek II, but these are rare. Drilling in 2007 has further defined the resource at Starvation, along its outer edges as well as the internal grade distributions. High angled structures have also been identified. In addition, core drilling has improved sample recovery.
Additional exploration potential exists to increase the resource of the presently known mineralized zones. The western extensions of the western zone have expansion potential along approximately 600 feet of strike length. The northwest structure that appears to be the primary control for the Starvation Canyon resource has potential for additional clusters of mineralization both to the northwest and southeast.
34
Saval
Gold mineralization in the Saval Basin area to the west of the SSX mine is primarily hosted in favorable Hansen Creek Formation unit III where it has been structurally prepared by faulting and has locally been compartmentalized by northwest-trending dike systems. In this area, a series of west-northwest trending structures have been cut by northeast-trending faults. Notable structural features include the west-northwest trending Saval horst and the northeast-trending Husky fault, which cuts across the older Saval horst and down-drops it to the southeast. Ore zones were mostly formed in Hansen III host in the vicinity of structural intersections, often forming relatively steep, narrow, plunging orebodies. Dikes, such as the Saval 3 pit dike can be traced for thousands of feet. High-grade gold mineralization has been concentrated along the Saval 3 dike in several locations, most prominently in the Saval 3 pit and in the north part of zone 5 at SSX. Except at the Saval 4 deposit, most economic zones in the Saval basin area have been mined out leaving relatively small mineralized zones in difficult-to-access pit walls and bottoms. During 2006 access to a small resource in the highwall of the Saval 2 pit was completed with a small amount of production. A small reserve is being carried in the highwall of the Saval 2.
At Saval 4, a significant gold zone has been identified that can be mined from underground with hillside access. A small pit was excavated during 2006 to allow for a portal. This excavation occurred in mineralized Roberts Mountains formation with 2,050 ounces stockpiled. In this zone, relatively steep, confined, and vertically extensive high-grade ore-bodies have formed within the Saval horst beneath a splay fault of the large Sheep Tank fault. It is interpreted that the intersection of the west-northwest trending faults that bound the horst interact with northeast trending faults, forming structurally prepared ore hosts along their intersections. Additional mineralized zones form on the flanks of the horst where it intersects the NE-trending structures. Most notable is a high-grade zone directly in the Sheep Tank fault just to the north of the main pod. Thinner mineralization occurs near the top of the horst along its south bounding fault. Excellent opportunity exists for local resource expansion of the main pod and in the flanking fault-hosted zones with close-in underground drilling after mining has begun.
Other Reserve/Resource Areas
Wright Window Pit
The Wright Window is a small open pit reserve and resource area located on the west side of the Independence Mountains to the west of the Murray mine. The deposit is hosted by the lower Roberts Mountains and Upper Hansen Creek Formations along the Saval Discontinuity. Mineralization occurs on two zones; the west zone mineralization outcrops at the surface and is about 50 feet thick. The higher-grade east area is about 200 x 300 feet wide and 45 feet thick.
Pie Creek Resource
Potentially economic gold mineralization occurs in a series of near-surface zones in the head of the Pie Creek drainage on the east flank of Wheeler Mountain. Indicated and Inferred resources have been modeled and are shallow enough, at a depth of 200 feet, for consideration of open-pit mining. The main pod is about 800 feet long, dips moderately to the southeast at about 300, and is 20 feet to 45 feet in cross-sectional thickness. Mineralization is hosted in the top of unit III of the Hansen Creek Formation and is probably controlled by northeast trending faults. Three other smaller pods near the main pod are similarly in the top of the Hansen III, but strike northwest, dip moderately to the north, and are probably controlled by local faults of similar orientation. The main pod mineralization occurs between two of the mineralized northwesterly cross structures.
Drilling
Numerous drill campaigns have been executed at Jerritt Canyon since its discovery in the 1970’s. Exploration drilling programs typically consist of RC drilling at about 200 foot centers. The spacing is then reduced to about 140 feet and finally, to 100 foot centers or less. Surface core drilling typically makes up about 5% to 10% of the total drilling. At the underground mines, definition drilling consists of core drilling on 50 foot centers from underground stations, using NQ sized core which is 1.875 inches in diameter. Underground RC drilling (Cubex) is used for resource confirmation and is drilled on 20 to 40- foot centers. RC holes are generally less than 150 feet in length, but can be as long as 300 feet. Underground production sample drilling consists of Cubex and rotary percussion drilling (Solo and Secoma). Holes are generally short, less than 60 feet, and are drilled on center as close as 10 to 20 feet. The vast majority of drillholes, except the production holes, are measured for downhole deviation.
35
Tens of thousands of holes have been drilled on the property over the years. The Murray mine has over 22,000 holes with more than 2 million feet drilled; the Smith mine has over 5,500 holes with more than 1.40 million feet; the SSX mine has nearly 18,500 holes with 2.6 million feet of drilling.
Drilling at Jerritt Canyon from 2000 through 2010 is shown in Table 3. Drilling in 2000 through 2002 was conducted by the former owner, and drilling from 2003 to present was conducted by Queenstake.
Table 3: Jerritt Canyon Drilling (2000 through 2010)
| Year | Surface RC | Surface Core | UG Core | UG RC | Production |
| | No. | Footage | No. | Footage | No. | Footage | No. | Footage | No. | Footage |
| 2000 | 378 | 444,795 | 2 | * | 292 | 75,799 | ** | ** | 4,982 | 204,182 |
| 2001 | 59 | 65,450 | 0 | 0 | 268 | 86,134 | 914 | 112,129 | 5,086 | 349,157 |
| 2002 | 27 | 18,905 | 0 | 0 | 186 | 53,940 | 2,939 | 245,536 | 3,593 | 135,824 |
| 2003 | 108 | 47,277 | 0 | 0 | 119 | 41,458 | 2,057 | 191,416 | 3,643 | 141,218 |
| 2004 | 377 | 300,226 | 34 | 21,212 | 297 | 126,091 | 2,643 | 263,367 | 2,739 | 108,780 |
| 2005 | 126 | 101,413 | 4 | 1,403 | 179 | 80,251 | 2,618 | 267,627 | 2,414 | 94,793 |
| 2006 | 155 | 135,940 | 0 | 0 | 125 | 53,985 | 2,160 | 206,138 | 724 | 28,251 |
| 2007 | 220 | 216,592 | 15 | 12,495 | 44 | 20,580 | 1,808 | 178,625 | 1,035 | 38,950 |
| 2008 | 101 | 104,182 | 7 | 8,939 | 94 | 41,915 | 240 | 45,661 | 578 | 36,820 |
| 2009 | No Activity | | | | | | | | | |
| 2010 | 0 | 0 | 0 | 0 | 3 | 3,446 | 5 | 4,680 | 1,143 | 71,565 |
*2000 surface core footage is included with surface RC
**2000 underground RC drilling is included with production drilling
Sampling and Analysis
Surface Drilling - Reverse Circulation Drilling
Surface exploration drilling programs at Jerritt Canyon consist predominantly of reverse circulation (RC) holes, with some surface core drilling. The drilling is conducted by a contract company and downhole surveys are taken by a contractor using a gyroscopic instrument. Collar locations are surveyed by a contracted survey company and/or in-house surveyors.
The surface RC holes are 5.5 inches in diameter and are sampled on 5 foot intervals, according to a protocol established by Queenstake.
Surface diamond drill core is HQ-sized (2.5 inches), unless it is necessary to reduce to NQ for completion of the hole. Surface core is logged for lithologic information and for geotechnical data according to the Jerritt Canyon logging manual at the logging facility. Surface core is split or cut with a diamond saw or hydraulic splitter and half of the sample is sent to the lab for analysis.
Underground Drilling
Drill hole spacing is targeted at 30 to 50 foot centers throughout the deposit. The attitude of the drill hole can be at any inclination to the mineralized unit although it is preferred to be as close to normal to the ore-controlling structures as possible. Collars of all drill holes are surveyed and the orientation of the holes is determined. All of the holes are surveyed by using a down-hole survey instrument (tropari or Flexit) or by a contract survey crew to measure the hole deviation. All of the collar and downhole surveys must pass quality assurance scrutiny by the site geologist prior to loading the data into the database. Only the actual data taken from the drillhole survey is used. Any projections of the survey beyond the length of the hole when surveyed are discarded. On rare occasions the collars are lost prior to collar or down hole surveys being completed; in this case the planned coordinates and hole orientation are used. However, when geological interpretation is done this factor is heavily considered in determining the validity of using the data from these holes.
36
Production Samples
| Percussive drills (Solo, Airtrack, Secoma and others) are the dominant type used for collection of sludge samples over one rod length or six feet for final definition of the ore zones. It utilizes a rotary percussion drill with 3 inch diameter bits. Cuttings exit the hole via the annulus and are collected in a tray placed beneath the collar of the hole. These holes are drilled no longer than 60 feet in length due to hole deviation and downhole sample contamination issues. The hole and tray are cleaned prior to continuing the drill hole an additional six feet. Collar locations are surveyed but a downhole survey is not generally done. Some twinned data collected in 2001 suggests that there is a greater potential for these holes to have down-hole contamination beyond 36 feet depending largely on the orientation of the hole. For this reason the length of these holes has been decreased in the past few years. These drills are used for definition drilling at Murray and to a much lesser extent at SSX and Smith Mines; |
| Jumbo drill holes and jackleg holes are drilled for ore control only. This data, when collected, is used to help determine ore waste determinations but is not loaded into the database; |
| Selective rib and/or face samples are also used to help determine the ore boundaries and for grade control. They can be used to support the constrained ore boundary and in some cases at SSX are used to help estimate the block model grades; and |
| Cubex drills are sometime used for production drilling. |
Truck Samples
At all the underground mines each haul truck is sampled for grade control purposes. The samples consist of grab samples taken over the entire load by the truck driver. Samples are placed in bags with pre-attached bar code numbered tags and transported to the Jerritt Canyon lab. Truck sample assays are cut by 8% which is a factor that has been determined through mine to mill reconciliation. The grades are used to state mine production.
Sample Preparation, Analyses and Security
Jerritt Canyon Laboratory Procedures
The mine utilizes the Jerritt Canyon laboratory for analytical work on the underground samples with check samples sent to ALS Chemex for comparisons. The samples for most of the surface drilling in the West Dash resource area in 2006 were also analyzed at the Jerritt Canyon facility. The assay lab is located in a separate building close to the ore processing plant. The laboratory has all the normal sample preparation equipment and facilities. The laboratory operates continually with a crew of 16 and performs about 500 fire assays per day with a 24-hour turn around from receipt of sample to reporting of assays.
Sample Preparation
All of the underground samples received at the Jerritt Canyon assay laboratory arrive with bar coded labels. The labels match drill logs maintained by samplers and drillers in the Jerritt Canyon Underground Department. Sample bar codes are scanned into the LIMS and assay lots are auto-created. The surface drillhole sample numbers are labeled on the sample bags and then logged into the LIMS system by the lab technicians. All logged samples dry for four to six hours at 325°F prior to prepping.
37
A rotary (automatic) 1:4 split (50 rotary cuts minimum) follows first stage crushing. Core samples first stage crush to 99% -1 inch prior to split; all other types are typically –1/2 inch prior to first stage split. Second stage crushing (99% - 3/8 inch) automatically passes through a rotary splitter (50 cut minimum). The assay split is then pulverized in a plate mill to 95%-150 mesh (Tyler) and blends for five minutes on a rotary blending wheel. The samples are placed in bar coded sample cups and transferred to fire assay.
Jerritt Canyon Lab Fire Assay Procedures:
A tray of 24 thirty-gram charge crucibles is prepared with a standard litharge flux. Each sample is weighed at one assay ton. Of 24 samples on each tray, one is a repeat sample, one is a standard, one is a blank, and one is a blind standard inserted into the sample stream by the geology department. The samples are fired by the method of fusion/cupellation, with a gravimetric finish. The balance used for the final weighing is a Cahn C-30 microbalance that is serviced and calibrated on a semi-annual basis by Microlab Services.
The laboratory in-house QA/QC procedure for checking the accuracy of the Jerritt Canyon lab consists of submitting saved duplicate samples of the mill feed and tail daily samples to outside labs for comparison. These samples are submitted on a weekly basis to either Rocky Mountain Geochemical or Chemex Laboratories. The data is compiled from the Jerritt Canyon daily assay sheet and compared with the results from the two outside labs. The results of the comparison are entered into a statistical program and a running check is maintained on the data.
Commercial Laboratories
Surface RC and diamond drilling are sent to ALS Chemex and American Assay. Samples above 0.100 opt gold are routinely fire assayed with a gravimetric finish. Blanks, standards, and pulps are routinely inserted into the sample stream for QA/QC, and check assays
The Geology Department at Jerritt Canyon has established laboratory quality assurance/quality control procedures as follows:
Jerritt Canyon Laboratory
- One standard sample per 20 samples;
- One blank sample, consisting of silica sand, per drillhole;
- One pulp of a previously assayed interval is inserted into the sample stream at the geologist’s discretion; and
- Check assays consist of coarse rejects and pulps (one sample for every twenty over 0.01opt and one in ten over 0.07opt) sent to a commercial laboratory, generally ALS Chemex.
Commercial Laboratory
- One standard sample in each batch of samples. A batch contains 40 samples in most commercial labs;
- One blank sample of silica sand per hole, inserted at the beginning or end of hole, or after a mineralized zone;
- A duplicate sample consisting of a pulp of a previously assayed interval may be used as a substitute for the regular standards; and
- 10% of the samples that have a value greater than 0.07 opt gold, and 5% of samples between 0.01 opt and 0.07 opt gold are submitted to a second lab for check analysis.
The standards have been prepared from Jerritt Canyon mineralized rock and have several different gold values. The standards used throughout 2008 include:
- High 0.268opt;
- JCQ01 0.117opt;
38
- JCQ02 0.256opt;
- JCQ03 0.051opt; and
- JCQ04 0.120opt.
Results from the standards or duplicates are reviewed by geologists upon receipt from the laboratory. If there is significant deviation from the expected value then the batch of samples is re-fired. If the lab is unable to match the original results within reasonable limits then the sample is re-fired until assay values match. The results from these analytical determinations are available in the QA/QC section below.
SRK reviewed the Jerritt Canyon assay QA/QC data for 2007 and finds the results within industry standards. Various graphs representing the results of the QA/QC program are located in Appendix B.
Data Verification
The Jerritt Canyon mine has tens of thousands of drillholes throughout the land package in the active mines, mined out areas, and exploration targets. Over the years the property has been the subject of many audits in which data verification procedures were carried out.
The geology department has largely completed the task of storing drillhole logging information and assay data into the AcQuire database package. Assay data is directly downloaded from the lab (both commercial and Jerritt Canyon's) and goes through automatic and visual validations before being recorded, thus eliminating data entry errors.
It is SRK's opinion that Jerritt Canyon is conducting exploration and development sampling and analysis programs using standard practices and that the data can be effectively used in the estimation of resources and reserves.
Mineral Resource and Mineral Reserve Estimates
At Jerritt Canyon, most gold mineralization occurs within lenticular bodies with relatively sharp hang-wall and foot-wall boundaries. In order to better model this type of mineralization, detailed wireframe solids based on geologic and grade continuity (roughly 0.15 opt Au and above) are created with MineSight software for individual zones. The wireframes are built using assays of similar value that also show geologic continuity along known ore controls. More accurate targeting of economic material for excavation with reduced dilution has been the result. This method is employed at all of the development projects and most new areas of the active underground mines. Mature, mostly-depleted portions of the active mines do not use wireframes, but rely on outlines drawn by the geologist in plan view to define a grade shell with geologic constraints.
The drillhole database is divided into the separate resource areas and composited separately. The underground areas are composited into the predominant sample length, predominately 5 feet downhole starting at the top of the drillhole. The areas that are more amenable to open pit mining are composited into 20 foot lengths starting at the top of the drillhole.
The tonnage factor used for all Jerritt Canyon ore is 12.6 cubic feet per ton. The factor is based on testing done in 2000 at the University of Nevada, Reno and Chemex lab on a total of 67 samples. The weighted tonnage factor returned on the samples was 12.616. Since then 50 samples from Smith Zone 4 (Mahala) and 5 from Steer were analyzed by Zonge Engineering and Research of Tucson, Arizona. The average for Smith Zone 4 was 12.45 cubic feet per ton, which is slightly heavier than the average used for all the mines and the average for Steer was 13.0 cubic feet per ton, which is slightly lighter. Additional tests were done in 2005 on 22 ore grade samples and 24 waste samples from Starvation Canyon. The results were 11.8 cubic feet per ton for the ore grade samples and 12.2 for the waste samples, both of which are heavier than the 12.6 average used at the mines.
39
Three methods of resource estimation, including Probability Assigned Constrained Kriging (PACK), Inverse-Distance Weighting (IDW), and Block-Polygonal, are employed at Jerritt Canyon. Each resource area is initially interpreted and grade estimated using Mintec MineSight software and subsequently exported to Maptek Vulcan software for engineering design and reserve tabulation.
Most of the areas with active underground mining utilize the PACK method. Development projects and some zones near current mining with wider-spaced drilling are modeled with the IDW method. A few projects with limited drilling use the Block-Polygon method.
- Probability Assigned Constrained Kriging (PACK) is a geostatistical method applied to most reserve areas at Jerritt Canyon. Detailed indicator and gold grade variography is developed for each zone or structural domain interpolated with the PACK method. In areas modeled by PACK, blocks within constraining wireframe solids and interpreted geologic plan-oriented strings are modeled separately from exterior blocks, using composites within the wireframes. Exterior blocks are interpolated in a separate pass using exterior samples. The percentage of model cells that reside within the wireframes is recorded and used for resource tabulation;
- Inverse-Distance Weighting (IDW): This method is used in several resource and reserve areas where drilling is too widely spaced to derive variography necessary for interpolation with the PACK method. In areas where lenticular mineralized bodies have been identified, a wireframe is constructed based on geologic and grade continuity. Similar to the PACK method described above, model cells interior and exterior to the wireframes are interpolated separately using only interior or exterior drillhole samples respectively. The percentage of model cells that reside within the wireframes is used for resource tabulation; and
- Block-Polygon: A method utilized in some of the resource areas where drill hole spacing is insufficient to conduct mine planning and reserve estimation. It employs a nearest neighbor two-dimensional search without constraining interpretive envelopes.
The PACK method consists of dividing the deposit into low-grade and high-grade probability zones and then estimating the gold grade within each of the zones separately. The methodology is summarized below:
| 1. | The deposit is divided into geological or structural zones within which the geostatistical parameters are expected to be the same. |
| | |
| 2. | Low-grade and high-grade thresholds are chosen based on the cumulative frequency plots of the sample data The typical low grade threshold is 0.03opt and the high-grade threshold is typically 0.15opt. |
| | |
| 3. | For each threshold, composites are assigned indicator values and indicator variograms are calculated from the composite indicators. The block indicator values are estimated by kriging. The block is designated as being within a low-grade envelope if the low-grade indicator is greater than 50% and the high-grade indicator is less than 50%. The block is considered high-grade if the high-grade indicator is greater than 50%. The 50% rule was reduced to a lower percentage in some cases depending on the distribution of the blocks. |
| | |
| 4. | The composites are back-coded from the model as being low-grade or high-grade, and variograms are calculated for both classes. |
| | |
| 5. | Gold grades are estimated for the high-grade blocks using only composites within the high-grade envelope, and likewise, gold grades are estimated for the low-grade blocks using only composites within the low-grade envelope. |
Refer to the Table 5 below for a listing of resource estimation methods by project.
Table 5: Jerritt Canyon Resource Estimation Methods by Project
| Deposit/Area | Interpolation Method |
| Mine Areas | PACK |
| Murray | PACK |
| �� Murray Zone 9 | PACK - IDW |
40
| Deposit/Area | Interpolation Method |
| SSX | PACK – IDW in inferred shapes (Steer) |
| Smith | PACK – IDW |
| Smith East | IDW – PACK |
| Saval | IDW - PACK |
| Starvation | IDW |
| Wright Window | PACK – IDW |
| Resource Areas | |
| Burns Basin Pit | IDW |
| California Mtn. Pit (Next) | POLYGONAL |
| Coyote Zone 10 Pit | IDW |
| Pie Creek Pit | IDW |
| Road Canyon Pit | IDW |
| Mill Creek | IDW |
| Burns Basin | IDW |
| California Mtn. | POLYGONAL |
| Coyote Zone 10 | IDW |
| MCE | PACK |
| Waterpipe II | POLYGONAL |
| West Mahala | IDW |
| Winters Creek | IDW |
Most of the reserve and resource areas are built with 15 x 15 x 15 foot blocks, with the exception of the Murray mine where 5 x 5 x 15 foot blocks are used. Starting in 2005, production models using a block size of 5 x 5 x 5 feet were utilized at the Steer mine and portions of the SSX and Smith mines in order to better delineate ore boundaries, and thus reduce dilution. Although these smaller blocks are used, the geologic/grade shapes are drawn to at least the smallest practical mining units (SMU), usually at least 15 x 15 x 15 foot in size. For resource reporting conformity at the resolution of the 15 x 15 x 15 foot SMU, the production models are re-blocked to the 15 foot matrix prior to reporting. As expected, the result of the re-blocking of the 5 foot blocks into 15 foot blocks shows similar contained ounces for zones at lower grades while there is increase in tonnage and decrease in grade at higher mining-grade cutoffs.
Variography
There was no new variography run in 2007. All of the geostatistics used in the resource calculations were compiled from geostatistical analysis in previous years. Because of the mature nature of the resource in the areas where geostatistical methods are used it is considered that the new data would not have a significant impact on the variography.
In past years, SRK visually examined selected low-grade and high-grade indicator variograms which show reasonable continuity over distances often exceeding 100 feet. The gold grade variograms show shorter ranges, as would be expected since the samples are limited to grades between 0.030opt and 0.150opt in the case of the low-grade samples and greater than 0.150opt in the case of high-grade samples. Appendix C contains indicator and grade variograms for Smith Zone 4 (Mahala and East Mahala) and Steer.
Definition of Resource Categories
For resource classification, blocks must lie within interpreted wireframes or grade shells and have demonstrated continuity of ore-tenor material (>0.15opt Au) over multiple drillhole intercepts to be considered as Measured or Indicated resources. Measured classification requires a minimum of three drillholes, the nearest composite within 20 feet, and mining history in the immediate area. Indicated classification requires that the nearest composite be within 2/3 of the variogram range. Blocks with a distance between drillholes greater than 2/3 of the variogram range are classified as Inferred. All blocks outside interpreted wireframe shapes or plan strings are considered to be Inferred resources.
41
SRK finds that the resource and reserve models developed by Jerritt Canyon conform to the definitions set forth in National Instrument NI 43-101 in Sections 1.3 and 1.4 which classify the resource into measured, indicated, and inferred categories. The standards applied by Jerritt Canyon conform to the definitions adopted by the Canadian Institute of Mining, Metallurgy and Petroleum – Definitions Adopted by CIM Council August 20, 2000.
Mineral Resource Checks
SRK imported the Jerritt Canyon block models into Vulcan software and conducted a series of checks to reconcile the stated resource tons and grade with the actual block model grades and wireframes and grade shells. SRK also visually compared the block model grades against drillhole assay data.
SRK considers that the Jerritt Canyon block models have been constructed in compliance with accepted engineering practice and can be considered reasonable global predictors of resources within the modeled areas.
Mineral Resource Statement
The Jerritt Canyon mine resources, including reserves, as of December 2007 are listed in Table 6. The resources are contained within areas where mining is currently taking place or where mining is reasonably expected to take place in the future. The metal ounces are on a contained basis without adjustment for process recoveries.
42
Table 6: Jerritt Canyon Mineral Resources, Including Reserves - December 31, 2007
| | Measured | Indicated | Measured + Indicated | Inferred |
| Deposit/Area | Tons | opt | Cont'd oz | Tons | opt | Cont'd oz | Tons | opt | Cont'd oz | Tons | opt | Cont'd oz |
| | | | | | | | | | | | | |
| MURRAY | 155.8 | 0.310 | 48.3 | 26.6 | 0.269 | 7.1 | 182.4 | 0.304 | 55.4 | 90.4 | 0.228 | 20.6 |
| MURRAY ZONE 9 | 0.0 | - | 0.0 | 210.9 | 0.277 | 58.5 | 210.9 | 0.277 | 58.5 | 61.6 | 0.209 | 12.9 |
| SSX | 1,815.3 | 0.255 | 462.5 | 746.1 | 0.269 | 200.7 | 2,561.4 | 0.259 | 663.2 | 959.2 | 0.236 | 226.6 |
| SMITH | 587.7 | 0.303 | 178.0 | 649.1 | 0.256 | 166.1 | 1,236.9 | 0.278 | 344.1 | 534.0 | 0.221 | 118.2 |
| SMITH EAST | 19.0 | 0.441 | 8.4 | 1,043.5 | 0.284 | 296.7 | 1,062.5 | 0.287 | 305.0 | 125.2 | 0.280 | 35.1 |
| SAVAL | 12.3 | 0.227 | 2.8 | 367.5 | 0.253 | 93.0 | 379.8 | 0.252 | 95.8 | 107.4 | 0.206 | 22.1 |
| STARVATION | 0.0 | - | 0.0 | 697.3 | 0.287 | 199.9 | 697.3 | 0.287 | 199.9 | 25.5 | 0.252 | 6.4 |
| WRIGHT WINDOW | 0.0 | - | 0.0 | 97.8 | 0.156 | 15.2 | 97.8 | 0.156 | 15.2 | 19.0 | 0.229 | 4.3 |
| | | | | | | | | | | | | |
| Subtotal | 2,590.2 | 0.270 | 699.9 | 3,838.8 | 0.270 | 1,037.2 | 6,429.0 | 0.270 | 1,737.1 | 1,922.4 | 0.232 | 446.2 |
| Stockpiles | 33.9 | 0.173 | 6.2 | 818.3 | 0.059 | 48.1 | 854.1 | 0.064 | 54.3 | - | - | - |
| | | | | | | | | | | | | |
| Pit Resources | | | | | | | | | | | | |
| Burns Basin Pit | - | - | - | 29.7 | 0.134 | 4.0 | 29.7 | 0.134 | 4.0 | - | - | - |
| California Mtn. Pit (NEXT) | - | - | - | 8.0 | 0.115 | 0.9 | 8.0 | 0.115 | 0.9 | - | - | - |
| Coyote Zone 10 Pit | - | - | - | 0.0 | | 0.0 | 0.0 | | 0.0 | 20.1 | 0.104 | 2.1 |
| Pie Creek Pit | - | - | - | 190.2 | 0.157 | 29.9 | 190.2 | 0.157 | 29.9 | 28.3 | 0.142 | 4.0 |
| Road Canyon Pit | - | - | - | 148.6 | 0.143 | 21.2 | 148.6 | 0.143 | 21.2 | 74.3 | 0.131 | 9.7 |
| Mill Creek | | | | 78.4 | 0.124 | 9.7 | 78.4 | 0.124 | 9.7 | - | - | - |
| | | | | | | | | | | | | |
| U/G Resources | | | | | | | | | | | | |
| Burns Basin | - | - | - | 30.7 | 0.194 | 6.0 | 30.7 | 0.194 | 6.0 | 50.6 | 0.228 | 11.5 |
| California Mtn. | - | - | - | 32.1 | 0.377 | 12.1 | 32.1 | 0.377 | 12.1 | 9.4 | 0.330 | 3.1 |
| Coyote Zone 10 | - | - | - | 45.2 | 0.212 | 9.6 | 45.2 | 0.212 | 9.6 | 2.7 | 0.184 | 0.5 |
| MCE | - | - | - | 4.4 | 0.201 | 0.9 | 4.4 | 0.201 | 0.9 | 7.8 | 0.189 | 1.5 |
| Waterpipe II | - | - | - | 0.0 | | 0.0 | 0.0 | | 0.0 | 37.4 | 0.206 | 7.7 |
| West Mahala | - | - | - | 197.5 | 0.218 | 43.0 | 197.5 | 0.218 | 43.0 | 129.6 | 0.206 | 26.7 |
| Winters Creek | - | - | - | 148.9 | 0.218 | 32.5 | 148.9 | 0.218 | 32.5 | 37.2 | 0.199 | 7.4 |
| | | | | | | | | | | | | |
| Total | 2,626.0 | 0.269 | 706.1 | 5,570.9 | 0.225 | 1,255.0 | 8,196.9 | 0.239 | 1,961.1 | 2,319.7 | 0.224 | 520.4 |
43
SRK is not aware of any possible adverse or unusual restrictions on mining resulting from legal or title issues, taxation, socio-economic, or other issues that would affect the Jerritt Canyon operation. The mine has the permits necessary for operation.
Mineral Reserve Estimate
Essentially all of the current reserves at Jerritt Canyon are contained in deposits being developed and/or mined by underground methods. The exceptions include Wright Window which is planned as an open pit operation, Starvation Canyon which is an undeveloped underground reserve area, and the stockpiles reposing at the mine portals or remaining from earlier open pit extraction.
The previous sections describe the approach in evaluating mineralized boundaries and estimating gold grades within the overall resource envelope. In order to determine the portion of the Measured and Indicated resources that would qualify for Proven and Probable reserve status, it is necessary to configure the Measured and Indicated resources into mineable shapes for the selected mining method, and then apply economic tests for establishing validity that the reserve blocks will, indeed, show positive economics.
The economic exercise is normally accomplished by calculating a breakeven cutoff grade, stated in ounces of gold per ton (oz Au/ton), which equates the total operating costs at the property with gold recovery from the process plant, and the expected return from gold sales. Total costs include mining, processing, assessed charges, and site administrative costs. Process recovery has been relatively constant over several years of operations at around 87%, with some improvement over that last half of 2007 and again in 2010 when the mill returned to operations. Recovery is projected at 89.0% going forward. Revenues reflect an average gold price experienced during the previous three years, after subtraction of refining charges and royalties.
The objective of this analysis is to derive a minimum gold grade in the ground that will just recoup the costs of production. Material not meeting this hurdle remains a resource, while blocks exceeding the minimum will be in the mining plan and will be extracted over time. It can be appreciated that the average grade of material mined and processed will be in excess of the minimum grade; thus these blocks will cover all variable production costs and will contribute toward fixed charges and profitability.
Incremental cutoff grades are sometimes employed where certain costs have already been expended (sunk costs), and the block now must cover only the remaining down-stream charges. An example is mineralized material which has been taken from underground and placed in stockpiles at a mine portal for assaying. Now that the drilling, blasting, loading and underground haulage have been expended, it may be possible that the rock contains sufficient gold to pay for surface hauling to the process plant, and the process costs as well, rather than being carried to a waste dump for disposal. An incremental cutoff grade calculation at this point will be lower than a breakeven grade, but this material should provide a marginal contribution to the operation as a whole.
The accepted formula for calculating a breakeven cutoff grade is given below:
Breakeven Cutoff grade = TotalCosts of Production
(Gold Price – Deducts) x Process Recovery
Breakeven cutoff grades were calculated for each mine or material source and compared to those determined by Jerritt Canyon personnel. The costs figures are averages obtained for the entire year of 2007, with a modification for expected processing costs in the coming years.
The following parameters, shown in Table 7, have been used in determining the various cutoff grades. Excluded from costs are the district-wide exploration expenses and capitalized development charges.
44
Table 7: Jerritt Canyon Cutoff Grades Parameters (Based on 2007 Information)
| Gold Price | $ | 580/oz | |
| Plant Recovery | | 89% | |
| Refining Charges | $ | 0.78/oz | |
| Total Production Costs, Including Processing, $/ton | | | |
| SSX | $ | 112.21 | |
| E. Dash | $ | 11159 | |
| Starvation | $ | 108.44 | |
| Smith | $ | 103.59 | |
| Wright Window | $ | 47.68 | |
| Stockpiles | $ | 34.39 | |
| Equating these parameters by the formula shown above, cutoff grades for the various sources of material can be calculated. These are presented in Table 8 below: |
| |
| Table 8:Jerritt Canyon Cutoff Grades (December 2007) |
| Material Source | SRK Breakeven Cutoff, opt Au |
| Stockpile Direct | 0.06 |
| Stockpile Screened | 0.07 |
| Wright Window | 0.09 |
| Starvation Canyon | 0.21 |
| Smith | 0.20 |
| SSX Complex/E. Dash | 0.22 |
Production from the low-grade stockpiles can be either upgraded by screening and collection of the fines, or may be delivered to the processing plant in bulk. Because the mill will be operating at full capacity with the combination of Jerritt Canyon ore and purchased material, the stockpiles most likely will continue to be upgraded by screening.
In addition to the economic justification for the resource, factors for mining dilution and recovery need to be considered before the final mineral reserve statement is issued. At the Jerritt Canyon mines, where the ore is present as irregular pods, and the mining methods are typically sublevel or drift-and-fill stoping, any mining dilution occurs at the fringes of the ore pods or lenses. Within the pods, slices or drifts are extracted and then backfilled with cemented waste material. When the backfill has consolidated, the ore between the primary stopes or drifts is then extracted. In the primary cuts, the interior stope boundaries are surrounded by ore, so little dilution results. Within the secondary cuts, the walls and/or back are cemented backfill, which is stronger than the ore or enclosing rocks, and thus little dilution takes place. It is primarily on the fringes of the individual ore bodies that dilution occurs, with the amount also being dependent upon the mining method. Jerritt Canyon engineers have developed a matrix for the different dilution factors based on experience with the various mining methods, and these are applied in calculating mineral reserves. All dilution material is applied at zero ounces per ton.
Table 9 presents historical and projected dilution factors for the underground operations. Wright Window will be a surface mine, and dilution should be minimal because of the ability to selectively mine based on blast hole analyses. Backfilled stopes can stand over substantial vertical heights. This situation allows the operation to recover nearly all the identified ore-grade material.
45
Table 9: Jerritt Canyon Dilution Factors
| | Mining Method |
| | Rock | Secondary Stope | Sublevel |
| Mine | Drift-and-Fill | Drift-and-Fill | Stoping |
| SSX Complex | 10 | 10 | 10 |
| Starvation Canyon | 10 | 10 | 10 |
| Smith | 10 | 7 | 7 |
| Saval | 10 | 10 | 10 |
Mineral reserves are listed in Table 10, using the respective cutoff grades for each individual mine. It should be noted that the gold price of $580 per ounce is an approximate average of prices published from 2005 through 2007. During this time the price was on an upward trend and certainly the cutoff grades shown in Table 15 are high (conservative) as compared to those that would be calculated using more recent values. For example, the December 2007 price, was $220 per/ounce higher than the three-year average, and thus operational decisions based on short-term prices will allow more material to be recovered and sold at a profit than indicated in the reserve table. In 2010 the cutoff grade would be significantly lower as the average gold price reached $1,226.
Table 10: Jerritt Canyon Reserves– December 31, 2007
| | Proven | Probable | Total |
| | | | Cont'd | | | Cont'd | | | Cont'd |
| Mine | kt | opt | koz | kt | opt | koz | kt | opt | koz |
| Smith | 92.5 | 0.304 | 28.1 | 861.6 | 0.280 | 241.4 | 954.1 | 0.282 | 269.5 |
| SSX | 513.7 | 0.221 | 113.4 | 386.3 | 0.232 | 89.7 | 900.0 | 0.226 | 203.0 |
| Saval | 11.4 | 0.200 | 2.3 | 108.8 | 0.250 | 27.2 | 120.2 | 0.246 | 29.5 |
| Starvation | 0.0 | - | 0.0 | 571.6 | 0.282 | 161.3 | 571.6 | 0.282 | 161.3 |
| Wright Window | 0.0 | - | 0.0 | 32.6 | 0.226 | 7.4 | 32.6 | 0.226 | 7.4 |
| Subtotal | 617.6 | 0.233 | 143.7 | 1,961.0 | 0.269 | 527.0 | 2,578.6 | 0.260 | 670.7 |
| Stockpiles | 35.9 | 0.173 | 6.2 | 540.8 | 0.075 | 40.4 | 576.7 | 0.081 | 46.6 |
| Total | 653.4 | 0.229 | 149.9 | 2,501.8 | 0.227 | 567.4 | 3,155.2 | 0.227 | 717.3 |
Mining Operations
Jerritt Canyon is an operating property with over 20 years of production experience, during which seven nearly eight million ounces of gold have been produced. The Jerritt Canyon mine complex consists of two operating underground mines located several miles west of the processing plant and administration facilities which are 50 miles north of Elko, Nevada. A third mine, Murray, was closed during 2006.
All mines feed the same processing plant, with output from the underground operations and other sources (Murray ore pad reclamation, drill cores, estc.) totaling nearly 0.62 million tons during 2007. The producing properties, and their annual production rates, are given in Table 11:
Table 11: Jerritt Canyon 2007 Production (last full year of activity)
| Property | Annual Production (tons) |
| SSX Complex | 312,208 |
| Smith Mine | 117,394 |
| Stockpiles and Cleanup | 190,331 |
| Total | 619,933 |
The full processing plant has the capability of treating approximately 4,200 tons/day. This rate was quite attainable when the feed derived mainly from open pit operations, but has been a significant surplus when accepting material from underground mines simply because the total mine output cannot attain this daily rate. In mid-2007 Queenstake amended an agreement with Newmont Mining Corporation to purchase material delivered to Jerritt Canyon by Newmont, which would supplement mined ores feeding the roasters and thereby reduce certain unit operating costs. During 2007, Queenstake processed 348,198 tons of Newmont material. In 2010 a new short term agreement was established with Newmont for the delivery of 2,000 tons per day until January 31, 2011. A total of 86,257 tons of ore was purchased from Newmont USA Limited (Newmont), containing 16,905 ounces, at an average cost per wet ton of $198.53 per dry ton. A longer term agreement is being developed in 2011.
46
The plant processed an average of 2,700 tons per day, or just under 0.97 million tons for the year 2007. Plant capacity is limited to some extent by the “fuel content” of the ore (principally contained pyrite) which tends to enhance temperatures in the roaster and so must be regulated carefully when this type of rock serves as feedstock. Blending of various mined products is practiced constantly to reduce deleterious impacts from rock types with high fuel content, high arsenic content, and so forth. Also the capacity is somewhat limited because of air permit requirements. Gold produced in 2007 was 175,646 ounces from 968,130 tons of processed ore and purchased material at a metallurgical recovery that averaged 88.2% .
The underground mines reported production of 429,602 tons of ore, along with 229,370 waste tons in 2007. The daily ore production rate calculates at almost 1,193 tons for the complex at an average grade of 0.285opt. This tonnage figure was less than the budgeted amount of nearly 503,400 ore tons at a projected mined grade of 0.265 ounces/ton.
The mines are traditionally operated by trackless equipment. Electric drill jumbos are used in preparation for blasting, and front loaders excavate the broken material into diesel-driven Wagner or Tamrock underground mine trucks for hauling to a pad area outside the portals. Segregation of mined material is effected near the portals by placing the rock into several windrows; after dumping in a windrow the mine-truck operator collects a sample from his load for analysis. Assays from the laboratory then dictate whether that material is high-grade, low-grade, or waste; the latter is excavated and placed in a waste dump, whereas the two ore types may or may not be blended depending on analytical results, and taken to the process facility. Because of the distances from the several mine portals to the processing plant, large (150 ton) off-road haulers are used for surface ore transport. These haul roads appear to be well maintained, they are of adequate width for two-way traffic, and special effort is expended during the winter months to keep the roadways open from drifting snow. Much of this equipment will need to be replaced in 2011 as the Issuer returns to mining activity in the SSX-Steer mine.
Access to the underground mines is through portals, with internal ramps maintained at grades of 12% to 15%. Typical openings measure 15 x 15 feet in cross section, although consideration is now being given to reducing some drifts to 10 x 12 feet in size to allow more selective mining and to reduce development costs. Ventilation is accomplished through the portal openings (intake air) and through a number of raise bores (exhaust air) six feet to eight feet in diameter that connect the underground workings to the surface. Certain of these raise bores also serve as emergency escapeways and are equipped with personnel capsules and hoisting equipment located on the surface. Major mine openings are supported with bolts and mesh which seem to hold the back and ribs well. Ore is generally developed by drifting adjacent to the zone in more stable rock and then cross-cutting through the deposit at specified intervals. Drift-and-fill mining is practiced, with secondary openings either alongside a backfilled stope or underneath a previously-filled excavation. In the latter situation, cost savings are accomplished since the cemented fill does not require artificial support. Extraction of ore-grade material is near 100%, and mining dilution for the most part is confined to the stope fringes.
Each mine has its own batch plant located outside the mine portal. The backfill plants receive screened rock which is stored in bins adjacent to the fly-ash and cement tanks. These products are blended according to the backfill mix design, water is added, and the mixture placed into the underground ore haulage trucks for transport back into the mine stopes.
47
In addition to the backfill plant, the mines’ surface structures generally include a large, well-equipped maintenance shop, mine dry, and mine office building. The most recent additions were the administration and shop buildings located at the Steer portal (part of the SSX complex) which were constructed in April, 2005.
Gold recovery in 2007 (and again in 2010 when the mill operations recommenced) showed improvement throughout the year as compared to 2006 and averaged 88.2% of contained metal delivered to the process plant (weighted by tonnage). Data were recorded by month for the year 2010, as shown below in Table 12:
Table 12: Jerritt Canyon 2010 Gold Recovery by Month
| Month | % Au Recovery |
| January | 87.3 |
| February | 83.9 |
| March | 89.6 |
| April | 89.4 |
| May | 87.5 |
| June | 87.6 |
| July | 89.9 |
| August | 89.7 |
| September | 87.7 |
| October | 87.5 |
| November | 86.6 |
| December | 87.4 |
| Average (weighted by tonnage) | 88.1 |
The average for 2010 is in line with 2007 amounts (the last full year of operations) however these recoveries were done with lower grade ores and under tight restrictions imposed for emissions testing. The Issuer expects these rates to improve as the grade of the ore improves and the restrictions are lifted now that the new mercury technology has proven effective.
Gold markets are mature, global markets with reputable smelters and refiners located throughout the world. Demand continues to be very high with prices for gold showing a sustained increase over the last several years during the past year-London Final price averaged just under $1,226 /ounce for 2010.
Markets for doré are readily available. Jerritt Canyon ships its doré to the Johnson Matthey refinery in Salt Lake City, Utah.
Jerritt Canyon has a few operational contracts in place at the present time. The most significant contract is for the mining of the Smith Mine which is currently being performed by Small Mine Developers under a three year contract expiring January 2013. Other contracts are for maintenance or engineering services to assist the current personnel at Jerritt Canyon.
In November 2010, a 3 month agreement was reached between Queenstake and Newmont USA Ltd. whereby Newmont would undertake to deliver 2,000 tons of ore per day from Newmont operations which will be be purchased by Queenstake and processed through the Jerritt Canyon processing plant. A new agreement is underway in 2011 while Newmont continues to deliver under the terms of the interim contract.
Environmental Issues
Environmental Issues are related to addressing the legacy of thirty years of operations and building for the future. Environmental management systems are in place and there is a qualified environmental staff on site, assisted by external resources as required. Various mitigation programs are in effect as required within the Consent Decree signed in October 2009, and related to additional issues. The most significant program underway is the construction of a new tailings facility to replace the one that has been in use since 1980, which will then be reclaimed.
48
Environmental liabilities at the Mine related to closure and reclamation include:
- Salinity in seepage from four waste rock disposal areas (RDAs).
- Seepage from the tailings impoundment, which will be mitigated by the construction of a second tailings facility; and
- Air emissions from the processing circuit, which has been substantially reduced to well below required limits with the construction of a new mercury emissions control system in 2009.
Waste Rock Seepage
There are several work programs underway required by the Consent Decree to diminish the seepage in 2011 along with a long term solution to remedy future waste. Staff has worked with the Nevada Division of Environmental Protection – Bureau of Mining Regulation and Reclamation (NDEP-BMRR) to develop mitigation and monitoring plans.
The Mine has been working with the NDEP-BMRR to treat seepage with high concentrations of sulfate and TDS from the RDA’s using a sulfate reduction trench in Marlboro Canyon. The trench reduced concentrations but not to an acceptable level. The Issuer will improve reclamation of the RDAs to diminish the seepage at its sources. The discharge ultimately flows into Jerritt Creek which flows into Independence Valley through several ranch properties and infiltrates into the sub-surface. Monitoring downstream from the trench show acceptable sulfate and TDS levels
Three other RDA’s are also exhibiting elevated concentrations of sulfate besides Marlboro Canyon. These are: Gracie; Snow Canyon; and, DASH East. The Issuer will improve reclamation of these RDAs to diminish the seepage at its sources. The DASH East RDA will be used for construction materials for underground mine backfill, may be used for closure of TSF1 and may contribute construction material for TSF2.
Tailings Impoundment Seepage Control
During 2009 and under the requirements within the CD, the Issuer prepared an optimization plan for the seepage recovery system. This seepage recovery system optimization went into effect in 2010 and will be functional during the remaining useful life of TSF and for the recovery of residual seepage after the closure of TSF1.
Air Pollution Controls
On October 13, 2009, the NDEP entered into a Consent Decree with Queenstake. The requirements of the CD relate to legacy facilities, pollution controls and management systems. Several process component shave been closed and the reclamation of the sites were completed in 2010 or will be completed in 2011. New air pollution controls for mercury emissions from the roaster were designed in 2009, tested in 2010, and will be installed in 2011.
Reclamation Bond Cost
Approved reclamation and closure plans are in place and have been recently updated, and the Mine concurrently reclaims facilities and disturbances. Reclamation consists of earthworks and reseeding; and closure consists of characterization, disassembly and demolition, and chemical stabilization. Mine staff and the USFS/NDEP update the reclamation bond on an annual basis. As of September, 2010, the reclamation bond was estimated to be about US$54.8 million. The 2011 update is in preparation. Bond increases are a result of more surface disturbance or facilities needing restoration, and increased unit costs (labor, equipment, and fuel costs).
49
Operating permits for the mine are in place and are presented in Table 13. Environmental management systems are in place and are managed by an experienced and qualified onsite environmental staff. Operating and maintenance staffs are informed of their responsibilities during annual MSHA refresher classes. In addition to MSHA classes, the Mine holds leadership classes for the supervisory staff. During these classes, supervisors are informed of their environmental responsibilities.
Table 13: Operating Permits
| Permit/Approval | Granting Agency | Comments |
| Plan of Operations | USFS | |
| Work Plans | USFS | Annual work plan submitted to USFS and NDEP |
| Clean Water Act Section 404 Permit | U.S. Army Corps of Engineers | Expired in 2007. There are no triggers requiring the update. |
| EPA ID Number | U.S. Environmental Protection Agency | The Mine, a large-quantity generator, has the typical hazardous wastes such as laboratory cupels and crucibles, and cleaners from maintenance operations. Wastes are accumulated and full drums are shipped once every calendar quarter fro disposal |
| Air Quality Permit | Nevada Division of Environmental Protection (NDEP)/ Bureau of Air Pollution Control | The Mine has a current Title V air permit. Improved pollution controls for mercury emissions and expanded monitoring and management systems developed under the CD are being incorporated in the permit. |
| Reclamation Permit | USFS and NDEP/ Bureau of Mining Regulation and Reclamation (BMRR) | The bond estimate is updated annually with the USFS & NDEP. The bond as of September, 2010, was US$54.8 million. |
| Water Pollution Control Permit | NDEP-BMRR | One water pollution control permit covers the entire mine area. Tihe tailings seepage/chloride plume is managed by a recovery system and will be mitigated by closure of TSF1; and the high sulfate/total dissolved solids emanating from four rock disposal areas will be diminished by improved reclamation and surface water controls. |
| Underground Injection Control | NDEP/ Bureau of Water Pollution Control | Addresses dewatering water from the underground mines. There is currently no active underground injection. |
| Solid Waste Class III Landfill Waiver | NDEP/ Bureau of Solid Waste | The Mine has three authorized landfills at the lower mill area, Burns Basin, and Alchem. Employees are instructed during annual MSHA refreshers with regard to what is acceptable to dispose of in the landfill. |
| General Stormwater Discharge Permit NVR300000 | NDEP/Bureau of Water Pollution Control | Annual reports are submitted to NDEP. No concerns have been noted. |
| Permit to Appropriate Waters | NV Division of Water Resources | No concerns were identified. The Mine has sufficient appropriations to cover processing and dewatering needs. |
| Permit to Construct Impoundments/Dam Safety | NV Division of Water Resources | No concerns identified |
| Industrial Artificial Pond Permits | Nevada Department of Wildlife | No concerns identified |
| Liquefied Petroleum Gas License | NV Board of the Regulation of Liquefied Petroleum Gas | No concerns identified |
| Potable Water System | Nevada State Health Division | Potable water systems are located at the Murray, SSX, and millsite. Upgrades are underway in 2011 for the SSX and millsite systems. |
50
| Permit/Approval | Granting Agency | Comments |
| Septic System Permit | Nevada State Health Division | The Mine has general permits for five systems: SSX; Steer; Murray; USA; and Smith. The mill site has a package plant that discharges to the tailings impoundment. No concerns identified. The package plan will be updated in 2011. |
The current closure cost estimate for Jerritt Canyon is approximately $48.3 million, assuming the work is accomplished by an in-house work force, which Queenstake has funded by placing US$25.7 million in a commutation account with the Chartis, along with two further deposits in money market accounts at Chartis totaling $2.6 million in 2010 related to increased surety for additional bonding requirements. The net present value of this obligation which reflects the new mine life extending to 2025 is $36.1 million. The reclamation cost for the agency bond is somewhat higher at $54.8 million as calculated under the U.S. Forest Service bonding guidelines; this figure includes agency oversight and administration. Queenstake has a policy with Chartis for a closure cost and cap insurance policy that has been accepted by the regulatory agencies to serve both to fund the physical reclamation and post-closure site management, and meet agency requirements for bonding.
Closure and reclamation will consist of the following actions:
- Open pits will be reclaimed by partially backfilling the pits with mine waste rock produced in the underground mining operations. Level areas in the pit bottom will be covered with fine-grained waste rock or growth medium and vegetated.
- Portals for the underground mines will be sealed by blasting, backfilling or bulk-heading. Raises extending to the surface will be backfilled. Regional groundwater levels are below the elevation of the mine portals or raises, therefore seepage from the mine openings is not expected.
- Waste rock disposal areas not generating seepage will be left in a condition meeting slope stability requirements. Portions of the older rock disposal areas will be left with angle of repose side slopes that are covered with durable non-acid generating rock. Other rock disposal areas will have final slopes of 2.5H to 1V. Tops of the rock disposal areas will be graded to route surface water runoff away from rock disposal area slopes. Level surfaces of the rock disposal areas and the 2.5H to 1V side slopes will be covered with growth media and vegetated.
- Waste rock disposal areas generating seepage will be contoured and growth medium applied to increase shedding of precipitation and to diminish the production of seepage.
- Haul roads and access roads not included in the final site access requirements will be graded to conform to the original ground contours and vegetated. Discussion are currently in progress with the USFS to identify roads that will remain as part of the USFS travel management plans. Haul roads that may be left open will likely require some level of reclamation to reduce overall road width.
- Sediment control structures will be reclaimed by breaching ponds and basins after sediment and erosion control issues are controlled through reclamation of the areas draining to the structures.
- The tailings impoundment will be reclaimed in phases. Beginning with the spent ore on the heap leach facility, rock and soil will be applied to beach areas in 2011 to provide a working surface on which evaporation of the surface waters and the residual seepage will be performed. Wells will be installed to monitor the progress of seepage recovery until forced evaporation will no longer be required. The tailings surface will then be graded to be free-draining from the facility. Then a synthetic liner and soil cover will be applied. The final topography of TSF1 will conform by first removing free water from the pond through evaporation.
- Solution ponds associated with the heap leach pad and the processing plant will be reclaimed by removing solution from the pond, and disposal of all contained sludge in the tailings impoundment. Pond liners will be folded into the ponds and backfilled. Growth medium will be placed over the backfilled ponds and vegetated.
- Buildings and structures will be dismantled to the level of foundations and either salvaged or disposed of in an approved landfill. Process piping will be rinsed and neutralized. Disposition of underground piping is not specifically addressed, however SRK would assume it will be necessary to remove all piping.
51
Taxes
Queenstake controls more than 119 square miles of ground encompassing the mine area proper and surrounding acreage. The bulk of this is in the form of contiguous unpatented mining claims which are held in force by production from the mining activities. No production royalties are paid for gold deriving from these claims.
Some property is leased from landowners in the region, and a royalty is paid on production from these lands. In the future this amount will average approximately $60/recovered ounce as the royalty percentage increases based on gold price and currently the maximum percentage has been reached due to the current gold price (5% of recovered ounces sold).
Nevada does not apply a corporate income tax. Income tax is levied on the federal level. There is a modest sliding scale tax rate generally applicable to smaller operations, but given the size of the Jerritt Canyon activities, the rate is 34.5% of net income after all deductions have been taken. Queenstake has, in total, suffered a loss since acquiring Jerritt Canyon in mid-2003 except for in 2007 when Queenstake was acquired by the Issuer, however 2008 and 2009 were also loss years which were carried back to offset so no federal income taxes have been assessed.
Property taxes are assessed annually by Elko County on real estate and personal property controlled by Queenstake.
A sales tax rate of 6.5% is applied to all purchases within Elko County, and the state levies a 0.63% tax on gross incomes paid, less credits for certain health benefits for the workers.
Capital and Operating Cost Estimates
Jerritt Canyon is forecasting a capital expenditure of $115 million over 2011 for items related to the mill and mine facilities. These include the categories of: equipment, construction of a new tailings facility, underground development, and mine facilities. The largest expenditure outlays will be for the construction of a new tailings facility at $39.1 million, mine equipment and facilities required to recommence mining at the SSX of $20.3 million, mine development at $4.5 million, and $6.0 million for the construction of a new ore dryer to meet the current requirements under the Consent Decree. Sustaining capital costs for the ore processing plant is budgeted at $17.1 million for upgrades to existing facilities. Sustaining capital costs for surface services and G&A is budgeted at $1.6 million. G&A sustaining capital at Jerritt Canyon is typically for the replacement of light vehicles and office equipment. A breakdown by property is given in Table 14.
The operating costs per ton of ore for processing have steadily increased over the years from $15.67 in 2001 to $30.41 in 2007 (the last full year of operations prior to 2010) and $120 in 2010, primarily as a function of the production throughput and energy costs. In 2010 there were several issues that the Issuer expects will not be present in the future as the Issuer recapitalizes and invests in the infrastructure in 2011. These issues primarily stemmed from low grades, strict controls over processing levels while operating under the Consent Decree, and a number of mill stoppages due to a lack of spare parts. Of this total, approximately 75% is for operations and 25% is for maintenance.
The anticipated operating cost for the next five years is $98.32 per ton of ore as shown in Table 15. The lowest per-ton costs are associated with the direct and screened stockpiles, since these sources do not bear future mining charges nor assigned royalty payments. Wright Window is a small area that will be surface mined, and so the unit costs are significantly less than for an underground operation. The remaining sources of feed material derive from underground and have varying estimated costs depending largely on ground conditions and the need to backfill for support. The highest-cost mining occurs in the E. Dash, and Starvation Canyon mines.
52
Economic Analysis
SRK has reviewed the internal life-of-mine (“LoM”) technical and financial model prepared by Queenstake for
Jerritt Canyon Mine for the 2007 reserve.
The LoM plan, technical and economic projections in the LoM model include forward looking statements that are not historical facts and are required in accordance with the reporting requirements of the OSC. These forward looking statements are estimates and involve risks and uncertainties that could cause actual results to differ materially.
LoM Plan and Economics
The SRK LoM plan and economics are based on the following:
- Reserves of 3.55 million tons at an average grade of 0.227 oz-Au/ton, containing a total of 717 koz of gold;
- A mine life of 5 years from 7 mines and various stockpiles, at a total average rate of 623 kt per year;
- An overall average metallurgical recovery rate of 89%, producing 368 koz of gold over the LoM;
- A cash operating cost of $518/Au-oz, or $99.32/ore-ton on a constant dollar basis;
- Total capital costs of $55.5 million being comprised of $5.2 million for mine equipment, $22.4 million for capitalized development, and $2.3 million for facilities, and sustaining capital of $14.1 million for process, $1.6 million for administration and surface services, and $9.9 million tailing impoundment; and
- Salvage value of $18.1 million
| The base case economic analysis results as at 2007, shown in Table 16, indicate an undiscounted after-tax net present value of $9.853 million at a 0% discount rate. |
| |
| Table 16: LoM Economic Results (as at 2007) |
| Description | LoM Value |
| Ore | |
| Ore Milled-(Jerritt Canyon) | 3,155 kt |
| Gold Grade | 0.227 opt |
| Contained Gold | 717 koz |
| Process Recovery (average) | 89 % |
| Recovered Gold | 638 koz |
| Gross Income ($000’s) | |
| Market Price $580/oz | |
| Gold Sales | $370,240 |
| Net Income from Purchased Ores | - |
| Gross Revenue | $370,240 |
| Refining & Sales | ($520) |
| Net Smelter Return | $369,720 |
| Royalties | ($3,831) |
| Gross Income From Mining | $365,889 |
| Operating & Capital Cost ($000’s) | |
| Mining | ($118,190) |
| Backfill | ($22,719) |
| Expensed Waste | ($28,818) |
| Surface Facilities | ($35,287) |
| Process | ($87,179) |
| Site Administration | ($16,819) |
| Purchased Ore | (-) |
| Operating Costs | ($308,801) |
53
| Description | | LoM Value |
| | Cash Cost ($/oz) $518/oz | |
| | Cash Cost ($/t-ore) $98.32 /t | |
| | Cash Operating Margin (EBITDA) | $58,024 |
| Other Costs | | |
| Reclamation Accrual | ($352) |
| Other | | $9,700 |
| | Net Income | $47,236 |
| Capital Cost net of Salvage ($000’s) | |
| Equipment | | ($5,192) |
| Capitalized Development | ($22,452) |
| Facilities | | ($2,294) |
| Process Capital (sustaining) | ($14,115) |
| Tailings Impoundment | ($9,870) |
| Administration & Surface Services | ($1,560) |
| Salvage | | $18,100 |
| Capital Costs | ($37,382) |
| | | |
| Cash Flow | (NPV @ 0%) | $9,853 |
| Cash Flow | (NPV @ 5%) | $5,270 |
| Cash Flow | (npv @ 8%) | $1,966 |
The expected life of the Jerritt Canyon operation is five years, based on the current processing rate and reported proven and probable reserves as of December 31, 2007. The Issuer controls a large land position in the immediate area and it is expected that future exploration will continue to convert certain resources to a reserve category over time.
Exploration and Development
Queenstake has been conducting aggressive resource and reserve development programs throughout its ownership of Jerritt Canyon.
The following recommendations for advancing the Jerritt Canyon property are listed below:
- Continue to satisfy the requirements defined by the State of Nevada in the 2009 Consent Decree document including mercury emissions controls at the processing plant;
- Continue exploration and resource conversion drilling with the target of locating new areas of resource and reserve both near mine and in underexplored areas;
- Re-evaluate the open-pit gold mining potential of the Jerritt Canyon District in the current high-price gold environment (open pit mining stopped in 1999 when the gold price was less than $326/ounce);
- Continue to update the drill hole acQuire database with new and historic geologic data as drilling programs progress;
- Continue remodeling the geology and resource areas using Vulcan software to produce new block models for updated resource estimations and mine design;
- Reopen the SSX-Steer Mine Complex using Queenstake staff and mining equipment targeting approximately 1,200 tons of ore production in the third quarter of 2011;
- Conduct pre-development geotechnical and metallurgy studies on the Starvation Canyon resource to help with mine design and advance this deposit towards production in 2012;
- Try to maximize stockpile haulage to the mill during the non-winter seasons;
- Continue to work on the mine to mill reconciliation in respect to tons and grade; and
54
- Continue to develop ways to minimize the amount of moisture in the ore that enters the plant. The moisture typically comes from internal mine water, and seasonally from water that enters the stockpiles at the mines and mill.
(b) Ketza River Project, Yukon Territory
The Issuer's interest in the Ketza River Property is the subject of a report prepared (the “SRK Report”), dated April 18, 2008, prepared by SRK Consulting (US), Inc. (“SRK”), of #3000, 7175 West Jefferson Avenue, Lakewood, Colorado, USA 80235. Included in this report is the most up-to-date published Ketza River resource estimate dated December 31, 2007.
The following description of the Ketza River Property has been summarized primarily from the 2008 SRK Report. Some updates have been added that relate to the 2008 to 2010 project work. Data or information noted below subsequent December 31, 2007 has not been reviewed or prepared by SRK Consulting but rather by management of the Issuer from previously published results, and has not been incorporated to date within any NI 43-101 report. The recent work has continued to focus on exploration throughout the property, drilling near and away from the existing resource areas, and conducting studies under the direction of EBA Engineering Consultants Ltd. (now a Tetratech Company) to help satisfy the YESAB Project Proposal that is being targeted for submission to YESAB in Whitehorse in late July 2011. The Issuer intends to issue an updated NI 43-101 report in early to mid-2011.
Project Description and Location
The Property owned or leased by Ketza River Holdings is located on the headwaters of Cache Creek, a tributary of the Ketza River, in the Watson Lake Mining District of the Yukon Territory, and is centered at 61o 32' N and 132o 13' W on NTS map sheet 105 F/9 (Figure 6).
Both the Ketza River and Silver Valley Projects consist of a total of 653 Yukon quartz claims and fractions of claims, 66 quartz leases (owned by Ketza River Holdings Ltd.), and 6 leased quartz claims (not owned by KRH) as shown in Figure 6.
The Ketza River Property consists of 533 quartz claims and fractions of claims and 60 quartz leases. The 60 quartz leases cover approximately 787.9ha.
The Silver Valley Property lies approximately 6km east of the Ketza River Property and contains both Au and Ag-Pb ± Au targets. The Silver Valley Property is not included in the current published Ketza River resource. The Silver Valley Property consists of 118 quartz claims and fractions of claims, six quartz leases owned by KRH, and six leased quartz leases not owned by KRH. The six quartz leases owned by KRH cover approximately 81.8 ha.
Two quartz claims (Lynx 1 and Lynx 2) owned by KRH are located near the intersection of the Ketza River Project access road and the Robert Campbell Highway and are not shown in Figure 6.
An annual royalty is due to the Yukon government on every producing mine according to the Yukon Quartz Mining Act (Canada). The royalty is on any profits that exceed the sum of $10k during any calendar year. The royalty is as follows:
- On annual profits in excess of $10k and up to $1M, 3%;
- On the excess above $1M up to $5M, 5%;
- On the excess above $5M up to $10M, 6%; and
- On the excess above $10M a proportional increase of 1% for each additional $5M.
Environmental permits are in place for exploration and related activities, as well as the maintenance of the Ketza River camp. The Issuer has an environmental staff based at the Ketza River camp to routinely monitor environmental parameters, and also maintains an environmental office in the provincial capital of Whitehorse. Relevant permits are presented in Table 17. All permits except the Water License are issued by the Department of Energy, Mines and Resources or the Department of Environment. The Water License is issued by the Yukon Water Board.
55
Table 17: Permits for the Ketza River Project
| Permit/Approval | Issuing Agency | Comments |
| Quartz Mining Land Use Permit LQ00156 | Mining Land Use, Department of Energy, Mines and Resources | Covers all exploration through June 14, 2014. |
| Government of Yukon Lease | Lands Branch, Department of Energy, Mines and Resources | For the occupation of land for the purpose of commercial mine, mill, campsite, tailings pond and other facilities. |
| Class A Land Permit | Lands Branch, Department of Energy, Mines and Resources | Permit to proceed with the land use operations for road maintenance. |
| Water License QZ04-063 (expired December 31, 2009) | Yukon Water Board | For the storage of water in, and the discharge of water from, an existing tailings impoundment. |
| Environmental Health Approvals | Department of Environment | Public Health and Safety Act approvals needed for drinking water, food safety and private sewage disposal. |
| Storage Tank Registration | Department of Environment | For registered AST’s: one 45,000L, one 500L, one 10,000L, and four 90,000L_tanks. |
| Air Emissions Permit No. 4201-60-025 (expires Dec. 31, 2012) | Department of Environment | Permit to operate a solid waste incinerator capable of burning >5kg/day. |
| Special Waste Permit No. YG41-190 | Department of Environment | Allows for storage and handling of waste, oil, waste batteries, waste lead nitrate, unspecified substances classified as “Corrosive Solids, NOS, Class 8, Packing Group 1. |
The Quartz Mining Land Use Permit requires a lease-security payment to be made each year for a limited time. Under the previous permit, payments of C$26,500 were due April 1 of each year. The recently revised permit will also require total payment of $564,300 which will be made through annual funding payments of $94,050 commencing April 1, 2008, two of which have been made so far as the operations were shut down for one year. In addition, the Government of Yukon Lease requires a payment in the amount of C$7,000 to be made on January 1 of each year. A total of C$3,087,600 has been paid for the Water License. No further payments are due under the present permit. The Issuer has all permits required for exploration and maintenance of the camp however additional permits will be required for mine operations. There are currently no environmental liabilities at the Ketza River property.
The Water License QZ04-063 expired on December 31, 2009 and the reapplication process is currently in progress. Yukon-Nevada Gold Corp. and Ketza River Holdings are still obeying the rules and regulations in the Water License QZ04-063 until it is renewed. Other permits that have been attained in the past but that have recently expired include: Solid Waste Permit (Commercial Dump Permit No. 81-013) which expired December 31, 2009; and a Quarry Permit which expired October 17, 2008.
The Issuer has all permits required for exploration and maintenance of the camp; however, additional permits will be required for mine operations. There are currently no environmental liabilities at the Ketza River property.
56
Figure 6– Location Map
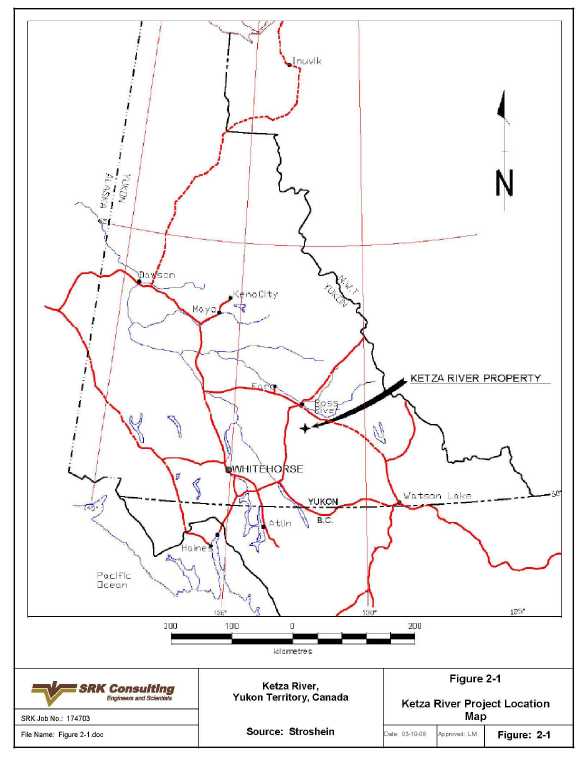
57
Figure 7: Ketza River Project Land Position
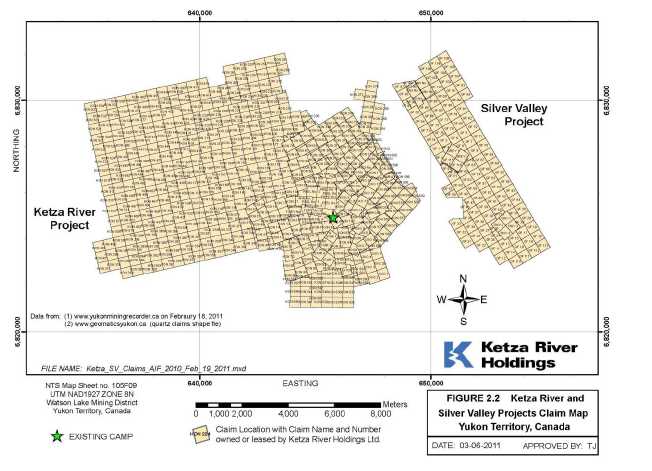
Accessibility, Climate, Land Resources, Infrastructure and Physiography
The Property is located in the Pelly Mountains in south central Yukon. Terrain is mountainous with elevations ranging from 1,300m above mean sea level (amsl) to 2,100m amsl. Land use in the area is limited to mining, trapping, hunting and recreation.
Average daytime temperatures range from highs of +25oC in summer to lows of -40oC in winter. Average annual precipitation in Faro, the nearest location for which weather statistics are available, is 31.6cm and includes annual averages of 21.4cm of rainfall and 111.6cm of snowfall (http://climate.weatheroffice.ec.gc.ca/climate_normals).
Daylight extends to nearly 24hr/day in the summer months, particularly June. There are only short periods of daylight during the winter. Exploration can be conducted year-round but heavy winter snow may limit access to some areas. Mining can be conducted year-round.
Vegetation consists of dwarf birch, spruce, alder and balsam trees up to the tree line at approximately 1,600m amsl. The Property is accessible by a 40km all-weather road from Km 323 on the Robert Campbell Highway. The Property is approximately 80km by road from Ross River and 460km from Whitehorse (Figures 6 and 8). The 40km access road is kept open year-round and is passable for tractor-trailer-size supply trucks.
58
The surface is owned by the Crown and leased to the Issuer under the Government of Yukon Lease. Total annual lease payment for the occupation of land for the purpose of a commercial mine, mill, campsite, tailings pond and other mine-related facilities is C$7,000.
The community of Ross River is 90km from the Project and supplies food, fuel and basic medical service. Personnel trained in first aid are on site at the Ketza River camp at all times and a fully stocked Industrial Ambulance is available. There is an airstrip in Ross River and contractors for electrical, plumbing, mechanical and vehicle maintenance are available in Ross River or Whitehorse.
Power to the camp and facilities is provided by 160kV and 210kV diesel generators. One generator remains off while the other generator provides power. The two are used alternately to allow for maintenance. A smaller 60kV generator is available as backup. Power for any future mining activities will be provided by additional generators.
Water for the camp and facilities is available from two established wells. Ketza is currently receiving their drinking water by pumping directly from Cache Creek into a storage tank where the water is chlorinated, and processed using reverse osmosis equipment (for arsenic treatment). Pumps that are in place can individually produce up to 30gal/min. An emergency source for water is Cache Creek itself. Power and a pump are in place so that water can be used from the creek if needed. Water required for future mining operations will be assessed in feasibility studies and will presumably be provided by water wells to be drilled on the property.
The buildings for the camp, kitchen and offices are Atco trailer units. There are 48 rooms available for lodging. There is a kitchen unit with dining area and an office complex for technical staff. Shop areas in the old mill building are functional and are used for maintenance of camp vehicles and equipment.
The old mill building is in good condition and its use for future milling activities will be investigated in feasibility studies. West of camp there is a core logging and core splitting building. All facilities have available power and water. Core is stored outdoors on-site.
The camp site is permitted for 50 personnel. Technical staff typically work four weeks on and two weeks off with schedules dependent on the needs of the camp. A larger camp will be required for future mining operations. A suitable tailings storage site is present on the property.
There is an existing tailings pond on the Ketza River site that was utilized in previous milling operations. This pond was designed as a sub-aqueous disposal sight for oxide mill tailings. The majority of the mining that is proposed will be sulfide in nature making the current pond unsuitable for tailings disposal under the current plan. A new tailings facility is proposed in the current application being prepared.
Waste generated in camp and from activities associated with the Project are burned in a trash incinerator or hauled to the Ross River land fill. Trash awaiting incineration is stored in bear-proof metal storage containers. There is a chemical treatment facility for sewage located down gradient from the camp.
Currently there are no waste dumps of any significant size on the surface. The majority of the waste material that was previously mined was used as fill material for the underground workings.
Preliminary sites for waste rock disposal have been identified. Geotechnical and environmental data is currently being collected and summarized to use in the engineering design for future waste dumps. Although some of the waste may be acid generating in nature, the abundance of high quality limestone on the site should leave several options for mitigation of acid generation potential.
Geologists, engineers, surveyors and other technical people are hired on a contract basis or employed through the Issuer. An independent engineering firm is assisting with the preparation of the current permit application to change the use of the property from exploration to development and mining. There is an expired Memorandum of Understanding (MOU) signed with the Dena Band of the Kaska Nation stating that First Nation’s people will be preferentially hired if they qualify for available jobs; Ketza River Holdings is still honoring this expired MOU while negotiations are in progress to make a new MOU. Personnel for mining operations will be hired and trained locally, where possible. Additional personnel will be hired from other localities.
59
Figure 8: Ketza River Project Access
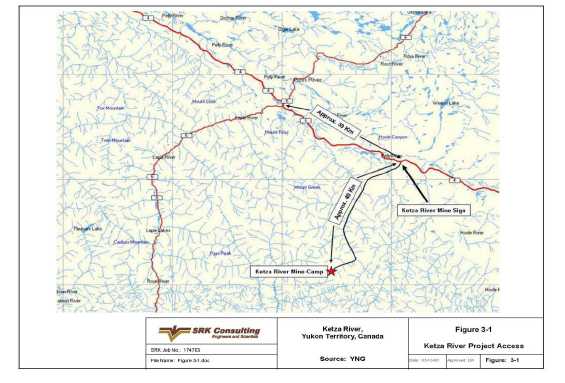
History
The Ketza River Property has a history of exploration and production dating back to the 1940’s. The property consists of several discrete zones of mineralization as shown on Figure 9. The exploration camp, and core shed are shown on the map along with the historic tailings pond and mill site.
The history of the ownership of the Kettza River Property is summarized below:
- Conwest Exploration Company Limited (Conwest), 1954-1983;
- Pacific Trans Ocean Resources Ltd (Pacific Trans Ocean), 1983 to 1984, through an option with Conwest;
- Joint venture between Canamax Resources Inc. (Canamax) and Pacific Trans Ocean, 1984-1989;
- Canamax, following purchase of Pacific Trans Ocean’s interest, 1989-1992;
- Wheaton River Minerals Ltd (Wheaton), after acquisition of property from Canamax, 1992-1994;
- YGC Resources Inc. (YGC), after transferral from Wheaton in exchange for controlling interest in YGC, later divested, 1994-2007; and
- The Issuer, following merger between YGC and Queenstake Resources Ltd to create YNG, 2007 to present. Ketza River Holdings Ltd. is a 100% Canadian owned subsidiary company of Yukon-Nevada Gold Corp. that owns and operates the Ketza River and Silver Valley Projects in the Yukon.
Lead-silver veins were discovered in the Ketza River area by prospectors of the Hudson Bay Mining and Smelting Company Limited in 1947. Later explorers conducted trenching, road building and diamond drilling. Exploration adits were subsequently developed on the lead-silver veins but little economic production was achieved.
Gold mineralization on the property was first discovered in 1954 by Conwest. Between 1955 and 1960, Conwest explored several mineralized occurrences with trenching and 75 AX diamond drill and packsack drillholes. A non-NI 43-101-compliant historic geological “reserve” of 68kt grading 12g/t-Au was reported for the Peel 3 and Peel 3C deposits (now known as the Peel and Ridge zones). The claims were surveyed and taken to lease during this time.
60
Figure 9: Mineralized Zones and Facilities
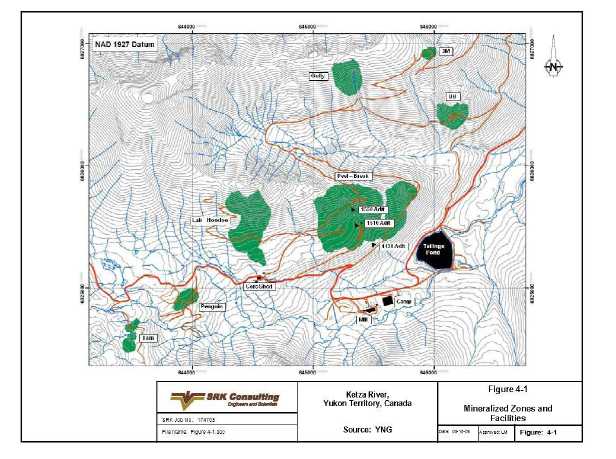
In 1983, Pacific Trans Ocean optioned the property from Conwest and carried out limited geochemical and geological surveys before entering into a joint venture with Canamax in 1984.
In February 1987, a feasibility study was completed by Canamax (Canamax Resources Inc. 1987) and reviewed by Wright Engineers Ltd (Wright). The study recommended construction of a 320t/d mill and mine complex producing approximately 50koz-Au/year from a mineable base of 460kt averaging 15.3g/t -Au. The feasibility preceded NI 43-101 requirements and is not compliant with CIM guidelines. Mine life was to be five years and the average cost per ounce of gold produced was to be in the range of US$220 to US$250. The estimated cost to build the mine and mill was estimated at US$21M. A production decision was made in March 1987, and financing was obtained in October 1987. The mill achieved commercial production in July 1988.
After several months of operation, the oxide inventory was significantly reduced from the Wright feasibility study estimates due to an error in estimation of the bulk density of the oxide ore. The feed grade to the mill was also lower than expected, due to a number of factors including over-weighting of high-grade samples in the data and dilution from the lower than expected grade from the footwall mineralization (Strathcona Mineral Services Limited, 1988). Canamax purchased Pacific Trans-Ocean's interest in the Project in January 1989.
From July 1988 to November 1990, production from the property was 100,033oz-Au from 342,395t at an average mill head grade of 11.6g/t -Au. Average mill throughput over the life of the mine was 364t/d with an average gold recovery of 88.65% . A summary of total production by zone is presented in Table 4.4.1 (Hodgson, 1991). It should be noted that mine production figures were not reconciled with total mill production of 100,033oz-Au.
61
Table 18: Summary of Total Gold Production July 1988– November 1990
| Zone | Tonnes | g/t-Au |
| Ridge | 95,790 | 13 |
| Peel | 148,844 | 13 |
| Break-Nu | 54,700 | 10 |
| Tarn | 18,169 | 8 |
| QB | 1,987 | 13 |
| Knoll | 2,936 | 6 |
| Gully | 8,136 | 10 |
| 1430 East | 600 | 5 |
| Peel/Ridge Mine Dump | 11,233 | 6 |
| Total | 342,395 | 11.6 |
With the oxide zones nearing depletion, attention was given to the economic viability of the sulfide mineralization and in November 1990 the mine and mill ceased treating oxide material. Metallurgical studies were conducted on sulfide mineralization from several of the deposits. Gold recovery of 78.3% from the sulfides was forecast with limited capital additions required to the existing mill. The mill was permitted to treat oxide ore only and additional permits were required for the treatment of sulfide ore. In June 1991 an amended water license was received but Canamax did not pursue the application due to corporate conditions, low gold prices and adverse market conditions.
Wheaton acquired the property from Canamax in 1992 and in 1994 transferred it to YGC in exchange for a controlling interest, later divested, in YGC. The claims outside the mine area were optioned to Hemlo Gold Mines Inc. (Hemlo) from 1993 to 1995.
Hemlo carried out soil sampling, magnetic surveys, bulldozer trenching and completed three diamond drillholes totaling 499m in the Shamrock zone area. YGC also conducted diamond drilling in 1994 and 1995 that consisted of 72 HQ-diameter diamond drillholes totaling 5,622m. The program resulted in the discovery of the Chimney and Fork zones.
In 1996, YGC completed 14 HQ-diameter holes totaling 1,954m in the mine area and 21 HQ-diameter holes totaling 3,613m in the Shamrock zone. The 1996 program also consisted of geologic mapping, prospecting and sampling a number of other anomalous zones. During 1997, 11 holes, totaling 1,217m, were drilled along the Fork – Nu- trend.
From 1955 through 1997, a total of 914 diamond, RC and percussion drillholes totaling 53,134m of drilling have been completed on the property. A summary of this is presented in Table 19.
University graduate students (Cathro, 1990 and Stavely, 1992) completed studies on the property investigating the geology and mineral deposits of the Ketza district and the mineralogy and geochemistry of the Ketza Mine deposits. A post-graduate investigation was completed on the structural geology, stratigraphy, alteration systems, and possible age relationships of mineralization and postulated intrusive activity (Fonseca, 1997).
Table 19: Summary of Drilling from 1955 to 1997
| Year | Operator | No. Holes | Type of Drilling | Length Drilled (m) |
| 1955-60 | Conwest Exploration Co. | 75 | Diamond | Unknown |
| 1984 | Canamax Resources Inc. | 59 | Diamond | 2,424 |
| 1985 | Canamax Resources Inc. | 60 | Diamond | 6,158 |
| 1986 | Canamax Resources Inc. | 158 | Diamond | 8,609 |
| 1987 | Canamax Resources Inc. | 61 | Diamond | 4,990 |
| 1987 | Canamax Resources Inc. | 95 | RC | 5,029 |
62
| Year | Operator | No. Holes | Type of Drilling | Length Drilled (m) |
| 1988 | Canamax Resources Inc. | 70 | Diamond | 5,549 |
| 1989 | Canamax Resources Inc. | 127 | Diamond | 5,590 |
| 1989 | Canamax Resources Inc. | 79 | Percussion | 1,215 |
| 1990 | Canamax Resources Inc. | 9 | Diamond | 1,101 |
| 1994 | Hemlo Gold Mines Inc./YGC Resources Ltd. | 25 | Diamond | 2,180 |
| 1995 | Hemlo Gold Mines Inc./YGC Resources Ltd. | 50 | Diamond | 3,630 |
| 1996 | YGC Resources Ltd. | 35 | Diamond | 5,442 |
| 1997 | YGC Resources Ltd. | 11 | Diamond | 1,217 |
| Total | | 914 | | 53,134 |
Canamax, the previous operator of the mine, expended $11.6M on exploration and feasibility studies beginning in 1984. Exploration summary reports were prepared annually by Canamax describing geophysical ground and airborne surveys, geochemical soil sampling, prospecting, trenching, percussion drilling, RC drilling, diamond drilling and underground developments.
After YGC acquired the property in 1994, it spent $0.52M in 1994, $0.76M in 1995 and $0.90M in 1996 on exploration. Drilling on the extensions of mineralized trends, on the peripheries of developed zones and in other unexplored anomalous areas totaled 11,090m in 110 HQ holes. The exploration was successful, leading to the discovery of new gold-bearing oxide and sulfide mineralization on the property. A summary report on the 1994 and 1995 drilling programs was prepared at the end of the 1995 season.
Historic Mineral Resource and Reserve Estimates
Pre-production Resource Estimates
Canamax calculated “resource and reserve” estimates prior to production using cross sectional methods in which blocks were drawn halfway to the nearest adjacent drillhole and halfway to the adjacent cross-section except where geology dictated a reduction in block size due to structural discontinuity. These estimates used a variety of cutoffs and included or excluded different satellite deposits, so it is difficult to make meaningful comparisons between the estimates from year to year. These estimates were done before the NI 43-101 standards were required, and the similarity to today’s definitions regarding measured, indicated and inferred resources are uncertain. Specific Gravity (SG) values applied to sulfide and oxide are not mentioned in the 1984 resource, but in 1985 2.8 was used for oxide, and 3.3 was used for sulfide. In 1986 the oxide SG was 3.1, and sulfide is not mentioned. These preproduction estimates are summarized in Table 20, and Figure 10. The estimates date from before institution of NI 43-101 reporting guidelines and should not be relied upon.
Table 20: Historic Resource Estimates
| | | | Oxide | Sulfide |
| Year | Description | Cut-off | Tonnes | Grade (g/t) | oz | Tonnes | Grade (g/t) | oz |
1984
| Peel Pit & UG + Tarn Pit
| 4g/2.5m (Peel)
2g/2.5m (Tarn) |
473,397 |
8.52 | 142,991
|
|
|
|
| 1985 | Peel Oxide + Misc. Sulfides | 4g over 2.5m | 439,077 | 14.62 | 187,703 | 430,913 | 7.46 | 330,693 |
1986
| PP&P Oxide, Possible
Sulfide | 4g/t
| 535,000
|
15.02 | 258,376
| 543,000
| 7.50
| 130,934
|
1987
| Same as above + new zones
(Gully, QB, Break & Knoll) | 4g/t
| 651,188
|
14.46 | 302,810
| 559,340
| 7.51
| 134,979
|
63
Figure 10: Preproduction Resource Estimates
Ketza River - Canamax
Preproduction Historic Resource Estimates

Geological Setting
The Property is located in the Pelly Mountains of central Yukon. The mountains are made up of a shallow marine miogeoclinal sequence of rocks forming a carbonate platform bounded by the Omenica Tectonic Belt to the southwest and a faulted lobe of the Yukon Tanana Terrain to the northeast across the Tintina Fault. This carbonate platform is known as the Cassiar Terrain or Pelly-Cassiar Platform (Pelly-Cassiar).
The Pelly-Cassiar is a displaced continental margin of the ancient North American continent. Rocks of the Pelly-Cassiar consist of a continental margin sedimentary sequence of the Rocky Mountain Assemblage composed of interbedded carbonate and clastic units of Paleozoic age. Several major deformation events have affected the region including a Mesozoic-age arc-continent collision, doming and uplift during the intrusion of mid-Cretaceous stocks and an estimated 450km of dextral strike-slip displacement on the Tintina Fault from the Cretaceous to Tertiary periods.
Four significant thrust faults, the McConnell, Porcupine-Seagull, Cloutier, and St. Cyr thrusts, parallel the Tintina Fault and dip generally southwest (Abbott, 1986). Thrusting is believed to have occurred during the Late Jurassic and Early Cretaceous.
Rocks in the Watson Lake District belong to the Cloutier Thrust Sheet, which is exposed within an erosional window in the overlying Porcupine-Seagull Thrust Sheet. The window, known as the Ketza-Seagull arch, forms an elongated northwest-trending structure probably related to buried Cretaceous intrusions. The intrusions are apparently centered in two areas known as the Ketza Uplift and the Seagull Uplift. Structures in the window are characterized by steeply dipping normal faults.
64
The Ketza Uplift is thought to be caused by a buried intrusion (Parry and others, 1984 and Parry and others, 1985). The following supporting evidence has been cited for the presence of a buried intrusive:
- The presence of a magnetic anomaly;
- Development of hornfels in sedimentary rocks; and
- Hydrothermal alteration immediately north of the Ketza River gold mantos.
The hornfels has been dated by whole rock K-Ar at 101+/-4Ma, in the Mid-Cretaceous (Cathro, 1988). The uplift exposes the oldest rocks of the Clouthier Thrust Sheet, which are Lower Cambrian carbonates and older clastic rocks. The rocks surrounding the uplift are Upper Cambrian and younger clastic and carbonate rocks.
Geology of the Ketza River Property
The Property is underlain by Lower Cambrian carbonate and clastic sedimentary rock units. The Lower Cambrian units (Map Units 1a, 1b, 1c, 1d, and 1e) form a conformable series (Figure 11) which is unconformably overlain by Late Cambrian black shale (Fonseca, 1998). The lithostratigraphic succession described below was adopted by previous workers (Read 1980). The general surface geology is outlined in Figure 12.
Local Lithology
The oldest rocks are Unit 1a which is composed of interbedded brown to rusty weathering argillite, phyllite, variably bedded impure siltstone, sandstone, quartzite, limestone and calcareous units. The unit outcrops in the center of the Ketza Uplift north of the Peel fault that encompasses the Shamrock target.
Unit 1b is a narrow bed (25 to 60m) of fossiliferous, well-laminated silty limestone that appears to be transitional from the underlying argillite to the overlying phyllitic limestone. The unit is not found at the surface on the property but has been intersected in drillholes.
Unit 1c is a recessive weathering unit of 75 to 105m thickness composed of brown to gray-green phyllitic limestone, calcareous mudstone and argillaceous limestone. The upper contact of the unit is gradational with the overlying massive to thick bedded blue gray limestone. This unit crops out in exposures along Cache Creek above the mill site.
Unit 1d is host to all replacement-type manto mineralization on the property. The lower contact is gradational and arbitrarily defined when the well-bedded limestone becomes the major component. The unit is from 120 to 180m thick. The limestone is a gray, uniformly bedded, clean limestone with distinctive Archeocyathid fossils occurring near the top of the unit. An internal stratigraphy has been recognized in the mine site area. The internal beds are separated on the basis of textures. Beds of massive fine-grained light-gray limestone, blue fine-grained crystalline limestone, thin and wispy silty banded limestone, and silty black limestone are recognizable in drill core and outcrop. The unit is locally dolomitized, recrystallized and weathered near the mineralization. The limestone is resistant and forms prominent cliffs and ridges throughout the region.
Unit 1e is composed of a thin (0 to 50m) green mudstone bed which forms a distinctive marker horizon. The unit is locally to pervasively clay- or talc-altered in the vicinity of mineralization. The mudstone is generally recessive, poorly exposed and often required additional ground support in the underground workings where it formed the hanging wall of the Peel zone.
Unit 2a is composed of carbonaceous to graphitic black shale with a well-developed slaty cleavage. The thickness of the unit is unknown as the top of the unit is not exposed on the property. The unit crops out in the fault-bounded panels at the Peel Oxide zone and in the Sue Creek area north of Cache Creek. A discontinuous unit of dull orange-weathering dolomite, Unit 2b, outcrops in the western portion of the property. This is a regional unit mapped by Read (1980) and was not recognized on the property by Canamax.
65
Alteration
Dolomitization or iron carbonate replacement alteration envelopes the manto mineralization and is especially well developed in areas lateral to the mantos where the host limestones are brecciated. The carbonate replacement deposits result in the migration and precipitation of calcite in the rocks surrounding the mineralization. Sheeted white calcite veins are exposed in the footwall rocks in the Break open pit and amorphous white calcite banding occurs in the fine grained limestone unit in proximity to the Peel/Ridge zones and in the upper plate rocks in the Hoodoo area. The calcite-rich limestone beds are referred to as zebra rock.
Silicification, sulfidization, and bleaching are closely associated with quartz-sulfide veins in sedimentary rocks in the argillite-hosted targets. Skarn mineralization at the Project is rare, and usually does not yield significant gold values. Epidote, biotite and diopside hornfels are wide-spread in Unit 1a, with quartz-sericite enclosing a core of quartz and silicification.
Structure
The Property lies on the southern flank of a westward plunging anticline which is cored by the Unit 1a argillite exposed along Peel Creek. The strata are strongly folded with limbs ranging from steep to flat-lying. A later deformation has overprinted these structures with broad, open folds and drag folds that occur adjacent to thrust faults.
A synclinal closure has been mapped in the Peel Ridge mine site area where mineralized bodies occur on both limbs of the fold. A major synclinal fold with parasitic anticlinal folds has been mapped northwest of the mine site area in the upper plate rocks overlying the Peel thrust fault. Limestone beds of Unit 1d host gold-bearing oxides and sulfides at the Hoodoo and Comet zones in the core and on the western limb of a tight anticline.
Regionally, the thrust faults are northeast-directed with displacements of up to 450m. The Peel fault is thought to be a reactivated thrust fault that pre-dates the block faulting. It is cross cut and offset in the Peel - Ridge fault by northwest-trending faults. The Peel fault intersects the Ridge zone ore deposit and juxtaposes Lower Cambrian argillite Unit 1a over the Lower Cambrian limestone Unit 1d. The fault has two different orientations, steeply dipping east of the Ridge zone to shallow dipping over the Ridge zone and to the west. The fault has been traced westward to the area of the Lab deposit.
The stratigraphy, thrust faults and folds have been disrupted by numerous reverse, normal and strike-slip faults. High angle block faults related to uplift and doming are prominent. Detailed mapping in the underground workings indicates that the Peel and Ridge oxide deposits occur within a 200m wide zone of structural deformation bounded by two northwest trending block faults.
The Ketza Uplift is composed of uplifted and altered Lower Cambrian Unit 1a strata. Structures within the uplift include thrust faults, upright folds, and high-angle normal faults all of which have strong spatial association with plutonic related type deposits. An apophysis of a mid-Cretaceous stock is postulated to lie beneath the core of the uplift and the Peel Creek anticline. Possible hornfels in the Unit 1a argillite along Peel Creek and a coincident aeromagnetic anomaly are cited as supporting this hypothesis. Block faulting predates, or was contemporaneous with, the mineralizing event and the faults acted as conduits for the metal-bearing solutions.
66
Figure 11: Stratigraphic Column
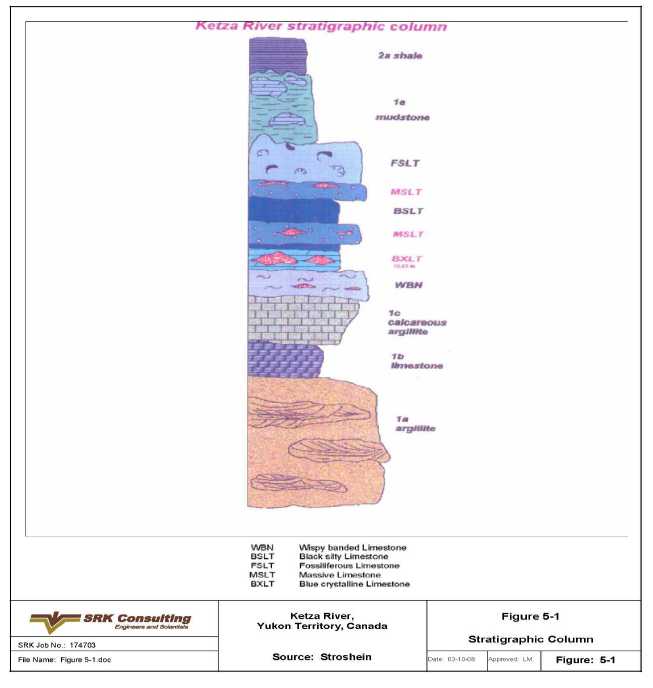
67
Figure 12: Generalized Geology Map

Exploration
In May of 2005, YGC commenced drilling at the Ketza River Project, and has been drilling continuously since then, with the exception of holiday shutdowns. In 2006, the main Project area was flown for new one-meter-contour topographic map coverage. In the spring of 2007 the Ketza claim block was expanded on the south and west. A limited amount of reconnaissance work was conducted in 2006, followed by a major effort in 2007, yielding several new target areas. Ground magnetic and gravity surveys were carried out over known mineralization. A soil sampling program was completed in the area of Peel Ridge north to the top of Shamrock Mountain. A petrographic study was completed for manto-style mineralization.
Samples from three 1996 drillholes were analyzed for multi-element geochemistry in an attempt to determine the presence of a zonation pattern that might point to the location of a postulated buried intrusive as postulated by Fonseca (1998). The holes were located at the QB Zone, the 3M Zone and one in between. The ratios of gold-arsenic and gold-bismuth indicated that the QB Zone hole was closest to the intrusive (Stroshein, 2006).
68
Rock Sampling
Tarn Pit
The wall of the Tarn Pit was channel sampled in the fall of 2006. A total of 40 samples were collected, each one 5.0m in length. The samples averaged 2g/t-Au, with a high of 9.7g/t -Au.
Creek Zone
Outcrops just above the pad for holes KR-06-920 through 922 contain massive pyrite with black coatings on the crystal surfaces. The black coating is assumed to be chalcocite since the samples ran approximately 0.2% Cu. Other dark grains in the rock were identified as tetrahedrite. All four samples contained gold values.
Gully Pit
The Gully Zone is part of the Shamrock target, and was mined by Canamax in the late 1980’s, yielding approximately 8,000t of oxide grading 10.0g/t -Au (Hodgson, 1991). Mining stopped when sulfide mineralization was encountered, leaving a prominent massive sulfide rib protruding from the pit floor, and a highly oxidized shear zone along its side.
In mid-August of 2006, a series of chip and channel samples were collected across the massive sulfide rib and the adjacent shear zone. The assays of the samples contained significant amounts of gold.
Geophysical Surveys
Aurora Geosciences conducted several geophysical surveys within the Ketza River Project area in both 2007 and 2010. In 2007, a ground magnetic survey was performed on a 50m grid from the Peel Zone across to Peel Canyon to the northeast which included to the top of Shamrock Mountain. Also in 2007, Aurora Geosciences completed a gravity survey on a 50m grid from the Lab Zone to the top of Shamrock Mountain. In 2010, Aurora Geosciences conducted: (1) ground IP surveys at the South Hill and the OK targets (Shamrock), and (2) ground magnetic surveys over the Shamrock, OK, South Hill, and lower tailings site targets or areas. The 2010 IP survey used an expanding pole-dipole array with a 25m dipole spacing. The ground magnetic lines were spaced 100 meters apart with readings taken on stations spaced every 10 meters. Results from these geophysical surveys are in the company files.
Soil Sampling
Aurora Geosciences was contracted to conduct a soil sampling program large portions of Peel Ridge and Shamrock Mountain in 2007. The sampling was done on a 50m grid, and targeted areas where 200m spaced soil lines had identified anomalous gold. Results are being analyzed at the time of this report.
A more recent soil sampling program done in the summer of 2010 on an even 100 m grid was targeted over the South Hill Target located just south of the existing camp. Results of this work, in conjunction with the recent 2010 geophysical results, will be used to help target additional exploration programs in the area.
Topographic Surveys
In August 2006 Aero Geometrics of Vancouver flew the Project, including the existing claim block in 100km2 of new coverage. Two sets of digital topographic maps, with 10m and 1m contour intervals were produced.
In early September 2007, Aero Geometrics of Vancouver flew portions of the Project in which mining claims had been staked since the survey the previous year. Topographic maps generated by this survey have a 5m contour interval.
Mineralization
Mineralization on the property is generally of two types: manto and chimney, carbonate-hosted replacement deposits that occur south of the Peel fault and quartz-sulfide fissure veins and quartz-breccia zones in siliciclastic rocks that occur north of the Peel fault. Over 30 targets and prospects have been identified on the property. For purposes of resource estimation the area has been divided into four model areas with most of the targets falling into one of the following areas (Figure 13):
69
| Tarn Area: | Tarn |
| Penguin-Lab Area: | Penguin, Flint, Lab and Hoodoo; |
| Peel Area: | Ridge, Peel, Nu-Break |
| Shamrock Area: | Gully, QB, 3M. |
All areas except Shamrock occur south of the Peel fault and contain manto and chimney, carbonate-hosted replacement deposits while Shamrock occurs north of the Peel fault and contains quartz-sulfide fissure vein and quartz breccia zones in siliciclastic rocks. The Knoll and Freds Vein deposits were not modeled for the resource.
Mineralized Zones
Peel, Penguin-Lab and Tarn areas are generally of the gold-rich carbonate-hosted chimney- and manto-style sulfide mineralization and its oxidized equivalent. The lone exception to this is Fred’s Vein East, which is a quartz-sulfide vein hosted by siliciclastic rocks immediately north of the Peel fault. While Fred’s Vein East is geologically similar to the mineralization in the Shamrock area, it falls within the Peel area because of its location on Peel Ridge.
The mantos and steeply-plunging chimneys are preferentially hosted by three limestone facies of Unit 1d: BXLT, MSLT and WBN, which are confined to the south side of the Peel fault. The location of mineralization is controlled by high-angle planar and listric normal faults, fold hinges and by the location of the three favorable carbonate facies. In general, the mantos have an elongate geometry.
Principal sulfide mineralogy consists of pyrrhotite, pyrite, arsenopyrite, marcasite and minor chalcopyrite. Galena and sphalerite are rare. Oxidized mineralogy primarily consists of hematite and goethite. Scorodite, after arsenopyrite, is common. A distinctive lustrous hydrous iron silicate mineral named hisingerite is present, and is often associated with high-grade gold values.
Sulfide mantos include Peel Sulfides, Peal East Sulfides, Penguin, Tarn, Lab and Flint. Oxide mantos include Peel Oxides, Break-Nu, Ridge and Hoodoo.
Tarn Zone
The Tarn zone is located approximately 2km west of the Ketza River Camp in the headwaters of Cache Creek. Mineralization consists of two mixed oxide-sulfide bodies ranging from 85m to 115m in length, 35m to 60m in width and 5m to 8m in thickness. Mineralization is exposed in the Tarn pit and extends to 75m in depth and is approximately horizontal. Strike is about 015o.
Approximately 18kt of oxidized Manto-style mineralization was mined from the Tarn zone in the late 1980’s. Current exploration focuses mainly on the sulfide Manto beneath the oxide.
Penguin Zone
The Penguin zone is manto-style sulfide mineralization located approximately 1.25km west of the Ketza River Camp, also in the Cache Creek drainage. Two mineralized bodies occur within a presently defined area of approximately 425m in length, 100m in width and 15m in thickness. The first zone, formerly known as the Flint zone, is sub-vertical with a plunge of 25o to the southwest. It is approximately 150m in length, 60m in height and 10m in width. This zone occurs 90m below the surface with an azimuth of 050o.
The second zone is more flat-lying with approximate dimensions of 150m in length, 115m in width and 4m in thickness. It occurs approximately 120m below the surface with a plunge of 4o to the southwest and an azimuth of 020o.
70
Lab Zone
The Lab Zone is manto-style sulfide mineralization located approximately 1.25km northwest of the Ketza River Camp on the southern slope of Peel Ridge. The Lab zone consists of four distinct zones that occur over an area measuring 320m x 400m and average 5m in thickness. The four bodies occur in two pairs at right angles to one another with the arms striking northeast and southeast. The former Calcite zone is now included in this zone.
Hoodoo Zone
The Hoodoo zone is manto-style oxide/sulfide mineralization located approximately 1.5km northeast of the Ketza River Camp on the southern slope of Peel Ridge. Early drilling stopped once sulfide mineralization was reached but recent drilling has been targeting the sulfide mineralization underlying the oxide mineralization exposed at surface. Recent exploration has also been successful in extending the oxide mineralization. Geometrically the Hoodoo zone is a flattened cylinder with a presently defined diameter of 70m and a thickness of 15m.
Peel Model Area Occurrences
Peel Zone
The Peel zone is located about 0.75km north of the Ketza River Camp on the south flank of Peel Ridge. Mineralization consists of irregular interconnected lenses and pods in area approximately 400m long x 400m wide zone. The Peel zone consists of the Peel West, Ridge, Main Peel, or Peel oxide, zones. The Nu-Break and
Fred’s Vein East zones are also on Peel Ridge but are somewhat to the east of the main grouping of mineralized bodies that comprise the Peel zone.
Peel West Zone
The Peel West zone consists of four mineralized bodies with a generally circular footprint. The four bodies occur over an area measuring 320m x 260m and range in thickness from one to 10m. The mineralized bodies are exposed at the surface and extend to a depth of 60m. The overall azimuth of the zones is 325o.
Ridge Oxide Zone
The Ridge oxide manto zone as presently defined consists of three separate mineralized bodies occurring over an area approximately 500m in length, 85m in width and 50m in thickness. Individual mantos vary from 5 to 10m in thickness. The zone is exposed at the surface and extends to a depth of 120m. Mantos dip from fairly flat-lying to 55o to the north. Azimuths range from 070o to 350o.
Production from the oxide mineralization in the Peel and Ridge deposits was approximately 148,844t at an average grade of 13g/t-Au. Oxide mineralization is cut off by the bounding northwest-trending East Side fault.
Nu-Break Zone
The Nu-Break zone consists of oxide/manto mineralization located approximately 1.0km north-northeast of the Ketza River Camp on the nose of Peel Ridge. The overall dimensions of the mineralized body as presently defined are approximately 175m in length, 75m in width and 30m in thickness.The zone is exposed at the surface and extends to a depth of 95 m below the surface. The azimuth of the zone is approximately 300o with a dip of 75o to the south.
Fred’s Vein East
Fred’s Vein East is a quartz-sulfide vein-like occurrence in siliciclastic rocks on the north side of the Peel fault. The vein is located on the north side of Peel Ridge in the Peel Creek drainage approximately 1.0km north of the Ketza River Camp. The exposed strike of the structure is approximately 100m. The width is difficult to characterize and the down dip extension has not yet been defined. The zone is exposed at the surface. The strike varies from 065o to 080o and dip varies from 80o to 85o south.
71
Shamrock Model Area Occurrences
All of the mineralization in the Shamrock area occurs in siliciclastic rocks north of the Peel Fault. Mineralization occurs as fissure veins, breccia zones and disseminations rather than chimneys and replacement mantos.
Gully Zone
The Gully Vein is a quartz-sulfide vein occurring in siliciclastic rocks north of the Peel fault. The vein is located approximately 1.75km north of the Ketza River Camp on the south flank of Shamrock Mountain in the Peel Creek drainage. Samples from drilling range up to 37.6g/t -Au. The overall dimensions of the mineralized body as presently defined are approximately 300m in length, 100m in depth and 4m in thickness. The zone extends from the surface to 125m with an azimuth of 165o, a dip of 45o west and a plunge of 9o.
QB Zone
The QB zone consists of multiple irregular lenses of quartz-breccia occurring in siliciclastic rocks north of the Peel fault. The vein is located approximately 1.75km northeast of the Ketza River Camp on the south flank of Shamrock Mountain in the Peel Creek drainage. The overall dimensions of the mineralized body as presently defined are approximately 525m in length, 220m in width and 2m to 70m in thickness. The zone extends from the surface to a depth of 270m with an azimuth of 140o and a plunge of 040o to the south.
3M Zone
The 3M zone is located about 2.5km northeast of the Ketza River Camp on the ridge between Peel and Misery Creeks. Mineralization consists of quartz breccia and disseminations in siliciclastic rocks. The mineralized body is approximately 525m in length, ranges from 2m to 12m in width and extends to 230m in depth. The upper part contact of mineralization ranges from 40m to 90m below the surface. The azimuth of the mineralized body is 150o and the dip is 010o to the west.
Knoll Zone
The Knoll zone is located about 3.0km northeast of the Ketza River Camp on the north slope of Shamrock Mountain. It is just outside of the Northwest edge of the Shamrock model area. It is comprised of a body of oxide mineralization measuring 45m x 35m with a thickness ranging from 4m to 10m. It is exposed at the surface and has been mined on a limited scale in the past.
72
Figure 13: Drillhole Locations and Modeled Areas with Deposit Names
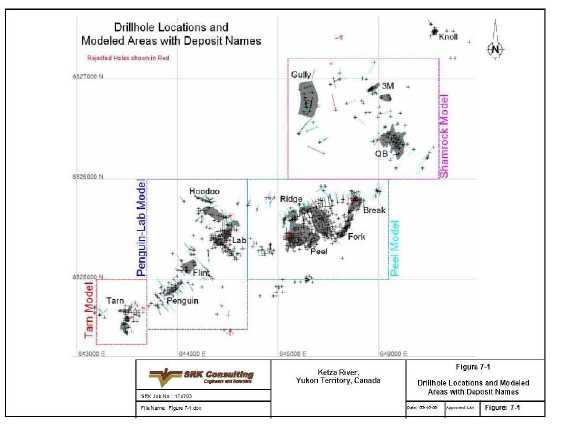
Drilling
From May of 2005 through December of 2010, the Issuer drilled a total of 1,029 drill holes for a total of 136,656m (Table 23). The principal objective of the drilling programs was the continued definition of known mineralized areas and the testing of newly discovered areas. Only a minor amount of the drilling has been dedicated towards predevelopment or YESAB project proposal studies. All diamond drill holes completed in the resource area from 2005 to December 31, 2007 are shown in Figure 13.
Table 23. Summary of Diamond Drilling 2005 Through 2010 Conducted at the Ketza River Project
| Year | Operator | No. of Holes | Type Drilling | No. of m Drilled |
| 2005 | YGC Resources Ltd. | 99 | Diamond | 12,734 |
| 2006 | YGC Resources Ltd. | 270 | Diamond | 33,874 |
| 2007 | YGC Resources Ltd./KRH | 305 | Diamond | 41,587 |
| 2008 | Ketza River Holdings | 225 | Diamond | 30,436 |
| 2009 | Ketza River Holdings | 2 | Diamond | 483 |
| 2010 | Ketza River Holdings | 128 | Diamond | 17,542 |
| Total | | 1,029 | | 136,656 |
Notes:
| (1) | the total drilling done in 2008 includes 26 geotechnical and hydrogeology diamond drill holes totaling 2,562m, and 14 condemnation diamond drill holes totaling 1926.79m completed at the upper tailings site. |
| (2) | the total amount of drilling (in meters) done in 2010 and listed in Table 23 above includes 10 geotechnical and hydrogeology diamond drill holes totaling 1232.7m, and 16 tailings dam condemnation and exploration drill holes totaling 2,695.3m. The total amount of 2010 drilling listed in Table 23 does not include the 14 geotechnical drill holes totaling 275 m that used Becker and diamond drilling methods, or the 2 piezometer drill holes totaling 21m completed at the existing tailings pond area. |
73
| (3) | KRH = Ketza River Holdings, a 100% Canadian subsidiary company owned by Yukon-Nevada Gold Corp. |
| (4) | Total drilling excludes drill holes completed at the adjacent Silver Valley Project. |
All of the drilling from 2005 through 2010 was diamond drilling with the exception of: (1) the 14 Becker drill holes (finished with diamond drilling to the total depth) completed in the lower tailings option site in late 2010; and two piezometer drill holes completed in late 2010 near the existing tailings pond dam. The diamond drill holes completed from 2005 to 2010 were started with NQ-sized core (47.6mm in diameter) or HQ-sized core (63.5mm in diameter) and reduced to NQ-sized core as required. A total of thirty drill holes (numbers KR-08-1269 to KR-08-1300) were drilled for metallurgical purposes in 2008 and are HQ-sized (63.5mm) . Oriented diamond drill holes completed for geotechnical purposes in 2008 (drill hole numbers GT-08-01 to GT-08-12, and HYD-08-01 to HYD-08-12, HYD-08-16 and HYD-08-17) and 2010 (drill hole number GT-10-01 to GT-10-10, and HYD-10-01) are HQ3-sized (61.1mm) and utilized triple tubes and the EZY-Mark core orientation system.
Collar locations are obtained by using a combination of a Leica total station and a Trimble R8 differential GPS. Downhole surveys are done using Reflex Maxibor II downhole survey tool. Prior to 2007 acid tests were used to measure dip changes down hole.
Drill core is currently stored on site. Drill logs are entered directly into a laptop in the core shack using DrillKing software. Recovery and Rock Quality Designation (RQD) are recorded for each hole.
Drilling Targets and Results:
Drilling was successful in extending and/or defining limits of mineralization on the Peel, Tarn, Gully, QB, Hoodoo, and Lab zones. Parts of these remain open. Drilling on the Penguin and Calcite extension of Lab Zone was successful in defining mineralization at the location of magnetic highs.
A lack of significant mineralization was found by the drilling of the Peg-Fury (south of QB zone), Creek, Megawatt (south of Peel area), Nose zone, as well as the previously untested ground between Lab and Peel. The Thrust vein, near Tarn was found to be cut off by a low angle fault at shallow depth.
The results were inconclusive at the Crest, and Freds Vein East Zones; more drilling will be required to either define or disprove significant mineralization at these zones.
Sampling Method and Approach
The sampling procedures associated with the drilling programs utilized by YGC after acquiring the Ketza River property are described in this section. Little is known of the sampling methods employed by earlier operators. Sampling procedures, collection and security for the Issuer were completed under the direction of Qualified Person Ed Gates.
During the diamond drilling programs, geological personnel attended the drill at regular intervals as well as during drilling of mineralized intersections of predicted zone drillholes. Geologic personnel are on hand to determine the completion depth of each hole and to shut down the drillhole. The core is delivered to the core shack at the end of each working shift or when the drillhole is completed.
The core is laid out in sequence at the core shack. The core is logged directly into laptop computers by geologists and sample intervals are marked on the core and recorded on the drill logs. The core is then stored within the core shack and samples are split in sequence. Personnel conducting the sampling are supervised by the geologist who logs the core.
All drill core is logged and photographed before sampling. The descriptions are entered onto prepared log forms on laptop computers using coded entries for lithology, texture, structure and mineralogy.
Oxide and sulfide mineralization are sampled on the basis of geologic features. Maximum sample interval for HQ core is 1.5m and 3.05m for NQ core. The minimum sample interval is 0.2m. Once samples are identified and marked, sample tickets are stapled into the sample locations. Sample intervals and geology are then logged into Drill King software. Once all of the drill hole data is logged and entered into Drill King, the data is imported into an Access drill hole database at the project site and ultimately imported into an acQuire drill hole database.
74
Core is then taken into the splitting room where sampled intervals are split or cut (massive sulfide intervals are cut with a diamond saw. Core from oxide zones often occurs as iron oxide rubble. In these instances, the rubble is sampled with a spoon rather that split or cut.
Half of the sample is placed in the sample bag and half is retained in the core box for future reference. The detachable half of the sample ticket is remove from the core box and placed inside the sample bag. The remaining half of the sample ticket remains in the core box with the corresponding sample number. Core boxes are then remove to a designated core storage yard where they are placed on core racks.
Sealed sample bags are then place in large white rice bags, the rice bags are labeled with the hole number, the contained sample numbers and the rice bag are numbered for transport (i.e. Bag 1 of 6). Rice bags are then placed in an outside storage bin where they await shipping.
Samples are transported by company personnel at least once per week to Canadian Freightways in Whitehorse, Yukon. A sample shipment form is filled out and kept on file, indicating the date, truck being driven, person transporting the samples, hole numbers and number of bags. Upon arrival in Whitehorse, samples are directly loaded upon pallets at Canadian Freightways and shipped to ALS Chemex.
As a rule, core recovery is very good in limestone and sulfide mantos, very good in the Gully vein and the argillite wallrock, moderate in the QB zone stockwork and fault intersections and moderate to poor in the oxide mantos.
Sample Preparation, Analysis and Security of Samples
In the 1980’s Canamax used Northern Analytical Laboratory in Whitehorse, YT and Rossbacher Labs in Burnaby,
BC. For sample preparation and analysis. In 2006-2007, YGC used Eco-Tech labs in Kamloops, BC. In 2006-2007 all sample preparation was done by ALS Chemex in their Elko, Nevada or Terrance British Columbia sample preparation facilities. No sample preparation was done on site.
ALS-Chemex (2006-2010):
Samples are dried at 110-120 C and then crushed with either an oscillating jaw crusher or a roll crusher. The ALS Chemex QC specification for crushed material is that >70% of the sample must pass a 2mm (10 mesh) screen. A whole or split portion derived from the crushing process is pulverized using a ring mill. The ALS Chemex QC specification for final pulverizing is that >85% of the sample be less than 75 microns (200 mesh) A 30g split is fire assayed and the resultant bead is parted and digested with aqua regia, and the final result is measured using Atomic Absorption. Assays above 1.0ppm were re-assayed using a gravimetric finish.
Eco-Tech Labs followed essentially the same process.
Quality Controls and Quality Assurance
2005-2007 (YGC-YNGC)
The YNG laboratory Quality Assurance/Quality Control (QA/QC) program consists of inserting a blank sample into the sample stream at the top of every hole and then inserting either a standard sample or blank sample at every 15th sample. If a hole has less than 15 samples, a standard and blank are inserted at the end of the hole.
The blanks are non-commercial material, composed of locally derived barren limestone, and have not been certified to be of zero grade.
Prior to mid-year 2006, a non-commercial moderate grade “pseudo-standard” was used, which had been collected from a mineralized outcrop in the Ridge pit and blended by hand. When this first “standard” was depleted, a second supply of higher grade material was collected and blended from a local high grade stockpile. These “standards” were inserted simply to ensure that the lab would catch high grade assays, and not necessarily to assess the precision of the lab. The shortfalls of these non-commercial standards was realized, and commercial standards from CDN Resource Laboratories Ltd were used starting in 2006.
75
After mid-year 2006, for manto-styled mineralization Gold Ore Reference Standard CDN-GS-10A (9.78+/ - 0.53g/t) or CDN-GS-10B (8.6 +/- 0.49g/t) was used. For stockwork-style mineralization Gold Ore Reference Standard: CDN-GS-2B (2.03 +/- 0.12g/t) was used.
Due to communication issues, the standard insertion protocol was not strictly adhered to once a particular standard supply was depleted. There were minor labeling issues where blanks and standards had labels swapped, or the wrong standard label was recorded. These issues were identified and corrected as confirmed by comparing the geochemistry of the multi-element assay results to those of the standards. The problems reflected an issue with check sample handling and not with lab results.
Occasionally, higher-grade gravimetric assays were re-assayed as a check; all of these refires were within acceptable ranges of the original
Interpretation
Graphs were plotted for each set of standards, and blanks. These are shown in Figures 14 to 17. With the exception of a few anomalies which may represent mislabeled samples, most of the commercial standards behave as well can be expected. Only a few assays are outside of the 2 standard deviations range, and most are within one standard deviation. The non-commercial standards assayed with a much wider variation, but consistently showed elevated grades as would be expected, although not at precise grades as one would expect from the commercial standards. The blank samples show several anomalous results which may be due to mislabeled samples, sample preparation contamination, or anomalous gold present within the blank.
Figure 14: Laboratory QA/QC Blank Samples
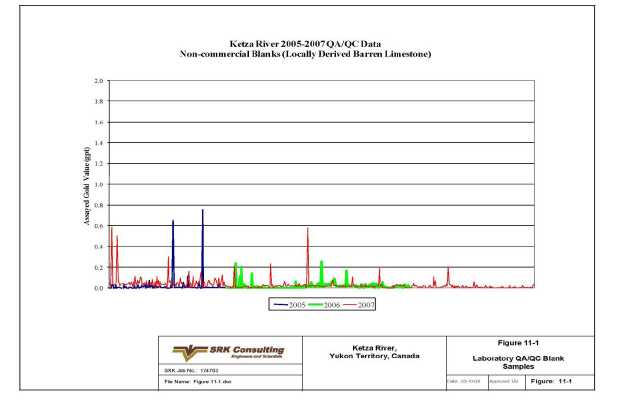
76
Figure 15: Laboratory QA/QC 1-2g Commercial Standards
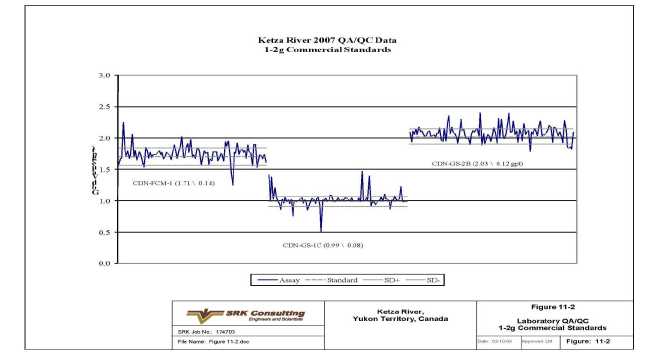
Figure 16: Laboratory QA/QC 10g Commercial Standards
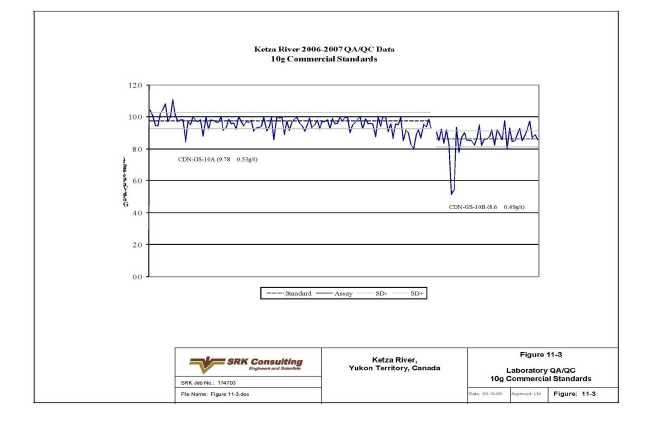
77
Figure 17: Laboratory QA/QC,Non-Commercial Standards

.Mineral Resource and Mineral Reserve Estimates
A series of standard cyanide leach tests was run under various conditions of grind, pre-aeration and leach time, with and without CIL (carbon-in-leach). The precise conditions of the individual tests are reported, along with the results, in Lakefield Research (1986a, 1986b, 1987).
The initial results reported by Lakefield (Lakefield Research (1986a, 1986b) indicated that excellent gold recoveries (over 94%) could be achieved at a relatively course grind (69% minus 200 mesh) and 48hr retention time, without pre-aeration. Residues contained significantly less than 1g/t-Au. These tests were carried out on a single composite sample.
A series of nine additional samples from the oxide zone was subjected to confirmatory tests (Lakefield Research, 1987). The recoveries on these tests were significantly lower, with only two samples yielding residues below 1g/tAu. Average recoveries were 87%. Further tests at finer grinds (80% minus 200 mesh) were carried out on these nine samples, and although recoveries fell short of those anticipated from Lakefield Research (1986a and 1986b), they were consistently over 90%.
The Issuer in 2008 conducted a diamond drilling sampling and testing program to determine metallurgical characteristics of the ore types that comprise the current resource. The 2008 test work was conducted by PRA Labs (now called Inspectorate Labs) and a summary report is in progress and will be included in the upcoming NI 43-101 report due in early 2011. The updated NI 43-101 report will include a revised resource estimate based on the 2008 drilling and a new geologic model generated by Todd Johnson, Vice President of Exploration for Yukon-Nevada Gold Corp., and Karl Swanson, Mining Consultant, using Vulcan software. The updated Ketza River mine resource will be done by Mark Odell, Mining Consultant.
In 2007, the Issuer undertook a complete update of the Ketza River resource estimate. Compared to previous estimates, the 2007 update included 637 additional drillholes in the resource database and reflected a significantly enhanced understanding of geologic controls on mineralization in both the manto and Shamrock zones. The 2007 resource estimate was also undertaken with a view to transition the Project from an exploration project to a feasibility/development project.
78
Accordingly, the focus of the 2007 resource estimate was to identify measured and indicated resource shapes with grades and continuity that could serve as the starting points for definition of mineable shapes and reserves as part of the ongoing pre-feasibility study that the Issuer has commenced on the property. Unlike previous resource estimates, a hard geologic boundary was used to tightly constrain resource shapes in three dimensions.
The resource estimation was done by Russ White (SRK) with assistance in wireframe modeling and input from Larry Snider (the Issuer). Larry Snider also performed the pit optimizations used for distinguishing Open Pit from Underground resources.
The drill hole database is currently maintained at the Ketza Minesite in acQuire software, and was transferred from a Drill King database in late 2007. As of this reporting date (March 14, 2011), the Ketza acQuire drill hole database contains information for 1,691 drill holes, including 1,029 core holes from the 2005 to 2010 programs (5 diamond drill holes drilled in late 2010 still need to be assayed and imported into the database), 591 core holes from pre-2005 programs (1984-1996), and 95 RC holes from 1987.
The December 31, 2007 NI 43-101 resource estimate was conducted using information from 1,360 drill holes, including 674 core holes from the 2005 to 2007 programs, 591 core holes from pre-2005 programs (1984-1996), and 95 RC holes from 1987.
Data for the December 31, 2007 NI 43-101 was extracted from acQuire and imported to Vulcan in 4 separate tables.
- Collar Location Surveys–Hole ID, Northing, Easting, Elevation and Hole Depth;
- Downhole Orientation Surveys - Downhole depth, Azimuth and plunge of hole at various downhole depths;
- Geologic Logs – Table 24 lists the fields recorded in drillholes from 2005 to 2007. Only the LCODE field was entered in the database for previously drilled holes. Table 25 lists the common lithologies logged at Ketza River; and
- Assays -From, to, and gold assay
Table 24 Geology Database Fields
| Field | Description | Entry |
| LCODE | Lithology Code | Alpha Code |
| STR1 | Structure 1 | Alpha Code |
| STR2 | Structure 2 | Alpha Code |
| TXTR1 | Texture 1 | Alpha Code |
| TXTR2 | Texture 2 | Alpha Code |
| PO | Pyrrhotite | Percentage |
| PY | Pyrite | Percentage |
| APY | Arsenopyrite | Percentage |
| CPY | Chalcopyrite | Percentage |
| OXMIN | Primary Oxide Mineral | Alpha Code |
| OXINT | Intensity of oxidation | Alpha Code |
| Description | Geologic Description | Freeform Alpha |
Table 25 Most Common Lithology Codes
| LCODE | Description | LCODE | Description |
| MSLT | Massive-oolitic limestone | BSLT | Black siltstone |
| WBN | Wispy banded limestone | SQA | Siltstone/Quartzite/Argillite |
| ARG | Argillite | VEIN | Vein |
79
| LCODE | Description | LCODE | Description |
| LST | Limestone | CAS | Casing |
| FSLT | Fossiliferous limestone | QTE | Quartzite |
| ARS | Argillite/Siltstone | FZ | Fault zone |
| OXIDE | Oxide Mineralization | QAS | Quartzite/Argillite/Siltstone |
| SULF | Massive sulfide(>50%) | BA | Black argillite |
| QSA | Quartzite/Siltstone/Argillite | OVB | Overburden |
| MUD | Mudstone | HFLS | Hornfels |
| SAQ | SLT/ARG/QTE | AQS | Argillite/Quartzite/Siltstone |
| BXLT | Blue crystalline limestone | PHIL | Phyllite |
| SLT | Siltstone | QTZ | Quartz |
| ASQ | Argillite/Siltstone/Quartzite | GO | Gouge |
The gold value was recorded in the database using the following priority: average of fire assays, if available, single fire assay if available, or AA assay. Unsampled intervals are omitted from the database and treated as zero values in the compositing routine, and lost-core intervals recorded as -9. Previous databases had recorded below-detection-limit (BDL) assays as values ranging from 0.015 to 0.000 depending on the detection limit and the person doing data entry. The lowest detection limit from any program was 0.005g/t, so a standard BDL value of 0.001g/t was chosen as a flag that the sample was actually assayed, but had negligible gold. Raw assays were capped at 100g/t for all deposits, which affected 8 assays out of 29,650 assays. Further reduction of risk due to anomalous assays was accomplished with high-grade distance restrictions during estimation.
Of the 1,360 drillholes in the Ketza database, 82 Drillholes were rejected from the database due primarily to irreconcilable location issues. A few were rejected due to the hole orientation which drilled directly down the vein making any given intercept biased or unable to be extrapolated accurately to any given volume. Three RC holes were also rejected due to likely downhole contamination. Figure 18 is a drillhole location map showing the drilling that was used for resource estimation. Another 34 “non-resource” holes contained no significant mineralization and were drilled outside of any deposit of interest. Although they were not specifically excluded they had no influence on this resource estimate. Another 35 were drilled in the Knoll Zone which is essentially mined out and therefore was not estimated. Table 26 is a summary of drillholes used and rejected by model area.
Table 26: Summary of Drillholes used and Rejected by Model Area
| | Used for Resource | Rejected | Non-Resource | Total |
| Model | Number | Length | Length | Number | Length | Length | Number | Length | Length | Number | Length | Length |
| Area | of Holes | Drilled | Sampled | of Holes | Drilled | Sampled | of Holes | Drilled | Sampled | of Holes | Drilled | Sampled |
| PEEL | 583 | 51,502 | 14,111 | 38 | 2,857 | 923 | 26 | 4,121 | 2,510 | 647 | 58,480 | 17,545 |
| PENG | 335 | 38,575 | 12,312 | 20 | 1,871 | 772 | 7 | 790 | 144 | 362 | 41,236 | 13,228 |
| SHAM | 216 | 27,133 | 18,702 | 10 | 2,101 | 1,434 | | | | 226 | 29,234 | 20,136 |
| TARN | 75 | 6,452 | 1,901 | 12 | 442 | 108 | 1 | 106 | 26 | 88 | 7,000 | 2,035 |
| KNOLL | | | | 2 | 327 | 320 | 35 | 1,379 | 246 | 37 | 1,706 | 566 |
| Total | 1209 | 123,662 | 47,028 | 82 | 7,597 | 3,557 | 69 | 6,396 | 2,926 | 1360 | 137,656 | 53,510 |
Mineralized envelopes were defined based upon lithology codes and gold assays, and modeled as wireframes in either Minesite or Vulcan software. In most areas these represent limestone hosted “manto” and “chimney” zones. In the Shamrock model area, these are siliciclastic hosted veins and stockworks. Fifty-two separate wireframes were created, 23 in the Peel Area, 13 in the Penguin-Lab area, 12 in the Shamrock area, and 4 in the Tarn area. The locations of these shapes are shown in Figure 19. Cross-sections are shown in figures 19 through 21.
80
Figure 18: Drillhole Locations and Modeled Areas with Deposit Names
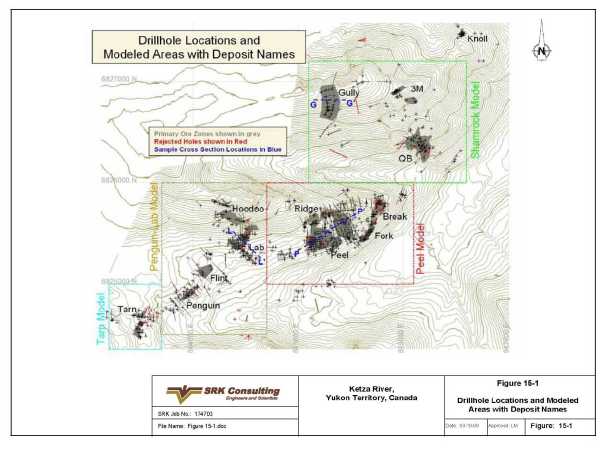
Figure 19: Cross-Section, Peel Deposit
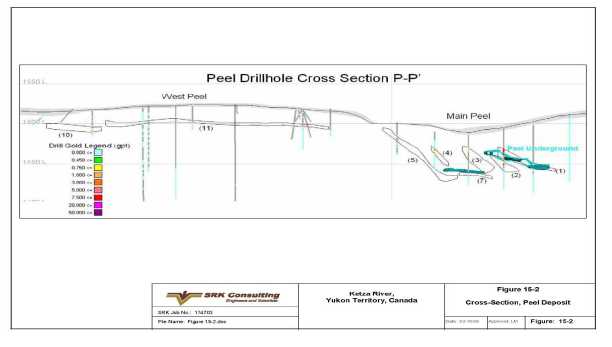
81
Figure 20: Cross-Section, Gulley Deposit
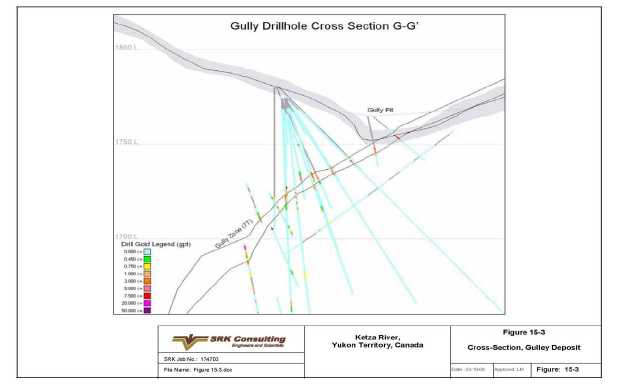
Figure 21: Cross-Section, Lab Deposit
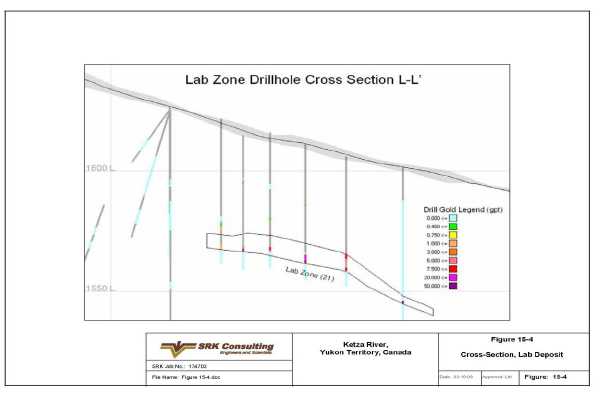
82
The geologic database was used to determine the intensity of mineralization, and the oxidation state of the mineralization. A temporary field calledTotSu was derived by adding the percentages of all of the logged sulfides (PO+PY+APY+CPY).
An oxidation code was calculated based upon the geologic logs, with influence from the LCODE, the total sulfides and the OXINT fields:
The resulting codes (valued 1 through 5) can be described as follows:
| | 1. | Massive Oxide. |
| | 2. | Moderate Oxide. |
| | 3. | Moderate or Unmineralized. |
| | 4. | Moderate Sulfide. |
| | 5. | Massive Sulfide. |
The highly variable specific gravity of the ore mineralization has been a significant issue at Ketza in the past. The oxide mineralization is very light, and the sulfide material is extremely heavy. Estimates made prior to mining did not adequately account for this. Very high-grade oxide material was extrapolated into sulfide areas and ounces were over-estimated. Due to this issue, exhaustive studies were undertaken by Canamax in the late 1980’s to get a more accurate density factor for the oxide material which was their primary mill feed.
In 2006 numerous density measurements were made on sulfide ore, yielding an average density of 4.2 for sulfide ore in the Flint, Gulley, Fred’s Vein and Tarn areas.
In late 2007, specific gravity measurements were collected for 101 samples from across the entire deposit area. Due to the relatively few samples measured and the apparent irrelevance of area on the measurements, samples were analyzed primarily by lithology/ore type. Only a few samples of pure oxide and sulfide material were collected for this program because exhaustive studies had been made of these previously by Canamax in the late 1980’s and YGC in 2005-2006. The samples taken in 2007 confirmed these previous studies and that the average SG of the unmineralized material is 2.75. Based upon the results form all of the studies, the following scheme was used for assigning specific gravity values to each drillhole composite:
| | | Default: SG = 2.75; |
| | | High-grade default, Au greater than 5.0g/t: SG = 3.1; |
| | | Oxide: SG = 2.2; |
| | | Moderate oxide: SG = 2.5; |
| | | Moderate Sulfide: SG = 3.7; and |
| | | Sulfide: SG = 4.2. |
Table 27 lists the average and minimum and maximum SG values for the various rock types at each of the areas.
83
Table 27: Statistics for SG Data
| Material-> | ASQ + Min (Qtz Vn) | Dilution | Host Rock | LS + Min | Oxide | Sulf |
| Area | # | Avg | Min | Max | # | Avg | Min | Max | # | Avg | Min | Max | # | Avg | Min | Max | # | Avg | Min | Max | # | Avg | Min | Max |
| Flint | | | | | 2 | 2.84 | 2.75 | 2.93 | 2 | 2.79 | 2.74 | 2.83 | 3 | 2.74 | 2.69 | 2.81 | | | | | 3 | 4.50 | 4.30 | 4.67 |
| FV | 3 | 2.76 | 2.68 | 2.84 | 2 | 2.77 | 2.73 | 2.80 | 2 | 2.72 | 2.64 | 2.80 | | | | | | | | | 3 | 4.19 | 3.93 | 4.36 |
| Gully | 5 | 2.83 | 2.7 | 3.24 | 3 | 2.76 | 2.72 | 2.79 | 2 | 2.75 | 2.74 | 2.75 | | | | | | | | | 5 | 4.25 | 4.12 | 4.37 |
| HD | | | | | 3 | 2.51 | 2.21 | 2.66 | 3 | 2.69 | 2.68 | 2.72 | | | | | 5 | 2.21 | 1.89 | 2.50 | | | | |
| Lab | | | | | 2 | 2.77 | 2.71 | 2.83 | 2 | 2.75 | 2.68 | 2.81 | | | | | | | | | | | | |
| Peel | | | | | 5 | 2.90 | 2.36 | 3.96 | 3 | 2.67 | 2.56 | 2.73 | | | | | | | | | | | | |
| Peng. | | | | | 2 | 3.04 | 3.01 | 3.07 | 2 | 2.85 | 2.74 | 2.96 | 3 | 2.75 | 2.65 | 2.9 | | | | | | | | |
| QB | 9 | 2.76 | 2.6 | 3.06 | 9 | 2.92 | 2.72 | 3.97 | 3 | 2.84 | 2.81 | 2.86 | | | | | | | | | | | | |
| Tarn | | | | | 3 | 2.73 | 2.73 | 2.74 | 2 | 2.76 | 2.76 | 2.76 | 5 | 2.86 | 2.64 | 3.4 | | | | | 5 | 4.12 | 3.45 | 4.51 |
| Total | 17 | 2.78 | 2.6 | 3.24 | 31 | 2.83 | 2.21 | 3.97 | 21 | 2.75 | 2.56 | 2.96 | 11 | 2.80 | 2.64 | 3.4 | 5 | 2.21 | 1.89 | 2.5 | 16 | 4.24 | 3.45 | 4.67 |
84
After the Specific Gravity value was assigned, another database field (SGAU) was calculated by multiplyingSG by the Gold Assay. This was used in the compositing process to weight the composites bySG.
Drillhole assay data was composited at downhole lengths of 1.5m, broken at mineralized envelope boundaries. Unsampled intervals were carried at a zero grade. A very few intervals of lost core, usually resulting from highly oxidized mineralized zones, were omitted from the composites. The majority LCODE field was recorded in composites, while SGAU, REDOX, and SG were length-weight averaged as numeric values. After the composites were created, the gold value was back calculated with the formula: AU = SGAU / SG.
Variograms were generated from 1.5m composites for each main group of ore zones (Figures 22 and 23). Each group had at least one orientation which yielded a recognizable variogram structure, but rarely more than one. This is not uncommon for such discontinuous zones with limited spatial extent and moderate drill spacing. The relative similarity of the recognizable variogram ranges, influenced the choice of Major and Semi-Major axis of the search radius in the grade estimation. Variogram model attributes are listed in Table 28.
Table 28: Variogram Model Parameters
| Deposit Area | Nugget | Sill_Dif | Range |
| Peel | 1.20 | 2.2 | 54 |
| Ridge | 0.28 | 1.6 | 51 |
| Fork/Break | 1.50 | 1.1 | 50 |
| Lab | 1.00 | 2.7 | 51 |
| Hoodoo | 1.00 | 4.6 | 60 |
| Peng/Tarn | 1.00 | 1.6 | 45 |
| Gully | 1.00 | 0.7 | 50 |
| QB | 2.00 | 2.0 | 60 |
| 3M | 0.50 | 1.7 | 47 |
Univariate statistics were used to determine high-grade restriction levels for each individual area. The Gully deposit was treated separately from the rest of Shamrock, as it has more consistent high-grade than the QB and 3m zones. Probability plots and grade histograms were reviewed and are summarized below in Table 29. Inside the mineralized envelopes, the Peel area has the most consistent high-grade material, while Shamrock has the least. The high-grade outside of the mineralized envelopes is relatively insignificant, and in some cases high-grade restrictions were not required.
Table 29: Composite Summary Statistics by Model Area
| | Count | g/t-Au | Quartile g/t-Au | HG Limit |
| Model Area | #Assays | Average | Min | Q1 | Q2 | Q3 | Max | g/t-Au |
| Peel Inside | 2,366 | 5.07 | 0.00 | 0.14 | 1.59 | 5.48 | 92.57 | 65 |
| Penguin Inside | 1,038 | 2.74 | 0.00 | 0.02 | 0.77 | 2.81 | 62.89 | 35 |
| Shamrock Inside | 830 | 1.83 | 0.00 | 0.10 | 0.57 | 1.91 | 28.00 | 20 |
| Tarn Inside | 228 | 4.14 | 0.00 | 0.50 | 1.48 | 4.18 | 48.90 | 25 |
| Gully Inside | 246 | 3.29 | 0.00 | 1.21 | 2.03 | 3.64 | 37.60 | 35 |
| Peel Outside | 8,739 | 0.157 | 0.001 | 0.003 | 0.010 | 0.045 | 68.80 | 35 |
| Penguin Outside | 7,401 | 0.102 | 0.001 | 0.001 | 0.006 | 0.028 | 25.40 | NA |
| Sham. Outside | 7,779 | 0.147 | 0.001 | 0.005 | 0.025 | 0.094 | 25.10 | 15 |
| Tarn Outside | 997 | 0.066 | 0.001 | 0.001 | 0.004 | 0.023 | 3.35 | NA |
| Gully Outside | 4,107 | 0.068 | 0.001 | 0.001 | 0.006 | 0.021 | 14.10 | NA |
Four block models were defined for the model areas as shown in Figure 18. Each block model consists of a framework with 5m cube blocks. Wireframes of the 52 mineralized envelopes were used to assign a percentage inside the envelope, and estimations were made separately for the inside and outside block fractions. Any block which had more than 0.5% inside a mineralized envelope was assigned a code corresponding to the wireframe.
85
Grade estimations were made using the inverse distance squared estimation method. A minimum of 3 samples were required with a maximum of 12 composites used for each block. Based on the relative similarity of the recognizable variograms, a standardized search radius of 50m x 50m was used. The minor axis was generally kept down to between 7 and 12m depending on the zone’s thickness and geometry. Zones which did not conform to a plane required wider minor searches to ensure continuous estimation of blocks.
Estimation of block grades for the blocks and fractions outside the mineralized envelope used a consistently narrow search to avoid smearing grades over a spherical region. The orientation of the search radii for the outside blocks varied from region to region depending upon the apparent alignment of ore grades.
AUSG and SG values were estimated in the block models. This was done as a means of weighting the estimation by the specific gravity of the samples. Other variables include number of composites, distance to the closest composite and average distance to composites used in the estimation. Gold values were back calculated with the following formulas by dividing AUSG by SG.
An extra gold variable was estimated simply as a means of applying the high-grade gold restriction. This restriction prevents a composite above a specific threshold from influencing any block beyond a distance which is shorter than the search radius. In this case the restricted search radii used for samples above the threshold was 35m x 35m x 5m inside the mineralized envelopes, and 20m x 20m x 5m for samples outside the mineralized envelopes.
Resources were classified by distance to nearest sample within most ore shapes. Any block which was within 35m of the nearest sample was designated as indicated, except in a few ore shapes which were forced to the designation of inferred. In a few shallow, well-drilled mineral envelopes, measured resources were allowed where the distance to the nearest composite was less than 15m, and at least 12 composites were used to estimate the block. This was allowed in 2 shapes in Peel, 2 in Lab and in the Gully zone in Shamrock. Blocks which were more than 35m from the nearest sample were designated as inferred in all ore shapes. Since these alignments used for “outside” blocks are approximate and subject to revision, all outside block grades are considered inferred.
This mineral inventory of all estimated (unmined) material above a 1.0g cut-off is supplied for comparison to previous resources which were listed in this fashion (Table 30). This is only considered an inventory, as much of the material will likely never be recoverable with an open pit, and should therefore be listed at a higher cut-off.
86
Figure 22: Peel Model Variograms
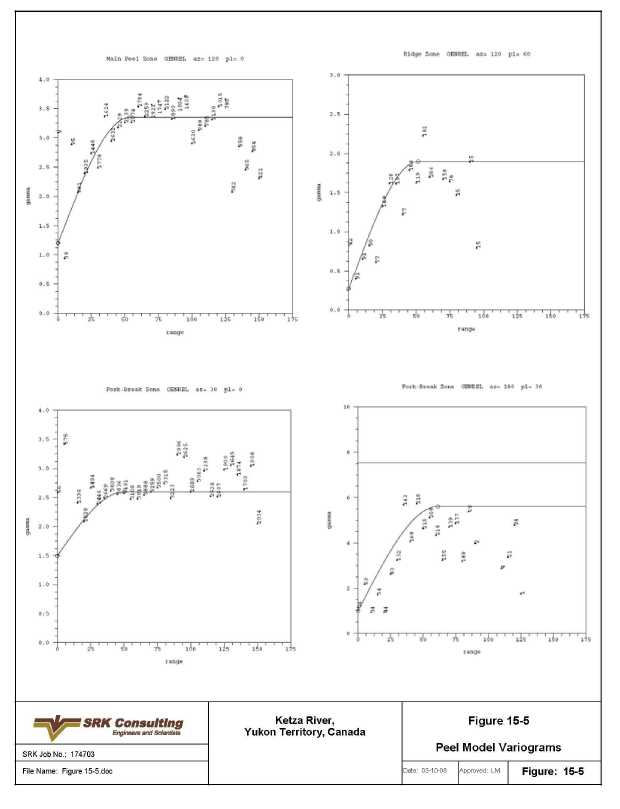
87
Figure 23: Penguin-Lab Shamrock Variograms

88
Table 30 Mineral Inventory at a 1.0g/t CoG
| | Measured + Indicated | Inferred |
| Area | kt | koz | g/t-Au | kt | koz | g/t-Au |
| Peel | 2,444 | 409 | 5.21 | 600 | 45 | 2.31 |
| Penguin-Lab | 965 | 138 | 4.44 | 640 | 41 | 2.01 |
| Shamrock | 1,630 | 149 | 2.85 | 1,292 | 101 | 2.44 |
| Tarn | 86 | 10 | 3.50 | 61 | 4 | 2.07 |
| Total | 5,125 | 706 | 4.29 | 2,593 | 191 | 2.29 |
Resource Definition
In order to distinguish between potential Open Pit Resources and Underground Resources, pit optimizations were performed using Minesights Lerchs-Grossmann implementation. The parameters used for these optimizations were fairly liberal, as this exercise was done simply to determine which blocks could reasonably be expected to be mined at open pit cut-offs. A 1.0g/t resource cut-off was applied to any block that could optimistically be mined by an open pit, and a 3.0g/t cut-off was applied to blocks outside of the optimistic pit, to account for higher underground mining costs for those blocks. This was not done as definition of reserves, simply as a way of eliminating the portion of the Mineral Inventory which could not reasonably be expected to be recovered economically.
Pit Optimization Net Value Calculation
A net value was calculated for every block in the model. The net value considers mining cost, ore (process) cost, and recoverable gold value as outlined below. The block model tracks the fractions of blocks within mineralized envelope wireframes separately from the portion outside of the wireframes. The portion inside the wireframe typically is higher-grade and represents the potential ore portion of the block. Ore costs and recoverable values can be applied to the inside and outside block fractions separately. Calculation of the values outlined below results in the net value for each block.
Mining Cost: The calculation for mining cost is fairly simple and involves multiplying the volume of the block by a tonnage factor to come up with a block tonnage. If blocks intersect topography, the block tonnage is reduced by the percent portion of the block above topo. A $2.82/t value is multiplied by the block tonnage to come up with a per block mining cost. For the purposes of the cost to mine a block of material, a blanket tonnage factor of 2.75t/m3was applied on the premise that changes in density will not markedly change the cost to blast, mine, and haul a given volume of rock as factors such as haul distance and equipment size are usually more important;
Ore Cost:The total process cost and any additional ore tonnage costs are calculated for the potential ore fraction of each block. The per tonnage costs are multiplied only by the tonnage of the potential ore fraction of each block;
Recoverable Value:Likewise, the recoverable value is calculated only for the potential ore fraction of each block. The gold grade is multiplied by price per gram, ore tonnage and the metallurgical recovery;
Ore Revenue:Ore costs per block are then subtracted from the recoverable value, and if the result is positive, this is the ore revenue for the block. If the ore costs exceed the recoverable value, then it is not worth processing the block, and the ore revenue is set to zero; and
Net Value:The net value of the block is simply the ore revenue minus the mining cost. Analysis of net values within the blocks can be used to determine waste, sub-ore, and ore based on mine-cut-off versus mill-cut-off. A waste block will have a negative net value equal to the cost to mine the block. An “ore” block will have a net value of more than zero, and is worth mining by itself. A “sub-ore” block will have a negative net value greater than the mining cost, and is worth processing, but only if it needs to be mined in order to get to an “ore” block.
89
Optimization Parameters
| | Gold Price: | $1,000 US$/troy oz |
| | Metallurgical recovery | 85% |
| | Specific Gravity | SG variable as modelled per block |
| | (for gold content and process costs) |
| | Specific Gravity | 2.75 |
| | (for mining costs) | |
| | Mining cost/t | US$2.82 |
| | Process cost/t-ore | US$12.00 |
These parameters are based on a cost profile assuming an operation of 1,500t-ore/d and an overall 8:1 stripping.
Lerchs-Grossmann Pit Optimization
Once the net values have been calculated, the Lerchs-Grossmann process operates solely on these, using the specified pit slope. In the pit optimization analysis, blocks must contain enough revenue in the VAL fields to not only pay for their own mining, but also help pay for waste blocks above them. Very low-grade blocks (with only minor revenue after process to partially offset their own mining) can have their mining paid for by higher-grade blocks below them, thus they can be treated as a form of incremental ore. Note that the cut-off grade for each block will differ slightly as there are a variety of modelled SG’s which influence the net value in conjunction with the gold grade. The output of the process is a surface file, which can be used in tabulating resources from the block model. The mineral resource for Ketza River is presented in Table 31. Figure 25 is a map showing the extent of the pits resulting from this exercise.
Resource Statement
Table 31: Ketza River Resource Statement
| | Open Pit Resource | Underground Resource | Combined (OP+UG) |
| Area | kt | g/t-Au | koz | kt | g/t-Au | koz | kt | g/t-Au | koz |
| Measured | | | | | | | | | |
| Peel | 303.2 | 7.17 | 69.8 | 2.0 | 4.34 | 0.3 | 305.2 | 7.15 | 70.1 |
| Penguin-Lab | 205.2 | 7.70 | 50.8 | 18.5 | 6.78 | 4.0 | 223.7 | 7.62 | 54.8 |
| Shamrock | 182.5 | 3.65 | 21.4 | 0.8 | 3.78 | 0.1 | 183.2 | 3.65 | 21.5 |
| Tarn | 0.0 | | 0.00 | - | | - | | | |
| Total Measured | 690.9 | 6.39 | 142.0 | 21.3 | 6.43 | 4.4 | 712.2 | 6.40 | 146.5 |
| | | | | | | | | | |
| Indicated | | | | | | | | | |
| Peel | 1,878.6 | 5.14 | 310.6 | 98.9 | 5.73 | 18.2 | 1,977.5 | 5.17 | 328.8 |
| Penguin-Lab | 567.7 | 3.56 | 65.0 | 70.7 | 5.05 | 11.5 | 638.4 | 3.72 | 76.5 |
| Shamrock | 519.6 | 3.58 | 59.8 | 175.8 | 4.74 | 26.8 | 695.5 | 3.87 | 86.6 |
| Tarn | 54.6 | 4.26 | 7.5 | 3.6 | 4.92 | 0.6 | 58.2 | 4.30 | 8.0 |
| Total Indicated | 3,020.5 | 4.56 | 442.9 | 349.0 | 5.09 | 57.1 | 3,369.5 | 4.61 | 499.9 |
90
| | Open Pit Resource | Underground Resource | Combined (OP+UG) |
| Area | kt | g/t-Au | koz | kt | g/t-Au | koz | kt | g/t-Au | koz |
| Measured and Indicated | | | | | | | | | |
| Peel | 2,181.80 | 5.42 | 380.4 | 100.9 | 5.70 | 18.5 | 2,283 | 5.44 | 399.0 |
| Penguin-Lab | 772.9 | 4.66 | 115.8 | 89.2 | 5.40 | 15.5 | 862.1 | 4.74 | 131.3 |
| Shamrock | 702.1 | 3.60 | 81.2 | 176.6 | 4.74 | 26.9 | 878.7 | 3.83 | 108.1 |
| Tarn | 54.6 | 4.26 | 7.5 | 3.6 | 4.92 | 0.5 | 58.2 | 4.3 | 8.0 |
| Total M&I | 3,711.4 | 4.90 | 584.9 | 370.3 | 5.16 | 61.5 | 4,081.7 | 4.93 | 646.4 |
| | | | | | | | | | |
| Inferred | | | | | | | | | |
| Peel | 298.1 | 2.79 | 26.7 | 27.6 | 3.72 | 3.3 | 325.7 | 2.86 | 30.0 |
| Penguin-Lab | 188.1 | 2.33 | 14.1 | 59.9 | 4.14 | 8.0 | 248.0 | 2.77 | 22.1 |
| Shamrock | 229.7 | 2.83 | 20.9 | 225.9 | 5.03 | 36.5 | 455.6 | 3.92 | 57.5 |
| Tarn | 46.3 | 2.20 | 3.3 | - | - | - | 46.3 | 2.2 | 3.3 |
| Total Inferred | 762.2 | 2.65 | 65.0 | 313.4 | 4.74 | 47.8 | 1,075.6 | 3.26 | 112.8 |
Grade tonnage curves were calculated at 0.5g/t cutoff intervals. Figure 26 shows grade tonnage curves for the entire mineral envelope and the grade tonnage curve only within the $1000 gold optimized pit shapes.
91
Figure 25: Optimized Pits, $1,000 Gold
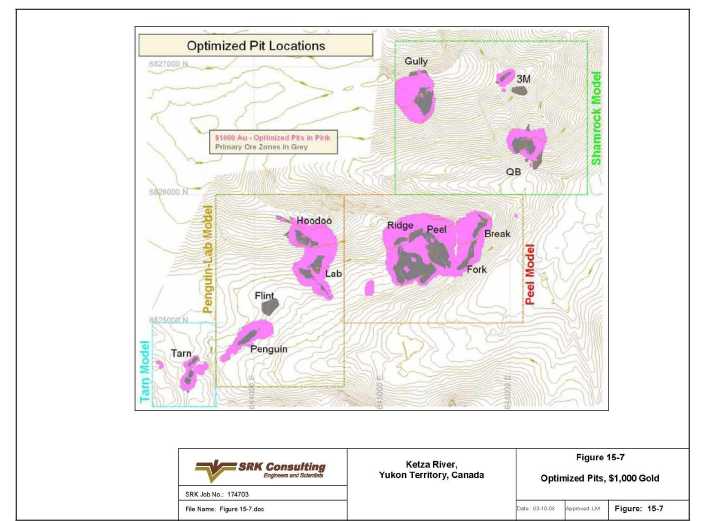
92
Figure 26: Grade Tonnage Curves

93
YESAB Project Proposal Work Summary
A number of studies relating to the YESAB Project Proposal were continued in 2010. EBA Engineering in the Vancouver, Whitehorse, and Edmonton offices are managing this work for Ketza River Holdings Ltd.. The Ketza River Project proposal is being targeted for submission to YESAB in late July 2011.
Geotechnical– Hydrogeology– Condemnation– Monitoring Well Drilling
In support of the project proposal that will be submitted to the Yukon Environmental and Socio-economic Assessment Board (YESAB), a total of 1,233 meters of geotechnical and hydrogeology drilling was conducted for the pit-wall stability program (see Table 32). The results of this drilling was combined with the geotechnical drilling information gathered in 2008 to help support pit-wall slope recommendations for the proposed mine design. Two draft geotechnical reports, one on the manto zone deposits and one on the Shamrock zone deposits, were completed for in-house review in December 2010. A few of these 2010 geotechnical drill holes contained significant assay intervals (e.g. drill hole GT-10-05B in Tarn that intersected 6.21 m averaging 2.24 g/t Au).
Table 32. 2010 Open-Pit Stability Geotechnical and Hydrogeology Drill Hole Summary.
| Area | Drill Holes Completed | Total Meters | Total Footage |
| Peel Zone Geotechnical | 3 | 524 | 1,721 |
| Penguin Zone Geotechnical | 1 | 77 | 252 |
| Tarn Zone Geotechnical | 2 | 145 | 476 |
| Tarn Zone Hydrogeology | 1 | 72 | 236 |
| 3-M Zone Geotechnical | 1 | 103 | 337 |
| Gully Vein Geotechnical | 2 | 312 | 1,024 |
| Total Geotechnical - Open Pits | 10 | 1,233 | 4,046 |
A total of 32 drill holes were also completed in and around the footprint of the proposed lower tailings site to both help support the YESAB project proposal (collect geotechnical soil and rock characteristics) and to condemn the underlying bedrock for potential gold mineralization (see Table 33). Sixteen were diamond drill holes that targeted magnetic anomalies and were designed for either exploration or condemnation purposes. All of these drill holes were logged for geotechnical data and some were used to gather hydrogeology information to help support engineering design studies. Fourteen of the drill holes were completed with a Becker drill and diamond drill core at depth to gather geotechnical information. A few of these drill holes were completed as groundwater monitoring wells. Two monitoring wells were installed at the toe berm of the existing tailings dam as requested by the Yukon Water Board.
Table 33. 2010 Drill Hole Summary in or near the Lower Tailings Option Site to help support the YESAB project proposal.
| | Drill Holes | | |
| Area | Completed | Total Meters | Total Footage |
| Lower Tailings Site Geotechnical, Hydrogeology & Condemnation Core Holes | 16 | 2,695 | 8,843 |
| Lower Tailings Site Geotechnical Becker Holes (diamond drilling at depth) | 14 | 275 | 905 |
| Sub-total Proposed Tailings Site | 30 | 2,970 | 9,748 |
| Tailings Dam Monitoring | 2 | 21 | 70 |
| Total | 32 | 2,991 | 9,788 |
Other 2010 YESAB-Related Project Work
Additional YESAB Project Proposal work completed in 2010 on the Ketza River Project included:
- Site water quality and QA/QC program;
- Hydrogeology data compilation and analysis;
- Hydrotechnical and water balance work;
94
- Socio-economic studies;
- Fish and aquatic studies;
- Tailings design and tradeoff studies;
- Compiling all As-overlimit geochemical data to help support project-wide geochemical and water chemistry studies;
- Wildlife studies conducted by biologists;
- Conceptual engineering studies and project description;
- The Ketza River process flowsheet was designed by John Fox (contract metallurgist);
- Nine representative waste rock samples based on various sulfide mineral and oxide mineral contents were collected and sent to ALS for humidity cell test work at the end of December 2010; ongoing humidity cell testwork is in progress for the three samples started in 2008 (sulfide tailings, oxide tailings, and vein ores);
- Additional ARD/ABA samples (~300) of representative waste rock were also targeted for collection and will be submitted to ALS Lab for testing in January 2011;
- Several meetings with local communities (Ross River and Faro) and local First Nations (Ross River Dena and Teslin) were held in November and December 2010 to update everyone on YNG’s proposed Ketza
River Mine Project; additional meetings are being planned in January 2011 at Teslin; and - Numerous meetings were also held with the Water Board, YESAB, Water Resources, and Energy, Mines and Resources to help advance: the progress for the YESAB Project Proposal; the water license application for the existing tailings pond; and to help address a potential access road maintenance application through the YESAA process.
(c) Silver Valley Property, Yukon
The Issuer was granted an option to acquire a 100% interest in six (6) claims located in the Yukon Territory. The primary focus of exploration for this property will be silver, with a secondary focus on gold, lead and zinc. The Issuer has staked 114 claims around the six claims, and these are registered in the name of the Issuer.
Exploration Drilling
Diamond drilling was conducted at the Silver Valley project during January of 2010. The Silver Valley Property consists mostly of Ag-Pb-Au±Cu±Zn veins and is located approximately 6 kilometres east of the main Ketza River gold project. The K18B mine is a past producer of Ag and Pb and minor Au that operated from 1965 to 1969 (including exploration work) by Stump Mines Ltd. and later again for a brief time in 1980 and 1981 by Iona Silver Mines Ltd. Development work at the K18B vein was reportedly stopped in 1981 when a fire destroyed the compressor shack.
A total of seven drill holes were completed in 2010 which tested two horizontal-loop E-M geophysical anomalies that were identified during the 2007 field season.
Table 5. 2010 Silver Valley Exploration Drilling Summary.
| Target | Drill Holes Completed | Total Meters | Total Footage |
| River’s Edge | 5 | 817 | 2680 |
| K-18B South | 2 | 428 | 1404 |
| Total | 7 | 1245 | 4084 |
Drilling
Drilling at the Silver Valley Project in 2010 focused on the River’s Edge and K18B South targets. Five drill holes were completed at the River’s Edge target which identified three sub-parallel quartz-siderite-pyrite veins with minor amounts of galena and tetrahedrite. The highlight was SV-10-70 which intercepted 0.9 meters grading 5.25 g/t Au, 27.7 g/t Ag and 0.16% Cu.
95
Two drill holes were also completed on the north end of the K-18B South target. This target may be a fault-offset of the K-18B Vein which was the focus of drilling in 2007. The two drill holes intersected two pyrite-dominant veins approximately 3 meters in width. Galena, sphalerite, tetrahedrite and stibnite were also present in these vein zones. The best intercept came from drill hole SV-10-75 which intersected 1.39 meters that assayed 103 g/t Ag, 0.4% Pb, 0.28 g/t Au, and 0.2% Cu.
Reclamation
During the 2008 field season, a total of 557 meters of trenches were excavated for exploration purposes using a track-mounted excavator. These trenches were re-contoured late in the 2010 field season.
(d) Other Properties
Bay Property, Yukon – The Issuer has staked 36 claims near Watson Lake, Yukon. The primary focus of exploration for this property will be silver.
Silver Bar, Arizona -The Issuer has a 100% interest in 55 claims in Pinal County, Arizona. The focus of exploration of this property will be gold and copper. In 2010 the Issuer reduced the carrying value to a nominal amount as management has no current plans to conduct exploration t this property.
Greenwood properties -The Issuer owns a 75% interest in 31 claims in the Greenwood Mining District in southeast British Columbia. These claims are subject to a 2% net smelter returns royalty. The remaining 25% interest in this gold property is owned by Intrepid Minerals Corporation. This property was written down to a nominal amount in the 2007.
ITEM 5: DIVIDENDS AND DISTRIBUTIONS
5.1Dividends and Distributions
To date, the Issuer has not paid any cash dividends or distributions on its securities. The Issuer does not have any restriction that could prevent it from paying dividends or distributions and has no dividend or distribution policy.
ITEM 6: DESCRIPTION OF CAPITAL STRUCTURE
6.1General Description of Capital Structure
The Issuer is authorized to issue an unlimited number of shares without par value (the “Shares”). 699,117,596 Shares are issued and outstanding as at March 31, 2011. The Issuer also has 21,175,932 Share Purchase Warrants (the “Warrants”) issued and outstanding. Each warrant, when exercised, will entitle the holder to purchase one common share of the Issuer at a price of $3.00 per share on or before June 20, 2012.
Holders of the Shares of the Issuer shall be entitled to notice of, to attend and vote at any meeting of the shareholders of the Issuer and to one vote per share on a ballot. Shareholders will be entitled to receive dividends as and when declared by the Board of Directors of the Issuer as a class, subject to prior satisfaction of all preferential rights to dividends attached to all shares of other classes of shares ranking in priority to the Issuer’s Shares in respect of dividends. Shareholders shall be entitled in the event of any liquidation, dissolution or winding-up of the Issuer, whether voluntary or involuntary, or any other distribution of the assets among its shareholder for the purpose of winding-up its affairs, and subject to prior satisfaction of all preferential rights to return of capital upon dissolution attached to all shares of other classes of shares ranking in priority to Shares in respect of return of capital on dissolution, to share rateably, together with the holders of shares of any class of shares ranking equally in respect of return of capital, in such assets of the Issuer as are available for distribution.
96
6.2Constraints
There are no constraints imposed on ownership of securities of the Issuer to ensure that the Issuer has a required level of Canadian ownership.
6.3Ratings
The Issuer has not received a security rating with respect to its Shares.
ITEM 7: MARKET FOR SECURITIES
7.1Trading Price and Volume
The following table sets out the market price range and trading volume of the Shares on the Exchange under the symbolYNGfor the periods indicated:
| | Period | High ($) | Low ($) | Close ($) | Volume |
| 2010 | January | $0.30 | $0.21 | $0.22 | 1,909,600 |
| | February | $0.24 | $0.20 | $0.21 | 563,700 |
| | March | $0.28 | $0.21 | $0.24 | 2,097,300 |
| | April | $0.28 | $0.19 | $0.24 | 1,147,300 |
| | May | $0.24 | $0.18 | $0.20 | 997,100 |
| | June | $0.28 | $0.18 | $0.24 | 2,939,900 |
| | July | $0.33 | $0.23 | $0.29 | 4,411,500 |
| | August | $0.62 | $0.29 | $0.47 | 13,002,500 |
| | September | $0.76 | $0.39 | $0.67 | 5,350,200 |
| | October | $0.75 | $0.65 | $0.73 | 6,455,400 |
| | November | $0.90 | $0.51 | $0.85 | 6,255,200 |
| | December | $0.90 | $0.77 | $0.87 | 2,177,000 |
| 2011 | January | $0.87 | $0.57 | $0.68 | 3,696,800 |
| | February | $0.83 | $0.64 | $0.79 | 13,583,700 |
| | Week ending March 4 | $0.80 | $0.75 | $0.79 | 1,564,600 |
| | Week ending March 11 | $0.78 | $0.71 | $0.76 | 2,103,100 |
| | Week ending March 18 | $0.74 | $0.65 | $0.72 | 2,848,300 |
| | Week ending March 25 | $0.73 | $0.68 | $0.71 | 1,746,900 |
The Issuer also has 21,175,932 warrants issued and outstanding which, commencing November 7, 2007, traded on the Exchange under the symbolYNG.WT. The Warrants expire on June 20, 2012.
| | Period | High ($) | Low ($) | Close ($) | Volume |
| 2010 | January | $0.11 | $0.07 | $0.11 | 184,000 |
| | February | $0.06 | $0.02 | $0.03 | 458,500 |
| | March | $0.07 | $0.02 | $0.04 | 260,770 |
| | April | $0.05 | $0.04 | $0.04 | 30,000 |
| | May | N/A | N/A | N/A | 0 |
| | June | $0.05 | $0.05 | $0.05 | 2,000 |
| | July | $0.07 | $0.05 | $0.05 | 56,000 |
| | August | $0.095 | $0.05 | $0.10 | 209,100 |
| | September | $0.145 | $0.035 | $0.11 | 438,925 |
| | October | $0.145 | $0.065 | $0.11 | 94,800 |
| | November | $0.15 | $0.075 | $0.075 | 397,700 |
| | December | $0.15 | $0.13 | $0.145 | 159,700 |
| 2011 | January | $0.145 | $0.13 | $0.145 | 3,000 |
| | February | $0.145 | $0.08 | $0.10 | 112,100 |
97
| | Period | High ($) | Low ($) | Close ($) | Volume |
| | Week ending March 4 | N/A | N/A | N/A | 0 |
| | Week ending March 11 | $0.10 | $0.10 | $0.10 | 5,500 |
| | Week ending March 18 | $0.14 | $0.12 | $0.14 | 69,300 |
| | Week ending March 25 | N/A | N/A | N/A | 0 |
7.2Prior Sales
The Issuer does not have any class of securities which are outstanding but not listed or quoted on a marketplace.
ITEM 8: ESCROWED SECURITIES AND SECURITIES SUBJECT TO CONTRACTUAL RESTRICTION ON TRANSFER
8.1Escrowed Securities and Securities Subject to Contractual Restriction on Transfer
As at December 31, 2010 no Shares of the Issuer were subject to escrow restrictions.
ITEM 9: DIRECTORS AND OFFICERS
9.1Name, Occupation and Security Holding
| Name of Director/Executive | | | | |
| Officer, Province or State and | | Principal Occupation during the past five | | Current Position and Date of |
| Country of Residence | | years | | Appointment |
Robert F. Baldock(1)(3) (4) (5) (6) (7)
British Columbia, Canada | | President and Chief Executive Officer of the Issuer; President and Chief Executive Officer of Monument Mining Limited; June 2005 to date. | | President and CEO since May 21, 2009 and director since April 12, 2009 |
Graham Dickson(5)(6)
British Columbia, Canada | | President of Celec Inc., June 1993 to date. | | Chief Operating Officer since May 21, 2009 and a director since April 17, 1997. |
Francois Marland(6)
Switzerland | | Lawyer until 2010. | | Director and Vice Chairman since July 2, 2010 |
Symeon Solomonidis(5)
Switzerland | | Independent Consultant since 2008; Director of Software for Hewlett Packard from 1976 to 2008. | | Director since August 1, 2009 |
Jean-Edgar de Trentinian
Switzerland | | President and CEO of Orifer SA.; Director of Carrefour SA from 1993 to 2008. | | Director since August 1, 2009 |
Jay W. Schnyder(1)(2)
Switzerland | | A member of the management committee (Head of Refining) of MKS Finance SA, | | Director since May 13, 2010 |
Pierre Besuchet(3)
Switzerland | | Director the Faisal Private Bank (Switzerland) and the Indufina Industrielle et Finance Holding (Switzerland) and is a director of the following North American Companies: W2 Energy Inc., FNDS3000 Corp and Solar Energy Initiatives, Inc. | | Director since May 13, 2010 |
Gerald B. Ruth(1)(2) (3) (4) (5) (7)
Ontario, Canada | | CEO of Gersan Capital Corp. and a Director of Eagle Hill Exploration Corp.; an independent corporate finance consultant since 2003 | | Director since May 13, 2010 |
98
| Name of Director/Executive | | | | |
| Officer, Province or State and | | Principal Occupation during the past five | | Current Position and Date of |
| Country of Residence | | years | | Appointment |
John Greenslade(2)(4) (5)
British Columbia, Canada | | President of Baja Mining Corp. since April 20, 2004, President of Catalyst Copper Corp. (a mineral exploration company). | | Director and Chairman since May 13, 2010 |
| Shaun Heinrichs(7)British Columbia, Canada | | CFO of the Issuer since November 2008, controller of the Issuer since January 2008; Senior Manager, Finance at BC Hydro & Power Authority from February 2007 to February 2008; International Accounting Manager at PMC Sierra from July 2006 to February 2007. | | Chief Financial Officer from November 21, 2008 to date, Controller since January 31, 2008 to November 20, 2008 |
Graham Scott
British Columbia, Canada | | Lawyer; Principal, Vector Corporate Finance Lawyers from July 1, 2001 to date. | | Secretary since May 19, 2005 |
Todd Johnson
Nevada, USA | | Vice President of the Issuer since April 2010; independent consultant from December 2006 to March 2010; Project Manager at AMEC Earth and Environmental from September 2004 to November 2006 | | Vice President of Exploration since April 1, 2010 |
| (1) | Member of the Audit Committee |
| (2) | Member of the Compensation Committee |
| (3) | Member of the Corporate Governance Committee |
| (4) | Member of the Special Committee |
| (5) | Member of the Disclosure Committee (Corporate Disclosure Policy) |
| (6) | Member of the Strategic Committee |
| (7) | Member of the Audit Sub-Committee (Financial Disclosure) |
The directors are elected at the Annual General Meeting for a period of one year. The Issuer’s next Annual General Meeting is scheduled to be held on June 2, 2011 and it is anticipated that all of the above directors will be nominated for re-election. Officers of the Issuer are appointed by the Board of Directors.
As of March 30, 2011, 244,313,500 Shares of the Issuer are beneficially owned, or controlled or directed, directly or indirectly by the directors and executive officers, as a group, representing 34.95% of the issued and outstanding voting securities (699,117,569 Shares).
9.2Cease Trade Orders, Bankruptcies, Penalties or Sanctions
Other than as set out below, during the 10 years prior to the date of this AIF, none of the directors or executive officers of the Issuer or a shareholder holding a sufficient number of securities of the Issuer to affect materially the control of the Issuer, has been a director or officer of any other issuer that, while that person was acting in that capacity:
| (a) | was the subject of an order that was issued while the director or executive officer was acting in the capacity as director, chief executive officer or chief financial officer, or |
| | |
| (b) | was subject to an event that was issued after the director or executive officer ceased to be a director, chief executive officer or chief financial officer and which resulted from an event that occurred while that person was acting in the capacity as director, chief executive officer or chief financial officer . |
Mr. Greenslade is a director of Minterra Resource Corp. (“Minterra”). On April 30, 2009, Minterra received notice from the TSX Venture Exchange (“TSX-V”) that it was being halted from trading as it had less than three directors.
99
All directors and officers, other than John Greenslade, resigned prior to April 30, 2009. John Greenslade remained as a director and officer to attempt to re-structure Minterra for the benefit of its shareholders. On May 11, 2009, Minterra was cease traded by the BC Securities Commission for failure to file financial statements, associated Certificates of Disclosure, and fees. The cease trade order remains in effect. Minterra is currently without financial resources. It recently held a shareholders’ meeting and received approval to consolidate its issued capital as a first step in re-organization to reactivate. Its ability to reactivate will be subject to making satisfactory arrangements with existing creditors and completing share for debt settlements and an equity issue. Further to the cease trade on May 11, 2009, Minterra also received a notice to de-list from the TSX-V on July 3, 2009 and Minterra’s TSX-V listing was transferred to NEX on August 11, 2009. Mr. Greenslade was and currently remains a director of Trigon Uranium Corp. (“Trigon”) (now called IC Potash Corp.), and was advised by the President of Trigon that on August 28. 2007, a document was received by Trigon from the Pennsylvania Securities Commission in regard to a purported cold call to at least one Pennsylvania resident and the offer for sale of units of Trigon by a representative of Coal Harbor Communications (“CHC”) in Vancouver, Canada. In the document from the Pennsylvania Securities Commission, it was stated that: “It is ordered that the Respondents Trigon and CHC, and every successor, affiliate, control person, agent, servant and employee of each of them, and every entity owned, operated, or indirectly or directly controlled or hereinafter organized by or on behalf of them, shall immediately cease and desist from offering and selling the units in the Commonwealth of Pennsylvania, in violation of the 1972 Act, and in particular Section 201 thereof.” Subsequently, discussions were carried out between Trigon and the Pennsylvania Securities Commission with the assistance of the US attorneys of Trigon. Dale Paruk, provided a declaration before the Commonwealth of Pennsylvania where he stated that he was the owner and principal of CHC, that CHC had never been designated or acted as an agent of Trigon, that CHC had been specifically told that no contacts could be made to investors in the United States regarding Trigon’s equity issue by him or any of his associates, that Trigon could only consider offers to purchase its securities from US investors if there were substantial prior relationships or if the potential investors were qualified under US Securities Laws, that he was expressly told not to make cold calls to US residents about Trigon, and the he understood that a “rogue employee” of CHC had made such a call and that as a result that employee had been terminated. On June 24, 2008, the allegations of the Pennsylvania Securities Commission were settled as follows: 1) There was no admission of guilt or denial of the allegations; 2) the Summary Order to Cease and Desist issued on August 28, 2007 was rescinded; 3) Trigon paid investigative and legal costs; and 4) Trigon paid an administrative assessment.
During the 10 years prior to the date hereof, no director or executive officer of the Issuer, or a shareholder holding sufficient securities of the Issuer to affect materially the control of the Issuer has become bankrupt, made a proposal under any legislation relating to bankruptcy or insolvency, or been subject to or instituted any proceedings, arrangement or compromise with creditors, or had a receiver, receiver manager or trustee appointed to hold the assets of the director, executive officer or shareholder.
The foregoing information, not being within the knowledge of the Issuer, has been furnished by the respective directors, officers and shareholders holding a sufficient number of securities of the Issuer to materially control the Issuer.
Subsequent to January 1, 2011, no director or executive officer of the Issuer or a shareholder holding a sufficient number of securities of the Issuer to affect materially the control of the Issuer, is or has been subject to:
| (a) | any penalties or sanctions imposed by a court relating to securities legislation or by a securities regulatory authority or has entered into a settlement agreement with a securities regulatory authority; or |
| | |
| (b) | any other penalties or sanctions imposed by a court or regulatory body that would be likely to be considered important to a reasonable investor making an investment decision. |
100
9.3Conflicts of Interest
The Issuer has adopted, in accordance with Appendix M of the Issuer’s Corporate Governance Manual, a code of conduct and conflict of interest guidelines for directors and officers including disclosure requirements.
ITEM 10: PROMOTERS
10.1Promoters
Under the definition of “promoter” contained in Section 1 of theSecurities Act (British Columbia), Graham Dickson, a director and Chief Operating Officer of the Issuer, is a promoter of the Issuer, since he took the initiative of substantially reorganizing the business of the Issuer. Mr. Dickson beneficially owns or controls or directs, directly or indirectly, 2,396,000 Shares (0.34% of the issued and outstanding) of the Issuer.
ITEM 11: LEGAL PROCEEDINGS
11.1Legal Proceedings
There are no legal proceeding involving the Issuer.
11.2Regulatory Actions
There are no regulatory actions involving the Issuer.
ITEM 12: INTEREST OF MANAGEMENT AND OTHERS IN MATERIAL TRANSACTIONS
12.1Interest of Management and Others in Material Transactions
Each of the following directors and senior officers has an interest in the Issuer’s Stock Option Plan which was approved by the Issuer’s shareholders on May 13, 2010:
| | Position of Optionee | | No. of | Exercise | |
| Name of Optionee | (Director/Officer) | Date of Grant | Shares | Price | Expiry Date |
| Graham Dickson | Director | January. 5, 2007 | 600,000 | $2.77 | Jan. 5, 2012 |
| Graham Scott | Officer | January 5, 2007 | 50,000 | $2.77 | Jan. 5, 2012 |
| Graham Dickson | Director | August. 10, 2007 | 1,000,000 | $1.74 | Aug. 10, 2012 |
| Graham Scott | Officer | August 10, 2007 | 200,000 | $1.74 | Aug. 10, 2012 |
| Shaun Heinrichs | Officer | March 28, 2008 | 200,000 | $1.60 | March 27, 2013 |
| JE de Trentinian | Director | July 26,2009 | 1,000,000 | $0.15 | July 26/2014 |
| Robert Baldock | Director | July 26,2009 | 4,000,000 | $0.15 | July 26/2014 |
| Graham Dickson | Director | July 26,2009 | 4,000,000 | $0.15 | July 26/2014 |
| Simon Solomonidis | Director | July 26,2009 | 500,000 | $0.15 | July 26/2014 |
| Graham Scott | Officer | July 26,2009 | 500,000 | $0.15 | July 26/2014 |
| Shaun Heinrichs | Officer | July 26,2009 | 2,000,000 | $0.15 | July 26/2014 |
| Robert Baldock | Director | March 23, 2010 | 8,000,000 | $0.32 | March 23, 2015 |
| Graham Dickson | Director | March 23, 2010 | 8,000,000 | $0.32 | March 23, 2015 |
| Todd Johnson | Officer | March 23, 2010 | 775,000 | $0.32 | March 23,2015 |
| Francois Marland | Director | July 12, 2010 | 9,000,000 | $0.32 | July 12, 2015 |
| Pierre Besuchet | Director | July 15, 2010 | 1,000,000 | $0.26 | July 15, 2015 |
| Jay Schnyder | Director | July 15, 2010 | 1,000,000 | $0.26 | July 15, 2015 |
| John Greenslade | Director | July 15, 2010 | 1,000,000 | $0.26 | July 15, 2015 |
| Gerald Ruth | Director | July 15, 2010 | 1,000,000 | $0.26 | July 15, 2015 |
| Simon Solomonidis | Director | July 15, 2010 | 500,000 | $0.26 | July 15, 2015 |
101
ITEM 13: TRANSFER AGENTS AND REGISTRARS
13.1Transfer Agents and Registrars
The Registrar and Transfer Agent for the Issuer is:
| Computershare Trust Company of Canada | ComputerShare Investor Services |
| 2nd Floor, 510 Burrard Street | 100 University Ave, 9thFloor |
| Vancouver, B.C., V6C 3B9 | Toronto, ON M5J 2Y1 |
| ITEM 14:MATERIAL CONTRACTS |
| |
| 14.1Material Contracts |
| |
Set forth below are details of every contract, other than a contract entered into in the ordinary course of business, that is material to the Issuer and that was entered into within the most recently completed financial year, or before the most recently completed financial year but is still in effect: |
| 1. | Incentive Stock Option Plan (the “Plan”) authorizing the reservation of no more than 10% of the Issuer’s outstanding Shares for issuance under the Plan. |
| | |
| 2. | Pursuant to Stock Option Certificates dated January 5, 2007, August 10, 2007, March 28, 2008, July 26, 2009, March 23, 2010 and July 12, 2010 the Issuer granted options to Directors and Senior Officers as set out in Item 12.1 above. |
ITEM 15: INTERESTS OF EXPERTS
15.1Names of Experts
Landy A. Stinnett, of SRK Consulting (US), Inc. of Denver, Colorado, USA is the author of the SRK Report referred to in Section 5.4(a) hereof. Mr. Stinnett is a Professional Engineer in Wyoming (#4502).
Russell White and Leah Mach, of SRK Consulting (US), Inc. of Denver, Colorado, USA are the authors of the SRK Report referred to in Section 5.4(b) hereof. Mr. White is a Registered Geologist with the State of Washington (#2293) and Ms. Mach is a Certified Professional Geologist with the American Institute of Professional Geologists (#10940).
Mr. Gates of Spokane, Washington, is a licensed geologist in the state of Washington - #2253. Mr. Gates is also a Certified Professional Geologist with the American Institute of Professional Geologists - CPG#10902.
15.2Interests of Experts
Messrs. Stinnett, White and Gates and Ms. Mach have no registered or beneficial, direct or indirect, interest in the securities of the Issuer.
102
ITEM 16: ADDITIONAL INFORMATION
16.1Additional Information
Additional information relating to the Issuer may be found on SEDAR atwww.sedar.com. Additional information, including directors’ and officers’ remuneration and indebtedness, principal holders of the Issuer’s securities, and securities authorized for issuance under equity compensation plans, if applicable, is also contained in the Issuer’s Information Circular pertaining to its most recent Annual General Meeting that involved the election of directors and in the Issuer’s comparative financial statements and MD&A for its most recently completed financial year.
Set forth below is the additional information required pursuant to Form 52-110F1,Audit Committee Information Required in an AIF:
1.The Audit Committee’s Charter
The Issuer’s audit committee (the “Audit Committee”) is governed by an audit committee charter, the text of which is attached as Schedule “A” to this AIF.
The Audit Committee has also adopted a “Whistleblower Policy”, the text of which is attached as Schedule “B” to this AIF.
The purpose of the Audit Committee is to act as the representative of the Board of Directors in carrying out its oversight responsibilities relating to:
- The audit process;
- The financial accounting and reporting process to shareholders and regulatory bodies; and
- The system of internal financial controls.
2.Composition of the Audit Committee
The Issuer’s audit committee is comprised of three directors, as set forth below:
| Jay Schnyder | Gerald Ruth | Robert F. Baldock |
As defined in NI 52-110, the Board of Directors of the Issuer has determined that Messrs. Ruth and Schnyder are “independent” and all members of the Audit Committee are financially literate, meaning that they must be able to read and understand financial statements.
The Chair of the Audit Committee, Mr. Ruth, has accounting and financial expertise, meaning that he possesses financial or accounting credentials or has experience in finance or accounting.
3.Reliance on Certain Exemptions
At no time since the commencement of the Issuer’s most recently completed financial year, has the Issuer relied on the following exemptions:
| (a) | the exemption in section 2.4,De Minimis Non-audit Services; |
| (b) | the exemption in section 3.2,Initial Public Offerings; |
| (c) | the exemption in section 3.4,Events Outside Control of Member; |
| (d) | the exemption in section 3.5,Death, Disability or Resignation of Audit Committee Member; or |
103
| | (e) | an exemption from National Instrument 52-110,Audit Committees, in whole or part granted under Section 8,Exemptions. |
4.Reliance on the Exemption in Subsection 3.3(2) or Section 3.6
At no time since the commencement of the Issuer’s most recently completed financial year, has the Issuer relied on the exemption in subsection 3.3(2),Controlled Companies, or section 3.6,Temporary Exemption for Limited and Exceptional Circumstances.
5.Reliance on Section 3.8
At no time since the commencement of the Issuer’s most recently completed financial year, has the Issuer relied on the exemption in section 3.8,Acquisition of Financial Literacy.
6.Audit Committee Oversight
At no time since the commencement of the Issuer’s most recently completed financial year, has a recommendation of the Committee to nominate or compensate an external auditor not been adopted by the Board of Directors.
7.Pre-Approval Policies and Procedures
The Committee has adopted specific policies regarding the engagement of the external auditors appointed by the shareholders of the Issuer (the “Auditors”) consistent with the Committee’s charter with a view to ensuring the Auditors’ independence. These pre-approval policies relate to the engagement of audit services, audit-related services and non-audit-related services.
8.External Auditor Service Fees (By Category)
Set forth below are details of fees billed by the Issuer’s external auditor in each of the last two fiscal years for audit services:
| Fiscal Year End | Audit Fees | Audit-Related Fees(1) | Tax Fees(2) | All Other Fees(3) |
| December 31, 2009 | $ 314,850 | $ 30,937 | – | – |
| December 31, 2010 | 210,000 | – | – | – |
| (1) | The aggregate fees billed in each of the last two fiscal years for assurance and related services by the Issuer’s external auditor that are reasonably related to the performance of the audit or review of the Issuer's financial statements and are not reported under “Audit Fees”. |
| (2) | The aggregate fees billed in each of the last two fiscal years for professional services rendered by the Issuer’s external auditor for tax compliance, tax advice and tax planning. |
| (3) | The aggregate fees billed in each of the last two fiscal years for products and services provided by the Issuer’s external auditor, other than the services reported under clauses 1, 2 and 3 above. |
104
| Schedule “A” to the Annual Information Form of |
| Yukon-Nevada Gold Corp.(the "Issuer") |
| |
| |
| CHARTER OF THE AUDIT COMMITTEE |
| |
This charter (the “Charter”) sets forth the purpose, composition, responsibilities, duties, powers and authority of the Audit Committee (the “Committee”) of the Board of Directors (the “Board”) of the Issuer.
1.0 Purpose
The purpose of the audit committee (the “Committee”) is to: (a) assist the Board in fulfilling its oversight responsibilities with respect to financial reporting and disclosure requirements; (b) ensure that an effective risk management and financial control framework has been implemented by management of the Issuer; and (c) be responsible for external and internal audit processes.
2.0 Composition and Membership
The Board will appoint the members (“Members”) of the Committee after the annual general meeting of shareholders of the Issuer. The Members will be appointed to hold office until the next annual general meeting of shareholders of the Issuer or until their successors are appointed. The Board may remove a Member at any time and may fill any vacancy occurring on the Committee. A Member may resign at any time and a Member will cease to be a Member upon ceasing to be a director.
The Committee will consist of three directors that meet the criteria for independence and financial literacy established by applicable laws and the rules of the stock exchange upon which the Issuer’s securities are listed, including National Instrument 52-110 – Audit Committees. In addition, each director will be free of any relationship which could, in the view of the Board, reasonably interfere with the exercise of a member’s independent judgment.
The Board will appoint one of the Members to act as the Chairman of the Committee. The secretary of the Issuer (the “Secretary”) will be the secretary of all meetings and will maintain minutes of all meetings and deliberations of the Committee. In the absence of the Secretary at any meeting, the Committee will appoint another person who may, but need not, be a Member to be the secretary of that meeting.
3.0 Meetings
Meetings of the Committee will be held at such times and places as the Chairman may determine, but in any event not less than four times per year. Twenty-four (24) hours advance notice of each meeting will be given to each Member orally, by telephone, by facsimile or email, unless all Members are present and waive notice, or if those absent waive notice before or after a meeting. Members may attend all meetings either in person or by conference call.
At the request of the external auditors of the Issuer, the Chief Executive Officer or the Chief Financial Officer of the Issuer or any member of the Committee, the Chairman will convene a meeting of the Committee. Any such request will set out in reasonable detail the business proposed to be conducted at the meeting so requested.
The Chairman, if present, will act as the Chairman of meetings of the Committee. If the Chairman is not present at a meeting of the Committee, then the Members present may select one their number to act as Chairman of the meeting.
105
A majority of Members will constitute a quorum for a meeting of the Committee. Each Member will have one vote and decisions of the Committee will be made by an affirmative vote of the majority. The Chairman will not have a deciding or casting vote in the case of an equality of votes. Powers of the Committee may also be exercised by written resolution signed by all Members.
The Committee may invite from time to time such persons as it sees fit to attend its meetings and to take part in the discussion and consideration of the affairs of the Committee.
In advance of every regular meeting of the Committee, the Chairman, with the assistance of the Secretary, will prepare and distribute to the Members and others as deemed appropriate by the Chairman, an agenda of matters to be addressed at the meeting together with appropriate briefing materials. The Committee may require officers and employees of the Issuer to produce such information and reports as the Committee may deem appropriate in order to fulfil its duties.
4.0 Duties and Responsibilities
Subject to the powers and duties of the Board of Directors, the duties and responsibilities of the Committee are as follows:
| A. | The Audit Committee shall review and recommend updates to its terms of reference to the Corporate Governance Committee of the Board of Directors annually. |
| | |
| B. | The Audit Committee shall meet not less often than four times per year. |
| | |
| C. | The Audit Committee shall have responsibility for: |
| | i. | reviewing the financial statements of the Issuer and if appropriate recommending the approval of such financial statements by the Board of Directors; |
| | | |
| | ii. | reviewing the internal financial and accounting, audit and reporting systems controls of the Issuer; |
| | | |
| | iii. | reviewing the independence, qualifications and objectivity of the Issuer's auditors, and making recommendations to the board of directors in the ease of vacancy of an auditor, as to the selection of the Issuer's auditors; |
| | | |
| | iv. | reviewing and recommending auditors' remuneration; |
| | | |
| | v. | reviewing the scope, results and findings of the Issuer's auditors, audit and non-audit services; and |
| | | |
| | vi. | reviewing annually the status of significant current and potential legal matters. |
| D. | The Audit Committee shall ensure that effective lines of communication are maintained with the external auditor, internal auditors, financial management and the board of directors. |
| | |
| E. | The Audit Committee shall review with the auditors of the Issuer the relationships existing between them and the management of the Issuer to ensure an effective liaison in the coordination of audit effort regarding completeness of coverage, avoidance of redundant efforts and the effective use of audit resources. |
| | |
| F. | The Audit Committee shall review, discuss and consider with the auditors their approach to risk assessment, scope and plan of their audits. The review may include: |
| | i. | an annual assessment of areas of greatest risk to the Issuer and steps taken to address those risks; |
106
| | ii. | the annual assessment of the Issuer's insurance coverage, including the adequacy and cost thereof; |
| | | |
| | iii. | the annual audit plan and overall audit universe; |
| | | |
| | iv. | changes made from time to time in the audit universe and reasons therefor; |
| | | |
| | v. | methods employed by management of the Issuer to assess risk and to prioritize the various audit proposals identified in the annual plan as well as unscheduled audit proposals: and |
| | | |
| | vi. | any unusual occurrence affecting the management which may preclude the completion of the audit plan. |
| G. | The Audit Committee shall consider and review with the auditors and management of the Issuer: |
i. the adequacy of the Issuer's internal financial controls;
ii. recommendations for the improvement of the Issuer's accounting procedures and internal financial controls; and
iii. any related significant findings and recommendations together with management's responses thereto.
| H. | The Audit Committee shall review the annual consolidated financial statements which are to he submitted to the board of directors including management's discussion and analysis, if any, contained therein, or in any other relevant documentation. The review, may include: |
| | i. | reports from the auditors as to the results of their examination to date and advise them of any problems regarding financial reporting in the annual report of the Issuer, including any disagreements that may have arisen between the auditors and management in any area: |
| | | |
| | ii. | meeting(s) with management of the Issuer who shall outline any problems as to financial policies, financial reporting or matters relating to internal control and any matters in contention with or under consideration by the auditors or management of the Issuer; |
| | | |
| | iii. | the appropriateness of existing accounting principles being employed and any change in accounting policy or practice which the auditors may refer to in their audit report; |
| | | |
| | iv. | any proposed changes in financial statement presentation or footnote the auditors may recommend: and |
| | | |
| | v. | other matters related to the conduct of the audit which are to be communicated to the Audit Committee under generally accepted auditing standards. |
| I. | The Audit Committee shall review with management of the Issuer and the auditors quarterly interim financial statements and if appropriate recommend approval of such quarterly statements to the board of directors. |
| | |
| J. | The Audit Committee shall consider and review with management: |
| | i. | any difficulties encountered in the course of the audits conducted by the auditors, including any changes to or restrictions on the scope of their work or access to required information; |
| | | |
| | ii. | the internal auditing department budget and staffing and |
107
| | iii. | the internal auditing department charter including the internal audit plan. |
| K. | The Audit Committee shall review legal, regulatory and social matters that may have a material impact on the financial statements, related the Issuer compliance policies and programs and reports prepared to manage and monitor the Issuer compliance policies. The Audit Committee shall receive reports concerning the Issuer's environmental management program on a quarterly basis, and review ongoing environmental compliance Issues. |
| | |
| L. | The Audit Committee shall confirm and assure the independence of the auditors, including a review of management consulting services and related fees provided by the auditors. |
| | |
| M. | The Audit Committee shall meet with management and the auditors in separate executive sessions to discuss any matters that the Audit Committee or these groups believe should be discussed privately with the Audit Committee. |
| | |
| N. | The Audit Committee shall have the power to conduct or authorize investigations into any matters within the Audit Committee's scope of responsibilities. The Audit Committee shall be empowered to retain independent counsel, accountants, or others to assist it in the conduct of any investigation. |
| | |
| O. | The Audit Committee shall perform such other functions as assigned by law or the board of directors, and may review other items of an internal control or risk management nature which may from time to time he brought before the Audit Committee. |
| | |
| P. | The Audit Committee shall conduct a self-assessment at least annually, and discuss the results with the board of directors. |
108
| Schedule “B” to the Annual Information Form of |
| Yukon-Nevada Gold Corp. (the "Issuer") |
| |
| |
| WHISTLEBLOWER POLICY |
| |
The Issuer’s whistleblowing policy is posted on its website at https://www.openboard.info/yng/index.cfm.