
ANNUAL INFORMATION FORM
of
Yukon-Nevada Gold Corp.
#900, 688 West Hastings Street
Vancouver, BC, V6B 1P1
Tel: (604) 688-9427
March 29, 2012
TABLE OF CONTENTS
ii
3
ITEM 1: PRELIMINARY NOTES
1.1 Financial Statements and Forward-Looking Statements
All financial information in this AIF is prepared in accordance with International Financial Reporting Standards (“IFRS”)as issued by the International Accounting Standards Board.
This report contains “forward-looking statements”, including all statements that are not historical facts, and forward looking information within the meaning of the United States Private Securities Litigation Reform Act of 1995 and applicable Canadian Securities legislation. Forward-looking statements include, but are not limited to, statements with respect to the future price of gold, the realization of mineral reserve estimates, the timing and amount of estimated future production, costs of production, capital expenditures, costs and timing of the development of deposits, success of exploration activities, permitting time lines, currency exchange rate fluctuations, requirements for additional capital, government regulation of mining operations, environmental risks, unanticipated reclamation expenses, title disputes or claims and limitations on insurance coverage. Generally, these forward-looking statements can be identified by the use of forward-looking terminology such as “plans”, “expects” or “does not expect”, “is expected”, “budget”, “scheduled”, “estimates”, “forecasts”, “intends”, “anticipates” or “does not anticipate”, or “believes”, or variations of such words and phrases or state that certain actions, events or results “may”, “could”, “would”, “might” or “will be taken”, “occur” or “be achieved”.
With respect to forward-looking statements and the information included in this MD&A, we have made numerous assumptions, including, among other things, assumptions about the price of gold, anticipated costs and expenditures and our ability to achieve our goals, even though our management believes that the assumptions made and the expectations represented by such statements or information will prove to be accurate. By their nature, forward-looking statements and information are based on assumptions and involve known and unknown risks, uncertainties and other factors that may cause our actual results, performance or achievements, or industry results, to be materially different from future results, performance or achievements expressed or implied by such forward-looking information. Such risks, uncertainties and other factors include among other things the following: gold price volatility; discrepancies between actual and estimated production and mineral reserves and resources; the speculative nature of gold exploration; mining operational and development risk; and regulatory risks. See our Annual Information Form for additional information on risks, uncertainties and other factors related.
Although the Company has attempted to identify important factors that could cause actual results to differ materially from those contained in forward-looking statements, there may be other factors that cause results not to be as anticipated, estimated or intended. There can be no assurance that such statements will prove to be accurate, as actual results and future events could differ materially from those anticipated in such statements. Accordingly, readers should not place undue reliance on forward-looking statements. The Company does not undertake to update any forward-looking statements that are incorporated by reference herein, except in accordance with applicable securities laws.
1.2 Date of Information
All information in this AIF is as of March 29, 2012 unless otherwise indicated.
1.3 Glossary of Abbreviations and Terms
Certain abbreviations and terms used throughout this AIF are defined below:
4
| Term | Definition |
| Assay: | The chemical analysis of mineral samples to determine the metal content. |
| Capital Expenditure: | All other expenditures not classified as operating costs. |
| Composite: | Combining more than one sample result to give an average result over a larger distance. |
| Concentrate: | A metal-rich product resulting from a mineral enrichment process such as gravity concentration or flotation, in which most of the desired mineral has been separated from the waste material in the ore. |
| Crushing: | Initial process of reducing ore particle size to render it more amenable for further processing. |
| Cutoff Grade (CoG): | The grade of mineralized rock, which determines as to whether or not it is economic to recover its gold content by further concentration. |
| Dilution: | Waste, which is unavoidably mined with ore. |
| Dip: | Angle of inclination of a geological feature/rock from the horizontal. |
| Fault: | The surface of a fracture along which movement has occurred. |
| Footwall: | The underlying side of an orebody or stope. |
| Gangue: | Non-valuable components of the ore. |
| Grade: | The measure of concentration of gold within mineralized rock. |
| Hanging wall: | The overlying side of an orebody or slope. |
| Haulage: | A horizontal underground excavation which is used to transport mined ore. |
| Igneous: | Primary crystalline rock formed by the solidification of magma. |
| Kriging: | An interpolation method of assigning values from samples to blocks that minimizes the estimation error. |
| Level: | Horizontal tunnel the primary purpose is the transportation of personnel and materials. |
| Lithological: | Geological description pertaining to different rock types. |
| LoM Plans: | Life-of-Mine plans. |
| Material Properties: | Mine properties. |
| Milling: | A general term used to describe the process in which the ore is crushed and ground and subjected to physical or chemical treatment to extract the valuable metals to a concentrate or finished product. |
| Mineral/Mining Lease: | A lease area for which mineral rights are held. |
| Mineral Inventory: | A tabulation of tonnes, grade, and contained metal of all estimated material remaining in the ground that has no economic, mining, or metallurgical parameters applied, and not dependent upon the current fair-market metal price; tables can include data above a specific cutoff grade to help assess potential gross metal quantities and average metal grades. |
| Mining Assets: | The Material Properties and Significant Exploration Properties. |
| Ongoing Capital: | Capital estimates of a routine nature, which is necessary for sustaining operations. |
| Ore Reserve: | See Mineral Reserve. |
| Oxide: | An oxide-bearing mineral; an anion of oxygen in the oxidation state of -2 or a chemical compound formerly containing an oxygen in this state; result when elements are oxidized by oxygen in air. |
| Pillar: | Rock left behind to help support the excavations in an underground mine. |
| RoM: | Run-of-Mine. |
| Sedimentary: | Pertaining to rocks formed by the accumulation of sediments, formed by the erosion of other rocks. |
| Shaft: | An opening cut downwards from the surface for transporting personnel, equipment, supplies, ore and waste. |
| Sill: | A thin, tabular, horizontal to sub-horizontal body of igneous rock formed by the injection of magma into planar zones of weakness. |
| Smelting: | A high temperature pyrometallurgical operation conducted in a furnace, in which the valuable metal is collected to a molten matte or doré phase and separated from the gangue components that accumulate in a less dense molten slag phase. |
| Stope: | Underground void created by mining. |
| Stratigraphy: | The study of stratified rocks in terms of time and space. |
5
| Term | Definition |
Strike: | Direction of line formed by the intersection of strata surfaces with the horizontal plane, always perpendicular to the dip direction. |
| Sulfide: | A sulfur bearing mineral. |
| Tailings: | Finely ground waste rock from which valuable minerals or metals have been extracted. |
| Thickening: | The process of concentrating solid particles in suspension. |
| Total Expenditure: | All expenditures including those of an operating and capital nature. |
| Variogram: | A statistical representation of the characteristics (usually grade). |
Abbreviations
The imperial system has been used throughout the Jerritt Canyon and Ketza River Reports unless otherwise stated. All currency is in U.S. dollars. Market prices are reported in US$ per troy oz of gold. Tons are imperial containing 2,000 pounds. The following abbreviations are used herein.
| Term | Abbreviation | | Term | Abbreviation |
| A | ampere | | ICP | induced couple plasma |
| AA | atomic absorption | | ID2 | inverse-distance squared |
| A/m2 | amperes per square meter | | ID3 | inverse-distance cubed |
| ANFO | ammonium nitrate fuel oil | | IFC | International Finance Corporation |
| Ag | silver | | ILS | Intermediate Leach Solution |
| Au | gold | | kA | kiloamperes |
| AuEq | gold equivalent grade | | kg | kilograms |
| °C | degrees Centigrade | | km | kilometer |
| CCD | counter-current decantation | | km2 | square kilometer |
| CIL | carbon-in-leach | | koz | thousand troy ounces |
| CoG | Cut-off-Grade | | kt | thousand tonnes |
| cm | centimeter | | kt/d | thousand tonnes per day |
| cm2 | square centimeter | | kt/y | thousand tonnes per year |
| cm3 | cubic centimeter | | kV | kilovolt |
| cfm | cubic feet per minute | | kW | kilowatt |
| ConfC | confidence code | | kWh | kilowatt-hour |
| CRec | core recovery | | kWh/t | kilowatt-hour per metric tonne |
| CSS | closed-side setting | | l | liter |
| CTW | estimated true width | | lps | liters per second |
| ° | degree (degrees) | | lb | pound |
| dia. | diameter | | LHD | Long-Haul Dump truck |
| EIS | Environmental Impact Statement | | LLDDP | Linear Low Density Polyethylene Plastic |
| EMP | Environmental Management Plan | | LOI | Loss On Ignition |
| FA | fire assay | | LoM | Life-of-Mine |
| ft | foot (feet) | | lps | liters per second |
| ft2 | square foot (feet) | | m | meter |
| ft3 | cubic foot (feet) | | m2 | square meter |
| g | gram | | m3 | cubic meter |
| gal | gallon | | masl | meters above sea level |
| g-mol | gram-mole | | MARN | Ministry of the Environment and Natural Resources |
| gpm | gallons per minute | |
| g/t | grams per tonne | | MDA | Mine Development Associates |
| ha | hectares | | mg/l | milligrams/liter |
| HDPE | Height Density Polyethylene | | mm | millimeter |
| hp | horsepower | | mm2 | square millimeter |
| HTW | horizontal true width | | mm3 | cubic millimeter |
6
| Term | Abbreviation | | Term | Abbreviation |
| MME | Mine & Mill Engineering | | RQD | Rock Quality Description |
| Moz | million troy ounces | | SEC | U.S. Securities & Exchange Commission |
| Mt | million tonnes | | s | second |
| MTW | measured true width | | SG | specific gravity |
| MW | million watts | | SPT | standard penetration testing |
| m.y. | million years | | st | short ton (2,000 pounds) |
| NGO | non-governmental organization | | t | tonne (metric ton) (2,204.6 pounds) |
| NI 43-101 | Canadian National Instrument 43-101 | | t/h | tonnes per hour |
| OSC | Ontario Securities Commission | | t/d | tonnes per day |
| oz | troy ounce | | t/y | tonnes per year |
| % or pct | Percent | | TSF | total suspended particulates |
| PLC | Programmable Logic Controller | | TSP | tailings storage facility |
| PLS | Pregnant Leach Solution | | µ | micron or microns |
| PMF | probable maximum flood | | V | volts |
| ppb | parts per billion | | VFD | variable frequency drive |
| ppm | parts per million | | W | watt |
| QA/QC | Quality Assurance/Quality Control | | XRD | x-ray diffraction |
| RC | rotary circulation drilling | | yr | year |
| RoM | Run-of-Mine | | | |
1.4 Conversion Table
In this AIF a combination of imperial and metric measures are used with respect to mineral properties located in North America. Conversion rates from imperial measure to metric and from metric to imperial are provided below:
| Imperial Measure = | Metric Unit | Metric Measure = | Imperial Unit |
| 2.47 acres | 1 hectare | 0.4047 hectares | 1 acre |
| 3.28 feet | 1 metre | 0.3048 metres | 1 foot |
| 0.62 miles | 1 kilometre | 1.609 kilometres | 1 mile |
| 0.032 ounces (troy) | 1 gram | 31.1 grams | 1 ounce (troy) |
| 1.102 tons (short) | 1 tonne | 0.907 tonnes | 1 ton |
| 0.029 ounces (troy)/ton | 1 gram/tonne | 34.28 grams/tonne | 1 ounce (troy/ton) |
1.5 Currency
Unless otherwise indicated, all dollar amounts are in Canadian dollars.
1.6 Share Capital
On January 5, 2004 the Company consolidated its Common Share capital on the basis of one post-consolidated share for five pre-consolidated Shares. Unless otherwise expressed, all references in this Annual Information Form are to post-consolidated Shares.
ITEM 2: CORPORATE STRUCTURE
2.1 Name, Address and Incorporation
The full corporate name of the Company is Yukon-Nevada Gold Corp. (the “Company”).
7
| The address of the head office is: | The address of the registered office is: |
| | |
| #900, 688 West Hastings Street | #1040, 999 West Hastings Street |
| Vancouver, BC, V6B 1P1 | Vancouver, B.C. V6C 2W2 |
The Company was incorporated under the laws of the Province of British Columbia under the name “YGC Resources Ltd.” (“YGC”) on May 30, 1988. On January 25, 2002, the Company was struck from the Register of Companies for British Columbia and dissolved. The Company was restored to the Register on August 1, 2003. On January 5, 2004 the Company consolidated its share capital on a five (5) old for one (1) new basis and increased its authorized share capital from 4,000,000 Shares without par value to 100,000,000 Shares without par value. On June 23, 2005, the Company increased its authorized share capital from 100,000,000 Shares without par value to an unlimited number of Shares without par value.
By Combination Agreement dated March 16, 2007 with Queenstake Resources Ltd. (“Queenstake”), the Company entered into an Arrangement with Queenstake, providing for, among other things, the acquisition by the Company of all of the issued and outstanding shares of Queenstake. The Arrangement closed on June 20, 2007, at which time the Company changed its name to its current name.
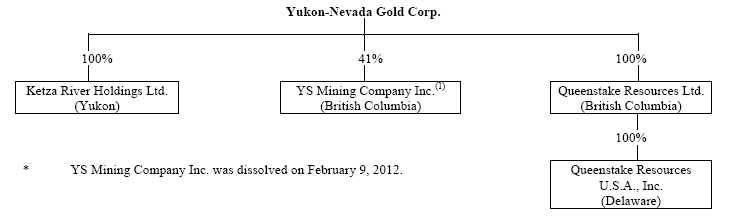
2.2 Intercorporate Relationships
Set forth below are the names of the Company’s subsidiaries:
ITEM 3: GENERAL DEVELOPMENT OF THE BUSINESS
The Shares of the Company were called for trading on the Toronto Stock Exchange (the “TSX”) on April 13, 2005. The Company is active in the evaluation, development and commercial production of mineral properties. The Company’s principal assets are the Jerritt Canyon gold mine, Nevada and the Ketza River property, Yukon Territory. The favourable price for gold has enabled the Company to raise equity financing, the proceeds of which are used to fund improvements to the Jerritt Canyon concentrator facilities and exploration of the Ketza River property.
3.1 Three-Year History
The principal business of the Company is the production of gold in Nevada and the acquisition, exploration and development of mineral properties of merit with a particular focus on gold, silver, zinc and copper properties in the Yukon Territory and British Columbia in Canada and in Arizona and Nevada in the United States.
8
The Company acquired the Jerritt Canyon gold mine upon completion of its plan of arrangement with Queenstake on June 20, 2007. Jerritt Canyon is a gold property with two active underground mines (Smith and SSX-Steer Complex), ore stockpiles and a 1.5 million ton per year capacity processing plant (grinding, roasting and carbon-in-leach circuits). The approximately 119 square miles that comprise the Jerritt Canyon property is host to a number of defined mineral resources and reserves in addition to a significant number of advanced, early stage and district-scale exploration targets with potential to expand the currently defined mineral reserves and resources proximal to the producing mines.
Total underground mine production from Smith Mine and SSX-Steer Complex totals 1,300 tons per day at year end 2011 (1,000 tpd from Smith by contract miner Small Mines Development, LLC and 300 tpd from SSX-Steer being mined by Queenstake Resources staff. Queenstake is targeting to ramp up to 1,200 tons per day production from the SSX-Steer mine in 2012 as more equipment becomes available. The Company has also obtained permitting to develop the Starvation Canyon underground mine which is scheduled to be ready in the second half of 2012 as infrastructure is put in place and equipment delivered. Starvation Canyon will be capable of delivering up to 600 tons of ore per day. This will complete the underground mine development program producing a targeted 2,800 tons per day of ore to the mill.
The Company completed 134,277 feet (220 drill holes) of surface reverse circulation and diamond drilling from several projects throughout the property; 23,942 feet (7,299.3m) of underground diamond drilling (37 drill holes) at the Smith Mine; and 93,753 feet (28,583m) of cubex production drilling (809 drill holes) in 2011 from the Smith and SSX-Steer underground mines. Drilling in 2011 focused on: those areas proximal to existing underground developments to convert inferred resources to measured and indicated resources, and in open pit areas with high potential for quick development (Burns Basin, Steer and Saval Canyon, and Pie Creek). In addition, a Titan 24 geophysical ground survey was conducted at Starvation Canyon that has identified several anomalies that are scheduled for drill testing in 2012.
The January 1, 2011Mineral Resources and Reserveswere updated in a new NI 43-101 Technical Report dated June 28, 2011 as amended on January 6, 2012. Resources have moderately increased from the previous year-end 2007 Technical Report and include: a measured resource of 4,549.9 ktons averaging 0.236 opt Au containing 1,073.1 koz; an indicated resource of 6,459.5 ktons averaging 0.204 opt Au containing 1,316.8 koz Au; and an inferred resource of 3,872.6 ktons averaging 0.194 opt Au containing 751.3 koz Au.Proven and Probable Reservesfrom a total contained ounce perspective remain basically unchanged from the previous year-end 2007 Technical Report and include a proven reserve of 1,406 ktons averaging 0.193 opt Au containing 270.9 koz, and a probable reserve of 2,959.7 ktons averaging 0.151 opt Au containing 446.0 koz.
The Company has owned the Ketza River property in the Yukon since 1994 under a 100% owned subsidiary company called Ketza River Holdings Ltd (“KRHL”). This former producing mine was shut down in November 1990 by the previous owner and operator (Canamax) due to the depletion of known oxide ore reserves identified at that time. The Ketza River property includes 712 mineral claims and leases, a gold mill, a 49-person camp and office facility, and necessary licences and permits to conduct exploration. The Company’s Senior Vice President – Acquisitions and Corporate Development, Graham Dickson, who is also a chemist, identified areas which were under-explored and which could be mined and processed by different methods than those employed in the past including some possibly significant quantities of sulphide ore. To date, the Company has completed the following work at Ketza River: diamond drilling from 1994 to 2011, an updated NI 43-101 Technical Report dated June 28, 2011 that includes the current open pit and underground resources, and pre-feasibility work and permitting work to support the Yukon Environmental and Socio-economic Assessment Board (“YESAB”) application that was submitted in September 2011 for potential Mine development.
Recent activities in 2011 have focused on installation of a 49-person replacement camp, upgrading of the camp infrastructure (new water well and sewer system), YESAB application work, drilling on the margins of the previously identified resource areas and in new exploration targets away from the known resources; and the completion of a NI 43-101 Technical Report on June 28, 2011 that updates the Mineral Resources as of January 25, 2010 with drilling results from 2008.
9
The 2011 exploration program consisted of a drilling program (26 drill holes totalling 14,441 ft. or 4,402m) that focused on the South Hill Target, the NW target, and the Penguin and Hoodoo Zones; 343 surface soil geochemical sampling in the OK target (located northeast of the QB Zone); 176 panel samples taken across the Canamax mill stockpile; sampling the last 13 geotechnical drill holes drilled in late 2010 at the lower tailings site; and the collection of 290 drill hole pulps (completed originally from 2007 to 2010) for duplicate Quality Assurance and Quality Control (QA/QC) analysis at ALS and Inspectorate. Current exploration work at the site is focusing on compiling the assays from the 2011 drilling program to help plan the 2012 drilling program.
Year Ending December 31, 2009
On February 24, 2009 the Company closed a non-brokered private placement of 10,000,000 units (the “Units”) at a price of $0.05 per unit, each Unit comprising one common share (a “Share”), one series “A” share purchase warrant (“A” Warrant”), each “A” Warrant entitling the holder to purchase one additional share at a price of $0.07 for a period of 12 months from the closing and one series “B” share purchase warrant (“B” Warrant”), each “B” Warrant entitling the holder to purchase one additional share at a price of $0.09 for a period of 18 months from the closing for gross proceeds of 3,990,000. A commission of 1,000,000 Shares and 1,000,000 “A” Warrants were issued.
On February 25, 2009, the Company closed a non-brokered private placement of 17,333,333 Units (the “Units”) at a price of $0.06 per Unit, each Unit comprising one common share (a “Share”) and one share purchase warrant (the “Warrant”), each Warrant entitling the holder to purchase one additional share at a price of $0.08 for a period of 24 months from the closing. A commission of 400,000 Units were issued.
Milling operations at the Company’s Jerritt Canyon Mine resumed March 25, 2009 when approvals were received from NDEP on the progress and plans developed by the Company.
On April 12, 2009 Robert F. Baldock was appointed to the Company’s Board of Directors.
On April 24, 2009 the Company closed a non-brokered private placement of 12,000,000 Unit (the “Units”) at a price of $0.06 per Unit, each Unit comprising one common share (a “Share”) and one share purchase warrant (the “Warrant”), each Warrant entitling the holder to purchase one additional share at a price of $0.08 for a period of 24 months from the closing. A commission of 400,000 Units were issued.
At an Annual General Meeting of the Company held on May 21, 2009, Graham Dickson, Robert Baldock, Peter Holbek, John Fox, Neil Steenberg, Don MacDonald, Iain Harris and Robert Chafee were elected to the Company’s Board of Directors. Mr. Dickson concurrently resigned as the Company’s President and Chief Executive Officer and was appointed the Company’s Chief Operating Officer and Robert Baldock was appointed the Company’s President and Chief Executive Officer. Iain Harris resigned as a director on May 21, 2009.
On May 30, 2009, Jerritt Canyon shutdown roaster operations due to a delay in the fabrication of certain fiberglass ductwork required in the construction of the new mercury emission control system, resulting in the failure to meet the deadline for this equipment to be installed as set by the NDEP in their March restart order. The Company was able to complete the installation of a calomel emission system and the system instrumentation on July 20, 2009.
On June 12, 2009 Don MacDonald resigned as a director of the Company and on August 1, 2009 Neil Steenberg and Peter Holbek resigned as directors of the Company and Terry Eisenman, Symeon Solomonidis and Jean-Edgar de Trentinian were appointed to the Company’s Board of Directors.
On August 6 and 28, 2009 the Company closed two tranches of a non-brokered private placement of an aggregate of 41,050,000 Units at a price of $0.10 per unit, each unit comprising one common share (a “Share”) and one share purchase warrant (the “Warrant”), each Warrant entitling the holder to purchase one additional share at a price of $0.125 for a period of 30 months from the closing. No commission was paid.
10
On December 1, 2009, the Company closed a non-brokered private placement of 10,000,000 Units at a price of $0.10 per unit, each unit comprising one common share (a “Share”) and one share purchase warrant (the “Warrant”), each Warrant entitling the holder to purchase one additional share at a price of $0.125 for a period of 18 months from the closing. No commission was paid.
After coming to an agreement with the NDEP in the form of a Consent Decree, the Company resumed operations on October 20, 2009. The Consent Decree resolves all of the compliance concerns of the NDEP in relation to the mill and surrounding land holdings of the Company, as well as related environmental concerns and gives the Company the right to operate the milling facility from the effective date.
The Company incurred exploration expenditures of approximately US $15 million on the Ketza River project and approximately US $1.2 million on the Silver Valley property. Both of these properties are located in the Yukon.
Year Ending December 31, 2010
At the Company’s Special Meeting held January 12, 2010, shareholders approved the issuance of Inducement Warrants to holders of existing warrants who elected to exercise their warrants prior to their expiration date. The Company issued 170,400,000 warrants exercisable at a price of $0.32 per share, 10,250,000 warrants exercisable at a price of $0.26 per share and 10,000,000 warrants exercisable at a price of $0.128 per share. All of the warrants expire January 12, 2012.
On April 1, 2010 the Company’s Board of Directors approved the appointment of Todd W. Johnson as its Vice President of Exploration.
At the Company’s 2010 Annual General Meeting held May 13, 2010 Graham Dickson, Robert Baldock, Pierre Besuchet, Jay Schnyder, John Greenslade, Symeon Solomonidis, Jean-Edgar de Trentinian and Gerald Ruth were appointed to the Board of Directors. Robert Chafee, Terry Eisenman and John Fox resigned as directors and John Greenslade was also appointed the Company’s Chairman.
On July 2, 2010 François Marland was appointed to the Company’s Board of Directors and was appointed the Company’s Vice Chairman.
In March 26, 2010 the Company closed a non-brokered private placement of 22,727,272 Shares (the “Shares”) at $0.22 per Share for gross proceeds of $5,000,000. There was no commission paid.
On May 6 and 12, 2010, the Company closed two tranches of a brokered private placement of 34,559,090 Flow-Through Shares (the “FT Shares”) at a price of $0.275 per FT Share for gross proceeds of $9,503,750. A commission was paid on a portion of the private placement of 7.5% cash and 700,000 warrants exercisable at a price of $0.275 per share on or before May 12, 2012.
On August 13, 2010 the Company closed a Senior Secured Note financing, issuing US$25,000,000 principal amount senior secured notes (the “Notes”) and 25,000,000 common share purchase warrants (the “Warrants”), raising gross proceeds of US$25,000,000. Each Warrant entitles the holder to purchase one common share of the Company at a price of $0.40 per share for a period of three years following closing. The Notes have a maturity date of December 31, 2012 and are secured by a charge over all the assets of the Company’s wholly owned subsidiaries, Queenstake Resources Ltd. (“QRL”) and Queenstake Resources U.S.A. Inc. (“Queenstake US”) as well as a share pledge over all shares in QRL and Queenstake US. A commission of 4% of the gross proceeds raised was paid in Shares of the Company.
11
By Agreement dated October 25, 2010, the Company entered into an ore purchase agreement with Newmont USA Limited whereby the Company will accept delivery of approximately 2,000 tons of gold bearing ore per day from several of Newmont's mines in Nevada.
On October 27, 2010 KPMG LLP resigned as the Company’s auditor and Deloitte & Touche LLP was appointed as the Company’s successor auditor.
Jerritt Canyon: For the first time since the second quarter of 2008, the Company re-opened the Smith Mine using a contract mining company, Small Mine Developers, in the first quarter of 2010. The Company began processing the ore in late February 2010.
In May 2010, the Company shutdown the mill at Jerritt Canyon in order to carry out a significant overhaul of key mill components for compliance with the Consent Decree and as well performed critical maintenance that had been identified subsequent to restart in 2009. During the shutdown, the Company replaced one quench tank completely, began upgrade work on the roaster control system, drained and relined the thickener tank, and refurbished the north tertiary cone crusher. After restarting operations it was determined that the cone crusher needed to be replaced entirely, with a new crusher being installed and put into operation in late July. This replacement subsequently resulted in an improvement in the production rates and the Company achieved steady state of operations during the third quarter.
In the fourth quarter of 2010 the Company successfully negotiated a trial three month contract with Newmont for the delivery of 2,000 tons of gold bearing ore per day commencing October 30, 2010. During the quarter the Company purchased 86,257 tons of ore from Newmont under this contract containing 16,905 ounces, at an average cost of $198.53 per dry ton. Due to the success of this initial contract, Newmont is continuing to deliver at a rate of 1,000 tons per day in 2011 while finalizing a longer term contract.
At the beginning of 2010 the Company prepared a capital budget that included significant expenditures for the commencement of the construction of a second tailings facility (construction to be completed in 2011), completion of several Consent Decree requirements, and also the winterization of and improvements to the mill facility. This winterization would be achieved by installing heat tracing materials on all piping, housing key areas of the crushing circuit (such as fine crushing), construction of an improved ore dryer which would also be protected from the weather, and increasing the level of materials and supplies on hand to reduce the down time caused by a lack of spare parts. In the second quarter the Company made significant progress in completing this capital budget but required additional funding to complete a large portion of the required work. To finance this budget the Company negotiated with several lenders during the year but was unable to obtain debt financing until late in the third quarter of 2010. Due to the timing of closing this financing and also the requirement to settle outstanding claims against the Company to clear title to the property, a substantial portion of the winterization project was not completed and the Company was forced to delay commencement of contruction of the second tailings facility. As well, due to the early onset of severe weather certain Consent Decree projects such as the reclamation of one of the off-take ponds (referred to as the Duck Pond) and the construction of a water treatment facility for acid rock clean up were not completed by their scheduled time.
The delay in these capital investments impacted the milling operations of the Company and the corresponding financial results for most of 2010. As a result of being unable to complete the full winterization project and restock materials and supplies to higher levels prior to the onset of severe winter conditions, the operations at Jerritt Canyon experienced significant downtime as sections of the mill, primarily fine crushing and the refinery (where the heat tracing work was not completed prior to winter), were exposed to severe cold and snow resulting in additional strain on equipment, breakdowns, and clogged chutes (due to the freezing of wet ore). This problem was aggravated by the need to freight in necessary parts to complete repair work due to the lack of in house inventories. The delays in completing key environmental projects required by the Consent Decree also resulted in the NDEP levying a significant fine against the Company ($0.8 million) late in the fourth quarter. As a result of these issues and resulting low throughput the Company continues to experience higher than normal production costs that will need further investment to correct in 2011.
12
Ketza River: During 2010, a total of 86 exploration diamond drill holes were completed at the Ketza River project in the Yukon Territory, Canada. This Ketza River drill program tested 11 target areas and consisted of both step-out drilling from existing resources and the testing of new geochemical and geophysical targets. The drilling program contained a Quality Assurance and Quality Control (QA/QC) program including the insertion of certified gold standards and blanks as defined in the previously published Year-end 2007 NI 43-101 report.
| Target | Drill Holes Completed | Total Meters | Total Footage |
| Bluff Zone | 8 | 782 | 2,566 |
| QB Deep IP | 3 | 1,601 | 5,251 |
| Vertical Vein | 7 | 1,181 | 3,876 |
| Connector Zone | 10 | 1,755 | 5,758 |
| Break Zone | 11 | 2,297 | 7,537 |
| B-Mag Zone | 14 | 996 | 3,268 |
| Peel Zone | 7 | 771 | 2,529 |
| Hoodoo Zone | 9 | 1,456 | 4,778 |
| Fred’s Vein | 3 | 500 | 1,642 |
| Penguin | 13 | 2,101 | 6,892 |
| Peel Creek Gravity | 1 | 174 | 572 |
| Total | 86 | 13,614 | 44,670 |
Following up on the successful 2008 drill hole intercepts, a series of 2010 step out drill holes were completed in the Bluff Zone which is located in between the Peel and Lab resource zones. Strong gold mineralization was encountered in some of the 2010 drill holes; however, this phase of drilling defined the bottom of the mineralized zone. The QB Zone – Deep Induced Polarization (IP) target was generated from a Titan-24 survey conducted in August of 2009. The survey identified an extensive zone of anomalous chargeability and conductivity located greater than 700 meters below the surface and beneath the drilled QB Zone resource. The Company completed several drill holes that successfully penetrated the geophysical anomaly and indicated strong anomalous gold throughout much of its length.
A series of 11 drill holes were completed in the Break Zone in the Peel resource that tested a magnetic anomaly caused by sulfide minerals lying below the existing oxide resource. All but two of the drill holes intersected significant gold mineralization but only from the oxide-rich material.
A total of fourteen step-out drill holes were completed in the southeastern margin of the B-Mag Zone located in the east side of the Peel resource. These drill holes were successful in extending gold mineralization by 15 to 33 meters laterally to the southeast from the existing resource.
Nine exploration drill holes were targeted as infill holes and local mineralization extensions in the planned high wall of the Lab-Hoodoo open-pit near the top of the ridge. Three fans of three drill holes each tested above, below and to either side of the 2008 drill holes which contained 9.14 meters averaging 32.98 g/t Au. All of the 2010 drill holes in this zone contained strong oxide mineralization. Assay result highlights in this zone include drill holes which intercepted 9.14 meters averaging 37.37 g/t Au, 1.43 m averaging 15.64 g/t Au, and a third which intercepted 2.30 meters averaging 17.60 g/t Au. Cross sections suggest that these drill hole assay intersections approximate true thickness.
A total of 13 drill holes were completed in 2010 at the Penguin Zone. Six of the drill holes tested Very Low Frequency (VLF) geophysical and soil anomalies that were coincident with a zone of massive pyrite and arsenopyrite boulders on the surface. Some of these drill holes contained significant gold mineralization. Seven of the other drill holes in this zone tested three strong magnetic high anomalies. Some of these drill holes encountered several significant gold intercepts containing massive pyrrhotite and pyrite.
13
Other exploration targets such as Fred’s Vein and the Peel gravity anomaly were also drill tested in 2010 with some indication of gold mineralization but no significant assay intersections.
Several inlying claims located within the large Ketza River property were purchased in the summer of 2010 and helped consolidate the ownership into one contiguous block owned or leased by KRHL. A total of 146 quartz claims were added to the Ketza River claim block in early 2011 to acquire prospective ground in the district for additional Au deposits.
Geophysical and Geochemical Surveys
As noted in the table below (results shown in kilometers, except for soil sampling which shows number of samples) four areas were targeted in 2010 for geophysical and soil exploration: the Shamrock, South Hill target, OK target, and lower tailings option site. The 2010 geophysical studies included Induced Polarization (IP) and ground magnetics.
| Target | South Hill | Shamrock | OK Target | Lower Tailings Site | Total |
| Technique | | | | | |
| Ground Magnetics | 71 | 45.1 | 71 | 41.1 | 157.2 |
| IP | 6.8 | | 36.9 | | 41.3 |
| Line Cutting | | | 34.5 | | 34.5 |
| Soil Sampling | 814 | | | | 814 |
The results of this work will be used to help target a good portion of the 2011 Ketza River drill hole program. The north side of Shamrock, the South Hill Target and the proposed tailings site were covered by a ground magnetic survey which identified numerous strong anomalies and helped refine targets north of the Shamrock Zone. Two Induced Polarization (IP) lines were conducted across the South Hill Target to investigate the possible presence of mineralized pyrite-bearing manto zones that do not have enough pyrrhotite to generate a magnetic anomaly. The 2010 IP survey results were successful at identifying a number of potential sulfide-bearing and mineralized zones.
Drill Hole Database and Resource Modeling
Significant work on the Ketza drill hole database was conducted in 2010 to help support an updated resource estimate. Drill hole assay data were reviewed, database software was upgraded, and assay importing routines were optimized during 2010. An extensive update process was completed as well to integrate all assays for historical drill holes (assays from 1985 to 1997 were digitally compiled from the paper drill hole files). Primary lab assay data for these early drill hole years were selected and methodically entered into the drill hole database and used for the revised 2010 resource model calculation. An updated resource calculation for the Ketza River project is currently in progress and targeted for completion in 2011 which will incorporate all of the previous years drilling information and will include a summary of the metallurgy testing program conducted in 2008. This resource estimate will form the basis of the mine design for the Project Proposal that has a targeted submission date to the Yukon Environmental and Socio-economic Assessment Board (YESAB) of August 2011.
2010 YESAB Project Proposal Work Summary
A number of studies relating to YESAB Project Proposal were continued in 2010. A third party engineering firm is handling the completion of this application with a targeted submission date in the third quarter of 2011.
In support of the project proposal a total of 1,233 meters of geotechnical and hydrogeology drilling (see table below) was conducted for the pit-wall stability program. The results of this drilling was combined with the geotechnical drilling information gathered in 2008 to help support pit-wall slope recommendations for the proposed mine design.
14
Two draft geotechnical reports, one on the manto zone deposits and one on the Shamrock zone deposits, were completed for in-house review in December 2010. A few of these 2010 geotechnical drill holes contained significant assay intervals (e.g. a drill hole in Tarn intersected 6.21 m averaging 2.24 g/t Au).
| Area | Drill Holes Completed | Total Meters | Total Footage |
| Peel Zone Geotechnical | 3 | 524 | 1,721 |
| Penguin Zone Geotechnical | 1 | 77 | 252 |
| Tarn Zone Geotechnical | 2 | 145 | 476 |
| Tarn Zone Hydrogeology | 1 | 72 | 236 |
| 3-M Zone Geotechnical | 1 | 103 | 337 |
| Gully Vein Geotechnical | 2 | 312 | 1,024 |
| Total Geotechnical - Open Pits | 10 | 1,233 | 4,046 |
A total of 32 drill holes were also completed in and around the footprint of the proposed lower tailings site to help support the YESAB project proposal. Sixteen were diamond drill holes that targeted magnetic anomalies and were designed for either exploration or condemnation purposes. All of these drill holes were logged for geotechnical data and some were used to gather hydrogeology information to help support engineering design studies. Fourteen of the drill holes were completed with a Becker drill and diamond drill core at depth to gather geotechnical information. Some of these drill holes were completed as groundwater monitoring wells. Two additional monitoring wells were installed at the toe berm of the existing tailings dam as requested by the Yukon Water Board.
Various other YESAB work was completed during the year including a site water quality control and assurance program, compilation of hydrogeology data compilation and analysis, Socio-economic, wildlife, fish and aquatic studies, tailings design and tradeoff studies, and conceptual engineering and design studies. Several meetings with local communities (Ross River and Faro) and local First Nations (Ross River Dena and Teslin) were held in November and December to update everyone on the Company’s proposed Ketza River project; additional meetings also took place in early 2011 at Teslin. Numerous meetings were also held with the Water Board, YESAA, Water Resources, and Energy, Mines and Resources to help advance the progress for the YESAB Project Proposal and the water license application for the existing tailings pond.
Silver Valley: A total of 7 diamond drill holes were conducted at the Silver Valley project in 2010.
| Target | Drill Holes Completed | Total Meters | Total Footage |
| River’s Edge | 5 | 817 | 2,680 |
| K-18B South | 2 | 428 | 1,404 |
| Total | 7 | 1,245 | 4,084 |
The 2010 drill holes tested two horizontal-loop electromagnetic (HLEM) geophysical anomalies identified during the 2007 field season. Five drill holes were completed at the River’s Edge target which identified three sub-parallel quartz-siderite-pyrite veins with minor amounts of galena and tetrahedrite. Two other 2010 drill holes tested the north end of the K-18B South target which is a possible fault offset of the K-18B Vein resource that was drilled in 2007. The two 2010 drill holes intersected two pyrite-dominant veins approximately 3 meters in width containing minor galena, sphalerite, stibnite, and tetrahedrite.
YS Mining Company:
During 2009, the Company, in conjunction with the joint venture partner, Northwest Mining and Geology Group Co., Ltd. for Nonferrous Minerals (“NWME”) performed geological and geophysical work at the Skukum property owned by Tagish Lake Gold (“Tagish”) (see Related Party Transaction section) as part of the ongoing due diligence for a possible merger. In September of 2009, the Amalgamation Agreement was terminated and Yukon-Shaanxi
15
Mining Company (”YSM”), through negotiations with MacQuarie Bank Limited, acquired a credit agreement from MacQuarie Bank with Tagish for total payment of C$1.5 million, secured by the Skukum property. This was funded through an additional equity contribution from NWME of C$1 million and cash from treasury. The Company did not participate in this equity contribution and as a result diluted its economic interest from 50% to 37.5% at December 31, 2009. The Company continues to have the option to purchase further shares in order to regain its 50% interest.
In April 2010, the joint venture received additional contributions of C$2 million, C$1 million of which was on behalf of the Company, and resulted in an increase in its ownership percentage from 37.5% to 41.67% . These funds were used to invest in the shares of Tagish Lake and fund exploration work on the Skukum property. Due to the poor working capital conditions of Tagish Lake and actions taken by other creditors, Tagish Lake was placed into Companies Creditors’ Arrangement Act (“CCAA”), utilizing the proceeds provided from the investment by YSM. During the CCAA process a takeover bid was received from New Pacific Metals Ltd. (“NUX”) for the shares of Tagish Lake which included full payout of any debts. Although the joint venture provided a competing takeover offer and funds were transferred from NWME to support the offer, insufficient shares were tendered to this competing offer to reach the required level of ownership and the majority of the shares were tendered to an improved offer made subsequently by NUX. Both joint venture partners had set a specific fair market value for the Tagish Lake property and the bid was based on these estimates, so an improved offer was not made. Subsequent to the successful take over by NUX, in October 2010 Tagish Lake completed a plan of arrangement under the CCAA with a loan from NUX and the joint venture has recovered all funds that were loaned to Tagish Lake with applicable interest. The joint venture will pursue other opportunities to explore and develop resources in the Yukon.
Year ending December 31, 2011
On January 28, 2011 the Company entered into a forward gold sale agreement with Monument Mining Ltd. (“Monument”) a public company the shares of which trade on the TSX Venture Exchange, the President of Monument is Robert Baldock, President of the Company. Graham Dickson and Jean-Edgar de Trentinian, directors of the Company are also directors of Monument. Under the agreement, Monument prepaid US$5,000,800 for the gold and will receive, in lieu of physical gold, an amount of $US$6,000,960 on or before June 30, 2011.
On March 2, 2011, the Company completed a $7.1 million non-brokered flow-through private placement for 8,334,882 flow-through shares (the “FT Shares”) at $0.85 per FT Share. The proceeds of were used for new resource exploration at Ketza River at new targets as well as at the Silver Valley property.
At a Special Meeting of the Company held March 8, 2011, shareholders approved the temporary reduction of the exercise price of eight series of unlisted warrants issued between April 2009 and August 2010 by approximately 18%. The holders of the warrants had 30 days from March 14, 2011 to exercise their warrants, after which the exercise prices of the warrants reverted to their original respective exercise prices. The original prices ranged from $0.08 to $0.40 per share and the reduced prices range from $0.07 to $0.33 per share. An aggregate of 59,813,333 warrants were exercised for gross proceeds of $12,637,880.
During the period May 10, 2011 to May 24, 2011, 140,400,000 warrants exercisable at a price of $0.32 per share held by an insider of the Company were purchased and exercised by various entities, raising an aggregate of $44,928,000 for the Company. Concurrent with the exercise of the warrants, the Company completed a private placement of 33,488,372 shares of the Company at a price of $0.43 per share, raising an aggregate of $14,400,000.
On June 27, 2011, Graham Dickson, resigned as the Company’s COO and was appointed the Senior Vice President of Acquisitions and Corporate Development. Randy Reichert was appointed the Company’s COO.
16
Shareholders of the Company approved a Forward Gold Sale Agreement dated August 12, 2011 whereby Deutsche Bank prepaid US$120,000,000 for the purchase of a maximum of 173,880 ounces of gold produced from the Company’s Jerritt Canyon Mine. The gold is being delivered over a four year period at an average rate of 3,623 ounces per month.
Jerritt Canyon: In 2011, the Company continued underground mining at Smith using a contract mining company, Small Mine Development, LLC (“SMD”), and, with the delivery of the majority of the mining equipment in the the third quarter of 2011, recommenced underground mining at the SSX-Steer mine in October. Total underground mine production from Smith Mine and SSX-Steer Complex totals 1,300 tons per day at year end 2011 (1,000 tpd from Smith by contract miner SMD and 300 tpd from SSX-Steer being mined by Queenstake Resources personnel). Queenstake is targeting to ramp up to 1,200 tons per day production from the SSX-Steer mine in 2012 as more equipment becomes available and additional resources are recruited. The Company has also obtained permitting to develop the Starvation Canyon underground mine which is scheduled to be ready in the second half of 2012 as infrastructure is put in place and equipment delivered. Starvation Canyon will be capable of delivering up to 600 tons of ore per day. This will complete the underground mine development program producing a targeted 2,800 tons per day of ore to the mill.
The Company commenced a significant capital plan in 2011 to increase the efficiency of operations at the mill including commencement of the installation of a new ore dryer along with an additional scrubber and bag house to reduce emissions, rebuilding the crushing circuit, fine-crushing circuit conveyor reconfiguration, change-out of the Merrill-Crowe precipitation circuit with an electrowinning circuit, replacement of a quench tank, and improvements to the oxygen plant. These projects were all substantially complete by the end of 2011 however much of the commissioning and final installation occurred in the first quarter of 2012 during the shutdown or shortly thereafter. In addition, construction of a new tailings storage facility (“TSF”) was started in July 2011 that uses two double lined impoundments: one for tailings solids and one into which tailings water will be decanted. This separation during operations is intended to provide greater stability to the tailings and reduce the time and costs for the ultimate closure and reclamation of the facilities. The TSF is also expandable and will be able to serve Jerritt Canyon for many years into the future.
The January 1, 2011 Mineral Resources and Reserves were updated in a new NI 43-101 Technical Report dated June 28, 2011 as amended on January 6, 2012. Resources have moderately increased from the previous Year-end 2007 Technical Report and include: a measured resource of 4,549.9 ktons averaging 0.236 opt Au containing 1,073.1 koz; an indicated resource of 6,459.5 ktons averaging 0.204 opt Au containing 1,316.8 koz Au; and an inferred resource of 3,872.6 ktons averaging 0.194 opt Au containing 751.3 koz Au. Proven and Probable Reserves remain basically unchanged from the previous Year-End 2007 Technical Report and include a proven reserve of 1,406 ktons averaging 0.193 opt Au containing 270.9 koz, and a probable reserve of 2,959.7 ktons averaging 0.151 opt Au containing 446.0 koz.
2011 Drilling
In 2011, the Company completed 134,277 feet (40,938m) of surface reverse circulation and diamond drilling (220 drill holes shown below), 23,942 feet (7,299.4m) of underground diamond drilling (37 drill holes) focused at the Smith Mine, and 93,753 feet 28,583m) of production drilling (809 drill holes) in 2011 from the Smith and SSX-Steer underground mines. The 2011 surface drilling focused on: those areas proximal to existing underground developments to convert inferred resources to measured and indicated resources, and in open pit areas with high potential for quick development (Burns Basin, Steer and Saval Canyon, and Pie Creek). The underground diamond drilling program focused at the Smith mine in Zones 2/5, 9, 1, 3, and 4. 2011 Production cubex drilling at Smith was focused in Zones 3, 5, 7, 8, and 9 and at the SSX-Steer Complex in Zones 1A, 2, and 7. The 2011 drilling programs contained a QA/QC program including the insertion of certified gold standards and blanks, which was similar to the one defined in the current NI 43-101 report dated June 28, 2011 as amended on January 6, 2012.
17
Summary of 2011 Surface Drilling Program
| Zone | Total number of Drill Holes | Total amount of Drilling (feet) |
| Surface reverse Circulation | 208 | 120,130 |
| Surface diamond Drilling | 12 (15 core tails done too) | 14,147 |
| Total | 220 | 134,277 |
2011 Surface RC and Diamond Drilling Summary by Area
Area |
Number of RC
Drill holes | Number of
Feet RC
Drilled |
Number of Core
Drill Holes | Number of
Feet Core
Drilled | Total No.
Drill
Holes | Total
Feet
Drilled |
| Burns Basin open pit | 61 | 23,740 | 0 | 0 | 61 | 23,740 |
| East Mahala/Mahala | 18 | 19,370 | 0 (5 core tails) | 2,608 | 18 | 21,978 |
| MCE | 3 | 1,020 | 0 | 0 | 3 | 1,020 |
| Pie Creek open pit | 17 | 5,600 | 0 | 0 | 17 | 5,600 |
| Starvation Canyon | 13 | 7,490 | 12 | 5,251 | 25 | 12,741 |
| Steer Canyon open pit | 23 | 12,520 | 0 | 0 | 23 | 12,520 |
| West Generator open pit | 37 | 8,200 | 0 | 0 | 37 | 8,200 |
| West Mahala | 36 | 42,190 | 0 (10 core tails) | 6,288 | 36 | 48,478 |
| Total | 208 | 120,130 | 12 | 14,147 | 220 | 134,277 |
Geophysics
A Titan 24 Geophysical ground survey was completed at the Starvation Canyon area in 2011 by Quantec Geoscience. The survey was conducted over a 9,836 foot by 4,918 foot (3,000 meter by 1,500 meter) grid. The long axis of the survey grid was oriented along the projected (290/110 degree) structural trend and centered over the Starvation Canyon deposit in order to characterize the signature of the undisturbed deposit. The grid was extended for a distance of 655 ft. (200m) southeasterly and 7,213 ft. northwesterly of the (currently identified) limits of the deposit resource inventory and covered the West Starvation target on the northwestern end of the grid.
The 2011 Titan 24 geophysical ground survey has identified several anomalies that are scheduled for drill testing in 2012.
Ketza River: Recent activities in 2011 have focused on: installation of a 49-person replacement camp; upgrading of the camp infrastructure (new water well and sewer system); YESAB Application work including submission of the final document to the YESAB for review; drilling on the margins of the previously identified resource areas and in new exploration targets away from the known resources; and the completion of a NI 43-101 Technical Report for on June 28, 2011 that updates the Mineral Resources as of January 25, 2010 that incorporates all drilling results from 2008.
2011 Drilling
During 2011, a total of 26 diamond drill holes totaling 14,441 feet (4,402m) were completed at the Ketza River Project in the Yukon Territory, Canada. This Ketza River drill program tested 4 target areas and consisted of both step-out drilling from existing resources at the Hoodoo and Penguin Zones) and the testing of new geochemical and geophysical targets (at South Hill and NW). The 2011 drilling program contained a Quality Assurance and QA/QC program including the insertion of certified gold standards and blanks, which was similar to the one defined in the current NI 43-101 report dated June 28, 2011 as amended on January 6, 2012. Much of the assays were still in progress as of December 31, 2011. Sampling of the last 13 geotechnical drill holes drilled in late 2010 at the lower tailings site was also completed in early 2011.
18
Current exploration work at the site is focusing on compiling the assays from the 2011 drilling program to help plan the 2012 drilling program.
| Target | Drill Holes Completed | Total Meters | Total Footage |
| South Hill | 11 | 2,428 | 7,965 |
| NW | 4 | 425 | 1,393 |
| Hoodoo Zone | 2 | 53 | 174 |
| Penguin | 9 | 1,496 | 4,909 |
| Total | 26 | 4,402 | 14,441 |
As of January 25, 2010, the measured resource consists of 167.8 ktonnes averaging 5.38 g/t Au containing 29 koz Au; the indicated resource estimate consists of 3,369.5 ktonnes averaging 4.61 g/t Au containing 499.9 koz; and the inferred resource consists of 453.7 ktonnes averaging 4.62 g/t Au containing 67.3 koz Au. This resource includes all of the 2008 drilling results but excludes 2010 and 2011 drilling results.
The decrease in measured, indicated, and inferred resources for the resource statement with an effective date of January 25, 2011 relative to that calculated from the previous Technical Report (SRK, 2008) reflects new drilling, more realistic constraints placed on the construction of the 0.5 g/t Au grade shells used to constrain the estimation process, a higher quality drill hole database, better specific gravity assignments to the various ore types, and more realistic and updated mining and milling parameters and costs.
A total of 146 additional quartz claims in the Ketza River Project area were staked in May 2011. This brings the total amount of quartz claims at Ketza River to 679. There are an additional 60 quartz leases at Ketza River totaling 1,947 acres (787.9 hectares). There are also a total of 71 additional claims that are located along the main access road from the Silver Valley Project (located approximately 1 km east of the Ketza River Project and owned 100% by Ketza River Resources) to the Robert Campbell Highway.
Geophysical and Geochemical Surveys
Several geochemical investigations were completed at the Ketza River project in 2011. A total of 343 soil samples were collected over the OK target located in the Shamrock Zone northeast of the QB Zone near Misery Creek. These surface soils were collected on the same grid as the 2010 IP survey to help confirm drill targets. A total of 176 panel samples were taken across the Canamax mill stockpile on a 10m by 10m grid to help characterize the grade of the stockpile. These stockpile samples were collected over a 2m radius from the central grid point. A total of 290 drill hole pulps (completed originally from 2007 to 2010) were collected and submitted for duplicate (QA/QC) analysis at ALS and Inspectorate.
Drill Hole Database and Resource Modeling
Significant work on the Ketza drill hole database was conducted in 2010 to help support an updated resource estimate in the most recent NI 43-101 Technical Report that has an effective date of January 25, 2011. To help support this NI 43-101 technical report, drill hole assay data were reviewed, database software was upgraded, and assay importing routines were optimized during 2010. An extensive update process was completed as well to integrate all assays for historical drill holes (assays from 1985 to 1997 were digitally compiled from the paper drill hole files). Primary lab assay data for these early drill hole years were selected and methodically entered into the drill hole database and used for the revised 2010 resource model calculation. The updated resource calculation for the Ketza River project incorporates all of the 2008 drilling information andincludes a summary of the metallurgy testing program conducted in 2008. This resource estimate forms the basis of the mine design that was included in the Application that was submitted to the Yukon Environmental and Socio-economic Assessment Board (YESAB) in late September 2011.
19
2011 YESAB Application Work Summary
Various YESAB related work was completed during 2010 and 2011 which was primarily managed by Tetratech (EBA) that culminated in submitting the YESAB Application in late September 2011. YESAB work continued throughout 2011 to help support the YESAB Application including: a site water quality control and assurance program, compilation of hydrogeology data compilation and analysis, waste rock analyses (ABA/ARD studies), open-pit wall stability analysis based on collecting geotechnical data from several oriented diamond drill holes completed in the proposed pit areas, underground rock quality assessment, a Socio-economic study, wildlife, fish and aquatic studies, tailings design and tradeoff studies, and conceptual engineering and design studies. Several meetings with local communities (Ross River, Faro, and Teslin) and local First Nations (Ross River Dena and Teslin) were held throughout the yearto update everyone on the Company’s proposed Ketza River Mine Project. A Traditional Knowledge agreement was signed with the Ross River Dena in 2011. Work also progressed with the Ross River Dena to finalize a new Memorandum of Understanding. Numerous meetings were also held with the Water Board, YESAA, Water Resources, and Energy, Mines and Resources to help advance the progress for the YESAB Project Proposal and Application, and the water license application for the existing tailings pond.
Humidity cell results from tailings and various waste rocks continued to be collected and analyzed by ALS Environmental throughout 2011 and are being analyzed by Tetratech. The preliminary analysis of the results were included in the YESAB Application submitted in September 2011.
Silver Valley: No diamond drill holes were conducted at the Silver Valley project in 2011. Two ground gravity survey grids were conducted at the Silver Valley project in the summer of 2011 by Aurora Geosciences. The grids covered the K18-B Vein, Silver Rain, and Silver Belle targets. The total area of the geophysical grid encompassed approximately 4.6 square kilometres consisting of approximately 500 survey points. The survey points were taken on 100 metre spaced lines and stations with local 50m station infills.
A total of 19 additional quartz claims in the Silver Valley project area were staked in May 2011. This brings the total amount of quartz claims at Silver Valley to 143. There are an additional 6 quartz leases at Silver Valley totaling 202 acres. There are also a total of 69 additional claims that are located along the main access road from the Silver Valley project (located approximately 1 km east of the Ketza River project and owned 100% by KRHL) to the Robert Campbell Highway.
The 6 leased claims (Tiny 1-4 and Grey 1-2 claims) from George Fairclough were officially purchased pursuant to the option agreement and transferred to KRHL in the third quarter of 2011.
YS Mining Company Inc.: During 2011 there was minimal activity in the YS Mining Company Inc. (“YSM”) joint venture, or its wholly owned subsidiary Yukon-Shaanxi Mining Company.
During the fourth quarter of 2011 the joint venture shareholders of YSM agreed to dissolve YSM. This was done by way of a Corporate Dissolution Agreement (the “Agreement”); and, the shareholders of YSM executing a consent resolution authorizing the dissolution of YSM (the “Resolution”).
The Resolution and the Agreement were both dated and executed on October 18, 2011 and all remaining assets, primarily cash, were distributed to the joint venture shareholders. The Company received a CAD $2.2 million from the distribution of assets on October 25, 2011. As at December 31, 2011 an application of dissolution had yet to be filed and YSM had yet to be dissolved. Remaining costs to dissolve YSM will be nominal and will be funded by each joint venture party as they arise.Events Subsequent to December 31, 2011
On January 12, 2012 the Company entered into a forward gold sale agreement with Monument Mining Ltd. (“Monument”) a public company the shares of which trade on the TSX Venture Exchange, the President of Monument is Robert Baldock, President of the Company. Graham Dickson and Jean-Edgar de Trentinian, directors of the Company are also directors of Monument. Under the agreement, Monument prepaid US$5,000,000 for the gold and will receive, in lieu of physical gold, an amount of US$6,000,000 on or before June 12, 2012.
20
On February 7, 2012 the Company entered into a Forward Gold Purchase Agreement (the “Agreement”) with Deutsche Bank AG (“Deutsche Bank”) whereby Deutsche Bank funded a US$20 million prepaid gold forward facility. The Company is using the funds for working capital and to further invest in the expansion of the SSX-Steer mine in Nevada. In connection with the transaction, the Company issued to Deutsche Bank a share purchase warrant which can be exercised to purchase 40,000,000 common shares at a price of $0.44 per share on or before February 7, 2015. Under the terms of the Agreement, in the event that the actual monthly quantity of gold delivered by the Company is less than the scheduled monthly amount, the shortfall can be made up, at the option of Deutsche Bank, by the issuance of common shares of the Company (the “Shares”). The conversion price per Share will be the five day volume weighted average price (“VWAP”) of the Company's shares as traded on the Toronto Stock Exchange ("TSX") immediately prior to the monthly delivery date for the scheduled delivery month in which such gold shortfall payment obligation arises, less the discount as permitted by the TSX.
ITEM 4: DESCRIPTION OF THE BUSINESS
4.1 General
The principal businesses of the Company are the continued mining of the Jerritt Canyon gold mine in Nevada, as well as the acquisition, exploration and development of natural resource properties with a particular focus on the Ketza River and Silver Valley Properties in the Yukon Territory.
Jerritt Canyon is an operating gold complex with two producing underground mines, ore stockpiles and a 1.5 million ton per year capacity processing plant. In addition, the approximately 119 square miles that comprise the Jerritt Canyon property offer a significant number of advanced, early stage and district-scale exploration targets and potential to expand the currently defined mineral reserves and resources proximal to the producing mines. The Company intends to seek and acquire additional near production stage properties worthy of development and within economic trucking distance of the Jerritt Canyon mill.
Summary
The Company is engaged in the acquisition, exploration, development and operation of precious metal properties. The Company continues to investigate and negotiate the acquisition of additional precious metal mining properties or interests in such properties in order to increase the reserve life. There is no assurance that any such investigations or negotiations will result in the completion of an acquisition.
Production and Services
The Company’s principal product is gold, with gold production forming the primary source of revenues. There is a global gold market into which the Company can sell gold and, as a result, the Company is not dependent on a particular purchaser with regard to the sale of the gold that it produces.
Specialized Skill and Knowledge
In order to carry on exploration, mining and milling activities the Company draws on the expertise of various personnel including geologists, engineers, and metallurgists.
21
Competitive Conditions
The precious metal mineral exploration and mining business is a competitive business. The Company must compete with numerous other companies and individuals in the search for and the acquisition of attractive precious metal mineral properties, especially in the current market. The ability of the Company to acquire precious metal mineral properties in the future will depend not only on its ability to develop its present properties and provide necessary ore to the current facilities, but also on its ability to select and acquire suitable producing properties or prospects for precious metal development or mineral exploration.
Economic Dependence
Not applicable to the Company.
Changes to Contracts
Not applicable to the Company.
Environmental Protection
The Jerritt Canyon facilities have been designed to mitigate environmental impacts. The operations have processes, procedures or facilities in place to manage substances that have the potential to be harmful to the environment. In order to prevent and control spills and protect water quality, the mine utilizes multiple levels of spill containment procedures and routine inspection and monitoring of its facilities. The mine has installed air pollution control devices on its facilities that exceeds the minimum requirements significantly and, in the case of mercury emissions, has set the new standard for the state of Nevada. The mine also has various programs to reuse and conserve water at its operations.
In 2009 the Company reached an agreement with the Nevada Division of Environmental Protection (“NDEP”) in the form of a Consent Decree issued by the Attorney General of the State of Nevada, representing the NDEP. The Consent Decree resolved all of the environmental compliance concerns of the NDEP in relation to the Jerritt Canyon mill and surrounding land holdings, as well as related environmental concerns, and gives the Company the right to operate the Jerritt Canyon milling facility from the effective date. The Consent Decree records and agrees both parties to the terms of an environmental work program and includes penalties for not completing these work programs. The company has completed all but the following work under the Consent Decree:
For 2012 the Company has budgeted significant environmental expenditures (approximately $__.__ million) in order to not only meet the requirements of the Consent Decree but also to meet commitments made to the state to improve the compliance of the operations. One of the most significant projects in 2012 is completion of the new tailings facility (TSF-2) as well as a second water storage facility to facilitate the reclamation of the first tailings pond (TSF-1).
Beginning in 2012, TSF-2 will transition as a replacement repository for mill tailings. The company anticipates TSF-1 will cease receiving tailings no later than January 2013. TSF-1 will then enter closure and reclamation. The Company is also planning to perform approximately $10.3 million in restoration projects at the mine site, including the initial actions for closure and reclamation of TSF1 and improvements to the reclamation of waste rock disposal areas to diminish the seepage from them.
In 2012, the Company will test on a pilot scale an active method to treat the DASH East Rock Disposal Area (RDA) seepage. If the efforts to diminish the flow rates and the applicable requirements cannot be met, then treatment may be required for the RDA seepages.
22
Queenstake has financed the Jerritt Canyon Operation’s reclamation and closure costs by funding a commutation account within an insurance policy with Chartis Insurance (Chartis). This insurance policy and additional cash placed by Queenstake in a money market account also with Chartis, collateralizes the surety provided to government agencies for closure and reclamation. As of early September 2011, the surety provided to Government agencies was US$81,590,537, including the closure and reclamation of the TSF-2, WSR, expanded mining activities, and additional costs mandated by the State for closure of TSF-1. Approximately 45% of the bond costs are related to control and remedy of the seepage from TSF-1. The Mine Reclamation Plan and Reclamation Cost Estimate dated June 2010 and later revised in September 2010 was submitted to the Bureau of Mining Reclamation (BMRR) Branch. The required surety to government agencies for reclamation of the private land facilities was $70,015,433. Queenstake estimates the net present value to its closure and reclamation obligations for the Jerritt Canyon Operations at the end of the mine life to be US$44,081,377 (using a 2.6% discount rate). Bond increases are a result of more surface disturbance, increased unit costs (labor, equipment, and fuel costs), and increased remedial actions mandated by government agencies.
Employees
As of December 31, 2011, the Company had 13 full-time employees at the head office in Vancouver, 23 full-time employees at the Ketza River location (this number is subject to some seasonality), and approximately 268 employees at the Jerritt Canyon gold mine. The Company uses a number of consultants and contractors for a variety of specialized tasks.
Foreign Operations
The Companys principal operations are within North America.
Bankruptcy and Similar Procedures
As at the date hereof, neither the Company, nor its subsidiaries, has been subjected to any bankruptcy, receivership or similar proceedings.
Reorganization
Commencing in December 2003, Graham Dickson, the president of the Company, took the initiative in reorganizing the Company by restoring it with the Register of Companies and returning the Company to good standing as a reporting Company in the provinces of British Columbia and Alberta. On January 5, 2004, the Company’s share capital was consolidated on a five (5) old for one (1) new basis and its authorized share capital was increased from 4,000,000 Shares without par value to 100,000,000 Shares without par value; subsequently the Company’s share capital was increased to an unlimited number if Shares without par value. On April 13, 2005, the Company’s Shares commenced trading on the TSX. In 2007 the Company amalgamated with Queenstake Resources Ltd. by way of a Plan of Arrangement and renamed the Company from YGC Resources Ltd. to Yukon-Nevada Gold Corp.
Social or Environmental Policies
The Company believes in hiring the majority of the workforce from within the local community at both the Canadian and US properties to the extent possible. The Company has a policy of working with environmental agencies as closely as possible to ensure compliance with the ever-evolving environmental regulations.
Jerritt Canyon Property
The Company conducts ongoing exploration, mine production, closure, and restoration on the Jerritt Canyon Property. Precious metals production has been conducted continuously on the Jerritt Canyon Property for thirty
23
years and the Company is now preparing for a new phase of productive life for the Jerritt Canyon Property. Several major permits have been renewed in the last two years and are being modified further to support ongoing operations while establishing the base for future growth. The Company and the NDEP entered into a Consent Decree in October of 2009 to address legacy issues and environmental controls. Several, but not all, modifications to operations are parts of that Consent Decree (CD). The Company has also responded to information requests from the United States Environmental Protection Agency (USEPA) on two issues described later in this section.
The Nevada mining permit which regulates water pollution control was renewed in June of 2009 for five years. In December of 2010 the Company submitted an application for a major modification to this permit to allow the construction of a new tailings storage facility (TSF2) that included another full update. This new TSF2 will replace the current tailings storage facility (TSF1) first constructed in 1981 and last modified in 1998 which is nearing capacity. The second tailings facility is anticipated to provide six years of storage at planned production rates. All current and planned mining operations have been incorporated into this permit
An application to renew the site wide Title V Air Quality Permit was accepted by the State of Nevada in June 2008, also for five years. The Company is addressing new information requirements under that permit. New air pollution control technologies have been developed under the CD to control mercury emissions and the State of Nevada is modifying air pollution control permits for these emissions controls. Construction of the new controls is planned for 2011. These modifications will allow compliance with State and Federal air pollution control regulations. The end result will be a fully compliant and permitted Title V permit for the operations in latter 2012.
A large portion of the Jerritt Canyon mine is located on public land administered by the U.S. Forest Service. The Jerritt Canyon staff maintains a proactive relationship with the U.S. Forest Service personnel, which includes frequent site inspections and up-dates. A majority of the Jerritt Canyon mining district has undergone a formal National Environmental Policy Act (“NEPA”) review as part of the 30 year mining and exploration history of the District. Environmental resources and issues are well defined in this documentation and appropriate mitigation strategies are in place to support and expand operations. Evolving regulatory programs may result in additional review of environmental issues associated with ongoing or planned future operations. Periodic NEPA review of these issues may be required for future expansions and modifications in the operations.
The Company’s operations on public lands managed by the US Bureau of Land Management (BLM) are limited to a very small area associated with the Starvation Canyon Mine access road. The Company has the necessary approvals from the BLM. Additional approvals may be required for expanded exploration plans in the future.
In September, 2010, the site wide Reclamation Permit with the State of Nevada was renewed and includes all current activities at the Jerritt Canyon Property on public and private lands. A modification of this permit is planned for early 2011 to allow construction of TSF2 and a water storage reserve and to add Starvation Canyon Mine operations.
TSF1 is scheduled to enter closure during 2012 independent of the obligations under the CD. The Company is completing closure of certain legacy facilities at the Jerritt Canyon Property in accordance with the CD. The Company will improve surface water controls for legacy waste rock disposal areas in 2011 under the CD. Reclamation projects are scheduled annually and are completed concurrently with the completion of mining activities. To date over 1,500 acres of mined lands have been reclaimed.
Reclamation and closure activities are defined and surety is provided to the Federal Government and the State of Nevada for the associated site restoration obligations in the total amount of US$54.88 million. These surety bonds are collateralized by a reclamation and closure insurance policy independently administered by Chartis Insurance Company (Chartis), formerly American Insurance Group (AIG). As reclamation is completed, payment for completing the insured activity is paid to the Company from a pre-funded Commutation Account administered by Chartis. The capacity of this collateralized bond was surpassed in 2010 and was supplemented with cash to make the collateral sufficient. The surety requirements are anticipated to increase as new facilities become necessary and older facilities have not yet been closed and reclaimed. The Company will ensure additional surety capacity as new mines and plant expansions develop in the future
24
The Company temporarily halted operations on the Jerritt Canyon Property in 2009. The State of Nevada then issued a regulatory Stop Order for the operations. The Company negotiated a Consent Decree with the State of Nevada to lift the Stop Order and resume operations. The Consent Decree required closure of certain legacy facilities, improvement of engineered controls for water pollution and development of new air pollution controls for mercury as a condition for lifting the Stop Order. At the time of writing this AIF, the Company was preparing to negotiate an extension and new terms for the CD for those actions not yet completed.
In 2009, the US Department of Justice (DOJ) signed a complaint against the Company but offered not to file the case with a court if the Company agreed to negotiate a settlement. The Company has maintained this agreement, the filing of the case has been held in abeyance, and the agreement is renewed on a 6-month basis. The complaint was not provided to the Company by the DOJ but the Company was informed that the complaint relates to mercury handling at the Jerritt Canyon Property. The Company has been improving mercury controls under the CD with the State of Nevada with operating and monitoring provided under the agreement with EPA. Monitoring of the effectiveness of mercury controls will be performed after the controls are constructed in 2011.
In 2009, the Jerritt canyon Property was selected by the USEPA for a ‘desktop’ audit of annual reports submitted for its Toxic Release Inventory program. The Company worked with the USEPA to satisfy information requests in 2010. The Company has received no response from the USEPA regarding the results of the audit on December 31, 2010.
The Company is committed to conducting its operations with high environmental values, ethics as well as to social issues. The Company operates in the following manner:
- Complies with applicable laws, regulations, and permit conditions and, where practicable, exceed their minimum requirements;
- Establishes and maintains management systems to monitor all environmental aspects of its activities;
- Reviews these management systems regularly to evaluate their effectiveness and modify them as appropriate to optimize their effectiveness;
- Proactively pursues and evaluates engineering alternatives to better address closure and reclamation obligations;
- Ensures that financial resources are available to meet environmental and reclamation obligations;
- Ensures that the Company’s employees and contractors are aware of the Company’s environmental policies and understand their relevant responsibilities; and
- Actively participates in the ongoing public and private sector debate on environmental and social matters that relate to the mining industry.
The Company is continually striving to improve its environmental performance. Planned environmental capital expenditures and restoration expenditures for 2011 are US$14.6 million.
Ketza River Property
The Company currently manages the environmental compliance program in the Yukon Territory through a contracted environmental engineering firm and has onsite personnel to administer the monitoring requirements needed. There are regular consultations with the Yukon Territorial Government to ensure the Company is complying with regulatory requirements. The Company conducted a number of environmental and social impact studies relating to the Yukon Environmental and Socio-economic Assessment Board (YESAB) project proposal and application that was submitted in late September 2011. The Company is now working through questions from YESAB and providing detailed responses. Approval of this project proposal will allow the Company to commence construction of the tailings facility at the site and allow for mine production.
25
4.2 Risk Factors
The Company operates in a dynamic and rapidly changing environment that involves numerous risks and uncertainties. Shareholders should carefully consider the risks described below before purchasing its Shares. The occurrence of any of the following events could harm the Company. If these events occur, the trading price of its Shares could decline, and shareholders may lose part or even all of their investment.
Precious Metal Price Fluctuations
The Company’s profitability from proposed operations will be dependent in part on:
• | the market price of precious metals; |
• | the price of metals or interests related thereto has fluctuated widely and is affected by numerous factors beyond our control including: |
| | • | international economic and political conditions; |
| | • | expectations of inflation; |
| | • | international currency exchange rates; |
| | • | interest rates; |
| | • | global or regional consumptive patterns; |
| | • | speculative activities; |
| | • | levels of supply and demand; |
| | • | increased production due to new mine developments and improved mining and production methods; |
| | • | availability and costs of metal substitutes; and |
| | • | metal stock levels maintained by producers and others and inventory carrying costs. |
Although it cannot predict the exact effect of these factors, the combination of these may result in the Company not receiving an adequate return on invested capital or an investment retaining its value.
Operating Hazards and Risks
Mining operations involve a high degree of risk, such as unusual or unexpected formations and other conditions, which even a combination of experience, knowledge and careful evaluation may not be able to overcome. Operations in which the Company has a direct or indirect interest are subject to all the hazards and risks normally incidental to exploration, development and production of precious metals, any of which could result in work stoppages, damage to or destruction of mines and other producing facilities, damage to life and property, environmental damage and possible legal liability for any or all damage. The Company presently carries a limited amount of liability insurance, and may become subject to liability for pollution, cave-ins or other hazards, and the payment of such liabilities could have a material adverse effect on its financial position.
Exploration and Development
Mineral exploration and development involves a high degree of risk as few properties which are explored are developed into producing mines. The Company cannot provide assurance that its continuing mineral exploration and development activities will result in any discoveries of bodies of commercial ore. The long-term profitability of the operations will be in part directly related to the cost and success of its exploration and development programs, which may be adversely affected by a number of factors.
The Company may require funding for the substantial expenditures which are required to establish reserves through drilling, to evaluate metallurgical processes to extract metal from ore and to develop the mining and processing
26
facilities and infrastructure at any site chosen for mining. Although substantial benefits may be derived from the discovery of a major mineralized deposit, no assurance can be given that minerals will be discovered in sufficient quantities to justify commercial operations or that the funds required for development can be obtained on a timely basis.
Numerous factors will affect the marketability of any minerals acquired or discovered which are beyond the Company’s control and cannot be accurately predicted, including market fluctuations, the proximity and capacity of milling facilities, mineral markets and processing equipment, and such other factors as government regulations, including regulations relating to royalties, allowable production, importing and exporting minerals and environmental protection.
Calculation of Reserves, Resources and Metal Recoveries
There is a degree of uncertainty attributable to the calculation of reserves and resources and corresponding grades being mined or dedicated to future production. Until reserves or resources are actually mined and processed, the quantity of mineralization and grades must be considered as estimates only. In addition, the quantity of reserves and resources may vary depending on metal prices. Any material change in quantity of reserves, resources, grade, stripping ratio, or metallurgical recoveries may affect the economic viability of our properties. In addition, the Company cannot provide assurance that metallurgical recoveries in small scale laboratory tests will be duplicated in larger scale tests under on-site conditions or during production.
Title to Mining Properties
Although the Company has taken steps to verify title to its mineral properties in a manner consistent with industry practice for the current stage of its evaluation of our properties, there is no guarantee that its title to the properties will not be challenged or impugned. The Company has not conducted surveys of some of the claims in which it holds a direct or indirect interest, therefore the precise area and location of the claims may be in doubt. There could be prior unregistered agreements or transfers or native land claims and its title may be affected by undetected defects.
Issuance of Debt
The Company may enter into transactions to acquire assets or the shares of other corporations which may be financed partially or wholly with debt, which may increase its debt levels above industry standards. The Company’s articles do not limit the amount of indebtedness that it can incur. The level of the Company’s indebtedness could impair its ability to obtain additional financing in the future to take advantage of business opportunities that may arise.
Dilution
In order to finance its working capital requirements and to raise equity for the development of its projects the Company may enter into commitments which would require the issuance of additional Shares, options, warrants and convertible debt. These commitments will comply with securities laws and could require the approval of the securities regulatory bodies, and in some cases, its shareholders.
Regulatory and environmental matters
The following discussion is necessarily brief and must not be taken to constitute a complete discussion of the various statutes, rules and governmental orders to which our operations may be subject. The Company’s existing properties are located in Canada and the United States, and are subject to extensive federal, state, provincial and local governmental regulations in these countries. These regulations may be revised or expanded at any time. A broad number of matters are subject to regulation. Generally, compliance with these regulations requires it to
27
obtain permits issued by federal, state, provincial and local regulatory agencies. Certain permits require periodic renewal or review of their conditions. It is impossible to predict whether it will be possible to obtain or renew such permits or whether material changes in permit conditions will be imposed. The inability to obtain or renew permits or the imposition of additional conditions could have a material adverse effect on its ability to develop and operate its properties.
Environmental laws and regulations to which the Company is subject as it progresses from the development stage to the production stage give rise to additional concerns and requirements. Failure to comply with applicable laws, regulations and permits can result in injunctive actions, suits for damages, and civil and criminal penalties. The laws and regulations applicable to its activities change frequently and it is not possible to predict the potential impact to the Company from any such future changes.
Passive Foreign Investment Company (“PFIC”)
The Company has not determined whether it meets the definition of PFIC, within the meaning of Sections 1291 through 1298 of the U.S. Internal Revenue Code of 1986, as amended, for the current tax year and any prior tax years. It may or may not qualify as a PFIC in subsequent years due to changes in its assets and business operations. A U.S. shareholder who holds stock in a foreign corporation during any year in which such corporation qualifies as a PFIC is subject to numerous special U.S. federal income taxation rules and may elect to be taxed under two alternative tax regimes. A U.S. shareholder should consult their own U.S. tax advisor with respect to an investment in the Company’s Shares and to ascertain which of the alternative tax regimes, if any, might be beneficial to the U.S. shareholder’s own facts and circumstances.
Enforcement of Civil Liabilities
The Company was incorporated under the laws of British Columbia, Canada. Some of its assets are located outside Canada and its directors and officers are residents of countries other than Canada. It could be difficult for its investors to effect service of process within Canada upon the Company and its directors and officers, or to realize in Canada upon judgments of courts of Canada predicated upon civil liability of it and its directors and officers under Canadian federal securities laws.
Likewise, given that the Company is incorporated under the laws of British Columbia and some of its assets are located in Canada, it may also be difficult for U.S. investors to effect service of process within the United States upon the Company or any of its directors and officers who are not residents of the United States, or to realize in the United States upon judgments of U.S. courts predicated upon civil liabilities under U.S. securities laws. A judgment of a U.S. court predicated solely upon such civil liabilities may be enforceable in Canada by a Canadian court if the U.S. court in which the judgment was obtained had jurisdiction, as determined by the Canadian court, in the matter.
4.3 Companies with Asset-backed Securities Outstanding
The Company has not historically held any asset-backed securities and does not have any plans to hold this security in the future.
4.4 Companies with Mineral Projects
(a) Jerritt Canyon Mine, Nevada
On June 20, 2007 the Company acquired Queenstake Resources Ltd. (“Queenstake”) which owns the Jerritt Canyon mine located in Nevada. The Jerritt Canyon mine is an operating gold property with two producing underground mines and ore stock piles, currently feeding ore to a 1.5 million ton per year capacity processing plant.
28
The following description and summary of the Jerritt Canyon Property is based on the Technical Report (the “Jerritt Canyon Report”) of Mark Odell, Mine Engineer Consultant, P.E., Todd W. Johnson, P.E., VP Exploration of the Company and Karl Swanson, Mining Consultant, SME, MAusIMM with an original filing date of June 28, 2011 and an amended issue date of January 6, 2012. The Jerritt Canyon Report is available at www.sedar.com.
Property Description and Location
Jerritt Canyon Mine is located in Elko County, Nevada, approximately 50 miles north of Elko in the Independence Mountains at Latitude 41º 23’ North, Longitude 116º West. The property is accessed by paved State Highway 225 about 45 miles to the paved mine access road. The property lies in ten townships within T39N to T41N and R52E to R54E relative to the Mount Diablo Base Line and Meridian (MDB&M). Figure 1 is a property location map. The property boundaries are located in the field with wooden stakes and were likely originally measured by tape and compass either from Section corners or adjacent claims. All property boundaries have since been located with modern surveying equipment and/or GPS (Trimble 5800 RTK GPS Rover utilizing aTrimble base receiver for reference corrections) with an accuracy of ±0.5 cm horizontal accuracy and a vertical accuracy of ±1 cm.
All of the drill hole data stored in the acQuire drill hole database are projected in Jerritt Grid. All plan map figures and cross-sections presented in the Jerritt Canyon Report are also presented in Jerritt Grid. Jerritt Grid is projected in foot units and equivalent to the NAD1927 State Plane, Nevada East, FIPS_2701 system with the only difference being that 2,000,000 feet is subtracted from the northing grid values.
29
Figure 1: General Location Map of the Jerritt Canyon Mine
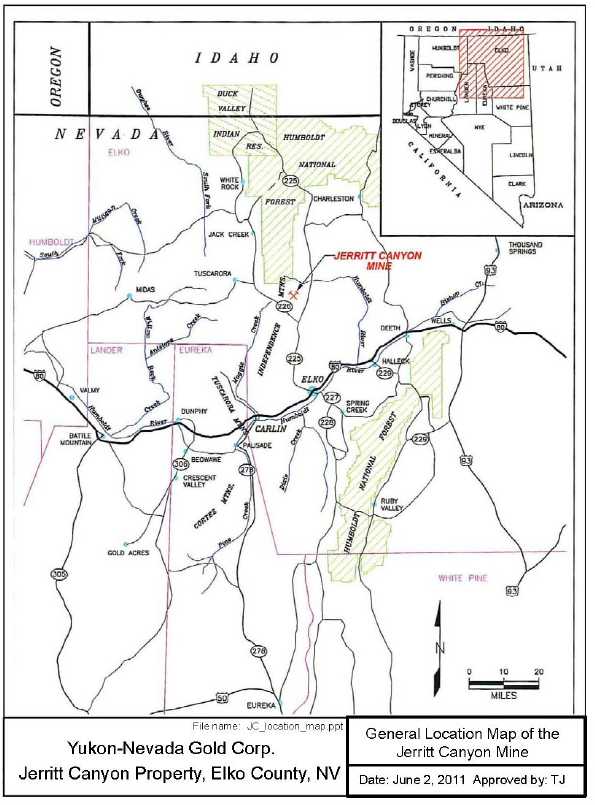
30
Figure 2: General Land Map of the Jerritt Canyon District
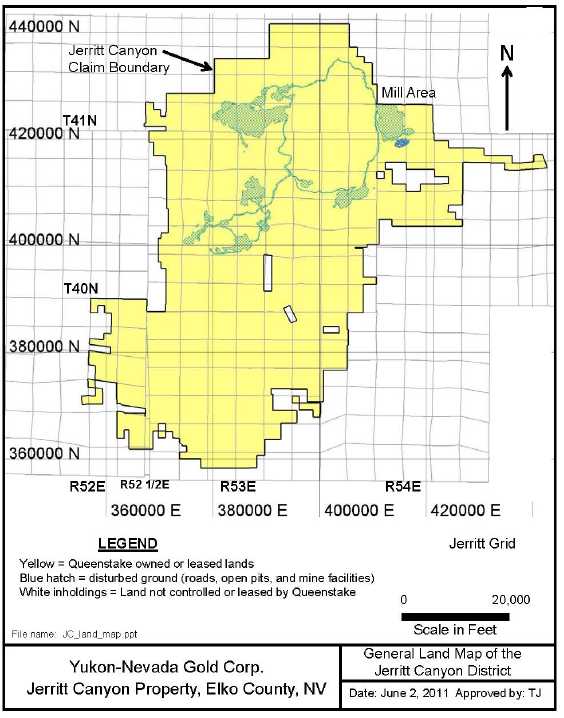
Mineral Titles
The property is 100% owned and operated by Queenstake which acquired the mine from the previous owner, a joint venture between Anglo Gold (70%) and Meridian Gold (30%), at the end of June 2003. Queenstake is a wholly owned subsidiary of YNG. The following claim details were discussed with Mr. Joel Casburn, the current Queenstake Land Manager, on May 3 and June 20, 2011 via email correspondence.
31
The operations are located on a combination of public and private lands, with the mines and mining related surface facilities being primarily located on mining claims in United States Forest Service (USFS) land within the Humboldt-Toiyabe National Forest. The process facilities, office, shop, and tailings are located on private land owned by Queenstake. Additional claims in the southern part of the land package are mostly located on private land with some located on land administered by the United States Bureau of Land Management (BLM). Claim-related fees are annually paid to the BLM and Elko County.
Queenstake owns 2,860 claims, 1,011 acres of patented claims, and 12,433 acres of fee land; in addition, Queenstake leases 278 claims and 11,271 acres of fee land with mineral rights (Table 1). The claim notices, affidavits, title to property and lease agreements were reviewed by the primary author. A map depicting the 2010 general land package is shown in Figure 2. All Jerritt Canyon property claims expire on September 1, 2011 but are always renewed every year by filing the necessary paperwork and claim fees with the BLM and the County. Estimated costs to maintain the 2,860 Queenstake-owned claims are $400,400 ($140 per claim) whereas the 278 leased claims are $38,920 (also at $140 per claim).
Table 1: Land and Claim Summary for Jerritt Canyon Project
| Land Status | No. Claims | Acres |
| Owned Claims | 2,860 | |
| Leased Claims | 278 | |
| Total Claims | 3,138 | |
| Fee Land Owned | | 12,433 |
| Patented Claims Owned | | 1,011 |
| Fee Land Leased | | 11,271 |
| Total Acres | | 24,715 |
Queenstake controls more than 119 square miles of ground encompassing the mine area and surrounding acreage. The bulk of this is in the form of contiguous unpatented mining claims which are held in force by production from the mining activities. No production royalties are paid for gold deriving from these claims.
Some property is leased from landowners in the region, and a royalty is paid on production from these lands. The royalty for mined material in 2010 was generally equal to a 5 percent net smelter return (NSR), the total cost of which is dependent upon the gold sale price and the refining results.
Environmental Liabilities
Environmental liabilities at the mine include:
- High sulfate and Total Dissolved Solids (TDS) in seepage from waste rock from four rock disposal areas (RDAs); and
- Site closure and restoration including management of seepage from the tailings impoundment.
Mineralized Zones, Mineral Resources Mineral Reserves and Mine Workings
The resource and reserve areas and mine facilities are located within Queenstake owned or leased claims and fee land. Figure 3 is a map showing the location of the resource and reserve areas.
32
Figure 3: General Land Map of the Jerritt Canyon Property with Resources and Reserves
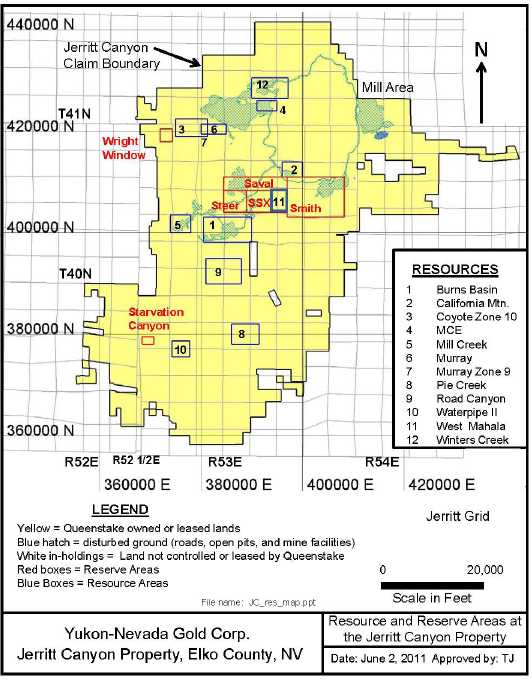
Permits
Operating permits for the mine are in place and are presented in Table 2. The mine is currently operating under a Consent Decree agreement (2009) between Queenstake and the State of Nevada. Environmental management systems are in place and are managed by an experienced and qualified onsite environmental staff. Operating and maintenance staffs are informed of their responsibilities during annual MSHA refresher classes. In addition to MSHA classes, the mine holds leadership classes for the supervisory staff. During these classes, supervisors are informed of their environmental responsibilities.
33
Permitting activities with the USFS and/or the State of Nevada occur throughout the year but is most active in the early spring when the Annual Work Plan is submitted to them for review of the year’s planned exploration drilling, disturbance, and development activities which includes a summary of the previous year’s reclamation activities and a bonding review.
Permitting activities with the State of Nevada are ongoing to help advance the Starvation Canyon project to an underground mine project. Queenstake has secured the Water Pollution Control Permit for this project and the Reclamation permit, including the bonding. Groundwater monitoring is in progress. In order to advance the Starvation Canyon portal, groundwater monitoring needs to be documented for two calendar quarters. The Nevada Highway Department may also need to be notified if any Starvation Canyon ores planned to be hauled on State Highways to the Jerritt Canyon Processing Facility.
Table 2: Operating Permits
| Permit/Approval | Granting Agency | Comments |
| Plan of Operations | USFS | Still active. |
| Work Plans | USFS | Annual work plan submitted to USFS and NDEP |
| Clean Water Act Section 404 Permit | U.S. Army Corps of Engineers | Expired in 2007. There are no triggers requiring the update. |
| EPA ID Number | U.S. Environmental Protection Agency | The Mine, a large-quantity generator, has the typical hazardous wastes found at a mine such as laboratory cupels and crucibles, and cleaners from maintenance operations. Wastes are accumulated and full drums are shipped once every calendar quarter for disposal. |
| Air Quality Permit | Nevada Division of Environmental Protection (NDEP)/ Bureau of Air Pollution Control | The Mine has a current Title V air permit. Improved pollution controls for mercury emissions and expanded monitoring and management systems developed under the Consent Decree are being incorporated in the permit. |
| Reclamation Permit | USFS and NDEP/ Bureau of Mining Regulation and Reclamation (BMRR) | The bond estimate is updated annually with the USFS and the NDEP. The bonding includes the construction of the new tailings storage facility (TSF), water storage reservoir, expanded mining activities, and additional costs for the closure of the existing TSF. |
| Water Pollution Control Permit | NDEP-BMRR | One water pollution control permit covers the entire mine area. The tailings seepage/chloride plume is managed by a recovery system and will be mitigated by closure of the existing TSF; and the high sulfate/total dissolved solids emanating from four rock disposal areas will be diminished by improved reclamation and surface water controls. |
| Underground Injection Control | NDEP/ Bureau of Water Pollution Control | Addresses dewatering from the underground mines. There is currently no active underground injection. |
| Solid Waste Class III Landfill Waiver | NDEP/ Bureau of Solid Waste | The Mine has three authorized landfills at the lower mill area, Burns Basin, and Alchem. Employees are instructed during annual MSHA refreshers with regard to what is acceptable to dispose of in the landfill. |
| General Stormwater Discharge Permit NVR300000 | NDEP/Bureau of Water Pollution Control | Annual reports are submitted to NDEP. No concerns have been noted. A general permit is in place. No concerns were noted. |
| Permit to Appropriate Waters | NV Division of Water Resources | No concerns were identified. The Mine has sufficient appropriations to cover processing and dewatering needs. |
| Permit to Construct Impoundments/Dam Safety | NV Division of Water Resources | No concerns identified. |
| Industrial Artificial Pond Permits | Nevada Department of Wildlife | No concerns identified. |
| Liquefied Petroleum Gas License | NV Board of the Regulation of Liquefied Petroleum Gas | No concerns identified. |
| Potable Water System | Nevada State Health Division | Potable water systems are located at the Murray, SSX, and millsite. Upgrades are underway in 2011 for the SSX and millsite systems. |
34
| Permit/Approval | Granting Agency | Comments |
| Septic System Permit | Nevada State Health Division | The Mine has general permits for five systems: SSX; Steer; Murray; USA; and Smith. The mill site has a package plant that discharges to the tailings impoundment. No concerns identified. The package plan will be updated in 2011. |
Accessibility, Climate, Local Resources, Infrastructure and Physiography
Access to Property
The Jerritt Canyon Mine is located in Elko County, Nevada, approximately 50 miles north of Elko. Access to the property is by State Road 225 to the mine access road. The roads are paved and in excellent condition all the way to the main gate where the administrative offices, process plant, warehouse, and tailings impoundment are located. The mines are accessed by haul roads on Queenstake controlled land.
Climate
The climate is temperate with winter temperatures between 0º and 40º Fahrenheit and summer temperatures between 35º and 90º. Average annual precipitation at the tailings impoundment is estimated at 14 inches per year with an estimated annual average evaporation of 43 inches. A significant amount of the total precipitation falls as snow and increases with elevation to the mining areas. Mine operations are only rarely halted by weather conditions, although ore haulage from the mines may be slowed. The mill, warehouse, shop, and administrative facilities are at a lower elevation and therefore are less exposed to weather extremes. Snowfall is generally common from the months of December to May.
Vegetation
The vegetation is typical of the Basin and Range province with sagebrush vegetation dominant at the lower elevations. Small stands of aspen and isolated fir trees grow in canyons and drainages.
Physiography
Jerritt Canyon mine is located in the Independence Mountain Range in the Basin and Range province of northern Nevada. The topography ranges from about 6,400 feet at the administrative facilities and mill site to about 8,000 feet at the highest point of the haul road to the mines.
Local Resources and Infrastructure
Elko, Nevada with a population of about 36,000 is the closest city to the mine. The city is on Interstate 80 and is serviced by daily commercial flights to Salt Lake City, Utah. Elko is a center for the mining operations in northern Nevada and services necessary for the mine are readily available there. The local population, along with the proximity of the other nearby cities (e.g. Salt Lake City in Utah and Battle Mountain, Winnemucca, Fernley, Fallon, Reno in Nevada) is large enough to supply most of the workers and supplies for all of the mines in the area.
Power to the minesite is purchased from Nevada Energy through a 125kV, 3-phase transmission line. Power consumption over the period from January to March 2011 has varied from 7.3 to 8.2 MWh. Cost of electrical power is approximately US$0.066/kWh.
A new natural gas pipeline has recently been installed to the south of the property by another company. Queenstake is examining opportunities to use natural gas to help power some of the mine facilities.
There are sufficient supplies of water at the site to allow the processing facility and other mine facilities to efficiently operate. Approximately 700 gallons per minute (gpm) of water is required to operate the mill with two
35
primary water sources: (1) a “dirty” water source consisting of the tailings storage facility 1 (TSF-1) seepage collection system that has contributions from 90 small diameter water wells around the TSF-1, four seepage collection trenches, and three embankment blanket drains that collectively produce 1,000 gpm; and (2) a cleaner water source from two deep water wells that are both capable of producing 500 gpm. A third deep water well exists at the property but is currently not operating. Once the TSF-1 is decommissioned and reclaimed, the additional necessary water sources for the mine facilities will come from the deep well sources and/or underground mine dewatering. All waters used at the Jerritt Canyon mine are from permitted and certificated water rights held by Queenstake and regulated by the Nevada Division of Water Resources.
There is sufficient room to place additional wastes on the property from future mining operations based on the existing claims owned by Queenstake. In addition, there is sufficient space to place the planned tailings storage facility 2 (TSF-2) and water storage reservoir (WSR) to the south of the existing tailings storage facility and existing evaporation pond.
History
The Jerritt Canyon mine is wholly owned by Queenstake Resources USA, Inc. (Queenstake) after its purchase from the joint venture of Anglo Gold and Meridian Gold in June 2003. The joint venture was formed in 1976 between Freeport Minerals Company, later Freeport McMoran Inc., and FMC, later Meridian Gold. In 1990, Freeport sold its interest in Jerritt Canyon to Minorco and their wholly owned subsidiary, Independence Mining Company, which became the new joint venture partner and operator of the mine. In 1998, Minorco’s North American gold assets, including 70% interest in Jerritt Canyon were sold to Anglo Gold.
Queenstake is now a wholly owned subsidiary of Yukon-Nevada Gold Corp. which formed as a result of a merger between Queenstake Resources Ltd. and YGC Resources Ltd. on June 20, 2007.
Prospectors explored for antimony in the 1910’s. Thirty to forty tons of stibnite as antimony ore were reportedly mined and shipped from the Burns Basin mine in the Jerritt Canyon district between 1918 and 1945. In the early 1970’s there was a renewed interest in antimony exploration when its price reached historic highs of $40 per pound. Around 1971, FMC began exploring for antimony in the Independence Mountains. In 1972, FMC, later known as Meridian Gold, discovered a disseminated gold deposit in the Jerritt Canyon area. In 1976, a joint venture was formed with Freeport Minerals Company to explore and develop the area, and mining commenced at Jerritt Canyon in 1981.
Historic Jerritt Canyon open pit and underground mining production is shown in Table 3. Open pit mining was conducted at the site from startup in 1981 until 1999. The first underground operation at Jerritt Canyon started up in 1993 at West Generator. The mine during 2008 up until August 8 consisted of two active underground mining operations (Smith and SSX-Steer complex) feeding ore to a process plant consisting of two roasters followed by carbon-in-leach processing. The Jerritt Canyon processing plant is currently under a production restriction of 180tph through its two roasters.
Table 3: Historic Open Pit and Underground Mine Production at the Jerritt Canyon Property before Recovery Losses
Open Pit Deposit
Name |
Years in Operation | Mined Tons
(short) | Gold Grade
(oz/st) | Ounces (1)
(contained) |
| Marlboro Canyon | 1980-1990 | 5,798,600 | 0.241 | 1,400,045 |
| Alchem | 1991-1994 | 1,657,600 | 0.098 | 162,621 |
| L. North Gen. Hill | 1980-1993 | 1,226,000 | 0.192 | 235,461 |
| U. North Gen. Hill | 1980-1993 | 7,636,300 | 0.170 | 1,298,308 |
| West Generator | 1986-1993 | 3,979,000 | 0.155 | 616,647 |
| Burns Basin | 1988-1998 | 2,441,800 | 0.169 | 412,328 |
36
Open Pit Deposit
Name |
Years in Operation | Mined Tons
(short) | Gold Grade
(oz/st) | Ounces (1)
(contained) |
| Mill Creek | 1992-1994 | 895,700 | 0.121 | 108,270 |
| Pattani Springs | 1988-1990 | 387,000 | 0.108 | 41,896 |
| California Mtn. | 1993-1994 | 410,300 | 0.162 | 66,341 |
| Dash | 1996-1999 | 1,906,100 | 0.221 | 420,789 |
| Winter’s Creek | 1992-1995 | 1,243,700 | 0.126 | 156,317 |
| Steer Canyon | 1994-1997 | 477,300 | 0.132 | 63,004 |
| Saval Canyon | 1994-1997 | 1,741,900 | 0.126 | 218,682 |
| Subtotal | 1980-1999 | 29,801,300 | 0.175 | 5,200,709 |
Underground Mine
Production |
Years in Operation | Mined Tons
(short) | Gold Grade
(oz/st) | Ounces (1)
(contained) |
| SSX | 1997-2008 | 4,425,500 | 0.289 | 1,280,946 |
| Steer | 2004-2006 | 68,174 | 0.233 | 15,879 |
| MCE (formerly Papillion) | 1997-2004 | 258,295 | 0.369 | 95,359 |
| Murray | 1997-2006 | 3,780,795 | 0.330 | 1,248,777 |
| Smith | 1999-2008; Jan. 2010- YE2010 | 1,379,900 | 0.280 | 385,943 |
| West Generator | 1993-1997 | 460,100 | 0.235 | 108,108 |
| Saval | 2004-2006 | 3,500 | 0.495 | 1,730 |
| Subtotal | 1993-YE2010 | 10,376,264 | 0.302 | 3,136,742 |
| | | | | |
| Grand Total | 1980-YE2010 | 40,177,564 | 0.208 | 8,337,451 |
| Notes: | (1) | Contained ounces does not include metallurgical recovery; |
| (2) | Gold production from open pit mining at Jerritt Canyon started in July of 1981 at the Marlboro Canyon and North Generator Hill pits; |
| | (3) | The last major open pit mine production was from Dash which was mined from 1996 to 1999; |
| | (4) | st = short ton; L. = Lower; U = Upper; Mtn. = Mountain; YE = Year-End; |
| | (5) | Steer is included in with SSX starting in 2006; |
| | (6) | Steer and Saval underground mining time period not discriminated; |
| (7) | Underground test mining began in September 1991 at the Phase 1 Test Project in the highwall of the West Generator open pit; |
| | (8) | the wet mill closed down in February 1997; the fluid-bed roaster started in 3rdquarter of 1989; |
| | (9) | Production records above do not show later mining of various low grade stockpile ores; |
| | (10) | Data compiled from internal Mine records and Jones (2005) and verified by Todd Johnson |
The mines are mechanized operations using backfill for ground control and to increase ore recovery. In the early years, the ores mined at the operation were less refractory and were processed through a “wet” mill. This “wet” mill continued to operate until 1997 and is still located on site. With ores becoming more carbonaceous and refractory, as well as with the introduction of higher-grade ore from underground operations, a dry mill with an ore roasting circuit was added in 1989 and is currently in operation.
Geological Setting
Regional
The Jerritt Canyon mining district is located in the Independence Mountain Range in northern Nevada. The range is part of the Basin and Range province of Nevada and is a horst block consisting primarily of Paleozoic sedimentary rocks with lesser Tertiary volcanics and intrusive dikes. A district geologic map is shown in Figure 4 and a stratigraphic column is shown in Figure 5. Much of this data was previously presented in the previous Year-End 2007 NI 43-101 Technical Report (SRK, 2008) and is still considered to be relevant.
37
There are four distinct assemblages in the district, characterized by their position relative to the Roberts Mountains thrust, a Devonian to Mississippian structure formed during the Antler orogeny:
- The western facies, or upper plate of the thrust, consists of the Cambrian to Ordovician Valmy Group and forms about 70% of the exposed rock. In the Jerritt Canyon district, the Valmy Group consists of the Snow Canyon formation, a chert, argillite, greenstone, and carbonaceous siltstone sequence, and the McAfee Quartzite, a sequence of massive quartzite and shale;
- The eastern facies, or lower plate of the thrust, consists of a sequence of Ordovician to Devonian shallow water sedimentary rocks that are exposed in tectonic and erosional windows through the upper plate. The gold mineralization in the district is contained with the eastern facies rocks. The Pogonip Group rock is exposed in the west-central part of the district and is composed of fossiliferous limestone with calcareous shale and dolomite interbeds. The Eureka Quartzite is a massive quartzite with minor interbeds of siltstone. The Hanson Creek Formation is one of two principal ore hosts in the district. It is divided into five units, with the contacts between the units being the favorable sites of gold mineralization. The Hanson Creek consists of interbedded silty limestone, calcareous siltstone, dolomite, chert, and carbonaceous limestone. The Roberts Mountains Formation is the second ore host and consists of calcareous, carbonaceous siltstone and thinly bedded, silty limestone. The Waterpipe Canyon formation is thought to have been deposited in a synkinematic foreland basin that formed during the Antler orogeny; it consists of carbonaceous shale with interbedded greywacke, chert pebble conglomerate, bedded chert, sandstone, and siltstone;
- The Schoonover sequence occurs north of the district and consists of basaltic and andesitic greenstone, chert, tuff, volcaniclastics, and siliciclastic and limestone turbidites of Devonian to Permian age; and
- The Antler overlap sequence is restricted to the north end of the range and consists of conglomerates, argillite, siltstone and limestone.
There are 4 sets of dikes: Pennsylvanian basalt dikes, Eocene basalt and quartz monzonite dikes and a Miocene basalt dike. The Pennsylvanian and Eocene basaltic dikes are altered and mineralized in most of the mines.
The regional structural setting of the Jerritt Canyon district is complex, with several regional deformation events being evident. The Devonian to Mississippian Antler orogeny, resulting from west to east compression, is represented in the upper plate Snow Canyon Formation with north-south folds in both the hanging wall and footwall of the thrust. The Permian to Triassic Sonoma orogeny emplaced the Golconda allochthon over parts of the Roberts Mountains allochthon to the north of the district. The northwest to southeast compression associated with this deformation is rarely seen in the district. The Jurassic to Cretaceous Nevadan orogeny resulted in east-west folds that are often associated with mineralization.
38
Figure 4: General Geology Map of the Jerritt Canyon District

39
Figure 5: General Stratigraphic Section of the Jerritt Canyon District
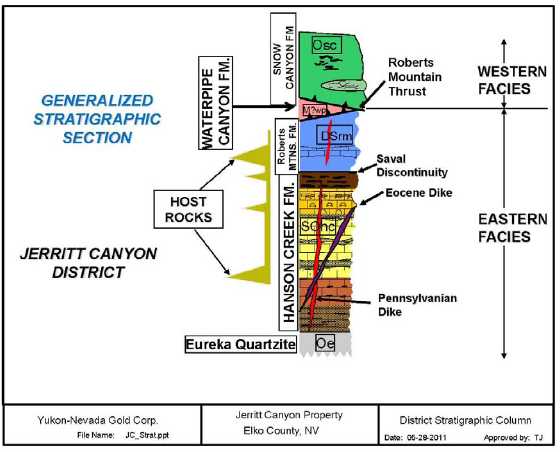
Local Geological Setting
Within the Jerritt Canyon area, gold can locally occur within all sedimentary formations, but is preferentially hosted by the Roberts Mountains and Hanson Creek Formations of the eastern facies in the lower plate of the Roberts Mountains thrust. The Roberts Mountains Formation consists of calcareous to dolomitic siltstones and silty limestones. The Hanson Creek Formation is divided into five members, numbered I through V from the top of the formation to the bottom. Hanson Creek I is a thinly bedded sequence of gray, medium-grained limestones and continuous blocky chert beds; it is typically brecciated. Hanson Creek II is a dark to light gray, irregularly bedded to massive, vuggy, dolomitic limestone. Hanson Creek III consists of intercalated carbonaceous micrites and laminated argillaceous limestones. Hanson Creek IV is a thickly bedded, medium to coarse-grained, carbonaceous limestone with discontinuous black chert nodules. Hanson Creek V consists of laminated, carbonaceous siltstone with chert lenses.
The contact between the Roberts Mountains Formation and the overlying Snow Canyon Formation is a regional thrust fault which transported the Snow Canyon eastward over the Roberts Mountains Formation. The contact between the Roberts Mountain Formation and the underlying Hanson Creek Formation is a discontinuity locally known as the Saval discontinuity. The discontinuity may be an angular unconformity of local extent or a thrust fault. Gold mineralization is typically enriched along this discontinuity. The base of the Hanson Creek is gradational into the Eureka Quartzite. Locally, the stratigraphic section has been repeated by thrust faulting as seen in the interpretive cross-section through the SSX mine in Figure 6.
40
Figure 6: Cross-Section Through the SSX Deposit Showing General Geology
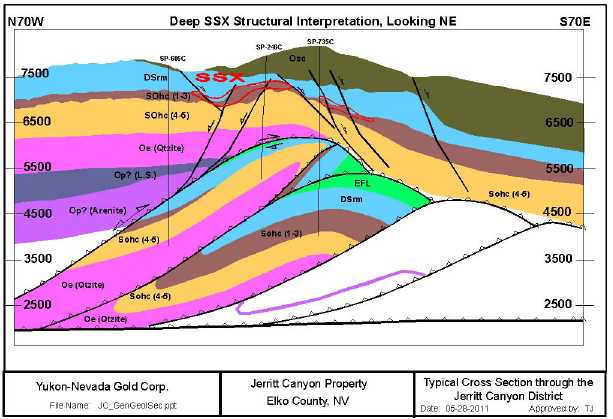
Exploration
The Jerritt Canyon district was explored by prospectors looking for antimony in the early 1900’s. FMC Corporation, exploring for antimony in the 1970’s, discovered gold occurrences similar to those in the nearby Carlin trend. In 1976, FMC, then known as Meridian Mining, formed a joint venture with Freeport Minerals to explore and develop the deposits. Mining commenced in 1981 with the North Generator open pit.
Since then, the operators of Jerritt Canyon have conducted exploration programs for the identification and development of new mineralized areas. Several open pit deposits were discovered, developed, and mined during the 1980’s and 1990’s, including North Generator, Alchem, Marlboro Canyon, Burns, Steer, Saval and Dash. The Dash open-pit was the last significant open pit to be mined on the property in 1999.
Underground targets were also identified, and the first to be exploited was the West Generator underground deposit in 1993. Underground mining has dominated at Jerritt Canyon since 1999 and has focused at Murray, Smith, and SSX.
The Murray deposit, originally discovered by condemnation drilling, produced over 1 million ounces. The SSX deposit was discovered in the early 1990’s by geologists following the structural trends between Burns Basin and California Mountain open pits. The SSX mine has also produced over 1 million ounces. The MCE, Smith, and Steer extension of SSX are more recent discoveries.
The Jerritt Canyon operation has had a history of exploration and discovery since the 1970’s. In the last few years until Queenstake’s acquisition of the property, most of the exploration efforts have been concentrated at and around the existing underground mines. Exploration efforts in the southern part of the range were directed to areas such as Water Pipe, Pie Creek, and Starvation Canyon (Figure 3). Queenstake has increased the exploration effort near the mine areas and also in the south.
41
As a result, the known mineralization at Starvation Canyon has increased in size and quality so that a portion of it was included in the end of 2005 reserves. Additional drilling at Starvation Canyon in 2007 and 2008 was targeted toward further definition and expansion of the resource.
Queenstake has carried out an aggressive program of exploration since it acquired the property in mid-2003. Since mid-2003, a number of different contract drilling companies, too numerous to identify here, have completed both underground and surface drilling at the property. The drilling companies responsible for drilling each drill hole are listed on the drill logs kept in the digital drill hole databases (in acQuire software) and/or in the paper drill hole log files stored at the mine. Drilling companies that have worked at Jerritt Canyon since 2008 are identified under the heading “Drilling” of this Section. In addition, since mid 2003 Queenstake owned its own underground production drills (e.g. Solo, Secoma and Cubex) before the August 2008 mine shutdown which also completed some of the underground drilling. The total amount of underground and surface drilling completed since 2003 at the property is summarized below:
- 2003: 280,151 feet of underground and surface RC and Core Drilling;
- 2004: 710,896 feet of underground and surface RC and Core Drilling;
- 2005: 450,694 feet of underground and surface RC and Core Drilling;
- 2006: 396,063 feet of underground and surface RC and Core Drilling;
- 2007: 467,242 feet of underground and surface RC and Core Drilling;
- 2008: 237,250 feet of underground and surface RC and Core Drilling;
- 2009: no drilling was completed in 2009;
- 2010: 79,691 feet of underground RC and Core Drilling; and
- 2011: 158,219 feet of underground and surface RC and Core Drilling;
Queenstake sold all of its underground production drills in mid-August 2008, and later purchased a used cubex drill that is currently being used at the SSX-Steer mine.
There has been considerable geophysical work completed throughout the Jerritt Canyon property since the early 1970’s by numerous contract geophysical companies. A good portion of the property has airborne magnetic data, ground gravity, and ground I.P.-Resistivity. Certain dike sets are identified in the magnetic surveys. Clay alteration is typified with low resistivity response and gravity low whereas silicification typically show up as resistivity highs and associated gravity highs. In addition, deep IP magnetotelluric (MT) surveys and Controlled Source Audio Frequency Magnetotellurics (CSAMT) surveys have been tried locally at the property and have been able to identify main structures that cross the property.
There has also been considerable soil surveys, rock chip sampling, and trench and roadcut sampling performed in the district by employees of the Jerritt Canyon mine. The soils have been typically collected on a predefined north-south oriented grid and analyzed for multi-element geochemistry. Soils overlying shallow orebodies at Jerritt Canyon are generally enriched in As and Au. The surface geochemistry is stored in a separate acQuire database.
Exploration expenditures (in millions) by Queenstake in recent years are listed below:
- 2007: $7.23 million;
- 2008: $6.48 million;
- 2009: $0; and
- 2010: 0.8 million.
Exploration and development drilling planned for 2011 has targeted either: (1) locating new areas of resource and reserve away from existing underground development; (2) converting existing resources to reserve (near-mine); or (3) drilling in previously disturbed areas including historic open pits. In addition, some monies will be devoted to geophysics (I.P.) in the south part of the district, and drilling for metallurgy and geotechnical testing in the
42
Starvation Canyon deposit. The proposed 2011 Jerritt Canyon geological program, consisting mostly of exploration and development drilling, totals $18.0 million dollars (Hofer, 2011). A summary of the geological drilling program is provided in the section entitled “2011 Geological Program” (Table 27) herein.
A significant portion of the future exploration programs at Jerritt Canyon will be devoted to drilling in or around the historic open pits. Most of the historical open pit resources have not been reassessed since 2006 or older when the gold price was at a much lower price per ounce than it is today.
Mineralization
The resource and reserve areas at Jerritt Canyon are shown on Figure 3. Drill hole maps and the modeled Au grade shells used to determine the existing resources as of January 1, 2011 in the main work areas are presented under the heading “Drilling” of this section. Mineralization characteristics in the main work areas are described below and shown in the figures under the heading “Mineral Resource and Mineral Reserve Estimates”. Zone numbers in the following descriptions refer to mining areas that are presented in the SRK Year-End 2007 Technical Report.
SSX-Steer Mine
The drift connecting the SSX and Steer mines was completed in the latter half of 2005 and the mines have been operated as a single unit referred to as the SSX complex or SSX-Steer complex since then. In 2007 a drift was completed to the Saval 3 portal allowing access to resource extending into the pit wall.
The SSX deposit was discovered in the early 1990’s following the northeast structural trends between the Burns Basin and California Mountain deposits and the west-northwest trends from the Steer/Saval deposits. Mining at SSX started in 1997.
Figures 11 and 15 show mineralization at the SSX-Steer, Saval, and West Mahala model and mining areas. The modeled mineralized bodies show a distinct northwest trend in the SSX area but are generally more east-west in the other areas. The mineralized zones are more continuous in the SSX area ranging from 200 to 2000 feet in length along the northwest strike and 50 to 200 feet in width. The thickness of the mineralization at SSX ranges from 10 to 100 feet. The mineralization at Steer is less continuous ranging in strike length from 50 to 500 feet and 50 to 300 feet in width. The ore thickness at Steer ranges from 20 feet to rarely 100 feet. The depth to mineralization ranges from near surface at the west end of Steer to a depth of about 800 feet below the surface for most of SSX. Most of the mineralization is between 600 to 1000 feet below the surface.
Mineralization at the SSX mine occurs mostly in the micritic unit III of the Hanson Creek Formation. A smaller portion of the mineralization occurs in calcareous siltstone at the base of the Roberts Mountains Formation or in the upper two cherty and dolomitic members of the Hanson Creek Formation. Mineralized zones are localized in and near west-northwest trending steeply dipping dikes (e.g. South Boundary Dike); however, dike material is a minor component of the ore at SSX. Mineralization is also localized along cross-cutting northeast trending faults (the Purple Fault in Zones 4 and 6, and the Crestline Fault in Zone 1). Folding of the mineralized horizons is apparent along axes parallel to the west-northwest dike trend and, more prominently, parallel to the northeast fault set. Gold occurs in decarbonitized rock, commonly in association with variable amounts of orpiment and realgar. Silicification with stibnite can also be associated with gold in portions of the upper cherty member of the Hanson Creek Formation.
Gold mineralization in the Steer portion of the SSX complex has been identified in an area stretching approximately 3,000 feet east from the old Steer pit to halfway along the connection drift to SSX Zone 5. Most gold mineralization at Steer is associated with gently dipping structures cutting through the Hanson Creek III unit. These structures strike northeast and dip southeast, offsetting individual strata. Typical ore zones follow the structures and tend to be broad and relatively thin. The mineralized zones are usually at the contact between the Hanson Creek units III and IV and occasionally follow the structures up through the Hanson III. Both within the Steer portion and the western side of SSX several low-angle features have been observed. These features are at least partly responsible for the gold mineralization at the contact of the Hanson Creek Units III and IV.
43
In the eastern portion of the Steer area, high-grade mineralization is associated with the Husky fault, a major northeast trending normal fault with at least 300 feet of normal dip-slip displacement to the southeast. Major northwest trending dikes appear to have locally compartmentalized high-grade mineralization. The intersection of these dikes with the Hanson III unit and the Husky fault and its related structures offers excellent exploration potential. One of these dikes is interpreted to be the western extension of the South Boundary dike, which is an important ore-controlling structure at the SSX mine to the east.
At Steer and SSX the structural intersections are the primary targets for resource expansion, as well as the westward extension of the South Boundary dike.
Saval Mine
Gold mineralization in the Saval Basin area to the west of the SSX mine is primarily hosted in favorable Hanson Creek Formation unit III where it has been structurally prepared by faulting and has locally been compartmentalized by northwest-trending dike systems. In this area, a series of west-northwest trending structures have been cut by northeast-trending faults. Notable structural features include the west-northwest trending Saval horst and the northeast-trending Husky fault, which cuts across the older Saval horst and down-drops it to the southeast. Mineralization is mostly hosted in the Hanson III unit in the vicinity of structural intersections, often forming relatively steep, narrow, plunging bodies. Dikes, such as the Saval 3 pit dike can be traced for thousands of feet. High-grade gold mineralization has been concentrated along the Saval 3 dike in several locations, most prominently in the Saval 3 pit and in the north part of zone 5 at SSX. Except at the Saval 4 deposit, most economic zones in the Saval basin area have been mined out leaving relatively small mineralized zones in difficult-to-access pit walls and bottoms. During 2006, access to a small resource in the highwall of the Saval 2 pit was completed with a small amount of production.
Mineralization at Saval generally trends east-west from 200 to 1,000 feet. The width ranges from 50 to 200 feet and the thickness from 10 to 50 feet. The depth is from the surface to about 400 feet below the surface.
Smith Mine
The Smith Mine, accessed from near the bottom of the Dash open pit, was started in 1999 as the pit was being mined out. The Smith Mine complex consists of several distinct areas that are accessed from the Smith portal, as well as an area to the east, East Dash, that will be accessed from a separate portal in the Dash pit. During 2006 a separate portal was developed to access mineralization in the east highwall of the Dash pit. Figure 14 shows the underground mine workings, the Dash Pit, and the two existing portals.
Gold mineralization in the main Smith, Mahala, and West Dash deposits is associated with the northeast trending Coulee Fault and west-northwest trending faults and dikes. In Zone 1, high-grade gold mineralization is hosted in the upper and middle portions of the Hanson Creek Formation unit III within a northwest trending horst block between the South Graben fault and the 170 fault. Mineralization in Zones 2 and 3 is directly associated with west-northwest trending dikes. High-grade mineralization occurs within the Hanson Creek units II and III along the steeply dipping dikes. Lesser amounts of mineralization exist at higher levels where the dikes intersect favorable beds in the Roberts Mountains Formation. An exception to the tight elevation controls on mineralization is at the intersection of the west-northwest trending dikes and Coulee fault. Here, high-grade mineralization blows out into the Hanson Creek unit III along the west plunging intersection of the dikes and the fault for a down-dip depth of 600 ft.
Gold mineralization in the Mahala area is spatially associated with the west-northwest trending Mahala fault and associated dikes and favorable ore-host stratigraphy including units II and III of the Hanson Creek Formation and lower beds of the Roberts Mountains Formation. Mineralization at East Mahala occurs primarily in broad, SE-dipping lenses in Roberts Mountains Formation in the hanging wall of the Coulee Fault
44
The B-Pit deposit occurs as gently dipping, thin lenses of mineralized material north of the main Smith deposit. Three of the four lenses occur are stratigraphically bound within the Roberts Mountains Formation. The fourth lens occurs at the top of the Hanson unit III in the wall of a NW-trending horst block just to the south of the other three zones.
The West and East Dash deposits occur at the extreme ends of the west-northwest trending Dash Fault system which formed the mineralization mined in the Dash pit. The West Dash deposit occurs at the intersection of the Coulee fault and the west-northwest trending Dash fault. Most gold mineralization at West Dash occurs in fault-bounded slices of Hanson Creek unit III with minor amounts in the overlying Hanson Creek unit II and Roberts Mountains Formation. West Dash is accessed through the Smith Portal.
The East Dash deposit lies approximately 1,800 feet southeast of the Dash pit. A portion of this deposit has been accessed by a small portal in the pit. At East Dash, most gold occurs in two lenses parallel to the Dash Fault and dipping to the northeast. The largest lens is about 1,100 feet and is 15 feet to 25 feet thick. This mineralization is fairly flat lying and is hosted mostly at the contact between the Hanson Creek II and III units. The north edge of the lens seems to be bounded by a steep east-west trending fault that is locally mineralized with high-grade material. The second lens is smaller at about 350 feet across, but much thicker, up to 120 feet.
The mineralization at Smith generally trends northwest with minor northeast trends along minor structures. The mineralization is continuous along the northwest trend ranging from 200 to 2,500 feet. The width of the mineralization ranges from 20 to 400 feet and the thickness ranges from 10 to 100 feet. The depth of the mineralization ranges from near surface at the Dash Pit to 1,200 feet below the surface to the south and east.
Murray Mine and Zone 9
The Murray Mine occurs within the Roberts Mountains Formation and the top three units of the Hanson Creek Formation. A minor amount of mineralization also occurs within the silicified unit IV of the Hanson Creek Formation. It was originally discovered by condemnation drilling for a waste dump for one of the early open pits. Mineralization in the main Murray deposit occurs along the New Deep Fault which is a wrench fault striking west -northwest and dipping 50º to 60º to the northeast. Mineralization in Zone 7 located about 750 feet north of the New Deep Fault occurred within calcareous siltstone beds of the Roberts Mountains Formation. Zone 7 and the main Murray have been largely mined out, with remnant pockets of mineralization remaining.
Zone 9 mineralization is located immediately west of the main Murray deposit and is associated with a westward projection of the New Deep Fault and several northeast trending faults. It was the focus of drilling campaigns in 2002-2005. Although there was no additional drilling in this resource it was removed from reserves in 2006 because of economics and possible water issues. It consists of two separate areas, a relatively flat-lying zone at the base of the Roberts Mountains Formation and a main zone which is associated with the New Deep fault. Mineralization is hosted by the Hanson Creek III which is locally overlain by the Snow Canyon Formation.
Mineralization at Murray generally trends southwest but the southern body trends west-northwest. One strong north-south mineralized trend connects to the southern body on the west side. The main trends are continuous ranging from 500 to 2,500 feet. The width is generally 50 to 400 feet and the thickness from 20 to 200 feet. The depth ranges from the surface to 750 feet deep. The groundwater table at this former mine currently lies at approximately 6,100 feet in elevation; no dewatering wells are active at Murray today. All remaining mineralization at Murray and Murray Zone 9 is only stated as a resource (no reserves) due to the high groundwater table.
45
Starvation Canyon
Starvation Canyon occurs in the southern half of the Jerritt Canyon property. Gold mineralization at Starvation Canyon occurs at the Hanson II-III contact and is localized along a west-northwest fault zone at northeast structural intersections. The majority of the mineralization is within the interbedded micrite and argillaceous limestone unit III of the Hanson Creek Formation, starting at or just beneath the contact. There are instances where mineralization has formed within the massive limestone of the basal Hanson Creek II, but these are rare. Drilling in 2007 and 2008 further defined the resource at Starvation, along its outer edges as well as the internal grade distributions. High angled structures have also been identified. In addition, core drilling has improved sample recovery.
Mineralization trends northwest 1,500 feet with a width ranging from 150 to 400 feet. The mineralization thickness is 5 to 100 feet and the depth ranges from 300 to 600 feet below the surface. The reserves and resources at Starvation Canyon lie above the groundwater table.
West Mahala
The West Mahala mineralized zone lies between the Smith Mine to the east and the SSX Mine to the west and is hosted at the contact between the Roberts Mountain and Hanson Creek Formations. The mineralization trends east-west with continuity ranging from 400 to 1,000 feet. The width ranges from 150 to 600 feet and the thickness ranges from 10 to 60 feet. The West Mahala mineralization is generally 1,000 to 1,200 feet below the surface. It is believed that additional infill drilling at West Mahala (targeted for the 2011 drill program) will partially convert the identified mineralized resources to reserve and at some point and become part of the SSX underground Mine. The majority of the resources at West Mahala lie below the groundwater table.
Wright Window
Wright Window is a small open pit reserve and resource area located on the west side of the Independence Mountains to the west of the Murray mine. The deposit is hosted by the lower Roberts Mountains and Upper Hanson Creek Formations along the Saval Discontinuity. Mineralization in the resource occurs in four zones (Figures 16 and 18); the west zone mineralization outcrops at the surface and is about 50 feet thick. The higher-grade east area is about 200 by 300 feet long and wide, 45 feet thick, and lies about 400 feet below the surface.
Pie Creek
Potentially economic gold mineralization occurs in a series of near-surface zones in the head of Pie Creek drainage on the east flank of Wheeler Mountain in the southern half of the Jerritt Canyon property. Indicated and inferred resources have been included in the block model and are shallow enough (<200 feet in depth below the surface) for consideration of open pit mining. The main pod of mineralization is about 800 feet long, dips moderately to the southeast at about 30°, and is 20 to 45 feet in cross-sectional thickness. Mineralization is hosted in the top of unit 3 of the Silurian-Ordovician aged Hanson Creek Formation (SOhc3) and is probably controlled by northeast-trending faults. Three other smaller mineralized pods are also hosted in the same rock unit but strike northwest and dip moderately to the north. The main mineralized pod occurs between two mineralized northwesterly cross structures.
Mill Creek
Potentially economic gold mineralization at Mill Creek occurs in a small, near-surface zone located just down the hill from a mineralized zone previously mined by a series of small open-pits. The modeled remaining intact mineralized zone is about 400 ft across, dips moderately to the north at about 400, and varies from 20 to 70 ft in cross-sectional thickness. Mineralization is hosted in unit three of the Silurian-Ordovician aged Hanson Creek Formation (SOhc) and is localized in a structural wedge between intersecting east-west and northeast trending faults that down-drop Hanson Creek unit three against unit four. These faults splay off of the nearby major northeast-trending Mill Creek fault. The Mill Creek fault is of high displacement and cuts diagonally across the district, forming the western boundary of three major lower plate carbonate rock windows.
46
Road Canyon
Potentially economic mineralization at Road Canyon occurs in a thin, near- or at-surface body 10 to 25 feet thick hosted in colluvial material. This mineralization occurs over several hundred feet in length on a moderately sloped hillside. The modeled mineralization is interpreted as the weathered remains of a bedrock gold zone with some amount of downslope movement.
This mineralization was modeled by previous Jerritt Geology teams, and confirmed by the present authors in Vulcan, using a single ore zone wireframe that connected ore-tenor intercepts and allowed up to 100 feet of projection beyond them. Material outside of the wireframe was not modeled. A much lighter tonnage factor of 17.5 ft3/ton was used instead of the standard 12.6 ft3/ton in order to better represent swelling and pore space in the unconsolidated material. Recognition that the mostly unconsolidated material could be potentially scraped or bulldozed in mining, it was decided that a typical bench-based pit optimization would be inappropriate as it ends up unnecessarily doubling the dilution.
MCE
Potentially economic mineralization at MCE is located at the base of the Marlboro Canyon pit and to the northeast of the Murray Mine. The MCE underground mine was previously mined from 1997 to 2004. The mineralization remaining in the resource is small and is confined to the contact zone between the Hanson Creek III and IV units, which dip 20 degrees to the south. The remaining mineralization occurs along a N70°E trending zone about 1,500 feet long with a plunge of 15° to the east.
Coyote Zone 10
Potentially economic mineralization at the Coyote Zone is located west of the Murray Mine. Most mineralization is hosted in the Roberts Mountain Formation near the lower contact with the Hanson Creek Formation approximately 170 to 1,000 feet below the existing surface. A lesser amount of mineralization is hosted in unit I of the Hanson Creek Formation. The mineralized body is approximately 200 feet in length and 18 to 110 feet in cross-sectional thickness.
Burns Basin
The Burns Basin area was previously open pit mined from 1988 to 1998. Potentially economic mineralization that makes up the remaining intact open pit (using a US$450 LG shell) and underground resources is mostly hosted at the contact zone between the Hanson Creek III and IV units. The underground resource is located outside of the US$450 pit shell in the northeast area approximately 600 to 800 feet from one of the pit resources. A significant amount of fill has been placed in portions of the Burns Basin pits, some of which is classified as municipal solid waste and debris from crates, cartons, and perhaps demolition of equipment. Modeled underground inferred resources at Burns Basin was lower based on the present author’s review of the old 2004 block models and pit shells.
California Mountain (NEXT)
Potentially economic mineralization in the California Mountain open pit and underground resources are located north and west of the existing California open pit that was mined from 1993 to 1994. This remaining mineralization is hosted both in the Roberts Mountain Formation near the upper contact with the Hanson Creek Formation, and within unit III of the Hanson Creek Formation. The remaining resource mineralization lies on a northeastern mineralized trend.
47
Drilling
Numerous drill campaigns have been executed at Jerritt Canyon since its discovery in the 1970’s. Exploration drilling programs typically consist of vertically oriented RC drilling at about 200 foot centers. The spacing is then reduced to about 140 feet and finally, to 100 foot centers or less. Surface core drilling typically makes up about 5% to 10% of the total drilling. During the early drilling years in the 1970’s and 1980’s when shallow open-pit targets were being pursued, most of the surface drill holes were drilled to a maximum depth of 600 feet below the surface and stopped regardless of the geological rock unit or alteration that was encountered.
At the underground mines up to August 2008, definition drilling included core drilling on 50 foot centers from underground stations, using NQ sized core which is 1.875 inches in diameter. In 2010, underground diamond drilling was used for exploration and resource conversion. Underground RC drilling (Cubex) is used for resource confirmation and is generally drilled on 20 to 40- foot centers. Underground RC drill holes are generally less than 150 feet in length, but can be as long as 300 feet. Up to August 2008, underground production sample drilling consisted of Cubex and rotary percussion drilling (Solo and Secoma). In 2010 a 5200 DRC Cubex (RC) drill, owned and operated by SMD, was used primarily for underground production sample drilling at the Smith Mine. These production drill holes were generally short, less than 60 feet, and were drilled on center as close as 10 to 20 feet. The vast majority of drill holes, except the production holes, have been measured for downhole deviation.
Tens of thousands of holes have been drilled on the property over the years. As of December 31, 2010, there are a total of 14,873 surface drill holes totaling 8,449,071 feet and 36,817 underground drill holes totaling 3,068,494 feet in the acQuire digital drill hole databases. The Murray mine has over 22,000 holes with more than 2 million feet drilled; the Smith mine has over 6,800 underground drill holes with more than 1.53 million feet; the SSX mine has nearly 21,560 underground drill holes with 2.73 million feet of drilling. Figures 7, 8, and 9 show the drill hole plan maps in the Smith mine, SSX-Steer complex (including Saval and West Mahala), and the Starvation Canyon area, respectively.
Drilling at Jerritt Canyon for the last twelve years is shown in Table 4. Drilling in 2000 through 2002 for AngloGold and Meridian was conducted either by contract drilling companies and underground drill rigs owned by Anglo Gold and Meridian Gold. Drilling from 2003 to the present for Queenstake was conducted by underground drill rigs owned by Queenstake or contract drilling companies not owned by Queenstake. The name of the drilling company is listed on each drill hole log stored either in the acQuire digital drill hole database or listed on the paper drill hole log files stored at the mine.
Drilling in 2008 was conducted underground at the SSX and Smith Mines, and throughout the property on the surface. Underground drilling was conducted underground at Smith in 2010 and at both Smith and SSX-Steer in 2011.
48
Figure 7. Smith Mine Drill Hole Plan Map
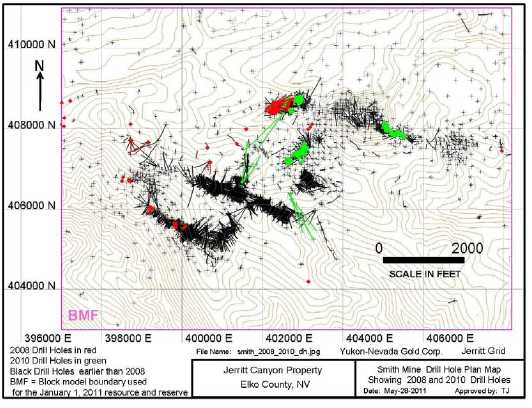
Figure 8. SSX-Steer Mine Complex Drill Hole Plan Map
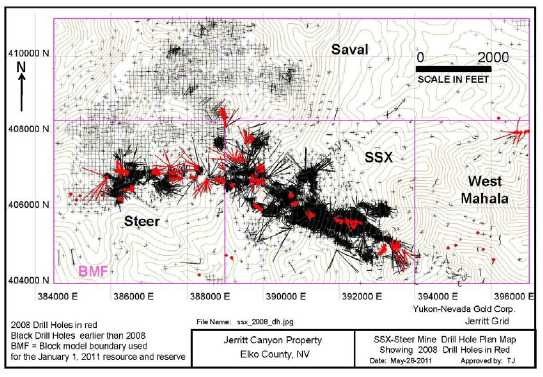
49
Figure 9. Starvation Canyon Drill Hole Plan Map
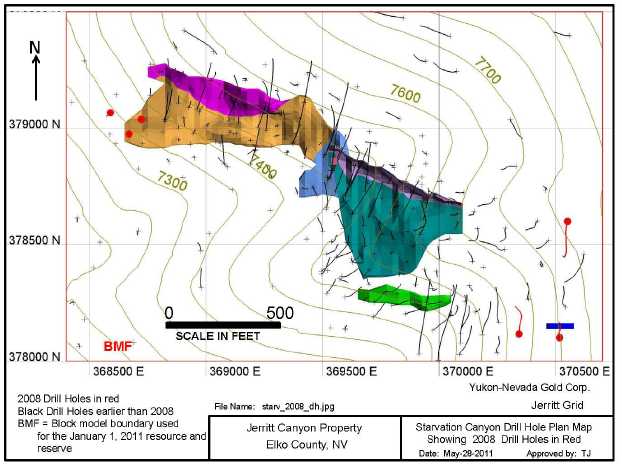
No underground drilling was conducted in 2009. No surface drilling was conducted on the surface in 2009 and 2010. All of the surface and underground drilling methodologies used in 2008, 2010, and 2011 were similar to that done in 2007 as described in the year-end December 31, 2007 NI 43-101 report (SRK, 2008).
Table 4: Jerritt Canyon Drilling (2000 through 2010)
| Year | Surface RC | Surface Core | UG Core | UG RC | Production |
| | No. | Footage | No. | Footage | No. | Footage | No. | Footage | No. | Footage |
| 2000 | 378 | 444,795 | 2 | * | 292 | 75,799 | ** | ** | 4,982 | 204,182 |
| 2001 | 59 | 65,450 | 0 | 0 | 268 | 86,134 | 914 | 112,129 | 5,086 | 349,157 |
| 2002 | 27 | 18,905 | 0 | 0 | 186 | 53,940 | 2,939 | 245,536 | 3,593 | 135,824 |
| 2003 | 108 | 47,277 | 0 | 0 | 119 | 41,458 | 2,057 | 191,416 | 3,643 | 141,218 |
| 2004 | 377 | 300,226 | 34 | 21,212 | 297 | 126,091 | 2,643 | 263,367 | 2,739 | 108,780 |
| 2005 | 126 | 101,413 | 4 | 1,403 | 179 | 80,251 | 2,618 | 267,627 | 2,414 | 94,793 |
| 2006 | 155 | 135,940 | 0 | 0 | 125 | 53,985 | 2,160 | 206,138 | 724 | 28,251 |
| 2007 | 220 | 216,592 | 15 | 12,495 | 44 | 20,580 | 1,808 | 178,625 | 1,035 | 38,950 |
| 2008 | 100 | 103,300 | 8 | 9,830 | 94 | 41,521 | 230 | 371,169 | 595 | 45,430 |
| 2009 | - | - | - | - | - | - | - | - | - | - |
| 2010 | 0 | 0 | 0 | 0 | 8 | 8,126 | 3 | 630 | 1,140 | 70,935 |
| 2011 | 208 | 120,130 | 12*** | 14,147 | 37 | 23,942 | ** | ** | 809 | 93,753 |
Notes: *2000 surface core footage is included with surface RC
**2000 and 2011 underground RC drilling is included with production drilling for that year
50
***15 surface core holes were core “tails” drilled after a RC precollar; the 12 drill holes listed were entirely core drilled at Starvation Canyon;
No drilling was conducted in 2009
Queenstake owned the Jerritt Canyon property since mid-2003;
The Company has owned Queenstake since mid-2007;
Contract drilling companies have completed almost all of the surface drill holes in Table 4;
Both contract drill companies and company-owned drill rigs completed the underground drilling from 2000 to 2011;
A single contract drilling company conducted the underground drilling in 2010.
Sampling and Analysis
Drill hole samples in 2008, 2010 and 2011 were analyzed at both the Jerritt Canyon assay lab and two commercial laboratories: ALS and American Assay Laboratory (AAL). The discussion below details the procedures and protocols used to collect and store the data for the Jerritt Canyon property. The Quality Assurance and Quality Control (QA/QC) programs are also detailed below.
Jerritt Canyon Laboratory Procedures (2008-2010)
In 2008, the mine utilized the noncertified Jerritt Canyon assay laboratory (JC lab) for analytical work on the underground samples with check samples sent to the certified (ISO/IEC 17025:2005) ALS Laboratory Group (or ALS Chemex lab or ALS) for comparisons. In 2010, the JC lab was utilized for analytical work on the underground production Cubex drill hole samples with check samples sent on a quarterly basis to ALS Chemex for comparisons. The samples for most of the surface drilling in the West Dash resource area in 2006 were also analyzed at the Jerritt Canyon facility. The JC lab is located in a separate building close to the ore processing plant. The laboratory has all the normal sample preparation equipment and facilities. In 2008, the laboratory operated continually with a crew of 16 and performed about 500 fire assays per day with a 24-hour turnaround from receipt of sample to reporting of assays. In 2010, the Jerritt Canyon assay lab was operated using one 12-hour work shift with a crew of 15 and performed approximately 360 assays per day.
Sample Preparation
All of the underground samples received at the JC lab in 2008-2010 arrived with bar coded labels and were transported to the front laydown area in front of the garage door by the drillers, Queenstake staff geologists or drilling support staff, or mine staff working with contract miner SMD. The labels match drill logs maintained by samplers and drillers in the Jerritt Canyon Underground Department. Sample bar codes in 2008 were scanned into the LIMS (an automated sample tracking system that utilizes bar-code scanning devices) and assay lots were auto-created. During the process of bar code acquisition in 2009 and the first half of 2010, some labels were manually entered into the database by hand since the LIMS system software was not fully operational. The surface drill hole sample numbers were labeled on the sample bags and then logged into the LIMS system by the lab technicians. All logged samples in 2008 and 2009 dried for four to six hours at 325°F prior to prepping. All logged samples in 2010 dried for four to eighteen hours at 205°F in ovens at the lab prior to any further sample preparation described below.
From 2008 and 2010, a rotary (automatic) 1:4 split (50 rotary cuts minimum) follows first stage crushing. Core samples first stage crush to 99% -1 inch prior to split; all other types are typically –1/2 inch prior to first stage split. Second stage crushing (99% - 3/8 inch) automatically passes through a rotary splitter (50 cut minimum). The assay split is then pulverized in a plate mill to 95%-150 mesh (Tyler) and blends for five minutes on a rotary blending wheel. The samples are placed in bar coded sample cups and transferred to fire assay.
51
Jerrritt Canyon Lab Fire Assay Procedures
A tray of 24 thirty-gram charge crucibles is prepared with a standard litharge flux. Each sample is weighed at one assay ton. In 2008 and 2009, of 24 samples on each tray, one was a repeat sample, one was a standard, one was a blank, and one was a blind standard inserted into the sample stream by the Geology department. The samples in 2008-2010 were fired by the method of fusion/cupellation, with a gravimetric finish. The balance used for the final weighing from 2008-2010 is a Cahn C-30 microbalance that was serviced and calibrated on a semi-annual basis by Microlab Services.
In 2010, similar fire assay methods were used as in 2008. In 2010, of 24 samples on each tray, one was a triplicate sample (in the eleventh position of the sample sequence and available to collect and send to ALS Commercial Lab for an assay check), one was a blank (second in the sequence), and one was a blind standard inserted into the 24th position of the sample sequence by the JC lab department. The standards used were the same used by the Geology Department (Rocklabs and in-house standards JCQ06 and JCQ07 described under the heading “Quality Controls and Quality Assurance” and presented to the JC lab by the Jerritt Geology staff as prelabeled blind pulp bags. A few non-certified standards were used by the JC lab in the first half of 2010 while certified standards were being purchased or made.
For 2008 to 2010, the JC lab in-house quality assurance/quality control (QA/QC) procedure for checking the accuracy of the Jerritt Canyon lab consists of submitting saved duplicate samples of the mill feed and tail daily samples to outside labs for comparison. These samples in 2008 were submitted on a weekly basis to either Rocky Mountain Geochemical or Chemex Laboratories. The data was compiled from the JC daily assay sheet and compared with the results from the two outside labs. The results of the comparison were entered into a statistical program and a running check was maintained on the data.
For 2010, the production drill hole samples were submitted on a quarterly basis to ALS-Chemex Lab by the Jerritt Geology staff. The JC lab staff compiles the results of each 24 sample assay batch and forwards the final results to the Geology Department as individual .csv spreadsheet files. The Geology Department compiles the Production drill hole assays and QA/QC samples from the JC daily assay sheet and imports the data to acQuire database software. The results of the assay lab comparison are monitored using QA/QC protocols set up in acQuire and described under the heading “Quality Controls and Quality Assurance”.
Commercial Laboratories
Surface RC and diamond drilling completed in 2008 were sent to the primary lab ALS Minerals Laboratory Group (also referred to as ALS Chemex or ALS in this document) and the secondary lab American Assay Laboratories (AAL) in Reno and Sparks, respectively, Nevada. For 2008 and 2009, samples above 0.100 opt gold were routinely fire assayed with a gravimetric finish. For 2010, the ALS Chemex lab in Reno, Nevada was used for all of the underground diamond drill hole analyses. Samples above 0.070 opt Au were routinely fire assayed with a gravimetric finish. For all years 2008-2010, blanks, standards, and pulps were routinely inserted into the sample stream for QA/QC, and check assay.
ALS Chemex typically picked up the cut samples (bagged and labeled with bar codes) at the Jerritt Canyon core logging facility and brought them to their lab in Elko for sample preparation. The 2010 sample preparation procedures for ALS Chemex include:
- the PREP-31 ALS method code that consists of logging the sample, weighing the sample, fine crushing the sample to better than 70 percent passing a 2mm (Tyler 9 mesh, US Std. No 10) screen, splitting off up to 250 g and pulverizing the split to better than 85% passing a 75 micron (Tyler 200 mesh, US std. No. 200) screen;
- Dry-21 ALS method code; and
52
- CRU-21 ALS method code that consists of a primary crush to approximately -6mm.
Once the samples were prepared by Jerritt Canyon geologists (geologically logged and sample intervals defined) and geotechnical staff (split or sawed core into two equal pieces and placing one half of the core into a labeled and sealed sample bags for assay analysis), they were picked up at the Jerritt Canyon mine site by ALS representatives who transported the samples to their sample preparation lab in Elko, Nevada and eventually to their assay lab in Reno, Nevada for analysis. The 2010 assay procedures for ALS Chemex included:
- The Au-AA23 ALS method code that consists of a 30g fire assay for gold that uses an aqua regia digest and analysis by atomic absorption spectroscopy (AAS) finish. A prepared sample is fused with a mixture of lead oxide, sodium carbonate, borax, silica, and other reagents as required, in quarted with 6 mg of gold- free silver and cupelled to yield a precious metal bead. The bead is digested in 0.5 mL dilute nitric acid in the microwave oven; 0.5 mL concentrated hydrochloric acid is then added and the bead is further digested in the microwave at a lower power setting. The digested solution is cooled, diluted to a total volume of 4 mL with de-mineralized water, and analyzed by atomic absorption spectroscopy against matrix-matched standards. The assay range for this analysis is from 0.005 to 10 ppm; all results >1 ppm were automatically re-analyzed by method Au-GRA21;
- The Au-GRA21 ALS method code that consists of a 30g Au fire assay with a gravimetric finish. The sample is fused with a mixture of lead oxide, sodium carbonate, borax, silica, and other reagents in order to produce a lead button; the lead button containing the precious metals is cupelled to remove the lead; the remaining gold (and silver) bead is parted in dilute nitric acid, annealed and weighed as gold. The assay range for this analysis is from 0.05 to 1,000 ppm Au. This assay method is used automatically for overlimit results from the Au-AA23 assay method.
American Assay Lab (AAL) uses similar sample preparation and assay analysis procedures as ALS Chemex. American Assay Laboratory has a sample preparation facility in Elko, Nevada and an assay laboratory in Sparks, Nevada.
Diamond drill core was transported from the underground drill stations to the Jerritt Canyon core logging facility by the contract drillers and/or Queenstake geological staff and the diamond drill core was stored and logged in a secure (lockable) facility until it was processed for shipment to an assay lab.
Quality Controls and Quality Assurance
2008 Jerritt Canyon and Commercial Laboratory QA/QC Procedures
The Geology Department at Jerritt Canyon had established laboratory QA/QC procedures that were identified in the 2008 NI 43-101 report (SRK, 2008) as follows:
Jerritt Canyon Laboratory
- One standard sample per 20 samples;
- One blank sample, consisting of silica sand, per drill hole;
- One pulp of a previously assayed interval is inserted into the sample stream at the geologist’s discretion; and
- Check assays consist of coarse rejects and pulps (one sample for every twenty over 0.01opt and one in ten over 0.07opt) sent to a commercial laboratory, generally ALS Chemex.
Commercial Laboratory
- One standard sample in each batch of samples. A batch contains 40 samples in most commercial labs;
53
- One blank sample of silica sand per hole, inserted at the beginning or end of hole, or after a mineralized zone;
- A duplicate sample consisting of a pulp of a previously assayed interval may be used as a substitute for the regular standards; and
- 10% of the samples that have a value greater than 0.07opt gold, and 5% of samples between 0.01opt and 0.07opt gold are submitted to a second lab for check analysis.
The standards used in 2008 and 2009 were prepared from Jerritt Canyon mineralized rock and have several different gold values. The standards used throughout 2008 and 2009 include:
- High – 0.268opt;
- JCQ01 – 0.117opt;
- JCQ02 – 0.256opt;
- JCQ03 – 0.051opt; and
- JCQ04 – 0.120opt.
Results from the standards or duplicates are reviewed by geologists upon receipt from the laboratory. If there is significant deviation from the expected value then the batch of samples is re-fired. If the lab is unable to match the original results within reasonable limits then the sample is re-fired until assay values match. The results from these analytical determinations are available in the QA/QC section below.
SRK reviewed the Jerritt Canyon assay QA/QC data for 2007 and found the results within industry standards. Various graphs representing the results of the 2007 QA/QC program are presented in the Year-End 2007 NI 43-101 report (SRK, 2008).
The primary author of the report was not at the site during the making of the QA/QC standards used in the 2008 drilling program. However, the standards that were used in 2008 and 2009 and inherited from the previous Jerritt Canyon Mine Geology group (pre-August 2008) were located by the primary author at the secured Jerritt Canyon core logging facility and were in clearly marked and sealed five-gallon buckets and containers.
2010 and 2011 Jerritt Canyon and Commercial Laboratory QA/QC Procedures
In 2010, the Geology Department at Jerritt Canyon established new laboratory QA/QC procedures as follows:
Jerritt Canyon Laboratory
- One standard sample per 24 samples;
- One blank sample, consisting of silica sand, per 24 samples;
- One triplicate sample per 24 samples;
- Check assays consist of in-house QA/QC procedures identified above, and submitting saved triplicates of the production drill hole samples to an outside certified lab for comparison. The production drill hole samples are submitted on a quarterly basis to ALS Chemex Laboratories.
Commercial Laboratory
A commercial laboratory was used to assay underground exploration and resource conversion diamond drill holes. The QA/QC protocol for 2010 and 2011 is summarized below:
- One standard sample (listed below) was inserted into the assay sample stream every 20th sample;
- A minimum of one blank sample of silica sand per hole, inserted at the beginning or end of hole, or after a mineralized zone;
54
- Send replicate samples consisting of both pulps and rejects originally assayed at ALS Chemex lab to ALS Chemex with different sample numbers on a quarterly basis; 1 percent of the exploration and resource conversion drill holes were targeted (estimated 37 pulps and coarse rejects per quarter);
- Send pulps originally assayed at ALS lab to AAL lab using the same sample numbers as the original assay; 2.5% of the underground diamond drill holes were targeted (estimated 40 pulps per quarter); 10% of the samples that have a value greater than 0.07opt gold (using gravimetric finish), and 5% of samples between 0.01opt and 0.07opt gold are submitted to the second lab (AAL) for check analysis each quarter.
The 4 standards used in 2010 were either prepared from Jerritt Canyon mineralized rock or purchased from Rocklabs Ltd. (a commercial lab that makes certified reference materials) and have several different gold values. The recommended gold concentration for each standard used throughout 2010 includes:
- JCQ06 – 0.159opt (Jerritt Canyon mineralized rock source);
- JCQ07 – 0.241opt (Jerritt Canyon mineralized rock source);
- Si54 – 0.0519opt (Rocklabs certified standard); and
- SK52 – 0.1198opt (Rocklabs certified standard).
The Jerritt Canyon sourced standards JCQ06 and JCQ07 consist of low-sulfide bearing carbonaceous limestone material that were collected from the Jerritt Canyon ore-dryer baghouse in early spring 2010 and approximate the size fraction of a pulp generated from a certified commercial lab. A large amount of each sample was submitted to American Assay Laboratory (AAL) Lab in Sparks, Nevada where they used a large blending machine to help homogenize the standards. After homogenization was attained, the standards were submitted to 3 different assay laboratories as random “blind” pulp samples with labeled identification numbers. The assay results of the standards from all of the labs were reviewed together. The recommended ideal Au values were calculated and based on the mean value. The upper and lower acceptable limits for each standard were calculated based on adding and subtracting two standard deviations to the mean value from all three labs.
The RockLab standards were analyzed by over 40 different assay labs around the world, have a 95% confidence level, and lower standard deviations and therefore lower acceptable limits for passing the Jerritt Canyon QA/QC protocol.
In order for an assay batch to pass the QA/QC review, the standard assay results must be within two standard deviations of the recommended standard value listed above. Various graphs and a discussion of the 2010 QA/QC program are presented in the Appendix and in Section 12 of the Jerritt Canyon Report. Results from the standards or duplicates are reviewed by geologists upon receipt from the laboratory. If there is significant deviation from the expected value then the batch of samples is re-fired. If the lab is unable to match the original results within reasonable limits then the sample is re-fired until assay values match or a valid reason for the standard assay discrepancy is determined (e.g. a mislabeled standard or a standard that was inserted out of sequence).
Mineral Resource and Mineral Reserve Estimates
On June 28, 2011, and as amended on January 6, 2012, YNG updated the Jerritt Canyon resource estimate incorporating additional drilling from the 2008 to 2010 drill campaigns. An additional 2,178 drill holes were added since the last NI 43-101 report (SRK, 2008). The resource estimate as of January 1, 2011 was done by Karl Swanson, independent consultant, SME, MAusIMM and Todd Johnson, VP Exploration Yukon Nevada Gold Corp., P.E. using the Vulcan Software version 7.5 service pack one. This new NI 43-101 resource estimate reinterpreted the 0.10 opt grade shells and created a geologic model within specific areas of the Jerritt Canyon claim boundary.
Three new block models were created in Vulcan Software for the January 1, 2011 Jerritt Canyon NI 43-101; Smith, SSX, and Starvation. The SSX block model includes the SSX, Steer, Saval, and West Mahala deposits.
55
The deposits at Jerritt Canyon which were re-estimated and new resources and/or reserves calculated since the last NI 43-101 report (SRK, 2008) are:
Smith
SSX-Steer
Saval
Starvation
West Mahala
Wright Window (the SRK 2008 Wright Window block model and the January 1, 2011 classification system was used for this study)
The open pit and underground models and deposits below were reviewed in MineSight and verified by the primary authors in Vulcan and have the same resources as stated in the 2008 NI 43-101:
Burns Basin (Indicated open pit)
California Mtn.
MCE
Mill Creek
Murray Zone 9
Pie Creek
Road Canyon
The following open pit and underground resources were viewed in Vulcan by the present authors and revised from earlier resource statements included in SRK (2008):
Burns Basin (Indicated and Inferred underground resources);
Coyote Zone 10 (Inferred open pit and Indicated and Inferred underground);
Murray (Measured and Indicated underground resources).
The December 31, 2007 underground resources that could not be viewed in Vulcan or verified by the present authors of this study include those for: Murray (Inferred resources), Waterpipe II (Inferred resources), and Winters Creek (Indicated and Inferred resources). The data for these underground resources were therefore excluded from the present resource tables. Future NI 43-101 reports will examine these areas based on new modeling work.
Therefore all supporting documentation for the unchanged resources is in SRK’s December 31, 2007 NI 43-101 technical report (SRK, 2008) and will be summarized in this document where necessary.
The stockpiles reposing at the mine portals or remaining from earlier open pit extraction are included in the resource table.
Three resource estimation methods were run on the gold grade in the block models used for the January 1, 2011 NI 43-101 report at Jerritt Canyon. These estimation methods are ordinary kriging (au_ok), inverse distance cubed (au_id3), and nearest neighbor (au_nn). The Smith and SSX models used the ordinary kriging estimate for the calculation of resource and reserves whereas Starvation used the inverse distance cubed estimate due to the wider spaced drill data and no production data. Table 5 shows the estimation method used in reporting by deposit or area for all of the deposits modeled in 2007 and 2011.
For the Jerritt Canyon block model estimations, each of the grade shell solids had individual estimation orientations and the blocks within the grade shells were estimated using these individual search orientations with multiple passes.
56
For Smith and SSX, three passes were done. The first pass has conservative parameters that classify the estimated blocks as measured with a search distance of 40x40x20 feet. The second pass uses a larger search, 100x100x50 feet, and requires less samples which classifies the estimated blocks as indicated. The third and last pass at 500x500x250 feet is the least restrictive and classifies the blocks as inferred.
For Starvation, two passes were used. The first pass is basically measured and indicated at 75x75x25 feet and the second at 150x150x50 feet is inferred. A script was run after the estimations to determine the final classification.
The low grade blocks were also estimated in the Smith and SSX block models with the same three passes but restricts samples greater than 0.10 opt grade to a search radius of 10x10x10 feet from the center of the block. The low grade estimations were divided into two domains that define the general limbs of an anticline and have different estimation orientations for each side. The estimated low grade blocks outside of the 0.1 opt grade shells are not included in either the resource or reserve. The sole purpose of the low grade estimation is to guide exploration.
The low grade blocks are also estimated with the same three passes but restricts samples greater than 0.10 opt grade to a search radius of 10x10x10 feet from the center of the block. The low grade estimations were divided into two domains that define the general limbs of an anticline and have different estimation orientations for each side.
During the estimations, only the composites flagged as inside the grade shells were used to estimate the blocks inside the grade shells. Likewise, only the composites flagged as outside the grade shells (low) were used to estimate the blocks outside of the grade shells.
Table 6 shows the estimation parameters for each deposit and pass. Appendix F shows the estimation ellipse orientations and ranges for each grade shell and pass including the low-grade estimation.
Table 5: Jerritt Canyon Resource Estimation Methods by Deposit
| Deposit or Area | Estimation Method |
| Resource and Reserve | |
| Smith | Ordinary Kriging |
| SSX-Steer | Ordinary Kriging |
| Saval | Ordinary Kriging |
| Starvation | Inverse Distance Cubed |
| �� West Mahala | Ordinary Kriging |
| Wright Window | PACK – IDW |
| | |
| Resource Only | |
| Burns Basin | IDW |
| California Mtn. | POLYGONAL |
| Coyote Zone 10 | IDW |
| MCE | PACK |
| Mill Creek | IDW |
| Murray Zone 9 | PACK - IDW |
| Pie Creek | IDW |
| Road Canyon | IDW |
Table 6: Estimation Parameters by Block Model
Area |
Shell |
Pass | Parent | Min | Max | Cap | Major | Semi | Minor | Max/ |
| X | Y | Z | Samp | Samp | Grade | Radius | Radius | Radius | DH |
| Smith | low | meas | 20 | 20 | 20 | 8 | 12 | 0.1 | 10 | 10 | 10 | 3 |
57
Area |
Shell |
Pass | Parent | Min | Max | Cap | Major | Semi | Minor | Max/ |
| X | Y | Z | Samp | Samp | Grade | Radius | Radius | Radius | DH |
| Smith | low | ind | 20 | 20 | 20 | 5 | 12 | 0.1 | 10 | 10 | 10 | 3 |
| Smith | low | inf | 20 | 20 | 20 | 2 | 12 | 0.1 | 10 | 10 | 10 | 3 |
| Smith | shell | meas | 10 | 10 | 10 | 8 | 12 | 3.5 | 10 | 10 | 10 | 3 |
| Smith | shell | ind | 10 | 10 | 10 | 5 | 12 | 3.5 | 10 | 10 | 10 | 3 |
| Smith | shell | inf | 10 | 10 | 10 | 2 | 12 | 3.5 | 10 | 10 | 10 | 3 |
| SSX | low | meas | 20 | 20 | 20 | 8 | 12 | 0.1 | 10 | 10 | 10 | 3 |
| SSX | low | ind | 20 | 20 | 20 | 5 | 12 | 0.1 | 10 | 10 | 10 | 3 |
| SSX | low | inf | 20 | 20 | 20 | 2 | 12 | 0.1 | 10 | 10 | 10 | 3 |
| SSX | shell | meas | 10 | 10 | 10 | 8 | 12 | 3.5 | 10 | 10 | 10 | 3 |
| SSX | shell | ind | 10 | 10 | 10 | 5 | 12 | 3.5 | 10 | 10 | 10 | 3 |
| SSX | shell | inf | 10 | 10 | 10 | 2 | 12 | 3.5 | 10 | 10 | 10 | 3 |
| Starv | shell | pass1 | 10 | 10 | 10 | 3 | 10 | 0.8 | 20 | 20 | 10 | 2 |
| Starv | shell | pass2 | 10 | 10 | 10 | 2 | 10 | 0.8 | 20 | 20 | 10 | 2 |
A parent block size was used during the estimations of the block models at Jerritt Canyon. This means that the estimation is run at the centroid of the parent block and all real blocks that exist in the estimation parent block are assigned that single estimated grade. The estimation parent block size for the low grade blocks at Smith and SSX are 20x20x20 feet. The estimation parent block size for the grade shell blocks for Smith, SSX, and Starvation is 10x10x10 feet.
The cap grade determined for each deposit is used in the estimations by restricting the range that the composites with values greater than the cap can influence. The range used at Smith and SSX is 10 feet in the major orientation, 10 feet in the semi-major orientation, and 10 feet in the minor orientation for gold composites higher than 3.5 opt. This means that a block centroid must be within 10 feet of the high-grade composite in order for it to be used as one of the composites used in that estimate. The cap ranges at Starvation are 20x20x10 for gold composites greater than 0.8 opt.
A different number of composites (samples) were used for the different estimation passes for each block model. For Smith and SSX, the minimum number of samples for the measured pass is 8, for the indicated pass is 5, and for the inferred pass is 2. The maximum number of samples is 12 for all three passes. For Starvation, the minimum is 3 for the first pass and 2 for the second pass. The maximum samples at Starvation is 10 for both estimation passes.
In addition, a maximum number of composites per drill hole is used during the estimations. At Smith and SSX, the maximum per drill hole for all estimations is 3. At Starvation it is 2 for both passes.
After the estimations are run, block calculations are run with scripts to assign or calculate values to additional fields in the block models. Text names are assigned to the ZONE, CLASSNAME, and MINED variables in the block models. A density of 0.0794 tons per cubic foot is applied to all intact rock blocks.
A north-south cross section of the estimated gold grades (au_ok) for the Smith model at 400,150E is in Figure 12. The 0.10 opt grade shells are the polygon outlines. The colour scheme is shown in Figure 10.
58
Figure 10: Jerritt Canyon Colour Legends

Figure 11: Plan View of 0.10 opt Grade Shells at SSX-Steer

59
Figure 12 Section View of Smith Estimated Blocks (au_ok) at 400150E
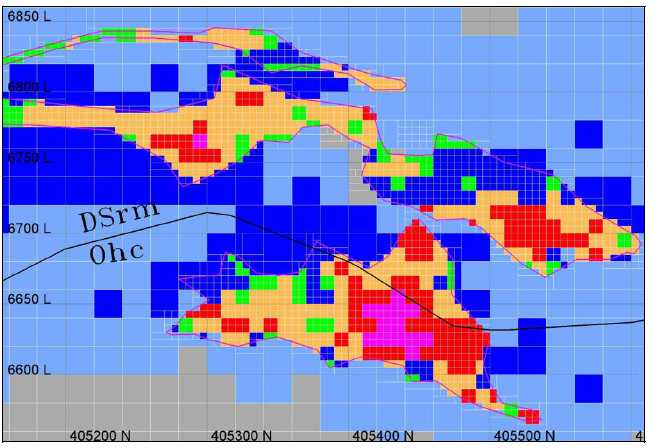
Mined Depletion
Both Smith and SSX have mined out areas within the block models. These mined out areas have been depleted by either deleting or renaming the blocks. At Smith, the Dash Pit (Figure 14) was included in the deepest topography and all blocks above this topo and the original topo surface were named either dump or air in the FM variable. The SSX pits were included in the current topography and all blocks above this surface are called air in the FM variable. No open pits exist within the Starvation model area.
Smith and SSX have underground mining which are tracked as surveyed and triangulated as-built solids. These solids are used to flag blocks as "mined" in the MINED variable at Smith if the block centroid is within the as-built solid. Block centroids that are outside of the as-built solids are named "intact" in the FM variable. At SSX, the blocks within the as-builts are named "asb" in the SHELL and ZONE variables.
A north-south cross section showing the outlines of the 0.10 opt grade shells and the depleted blocks for the Smith model at 400,150E is in Figure 13. This is the same section coordinates as Figure 12. The colour scheme is shown in Figure 10 where orange is "mined" and green is "intact".
60
Figure 13: Section View of Smith Depleted Blocks at 400150E
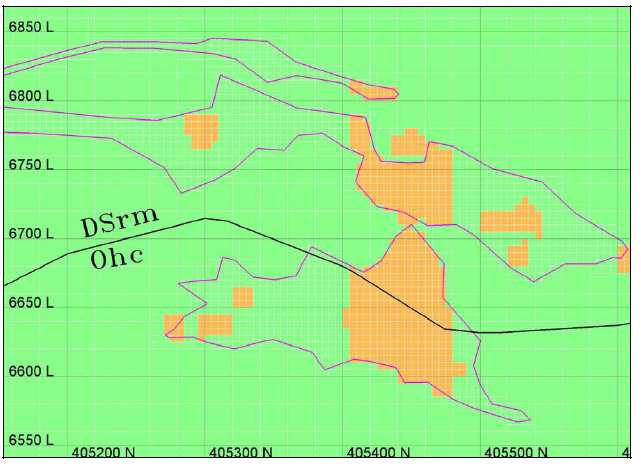
In addition to the as-built solids, polygons (shown in green on Figure 14) were drawn in plan view around densely mined areas at Smith and SSX in order to exclude possible remnants of previously mined grade shells in the resource. These polygons were projected 180° above and below in elevation from the digitized shape and depleted where the shapes intersected the 0.10 opt Au grade shells adding some conservatism to the total resource presented in Table 7. Triangulation solids were built from the polygons and all of the blocks that were not depleted with the as-builts and that are within the polygon solids were flagged as "asb" or "mined". Figure 14 shows the depletion polygons (green) in plan view for Smith. Figure 15 shows the depletion polygons (green) in plan view for SSX.
None of the "asb" or "mined" blocks are used when calculating the mineral resource.
61
Figure 14: Plan View of Smith As-built Solids and Depletion Polygons
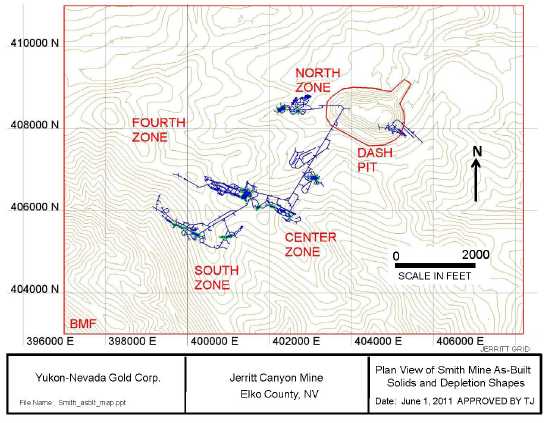
Figure 15: Plan View of SSX As-built Solids and Depletion Polygons
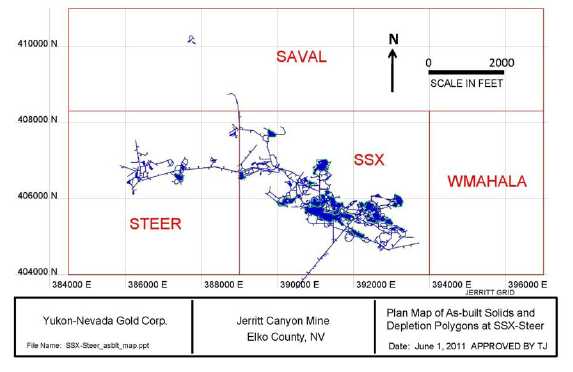
62
Mineral Reserve Estimate
The Jerritt Canyon mineral resources, including reserves, as of January 1, 2011 are listed in Tables 7 to 15. These Mineral Resource tables are separated by open pit (Tables 9 to 12) and underground resources (Tables 7 to 8; and 13 to 14), and by those that were recalculated by this study (Tables 7 to 10). For those underground and open pit resources that were not remodeled for this study and originally included in the SRK 2008 Technical Report, the present authors took the pre-existing block models and analyzed them in Vulcan to either verify or modify the SRK (2008) resource values (Tables 11 to 14). The total Mineral Resources at Jerritt Canyon, as confirmed by the present authors of the Jerritt Canyon Report, are listed in Table 15. The resources are contained within areas where mining is currently taking place or where mining is reasonably expected to take place in the future. The Au ounces are on a contained basis without adjustment for process recovery.
Only blocks within the 0.10 opt grade shells that have a gold grade greater than the 0.125 opt cutoff grade are used in calculating the January 1, 2011 underground resources. Therefore any blocks within the grade shells that have an estimated gold grade less than 0.125 opt are not used in the resource. In addition, only grade shells that have more than 1,000 tons and are within 750 feet of current underground workings or within 750 feet of designed workings used to define the reserve are used to calculate the resource.
The Smith, SSX-Steer, Saval, West Mahala, and Starvation deposits used a 0.125 opt cutoff to calculate the mineral resource. This is based on the current economic cutoff for underground mining at Jerritt. All of the other deposits included in the mineral resource (Tables 9 to 14) used the same cutoffs used in the 2008 NI 43-101. These cutoffs used in the 2008 NI 43-101 ranged from 0.068 opt to 0.086 opt for the open pit resource, and a combination of 0.150 and 0.125 opt for the underground resource for “mature” and “undeveloped” resources, respectively, depending upon proximity to mine infrastructure. The reason for the cutoff ranges for the open pits is that the resources were calculated in 2003 to 2006 and have been carried over the years unchanged to later NI 43-101 Technical Reports.
The open pit block models listed in the below resource tables were originally generated in MineSight software and were reviewed in Vulcan as part of this study for verification and possible use in the Jerritt Canyon Report. During our resource review, a few of the 2008 SRK Jerritt Canyon resources could not be viewed and/or verified and include Waterpipe II and Winters Creek. In addition, a few of the open pit resources, including Burns Basin and Coyote 10, and related underground resources were slightly lower than originally stated in the SRK 2008 Technical Report. The authors of the Jerritt Canyon Report believe that the methodology used to calculate the December 31, 2007 open pit and underground resources are sound, and that the stated unchanged verified resources are at best conservative since the current gold price is much higher than when they were originally made. Some of the open pit resources were examined using much lower gold prices than current gold prices ($550 per oz price and in some cases a $450 per oz Au price was used). Many of these open pit models will be rerun for the upcoming revised 2012 NI 43-101 Technical Report targeted for a late April completion date, some of which will contain new results from the 2011 drilling program.
Table 7: Jerritt Canyon Underground Measured and Indicated Mineral Resources, Including Reserves – January 1, 2011
Mine/Area | Au Cutoff
Grade (opt) | Measured | Indicated | Measured + Indicated |
| kt | opt | koz Au | kt | opt | koz Au | kt | opt | koz Au |
| SMITH | 0.125 | 1,979.7 | 0.237 | 469.2 | 2,062.4 | 0.233 | 480.8 | 4,042.1 | 0.235 | 950.0 |
| SSX-STEER | 0.125 | 2,352.5 | 0.227 | 532.9 | 1,569.8 | 0.221 | 347.2 | 3,922.3 | 0.224 | 880.1 |
| SAVAL | 0.125 | 86.2 | 0.250 | 21.5 | 344.9 | 0.223 | 76.9 | 431.1 | 0.228 | 98.4 |
| STARV | 0.125 | 5.5 | 0.365 | 2.0 | 496.9 | 0.284 | 141.1 | 502.4 | 0.285 | 143.1 |
| W. MAHALA | 0.125 | 0.4 | 0.199 | 0.1 | 212.1 | 0.188 | 39.9 | 212.5 | 0.188 | 40.0 |
| Total | 0.125 | 4,424.3 | 0.232 | 1,025.7 | 4,686.1 | 0.232 | 1,085.9 | 9,110.4 | 0.232 | 2,111.6 |
63
Notes: The January 1, 2011 Mineral Resources were calculated using only blocks within the 0.10 opt grade shells that have a gold grade greater than the 0.125 opt cutoff grade. In addition, only grade shells that have more than 1,000 tons and are within 750 feet of current underground workings or within 750 feet of designed workings used to define the reserve are used to calculate the resource.
Table 8 Jerritt Canyon Inferred Underground Mineral Resources – January 1, 2011
Mine | Au Cutoff Grade
(opt) | Inferred |
| kt | opt | koz Au |
| SMITH | 0.125 | 971.8 | 0.197 | 191.8 |
| SSX-STEER | 0.125 | 344.7 | 0.191 | 65.9 |
| SAVAL | 0.125 | 78.5 | 0.185 | 14.5 |
| STARV | 0.125 | 256.3 | 0.276 | 70.7 |
| W. MAHALA | 0.125 | 1,932.4 | 0.190 | 367.1 |
| Total | 0.125 | 3,583.7 | 0.198 | 710.0 |
Notes: The January 1, 2011 Mineral Resources were calculated using only blocks within the 0.10 opt grade shells that have a gold grade greater than the 0.125 opt cutoff grade. In addition, only grade shells that have more than 1,000 tons and are within 750 feet of current underground workings or within 750 feet of designed workings used to define the reserve are used to calculate the resource.
The January 1, 2011 open pit and stockpile resources are listed in Table 9 and 10. The December 31, 2007 block model for the Wright Window was reviewed using the January 2011 classification scheme to arrive at the restated resources in the tables. The Wright Window resource was calculated using Lerches-Grossman (LG) pit designs that examined measured, indicated, and inferred blocks at a US$1,150 per oz gold price and a 0.042 opt Au cutoff grade. The Wright Window resource includes indicated and inferred blocks from 4 different areas (Figure 16).
Once LG $1,100 reserve pits are designed (including ramps), only one of the pits makes it into the reserve (probable) category. Although the Wright Window Indicated resource totals 100.4 kt at an average Au grade of 0.131, the Wright Window reserve only contains 84.5kt averaging 0.127 opt Au. The main reason for not including more of the Wright Window resource in the reserve is because most of these open pit resources are driven on inferred material. The Wright Window resource represents areas to focus more exploration and drilling in order to try to convert to reserve (measured and indicated classification).
Figures 16 and 18 show the Wright Window resource pits designed at a 0.042 opt gold cutoff. The blocks shown for the resource pits are only those with a grade greater than 0.042 opt. Only the blocks and the proportion of blocks within the pit solid and above the 0.042 opt cutoff grade are used to calculate the resource. Figures 17 and 19 show a plan view and cross-section at 419250N of the Wright Window reserve, respectively, designed at a 0.044 opt Au cutoff.
Table 9: Jerritt Canyon 2011 Measured and Indicated Open-Pit and Stockpile Mineral Resources, Including Reserves – January 1, 2011
| Mine | Au Cutoff
Grade (opt) | Measured | Indicated | Measured + Indicated |
| kt | opt | koz Au | kt | opt | koz Au | kt | opt | koz Au |
| Wright Window | 0.042 | - | - | - | 100.4 | 0.131 | 13.1 | 100.4 | 0.131 | 13.1 |
| Stockpiles | 0.044 | - | - | - | 902.2 | 0.073 | 65.9 | 902.2 | 0.073 | 65.9 |
| Total | | - | - | - | 1,002.6 | 0.079 | 79.0 | 1,002.6 | 0.079 | 79.0 |
| Notes: | (1) | The Wright Window resource was revised using the December 31, 2007 block model and the January 1, 2011 classification system; |
| (2) | The January 1, 2011 stockpile resource is classified as indicated and reconciled to that published in the Year-End 2007 NI 43-101 report. |
64
A detailed description of the Jerritt Canyon January 1, 2011 stockpile resources and reserves are discussed under the heading “Mining Operations – Stockpiles” herein.
Figure 16: Plan Map of the Resources in the Wright Window area
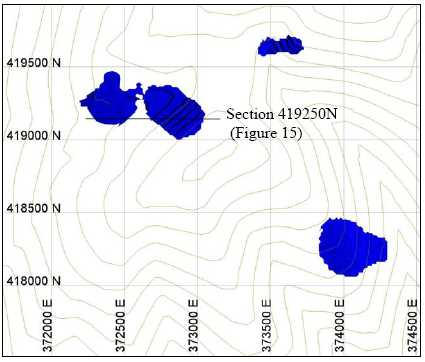
Figure 17: Plan Map of the Reserve pit at Wright Window area
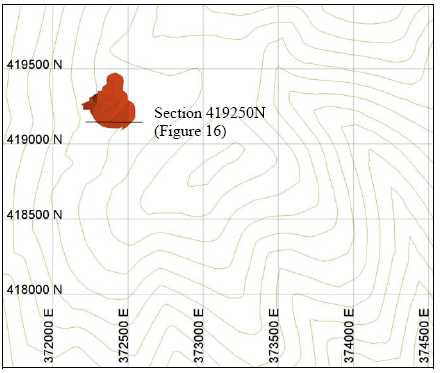
65
Figure 18: Section 419250N of Wright Window with $1,150 Resource Pit Outlines and Blocks with Grade Above 0.042 opt

Figure 19: Section 419250N of Wright Window with $1,100 Reserve Pit Outline and Blocks with Grade Above 0.044 opt
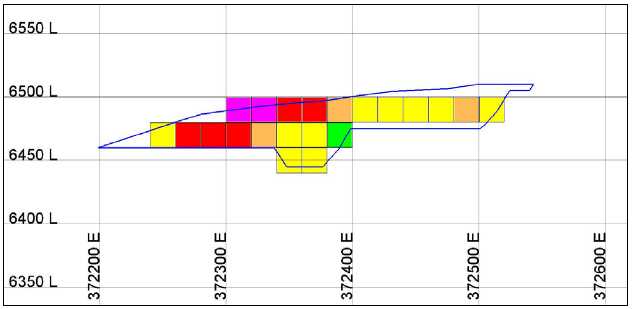
Table 10: Jerritt Canyon 2011 Inferred Open-Pit and Stockpile Mineral Resources – January 1, 2011
Mine |
Au Cutoff Grade (opt) | Inferred |
| kt | opt | koz Au |
| WRIGHT WINDOW PIT | 0.042 | 84.6 | 0.083 | 7.0 |
| Stockpiles | 0.044 | - | - | - |
| Total | | 84.6 | 0.083 | 7.0 |
| Notes: | (1) | The Wright Window resource was revised using the Year-End 2008 block model and the January 1, 2011 classification system; |
| (2) | The January 1, 2011 stockpile resource is classified as indicated and reconciled to that published in the Year-End 2007 NI 43-101 report. |
66
Table 11: Jerritt Canyon Measured and Indicated Open-Pit Mineral Resources, Including Reserves – January 1, 2011 Reassessment
Mine |
Au Cutoff
Grade (opt) | Measured | Indicated | Measured + Indicated |
kt |
opt | koz
Au |
kt |
opt | koz
Au |
kt |
opt | koz
Au |
| Burns Basin Pit(2) | 0.069 | - | - | - | 29.7 | 0.134 | 4.0 | 29.7 | 0.134 | 4.0 |
| Calif. Mtn. (NEXT) | 0.068 | - | - | - | 8.0 | 0.115 | 0.9 | 8.0 | 0.115 | 0.9 |
| Coyote Zone 10 Pit(2) | 0.075 | - | - | - | - | - | - | - | - | - |
| Pie Creek | 0.086 | - | - | - | 190.2 | 0.157 | 29.9 | 190.2 | 0.157 | 29.9 |
| Road Canyon Pit | 0.086 | - | - | - | 148.6 | 0.143 | 21.2 | 148.6 | 0.143 | 21.2 |
| Mill Creek Pit | 0.075 | - | - | - | 78.4 | 0.124 | 9.7 | 78.4 | 0.124 | 9.7 |
| Total | | - | - | - | 454.9 | 0.144 | 65.7 | 454.9 | 0.144 | 65.7 |
| Notes: | (1) | Data from SRK (2008) and verified by the present authors for this study; |
| (2) | Data from the present authors based on review of the old SRK (2008) models in Vulcan using the available LG pits and cutoff Au grades listed in the table; some of the Coyote and Burns Basin resources were decreased as a result of the present study; |
| (2) | The Pie Creek Resource last done in December 31, 2006 with the Indicated material calculated from a pit driven only on Indicated material); the Inferred material was calculated based on the increment between a $550 raw pit optimization shell driven on Indicated material, and a $550 raw pit optimization shell driven on Indicated and Inferred material; |
| (3) | The Road Canyon Resource was last done in December 31, 2005 only used data within an ore zone wireframe at a $550 gold price; a 17.5 ft3/ton tonnage factor was used to reflect the unconsolidated colluvial host; a 100 ft. range was used for Indicated to the closest intercept in the wireframe, whereas a 101-150 ft range was used for Inferred; |
| | (4) | The Mill Creek Resource was run on a $550 optimized pit shell driven on Indicated blocks only; |
| (5) | The Burns Basin Pit was run at $450 optimized pit shell in December 2004 and reanalyzed for the December 31, 2005 Technical Report; our review of the block model decreased the 2008 SRK resource as part of this study; |
| | (6) | The California Mountain resource was run using a US$450 LG pit ; and |
| (7) | The Coyote Zone 10 resource was run using a US$425 LG pit and a cutoff grade of 0.075 opt Au; our review of this block model and resource decreased the 2008 SRK resource as part of this study. |
Table 12: Jerritt Canyon Inferred Open-Pit Mineral Resources – January 1, 2011 Reassessment
Mine | Au Cutoff Grade
(opt) | Inferred |
| kt | Opt | koz Au |
| Burns Basin Pit | 0.069 | - | - | - |
| Calif. Mtn. Pit (NEXT) | 0.068 | - | - | - |
| Coyote Zone 10 Pit(3) | 0.075 | 14.4 | 0.109 | 1.6 |
| Pie Creek Pit | 0.086 | 28.3 | 0.142 | 4.0 |
| Road Canyon Pit | 0.086 | 74.3 | 0.131 | 9.7 |
| Mill Creek Pit | 0.075 | - | - | - |
| Total | | 117.0 | 0.131 | 15.3 |
| Notes: | (1) | Data from SRK (2008) and verified by the present authors; |
| | (2) | Data from the present authors based on review of the old SRK (2008) models in Vulcan; |
| | (3) | Data revised from the SRK 2008 Technical Report based on the present study. |
Figures 20 through 25 are plan maps of the SRK 2008 open pit resources at Burns Basin, California Mountain, Coyote Zone 10, Pie Creek, Road Canyon, and Mill Creek that were brought into Vulcan and either verified or revised based on a critical review by the present authors. The Burns Basin and Coyote Zone 10 open pit resources were slightly decreased as a result of our critical review and are listed in Tables 11 and 12. All figures below are in Jerritt Grid. Sections have elevation (in feet) on the left hand margin.
67
Figure 20: Plan View of Burns Basin $450 Resource Pit and Blocks with Grade Above 0.069 opt
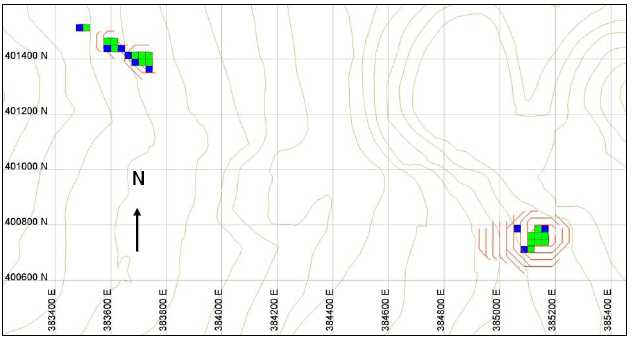
Figure 21: Plan View of California Mountain $450 Resource Pit and Blocks with Grade Above 0.068 opt
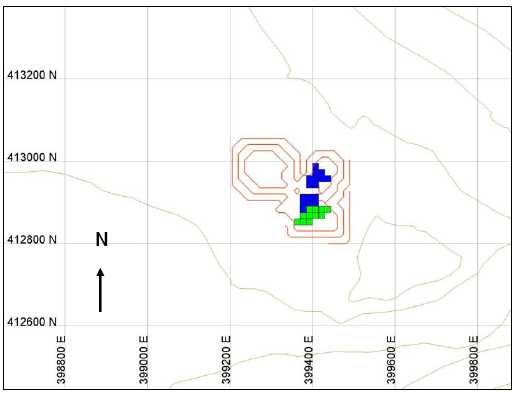
68
Figure 22: Plan View of Coyote Zone 10 $425 Resource Pit and Blocks with Grade > 0.075 opt
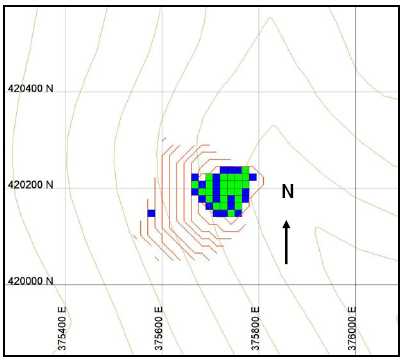
Figure 23: Plan View of Pie Creek $550 Resource Pit and Blocks with Grade Above 0.086 opt
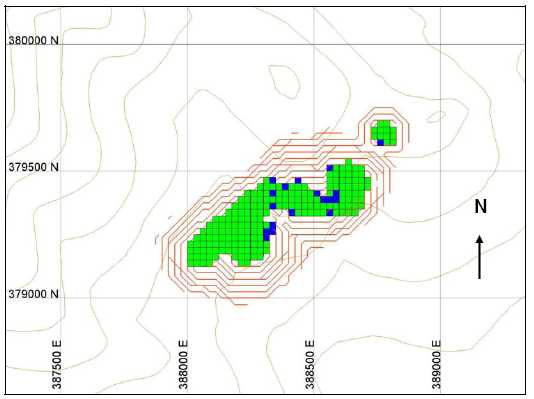
69
Figure 24: Plan View of Road Canyon $550 Resource Pit and Blocks with Grade > 0.086 opt
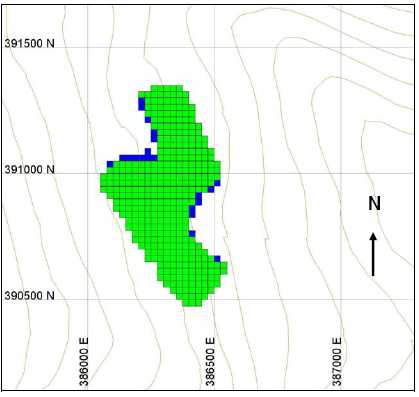
Figure 25: Plan View of Mill Creek $550 Resource Pit and Blocks with Grade Above 0.075 opt

70
Table 13: Jerritt Canyon Measured and Indicated Underground Mineral Resources, Including Reserves – January 1, 2011 Reassessment
Mine | Au
Cutoff
Grade
(opt) | Measured | Indicated | Measured + Indicated |
kt |
opt | koz
Au |
kt |
opt | koz
Au |
kt |
opt | koz
Au |
| Burns Basin(2) | 0.150 | - | - | - | 25.1 | 0.194 | 4.8 | 25.1 | 0.194 | 4.8 |
| Calif. Mtn.(1) | 0.150 | - | - | - | 32.1 | 0.377 | 12.1 | 32.1 | 0.377 | 12.1 |
| Coyote Zone 10(2) | 0.150 | - | - | - | 33.3 | 0.208 | 6.9 | 33.3 | 0.208 | 6.9 |
| MCE(1) | 0.150 | - | - | - | 4.4 | 0.201 | 0.9 | 4.4 | 0.201 | 0.9 |
| Murray(2) | 0.150 | 125.6 | 0.377 | 47.4 | 10.1 | 0.302 | 3.0 | 135.7 | 0.372 | 50.4 |
| Murray Zone 9(1) | 0.125 | - | - | - | 210.9 | 0.277 | 58.5 | 210.9 | 0.277 | 58.5 |
| Total | | 125.6 | 0.377 | 47.4 | 315.9 | 0.273 | 86.2 | 441.5 | 0.303 | 133.6 |
| Notes: | (1) | Data from SRK (2008) and verified by the present authors; |
| | (2) | Data from the present authors based on review of the old SRK (2008) models in Vulcan; The Burns Basin, |
| | | Murray (Mine), and Coyote Zone 10 underground resources were modified based on the current review; |
| | (3) | The Waterpipe II and Winters Creek underground resources included in the SRK 2008 Technical Report could |
| | | not be verified for this study and were therefore deleted from theses underground resources. |
Table 14: Jerritt Canyon Inferred Underground Mineral Resources – January 1, 2011 Reassessment
Mine | Au Cutoff Grade
(opt) | Inferred |
| kt | opt | kozAu |
| Burns Basin(2) | 0.150 | 6.9 | 0.176 | 1.2 |
| Calif. Mtn.(1) | 0.150 | 9.4 | 0.330 | 3.1 |
| Coyote Zone 10(2) | 0.150 | 1.6 | 0.171 | 0.3 |
| MCE(1) | 0.150 | 7.8 | 0.189 | 1.5 |
| Murray(2) | 0.150 | 0 | 0 | 0 |
| Murray Zone 9(1) | 0.125 | 61.6 | 0.209 | 12.9 |
| Total | | 87.3 | 0.218 | 19.0 |
| Notes: | (1) | Data from SRK (2008) and verified by the present authors; |
| (2) | Data from the present authors based on review of the old SRK (2008) models in Vulcan; The Burns Basin, Murray (Mine), and Coyote Zone 10 underground resources were modified based on the current review; |
| (3) | The Waterpipe II, Winters Creek, and Murray (inferred) underground resources from the SRK 2008 Technical Report could not be verified for this study and were therefore deleted from these underground resources. |
Figures 26 through 34 are plan maps or cross-sections of the SRK 2008 underground resources at Burns Basin, California Mountain, Coyote Zone 10, MCE, Murray (Mine), and Murray Zone 9 that were brought into Vulcan and either verified or revised based on a critical review by the present authors. The Burns Basin, Coyote Zone 10, and Murray (Mine) underground resources were slightly decreased as a result of our critical review and are listed in Tables 13 and 14. The 2007 Murray resource was revised based on the current author’s review of the 2007 block model and tabulating measured + indicated blocks >0.15 opt Au outside of the asbuilts but inside the restricted gradeshell domains. All blocks >0.15 opt located below the 6,100 foot elevation groundwater table were excluded from the resource. No inferred blocks were included in the revised Murray resource based on the author’s review of previous work.
71
Figure 26: Plan View of Burns Basin UG Resource Blocks with Grade Above 0.15 opt
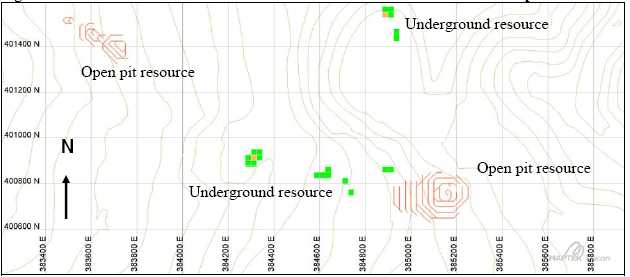
Figure 27: Plan View of California Mountain UG Resource Blocks with Grade Above 0.15 opt

72
Figure 28: Plan View of Coyote Zone UG Resource Blocks with Grade Above 0.15 opt
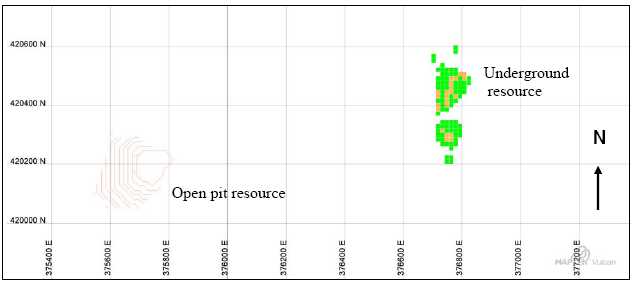
Figure 29: Plan View of MCE UG Resource Blocks with Grade Above 0.15 opt
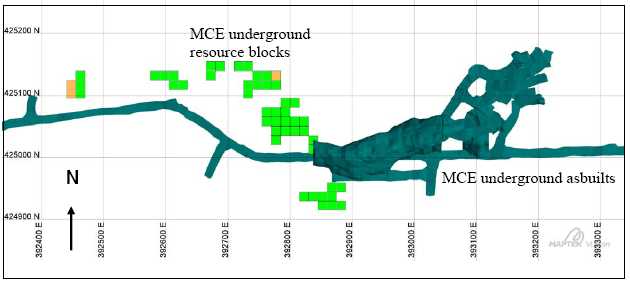
73
Figure 30: Section Looking North at MCE UG Resource: Blocks with Grade Above 0.15 opt

Figure 31: Murray UG Mine Plan Map (6182.5 Elev.) with Resource Blocks > 0.15 opt
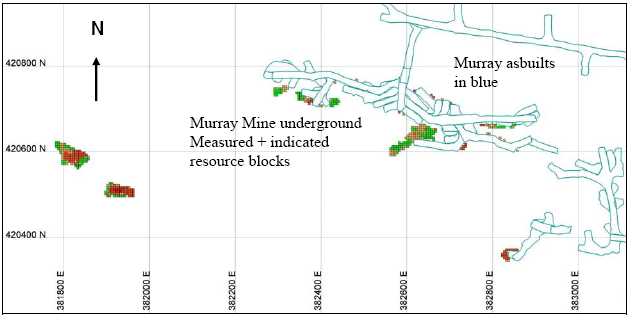
74
Figure 32: Section 420750N of Murray UG Mine with Resource Blocks > 0.15 opt

Notes: | Only Measured + Indicated blocks above 0.15 opt Au above the 6,100 ft. elevation are included in the stated Murray Resource (see text) |
Figure 33: Plan View of Murray Zone 9 UG Resource Blocks with Grade Above 0.15 opt
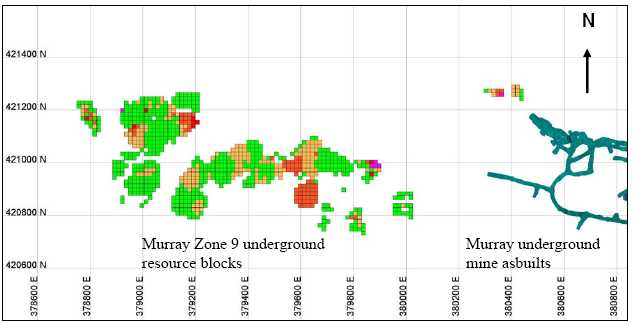
75
Figure 34: Section Looking North at Murray Zone 9 UG Resource Blocks with Grade > 0.15 opt
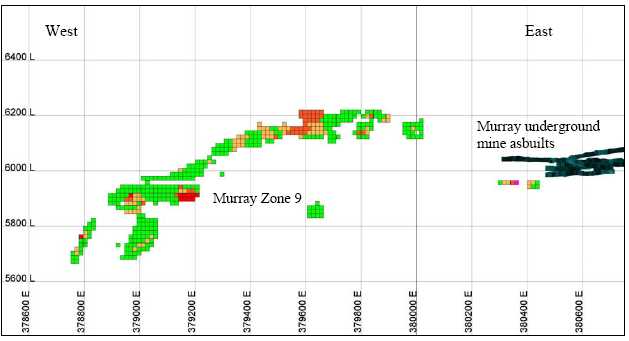
Total Mineral resources for the January 1, 2011 and open pit and underground are listed in Table 15. The Measured resources total 4,549.9 ktons averaging 0.236 opt Au containing 1,073.1 koz. The total Indicated resources are 6,459.5 ktons averaging 0.203 opt Au containing 1,316.8 koz. The total Measured and Indicated resources are 11,009.4 ktons averaging 0.217 opt Au containing 2,389.9 koz. The total Inferred underground resources are 3,872.6 ktons averaging 0.194 opt Au containing 751.3 koz.
Table 15: Jerritt Canyon Mineral Resources, Including Reserves – January 1, 2011
| Mine | Measured | Indicated | Measured + Indicated | Inferred |
| kt | opt | koz Au | kt | opt | koz Au | kt | opt | koz Au | kt | opt | koz
Au |
| Underground | | | | | | | | | | | | |
| SMITH | 1,979.7 | 0.237 | 469.2 | 2,062.4 | 0.233 | 480.8 | 4,042.1 | 0.235 | 950.0 | 971.8 | 0.197 | 191.8 |
| SSX-STEER | 2,352.5 | 0.227 | 532.9 | 1,569.8 | 0.221 | 347.2 | 3,922.3 | 0.224 | 880.1 | 344.7 | 0.191 | 65.9 |
| SAVAL | 86.2 | 0.250 | 21.5 | 344.9 | 0.223 | 76.9 | 431.1 | 0.228 | 98.4 | 78.5 | 0.185 | 14.5 |
| STARV | 5.5 | 0.365 | 2.0 | 496.9 | 0.284 | 141.1 | 502.4 | 0.285 | 143.1 | 256.3 | 0.276 | 70.7 |
| Subtotal | 4,423.9 | 0.232 | 1,025.6 | 4,474.0 | 0.234 | 1,046.0 | 8,897.9 | 0.233 | 2,071.6 | 1,651.3 | 0.208 | 342.9 |
| Open Pit | | | | | | | | | | | | |
| WRIGHTWINDOW PIT | - | - | - | 100.4 | 0.131 | 13.1 | 100.4 | 0.131 | 13.1 | 84.6 | 0.083 | 7.0 |
| Subtotal | - | - | - | 100.4 | 0.131 | 13.1 | 100.4 | 0.131 | 13.1 | 84.6 | 0.083 | 7.0 |
| Open PitResources | | | | | | | | | | | | |
| Burns Basin Pit | - | - | - | 29.7 | 0.134 | 4.0 | 29.7 | 0.134 | 4.0 | - | - | - |
| Calif. Mtn. Pit | - | - | - | 8.0 | 0.115 | 0.9 | 8.0 | 0.115 | 0.9 | - | - | - |
| Coyote Zone 10 | - | - | - | - | - | - | - | - | - | 14.4 | 0.109 | 1.6 |
| Mill Creek Pit | - | - | - | 78.4 | 0.124 | 9.7 | 78.4 | 0.124 | 9.7 | - | - | - |
| Pie Creek Pit | - | - | - | 190.2 | 0.157 | 29.9 | 190.2 | 0.157 | 29.9 | 28.3 | 0.142 | 4.0 |
| Road Cyn OP | - | - | - | 148.6 | 0.143 | 21.2 | 148.6 | 0.143 | 21.2 | 74.3 | 0.131 | 9.7 |
| Subtotal | - | - | - | 454.9 | 0.144 | 65.7 | 454.9 | 0.144 | 65.7 | 117.0 | 0.131 | 15.3 |
76
Mine | Measured | Indicated | Measured + Indicated | Inferred |
kt |
opt |
koz Au |
kt |
opt |
koz Au |
kt |
opt |
koz Au |
kt |
opt | koz
Au |
Underground
Resources
| | | | | | | | | | | | |
| Burns Basin | - | - | - | 25.1 | 0.194 | 4.8 | 25.1 | 0.194 | 4.8 | 6.9 | 0.176 | 1.2 |
| Calif. Mtn. | - | - | - | 32.1 | 0.377 | 12.1 | 32.1 | 0.377 | 12.1 | 9.4 | 0.330 | 3.1 |
| Coyote Zone 10 | - | - | - | 33.3 | 0.208 | 6.9 | 33.3 | 0.208 | 6.9 | 1.6 | 0.171 | 0.3 |
| MCE | - | - | - | 4.4 | 0.201 | 0.9 | 4.4 | 0.201 | 0.9 | 7.8 | 0.189 | 1.5 |
| Murray | 125.6 | 0.377 | 47.4 | 10.1 | 0.302 | 3.0 | 135.7 | 0.372 | 50.4 | - | - | - |
| Murray Zone 9 | - | - | - | 210.9 | 0.277 | 58.5 | 210.9 | 0.277 | 58.5 | 61.6 | 0.209 | 12.9 |
| West Mahala | 0.4 | 0.199 | 0.1 | 212.1 | 0.188 | 39.9 | 212.5 | 0.188 | 40.0 | 1,932.4 | 0.190 | 367.1 |
| Subtotal | 126.0 | 0.377 | 47.5 | 528.0 | 0.239 | 126.1 | 654.0 | 0.265 | 173.6 | 2,019.7 | 0.191 | 386.1 |
| | | | | | | | | | | | | |
| Stockpiles | - | - | - | 902.2 | 0.073 | 65.9 | 902.2 | 0.073 | 65.9 | - | - | - |
| | | | | | | | | | | | | |
| Total | 4,549.9 | 0.236 | 1,073.1 | 6,459.5 | 0.204 | 1,316.8 | 11,009.4 | 0.217 | 2,389.9 | 3,872.6 | 0.194 | 751.3 |
| Notes: | (1) | The January 1, 2011 underground mineral resources (in bold) are presented using a 0.125 opt Au cutoff grade and the Wright Window open pit resource used a 0.042 opt Au cutoff grade; a US$1,150/oz gold price was used for all revised resources; the January 1, 2011 underground resources revised for this study were only tabulated if they were within 750 feet of existing or designed workings and contained more than 1000 tons; the reviewed December 31, 2007 mineral resources used a 0.150 opt Au cutoff grade for undeveloped resources and a 0.125 opt Au cutoff grade for a more mature underground resource as calculated by SRK (2008); the SRK 2008 open pit resources were calculated using a gold price of US$450 or $550 and variable cutoff grades from 0.068 opt to 0.086 opt Au (see text); |
| (2) | The Wright Window resource was revised using the Year-End 2008 block model and the January 1, 2011 classification system; |
| (3) | Coyote Zone 10 OP and UG, Burns Basin UG, and Murray UG resources were revised for this study by the authors of the Jerritt Canyon Report using the old block models and related project data; |
| (4) | The January 1, 2011 stockpile resource is classified as indicated and reconciled to that published in the Year-End 2007 NI 43-101 report; |
| | (5) | Mineral resources that are not mineral reserves do not have demonstrated economic viability; |
| | (6) | UG = underground; OP = open pit. |
A comparison of the January 1, 2011 Resources compared to the previous December 31, 2007 Resource Statement by SRK (2008) shows the following:
| 1. | The Measured resources have increased by 73% (on a tonnage basis) or by 1,923.9 kt and 367.0 koz; |
| | |
| 2. | The Indicated resources have increased by 16% (on a tonnage basis) or by 888.6 kt and 61.8 koz; |
| | |
| 3. | The Inferred resources have increased by 67% (on a tonnage basis) or by 1,552.9 kt and 230.9 koz; |
| | |
| 4. | The indicated Jerritt stockpile resource (remote + mill) has increased by 10.3% (on a tonnage basis) or by 83.9 kt and 17.8 koz based on additional stockpile materials being discovered and/or mined in 2010 (including 2010 mining depletion), and also due to a lower economic cutoff grade when calculated using a $1,150 per ounce gold price; and |
| | |
| 5. | The measured Jerritt stockpile (remote + mill) has decreased 100% to 0 kt as a result of reclassification of the stockpile ores as all indicated, and because of mining from 2008 to 2010. |
77
The authors of the report were not aware of any possible adverse or unusual restrictions on mining resulting from legal or title issues, taxation, socio-economic, environmental, political, or others that would affect the Jerritt Canyon operation. The mine has the permits necessary for operation.
Mining Operations
Jerritt Canyon is an operating property with over 20 years of production experience, during which approximately 7.8 million ounces of gold have been produced up to year-end 2010. The Jerritt Canyon mine complex currently consists of one operating underground mine (Smith) located several miles southwest of the processing plant and administration facilities which are 50 miles north of Elko, Nevada (Figures 1 and 3). A second mine, the SSX-Steer complex, is planned to recommence mining in the third quarter of 2011. A third mine, Murray, was closed during 2006.
Recent operating results, including production costs, of the Jerritt Canyon mines are presented in this section. In addition, geotechnical parameters, mining fleets, ore control are presented in this section. Stockpile resources and reserves and reconciliation are also presented in this section.
All mines feed the same processing plant, with output from the underground operations and other sources (e.g. remote and mill Jerritt stockpiles) totaling nearly 0.22 million tons during 2008 and 0.41 million tons in 2010. The producing properties at Jerritt Canyon excluding third party purchased ores (e.g. Newmont), and their annual production rates for years 2008 to 2010, are given in Table 16 and represent ore materials processed through the mill.
Table 16: Jerritt Canyon 2008-2010 Production with 2011 Forecast Production
| Property | Annual Production (tons) | |
| Year | 2008 | 2009 | 2010 | 2011 Forecast |
| SSX Complex | 97,239 (1) | 0 | 0 | 113,975 |
| Smith | 38,670 (1) | 0 | 176,409 (2) | 405,539 |
| Stockpiles (4) | 88,709 (5) | UNK | 233,731 (3) | 295,000 |
| Total | 224,618 | UNK | 410,140 | 814,514 |
| Notes: | (1) | Tonnages based on internal mine records; |
| (2) | Dry tonnage processed through the mill; based on 5% moisture content of wet ton delivery published by YNG in the March 31, 2011 MD&A (2011); |
| | (3) | Remote stockpile tonnage processed through the mill based on internal mine records; |
| (4) | Stockpile data only includes those from Jerritt Canyon (mill and remote combined) and excludes Newmont and other third party purchased ores; |
| (5) | A total of 32,793 tons of remote stockpile and 55,916 tons of mill stockpile were processed in 2008; it is assumed that all of the mine=d Smith and SSX Complex ores mined in 2008 were processed in the same year; and |
| (6) | No underground mining occurred at Jerritt in 2009; in addition, no remote stockpile material was delivered to the mill; however, mill production records were not well documented by the contract mill operator at the time so the amount of Jerritt Stockpile ore material fed to the mill in 2009 is unknown (UNK); however a total of 9,770 ounces of Au were produced in 2009 according to YNG (March 31, 2011 MD&A (2011). |
| | (7) | Budgeted 2011 production includes actual data from January to May 2011 |
The full processing plant has the capability of treating approximately 6,000 tons/day (125 tph for each roaster). The historical processing capacity rate of 4,320 tpd (90tph for each roaster) was quite attainable when the feed derived mainly from open pit operations, but has been a significant surplus when accepting material from the underground mines simply because the total mine output cannot attain this daily rate. In mid-2007 Queenstake amended an agreement with Newmont Mining Corporation to purchase material delivered to Jerritt Canyon by Newmont, which would supplement mined ores feeding the roasters and thereby reduce certain unit operating costs.
78
Newmont ores continued to be purchased by Queenstake in 2008. Additional ore purchasing contracts with Newmont were made in 2010 (all contracts expired at the end of 2011); a total of 86,257 wet tons of ore containing 16,905 ounces of Au were purchased from Newmont (all in Quarter 4) and delivered to the mill in 2010. During 2008 and 2010, Queenstake processed 113,732 and 189,415 tons, respectively, of Newmont material. The Newmont stockpile ores processed in 2010 included material delivered to the mine prior to 2010. The amount of Newmont ores processed in 2009 is unknown due to poor record keeping by the contract mill operator.
The plant processed a total of 338,350 tons in 2008 and only operated for 159 days that year due to the significant amount of down time. The plant therefore processed an average of 2,128 tons/day in 2008. Plant capacity is limited to some extent by the “fuel content” of the ore (principally contained pyrite) which tends to enhance temperatures in the roaster and so must be regulated carefully when this type of rock serves as feedstock. Blending of various mined products is practiced constantly to reduce deleterious impacts from rock types with high fuel content, high arsenic content, and so forth. Also the capacity was somewhat limited because of air permit requirements at that time. Gold produced in 2008 from all sources was 44,732 ounces from 338,350 tons of processed ore and purchased material at a metallurgical recovery that averaged 87.3% .
The Smith and SSX-Steer underground mines reported production of 135,909 tons of ore, along with 136,070 waste tons in 2008. This tonnage figure was significantly less than the 2008 budgeted amount of nearly 336,641 ore tons at a projected mined grade of 0.284 ounces/ton which can be mostly attributed to the August 2008 mine shutdown and other mill shutdowns in early 2008. In 2008 a total of 88,709 tons of Jerritt Canyon stockpile (remote + mill) was processed through the mill. Of this total, 32,793 tons of remote stockpile material containing an average grade of 0.170 opt Au was delivered to the mill and processed. In addition, a total of 55,916 tons of mill stockpile at a grade of 0.141 opt Au was processed in 2008.
Due to poor record keeping in 2009 by the contract mill operator, Golden Eagle, the total amount of ore tons processed in 2009 was not recorded by YNG but they reportedly produced 9,770 ounces of Au for the year. All ore materials processed in 2009 were not separated by source and were a mixture of Newmont, Hollister, and Jerritt stockpile materials located at the mill. It is assumed that no remote Jerritt Canyon stockpile materials were hauled to the mill in 2009. The mill only operated for 130 days in 2009 as a result of several “stop” orders received from the NDEP.
The plant processed a total of 599,555 tons in 2010 and operated for 322 total days to achieve an average processing rate of 1,862 tons/day for the year. Gold produced in 2010 from all sources was 65,104 ounces (recovered) from 599,555 tons of processed ore and purchased material at a metallurgical recovery that averaged 88.2% . The Smith underground mine reported production of 207,535 wet tons of ore containing 45,302 ounces of Au (Yukon-Nevada Gold Corp, 2011), along with 186,650 waste tons in 2010. The daily ore production rate from the Smith Mine in the third quarter of 2010 reached the target of 1,000 ore tons. A total of 233,731 tons of Jerritt stockpile material containing 14,122 oz of Au was processed through the mill in 2010.
Underground Mining Methods
Current underground mining methods at Smith and SSX are typically sublevel or drift-and-fill stoping above the ground water table which is approximately at 6,600 feet above mean sea level. No open pit mining, other than for stockpiled low-grade ores from previous mine operations, is currently being conducted at Jerritt Canyon.
Any underground mining dilution occurs at the fringes of the ore pods or lenses. Within the pods, slices or drifts are extracted and then backfilled with cemented waste material. When the backfill has consolidated, the ore between the primary stopes or drifts is then extracted. In the primary cuts, the interior stope boundaries are surrounded by ore, so little dilution results. Within the secondary cuts, the walls and/or back are cemented backfill, which has less jointing than the ore or enclosing rocks, and thus little dilution takes place. It is primarily on the fringes of the individual ore bodies that dilution occurs, with the amount also being dependent upon the mining method. Historically dilution at Jerritt Canyon has averaged 10% or less for all mines and mining methods. All dilution material is applied at zero ounces per ton.
79
Table 17 presents historical and projected dilution factors for the underground operations. Wright Window will be a surface mine, and dilution should be minimal because of the ability to selectively mine based on blast hole analyses. Backfilled stopes can stand over substantial vertical heights. This situation allows the operation to recover nearly all the identified ore-grade material.
Table 17: Jerritt Canyon Dilution Factors
| Mine | Mining Method |
Rock
Drift-and-Fill | Secondary Stope
Drift-and-Fill | Sublevel
Stoping |
| SSX Complex | 10 | 10 | 10 |
| Starvation Canyon | 10 | 10 | 10 |
| Smith | 10 | 10 | 10 |
| Saval | 10 | 10 | 10 |
Processing Facilities, Operating Parameters, and Process Flow Sheet
The unit operations at the Jerritt Canyon processing plant are comprised of the following circuits:
- Primary crushing;
- Secondary crushing;
- Fine ore drying;
- Tertiary crushing;
- Dry grinding;
- Roasting;
- Carbon-in-leach (“CIL”) with cyanidation and carbon adsorption;
- Carbon stripping;
- Carbon reactivation;
- Merrill-Crowe process using zinc cementation of gold and silver;
- Precipitate refining;
- Oxygen plant;
- Water evaporation pond; and
- Tailing impoundment.
A simplified flow sheet of the mineral processing operation is shown in Figure 35. Table 18 summarizes the operating parameters for the processing plant.
Table 18: Operating Parameters for the Jerritt Canyon Processing Plant
| Operating Parameter | Units | Value |
| Processing Capacity Rate | tons/Year(1) | 1,576,800 |
| Processing Capacity Rate | tons/Day | 4,320 |
| Ore Grade(2) | oz Au/ton | 0.167 |
| Gold Recovery | % | 89.0 |
| Operating Cost(3) | $/ton Processed | 32.00 |
| (1) | Tons/year reflect ore from Jerritt Canyon and purchased ore. |
| (2) | Ore grade is the forecasted grade of Jerritt Canyon ore for 2011. |
| (3) | $32.00 for 2011 |
80
Figure 35: Simplified Ore Processing Flowsheet for the Jerritt Canyon Mine
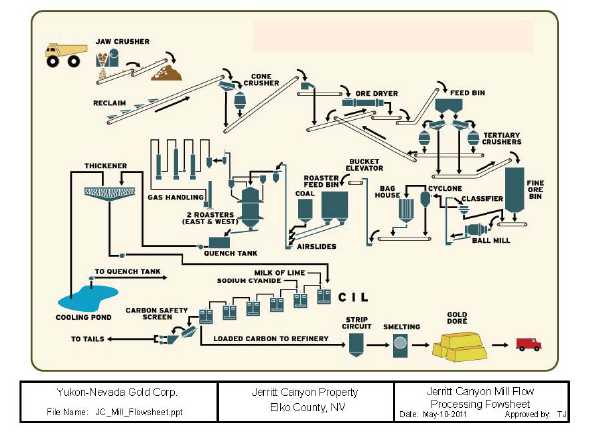
As part of the Consent Decree Agreement noted in under the heading “History”, the Jerritt Canyon processing plant is currently under a production restriction of 180tph through its two roasters. Stack tests are being done on a periodic basis to make sure that Queenstake adheres to the emissions thresholds listed in the Consent Decree or agreed to with the NDEP.
Recoverability
Gold recovery in 2008 to 2010 is shown below in Table 19 and was recorded by month. For 2010 the gold recovery averaged 88.2% of contained metal delivered to the process plant.
Table 19: Jerritt Canyon 2008-2010 Gold Recovery by Month
Month Year | Gold Recovery |
| 2008 | 2009 | 2010 |
| January | 83.3 | n/a | 87.3 |
| February | 85.8 | n/a | 83.9 |
| March | n/a | n/a | 89.6 |
| April | 75.2 | 82.5 | 89.4 |
| May | 83.7 | 89.9 | 87.5 |
| June | 87.6 | n/a | 87.6 |
| July | 87.9 | n/a | 89.9 |
| August | 86.8 | n/a | 89.7 |
| September | n/a | n/a | 87.7 |
81
Month Year | Gold Recovery |
| 2008 | 2009 | 2010 |
| October | n/a | n/a | 87.5 |
| November | n/a | 85.2 | 86.6 |
| December | n/a | 87.7 | 87.4 |
| Average | 87.3 | 86.3 | 88.2* |
Note:The average gold recovery value for 2009 is arithmetic whereas the 2008 and 2010 averages are weighted averages
The Au recovery for 2010 and 2007 was the same at 88.2 percent. The lower Au recoveries attained in 2008 and 2009 are likely a result of the significant down time for the mill and not being able to maintain steady state production. The Au recovery forecast for 2011 is at 89.0 percent because data suggest better recovery when processing Newmont rock. The authors of the Jerritt Canyon Report consider these figures acceptable, given the deposit characteristics and the method of extraction.
Historic Processing Plan Production and Cost Data
Table 20 contains historic production and cost data for the Jerritt Canyon processing plant as well as the budgeted figures for 2011. The Jerritt Canyon process plant operated at only 64% of its design capacity in 2007 due to bull gear problems with the grinding mill. The bull gear was replaced in second quarter 2006. The mine shutdown in August 2008 significantly impacted total mill production figures for 2008 and 2009. In addition unaccounted and “lost” ounces in 2009 and 2010, respectively, along with unexpected NDEP charges increased the processing costs and total costs for these years.
In March 2006, an agreement was reached between Queenstake and Newmont USA Limited (Newmont) whereby a minimum of 500,000 tons of ore per year from Newmont operations would be purchased by Queenstake and processed through the Jerritt Canyon processing plant. This agreement was in effect for two years (2006 and 2007) with an option for three additional years (2008-2010). New agreements were made with Newmont on October 25, 2010 that called for the delivery of 2,000 ore tons/day until December 31, 2010. A subsequent agreement with Newmont signed in April 2011, allows deliveries of Newmont ore to continue until December 31, 2011 with no specified quantities dictated in this agreement. Queenstake understands that Newmont has abundant ore available to purchase and process through the Jerritt Canyon mill facility; representatives from both companies are in communications with each other with respect to this issue. These additional tons from Newmont, in combination with ore materials from Jerritt and other possible sources, will bring the processing plant to full capacity and will have a significant impact in reducing the process operating costs per ton of ore which is reflected in Table 20.
Table 20: Jerritt Canyon Historic and Budgeted Process Production and Cost Data
Operating Data |
Units | Actual | Actual | Actual | Actual | Actual | Budget |
| 2006 | 2007 | 2008 | 2009 | 2010 | 2011 |
| Production Data | | | | | | | |
| Tons Processed: | | | | | | | |
| Annual(1) | 000’s tons | 974 | 900 | 338 | UNK | 600 | 979 |
| Daily Average | Tons | 2,667 | 2,466 | 2,128(1) | UNK | 1,862(1) | 2,500(2)(6) |
| Ore Grade | oz Au/ton | 0.211 | 0.217 | 0.160 | UNK | 0.123 | 0.157 |
| Recovery | % | 86.2 | 87.0 | 87.3 | 86.3 | 88.2 | 89.0 |
| Gold Production(3) | 000’s oz | 170 | 170 | 45 | 10 | 65 | 140 |
| Cost Data | | | | | | | |
| Annual Total Cost(4) | $000’s | 29,602 | 29,217 | 17,508 | 10,437 | 22,150 | 38,888(8) |
82
Operating Data |
Units | Actual | Actual | Actual | Actual | Actual | Budget |
| 2006 | 2007 | 2008 | 2009 | 2010 | 2011 |
| Unit Processing Costs: |
| Ore | $/ton Milled | 30.41 | 27.78 | 51.75 | UNK | 36.94(5) | 39.72(6)/32.00 |
| Gold | $/oz Au | 157.25 | 146.98 | 391.68 | 1,068.30(7) | 340.23(5) | 277.77 |
| Notes: | (1) | Includes actual tonnage (dry) for purchased ores in 2008 and 2010; the plant only operated for 159 days in 2008; |
| (2) | 2011 budget assumes two week down time in September for maintenance and mill upgrades; 2011 data includes actual tons, grade, and Au production from January to April; |
| | (3) | Includes purchased ores for actual 2006, 2007, 2008, 2010, and the first 4 months in 2011; |
| | (4) | Annual total cost excludes Newmont inventory cost; |
| (5) | Processing cost for 2010 is high due to the “loss” of approximately 2,700 oz Au in the process circuit and some large NDEP charges; |
| (6) | Delays in implementing the new mine plan for 2011 have resulted in reduced mill throughput for 2011 and therefore has resulted in increased unit processing costs; $32.00/ton Milled was the processing cost used for reserve determinations and was based on earlier years (with slight upward adjustments) when the mill was operating near steady state conditions; Mill production is expected to reach 4,000 tons per day by October 2011; |
| (7) | The unit processing cost is high due to poor record keeping of tons processed through the mill by the contract mill operator, because of low Au production for the year, and because the plant only operated for 139 days in 2009; |
| | (8) | The 2011 budgeted milling cost includes variable and fixed costs for the year |
The authors of the Jerritt Canyon Report consider the projected production and cost estimates achievable, especially with the expected startup of the SSX-Steer mine complex in the third quarter of 2011. The agreement with Newmont to purchase additional ore will help provide additional ore feed for the Jerritt Canyon mill on an as-needed basis.
Stockpiles
Stockpile materials are mined with 50- or 150-ton haul trucks and a front-end loader. Muck material to be mined has previously been assayed for grade control and is typically flagged in the field as ore or waste. Stockpile ore is delivered to the Rom whereas waste is delivered to a local waste dump.
The Jerritt Canyon mill (Rom) stockpile resources are physically surveyed on a monthly basis by the mine Engineering Department as part of the mine/mill reconciliation process. The remote stockpile resources were physically surveyed during the end of the fourth quarter of 2009 to establish a baseline for the purpose of reconciling to historic data. Since poor records of stockpile depletion were kept in 2008 and 2009, the Year-End 2009 remote stockpile surveyed inventory (900,530 tons averaging 0.069 opt Au containing 62,161 oz) was reconciled to balance to the Year-End 2007 stockpile resource (854.1 ktons averaging 0.064 opt Au) less the Year-End 2008 recorded depletion (see Tables 21 and 22 below). The primary reason for selecting the Year-End 2007 stockpile resource estimate for reconciliation purposes is that it represents the most recent data that had undergone some manner of independent audit (e.g. the NI 43-101 report by SRK Consulting published in 2008). The gold grade was calculated on a concurrent back-calculation on a weighted average basis. The Year-End 2010 depletions assumed the grade for each individual stockpile was delivered to the mill. The detailed reconciliation work (Hofer, 2011) is stored on the main computer server at the mine. Yearly depletion from remote stockpiles are done arithmetically.
A significant amount of Jerritt stockpile materials from the SC2 and SAL stockpiles, and all of the Murray SML stockpile that were mined in 2010 were not included in the resources or reserves identified in the December 31, 2007 NI 43-101 report or the physical year-end 2009 stockpile survey. It is believed that poor record keeping is to blame for not identifying these (low grade) ore stockpiles in prior in-house mine and published resource and reserve documents. The methodology used to characterize the quantity and gold grade of the added Murray SML stockpile
83
to the January 1, 2011 stockpile resource and reserve will be detailed below; the same methodology was used for the SC2 and SAL stockpiles. One existing Jerritt Canyon staff member remembers hauling ore to the SML stockpile in previous years and he indicates that the muck ore was from some portion of the Murray underground development.
The Murray SML stockpile was physically surveyed by Jerritt Canyon staff with the following dimensions: 510 ft. in length by 210 ft. in width by 40 ft. in height. Four trenches at approximately 100 to 150 ft. in length were excavated across the width of the SML stockpile on approximately 100 ft. spacings. Each trench was approximately 8 to 10 ft. in depth. Muck or stockpile sampling was conducted along the length of the trenches along 10 ft. intervals (data at the Jerritt Canyon site). Approximately 50 samples comprised the SML stockpile trenching and characterization program. Assaying of samples was done at the Jerritt Canyon mine lab. Trenching and sampling on the SML stockpile were conducted in September, 2010. From the physical stockpile survey a volume for the stockpile was established. A density factor (0.0568 tons/ft3) was applied to establish the tonnage estimate. The tonnage estimate was cut 50 percent due to potential engineering constraints on removing the entire stockpile. The gold grade for this tonnage was established as a straight arithmetic average of all of the samples. During October and November, 2010 approximately 8,730 tons of the Murray SML remote stockpile were transported to the ROM and processed. This material may be thought of as a bulk sample. Periodic dig face muck sampling was done during the excavation and loading of haul trucks as a check to ensure grade (i.e. grade control). Transport was done utilizing 50-ton haul trucks. Each truck was muck sampled upon delivery to the ROM pad by the mill. The ROM muck samples were used to establish the mine head grade being fed to the mill and the subsequent mine/mill reconciliation. Validation of the reconciled grade was based on the correlation of the Smith Mine block model and the reconciled Smith Mine head grade for ores processed at that time. Since the Smith Mine block model is performing well to predict estimated mined tons and grade based on asbuilt shape survey drawings, all reconciled grades are considered valid. The reconciled Murray SML stockpile grade agrees well with the resource grade assigned to the stockpile from the trench sampling (0.077 opt Au).
For the SC2 and SAL stockpiles, three initial trenches approximately 50 to 70 ft. in length were excavated, sampled, and assayed at the Jerrritt Canyon lab. Dig face sampling was conducted for each 10 ft. of advance on the dig faces. Haulage of the stockpile materials was conducted with 50-ton haul trucks. Each truck was muck sampled upon delivery to the ROM. Grade reconciliation and confirmation for these stockpiles were by the same process as described above.
As a result of the “exploration and mining” gains achieved in 2010 (Table 21) the net change to the remote stockpile inventory (Year-End 2009 to Year-End 2010) was -68,720 tons.
Table 21: Jerritt Canyon 2008-2010 Remote Stockpile Depletions and/or Additions
| | Annual Production |
| Year | Year-End 2008 | Year-End 2010 | Year-End 2010 |
| | Depletion(1) | Depletion(1) | Addition(2) |
| Tons | -32,793 | -226,370 | +157,650 |
| Grade (opt) | 0.149 | 0.052 | 0.068 |
| Ounces Au | 4,900 | 11,804 | 10,678 |
| Notes: | (1) | Tonnages based on internal mine records; |
| (2) | Addition of stockpile resource and/or reserves in 2010 was the result of an “exploration gain” at the SML stockpile based on trenching, sampling, and surveying; and “mining gains” derived from the S2C and SAL stockpiles |
84
Table 22: Jerritt Canyon 2008-2010 Remote Stockpile Resource Reconciliations
| | Annual Inventory |
| Year | Year-End 2007 | Year-End 2008(3) | Year-End 2010 |
| Tons | 854,100(1) | 821,307 | 758,312 |
| Grade (opt) | 0.064 | 0.060 | 0.063 |
| Ounces Au | 54,300 | 49,400 | 47,807 |
| Notes | (1) | Measured + Indicated stockpile data from the SRK NI 43-101 report (2008); |
| | (2) | Tonnages based on internal mine records |
| (3) | Year End 2008 data based on reconciliation to the Year-end 2007 remote stockpile resources minus 2008 depletion |
The year-end 2010 surveyed mill stockpile resource of 143,855 tons averaging 0.125 opt Au containing 18,021 oz was added to the Year-End 2010 remote stockpile resource to arrive at the total January 1, 2011 remote + mill stockpile resource of 902,167 tons averaging 0.073 opt Au containing 65,888 oz Au. William Hofer, Jerritt Canyon Chief Geologist, performed this stockpile reconciliation (2011b) with the assistance of Queenstake Engineering and Geology staff personnel.
As of June 1, 2011, the defined Jerritt Canyon ore stockpiles currently represent enough material for approximately 800 days of production at a 1,100 t/day mining and mill feed rate. All Jerritt stockpile material contains a gold grade above the cutoff grade off 0.44 opt Au and therefore has been included in the current reserve.
A significant mining gain of 19.3 koz for the January 1, 2011 Jerritt Canyon stockpile (65.9koz) relative to the December 31, 2007 stockpile reserve (46.6koz) is based primarily on a lower breakeven cutoff grade, a higher Au price ($1,100 US per oz), different mining parameters used in the current reserve work, and discovery of additional stockpile ores based on recent surface and trench sampling.
Contracts
Jerritt Canyon has a few operational contracts in place at the present time. Certain exploration drilling activities are under contract. In addition, as of November, 2009, Small Mine Development (SMD) is under contract to perform the mine development at the Smith Mine. The term of the contract is either until 250,000 troy ounces of Au are produced or until September 30, 2012, whichever comes first.
In March 2006, an agreement was reached between Queenstake and Newmont whereby a minimum of 500,000 tons of ore per year from Newmont operations will be purchased by Queenstake and processed through the Jerritt Canyon processing plant. This agreement was in effect for two years (2006 and 2007) with an option for three additional years (2008-2010).
New agreements were made with Newmont on October 25, 2010 that called for the delivery of 2,000 ore tons/day until December 31, 2010. A subsequent agreement with Newmont signed in April 2011, allows additional ore deliveries (at no specified quantities) of Newmont ore until December 31, 2011. Quantities of ore to be shipped are communicated between Queenstake and Newmont representatives on a daily basis and are variable. These additional tons will bring the processing plant to near full capacity and will have a significant impact in reducing the process operating costs per ton of ore which is reflected in Table 20.
An agreement was made with Rodeo Creek Gold Inc. in June 2007 and again in October 2009 for the delivery of Hollister mine ore (located in Elko County, Nevada) to the Jerritt Canyon processing facility. A disagreement occurred between the two parties regarding the validity of the contract and a settlement agreement was later signed in May 2010 that stipulated that Queenstake would process all of the remaining Hollister ore present at the Jerritt Canyon site no later than August 20, 2010 and payments would proceed according to the contract.
85
Financial Summary
Selected statistics from the reserves only life of mine plan economic analysis are listed in Table 23. All calculations use the 3 year trailing average market gold price of $1,100/ ounce. The payback period is also listed in Table 23 below.
Table 23: Key Financial Statistics
| Description | Value |
| Mine Life (years) | 3.6 |
| Cash Cost ($/oz) | $ 785 |
| Total Cost ($/oz.) | $ 990 |
| Gold Sales Price ($/oz.) | $ 1,100 |
| Payback Period (years) | 3.0 |
| Capital Cost ($ Millions) | $140.6 |
| Cash Flow ($ Millions) | $70.1 |
| 10% Discounted Cash Flow ($ Millions) | $42.2 |
| Internal Rate of Return | 36% |
Mine Life
The expected life of the Jerritt Canyon operation is 3.6 years to August 2014, based on exploration to date, the current processing rate, and reported proven and probable reserves as of January 1, 2011. The Company controls a large land position in the immediate area and it is expected that future exploration will continue to convert certain resources to a reserve category over time in order to extend the mine life beyond the LoM plan.
Taxation
Queenstake controls more than 119 square miles of ground encompassing the mine area proper and surrounding acreage. The bulk of this is in the form of contiguous unpatented mining claims which are held in force by production from the mining activities. No production royalties are paid for gold deriving from these claims.
Some property is leased from landowners in the region, and a royalty is paid on production from these lands. The royalty for mined material in 2010 was generally equal to a 5 percent net smelter return (NSR) which is dependent upon the Au sale price and the refining results.
Property taxes are assessed annually by Elko County on real estate and personal property controlled by Queenstake. Property taxes for the patented claims is expected to cost approximately $1,257. Additional property taxes paid in 2010 were for improvements, the roasters, the mill, and other property other than the patented claims and was approximately $400,000.
Nevada does not apply a corporate income tax Taxable income on the federal level is taxed at 38% after all deductions have been taken. Queenstake has tax losses carried forward in excess of expected future tax liabilities and no federal income tax is expected.
A sales tax rate of 6.85% is currently applied to all purchases within Elko County. The State Unemployment tax is 0.855% of wages and Federal unemployment tax is 0.8% of wages
Capital and Operating Cost Estimates
Jerritt Canyon is forecasting an expenditure of $140.6 million over the coming three-year period for mine-related capital items for the LoM plan. These include the categories of: equipment, underground development, and mine facilities.
86
The largest expenditure outlays will be for tailings impoundment at $39.1 million with an additional $29.7 million for mine development and $22.7 million for equipment. Sustaining capital costs for the ore processing plant is budgeted at $30.2 million for upgrades to existing facilities. Sustaining capital costs for General and Administrative (G&A) including environmental is budegeted at $6.5 million. A breakdown by property is given in Table 24.
Table 24: Jerritt Canyon Capital Expenditures for LoM ($000’s)
Cost Center | SSX
Complex |
Saval 4 |
Smith | Starvation
Canyon | Wright
Window |
Total |
| UG Mine Equip. | 13,459 | 0 | 0 | 9,250 | 0 | 22,709 |
| Mine Development | 17,003 | 4,723 | 0 | 8,004 | 0 | 29,730 |
| Mine Facilities | 0 | 300 | 1,500 | 3,460 | 300 | 5,560 |
| Process | | | | | | 30,187 |
| Surface Haulage Equipment | | | | | | 6,785 |
| Administration and Environmental | | | | | | 6,573 |
| Tailings Impoundment | | | | | | 39,078 |
| Total | $30,462 | $5,023 | $1,500 | $20,714 | $300 | $140,623 |
The operating costs per ton of ore for processing have steadily increased over the last 6 years from $15.67 in 2001 to $30.41 in 2007, primarily as a function of the production throughput and energy costs. Of this total, approximately 75% is for operations and 25% is for maintenance. With the planned increase in ore availability and process improvements it is estimated that the processing costs over the remaining mine life will be $32.00 ton.
The anticipated operating cost for the next 3.6 years is $111.13 per ton of ore as shown in Table 25. The lowest per-ton costs are associated with the stockpiles, since these sources do not bear future mining charges nor assigned royalty payments. Wright Window is a small area that will be surface mined, and so the unit costs are significantly less than for an underground operation.
The remaining sources of feed material derive from underground and have varying estimated costs depending largely on ground conditions, the need to backfill for support, and quantities of expensed waste mining. The highest-cost mining occurs in the Smith Mine. However, Smith mine does not incur any additional charges for capital development. Due to its remote location and high surface ore haulage costs the next highest cost mine is Starvation Canyon.
Table 25: Jerritt Canyon Operating Costs for LoM per Ton of Ore
Description |
Smith |
SSX |
Saval | Starvation
Canyon | Wright
Window | Surface
Stockpiles | LoM
Average |
| Mining | $ 99.19 | $ 41.17 | $ 49.69 | $ 41.39 | $ 2.75 | $ - | $53.93 |
| Backfill | - | 29.66 | 26.76 | 31.67 | - | - | 11.93 |
| Expensed Waste | - | 8.05 | 13.76 | 15.18 | 2.26 | - | 4.08 |
| Surface Hauling | - | 4.62 | 4.62 | 8.40 | 4.62 | 4.62 | 3.20 |
| Processing | 32.00 | 32.00 | 32.00 | 32.00 | 32.00 | 32.00 | 32.00 |
| Site Administration | 6.00 | 6.00 | 6.00 | 6.00 | 6.00 | 6.00 | 6.00 |
| Total | $ 137.19 | $ 121.39 | $ 132.84 | $ 134.64 | $ 47.33 | $ 42.62 | $111.13 |
87
LoM Plan and Economics
The LoM plan (Table 26), annual mine production schedule (Table 27), and annual cash-flow forecast and economics (Table 28) are based on the following assumptions and/or facts discussed in the previous sections of the Jerritt Canyon Report:
- Reserves of 4.366 million tons at an average grade of 0.164 oz-Au/ton, containing a total of 717 koz of gold;
- A mine life of 3.6 years from 4 underground and one open pit mines and various stockpiles, at a total average rate of 1,210 kt per year;
- An overall average metallurgical recovery rate of 89%, producing 660 koz of gold over the LoM;
- A cash operating cost of $785 Au-oz, or $115/ore-ton; and
- Total capital costs of $140.6 million being comprised of $29.5 million for mine equipment, $29.7 million for capitalized development, and $5.6 million for facilities, and sustaining capital of $36.8 million for process and administration, and $39.1 million tailing impoundment. These last items are estimations from Mark Odell, the Mining Engineer responsible for preparing the LoM Plan and Economical Analysis, and Shaun Heinrichs, the CFO for Yukon-Nevada Gold Corp.
The base case economic analysis results, shown in Table 26 indicate an after-tax net present value of $70.1 million at a 0% discount rate.
Table 26: Life of Mine Plan
| Description | LoM Value |
| Ore | |
| Ore Milled-(Jerritt Canyon) | 4,365kt |
| Gold Grade | 0.164opt |
| Contained Gold | 717koz |
| Process Recovery (average) | 89% |
| Recovered Gold | 638koz |
| Gross Income ($000’s) | |
| Market Price | $1,100/oz |
| Gold Sales | $701,962 |
| Net Income from Purchased Ores | - |
| Gross Revenue | $701,962 |
| Refining & Sales | ($638) |
| Net Smelter Return | $701,324 |
| Royalties | ($5,337) |
| Gross Income From Mining | $695.987 |
| Operating & Capital Cost ($000’s) | |
| Mining | ($235,427) |
| Backfill | ($52,064) |
| Expensed Waste | ($17,809) |
| Surface Ore Haulage | (13,978) |
| Process | ($139,706) |
| Site Administration | ($26,195) |
88
| Description | LoM Value |
| Purchased Ore | ($-) |
| Operating Costs | ($458,179) |
| Cash Cost ($/oz) | $785oz |
| Cash Cost ($/t-ore) | $115/t |
| Cash Operating Margin (EBITDA) | $201,133 |
| Other Costs | |
| Reclamation Accrual | ($9,575) |
| Other | $0 |
| Net Income | $191,558 |
| Capital Cost net of Salvage ($000’s) | |
| Equipment | ($29,494) |
| Capitalized Development | ($29,730) |
| Facilities | ($5,560) |
| Process Capital (sustaining) | ($30,187) |
| Tailings Impoundment | ($39,078) |
| Administration & surface Services | ($6,573) |
| Salvage | $ 0 |
| Capital Costs | ($140,623) |
| | |
| Cash Flow (NPV @ 0%) | $70,085 |
| Cash Flow (NPV @ 5%) | $54,966 |
| Cash Flow (NPV @ 10%) | $42,201 |
Table 27: Annual Mine Production Schedule from 2010 to 2014
Year |
Smith
Mined
Ore
kTons |
SSX
Mined
Ore
kTons |
Saval
Mined
Ore
ktons |
Starv
Mined
Ore
kTons |
East Dash
Mined
Ore
kTons | Wright
Window
Mined
Ore
kTons |
Surface
Stockpile
Mined
kTons |
Total
Ore
kTons
Mined | Average
Mined
Gold
Grade
(opt) |
| 2011 | 438.0 | 67.5 | - | - | - | - | 704.5 | 1,210.0 | 0.113 |
| 2012 | 439.2 | 457.5 | 78.2 | 114.4 | 66.0 | - | 54.8 | 1,210.0 | 0.185 |
| 2013 | 438.0 | 456.3 | 65.4 | 131.5 | 182.5 | 84.5 | -148.1 | 1,210.0 | 0.201 |
| 2014 | 5.0 | 234.1 | 25.5 | 117.1 | 63.0 | - | 291.0 | 735.8 | 0.154 |
| Total | 1,320.2 | 1,215.4 | 169.1 | 363.0 | 311.5 | 84.5 | 902.2 | 4,365.8 | 0.164 |
| Average GoldGrade (opt) | 0.166 | 0.189 | 0.210 | 0.264 | 0.196 | 0.127 | 0.073 | - | 0.164 |
| Notes: | (1) | Year 2013 the mine added 148.1 ktons to the ore stockpile due to mining in that year; |
| (2) | Wright Window is an open pit; the other mines are underground operations except for of course the stockpile materials; |
| | (3) | Starv = Starvation Canyon |
| (4) | The mine reserves and the production schedule were conducted by Independent Mining Consultant Mark Odell (PE; QP) and have an effective date of January 1, 2011 |
Table 28: Annual Cash-Flow Forecast from 2010 to 2014
Year |
Rec
Au
(oz) |
Gold
Price
(US$) |
Cash
Cost/oz
(US$) |
Total
Cost/oz
(US$) | Total
Revenue
(US$ x
1000) | Net
Income
(US$ x
1000) |
Net Cash
Flow (US$
x 1000) |
Cumulative
Cash Flow
(US$ x 1000) | Op Cash
Flow
(US$ x
1000) |
| 2011 | 121.8 | $1,100 | $825 | $1,007 | $133,935.2 | $11,264.8 | $-74,394.1 | $-74,394.1 | $30,916.5 |
89
Year |
Rec
Au
(oz) |
Gold
Price
(US$) |
Cash
Cost/oz
(US$) |
Total
Cost/oz
(US$) | Total
Revenue
(US$ x
1000) | Net
Income
(US$ x
1000) |
Net Cash
Flow (US$
x 1000) |
Cumulative
Cash Flow
(US$ x 1000) | Op Cash
Flow
(US$ x
1000) |
| 2012 | 199.3 | $1,100 | $790 | $987 | $219,249.2 | $22,622.3 | $25,975.5 | $-48,418.6 | $55,643.7 |
| 2013 | 216.1 | $1,100 | $789 | $989 | $237,683.7 | $23,932.6 | $60,125.4 | $11,706.8 | $65,769.0 |
| 2014 | 101.0 | $1,100 | $717 | $979 | $111,093.7 | $12,265.8 | $50,025.0 | $61,731.7 | $50,025.0 |
| 2015 | - | - | - | - | - | - | $8,353.7 | $70,085.4 | $8,353.7 |
| Total | 638.1 | $1,100 | $785 | $990 | $701,961.7 | $70,085.4 | $70,085.4 | $70,085.4 | $210,707.9 |
| Notes: | (1) | Rec = Recovered; Op = Operating; oz = ounce; Au = gold |
| (2) | The mine reserves and the production schedule were conducted by Independent Mining Consultant Mark Odell (PE; QP) and have an effective date of January 1, 2011 |
Exploration and Development
The operation now has a mine life of approximately 3.6 years with only Jerritt-sourced ore and identified Jerritt stockpiles. The authors of the Jerritt Canyon Report believe that the currently identified resources and reserves, and mine plan outlined in the Jerritt Canyon Report are reasonable and with additional financing the necessary people and equipment are available at the site and by Queenstake to successfully complete the project as planned. Mineral resources that are not mineral reserves do not have demonstrated economic viability.
The LoM mill production is targeting 3,600tpd starting in October 2011 with the following primary ore sources: Smith mine (1,250tpd), Jerritt Canyon stockpile (1,100tpd), and SSX-Steer complex (1,250tpd). In order to keep the mill operating at 3,600 tons per day beyond August 2014 which is when all of the Jerritt stockpile is predicted to be exhausted based on the LoM plan, additional ore feed will need to be secured. The additional ore could come from either Newmont, resources that have been converted to reserves at the Jerritt Canyon property, and/or from other mines or sources in the nearby region. If Newmont ores are pursued, the Newmont ore purchase agreement would obviously need to be extended beyond 2011.
The following recommendations are made:
- Continue exploration and development drilling with the goal of locating new areas of resource and reserve away from existing underground development, converting existing resources to reserve (near-mine), and targeting the historic open pits that have not been mined since 1999. The proposed 2011 Jerritt Canyon geological program to pursue the aforementioned targets at the property, consisting mostly of exploration and development drilling, totals $18.0 million dollars and is summarized below under the heading “2011 Geological Program”;
- Remodel the resources that have been included in the previous NI 43-101 report (SRK, 2008) that have not been updated in the Jerritt Canyon Report;
- Drill and model potential additional resources in the historic open pits using present day modeling techniques, economic and mining parameters, and the current gold price; the primary author believes that there is excellent potential to add additional resources in or near the historically mined open pits;
- Pursue other suitable ore sources in the region outside of the Jerritt Canyon property to help feed the mill;
- Try to maximize stockpile haulage to the mill during the non-winter seasons;
- Continue to work on the mine to mill reconciliation in respect to tons and grade; and
- Continue to develop ways to minimize the amount of moisture in the ore that enters the plant. The moisture typically comes from internal mine water, and seasonally from water that enters the stockpiles at the mines and mill.
90
2011 Geological Program
The proposed 2011 Jerritt Canyon geological program totals $18.0 million dollars and consists mostly of surface and underground drilling at both near-mine resources and stand alone targets throughout the property. A total of 237,250 feet of surface drilling is proposed for 2011 in the following areas listed in Table 29. In addition a total of 33,000 feet of underground drilling is planned at SSX-Steer and Smith mines.
Table 29: Proposed 2011 Jerritt Canyon Drilling and Geology Program ($000’s)
Description |
Drill Footage | Drilling
Budget ($) | Other
Budget ($) | Total
Budget ($) |
| Surface Drilling | | | | |
| Mahala | 81,000 | 3.5 | - | 3.5 |
| Open Pit Layback | 42,200 | 1.9 | - | 1.9 |
| Starvation Canyon | 6,000 | 0.3 | - | 0.3 |
| New Deep Fault | 18,800 | 0.9 | - | 0.9 |
| Pie Creek | 22,000 | 1.0 | - | 1.0 |
| Warm Creek | 9,000 | 0.4 | - | 0.4 |
| Road Canyon | 14,350 | 0.7 | - | 0.7 |
| Warm Creek | 9,000 | 0.4 | - | 0.4 |
| GeoTechnical and Met Drilling (Starv) | 10,400 | 1.1 | 0.3 | 1.4 |
| Core Tails | 24,500 | 2.7 | | 2.7 |
| Underground Drilling (SSX & Smith) | 33,000 | 1.9 | - | 1.9 |
| Geophysical Survey (Starv) | - | - | 0.5 | 0.5 |
| Operating Expenses | - | - | 1.0 | 1.0 |
| Trucks, computers, materials, GPS | - | - | 0.8 | 0.8 |
| Other | - | - | 0.6 | 0.6 |
| Total | 277,350 ft | $ 14.8 | 3.2 | $18.0 |
| Notes: | (1) | Mahala (81,000 feet) targeting West Mahala, East Dash, and ore trend extensions at the Smith Mine; |
| (2) | Open-Pit Layback (42,200 feet) targeting existing pits at West Generator, Steer and Saval, and California Mountain; |
| | (3) | The New Deep fault target lies along the East-West fault trend extending east from the Murray Mine. |
The 2011 drill program plan is to utilize 4 surface drills and is expected to start in early July and last 5 months until mid-December. Total cost for the proposed surface drilling is $12.3 million dollars. The total surface RC drilling cost on a per foot basis has been budgeted at $43.00 per foot. The direct and indirect cost for surface diamond (core) drilling has been budgeted at $107.50; all “other” costs related to the surface core drilling has been accounted for in the RC drilling costs noted above.
A significant amount of time in 2011 will be spent modeling and drilling for additional open pit resources at the property. Open pit mining ceased in 1999 and many of the open pits have not been assessed since 2006 or before this time.
In addition, a substantial amount of underground exploration and resource conversion drilling is planned at the SSX-Steer and Smith mines (likely totaling over 33,000 feet). At least one underground drill is secured for this work. Projected total cost for the underground drilling, including assays, labor, survey, and material is approximately $60.25 per foot.
In addition to the planned drill program for 2011, an Resistivity- Induced Polarization (IP) and magnetotelluric (MT) survey geophysical survey is planned for the Starvation Canyon area which was already initiated in early June 2011.
91
(b) Ketza River Project, Yukon Territory
The Company's interest in the Ketza River Property is the subject of the Technical Report (the “Ketza River Report”) of Mark Odell, Mine Engineer Consultant, P.E., Todd W. Johnson, P.E., VP Exploration of the Company, John Fox, Consulting Metallurgical Engineer,P.Eng. and Karl Swanson, Mining Consultant, SME, MAusIMM with an effective date of January 25, 2010 and an issue date of June 28, 2011 and is summarized below. The Ketza River Report is available at www.sedar.com.
Project Description and Location
The Ketza River Property is located on the headwaters of Cache Creek, a tributary of the Ketza River, in the Watson Lake Mining District of the Yukon Territory, and is centered at 61o 32' N and 132o 13' W on NTS map sheet 105 F/9 (Figure 36).
The Ketza River property consists of 679 quartz claims and fractions of claims, and 60 quartz leases as summarized in Table 30 and shown in Figure 37. The 60 quartz leases cover approximately 1947 acres (787.9ha) . The quartz leases currently owned by Ketza River Holdings Ltd. (“KRH”) were originally converted from quartz claims. The number of Ketza River claims identified above exclude claims associated with another nearby KRH project to the east (totaling 149 claims) and those along the Ketza River access road from the Roger Campbell Highway (totaling 71 claims).
As of late May 2011, 146 quartz claims (claim numbers KON 604 to 733 and GF 119 to 134) were staked at the southern portion of the Ketza River claim block and recorded and are currently under the control of KRH. These 146 newly acquired claims are part of the total described above and are included in Figure 37. All Ketza River project claims lie in NTS Map sheet numbers 105 F/9 and 105 F/8. All of the aforementioned Ketza River claims are controlled 100 percent by Ketza River Holding Ltd.
Table 30: Claim and Lease Summary for the Ketza River Project, Yukon
Property |
No. Quartz Claims |
No. Quartz Leases | No. Quartz Claims Not
Owned by KRH |
| Ketza River | 679 | 60 (787.9 ha) | 0 |
92
Figure 36: Ketza River Project Location Map
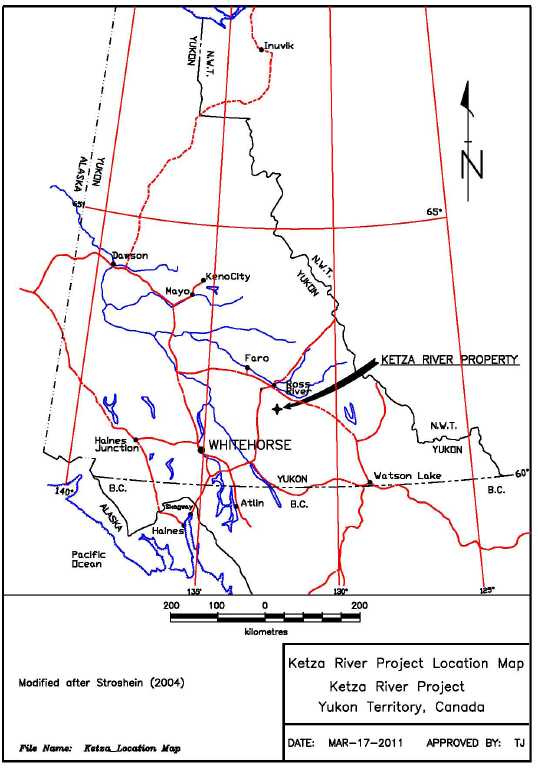
93
Figure 37: Ketza River Project Land Position
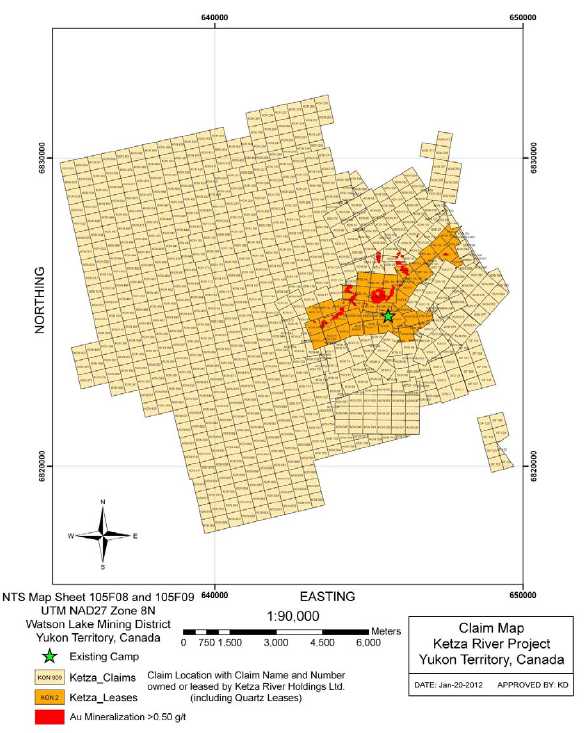
An annual royalty is due to the Yukon government on every producing mine according to the Yukon Quartz Mining Act (Canada) and is described in the Information Sheet 2010-02 “Explanation of Quartz Mining Act and Royalty Regulation Amendments” that can be downloaded from the internet from the Yukon Government website (Yukon Energy, Mines, and Resources, 2010). The royalty is on any profits that exceed the sum of $10k during any any calendar year.
94
The royalty is as follows:
- On annual profits in excess of $10k and up to $1M, 3 percent;
- On the excess above $1M up to $5M, 5 percent;
- On the excess above $5M up to $10M, 6 percent; and
- On the excess above $10M a proportional increase of 1 percent for each additional $5M with a cap on the annual royalty rate at 12 percent for any profit in excess of $35 million.
Environmental permits are in place for exploration and related activities, as well as the maintenance of the Ketza River camp. The Company has a staff based at the Ketza River camp to routinely monitor environmental parameters, and also maintains an office in the provincial capital of Whitehorse. Relevant permits are presented in Table 31. All permits except the Water License are issued by the Department of Energy, Mines and Resources or the Department of Environment. The Water License is issued by the Yukon Water Board.
The Quartz Mining Land Use Permit requires a lease-security payment to be made each year for a limited time. Under the existing permit, payments of C$94,050 are due every April 1 up until 2014 to the Department of Energy, Mines and Resources. In addition, Ketza River Holdings Ltd. holds lease number 105F09-001 for 15 years starting July 1, 2003. The total rent due on this lease per year is C$7,350 + GST (C$7,717.50 total) and due on July 1.
As of mid-March 2011, the total security amount held by the Yukon Government is C$3,508,821 (http://www.emr.gov.yk.ca/mining/security_held_mining_projects.html) of which C$3,087,600 is being held pursuant to the Waters Act is and C$421,221 is being held pursuant to the Quartz Mining Act. This money being held by the Yukon Government may be thought of as a reclamation bond.
The Water License QZ04-063 expired on December 31, 2009 and the reapplication process is currently in progress. Yukon-Nevada Gold Corp. and Ketza River Holdings are still obeying the rules and regulations in this water license until it is renewed.
Table 31: Permits for the Ketza River Project
| Permit/Approval | Issuing Agency | Comments |
| Quartz Mining Land Use Permit LQ00156 | Mining Land Use, Department of Energy, Mines and Resources | Covers all exploration through June 14, 2014. |
| Government of Yukon Lease (lease number 105F09-001) | Lands Branch, Department of Energy, Mines and Resources | For the occupation of land for the purpose of commercial mine, mill, campsite, tailings pond and other facilities. |
| Class A Land Permit | Lands Branch, Department of Energy, Mines and Resources | Permit to proceed with the land use operations for road maintenance. |
| Water License QZ04-063 (Expired December 31, 2009 but Reapplication process in progress) | Yukon Water Board | For the storage of water in, and the discharge of water from, an existing tailings impoundment. |
| Building (Occupancy) Permit Nos. 20111008765B and #20111008763B | Yukon Community Services; Yukon Building Inspector | 49-person trailer dormitory, and 7 unit diner complex |
| Water Well Building Permit Nos. 20111008769B and #20111008767B (portable water well bldg. sea-can | Yukon Community Services Yukon Building Inspector | 2 Sea-Can Water Treatment and Distribution Bldg., and potable water well Bldg. Sea -Can |
| Environmental Health Approvals: Permit No. 3981 (sewage disposal) | Department of Yukon Environmental Health | Public Health and Safety Act approvals needed for drinking water, food safety and private sewage disposal. |
95
| Permit/Approval | Issuing Agency | Comments |
| Waste Management Consolidated Permit No. 81-013 (Environmental Act Permit) | Yukon Department of Environment | Allows operation of a dump for solid waste, incinerator for burning solid waste, and allows generation and storage of waste oil and fuels; Includes an Air Emissions permit, a special waste permit, and a commercial dump permit; Storage Tank registration includes: one 45,000L, one 500L, one 10,000L, and four 90,000L tanks. Document contains a Pollution Prevention Plan and Pollution Prevention Policy |
| Storage Tank Permit No. 02011-41 | Yukon Community Services; Protective Services C-20 | Storage Tank permits for: one 45,000L, one 500L, one 10,000L, and four 90,000L tanks. |
| Work Within Right-of-Way Permit | Yukon Highway and Public Works | Allows KRH to conduct work along the main access road (needed prior to receiving approval for the quarry permits) |
| Quarry permits Nos. 11/393; 11,394; 11/395; and 11/396 | Yukon Energy, Mines, and Resources | Allows excavation of sand and gravel materials from existing quarries |
A replacement camp was installed at the Ketza River project site in the summer of 2011. Most of the permits for operating this replacement camp have been acquired As of year-end 2011, only a few outstanding items (fire suppression system) remain to be finalized to bring the replacement camp into full compliance for a 49-person camp. The occupancy permit was granted on a temporary basis (allowing 30 occupants in the camp) from the Yukon Building Inspector until the fire suppression system is complete. The Yukon Workers’ Compensation Health and Safety Board (WCB) granted permission to open the replacement camp for exploration purposes in early September 2011. Additional permits will be required for mine operations.
Environmental Liabilities
The only environmental liability at the Ketza River project includes the existing Ketza River tailings impoundment (pond and dam) that was originally established by the historic mine operators (Canamax Resources Inc.) in 1987 and used for their mining operation from 1988 to 1990. The Ketza River tailings pond is classified as Type II site that is regulated by the Government of the Yukon. The existing tailings pond is currently under owner-operator care and maintenance by Yukon-Nevada Gold Corp. (YNG). YNG is planning to start decommissioning the existing tailings dam prior to the startup of the next mining operation.
Environmental management systems are in place and there is a qualified environmental staff associated with YNG and KRH. Numerous monitoring wells exist at the Ketza River property that have been monitored by either on-site staff or contract engineering companies. EBA Engineering, now a Tetratech Company, has also been involved at the Ketza River property conducting environmental programs and water sampling over the recent years. Various mitigation programs are in effect as required under the various licenses and agreements that have been filed and/or approved for the project. No unusual costs associated with any of these programs were identified.
Accessibility, Climate, Land Resources, Infrastructure and Physiography
The Property is located in the Pelly Mountains in south central Yukon. Terrain is mountainous with elevations ranging from 1,300m above mean sea level (amsl) to 2,100m amsl. Land use in the area is limited to mining, trapping, hunting and recreation.
Average daytime temperatures range from highs of +25oC in summer to lows of -40oC in winter. Average annual precipitation in Faro, the nearest location for which weather statistics are available, is 31.6cm and includes annual averages of 21.4cm of rainfall and 111.6cm of snowfall (http://climate.weatheroffice.ec.gc.ca/climate_normals). Daylight extends to nearly 24hr/day in the summer months, particularly June. There are only short periods of daylight during the winter. Exploration can be conducted year-round but heavy winter snow may limit access to some areas. Mining can be conducted year-round.
96
Vegetation consists of dwarf birch, spruce, alder and balsam trees up to the tree line at approximately 1,600m amsl.
The Property is accessible by a 40km all-weather road from Km 323 on the Robert Campbell Highway. The Property is approximately 80km by road from Ross River and 460km from Whitehorse (Figures 36 and 38). The 40km access road is kept open year-round and is passable for tractor-trailer-size supply trucks.
The surface is owned by the Crown and leased to the Company under the Government of Yukon Lease. Total annual lease payment for the occupation of land for the purpose of a commercial mine, mill, campsite, tailings pond and other mine-related facilities is C$7,350 + GST (C$7,717.50 total).
The community of Ross River is 90km from the Project and supplies food, fuel and basic medical service. Personnel trained in first aid are on site at the Ketza River camp at all times and a fully stocked Industrial Ambulance is available. There is an airstrip in Ross River and contractors for electrical, plumbing, mechanical and vehicle maintenance are available in Ross River or Whitehorse.
Power to the camp and facilities is provided by 160kV and 210kV diesel generators. One generator remains off while the other generator provides power. The two are used alternately to allow for maintenance. A smaller 60kV generator is available as backup. Power for any future mining activities will be provided by additional generators.
A new water well was installed at the Ketza River camp area in July 2011. This water well supplies drinking water to the camp. All water sampling and testing of the water well along with the well completion report was done by the end of November 2011. In the recent past, the Ketza camp has received its drinking water by pumping directly from Cache Creek into a storage tank where the water was chlorinated and processed using reverse osmosis equipment (for arsenic treatment). Pumps that were in place could individually produce up to 30gal/min.
Water required for future mining operations will be assessed in future studies and will presumably be provided by water wells to be drilled on the property.
The buildings for the existing camp, kitchen and offices are modular Atco trailer units. The camp and kitchen facilities were installed in the summer of 2011. There are 49 rooms available for lodging. There is a separate kitchen unit with dining area and a separate office complex for technical staff. In addition there are laundry facilities and a dry room. The replacement camp will help support the exploration programs and also be used to support construction of the new mine facilities.
Shop areas in the old mill building are functional and are used for maintenance of camp vehicles and equipment. The old mill building that houses some of the old process equipment is in poor to moderate condition and its use for future milling activities will be investigated in future studies. West of camp there is an operational core logging and core splitting building. All facilities have available power and water. Core is stored outdoors on-site.
The camp site will be permitted for 49 personnel. Technical staff typically work four weeks on and two weeks off with schedules dependent on the needs of the camp.
A larger camp will be required for future mining operations. Approximately 150 people will be needed for mining operations while 200 people will be needed for construction.
There is an existing unlined tailings pond on the Ketza River site that was utilized in previous milling operations. This pond was constructed by October 1987 as a sub-aqueous disposal sight for oxide mill tailings with a storage volume capacity of 610,000m3 after allowing for 1.1m water cover on top of the tailings (Canamax, 1990; Golder, 1986). The amount of tailings in the existing pond is estimated by others at 342,395 tonnes (Canamax, 1991a).
97
The majority of the future mining that is proposed will contain sulfide minerals making the current pond unsuitable for tailings disposal.
YNG is investigating implementing a thickened tailings method for tailings disposal for future operations which would be located directly below the existing tailing pond. An alternative upper site located just north of the Penguin and Tarn resources has been proposed to be used for dry stacked tailings. For dry stacked tailings, the process slurry would be dewatered to a moisture content of around 20 percent. This material would then be stacked on a lined containment pad. The water that has been scalped out of the tailings stream would be re-used as makeup water where applicable.
Waste generated in camp and from activities associated with the Project are burned in a trash incinerator or hauled to the Ross River landfill. Trash awaiting incineration is stored in bear-proof metal storage containers. There is a chemical treatment facility for sewage located down-gradient from the camp.
Currently there are no waste dumps of any significant size on the surface. The majority of the waste material that was previously mined was used as fill material for the underground workings.
Preliminary sites for waste rock disposal have been identified and are shown in the submitted YESAB Application. Geotechnical and environmental data is currently being collected and summarized to use in the engineering design for future waste dumps. Although some of the waste may be acid generating in nature, the abundance of high quality limestone on the site should leave several options for mitigation of acid generation potential.
Geologists, engineers, surveyors and other technical people are hired on a contract basis or employed through YNG or KRH. Even though there is an expired signed Memorandum of Understanding (MOU) with the Dena Band of the Kaska Nation, KRH is still honoring this document which states that First Nation’s people will be preferentially hired if they qualify for available jobs. KRH is currently negotiating with the Dena Band to make a new MOU, expected to be signed in the first quarter of 2012. Personnel for mining operations will be hired and trained locally where possible. Additional personnel will be hired from other localities.
98
Figure 38: Ketza River Project Access

History
The Ketza River Property has a history of exploration and production dating back to the 1940’s. The property consists of several discrete zones of gold mineralization as shown on Figure 39. The exploration camp, and core shed are shown on the map along with the historic tailings pond and old mill site.
The history of the ownership of the Ketza River property is summarized below:
- Conwest Exploration Company Limited (Conwest), 1954-1983;
- Pacific Trans Ocean Resources Ltd (Pacific Trans-Ocean), 1983 to 1984, through an option with Conwest;
- Joint venture between Canamax Resources Inc. (Canamax) and Pacific Trans-Ocean, 1984-1989;
- Canamax, following purchase of Pacific Trans-Ocean’s interest, 1989-1992;
- Wheaton River Minerals Ltd (Wheaton), after acquisition of property from Canamax, 1992-1994;
- YGC Resources Inc. (YGC), after transferral from Wheaton in exchange for controlling interest in YGC, later divested, 1994-2007; and
- Yukon-Nevada Gold Corp. (YNG) or it’s 100 percent Canadian subsidiary company called Ketza River Holdings Ltd. (KRH), following merger between YGC and Queenstake Resources Ltd to create YNG, 2007 to present.
99
Lead-silver veins were discovered in the Ketza River area by prospectors of the Hudson Bay Mining and Smelting Company Limited in 1947. Later explorers conducted trenching, road building and diamond drilling. Exploration adits were subsequently developed on the lead-silver veins but little economic production was achieved.
Gold mineralization on the property was first discovered in 1954 by Conwest. Between 1955 and 1960, Conwest explored several mineralized occurrences with trenching and 75 AX diamond drill and packsack drill holes. A non-NI 43-101-compliant historic geological “reserve” of 68kt grading 12g/t-Au was reported for the Peel 3 and Peel 3C deposits (now known as the Peel and Ridge zones). The claims were surveyed and taken to lease during this time.
In 1983, Pacific Trans-Ocean optioned the property from Conwest and carried out limited geochemical and geological surveys before entering into a joint venture with Canamax in 1984.
In 1984, Canamax, as operator of the joint venture, completed geological mapping, a 3,500 sample soil geochemical survey for gold and arsenic, a 102 line-km airborne EM-Magnetic survey, rock sampling and 2,424m of diamond drilling in 59 drill holes. Drilling focused on the Peel, Flint, Penguin and Tarn sulfide zones and Ridge oxide manto zone. Initial oxide reserves at the Peel and Ridge zones were calculated at this time. The locations of the exploration targets and existing resources at the property are shown in Figure 39.
Figure 39: Gold Mineralized Zones and Exustung Facilities
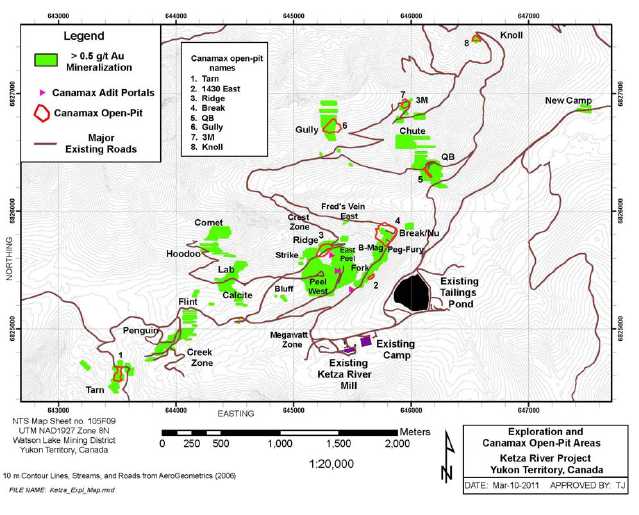
100
In 1985, Canamax carried out geologic mapping, 6,158m of diamond drilling in 60 holes, 409m of underground drifting on the 1510 Level and collection of a metallurgical bulk sample from the Peel and Ridge oxide zones. Preliminary geotechnical and environmental studies were also completed. The exploration led to the discovery of the QB vein. The Iona Silver property adjoining the east boundary of the property was optioned by Canamax and the Slide Lake claims immediately north of the property were staked at this time.
The 1986 field program consisted of prospecting and trenching and led to the discovery of the Break, Gully, 3M and Knoll zones. In 1986, Canamax undertook 6,278m of surface diamond drilling in 90 drill holes to define the Peel zone and to test the Break, QB and 3M showings. Underground exploration included 1,200m of development work on the 1550 and 1510 levels followed by 68 underground diamond drill holes totaling 2,331m. An option was obtained on the adjoining High River/Quillo property.
Exploration during 1987 included diamond and reverse-circulation (RC) drilling, ground geophysics and soil sampling. In addition, low-altitude aerial photography was completed over the property. Drilling during this time consisted of 61 diamond drill holes totaling 4,990m and 95 RC drill holes totaling 5,029m. Drilling focused on definition drilling on the Peel zone and exploration drilling on the Peel fault, Fred's Vein East, and 3M zones. Ground geophysical surveys included 50 line-km of magnetic and 30 line-km of HLEM surveys. Soil sampling on 25m spacing resulted in 2,298 samples for gold analysis only. The Hoodoo and Eileen oxide zones and the Lab and Raven sulfide zones were also discovered at this time.
In 1988, work consisted of diamond drilling, ground geophysics, soil sampling and underground development and exploration. Diamond drilling consisted of 70 holes, 12 of which were underground holes, totaling 5,549m on the Lab, Hoodoo, Comet, Knoll, 3M, NW fault, Megawatt, Sue Creek, Penguin, Peel, Break and Nu zones. Ground geophysical surveys included 90 line-km of magnetics and 26 line-km of VLF. A total of 2,310 soil samples were collected and analyzed for gold. One hundred sixty m of underground drifting on the Nu and Break zones was completed followed by 582m of underground diamond drilling. Sulfide mineral process investigations were initiated. Options on the Iona Silver and High River/Quillo properties were terminated in 1988.
Exploration during 1989 consisted of percussion and diamond drilling, surface geophysics, geologic mapping and soil sampling. Drilling consisted of 127 diamond drill holes (including seven underground holes) totaling 5,590m and 79 percussion holes for a total of 1,215m. Definition diamond drilling was carried out on the Knoll, Tarn, and 1430 East oxide zones and on the Peel East open pit, Peel East underground and Peel West underground and Lab sulfide zones. Preliminary percussion and diamond drilling was also carried out on the Break, B-Mag, Peg-Fury, and Nose zones. Ground geophysics consisted of 36 line-km of ground magnetics. Geological mapping and collection of 500 soil samples led to the discovery of the 1430 East, Tarn and B-Mag oxide zones. New oxide mineralization was also identified at the Knoll and QB zones.
During 1990, trenching was completed on the Penguin and Sauna zones. Drilling in 1990 focused on the Lab and Calcite Zones and consisted of 35 diamond drill holes totaling 2,620m.
In February 1987, a feasibility study (Canamax Resources Inc, 1987) was completed by Canamax and reviewed by Wright Engineers Ltd (Wright). The study recommended construction of a 320t/d mill and mine complex producing approximately 50koz-Au/year from a mineable base of 460kt of oxide ore averaging 15.3g/t -Au. The feasibility preceded NI 43-101 requirements and is not compliant with CIM (2000) guidelines. Mine life was to be five years and the average cost per ounce of gold produced was to be in the range of US$220 to US$250. The estimated cost to build the mine and mill was estimated at US$21M. A production decision was made in March 1987, and financing was obtained in October 1987. The mill achieved commercial production in July 1988.
After several months of operation, the inventory was significantly reduced from the Wright feasibility study estimates due to an error in estimation of the bulk density of the oxide ore. The feed grade to the mill was also lower than expected, due to a number of factors including over-weighting of high-grade samples in the data and dilution from the lower than expected grade from the footwall mineralization (Strathcona Mineral Services Limited, 1988). Canamax purchased Pacific Trans-Ocean's interest in the Project in January 1989.
101
Reported Canamax mill production is shown in Table 32. Gold produced in the preproduction milling period between March to June 1988 was used to help finance the construction of the mine which was officially opened in July 1988. Based on the two available data sources listing total gold production from March 1988 to November 1990, 337,343 tonnes were milled and 97,992 oz of Au were produced.
Table 32: Total Canamax Mill Production Data for the Ketza River Mine
Study (Reference) |
Production Period | Tonnes
Milled | Average Au
Grade(g/t) | Average Mill
Recovery | Au Oz
Prod. |
| Canamax Project Review; Mill Statistics (A) | July1988-Nov. 1990 | 307,397 | 10.68 | 88.31% | 93,312 |
| Canamax Preproduction Mill Records (B) | March-June 1988 | 29,946 | 7.78 | 85.33% | 4,680 |
| Total Canamax Mill Production | March 1988 – Nov. 1990 | 337,343 | 9.03 | 86.69% | 97,992 |
| Notes: | (1) | March-June 1998 data is from Canamax pre-production mine records found at the site; |
| (2) | References: (A) Canamax (1991) based on monthly and annual mill production statistics; (B) Canamax (1988) preproduction mill statistics data (from mill records); |
| (3) | Total mill production includes preproduction mill data; average Au grade and mill recovery is calculated using both preproduction and production mill data |
Average mill throughput over the life of the mine was 364t/d (Canamax, 1991). Historical Canamax mill records indicate that the dore Au bars poured at the Ketza River mine typically contained 5 to 10 percent Ag by weight as a result of processing oxide ore. Underground mining was primarily done using the square set method.
A summary of total mine production by zone is presented in Table 33 (Hodgson, 1991). It should be noted that mine production figures are not reconciled with total mill production. The mining statistics shown in Table 33 have poor reconciliation with the mill statistics shown in Table 32. The variance between the mill and mine statistics is moderate (8 to 12% difference) and could be related to: (1) higher reported Au grade in the mine production data (up to 8% higher than the mill Au grade); and (2) higher reported tonnes in the mine production data.
Table 33: Total Canamax Mine Production Data by Area: July 1988 – November 1990*
| Zone | Tonnes | g/t-Au |
| Ridge | 95,790 | 13 |
| Peel | 148,844 | 13 |
| Break-Nu | 54,700 | 10 |
| Tarn | 18,169 | 8 |
| QB | 1,987 | 13 |
| Knoll | 2,936 | 6 |
| Gully | 8,136 | 10 |
| 1430 East | 600 | 5 |
| Peel/Ridge Mine Dump | 11,233 | 6 |
| Total | 342,395 | 11.6 |
| Notes: | (1) | *Hodgson (1991) mine production statistics by resource area; |
| (2) | Mine production figures in this table have not been reconciled with total mill production so the stated tonnage values may be high by approximately 12 percent. |
Table 34 below shows the total underground ore production from historical records (Steffen, Robertson, and Kirsten, 1994). Approximately 66 percent of the ore tonnes were mined from underground sources while the remaining 34 percent were mined from open pit sources.
102
Table 34: Summary of Total Ketza River Underground Mine Production by Area
| Underground Zone | Ore Tonnes Mined |
| Ridge | 74,653 |
| Peel | 148,843 |
| Break | 813 |
| Nu | 1,578 |
| Total | 225,887 |
Note:Data from Steffen, Robertson, and Kirsten (1994)
A presumed ore stockpile exists at the Ketza River site just north of the existing mill. This stockpile was likely mined by Canamax but not processed. No reports have been found for the actual gold grade or tonnage data associated with this stockpile. Judging from the dark red-brown colour of the stockpile, the material in the stockpile is likely dominated by oxide material but must be confirmed with additional work. Surface sampling of the stockpile was conducted in 2011 to help characterize the Au grade distribution.
Tonnage calculation estimations of the stockpile material by YNG staff have recently been done in 2010 by two methods, both of which use the current topographic contour lines on 1 m contour intervals to help determine the stockpile volume: (1) cross sectional method, and (2) using shapes determined in Vulcan. Both methods have to estimate the bottom of the stockpile near an elevation that approximates the ground elevation present just outside of the stockpile area. Neither estimation method has used actual survey control of the stockpile on the ground.
The sectional method used cross-sections spaced every 10m to determine an area and an associated volume for each section. Using this methodology determined a total volume of 45,400 m3. Using Vulcan software and shapes digitized within this software (and a 13% grade to the base of the stockpile from one end to the other), a volume of 50,398 m3 was determined for the stockpile.
No specific gravity or density data has been determined for this stockpile material. So if we assume a specific gravity of 2.0 which is used for rock fill material at Jerritt Canyon mine in Nevada, a total of 90,800 tonnes and 100,796 tonnes is determined for the stockpile present near the existing Ketza River mill using the sectional and Vulcan methods, respectively. Obtaining actual survey data and Au grade assays for this stockpile are recommended for future work in order to possibly include in a resource estimate. The redox type of this stockpile may be assumed to be oxide until confirmed with further field studies.
With the oxide zones nearing depletion, attention was given to the economic viability of the sulfide mineralization and in November 1990 the mine and mill ceased treating oxide material. Metallurgical studies were conducted on sulfide mineralization from several of the deposits. An internal feasibility study on the sulfide ores (Canamax, 1990) indicated an additional C$3.4 million dollars in capital expenditures to help fund plant modifications, ore body development, and extra decommissioning. The 1990 Canamax feasibility study estimated gold recovery for the sulfide ores at 78 percent. The mill at the time was permitted to treat oxide ore only and additional permits were required for the treatment of sulfide ore. In June 1991 an amended water license was received but Canamax did not pursue the application due to corporate conditions, low gold prices and adverse market conditions.
Wheaton acquired the property from Canamax in 1992 and in 1994 transferred it to YGC in exchange for a controlling interest. Wheaton later divested out of YGC. The claims outside the mine area were optioned to Hemlo Gold Mines Inc. (Hemlo) from 1993 to 1995.
Hemlo carried out soil sampling, magnetic surveys, bulldozer trenching and in 1995 completed three diamond drill holes totaling 499m in the Shamrock zone area. YGC also conducted diamond drilling in 1994 and 1995 that consisted of 72 HQ-diameter diamond drill holes totaling 5,630m. The program resulted in the discovery of the Chimney and Fork zones.
103
In 1996, YGC completed 14 HQ-diameter holes totaling 1,954m in the mine area and 21 HQ-diameter holes totaling 3,612m in the Shamrock zone. The 1996 program also consisted of geologic mapping, prospecting and sampling a number of other anomalous zones. During 1997, 11 holes, totaling 1,217m, were drilled along the Fork – Nu trend.
From 1955 through 1997, a total of 940 diamond, RC and percussion drill holes totaling 55,096m of drilling have been completed on the property. A summary of this is presented in Table 35.
University graduate students (Cathro, 1990 and Stavely, 1992) completed studies on the property investigating the geology and mineral deposits of the Ketza district and the mineralogy and geochemistry of the Ketza Mine deposits. A post-graduate investigation was completed on the structural geology, stratigraphy, alteration systems, and possible age relationships of mineralization and postulated intrusive activity (Fonseca, 1998).
Canamax, the previous operator of the mine, expended $11.6M on exploration and feasibility studies from 1984 to 1990. Exploration summary reports were prepared annually by Canamax describing geophysical ground and airborne surveys, geochemical soil sampling, prospecting, trenching, percussion drilling, RC drilling, diamond drilling and underground developments.
Table 35: Summary of Drilling from 1955 to 1997
| Year | Operator | No. Holes | Type of Drilling | Length Drilled (m) |
| 1955-60 | Conwest Exploration Co. | 75* | Diamond | Unknown |
| 1984 | Canamax Resources Inc. | 59 | Diamond | 2,424 |
| 1985 | Canamax Resources Inc. | 60 | Diamond | 6,158 |
| 1986 | Canamax Resources Inc. | 158(A) | Diamond | 8,609 |
| 1987 | Canamax Resources Inc. | 61 | Diamond | 4,990 |
| 1987 | Canamax Resources Inc. | 95 | RC | 5,029 |
| 1988 | Canamax Resources Inc. | 70 | Diamond | 5,549 |
| 1989 | Canamax Resources Inc. | 127(B) | Diamond | 5,590 |
| 1989 | Canamax Resources Inc. | 79 | Percussion | 1,215 |
| 1990 | Canamax Resources Inc. | 35 | Diamond | 2,620 |
| 1994 | Hemlo Gold Mines Inc./YGC Resources Ltd. | 25 | Diamond | 2,180 |
| 1995 | Hemlo Gold Mines Inc./YGC Resources Ltd. | 50(C) | Diamond | 3,949 |
| 1996 | YGC Resources Ltd. | 35 | Diamond | 5,566 |
| 1997 | YGC Resources Ltd. | 11 | Diamond | 1,217 |
| Total | | 940 | | 55,096 |
| Notes: | (1) | *not included in the current Ketza River drill hole database; |
| | (2) | (A)= only 87 drill holes out of the 158 drill holes are in the current Ketza River drill hole database; |
| | (3) | (B)= only 101 drill holes out of the 127 are in the current Ketza River drill hole database; |
| (3) | (C)= Three drill holes out of the 50 total still need to be added to the Ketza River drill hole database and include hole numbers KR-95-502, KR-95-503, and KR-95-504. |
After YGC acquired the property in 1994, it spent $0.52M in 1994, $0.76M in 1995, $0.90M in 1996, and approximately $0.2M in 1997 on exploration. Drilling on the extensions of mineralized trends, on the peripheries of developed zones and in other unexplored anomalous areas totaled 12,912m in 121 diamond drill holes. The exploration was successful, leading to the discovery of new gold-bearing oxide and sulfide mineralization on the property. Summary reports on the 1994, 1995, 1996, and 1997 drilling programs are located in the project files at the Ketza camp.
104
Geological Setting
The Property is located in the Pelly Mountains of central Yukon. The mountains are made up of a shallow marine miogeoclinal sequence of rocks forming a carbonate platform bounded by the Omenica Tectonic Belt to the southwest and a faulted lobe of the Yukon Tanana Terrain to the northeast across the Tintina Fault. This carbonate platform is known as the Cassiar Terrain or Pelly-Cassiar Platform (Pelly-Cassiar).
The Pelly-Cassiar is a displaced continental margin of the ancient North American continent. Rocks of the Pelly-Cassiar consist of a continental margin sedimentary sequence of the Rocky Mountain Assemblage composed of interbedded carbonate and clastic units of Paleozoic age. Several major deformation events have affected the region including a Mesozoic-age arc-continent collision, doming and uplift during the intrusion of mid-Cretaceous stocks and an estimated 450km of dextral strike-slip displacement on the Tintina Fault from the Cretaceous to Tertiary periods.
Four significant thrust faults, the McConnell, Porcupine-Seagull, Cloutier, and St. Cyr thrusts, parallel the Tintina Fault and dip generally southwest (Abbott, 1986). Thrusting is believed to have occurred during the Late Jurassic and Early Cretaceous.
Rocks in the Watson Lake District belong to the Cloutier Thrust Sheet, which is exposed within an erosional window in the overlying Porcupine-Seagull Thrust Sheet. The window, known as the Ketza-Seagull arch, forms an elongated northwest-trending structure probably related to buried Cretaceous intrusions. The intrusions are apparently centered in two areas known as the Ketza Uplift and the Seagull Uplift. Structures in the window are characterized by steeply dipping normal faults.
An apophysis of a mid-Cretaceous stock is postulated to lie beneath the core of the Ketza Uplift and the Peel Creek anticline (Fonseca, 1998; Cathro, 1988; Parry et al., 1986 and 1984); however, no major intrusive rock bodies, and only rare narrow dikelets have been identified on the property to date. The uplift exposed the oldest rocks of the Clouthier Thrust Sheet, which are Lower Cambrian carbonates and older clastic rocks. The rocks surrounding the uplift are Upper Cambrian and younger clastic and carbonate rocks. The following supporting evidence has been cited for the presence of a buried intrusive body:
- The presence of an aeromagnetic anomaly;
- Mapped biotite-rich hornfels in sedimentary rocks (unit 1a) centered near Shamrock Mountain and Peel Creek;
Hornfelsed metasedimentary rock from rock unit 1a was dated at 101+/-4Ma (Mid-Cretaceous) using the whole rock K-Ar method (Cathro, 1988). One40Ar/39Ar analysis of white mica from quartz+sulfide veined rock from the Shamrock zone gave a mid-Cretaceous age (108 ± 0.3Ma) for mineralization which coincides with the emplacement of the Cassiar Plutonic suite (Fonseca, 1998).
Geology of the Ketza River Property
The geology of the Ketza River property has been described by numerous investigators including Canamax (1984-1991), Abercrombie (1990), Fonseca (1998; 1998a), Stroshein (1996), and Cathro (1988; 1986). The Property is underlain by Lower Cambrian carbonate and clastic sedimentary rock units. The Lower Cambrian units (Map Units 1a, 1b, 1c, 1d, and 1e) form a conformable series (Figure 40) which is unconformably overlain by Late Cambrian black shale (Fonseca, 1998). The lithostratigraphic succession described below was adopted by previous workers (Read, 1980). The general surface geology is outlined in Figure 41.
105
Figure 40: Stratigraphic Column

106
Figure 41: Surface Geology Map
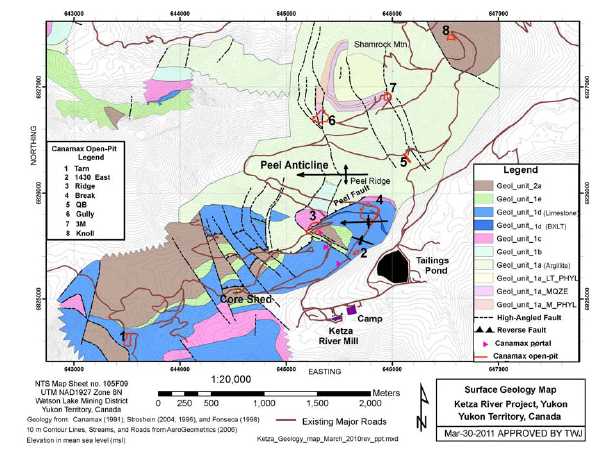
Local Lithology
The oldest rocks are Unit 1a which is composed of interbedded brown to rusty weathering argillite, phyllite, variably bedded impure siltstone, sandstone, quartzite, limestone and calcareous units. The unit outcrops in the center of the Ketza Uplift north of the Peel Fault that encompasses the Shamrock target.
Unit 1b is a narrow bed (25 to 60m) of fossiliferous, well-laminated silty limestone that appears to be transitional from the underlying argillite to the overlying phyllitic limestone. The unit is not found at the surface on the property but has been intersected in drill holes.
Unit 1c is a recessive weathering unit of 75 to 105m thickness composed of brown to gray-green phyllitic limestone, calcareous mudstone and argillaceous limestone. The upper contact of the unit is gradational with the overlying massive to thick bedded blue gray limestone. This unit crops out in exposures along Cache Creek above the mill site.
Unit 1d is host to the bulk of the manto-type replacement mineralization on the property. The lower contact is gradational and arbitrarily defined when the well-bedded limestone becomes the major component. The unit is from 120 to 180m thick. The limestone is a gray, uniformly bedded, clean limestone with distinctive Archeocyathid fossils occurring near the top of the unit. An internal stratigraphy has been recognized in the mine site area. The internal beds are separated on the basis of textures. Beds of massive fine-grained light-gray limestone, blue fine-grained crystalline limestone, thin and wispy silty banded limestone, and silty black limestone are recognizable in drill core and outcrop. The unit is locally dolomitized, recrystallized and weathered near the mineralization. The limestone is resistant and forms prominent cliffs and ridges throughout the region.
107
Unit 1e is composed of a thin (0 to 50m) green mudstone bed which forms a distinctive marker horizon. The unit is locally to pervasively clay- or talc-altered in the vicinity of mineralization. The mudstone is generally recessive, poorly exposed and often required additional ground support in the underground workings where it formed the hanging wall of the Peel zone.
Unit 2a is composed of carbonaceous to graphitic black shale with a well-developed slaty cleavage. The thickness of the unit is unknown as the top of the unit is not exposed on the property. The unit crops out in the fault-bounded panels at the Peel Oxide zone and in the Sue Creek area north of Cache Creek. A discontinuous unit of dull orange-weathering dolomite, Unit 2b, outcrops in the western portion of the property. This is a regional unit mapped by Read (1980) and was not recognized on the property by Canamax.
Alteration
Dolomitization or iron carbonate (siderite and ankerite) replacement alteration envelopes the manto mineralization and is especially well developed in areas lateral to the mantos where the host limestones are brecciated. The carbonate replacement deposits result in the migration and precipitation of calcite in the rocks surrounding the mineralization. Sheeted white calcite veinlets and veins are exposed in the footwall rocks in the Break open pit and amorphous white calcite banding occurs in the fine-grained limestone unit in proximity to the Peel/Ridge zones and in the upper plate rocks in the Hoodoo zone. The calcite-rich limestone beds are referred to as zebra rock. Skarn mineralization dominated by garnet, pyroxene, or amphibole at the property is rare and usually does not yield significant gold values. Magnetite-rich replacement and/or skarn that contains greater than 40 percent magnetite by volume has been documented in the B-Mag zone but is rare. Chlorite and talc have also been identified in diamond drill holes but are not abundant.
Silicification, sulfidization, biotite hornfels, and bleaching are closely associated with quartz-sulfide veins in sedimentary rocks in the argillite-hosted resources at Shamrock Mountain. Biotite hornfels has been mapped at the surface in unit 1a over an area approximately 2.5 square km in diameter that is centered over the QB zone and the northeast Peel area (Parry et al., 1984). Epidote and diopside hornfels have been reported but do not appear to be common. Quartz-sericite alteration has been mapped on the surface around a core of quartz and silicification in the QB zone.
Structure
The property is located in the Ketza Uplift that is composed of uplifted and altered Lower Cambrian Unit 1a strata. Structures within the uplift include thrust faults, upright folds, and high-angle normal faults. Block faulting likely either predates, or was contemporaneous with, the mineralizing event. The faults acted as conduits for the metal-bearing solutionshe structure of the Ketza River area has been described by Fonseca (1998; 1998a) and Abercrombie (1990).
The property lies on the southern flank of a westward plunging anticline which is cored by the Unit 1a argillite exposed along Peel Creek. The strata are strongly folded with limbs ranging from steep to flat-lying. A later deformation has overprinted these structures with broad, open folds and drag folds that occur adjacent to thrust faults.
A synclinal closure has been mapped in the Peel Ridge mine site area where mineralized bodies occur on both limbs of the fold. A major synclinal fold with parasitic anticlinal folds has been mapped northwest of the mine site area in the upper plate rocks overlying the Peel thrust fault. Limestone beds of Unit 1d host gold-bearing oxides and sulfides at the Hoodoo and Comet zones in the core and on the western limb of a tight anticline.
108
Regionally, the thrust faults are northeast directed with displacements of up to 450m. The Peel fault is thought to be a reactivated thrust fault that pre-dates the block faulting. It is cross cut and offset in the Peel - Ridge fault by northwest-trending faults. The Peel fault intersects the Ridge zone ore deposit and juxtaposes Lower Cambrian argillite Unit 1a over the Lower Cambrian limestone Unit 1d. The fault has two different orientations, steeply dipping east of the Ridge zone and shallow dipping over the Ridge zone and to the west. The fault has been traced westward to the area of the Lab deposit.
The stratigraphy, thrust faults and folds have been disrupted by numerous reverse, normal and strike-slip faults. High angle block faults related to uplift and doming are prominent. Detailed mapping in the underground workings indicates that the Peel and Ridge oxide deposits occur within a 200m wide zone of structural deformation bounded by two northwest trending block faults.
Exploration
In May of 2005, YGC recommenced drilling and exploration work at the Ketza River Project after a long hiatus from 1997. In 2006, the main Project area was flown for new one-meter-contour topographic map coverage. In the spring of 2007 the Ketza claim block was expanded on the south and west. A limited amount of reconnaissance work was conducted in 2006, followed by a major effort in 2007, yielding several new target areas. Ground magnetic and gravity surveys were carried out over known mineralization. A soil sampling program was completed in the area of Peel Ridge north to the top of Shamrock Mountain. A petrographic study was completed for manto-style mineralization.
More recent exploration work from 2008 to 2011 has included additional surface geophysical studies, soil sampling, rock-chip sampling, mapping, and significant amounts of diamond drilling.
Samples from three 1996 drill holes were analyzed for multi-element geochemistry in an attempt to determine the presence of a zonation pattern that might point to the location of a postulated buried intrusive as postulated by Fonseca (1998). The drill holes were located at the QB zone, the 3M zone and one in between. The ratios of gold-arsenic and gold-bismuth indicated that the QB zone hole was closest to an inferred intrusive body at depth (Stroshein, 2006).
Since 2005, YGC and YNG have spent $4.4M in 2005, $7.5M in 2006, $15.2M in 2007, $12.9M in 2008, $3.2M in 2009, and $8.1M in 2010 on exploration at the Ketza River property based on published company information (Yukon-Nevada Gold Corp, 2011).
Rock Sampling
Tarn Pit
The wall of the Tarn Pit was channel sampled in the fall of 2006. A total of 40 samples were collected, each one 5.0m in length. The samples averaged 2g/t-Au, with a high of 9.7g/t -Au.
Creek Zone
Outcrops just above the pad for holes KR-06-920 through 922 contain massive pyrite with black coatings on the crystal surfaces. The black coating is assumed to be chalcocite since the samples ran approximately 0.2% Cu. Other dark grains in the rock were identified as tetrahedrite. All four samples contained gold values.
Gully Pit
In mid-August of 2006, a series of chip and channel samples were collected across the massive sulfide rib and the adjacent shear zone in the Gully zone. The assays of the samples contained significant gold.
109
Soil Sampling
Aurora Geosciences conducted a soil sampling program over large portions of Peel Ridge and Shamrock Mountain in 2007. The sampling was done on a 50m grid, and targeted areas where 200m spaced soil lines had identified anomalous gold.
A more recent soil sampling program was done in the summer of 2010 on an even 100m grid and targeted the South Hill target located just south of the existing camp. An additional soil survey was conducted in 2011 over the OK target near Misery Creek. Results of this work, in conjunction with the recent geophysical results will be used to help target drill holes in the area.
Geophysics
Aurora Geosciences completed two geophysical surveys in 2007: (1) a gravity survey on a 50m grid from the Lab Zone to the top of Shamrock Mountain; and (2) a ground magnetic survey on a 50m grid from the Peel zone across to Peel Canyon to the northeast which included to the top of Shamrock Mountain.
Quantec Geosciences completed a Titan-24 IP ground survey in 2009 that covered 3 lines from the top of Shamrock Mountain to the top of Peel Ridge. This survey found numerous conductor anomalies some of which were at significant depths.
Aurora Geosciences completed several additional geophysical surveys in 2010: (1) a ground magnetic survey over the Shamrock, OK, South Hill and lower tailings site targets; and (2) a ground IP survey at the South Hill and OK targets. The 2010 IP survey used an expanding pole-dipole array with a 25m dipole spacing. The ground magnetic survey lines were spaced 100m apart with readings taken on stations spaced every 10m.
Topographic Surveys
In August 2006, Aero Geometrics of Vancouver flew the Project, including the existing claim block in 100km2 of new topographic survey coverage. Two sets of digital topographic maps, with 10m and 1m contour intervals were produced.
In early September 2007, Aero Geometrics of Vancouver flew portions of the Project in which mining claims had been staked since the survey the previous year. Topographic maps generated by this survey have a 5m contour interval.
Petrography
Gold in sulfide ore occurs as the native metal or less commonly as electrum in finely disseminated grains up to 25 microns in size (Giroux, 2005). The gold is very often associated with chalcopyrite and native bismuth and occurs mainly in fractures in the arsenopyrite and pyrite or along sulfide grain boundaries. Less commonly gold grains occur as inclusions in pyrrhotite.
Two distinct textures of Au bearing oxide materials have been documented. The first is massive to boxwork textured brown oxide typically located in the footwall of the mineralized zones and generally containing a low Au grade. The second is a highly colourful red-orange fine-grained variety that locally contains a colloform texture, typically occurs near the hanging wall, contains hisingerite, and is associated with higher grade Au content
Mineralization
Mineralization on the property is generally of two types: manto and chimney, carbonate-hosted replacement deposits that occur south of the Peel fault and quartz-sulfide fissure veins and quartz-breccia zones in siliciclastic
110
rocks that occur north of the Peel fault. Over 30 targets and prospects have been identified on the property (see Figure 39). For purposes of resource estimation, the area has been divided into seven model areas with most of the targets falling into one of the following areas (Figure 42):
Tarn Area: Tarn
North Penguin Area: Lab, Calcite, and Hoodoo
South Penguin Area: Penguin and Flint
Peel Area: Ridge, Peel, Nu-Break, Fork
QB Area: QB and 3M
Gully Area: Gully
Knoll Area: Knoll
The Tarn, North Penguin, South Penguin, and Peel areas occur south of the Peel fault and contain manto and chimney, carbonate-hosted replacement deposits while Gully, QB, 3M, and Knoll occur north of the Peel fault and contain quartz-sulfide fissure vein and quartz breccia zones in siliciclastic rocks. The Shamrock area includes Gully, QB, and 3M. The 3M zone was included in the QB model. The Knoll zone locally has some manto-type replacements.
Mineralized Zones
Peel, Penguin North, Penguin South, and Tarn areas generally consist of gold-rich carbonate-hosted chimney- and manto-style sulfide mineralization and its oxidized equivalents. Sulfide mantos include Peel Sulfides, Peal East Sulfides, Penguin, Tarn, Lab and Flint. Oxide mantos include Peel Oxides, Break-Nu, Ridge and Hoodoo.
The mantos and steeply plunging chimneys are preferentially hosted by three limestone facies of Unit 1d - massive limestone, fine-grained crystalline limestone, and wispy banded limestone - which are confined to the south side of the Peel fault. The location of mineralization is controlled by high-angle planar and listric normal faults, fold hinges and by the location of the three favorable carbonate facies. In general, the mantos have an elongate geometry.
Principal sulfide minerals in the mantos and chimneys consists of pyrrhotite, pyrite, arsenopyrite, marcasite and minor chalcopyrite. Galena and sphalerite are rare. Oxidized mineralogy primarily consists of hematite and goethite. Scorodite, after arsenopyrite, is common. A distinctive lustrous hydrous iron silicate mineral named hisingerite is present, and is often associated with high-grade gold values.
Tarn Zone
The Tarn zone is located approximately 2km west of the Ketza River Camp in the headwaters of Cache Creek. Mineralization consists of two mixed oxide-sulfide bodies ranging from 85m to 115m in length, 35m to 60m in width and 5m to 8m in thickness. Mineralization is exposed in the Tarn pit, extends to 75m in depth, and is flat lying with a strike of 015o.
Approximately 18.2kt of oxidized manto-style mineralization was mined from the Tarn zone in the late 1980’s. Current exploration at Tarn focuses mainly on the sulfide manto beneath some remaining oxide material.
Lab Zone
The Lab zone is manto-style sulfide mineralization located approximately 1.25km northwest of the Ketza River Camp on the southern slope of Peel Ridge. The Lab zone consists of four distinct zones that occur over an area measuring 320m x 400m and average 5m in thickness. The four bodies occur in two pairs at right angles to one another with the arms striking northeast and southeast. The former Calcite Zone is located on the south end of Lab and is included in this zone.
111
The Calcite resource consists of a narrow vein less than 7.2 m wide (averaging 1 to 3m wide) that has been traced over 225m of strike length, strikes 140º, and dips 39 to 50º to the west.
Hoodoo and Comet Zones
The Hoodoo zone contains both vein-type and manto-type oxide/sulfide mineralization located approximately 1.5km northeast of the Ketza River Camp on the southern slope of Peel Ridge. Early drilling in this zone was halted once sulfide mineralization was reached. Recent drilling has been targeting sulfide mineralization underlying the oxide mineralization exposed at surface. Exploration has also been successful in extending the oxide mineralization. The southern Hoodoo resource dips 38 to 70º to the south and is typically less than 5m thick. Several flat-lying mantos up to 11m thick are located on the northern end in the Comet Zone.
Penguin Zone
The Penguin Zone is manto-style sulfide mineralization located approximately 1.25km west of the Ketza River Camp. Four main mineralized bodies occur within a presently defined area approximately 360m in length, 155m in width, and up to 10m in thickness. The Penguin mineralization strikes 226º and dips moderately to the northwest at 60º.
Flint Zone
The Flint Zone consists of two manto-style sulfide zones located approximately 1.25km west of the Ketza River Camp, also in the Cache Creek drainage. The Flint Zone is sub-horizontal and is approximately 100m in length, 130m in width, and up to 5m in width. This zone occurs less than 85m below the surface and has a strike azimuth of 050o.
Peel Zone
The Peel zone is located about 0.75km north of the Ketza River Camp on the south flank of Peel Ridge. Manto-style mineralization at the Peel zone consists of irregular interconnected lenses and pods of both sulfide ore and some remaining pods of oxide ore in area approximately 400m long x 400m wide. The Peel zone consists of the Peel West, Ridge, Main Peel, Peel East, and Peel oxide zones. Oxide and sulfide-rich chimneys up to 30 to 115m in height are locally present on the northern end of the main Peel zone along a northeast-trending fault zone. Other faults that cut this area are high-angled and northwest-trending. The Nu-Break and Fred’s Vein East zones are also on Peel Ridge but are somewhat to the east of the main grouping of mineralized bodies that comprise the Peel zone.
Peel West and Peel East Zones
The Peel West and East zones consist dominantly of one large 400mm long by 400m wide narrow flatlying to gently dipping manto with a generally circular footprint that ranges from 0.9 to 12m in thickness. An additional five smaller mineralized mantos occur below or above the large manto in a stacked configuration. The mineralized mantos are locally exposed at the surface and extend to a depth of 100m below the surface. The overall strike of these zones is 320 to 355o.
Ridge Oxide Zone
The Ridge oxide zone consists of three separate mineralized chimney bodies occurring over an area approximately 100m in length, 100m in width, and up to 10m in thickness. Individual mantos vary from 5 to 10m in thickness. The zone is exposed at the surface and extends to a depth of 120m. The mantos and chimneys dip from fairly flat-lying to 50-70o to the north. Strikes range from 068o to 83oto 255o.
112
Production from the oxide mineralization in the Peel and Ridge deposits was approximately 244,634t at an average grade of 13g/t-Au (Hodgson, 1991). Oxide mineralization is cut off by the bounding northwest-trending East Side fault.
Nu-Break Zone
The Nu-Break zone consists of oxide manto mineralization located approximately 1.0km north-northeast of the Ketza River Camp on the nose of Peel Ridge. The overall dimensions of the mineralized body as presently defined are approximately 175m in length, 75m in width and up to 20m in thickness. The zone is exposed at the surface and extends to a depth of 95m below the surface. The zone strikes approximately 38o with a gentle dip of up to 30o to the southeast.
Fred’s Vein East
This vein is located approximately 1.0km north of the Ketza River Camp and is exposed at the surface. Fred’s Vein East is a quartz+sulfide mineral vein-like occurrence in siliciclastic rocks on the north side of the Peel fault. While Fred’s Vein East is geologically similar to the mineralization in the Shamrock area, it falls within the Peel area because of its location on the north side of Peel Ridge in the Peel Creek drainage.
The exposed strike length of the structure is approximately 100m. The width is difficult to characterize and the down dip extension has not yet been totally defined. The strike varies from 065o to 080o and dip varies from 80o to 85o to the south.
QB Zone
The QB zone consists of multiple irregular lenses or veins of quartz-breccia occurring in siliciclastic rocks north of the Peel fault. The main QB vein swarm is located approximately 1.75km northeast of the Ketza River Camp on the south flank of Shamrock Mountain in the Peel Creek drainage. The overall dimensions of the mineralized body as presently defined are approximately 530m in length, 230m in width and 2m to 70m in thickness. The zone extends from the surface to a depth of 175m, strikes 5-355o and plunges 17-46o to the southeast.
A generalized Au grade shell was digitized around low grade gold mineralization at depth below the QB zone. The resulting Au mineralization in a mineral inventory table from this work was very small.
3M Zone
The 3M zone is located about 2.5km northeast of the Ketza River Camp on the ridge between Peel and Misery Creeks. Mineralization consists of multiple thin quartz breccias and vein-like bodies and sulfide mineral disseminations in siliciclastic rocks. The mineralized bodies have variable strike and dip orientations: 330º/70ºNE; 235º/5ºSW; and 227º/84ºNW. The 0.5g/t Au grade shells are approximately 40-100m in length, range from 2m to 15m in width, and extend to approximately 100m in depth below the surface.
Grade shells greater than 0.5g/t opt Au were modeled in the 3M zone as part of this study and included in the QB zone resource. Only minor open-pit mining has occurred at 3M. The boundary of Canamax’s 3M open pit partially covers some of the 3M 0.5 g/t Au grade shells which suggests that 3M was partially mined. However, we were unable to apply any mining depletion to the 3M zone (open-pit mining done by Canamax) since the existing compiled topographic information is not detailed enough to confirm mining has occurred.
113
Gully Model Area Occurrences
The Gully zone was previously mined by Canamax in the late 1980’s and yielded approximately 8,100t of oxide ore averaging 10.0g/t -Au (Hodgson, 1991). Mining stopped when sulfide mineralization was encountered, leaving a prominent massive sulfide rib protruding from the pit floor, and a highly oxidized shear zone along its side.
Gully is a quartz+sulfide mineral vein occurring in siliciclastic rocks north of the Peel fault. The vein is located approximately 1.75km north of the Ketza River Camp on the south flank of Shamrock Mountain in the Peel Creek drainage. Assays from drill samples range up to 37.6g/t -Au. Overall dimensions of the mineralized vein as presently defined are approximately 350m in length, 100m in depth and 4 to 8m (4m average) in thickness. The zone extends from the surface to 150m with a strike of 165o, a dip of 45-60o west, and a plunge of 9o. The northern end of the Gully Vein has a shallower dip of 17º to the west as compared to the southern half of the vein.
Knoll Model Area Occurrences
The Knoll zone is located about 3.0km northeast of the Ketza River Camp on the north slope of Shamrock Mountain. It is comprised of multiple stacked subhorizontal (manto-like) 0.5g/t Au bodies of oxide and sulfide mineralization hosted in a dolostone bed measuring 50m x 35m with a thickness ranging from 4m to 10m. In addition, some vein-style mineralization hosted in argillite and phyllite rock has been documented at Knoll. Mineralization is exposed at the surface and has been open-pit mined on a limited scale in the past.
Drilling
From May of 2005 through December of 2010, YGC and YNG drilled a total of 1,029 drill holes for a total of 136,656m (Table 36). The principal objective of the drilling programs was the continued definition of known mineralized areas and the testing of newly discovered areas. Only a minor amount of the drilling has been dedicated towards predevelopment or YESAB project proposal studies. All diamond drill holes completed in the resource areas up to December 31, 2010 are shown in Figure 42.
Table 36: Summary of Diamond Drilling 2005 Through 2011
| Year | Operator | No. of Holes | Type Drilling | No. of m Drilled |
| 2005 | YGC Resources Ltd. | 99 | Diamond | 12,734 |
| 2006 | YGC Resources Ltd. | 270 | Diamond | 33,874 |
| 2007 | YGC Resources Ltd./KRH | 305 | Diamond | 41,587 |
| 2008 | Ketza River Holdings Ltd. | 225 | Diamond | 30,436 |
| 2009 | Ketza River Holdings Ltd. | 2 | Diamond | 483 |
| 2010 | Ketza River Holdings Ltd. | 128 | Diamond | 17,542 |
| 2011 | Ketza River Holdings Ltd. | 26 | Diamond | 4,402 |
| Total | | 1,055 | | 141,058 |
| Notes: | (1) | the total drilling done in 2008 listed above includes 26 geotechnical and hydrogeology diamond drill holes totaling 2,562m for predevelopment studies, and 14 condemnation diamond drill holes totaling 1926.79m completed at the alternative dry-stack upper tailings site. |
| (2) | the total amount of drilling (in meters) done in 2010 and listed above includes 10 geotechnical and hydrogeology diamond drill holes totaling 1232.7m, and 16 tailings dam (lower site) condemnation and exploration drill holes totaling 2,695.3m. The total amount of 2010 drilling listed in this table does not include the 14 geotechnical drill holes totaling 275 m that used Becker and diamond drilling methods, or the 2 piezometer drill holes totaling 21m completed at the existing tailings pond area. |
| | (3) | KRH = Ketza River Holdings, a 100% Canadian subsidiary company owned by the Company. |
| (4) | YGC Resources Ltd., the predecessor company to KRH, merged with Queenstake Resources in mid-2007 to form the Company (YNG); |
| | (5) | Total drilling excludes drill holes completed at the adjacent Silver Valley Project; |
| | (6) | The resource stated in this Technical Report does not include drill holes drilled in 2009 and thereafter. |
114
All of the drilling from 2005 through 2011 listed in Table 36 is diamond drilling. The diamond drill holes completed from 2005 to 2011 were started with NQ-sized core (47.6mm in diameter) or HQ-sized core (63.5mm in diameter) and reduced to NQ-sized core as required. A total of thirty drill holes (numbers KR-08-1269 to KR-08-1300) were drilled for metallurgical purposes in 2008 and are HQ-sized (63.5mm) . Hydrogeology drill holes completed in 2008 (HYD-08-01 to HYD-08-12, HYD-08-16 and HYD-08-17) and 2010 (drill hole number HYD-10-01) are HQ-sized (63.5mm) . Oriented diamond drill holes completed for geotechnical purposes in 2008 (drill hole numbers GT-08-01 to GT-08-12) and 2010 (drill hole numbers GT-10-01 to GT-10-10) are HQ3-sized (61.1mm) and utilized triple tubes. These geotechnical drill holes utilized the EZY-Mark core orientation system and were carefully logged and sampled for geotechnical data.
Collar locations are obtained by using a combination of a Leica total station and a Trimble R8 differential GPS. Downhole surveys are done using Reflex Maxibor II downhole survey tool. Prior to 2007 acid tests were used to measure dip changes down hole.
Drill core is currently stored on site. Drill logs are entered directly into a laptop computer in the core shack using Drill King software. Core recovery and Rock Quality Designation (RQD) are recorded for each drill hole.
The primary author, Todd Johnson, has reviewed the recent drilling procedures and results from 2005 to the present and has deemed them to be relevant and meet industry standards, and are acceptable to use in the current resource determination. Some of the in-house standards and blanks that were used in the 2005 to 2008 drilling programs were not certified and created local problems for quality assurance and quality control for drill hole assay results (see “Sampling and Analysis”). However, the use of in-house standards and blanks has been discontinued in the 2009-2011 drilling programs.
Drilling in 2008 was successful in extending and/or defining limits of mineralization on the Peel, Tarn, Gully, QB, Hoodoo, Bluff, and Lab zones. Parts of these remain open. Drilling on the Penguin and Calcite extension of Lab Zone was successful in defining mineralization at the location of magnetic highs.
A lack of significant mineralization was found by the drilling of the Peg-Fury (south of QB zone), Creek, Megawatt (south of Peel area), and Nose zones, as well as the previously untested ground between Lab and Peel. The Thrust vein, near Tarn was found to be cut off by a low angle fault at shallow depth.
The results were inconclusive at the Crest and Fred’s Vein East; more drilling will be required to either define or disprove significant mineralization at these zones. Significant mineralization was drilled at Hoodoo and Bluff, but definition of the nature and orientation of the mineralization will require more drilling.
Sampling and Analysis
The sampling procedures associated with the drilling programs utilized by YGC after acquiring the Ketza River property are described in this section. Little is known of the sampling methods employed by earlier operators. Sampling procedures, collection and security for YGC/YNG from 2006 to May 2011 has been completed mostly under the direction of YNG’s Qualified Person, Ed Gates. Erika Shepard, P.Geo., was the Qualified Person at the site for a brief period from April to December 2008. Kyle Dziama (BSc. Geology; GIT) has been the Yukon Project Manager and Geologist in charge since May 2011.
During the diamond drilling programs, geological personnel attended the drill at regular intervals as well as during drilling of mineralized intersections. Geologic personnel are on hand to determine the completion depth of each hole and to shut down the drill hole. The core is delivered to the core shack at the end of each working shift or when the drill hole is completed.
The core is laid out in sequence at the core shack. The core is logged directly into laptop computers by geologists, and sample intervals are marked on the core and recorded on the drill logs. The core is then stored within the core shack and samples are split in sequence. Personnel conducting the sampling are supervised by the geologist who logs the core.
115
All drill core is logged and photographed before sampling. The descriptions are entered onto prepared log forms on laptop computers using coded entries for lithology, texture, structure and mineralogy.
Oxide and sulfide mineralization are sampled on the basis of geologic features. The maximum sample interval for HQ core is 1.5m and 3.05m for NQ core. The minimum sample interval is 0.2m. Once samples are identified and marked, sample tickets are stapled into the sample locations in the core boxes. Sample intervals and geology are then logged into Drill King software. Once all of the drill hole data is logged and entered into Drill King, the data is imported into an Access drill hole database at the project site. Once the data is verified by on site geologists is ultimately imported into the master acQuire drill hole database. The drill hole data was imported into acQuire at the Ketza site by an experienced geologist up until January 2010. From February 2010 to March 2011 the drill hole data was imported into acQuire by the same experienced geologist at the Vancouver YNG corporate office. An experienced geologist is currently storing the recent drill hole data in Access at the project site.
Core is then taken into the splitting room where sampled intervals are split or with a diamond saw. Core from oxide zones often occurs as iron oxide rubble. In these instances, the rubble is sampled with a spoon rather that split or cut.
Half of the sample is placed in the sample bag and half is retained in the core box for future reference. The detachable half of the sample ticket is removed from the core box and placed inside the sample bag. The remaining half of the sample ticket remains in the core box with the corresponding sample number. Core boxes are removed to a designated core storage yard where they are placed on core racks.
Sealed sample bags are placed in large, consecutively numbered, white rice bags (e.g. Bag 1 of 6). The rice bags are labeled with the drill hole number and the contained sample numbers. Rice bags are placed in an outside storage bin near the core shack where they await shipping to the lab.
Prior to 2010, drill hole samples were transported by company personnel at least once per week to Byers’ Transport or Canadian Freightways in Whitehorse, Yukon. A sample shipment form is filled out and kept on file, indicating the date, truck being driven, person transporting the samples, hole numbers and number of bags. Upon arrival in Whitehorse, samples are directly loaded upon pallets at the transportation company and shipped to ALS Chemex. In 2010 and 2011, samples were dropped off by company personnel at the ALS prep lab in Whitehorse.
Sample Quality
Core recovery at the Ketza River property is generally very good in limestone and sulfide mantos, very good in the Gully vein and the argillite wallrock, moderate in the QB zone stockwork and fault intersections and moderate to poor in the oxide mantos. Core recovery data and RQD values were captured for the historic Ketza River drilling done from 1984 to 1997 but still need to be compiled and analyzed.
Sample Preparation, Analysis and Security of Samples
Various Labs (Pre-2006):
In the 1980’s, Canamax used Bondar-Clegg in Vancouver, BC; Northern Analytical Laboratory (noncertified) in Whitehorse, Yukon; Rossbacher Labs (noncertified) in Burnaby, BC; and the Ketza River assay lab (noncertified), Yukon for drill hole sample preparation and Au analysis. The preparation and Au analysis methods for these historical drill holes are compiled in the old Canamax project file reports at the site and digitally in the Ketza Project computer server. Most of the sample preparation at the commercial labs mentioned above was completed by people not affiliated with the mining and exploration companies with the exception of those samples analyzed at the Ketza River assay mine lab.
116
The Ketza River assay lab located at the mine site was the primary assay lab for those drill holes completed in 1987, and from 1989 to 1990. Employees of Canamax were responsible for sample preparation and assay of these drill holes analyzed at the Ketza River assay lab which is approximately 397 drill holes.
In 2005, YGC used Eco-Tech labs in Kamloops, BC. Samples were sorted and dried (if necessary), and then crushed through a jaw crusher and cone or rolls crusher to –10 mesh. The sample was then split through a Jones riffle until a –250 gram sub sample was achieved. The sub sample was then pulverized in a ring and puck pulverizer to 95 percent passing -140 mesh. The sample was next rolled to homogenize. A 30g sample size was fire assayed using appropriate fluxes. The resultant dore bead was parted and then digested with aqua regia and then analyzed on a Perkin Elmer AA instrument. Appropriate standards and repeat sample (Quality Control Components) accompany the sample results on the data sheet.
ALS-Chemex (2006-2008):
From 2006 to 2008, most sample preparation was done by ALS Chemex (ISO 9001:2008 registration and ISO 17025 accredited methods in North America) in their Terrace, British Columbia sample preparation facilities with the exception of some samples drilled for metallurgy testing purposes (see sample preparation discussion below). No sample preparation was done on site.
Samples are dried at 120°C (maximum) and then crushed with either an oscillating jaw crusher or a roll crusher. The ALS Chemex QC specification for crushed material is that greater than 70 percent of the sample must pass a 2mm (10 mesh) screen. A whole or split portion derived from the crushing process is pulverized using a ring mill. The ALS Chemex QC specification for final pulverizing is that greater than 85 percent of the sample be less than 75µm (200 mesh). A 30g split is fire assayed and the resultant bead is parted and digested with aqua regia, and the final result is measured using Atomic Absorption (AA) using the Au-AA23 analytical procedure (reported in ppm units). All assays above 1.0ppm were re-assayed by ALS Chemex using a gravimetric finish (Au-GRA21 analytical procedure) and reported in ppm units.
Since early 2006, ALS Chemex has also been analyzing every submitted sample interval for 35 element Inductively Coupled Plasma (ICP) geochemistry using the ME-ICP41 analytical method that utilizes nitric aqua regia digestion and atomic emission spectroscopy (AES). The 35 analyzed elements include Ag, Al, As, B, Ba, Be, Bi, Ca, Cd, Co, Cr, Cu, Fe, Ga, Hg, K, La, Mg, Mn, Mo, Na, Ni, P, Pb, S, Sb, Sc, Sr, Th, Ti, Tl, U, V, W, and Zn. Since spring of 2008, all submitted drill samples that contain greater than 10,000 ppm As, which is the upper limit using the ME-ICP41 analytical method, have been reanalyzed for overlimit As using aqua regia and the ME-OG46 analytical method.
A total of 30 diamond drill holes (totaling 3,388 m and including drill hole numbers KR-08-1269 to KR-08-1300) were completed in early 2008 for metallurgical testwork and prepared at the Jerritt Canyon Mine laboratory (noncertified lab), located about 51 kilometers north of Elko, Nevada. This mine lab is operated by Queenstake Resources USA, Inc. which is a 100% subsidiary company owned by YNG. The metallurgy samples were shipped to the Queenstake lab for faster processing and prep work; Queenstake employees prepared the Ketza River metallurgy samples by making pulps and performing initial Au assays. The leftover pulps were shipped to ALS for analysis for inclusion into the acQuire drill hole assay database.
These metallurgy core samples were dried at less than 93°C (maximum) and then crushed with a Rock Labs swing jaw crusher that took the sample material to 99 percent passing 25.4 mm (1 inch). Each sample was then processed through a Rock Labs Boyd crusher that took the sample to 99 percent passing 9.5 mm (3/8 inches). A whole or split portion derived from the crushing process (using a rotary splitter) was pulverized using a Bico pulverizer; the QC specification for final pulverizing was 95 percent passing 0.106 mm (150 mesh). A total of 300 grams of pulp material for each drill sample interval was made for fire assay and was initially analyzed by the Jerritt Canyon Laboratory to determine ore from waste (the Jerritt Canyon Lab assay results were not entered into the Ketza acQuire drill hole database or used for resource estimation).
117
The remaining pulp materials for each metallurgy drill sample (ore and waste) were later shipped to the ALS Chemex Reno laboratory for final assay as per the ALS Chemex assay specifications described above; these final assays from ALS Chemex were imported into the Ketza River acQuire drill hole database and used for resource modeling and estimation. The coarse reject material from the metallurgy drill hole sample were purged with nitrogen, placed in individual 2-gallon sealed plastic buckets soon after the split to minimize oxidation, and shipped to PRA Laboratory (now called Inspectorate) in Richmond, BC for metallurgy testwork. Inspectorate Lab is an International Organization for Standardization (ISO) 17025 certified lab.
Quality Controls and Quality Assurance
QA/QC Protocol 2005-2008 (YGC-YNG)
The YGC-YNG laboratory Quality Assurance/Quality Control (QA/QC) program consists of inserting a blank sample into the sample stream at the top of every hole and then inserting either a standard sample or blank sample at every 15th sample. If a drill hole has less than 15 samples, a standard and blank are inserted at the end of the hole.
The blanks used in the 2005 to 2008 drill programs were non-commercial material, composed of locally derived barren limestone and have not been certified to be of zero grade. The “barren” limestone source is located just southeast of the core shack (between the south projection of the Lab-Calcite resource and the West Peel resource). Since May 15, 2010, blank material being inserted into the sample sequence consists of crushed marble material that is being commercially sold in large bags in Whitehorse. This crushed marble material has not yet been certified to be of zero grade, but initial results indicate that the material contains very little Au.
Prior to mid-year 2006, a non-commercial moderate grade “pseudo-standard” was used, which had been collected from a mineralized outcrop in the Ridge pit and blended by hand. When this first “standard” was depleted, a second supply of higher grade material was collected and blended from a local high grade stockpile. These “standards” were inserted simply to ensure that the lab would catch high grade assays, and not necessarily to assess the precision of the lab. The shortfalls of these non-commercial standards was realized, and commercial standards from CDN Resource Laboratories Ltd were used starting in mid 2006.
After mid-year 2006, Gold Ore Reference Standards CDN-GS-10A (9.78+/ - 0.53g/t) or CDN-GS-10B (8.6 +/- 0.49g/t) have been used for drill holes completed in manto-type mineralization. Gold Ore Reference Standards CDN-GS-1C (0.99 +/- 0.08g/t), CDN-GS-2B (2.03 +/- 0.12g/t) or CDN-GS-2C (2.06 +/- 0.15g/t) have been used for drill holes completed in stockwork- or fissure-vein-type mineralization.
Due to communication issues, the standard insertion protocol was not strictly adhered to once a particular standard supply was depleted. There were minor labeling issues where blanks and standards had labels swapped, or the wrong standard label was recorded. These issues were identified and corrected as confirmed by comparing the geochemistry of the multi-element assay results to those of the standards. The problems reflected an issue with check sample handling and not with lab results.
Occasionally, higher-grade gravimetric assays were re-assayed as a check; all of these refires were within acceptable ranges of the original.
Interpretation
Graphs (Gravimetric Au using ALS analysis method Au-GRA 21 vs. return date) were plotted for each set of standards and blanks for the 2008 drill hole program and reviewed prior to conducting this current resource estimate. It must be emphasized that assay results for the 2008 drill holes were not all completed and finalized until January 25, 2010 due to funding issues which is the reason why some of the 2008 drill hole assay return dates extend into the 2010 year.
118
A total of 132 valid Au analyses using the CDN-GS-10B standard were completed in the 2008 drill program and stored in the drill hole database. A total of 119 valid Au analyses using the CDN-GS-2B standard were completed in the 2008 drill program and stored in the drill hole database. A total of 150 valid Au analyses using the CDN-GS-2C standard were completed in the 2008 drill program and stored in the drill hole database. A total of 636 valid blank standards were analyzed as part of the 2008 drill hole program.
With the exception of a few anomalies which may represent mislabeled samples, most of the commercial standards behave as well can be expected. Only a few assays are outside of the 2 standard deviations range, and most are within one standard deviation. The blank samples show several anomalous results which may be due to mislabeled samples, sample preparation contamination, or anomalous gold present within the blank.
The QA/QC program should be improved to meet industry guidelines of inserting 1 standard for every 20 samples, 1 duplicate sample for every 20 samples, and 1 blank for every 20 to 50 samples. The QA/QC data should be monitored on a regular basis to monitor the laboratory performance. In addition, a different blank material that is preferably certified by a commercial lab should be used for future drill programs.
A total of 22 pulps generated from the 2006 and 2007 drilling programs that were originally assayed at ALS Chemex, were relabeled with different sample ID numbers and reanalyzed at ALS-Chemex again in early 2008. These duplicate samples were not reviewed in the 2008 SRK NI 43-101 report. A scatter plot of these duplicate Au values are shown in Figure I-2 in Appendix I of the Ketza River Report and compare well with one another. No drill hole pulps or coarse rejects have been completed by a secondary certified assay lab for the 2008 drill program.. Several hundred pulps from the 2007 to 2010 drill programs have recently been submitted to ALS-Chemex and Inspectorate Labs for check analyses (as of December 2011).
.Mineral Resource and Mineral Reserve Estimates
In 2010, YNG updated the Ketza resource estimate with additional drilling up to August 2008 including up to drill hole KR-08-1466. An additional 191 drill holes were added since the last NI 43-101 report (SRK, 2008). The 2010 resource estimate was done by Karl Swanson and Todd Johnson using the Vulcan Software version 7.5 service pack one. This new NI 43-101 resource estimate reinterpreted the 0.5 g/t grade shells and created a geologic model within the Ketza River claim area.
The geologic model separated the main limestone unit (1d) from the argillite and siltstone units which lie both above and below the main limestone unit. An additional thin and mostly unmineralized limestone bed within the upper argillite was also modeled where possible. The individually logged limestone subunits within the unit 1d limestone are described under the heading “Geological Setting”, but were not modeled for this resource estimate.
The gold grade shells were modeled at a rigorous 0.5 g/t cutoff following geologic contact orientation where appropriate. Dilution was kept at a minimum, usually only allowing grades below the cutoff to be included internally to the grade shell or sometimes laterally to maintain ore shape continuity. This kept the grade shells tightly constrained so that the volume of both the manto mineralized bodies and the higher-angle vein style bodies were realistic based on the drilling intercepts.
Drill Hole Database
The drill hole database is currently maintained at the Ketza River camp in acQuire software, and was transferred from a Drill King (Access) database in late 2007. As of January 25, 2010 the database contained information for 1,582 drill holes, including 896 core holes from 2005 to 2008, 591 core holes from 1984 to 1997, and 95 RC drill holes from 1987.
119
In order to conduct the current resource estimate, data was extracted from acQuire, appended as required with the 1984-1997 audited drill hole data, and imported to Vulcan in 4 separate tables:
- Collar - HoleID, Northing, Easting, Elevation and Total Depth;
- Survey - Downhole depth, Azimuth, and Dip of drill hole at downhole depth;
- Assay - From, To, Sample ID, and gold assay for all drill holes, and Wt. percent iron for drill holes from 2005 to 2008 as well as other ICP elements. Specific gravity (SG) was calculated from the Wt. percent iron data from ALS Chemex for drill holes completed from early 2006 to 2008 and stored in the Vulcan Assay table in the SG_ASY field.
- Geology – From, To, Lithology Codes, percent sulfide minerals, and percent oxide minerals. Table 37 lists the fields recorded in Vulcan database. Table 38 lists the common lithologies logged at Ketza River. Where no Wt. percent iron data was available to calculate an SG value, the SG was assigned based on information logged by the geologists and stored in the Vulcan Geology table in the SG_GEO field (see Section 15.3.4 of the Ketza River Report for details).
Table 37: Geology Database Fields
| Field | Description | Entry |
| LCODE1 | Previous Lith Code | Alpha Code |
| LCODE2 | Edited Lith Code | Alpha Code |
| PO | Pyrrhotite | Percentage |
| PY | Pyrite | Percentage |
| APY | Arsenopyrite | Percentage |
| CPY | Chalcopyrite | Percentage |
| TOTSUL | Total Sulfide | Percentage |
| LIM | Limonite | Percentage |
| HEM | Hematite | Percentage |
| SCORO | Scorodite | Percentage |
| OXIDE1 | Primary Oxide Mineral | Alpha Code |
| OX1INT | Intensity of oxidation | Percentage |
| OXIDE2 | Secondary Oxide Mineral | Alpha Code |
| OX2INT | Intensity of oxidation | Percentage |
| TOTOX | Total Oxide | Percentage |
| OXDESC | Oxide Description | Alpha Code |
| RKMOD | Modeled Rock Name | Alpha Code |
| REDOX | Oxide State | Alpha Code |
| SG_GEO | Specific Gravity | Numeric |
| ZONE | Model Zone | Alpha Code |
| DOMAIN | Model Domain | Alpha Code |
| FLAG | Model Grade Shell | Alpha Code |
Table 38: Most Common Lithology Codes
| LCODE | Description | LCODE | Description |
| MSLT | Massive-oolitic limestone | BSLT | Black siltstone |
| WBN | Wispy banded limestone | SQA | Siltstone/Quartzite/Argillite |
| ARG | Argillite | VEIN | Vein |
| LST | Limestone | CASE | Casing |
| FSLT | Fossiliferous limestone | QTE | Quartzite |
120
| LCODE | Description | LCODE | Description |
| ARS | Argillite/Siltstone | FZ | Fault zone |
| OXIDE | Oxide Mineralization (≥50% by volume) | QAS | Quartzite/Argillite/Siltstone |
| SULF | Massive sulfide (≥50% by volume) | BA | Black argillite |
| QSA | Quartzite/Siltstone/Argillite | OVB | Overburden |
| MUD | Mudstone | HFLS | Hornfels |
| SAQ | SLT/ARG/QTE | AQS | Argillite/Quartzite/Siltstone |
| BXLT | Blue crystalline limestone | PHIL | Phyllite |
| SLT | Siltstone | QTZ | Quartz |
| ASQ | Argillite/Siltstone/Quartzite | GO | Gouge |
The geologic database was used to determine the percent oxide minerals and/or percent sulfide minerals (by volume) which was then used to determine the specific gravity. The methodology is described in Section 15.3 Specific Gravity Determinations and Redox Classification, of the Ketza River Report.
A total of 12,038 Au assay values are present in the Vulcan database that have a value > 0.069 g/t Au (greater than the highest detection limit). A total of 10,306 Ag values are present in the Vulcan database that have a value greater than 0.1 g/t which is the maximum detection limit rounded to the nearest tenths decimal place for 2005 geochemical analyses and younger.
For this current Ketza model, only three RC holes were removed from the database prior to variography and grade estimation (See Table 39). These three RC holes had core twins which showed downhole contamination of the RC holes. The RC holes are KR-87-RC3, KR-87-RC6, and KR-87-RC21. The core twins are KR-96-566, KR-05-676, and KR-07-1071. Drill hole KR-87-RC6 is shown in Figure 46 and shows the contamination in relation to surrounding holes and the modeled 0.5 g/t grade shells.
In addition to the three rejected RC holes, three "trench" holes located in the Tarn Zone were removed from the database leaving a total of 1,582 actual drill holes of the 1,585 collar names. These "trench" holes were named KR-06-TR2, KR-06-TR3, and KR-06-TR4. In the previous model by SRK (2008), additional holes were removed due to incorrect collar locations or orientation in relation to their modeled grade shells. As part of this study, Canamax maps were investigated and each of the other previously rejected holes were corrected and used. See Appendix C for list of moved drill holes. In remodeling the grade shells, no drill holes were rejected due to orientation. Therefore only the three contaminated RC holes were rejected from the total 1,582 drill holes.
Table 39: Summary of Drill Holes by Area
| | Used for Modeling | Rejected | Total |
Area | No. of
Holes | Length
Drilled | Length
Sampled | No. of
Holes | Length
Drilled | Length
Sampled | No. of
Holes | Length
Drilled | Length
Sampled |
| PEEL | 684 | 63,583 | 19,439 | | | | 684 | 63,583 | 19,439 |
| PENG | 408 | 48,027 | 15,847 | | | | 408 | 48,027 | 15,847 |
| SHAM | 324 | 42,470 | 28,051 | 3 | 363 | 244 | 327 | 42,833 | 28,295 |
| TARN | 121 | 10,943 | 2,812 | | | | 121 | 10,943 | 2,812 |
| KNOLL | 42 | 2,628 | 694 | | | | 42 | 2,628 | 694 |
| Total | 1,579 | 167,651 | 66,843 | 3 | 363 | 244 | 1,582 | 168,014 | 67,087 |
| Notes: | (1) | Penguin, Flint, Lab-Hoodoo and Calcite zones are included in the “PENG” model area; |
| | (2) | Gully, 3M, and QB are included in the “SHAM” model area; |
| | (3) | Break, Ridge, B-Mag, Fury, Fork and Peel are included in the “PEEL” model area; |
121
Geology and Grade Shell Modeling
Geology was modeled at Ketza by digitizing the major faults and geologic contacts on 10m east-west cross sections. The contacts modeled were between limestone and argillite units. No internal limestone units were modeled. The geologic units were triangulated in Vulcan as individual solids within fault blocks. The shape and orientation of these geologic units were used as a guide for the grade shell models.
Grade shells at a 0.5 g/t cutoff were digitized on 10m cross sections based upon lithology codes and gold assays, and modeled as wireframes in the Vulcan software. The cross sections were generally east-west but north-south sections were necessary in north Peel around the Break and Ridge zones. The grade shells in the Tarn, Penguin, Peel, and Knoll zones represent limestone hosted manto mineralized zones and lesser structurally-controlled chimney zones. The grade shells in the Gully and QB zones within the Shamrock area represent veins, stockworks, and disseminated styles of mineralization hosted in siliciclastic rocks.
A total of 110 individual grade shells were created: nine in the Tarn area, 28 in the Penguin area, 42 in the Peel area, and 31 in the Shamrock area. The areas are defined in Table 39 and in Figure 42. Six of the grade shells were not used in the block models as they are small and isolated and outside of the block model limits. Four of these shells are outside of Peel, one is west of Tarn and the last is east of QB. The locations of all of the shells and block models are shown in Figure 42. Representative cross-sections of chosen areas are shown in Figures 43 through 46.
122
Figure 42: Plan Map of Grade Shells and Block Models by Area
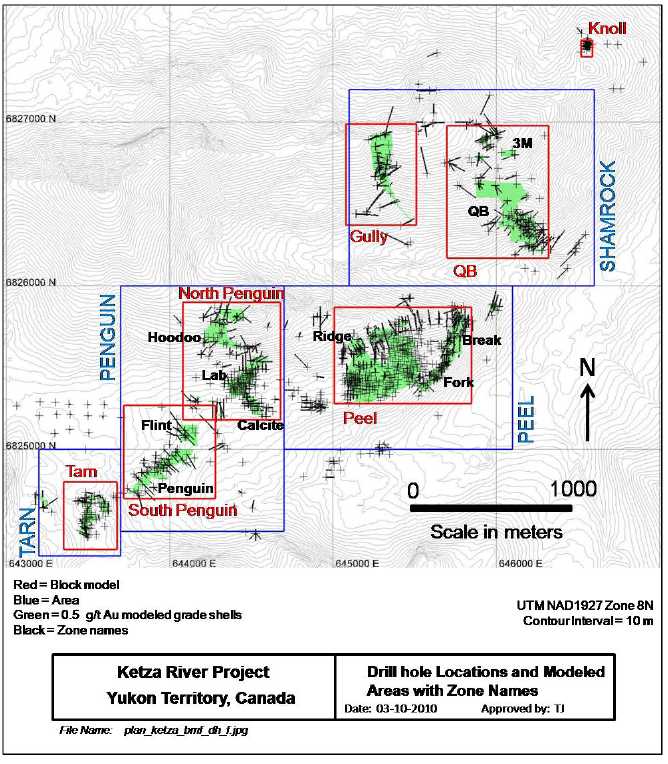
123
Figure 43: Cross Section of Peel Grade Shells and Drill Holes
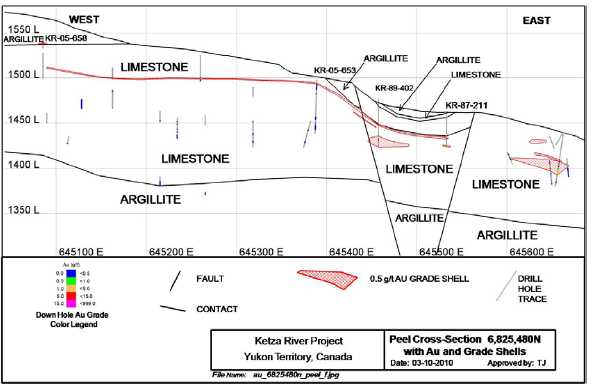
Figure 44: Cross Section of Peel Geology and Drill Holes
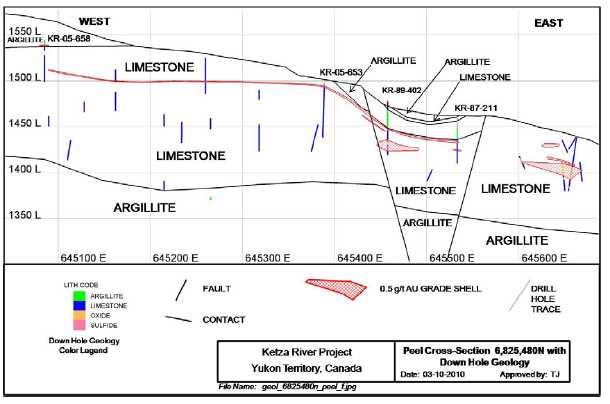
124
Figure 45: Cross Section of Gully Grade Shells and Drill Holes
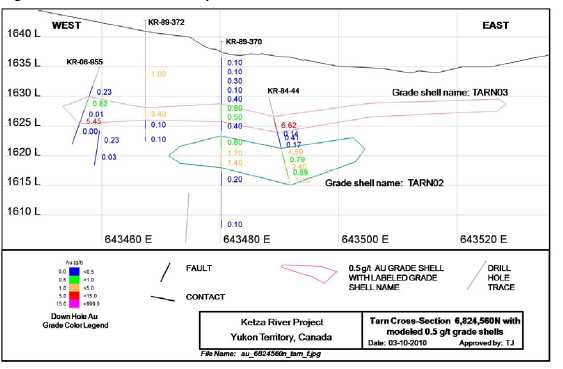
Figure 46: Cross Section of QB Grade Shells and Drill Holes
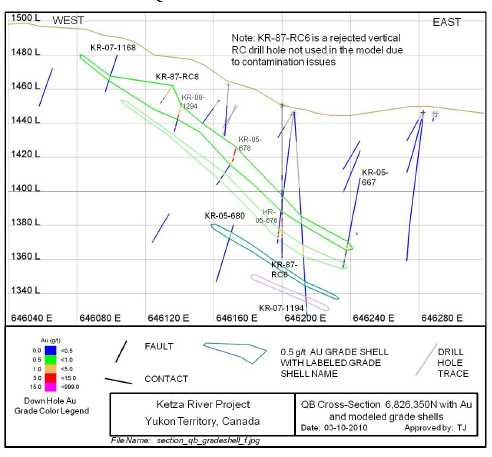
125
Mineral Resource Statement
The Ketza River open pit and underground resources are summarized in Table 40, and separated by oxide and sulfide REDOX ore types (as defined in Section 15.7 of the Ketza River Report) in Tables 41 and 42. The cutoff grade for open pit resources is 0.78 g/t Au for oxide ore and 1.00 g/t Au for sulfide ores for blocks contained inside the optimized pit, and 3.44 g/t Au for oxide and 4.43 g/t Au for sulfide ores for underground resources outside the optimized pit. The mineral resources tabulated below include Measured, Indicated and Inferred classifications as described in below.
A total of 41% of the measured and indicated recoverable resource ounces are hosted in oxide ores which have a gold recovery of 90%; whereas the other 59% of the measured and indicated recoverable, resource ounces are hosted in sulfide or mixed sulfide+oxide ores that generally have Au recoveries of 70 percent. The previous Year-End 2007 NI 43-101 report (SRK, 2008) did not quantify the amounts of oxide vs. sulfide ores.
Table 40: Ketza River Mineral Resource Statement (Oxide and Sulfide Combined)
| Area | Open Pit Resource | Underground Resource | Combined (OP+UG) |
| kt | g/t-Au | koz | kt | g/t-Au | koz | kt | g/t-Au | koz |
| Measured | | | | | | | | | |
| Peel | 85.2 | 5.76 | 15.8 | 3.7 | 8.41 | 1.0 | 88.9 | 5.87 | 16.8 |
| Penguin | 14.0 | 1.88 | 0.8 | 0.0 | 0.00 | 0.0 | 14.0 | 1.88 | 0.8 |
| Lab-Hoodoo | 9.4 | 6.92 | 2.1 | 0.0 | 0.00 | 0.0 | 9.4 | 6.92 | 2.1 |
| Tarn | 11.4 | 4.73 | 1.7 | 0.0 | 0.00 | 0.0 | 11.4 | 4.73 | 1.7 |
| Gully | 7.0 | 5.60 | 1.3 | 2.1 | 7.41 | 0.5 | 9.1 | 6.01 | 1.8 |
| QB | 23.4 | 4.55 | 3.4 | 0.4 | 3.81 | 0.0 | 23.8 | 4.47 | 3.4 |
| Knoll | 11.1 | 6.66 | 2.4 | 0.0 | 0.00 | 0.0 | 11.1 | 6.66 | 2.4 |
| Total Measured | 161.5 | 5.30 | 27.5 | 6.3 | 7.39 | 1.5 | 167.8 | 5.38 | 29.0 |
| | | | | | | | | | |
| Indicated | | | | | | | | | |
| Peel | 1,053.4 | 6.22 | 210.6 | 204.6 | 8.83 | 58.1 | 1,258.0 | 6.64 | 268.7 |
| Penguin | 233.6 | 2.89 | 21.7 | 0.0 | 0.00 | 0.0 | 233.6 | 2.89 | 21.7 |
| Lab-Hoodoo | 243.2 | 5.20 | 40.6 | 22.1 | 6.90 | 4.9 | 265.3 | 5.34 | 45.5 |
| Tarn | 79.3 | 3.88 | 9.9 | 0.0 | 0.00 | 0.0 | 79.3 | 3.88 | 9.9 |
| Gully | 45.1 | 3.57 | 5.2 | 14.7 | 8.04 | 3.8 | 59.8 | 4.67 | 9.0 |
| QB | 298.0 | 3.21 | 30.8 | 15.5 | 5.22 | 2.6 | 313.5 | 3.31 | 33.4 |
| Knoll | 2.9 | 4.54 | 0.4 | 0.0 | 0.00 | 0.0 | 2.9 | 4.54 | 0.4 |
| Total Indicated | 1,955.4 | 5.08 | 319.3 | 256.9 | 8.40 | 69.4 | 2,212.3 | 5.46 | 388.7 |
| | | | | | | | | | |
| Measured and Indicated | | | | | | | | | |
| Peel | 1,138.6 | 6.19 | 226.4 | 208.3 | 8.82 | 59.1 | 1,346.9 | 6.59 | 285.5 |
| Penguin | 247.6 | 2.84 | 22.6 | 0.0 | 0.00 | 0.0 | 247.6 | 2.84 | 22.6 |
| Lab-Hoodoo | 252.6 | 5.26 | 42.7 | 22.1 | 6.90 | 4.9 | 274.7 | 5.39 | 47.6 |
| Tarn | 90.7 | 3.99 | 11.6 | 0.0 | 0.00 | 0.0 | 90.7 | 3.99 | 11.6 |
| Gully | 52.1 | 3.85 | 6.4 | 16.9 | 7.91 | 4.3 | 69.0 | 4.84 | 10.7 |
| QB | 321.4 | 3.31 | 34.2 | 15.9 | 5.09 | 2.6 | 337.3 | 3.39 | 36.8 |
| Knoll | 14.0 | 6.22 | 2.8 | 0.0 | 0.00 | 0.0 | 14.0 | 6.22 | 2.8 |
| Total M&I | 2,116.9 | 5.09 | 346.8 | 263.2 | 8.38 | 70.9 | 2,380.1 | 5.46 | 417.7 |
| | | | | | | | | | |
| Inferred | | | | | | | | | |
| Peel | 195.2 | 5.30 | 33.2 | 24.2 | 6.55 | 5.1 | 219.4 | 5.43 | 38.3 |
| Penguin | 44.0 | 2.49 | 3.5 | 0.0 | 0.00 | 0.0 | 44.0 | 2.49 | 3.5 |
| Lab-Hoodoo | 37.5 | 4.38 | 5.3 | 10.1 | 5.54 | 1.8 | 47.6 | 4.62 | 7.1 |
| Tarn | 3.2 | 3.50 | 0.4 | 0.0 | 0.00 | 0.0 | 3.2 | 3.50 | 0.4 |
| Gully | 15.9 | 3.46 | 1.8 | 5.6 | 8.89 | 1.6 | 21.5 | 4.87 | 3.4 |
| QB | 113.5 | 3.80 | 13.9 | 4.4 | 5.66 | 0.8 | 117.9 | 3.87 | 14.7 |
126
Area | Open Pit Resource | Underground Resource | Combined (OP+UG) |
| kt | g/t-Au | koz | kt | g/t-Au | koz | kt | g/t-Au | koz |
| Knoll | 0.0 | 0.00 | 0.0 | 0.0 | 0.00 | 0.0 | 0.0 | 0.00 | 0.0 |
| Total Inferred | 409.4 | 4.41 | 58.0 | 44.3 | 6.56 | 9.3 | 453.7 | 4.62 | 67.3 |
| Notes: | (1) | The cutoff Au grade for oxide and sulfide ore inside the optimized open pit is 0.78 g/t and 1.00 g/t, respectively; whereas the cutoff Au grade for oxide and sulfide ore for material mineable by underground methods outside of the optimized open pit are 3.44 g/t and 4.43 g/t, respectively; |
| | (2) | Au price used for this resource estimate is US$1,150/troy oz; |
| | (3) | Assigned sulfide and oxide ore Au recoveries are 70 and 90 percent, respectively; |
| (4) | All materials in this table include all REDOX types (oxide, sulfide, and mixed “oxide+sulfide”) as defined in Section 15.3 of the Ketz a River Report; |
| (5) | Mining cost/t = $3.00 open pit and $80.00 underground; processing cost/t ore = $26.00; specific gravity variable as modeled per block; 18.4:1 (waste:ore) average strip ratio for all resources; 1,500 t ore/day mill feed; A Lerchs- Grossman pit optimization has been used to differentiate potential open pit resources from potential underground resources using mining costs, Au cutoff grades, and other parameters documented in the Ketza River Report; |
| (6) | This resource includes all drill holes completed in 2008 and does not include any drill holes completed in 2009 or 2010; This resource statement has an effective date of January 25, 2010. |
Table 41: Ketza River Mineral Resource Statement (Oxide Material Only)
| Area | Open Pit Resource | Underground Resource | Combined (OP+UG) |
| kt | g/t-Au | koz | kt | g/t-Au | koz | kt | g/t-Au | koz |
| Measured | | | | | | | | | |
| Peel | 43.4 | 5.52 | 7.7 | 3.3 | 7.16 | 0.8 | 46.7 | 5.67 | 8.52 |
| Penguin | 0.0 | 0.00 | 0.0 | 0.0 | 0.00 | 0.0 | 0.0 | 0.00 | 0.0 |
| Lab-Hoodoo | 0.9 | 4.55 | 0.1 | 0.0 | 0.00 | 0.0 | 0.9 | 4.55 | 0.1 |
| Tarn | 8.5 | 5.64 | 1.5 | 0.0 | 0.00 | 0.0 | 8.5 | 5,64 | 1.5 |
| Gully | 0.7 | 5.33 | 0.1 | 0.0 | 4.65 | 0.0 | 0.7 | 5.33 | 0.1 |
| QB | 18.0 | 2.70 | 1.6 | 0.3 | 3.63 | 0 | 18.3 | 2.65 | 1.6 |
| Knoll | 9.7 | 6.65 | 2.1 | 0.0 | 0.00 | 0.0 | 9.7 | 6.65 | 2.1 |
| Total Measured | 81.2 | 5.03 | 13.1 | 3.6 | 6.91 | 0.8 | 84.8 | 5.11 | 13.9 |
| | | | | | | | | | |
| Indicated | | | | | | | | | |
| Peel | 357.3 | 6.41 | 73.6 | 168.1 | 8.85 | 47.8 | 525.4 | 7.19 | 121.4 |
| Penguin | 4.4 | 2.95 | 0.4 | 0.0 | 0.00 | 0.0 | 4.4 | 2.95 | 0.4 |
| Lab-Hoodoo | 48.0 | 3.15 | 4.9 | 6.8 | 5.99 | 1.3 | 54.8 | 3.50 | 6.2 |
| Tarn | 47.6 | 4.07 | 6.2 | 0.0 | 0.00 | 0.0 | 47.6 | 4.07 | 6.2 |
| Gully | 11.4 | 3.50 | 1.3 | 3.3 | 4.38 | 0.5 | 14.7 | 3.77 | 1,8 |
| QB | 209.5 | 2.81 | 19.0 | 8.8 | 4.82 | 1.4 | 218.3 | 2.90 | 20.4 |
| Knoll | 2.2 | 4.51 | 0.3 | 0.0 | 0.00 | 0.0 | 2.2 | 4.51 | 0.3 |
| Total Indicated | 680.5 | 4.83 | 105.7 | 186.9 | 8.47 | 50.9 | 867.4 | 5.62 | 156.6 |
| | | | | | | | | | |
| Measured and Indicated | | | | | | | | | |
| Peel | 400.8 | 6.31 | 81.4 | 171.4 | 8.81 | 48.6 | 572.2 | 7.06 | 130.0 |
| Penguin | 4.4 | 2.95 | 0.4 | 0.0 | 0.00 | 0.0 | 4.4 | 2.95 | 0.4 |
| Lab-Hoodoo | 48.9 | 3.18 | 5.0 | 6.8 | 5.99 | 1.3 | 55.7 | 3.52 | 6.3 |
| Tarn | 56.1 | 4.31 | 7.8 | 0.0 | 0.00 | 0.0 | 56.1 | 4.31 | 7.8 |
| Gully | 12.1 | 3.60 | 1.4 | 3.3 | 4.38 | 0.5 | 15.4 | 3.84 | 1.9 |
| QB | 227.5 | 2.80 | 20.5 | 9.1 | 4.79 | 1.4 | 236.6 | 2.88 | 21.9 |
| Knoll | 12.0 | 6.25 | 2.4 | 0.0 | 0.00 | 0.0 | 12.0 | 6.25 | 2.4 |
| Total M&I | 761.7 | 4.85 | 118.9 | 190.5 | 8.45 | 51.7 | 952.2 | 5.57 | 170.6 |
| | | | | | | | | | |
| Inferred | | | | | | | | | |
| Peel | 51.4 | 5.88 | 9.7 | 14.7 | 6.16 | 2.9 | 66.1 | 5.94 | 12.6 |
| Penguin | 2.4 | 2.09 | 0.2 | 0.0 | 0.00 | 0.0 | 2.4 | 2.09 | 0.2 |
| Lab-Hoodoo | 31.1 | 4.57 | 4.6 | 8.5 | 4.89 | 1.3 | 39.6 | 4.61 | 5.9 |
| Tarn | 3.0 | 3.58 | 0.4 | 0.0 | 0.00 | 0.0 | 3.0 | 3.58 | 0.4 |
127
| Area | Open Pit Resource | Underground Resource | Combined (OP+UG) |
| kt | g/t-Au | koz | kt | g/t-Au | koz | kt | g/t-Au | koz |
| Gully | 2.2 | 2.18 | 0.2 | 0.3 | 5.39 | 0.0 | 2.5 | 1.91 | 0.2 |
| QB | 83.1 | 3.32 | 8.9 | 2.5 | 5.11 | 0.4 | 85.6 | 3.37 | 9.3 |
| Knoll | 0.0 | 0.00 | 0.0 | 0.0 | 0.00 | 0.0 | 0.0 | 0.00 | 0.0 |
| Total Inferred | 173.1 | 4.28 | 23.8 | 25.9 | 5.64 | 4.7 | 199.0 | 4.46 | 28.5 |
| Notes: | (1) | the Au cutoff grade for oxide ore within the optimized pit is 0.78 g/t; whereas the Au cutoff grade for underground oxide ore outside of the optimized open pit is 3.44 g/t; |
| (2) | Material included in this table consists of oxide and unaltered REDOX types as defined in Section 15.3 of the Ketza River Report. |
| | (3) | These resources have an effective date of January 25, 2010. |
Table 42: Ketza River Mineral Resource Statement (Sulfide and Mixed Materials Only)
| Area | Open Pit Resource | Underground Resource | Combined (OP+UG) |
| kt | g/t-Au | koz | kt | g/t-Au | koz | kt | g/t-Au | koz |
| Measured | | | | | | | | | |
| Peel | 41.8 | 6.00 | 8.1 | 0.4 | 13.01 | 0.2 | 42.2 | 6.09 | 8.3 |
| Penguin | 14.0 | 1.88 | 0.8 | 0.0 | 0.00 | 0.0 | 14.0 | 1.88 | 0.8 |
| Lab-Hoodoo | 8.5 | 7.18 | 2.0 | 0.0 | 0.00 | 0.0 | 8.5 | 7.18 | 2.0 |
| Tarn | 2.9 | 2.09 | 0.2 | 0.0 | 0.00 | 0.0 | 2.9 | 2.09 | 0.2 |
| Gully | 6.3 | 5.63 | 1.2 | 2.1 | 7.45 | 0.5 | 8.4 | 6.07 | 1.7 |
| QB | 5.4 | 10.71 | 1.9 | 0.1 | 4.33 | 0.0 | 5.5 | 10.51 | 1.9 |
| Knoll | 1.3 | 6.75 | 0.3 | 0.0 | 0.00 | 0.0 | 1.3 | 6.75 | 0.3 |
| Total Measured | 80.2 | 5.57 | 14.36 | 2.7 | 8.04 | 0.7 | 82.9 | 5.65 | 15.1 |
| | | | | | | | | | |
| Indicated | | | | | | | | | |
| Peel | 696.0 | 6.12 | 137.0 | 36.5 | 8.78 | 10.3 | 732.5 | 6.25 | 147.3 |
| Penguin | 229.2 | 2.89 | 21.3 | 0.0 | 0.00 | 0.0 | 229.2 | 2.89 | 21.3 |
| Lab-Hoodoo | 195.2 | 5.70 | 35.8 | 15.3 | 7.39 | 3.6 | 210.5 | 5.82 | 39.4 |
| Tarn | 31.7 | 3.59 | 3.7 | 0.0 | 0.00 | 0.0 | 31.7 | 3.59 | 3.7 |
| Gully | 33.7 | 3.60 | 3.9 | 11.4 | 8.95 | 3.3 | 45.1 | 4.97 | 7.2 |
| QB | 88.4 | 4.15 | 11.8 | 6.7 | 5.64 | 1.2 | 95.1 | 4.25 | 13.0 |
| Knoll | 0.7 | 4.63 | 0.10 | 0.0 | 0.00 | 0.0 | 0.7 | 4.63 | 0.1 |
| Total Indicated | 1,275.0 | 5.21 | 213.6 | 70.0 | 8.20 | 18.5 | 1,345.0 | 5.37 | 232.1 |
| | | | | | | | | | |
| Measured and Indicated | | | | | | | | | |
| Peel | 737.8 | 6.12 | 145.1 | 36.9 | 8.82 | 10.5 | 774.7 | 6.25 | 155.6 |
| Penguin | 243.2 | 2.83 | 22.2 | 0.0 | 0.00 | 0.0 | 243.2 | 2.83 | 22.2 |
| Lab-Hoodoo | 203.7 | 5.76 | 37.7 | 15.3 | 7.39 | 3.6 | 219.0 | 5.87 | 41.3 |
| Tarn | 34.6 | 3.47 | 3.9 | 0.0 | 0.00 | 0.0 | 34.6 | 3.47 | 3.9 |
| Gully | 40.1 | 3.92 | 5.1 | 13.6 | 8.71 | 3.8 | 53.7 | 5.13 | 8.9 |
| QB | 93.9 | 4.53 | 13.7 | 6.8 | 5.62 | 1.2 | 100.7 | 4.60 | 14.9 |
| Knoll | 2.0 | 6.02 | 0.4 | 0.0 | 0.00 | 0.0 | 2.0 | 6.02 | 0.4 |
| Total M&I | 1,355.2 | 5.23 | 227.9 | 72.7 | 8.2 | 19.2 | 1,427.9 | 5.38 | 247.1 |
| | | | | | | | | | |
| Inferred | | | | | | | | | |
| Peel | 143.9 | 5.09 | 23.5 | 9.5 | 7.06 | 2.2 | 153.4 | 5.22 | 25.7 |
| Penguin | 41.6 | 2.52 | 3.4 | 0.0 | 0.00 | 0.0 | 41.6 | 2.52 | 3.4 |
| Lab-Hoodoo | 6.4 | 3.42 | 0.7 | 1.6 | 9.99 | 0.5 | 8.0 | 4.67 | 1.2 |
| Tarn | 0.2 | 2.01 | 0.0 | 0.0 | 0.00 | 0.0 | 0.2 | 2.01 | 0.0 |
| Gully | 13.8 | 3.66 | 1.6 | 5.3 | 9.36 | 1.6 | 19.1 | 5.25 | 3.2 |
| QB | 30.4 | 5.12 | 5.0 | 1.9 | 5.83 | 0.4 | 32.3 | 5.20 | 5.4 |
| Knoll | 0.0 | 0.00 | 0.0 | 0.0 | 0.00 | 0.0 | 0.0 | 0.00 | 0.0 |
| Total Inferred | 236.2 | 4.51 | 34.2 | 18.4 | 7.86 | 4.6 | 254.6 | 4.74 | 38.8 |
Notes: | (1) | the Au cutoff grade for sulfide ore within the optimized pit is 1.00 g/t; whereas the Au cutoff grade for underground oxide ore outside of the optimized open pit is 4.43 g/t; |
128
| | (2) | Material included in this table consists of transulfide (mixed oxide + sulfide), sulfide, and hisulfide REDOX types as defined in Section 15.3 of the Ketza River Report; |
| | (3) | These resources have an effective date of January 25, 2010. |
Mineral Resource Sensitivity
A grade tonnage curve (Figure 47) was calculated at 0.5 g/t cutoff increments for the Measured and Indicated mineral inventory after depletion.
Figure 47: Grade Tonnage Curve
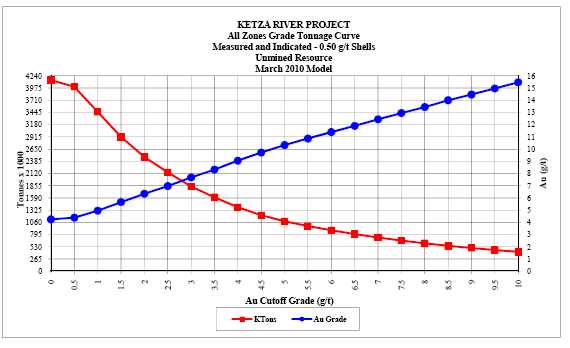
As an upside sensitivity case, a US$1,300 per troy oz Au price was determined for the open pit resource to support the YESAB Project Proposal and in order to define the maximum environmental impact to the project. The total open pit resource at the $1,300 Au price includes:
- A measured resource of 166.1ktonnes averaging 5.17g/t Au totaling 27.6koz;
- An indicated resource of 2,018.2ktonnes averaging 4.95 g/t Au totaling 321.4 koz; and
- An Inferred resource of 414.8ktonnes averaging 4.37 g/t Au totaling 58.2koz.
The Au cutoff grades for oxide and sulfide ores inside the optimized open pit for this case are 0.735 g/t and 0.833 g/t, respectively.
Mining Operations
There are no mining operations conducted on the Ketza River Property.
129
Exploration and Development
Issues relating to QA/QC data including standards, blanks, possible sample preparation problems, and assay performance have been addressed in the preceding sections. All historic drill hole data from 1984 to 1997 have been audited and corrected in the master acQuire drill hole database as part of this study.
Although older drill holes previous to 1998 were not surveyed and do not have well-documented QA/QC protocols, the newer drilling from 2005 to the present contain drill holes that have been surveyed and have well documented QA/QC protocols. These newer drill holes have been completed throughout the existing resource areas in order to verify the older data. Some additional drilling may be warranted in a few of the resource areas as part of a feasibility level study again to help validate the older drill hole data.
Additional drilling may be warranted at the QB zone, the upper Hoodoo zone, and the Flint zone. Some of the shallower well drilled zones have enough reliable information to qualify for measured status; however, for the purposes if this resource estimate, the bulk of the estimated mineralized material has been classified within the indicated category.
Exploration Conclusions
Results in the Hoodoo Zone are promising and further drilling will help to define additional indicated resources and the final boundaries to the 0.5 g/t Au mineralization. Several other deposits need additional drilling to convert inferred resources to indicated (e.g. Peel, QB, and Lab-Hoodoo). A couple deposits remain open down dip or along strike, and further step out drilling is likely to add resources (e.g. Gully and Hoodoo Zones). Exploration drilling in the Gully Zone area at depth should only proceed if underground mining on these potentially deep vein ores can be proven to be economical.
Drilling of magnetic highs has been successful in Penguin and Lab and other resource areas and should be continued on other targets throughout the claim block. There are a number of undrilled gold targets remaining on the property that should be pursued with geophysics, soil and/or rock-chip sampling, and drilling in order to help increase the resource base and add value to the proposed mining project.
Resource Estimation
The current Ketza River resource estimation uses additional drilling completed in 2008 (225 more drill holes than the previous NI 43-101 report published by SRK in 2008), additional total oxide and total sulfide logged mineral data from early drill holes, audited historical drill hole assay data from 1984 to 1997, additional specific gravity data, a new geologic model, and new block models. In addition, this current resource estimate used a higher Au price, a higher processing cost, a higher open-pit mining cost, and a higher overall stripping ratio relative to the previous model.
A total of 41% of the measured and indicated recoverable resource ounces are hosted in oxide ores which have a gold recovery of 90%; whereas the other 59% of the measured and indicated recoverable, resource ounces are hosted in sulfide or mixed sulfide+oxide ores that generally have Au recoveries of 70 percent. The previous Year-End 2007 NI 43-101 report (SRK, 2008) did not quantify the amounts of oxide vs. sulfide ores.
As a result of this new work, the current resource estimate is lower in contained tonnages and contained ounces relative to the previous NI 43-101 resource estimation (SRK, 2008).
Compared to the last reported resource estimate for Ketza River (SRK, 2008):
- the current measured resource estimate represents: a decrease of 544.4 ktonnes from a previously estimated 712.2 ktonnes;
130
- the current indicated resource estimate represents: a decrease of 1,157,2 ktonnes from a previously estimated 3,369.5 ktonnes;
- the current measured resource estimate represents a decrease of 117.5 koz of recoverable gold from a previously estimated 146.5 koz;
- the current indicated resource estimate represents a decrease of 111.2 koz of recoverable gold from a previously estimated 499.9 koz;
- The current measured resource estimate contains an average Au grade of 5.38 g/t which is lower than the previously estimated Au grade of 6.40 g/t Au;
- The current indicated resource estimate contains an estimated average Au grade of 5.46 g/t which is higher than the previously estimated Au grade of 4.61 g/t Au;
Based on cross-section review of grade shells in the current model vs. the last model, it is clear that the current model incorporates smaller grade shell shapes relative to the previous SRK 2008 model that more accurately honors a 0.5 g/t Au cutoff, which explains the decreased tonnage difference between the two resource estimations. Because of not allowing external waste dilution into our grade shell shapes, and limiting internal waste dilution in our grade shells to the best of our ability, the overall average indicated Au grade in the current model generally increased.
The current resource model utilizes more detailed and more complete specific gravity data within the database relative to the previous model. In addition, the specific gravity values in this current resource were calculated, assigned, and ultimately estimated into the blocks using a different methodology than the previous NI 43-101 resource estimate. Since there were so many significant changes to the modeling parameters and drill hole data in the current model (i.e. different grade shell shapes and sizes; historical drill hole data capture; different ore classification scripts; additional SG data; additional 2008 drill hole data; different estimation methodology; and different mining parameters, mining costs, and economics), the specific impact of the new specific gravity derivations to the total tonnage of the current resource is unknown.
The current resource model is more realistic and defendable in comparison to all previous resource estimates. The current model, which used additional 2008 drill hole data and tighter grade shells modeled at a rigid 0.5 g/t Au grade cutoff, has resulted in a better local resource estimate for the Au grade and specific gravity, but globally did not increase the overall contained ounces. The current model compares better than all previous models with the oxide mining done by Canamax with regards to depletion of the predicted oxide blocks, and with regards to the overall total mined tonnes and total produced ounces. The inferred classification of potential ore material in the current resource estimate was included in order to maximize the footprint of the Lerchs-Grossman pit shells for permitting purposes.
Other Relevant Information
YNG submitted the Yukon Environmental and Socio-Economic Assessment Board (YESAB) Application in late September 2011.
Exploration is continuing at the property in 2011. Additional exploration at the property is warranted based on review of the existing drill hole results and because of the large property size that includes additional favorable areas for manto and vein-stockwork mineralization.
(c) Silver Valley Property, Yukon
The Company was granted an option to acquire a 100% interest in six claims located in the Yukon Territory. The primary focus of exploration for this property will be silver, with a secondary focus on gold, lead and zinc. The Company has staked or acquired 143 additional quartz claims and leases around the original six claims, and these are registered in the name of the Company. As of year-end 2011, there are a total of 149 quartz claims and quartz leases (Figure 48) that comprise the Silver Valley Project all of which are owned 100% by KRH. There are a total of 4 quartz leases in the Silver Valley property that comprise 202 acres.
131
Figure 48. Silver Valley Claim Map
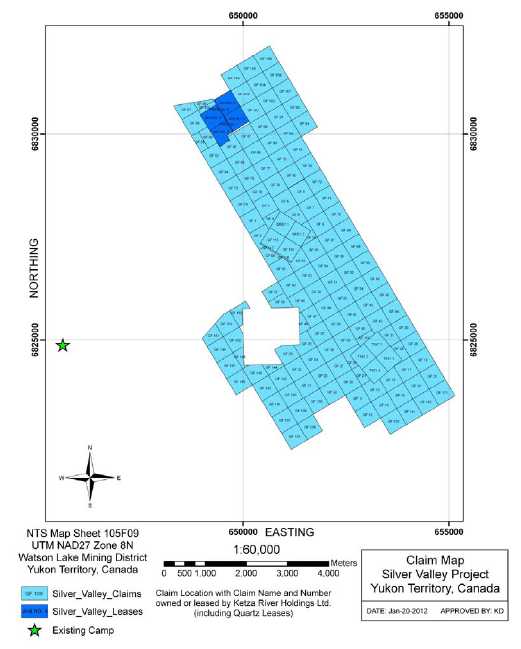
Exploration Drilling
Diamond drilling totalling 75 holes in 11,163 m has been conducted at the Silver Valley project in 2006, 2007, 2009 and during January of 2010 by KRH. The Silver Valley Property consists mostly of Ag-Pb-Au±Cu±Zn veins and is located approximately 1 kilometre east of the main Ketza River gold project. The K18B mine is a past producer of Ag and Pb and minor Au that operated from 1965 to 1969 (including exploration work) by Stump Mines Ltd. and later again for a brief time in 1980 and 1981 by Iona Silver Mines Ltd. Development work at the K18B vein was reportedly stopped in 1981 when a fire destroyed the compressor shack.
132
A total of seven drill holes were completed in 2010 which tested two horizontal-loop E-M geophysical anomalies that were identified during the 2007 field season. No drilling was performed at Silver Valley in 2011.
Table 43. 2006-2011 Silver Valley Drilling Summary.
| Year | Drill Holes Completed | Total Meters | Total Footage |
| K-18B South | | | |
| 2006 | 4 | 1.014.7 | 3,328.2 |
| 2007 | 58 | 8,903.5 | 29,203.3 |
| 2008 | 0 | 0 | 0 |
| 2010 | 7 | 1,244.8 | 4,082.9 |
| 2011 | 0 | 0 | 0 |
| Total | 75 | 11,163.0 | 36,614.4 |
Drilling
Drilling at the Silver Valley Project in 2010 focused on the River’s Edge and K18B South targets. The QA/QC procedures used for the Silver Valley Project were similar to those used for the 2008 Ketza River drilling program described previously; a couple different certified standards containing Pb, Zn, and Ag were used for the Silver Valley assay programs. The same Ketza River geological staff and camp support have been used to conduct the exploration and drilling work at the Silver Valley Project.
Five drill holes were completed at the River’s Edge target which identified three sub-parallel quartz-siderite-pyrite veins with minor amounts of galena and tetrahedrite. The highlight was SV-10-70 which intercepted 0.9 meters grading 5.25 g/t Au, 27.7 g/t Ag and 0.16% Cu.
Two drill holes were also completed on the north end of the K-18B South target. This target may be a fault-offset of the K-18B Vein which was the focus of drilling in 2007. The two drill holes intersected two pyrite-dominant veins approximately 3 meters in width. Galena, sphalerite, tetrahedrite and stibnite were also present in these vein zones. The best intercept came from drill hole SV-10-75 which intersected 1.39 meters that assayed 103 g/t Ag, 0.4% Pb, 0.28 g/t Au, and 0.2% Cu.
Trenching and Reclamation
During the 2008 field season, a total of 557 meters of trenches were excavated for exploration purposes using a track-mounted excavator. These trenches were sampled and later re-contoured late in the 2010 field season.
(d) Other Properties
Bay Property, Yukon – The Company has staked 36 claims near Watson Lake, Yukon. The primary focus of exploration for this property will be silver.
Silver Bar, Arizona -The Company has a 100% interest in 55 claims in Pinal County, Arizona. The focus of exploration of this property will be gold and copper. In 2010 the Company reduced the carrying value to a nominal amount as management has no current plans to conduct exploration t this property.
Greenwood properties -The Company owns a 75% interest in 31 claims in the Greenwood Mining District in south-east British Columbia. These claims are subject to a 2% net smelter returns royalty. The remaining 25% interest in this gold property is owned by Intrepid Minerals Corporation. This property was written down to a nominal amount in the 2007.
133
ITEM 5: DIVIDENDS AND DISTRIBUTIONS
To date, the Company has not paid any cash dividends or distributions on its securities. The Company does not have any restriction that could prevent it from paying dividends or distributions and has no dividend or distribution policy.
ITEM 6: DESCRIPTION OF CAPITAL STRUCTURE
The Company is authorized to issue an unlimited number of shares without par value (the “Shares”). 931,479,031 Shares are issued and outstanding as at March 29, 2012. The Company also has 94,914,372 Share Purchase Warrants (the “Warrants”) issued and outstanding. Each warrant, when exercised, will entitle the holder to purchase one common share of the Company at a price of between $0.43 and $3.00 per share (the latter of which expire on or before June 20, 2012.
Holders of Shares of the Company shall be entitled to notice of, to attend and vote at any meeting of the shareholders of the Company and to one vote per share on a ballot. Shareholders will be entitled to receive dividends as and when declared by the Board of Directors of the Company as a class, subject to prior satisfaction of all preferential rights to dividends attached to all shares of other classes of shares ranking in priority to the Company’s Shares in respect of dividends. Shareholders shall be entitled in the event of any liquidation, dissolution or winding-up of the Company, whether voluntary or involuntary, or any other distribution of the assets among its shareholder for the purpose of winding-up its affairs, and subject to prior satisfaction of all preferential rights to return of capital upon dissolution attached to all shares of other classes of shares ranking in priority to Shares in respect of return of capital on dissolution, to share rateably, together with the holders of shares of any class of shares ranking equally in respect of return of capital, in such assets of the Company as are available for distribution.
ITEM 7: MARKET FOR SECURITIES
7.1 Trading Price and Volume
The following table sets out the market price range and trading volume of the Shares on the Exchange under the symbolYNGfor the periods indicated:
| Period | High ($) | Low ($) | Volume |
| 2011 January | 0.86 | 0.58 | 21,336,954 |
| February | 0.83 | 0.64 | 13,807,288 |
| March | 0.79 | 0.65 | 12,067,047 |
| April | 0.70 | 0.54 | 15,729,695 |
| May | 0.58 | 0.36 | 15,893,539 |
| June | 0.495 | 0.35 | 6,243,810 |
| July | 0.52 | 0.415 | 9,768,282 |
| August | 0.56 | 0.415 | 12,074,324 |
| September | 0.50 | 0.285 | 25,554,818 |
| October | 0.42 | 0.28 | 8,173,482 |
| November | 0.38 | 0.28 | 9,068,878 |
| December | 0.36 | 0.24 | 15,892,805 |
134
| Period | High ($) | Low ($) | Volume |
| 2012January | 0.315 | 0.23 | 28,471,073 |
| February | 0.475 | 0.28 | 25,019,487 |
| Week ending March 2 | 0.40 | 0.35 | 1,401,433 |
| Week ending March 9 | 0.385 | 0.325 | 2,542,917 |
| Week ending March 16 | 0.385 | 0.32 | 2,167,733 |
| Week ending March 23 | 0.345 | 0.305 | 1,852,533 |
The Company also has 21,175,932 warrants issued and outstanding which, commencing November 7, 2007, traded on the Exchange under the symbolYNG.WT. The Warrants expire on June 20, 2012.
| Period | High ($) | Low ($) | Volume |
| 2011January | 0.145 | 0.13 | 3,000 |
| February | 0.145 | 0.08 | 112,100 |
| March | 0.14 | 0.10 | 74,800 |
| April | 0.05 | 0.01 | 6,192,200 |
| May | 0.02 | 0.005 | 7,605,750 |
| June | 0.02 | 0.01 | 28,000 |
| July | 0.02 | 0.015 | 28,400 |
| August | 0.02 | 0.01 | 508,500 |
| September | 0.02 | 0.01 | 598,000 |
| October | 0.02 | 0.005 | 100,000 |
| November | 0.015 | 0.01 | 224,900 |
| December | 0.01 | 0.01 | 140,000 |
| 2012January | 0.01 | 0.005 | 55,000 |
| February | 0.01 | 0.005 | 1,461,000 |
| Week ending March 2 | N/A | N/A | N/A |
| Week ending March 9 | 0.01 | 0.01 | 100,000 |
| Week ending March 16 | 0.01 | 0.01 | 5,500 |
| Week ending March 23 | N/A | N/A | N/A |
ITEM 8: | ESCROWED SECURITIES ANDSECURITIESSUBJECTTOCONTRACTUALRESTRICTION ON TRANSFER |
As at December 31, 2011 no Shares of the Company were subject to escrow restrictions.
ITEM 9: DIRECTORS AND OFFICERS
9.1 Name, Occupation and Security Holding
Name of Director/Executive
Officer, Province or State and
Country of Residence |
Principal Occupation during the past five
years |
Current Position and Date of
Appointment |
Robert F. Baldock(1)(3) (4) (5) (6) (7)
British Columbia, Canada | President and CEO of the Company; President and CEO of Monument Mining Limited; June 2005 to date. | President and Chief Executive Officer since May 21, 2009 and Director since April 12, 2009 |
135
Name of Director/Executive
Officer, Province or State and
Country of Residence |
Principal Occupation during the past five
years |
Current Position and Date of
Appointment |
Graham Dickson(5) (6)
British Columbia, Canada | President of Celec Inc., June 1993 to date. | Senior Vice President of Acquisitions and Corporate Development since June 27, 2011; Director since April 17, 1997. |
Francois Marland(6)
Switzerland | Lawyer until 2010. | Director and Vice Chairman since July 2, 2010 |
Symeon Solomonidis(5)
Switzerland | Independent Consultant since 2008; Director of Software for Hewlett Packard from 1976 to 2008. | Director since August 1, 2009 |
Jean-Edgar de Trentinian
Switzerland | President and CEO of Orifer SA.; Director of Carrefour SA from 1993 to 2008. | Director since August 1, 2009 |
Jay W. Schnyder(1)(2)
Switzerland | A member of the management committee (Head of Refining) of MKS Finance SA, | Director since May 13, 2010 |
Pierre Besuchet(3)
Switzerland | Director the Faisal Private Bank (Switzerland) and the Indufina Industrielle et Finance Holding (Switzerland) and is a director of the following North American Companies: W2 Energy Inc. and Solar Energy Initiatives, Inc. | Director since May 13, 2010 |
Gerald B. Ruth(1)(2) (3) (4) (5) (7)
Ontario, Canada | CEO of Gersan Capital Corp. and a Director of Eagle Hill Exploration Corp.; an independent corporate finance consultant since 2003 | Director since May 13, 2010 |
John Greenslade(2) (4) (5)
British Columbia, Canada | President of Baja Mining Corp. since April 20, 2004, President of Catalyst Copper Corp. (a mineral exploration company). | Director and Chairman since May 13, 2010 |
Shaun Heinrichs(7)
British Columbia, Canada | CFO of the Company since November 2008, controller of the Company since January 2008; Senior Manager, Finance at BC Hydro & Power Authority from February 2007 to February 2008; International Accounting Manager at PMC Sierra from July 2006 to February 2007. | Chief Financial Officer from November 21, 2008 to date |
Graham Scott
British Columbia, Canada | Lawyer; Principal, Vector Corporate Finance Lawyers from July 1, 2001 to date. | Secretary since May 19, 2005 |
Todd Johnson
British Columbia, Canada | Vice President of the Company since April 2010; independent consultant from December 2006 to March 2010. | Vice President of Exploration since April 1, 2010 |
Randy Reichert
British Columbia, Canada | Chief Operating Officer of the Company since June 27, 2011; President and COO for Colossus Minerals Inc. from 2009 to June 2011; COO of Oriel Resources plc (2008 to 2009) and Orsu Metals Corp. (2007 to 2008); General Manager of Kinross Gold Corporation (2006 to 2007). | Chief Operating Officer since June 27, 2011 |
| (1) | Member of the Audit Committee |
| (2) | Member of the Compensation Committee |
136
| (3) | Member of the Corporate Governance Committee |
| (4) | Member of the Special Committee |
| (5) | Member of the Disclosure Committee (Corporate Disclosure Policy) |
| (6) | Member of the Strategic Committee |
| (7) | Member of the Audit Sub-Committee (Financial Disclosure) |
The directors are elected at the Annual General Meeting for a period of one year. The Company’s next Annual General Meeting is scheduled to be held on May 22, 2012 and it is anticipated that all of the above directors will be nominated for re-election. Officers of the Company are appointed by the Board of Directors.
As of March 29, 2012, 281,923,500 Shares of the Company are beneficially owned, or controlled or directed, directly or indirectly by the directors and executive officers, as a group, representing 30.27% of the issued and outstanding voting securities (931,479,031 Shares).
9.2 Cease Trade Orders, Bankruptcies, Penalties or Sanctions
Other than as set out below, during the 10 years prior to the date of this AIF, none of the directors or executive officers of the Company or a shareholder holding a sufficient number of securities of the Company to affect materially the control of the Company, has been a director or officer of any other Company that, while that person was acting in that capacity:
| (a) | was the subject of an order that was issued while the director or executive officer was acting in the capacity as director, chief executive officer or chief financial officer, or |
| | |
| (b) | was subject to an event that was issued after the director or executive officer ceased to be a director, chief executive officer or chief financial officer and which resulted from an event that occurred while that person was acting in the capacity as director, chief executive officer or chief financial officer. |
Mr. Greenslade is a director of Minterra Resource Corp. (“Minterra”). On April 30, 2009, Minterra received notice from the TSX Venture Exchange (“TSX-V”) that it was being halted from trading as it had less than three directors. All directors and officers, other than John Greenslade, resigned prior to April 30, 2009. John Greenslade remained as a director and officer to attempt to re-structure Minterra for the benefit of its shareholders. On May 11, 2009, Minterra was cease traded by the BC Securities Commission for failure to file financial statements, associated Certificates of Disclosure, and fees. The cease trade order remains in effect. Minterra is currently without financial resources. It recently held a shareholders’ meeting and received approval to consolidate its issued capital as a first step in re-organization to reactivate. Its ability to reactivate will be subject to making satisfactory arrangements with existing creditors and completing share for debt settlements and an equity issue. Further to the cease trade on May 11, 2009, Minterra also received a notice to de-list from the TSX-V on July 3, 2009 and Minterra’s TSX-V listing was transferred to NEX on August 11, 2009. Mr. Greenslade was and currently remains a director of Trigon Uranium Corp. (“Trigon”) (now called IC Potash Corp.), and was advised by the President of Trigon that on August 28. 2007, a document was received by Trigon from the Pennsylvania Securities Commission in regard to a purported cold call to at least one Pennsylvania resident and the offer for sale of units of Trigon by a representative of Coal Harbor Communications (“CHC”) in Vancouver, Canada. In the document from the Pennsylvania Securities Commission, it was stated that: “It is ordered that the Respondents Trigon and CHC, and every successor, affiliate, control person, agent, servant and employee of each of them, and every entity owned, operated, or indirectly or directly controlled or hereinafter organized by or on behalf of them, shall immediately cease and desist from offering and selling the units in the Commonwealth of Pennsylvania, in violation of the 1972 Act, and in particular Section 201 thereof.” Subsequently, discussions were carried out between Trigon and the Pennsylvania Securities Commission with the assistance of the US attorneys of Trigon. Dale Paruk, provided a declaration before the Commonwealth of Pennsylvania where he stated that he was the owner and principal of CHC, that CHC had never been designated or acted as an agent of Trigon, that CHC had been specifically told that no contacts could be made to investors in the United States regarding Trigon’s equity issue by him or any of his associates, that Trigon could only consider offers to purchase its securities from US investors if there were substantial prior
137
relationships or if the potential investors were qualified under US Securities Laws, that he was expressly told not to make cold calls to US residents about Trigon, and the he understood that a “rogue employee” of CHC had made such a call and that as a result that employee had been terminated. On June 24, 2008, the allegations of the Pennsylvania Securities Commission were settled as follows: 1) There was no admission of guilt or denial of the allegations; 2) the Summary Order to Cease and Desist issued on August 28, 2007 was rescinded; 3) Trigon paid investigative and legal costs; and 4) Trigon paid an administrative assessment.
During the 10 years prior to the date hereof, no director or executive officer of the Company, or a shareholder holding sufficient securities of the Company to affect materially the control of the Company has become bankrupt, made a proposal under any legislation relating to bankruptcy or insolvency, or been subject to or instituted any proceedings, arrangement or compromise with creditors, or had a receiver, receiver manager or trustee appointed to hold the assets of the director, executive officer or shareholder.
The foregoing information, not being within the knowledge of the Company, has been furnished by the respective directors, officers and shareholders holding a sufficient number of securities of the Company to materially control the Company.
Subsequent to January 1, 2012, no director or executive officer of the Company or a shareholder holding a sufficient number of securities of the Company to affect materially the control of the Company, is or has been subject to:
| (a) | any penalties or sanctions imposed by a court relating to securities legislation or by a securities regulatory authority or has entered into a settlement agreement with a securities regulatory authority; or |
| | |
| (b) | any other penalties or sanctions imposed by a court or regulatory body that would be likely to be considered important to a reasonable investor making an investment decision. |
9.3 Conflicts of Interest
The Company has adopted, in accordance with Appendix M of the Company’s Corporate Governance Manual, a code of conduct and conflict of interest guidelines for directors and officers including disclosure requirements.
ITEM 10: PROMOTERS
Under the definition of “promoter” contained in Section 1 of theSecurities Act (British Columbia), other than the directors and officers of the Company, management is not aware of any person or company who could be characterized as a promoter of the Company or a subsidiary of the Company within the two most recently completed financial years or during the current financial year.
ITEM 11: LEGAL PROCEEDINGS
The Company is not aware of any legal proceeding or regulatory actions to which the Company is or is likely to be a party other than as disclosued in the Company’s annual audited financial statements.
ITEM 12: INTEREST OF MANAGEMENT AND OTHERS IN MATERIAL TRANSACTIONS
Each of the following directors and senior officers has an interest in the Company’s Stock Option Plan which was approved by the Company’s shareholders on May 13, 2010:
138
Name of Optionee | Position of Optionee
(Director/Officer) |
Date of Grant | No. of
Shares | Exercise
Price |
Expiry Date |
| Graham Dickson | Director | August. 10, 2007 | 1,000,000 | $1.74 | Aug. 10, 2012 |
| Graham Scott | Officer | August 10, 2007 | 200,000 | $1.74 | Aug. 10, 2012 |
| Shaun Heinrichs | Officer | March 28, 2008 | 200,000 | $1.60 | March 27, 2013 |
| JE de Trentinian | Director | July 26,2009 | 1,000,000 | $0.15 | July 26, 2014 |
| Robert Baldock | Director | July 26,2009 | 4,000,000 | $0.15 | July 26, 2014 |
| Graham Dickson | Director | July 26,2009 | 4,000,000 | $0.15 | July 26, 2014 |
| Simon Solomonidis | Director | July 26,2009 | 500,000 | $0.15 | July 26, 2014 |
| Graham Scott | Officer | July 26,2009 | 500,000 | $0.15 | July 26, 2014 |
| Shaun Heinrichs | Officer | July 26,2009 | 1,500,000 | $0.15 | July 26, 2014 |
| Todd Johnson | Officer | July 26, 2009 | 225,000 | $0.15 | July 26, 2014 |
| Robert Baldock | Director | March 23, 2010 | 8,000,000 | $0.32 | March 23, 2015 |
| Graham Dickson | Director | March 23, 2010 | 8,000,000 | $0.32 | March 23, 2015 |
| Todd Johnson | Officer | March 23, 2010 | 775,000 | $0.32 | March 23,2015 |
| Francois Marland | Director | July 12, 2010 | 9,000,000 | $0.32 | July 12, 2015 |
| Pierre Besuchet | Director | July 15, 2010 | 1,000,000 | $0.26 | July 15, 2015 |
| Jay Schnyder | Director | July 15, 2010 | 1,000,000 | $0.26 | July 15, 2015 |
| John Greenslade | Director | July 15, 2010 | 1,000,000 | $0.26 | July 15, 2015 |
| Gerald Ruth | Director | July 15, 2010 | 1,000,000 | $0.26 | July 15, 2015 |
| Simon Solomonidis | Director | July 15, 2010 | 500,000 | $0.26 | July 15, 2015 |
| Todd Johnson | Officer | September 9, 2011 | 250,000 | $0.45 | September 9, 2016 |
| Shaun Heinrichs | Officer | May 31, 2011 | 750,000 | $0.50 | May 31, 2016 |
| Randy Reichert | Officer | May 31, 2011 | 1,500,000 | $0.50 | May 31, 2016 |
| Randy Reichert | Officer | January 11, 2012 | 2,000,000 | $0.26 | January 11, 2017 |
ITEM 13: TRANSFER AGENTS AND REGISTRARS
The Registrar and Transfer Agent for the Company is:
| Computershare Trust Company of Canada | ComputerShare Investor Services |
| 2nd Floor, 510 Burrard Street | 100 University Ave, 9thFloor |
| Vancouver, B.C., V6C 3B9 | Toronto, ON M5J 2Y1 |
ITEM 14: MATERIAL CONTRACTS
Set forth below are details of every contract, other than a contract entered into in the ordinary course of business, that is material to the Company and that was entered into within the most recently completed financial year, or before the most recently completed financial year but is still in effect:
| 1. | Incentive Stock Option Plan (the “Plan”) authorizing the reservation of no more than 10% of the Company’s outstanding Shares for issuance under the Plan. |
| | |
| 2. | Pursuant to Stock Option Certificates the Company granted options to Directors and Senior Officers as set out in Item 12 above. |
139
ITEM 15: INTERESTS OF EXPERTS
15.1 Names of Experts
Todd Johnson, Vice President of Exploration of the Company, of Vancouver, British Columbia (#16748, Nevada), Karl Swanson, Mining Consultant, of Larkspur, Colorado (AusIMM #304871 and SME #4043076) and Mark Odell, Mine Engineer Consultant, of Elko, Nevada (#13708, Nevada) are the authors of the technical report referred to in Section 4.4(a) hereof.
Messrs. Johnson, Swanson and Odell, as well as John Fox, Metallurgical Engineer of Vancouver, British Columbia (#12578, British Columbia) are the authors of the Technical Report referred to in Section 4.4(b) hereof.
15.2 Interests of Experts
Mr. Johnson is an officer of the Company and Mr. Fox was director of the Company (2005 to 2010). Both of Messrs. Fox and Johnson hold stock options to purchase securities of the Company. Messrs. Swanson and Odell have no registered or beneficial, direct or indirect, interest in the securities of the Company.
Deloitte & Touche LLP is the Company’s auditor and is independent within the meaning of the Rules of Professional Conductof the Institute of Chartered Accountants of British Columbia.
ITEM 16: ADDITIONAL INFORMATION
Additional information relating to the Company may be found on SEDAR atwww.sedar.com. Additional information, including directors’ and officers’ remuneration and indebtedness, principal holders of the Company’s securities, and securities authorized for issuance under equity compensation plans, if applicable, is also contained in the Company’s Information Circular pertaining to its most recent Annual General Meeting that involved the election of directors and in the Company’s comparative financial statements and MD&A for its most recently completed financial year.
Set forth below is the additional information required pursuant to Form 52-110F1,Audit Committee Information Required in an AIF:
1. The Audit Committee’s Charter
The Company’s audit committee (the “Audit Committee”) is governed by an audit committee charter, the text of which is attached as Schedule “A” to this AIF. The Audit Committee has also adopted a “Whistleblower Policy”, the text of which is attached as Schedule “B” to this AIF.
The purpose of the Audit Committee is to act as the representative of the Board of Directors in carrying out its oversight responsibilities relating to:
- The audit process;
- The financial accounting and reporting process to shareholders and regulatory bodies; and
- The system of internal financial controls.
140
2. Composition of the Audit Committee
The Company’s audit committee is comprised of three directors, Jay Schnyder, Gerald Ruth (Chair) and Robert F. Baldock. As defined in NI 52-110, the Board of Directors of the Company has determined that Messrs. Ruth and Schnyder are “independent” and all members of the Audit Committee are financially literate, meaning that they are able to read and understand financial statements.
3. Relevant Education and Experience
NI 52-110 provides that an individual is “financially literate” if he or she has the ability to read and understand a set of financial statements that present a breadth and level of complexity of accounting issues that are generally comparable to the breadth and complexity of the issues that can reasonably be expected to be raised by the Company’s financial statements. All members of the Audit Committee are financially literate as that term is defined.
Gerald Ruth graduated from Wilfrid Laurier University with a Bachelor of Business Administration (Hons.) in 1981 and earned his designation as a Chartered Accountant in 1983. He has been an independent corporate finance consultant since 2003, a Director and audit committee member of various private and public companies.
Jay Schnyder graduated with a Master in Business Administration in 1987 from the University of Lausanne, Switzerland and developped his education on precious metals and currency trading at MKS FINANCE before taking over the groups business development with various public and private familly owned mining groups which amongst the individual financial evaluations of such groups for compliance and credit purposes included structuring hedging and bridge financing programs.
Robert F. Baldock is an experienced mining executive as well as being a qualified and experienced accountant with over 30 years of hands-on management of public and private corporations across a wide range of industries, focused on the mining industry.
4. Reliance on Certain Exemptions
At no time since the commencement of the Company’s most recently completed financial year, has the Company relied on the following exemptions:
| | (a) | the exemption in section 2.4,De Minimis Non-audit Services; |
| | (b) | the exemption in section 3.2,Initial Public Offerings; |
| | (c) | the exemption in section 3.4,Events Outside Control of Member; |
| | (d) | the exemption in section 3.5,Death, Disability or Resignation of Audit Committee Member; or |
| | (e) | an exemption from National Instrument 52-110,Audit Committees, in whole or part granted under Section 8,Exemptions. |
5. Reliance on the Exemption in Subsection 3.3(2) or Section 3.6
At no time since the commencement of the Company’s most recently completed financial year, has the Company relied on the exemption in subsection 3.3(2),Controlled Companies, or section 3.6,Temporary Exemption for Limited and Exceptional Circumstances.
6. Reliance on Section 3.8
At no time since the commencement of the Company’s most recently completed financial year, has the Company relied on the exemption in section 3.8,Acquisition of Financial Literacy.
141
7. Audit Committee Oversight
At no time since the commencement of the Company’s most recently completed financial year, has a recommendation of the Committee to nominate or compensate an external auditor not been adopted by the Board of Directors.
8. Pre-Approval Policies and Procedures
The Committee has adopted specific policies regarding the engagement of the external auditors appointed by the shareholders of the Company (the “Auditors”) consistent with the Committee’s charter with a view to ensuring the Auditors’ independence. These pre-approval policies relate to the engagement of audit services, audit-related services and non-audit-related services.
9. External Auditor Service Fees (By Category)
Set forth below are details of fees billed by the Company’s external auditor in each of the last two fiscal years for audit services:
| Fiscal Year End | Audit Fees | Audit-Related Fees(1) | Tax Fees(2) | All Other Fees(3) |
| December 31, 2010 | 210,000 | – | – | – |
| December 31, 2011 | 337,000 | 40,000 | 53,000 | – |
| (1) | The aggregate fees billed in each of the last two fiscal years for assurance and related services by the Company’s external auditor that are reasonably related to the performance of the audit or review of the Company’s financial statements and are not reported under “Audit Fees”. |
| (2) | The aggregate fees billed in each of the last two fiscal years for professional services rendered by the Company’s external auditor for tax compliance, tax advice and tax planning. |
| (3) | The aggregate fees billed in each of the last two fiscal years for products and services provided by the Company’s external auditor, other than the services reported under clauses 1 and 2 above. |
142
Schedule “A” to the Annual Information Form of
Yukon-Nevada Gold Corp. (the "Company")
| CHARTER OF THE AUDIT COMMITTEE |
This charter (the “Charter”) sets forth the purpose, composition, responsibilities, duties, powers and authority of the Audit Committee (the “Committee”) of the Board of Directors (the “Board”) of the Company.
1.0 Purpose
The purpose of the audit committee (the “Committee”) is to: (a) assist the Board in fulfilling its oversight responsibilities with respect to financial reporting and disclosure requirements; (b) ensure that an effective risk management and financial control framework has been implemented by management of the Company; and (c) be responsible for external and internal audit processes.
2.0 Composition and Membership
The Board will appoint the members (“Members”) of the Committee after the annual general meeting of shareholders of the Company. The Members will be appointed to hold office until the next annual general meeting of shareholders of the Company or until their successors are appointed. The Board may remove a Member at any time and may fill any vacancy occurring on the Committee. A Member may resign at any time and a Member will cease to be a Member upon ceasing to be a director.
The Committee will consist of three directors that meet the criteria for independence and financial literacy established by applicable laws and the rules of the stock exchange upon which the Company’s securities are listed, including National Instrument 52-110 – Audit Committees. In addition, each director will be free of any relationship which could, in the view of the Board, reasonably interfere with the exercise of a member’s independent judgment.
The Board will appoint one of the Members to act as the Chairman of the Committee. The secretary of the Company (the “Secretary”) will be the secretary of all meetings and will maintain minutes of all meetings and deliberations of the Committee. In the absence of the Secretary at any meeting, the Committee will appoint another person who may, but need not, be a Member to be the secretary of that meeting.
3.0 Meetings
Meetings of the Committee will be held at such times and places as the Chairman may determine, but in any event not less than four times per year. Twenty-four (24) hours advance notice of each meeting will be given to each Member orally, by telephone, by facsimile or email, unless all Members are present and waive notice, or if those absent waive notice before or after a meeting. Members may attend all meetings either in person or by conference call.
At the request of the external auditors of the Company, the Chief Executive Officer or the Chief Financial Officer of the Company or any member of the Committee, the Chairman will convene a meeting of the Committee. Any such request will set out in reasonable detail the business proposed to be conducted at the meeting so requested.
The Chairman, if present, will act as the Chairman of meetings of the Committee. If the Chairman is not present at a meeting of the Committee, then the Members present may select one their number to act as Chairman of the meeting.
143
A majority of Members will constitute a quorum for a meeting of the Committee. Each Member will have one vote and decisions of the Committee will be made by an affirmative vote of the majority. The Chairman will not have a deciding or casting vote in the case of an equality of votes. Powers of the Committee may also be exercised by written resolution signed by all Members.
The Committee may invite from time to time such persons as it sees fit to attend its meetings and to take part in the discussion and consideration of the affairs of the Committee.
In advance of every regular meeting of the Committee, the Chairman, with the assistance of the Secretary, will prepare and distribute to the Members and others as deemed appropriate by the Chairman, an agenda of matters to be addressed at the meeting together with appropriate briefing materials. The Committee may require officers and employees of the Company to produce such information and reports as the Committee may deem appropriate in order to fulfil its duties.
4.0 Duties and Responsibilities
Subject to the powers and duties of the Board of Directors, the duties and responsibilities of the Committee are as follows:
| A. | The Audit Committee shall review and recommend updates to its terms of reference to the Corporate Governance Committee of the Board of Directors annually. |
| | |
| B. | The Audit Committee shall meet not less often than four times per year. |
| | |
| C. | The Audit Committee shall have responsibility for: |
| | i. | reviewing the financial statements of the Company and if appropriate recommending the approval of such financial statements by the Board of Directors; |
| | | |
| | ii. | reviewing the internal financial and accounting, audit and reporting systems controls of the Company; |
| | | |
| | iii. | reviewing the independence, qualifications and objectivity of the Company's auditors, and making recommendations to the board of directors in the ease of vacancy of an auditor, as to the selection of the Company's auditors; |
| | | |
| | iv. | reviewing and recommending auditors' remuneration; |
| | | |
| | v. | reviewing the scope, results and findings of the Company's auditors, audit and non-audit services; and |
| | | |
| | vi. | reviewing annually the status of significant current and potential legal matters. |
| D. | The Audit Committee shall ensure that effective lines of communication are maintained with the external auditor, internal auditors, financial management and the board of directors. |
| | |
| E. | The Audit Committee shall review with the auditors of the Company the relationships existing between them and the management of the Company to ensure an effective liaison in the coordination of audit effort regarding completeness of coverage, avoidance of redundant efforts and the effective use of audit resources. |
| | |
| F. | The Audit Committee shall review, discuss and consider with the auditors their approach to risk assessment, scope and plan of their audits. The review may include: |
144
| | i. | an annual assessment of areas of greatest risk to the Company and steps taken to address those risks; |
| | | |
| | ii. | the annual assessment of the Company's insurance coverage, including the adequacy and cost thereof; |
| | | |
| | iii. | the annual audit plan and overall audit universe; |
| | | |
| | iv. | changes made from time to time in the audit universe and reasons therefor; |
| | | |
| | v. | methods employed by management of the Company to assess risk and to prioritize the various audit proposals identified in the annual plan as well as unscheduled audit proposals: and |
| | | |
| | vi. | any unusual occurrence affecting the management which may preclude the completion of the audit plan. |
| G. | The Audit Committee shall consider and review with the auditors and management of the Company: |
| | i. | the adequacy of the Company's internal financial controls; |
| | | |
| | ii. | recommendations for the improvement of the Company's accounting procedures and internal financial controls; and |
| | | |
| | iii. | any related significant findings and recommendations together with management's responses thereto. |
| H. | The Audit Committee shall review the annual consolidated financial statements which are to he submitted to the board of directors including management's discussion and analysis, if any, contained therein, or in any other relevant documentation. The review, may include: |
| | i. | reports from the auditors as to the results of their examination to date and advise them of any problems regarding financial reporting in the annual report of the Company, including any disagreements that may have arisen between the auditors and management in any area: |
| | | |
| | ii. | meeting(s) with management of the Company who shall outline any problems as to financial policies, financial reporting or matters relating to internal control and any matters in contention with or under consideration by the auditors or management of the Company; |
| | | |
| | iii. | the appropriateness of existing accounting principles being employed and any change in accounting policy or practice which the auditors may refer to in their audit report; |
| | | |
| | iv. | any proposed changes in financial statement presentation or footnote the auditors may recommend: and |
| | | |
| | v. | other matters related to the conduct of the audit which are to be communicated to the Audit Committee under generally accepted auditing standards. |
| I. | The Audit Committee shall review with management of the Company and the auditors quarterly interim financial statements and if appropriate recommend approval of such quarterly statements to the board of directors. |
| | |
| J. | The Audit Committee shall consider and review with management: |
145
| | i. | any difficulties encountered in the course of the audits conducted by the auditors, including any changes to or restrictions on the scope of their work or access to required information; |
| | | |
| | ii. | the internal auditing department budget and staffing and |
| | | |
| | iii. | the internal auditing department charter including the internal audit plan. |
| K. | The Audit Committee shall review legal, regulatory and social matters that may have a material impact on the financial statements, related the Company compliance policies and programs and reports prepared to manage and monitor the Company compliance policies. The Audit Committee shall receive reports concerning the Company's environmental management program on a quarterly basis, and review ongoing environmental compliance Issues. |
| | |
| L. | The Audit Committee shall confirm and assure the independence of the auditors, including a review of management consulting services and related fees provided by the auditors. |
| | |
| M. | The Audit Committee shall meet with management and the auditors in separate executive sessions to discuss any matters that the Audit Committee or these groups believe should be discussed privately with the Audit Committee. |
| | �� |
| N. | The Audit Committee shall have the power to conduct or authorize investigations into any matters within the Audit Committee's scope of responsibilities. The Audit Committee shall be empowered to retain independent counsel, accountants, or others to assist it in the conduct of any investigation. |
| | |
| O. | The Audit Committee shall perform such other functions as assigned by law or the board of directors, and may review other items of an internal control or risk management nature which may from time to time he brought before the Audit Committee. |
| | |
| P. | The Audit Committee shall conduct a self-assessment at least annually, and discuss the results with the board of directors. |
146
Schedule “B” to the Annual Information Form of
Yukon-Nevada Gold Corp. (the "Company")
The Company’s confidential whistleblowing policy is posted on its website at: (http://www.yukon-nevadagold.com/s/Governance.asp).