
ANNUAL INFORMATION FORM
of
Veris Gold Corp.
(formerly Yukon-Nevada Gold Corp.)
#900, 688 West Hastings Street
Vancouver, BC, V6B 1P1
Tel: (604) 688-9427
For the year ended December 31, 2012
March 28, 2013
TABLE OF CONTENTS
ii
3
FinancialStatementsandForwardLookingStatements
All financial information in this Annual Information Form (“AIF”) is prepared in accordance with International Financial Reporting Standards, as issued by the International Accounting Standards Board (“IFRS”).
This report contains “forward-looking statements”, including all statements that are not historical facts, and forward looking information within the meaning of the United States Private Securities Litigation Reform Act of 1995, as amended, and applicable Canadian Securities legislation. Forward-looking statements include, but are not limited to, statements with respect to the future price of gold, the realization of mineral reserve estimates, the timing and amount of estimated future production, costs of production, capital expenditures, costs and timing of the development of deposits, success of exploration activities, permitting time lines, currency exchange rate fluctuations, requirements for additional capital, government regulation of mining operations, environmental risks, unanticipated reclamation expenses, title disputes or claims and limitations on insurance coverage. Generally, these forward-looking statements can be identified by the use of forward-looking terminology such as “plans”, “expects” or “does not expect”, “is expected”, “budget”, “scheduled”, “estimates”, “forecasts”, “intends”, “anticipates” or “does not anticipate”, or “believes”, or variations of such words and phrases or state that certain actions, events or results “may”, “could”, “would”, “might” or “will be taken”, “occur” or “be achieved”.
With respect to forward-looking statements and the information included in this AIF, we have made numerous assumptions, including, among other things, assumptions about the price of gold, anticipated costs and expenditures and our ability to achieve our goals, even though our management believes that the assumptions made and the expectations represented by such statements or information will prove to be accurate. By their nature, forward-looking statements and information are based on assumptions and involve known and unknown risks, uncertainties and other factors that may cause our actual results, performance or achievements, or industry results, to be materially different from future results, performance or achievements expressed or implied by such forward-looking information. Such risks, uncertainties and other factors include among other things the following: gold price volatility; discrepancies between actual and estimated production and mineral reserves and resources; the speculative nature of gold exploration; mining operational and development risk; and regulatory risks. See this AIF –Description of Business – Risk Factors for additional information on risks, uncertainties and other factors related.
Although the Company has attempted to identify important factors that could cause actual results to differ materially from those contained in forward-looking statements, there may be other factors that cause results not to be as anticipated, estimated or intended. There can be no assurance that such statements will prove to be accurate, as actual results and future events could differ materially from those anticipated in such statements. Accordingly, readers should not place undue reliance on forward-looking statements. The Company does not undertake to update any forward-looking statements that are incorporated by reference herein, except in accordance with applicable securities laws.
DateofInformation
All information in this AIF is as of March 28, 2013 unless otherwise indicated.
ConversionTable
In this AIF a combination of imperial and metric measures are used with respect to mineral properties located in North America. Conversion rates from imperial measure to metric and from metric to imperial are provided below:
4
| Imperial Measure= | Metric Unit | Metric Measure= | Imperial Unit |
| 2.47 acres | 1 hectare | 0.4047 hectares | 1 acre |
| 3.28 feet | 1 metre | 0.3048 metres | 1 foot |
| 0.62 miles | 1 kilometre | 1.609 kilometres | 1 mile |
| 0.032 ounces (troy) | 1 gram | 31.1 grams | 1 ounce (troy) |
| 1.102 tons (short) | 1 tonne | 0.907 tonnes | 1 ton |
| 0.029 ounces (troy)/ton | 1 gram/tonne | 34.28 grams/tonne | 1 ounce (troy/ton) |
Currency
Unless otherwise indicated, all dollar amounts are in United States dollars.
ShareCapital
On January 5, 2004 Veris Gold Corp. consolidated its share capital on the basis of one post-consolidated common share of the Company for five pre-consolidated Shares. On October 11, 2012 the Company further consolidated its share capital on the basis of one post consolidated common share for ten pre-consolidated common shares. Unless otherwise expressed, all references are to post-consolidated common shares of the Company (the “Shares”).
The Shares of the Company were called for trading on the Toronto Stock Exchange (the “TSX”) on April 13, 2005.
CautionaryNotetoU.S.InvestorsRegardingResourceEstimates
CORPORATEName,AddressandIncorporation
The full corporate name of the Company is Veris Gold Corp. (the “Company” or “VG”).
The address of the Company’s head office is #900, 688 West Hastings Street, Vancouver, BC, V6B 1P1. The address of the Company’s registered office is #1040, 999 West Hastings Street, Vancouver, BC, V6C 2W2
The Company was incorporated under the laws of the Province of British Columbia under the name “YGC Resources Ltd.” on May 30, 1988. On January 25, 2002, the Company was struck from the Register of Companies for British Columbia and dissolved. The Company was restored to the Register on August 1, 2003. On January 5, 2004 the Company consolidated its share capital on a five (5) old for one (1) new basis and increased its authorized share capital from 4,000,000 Shares without par value to 100,000,000 Shares without par value. On June 23, 2005, the Company increased its authorized share capital from 100,000,000 Shares without par value to an unlimited number of Shares without par value. On June 20, 2007 the Company completed a plan or arrangement with QRL Resources Ltd. and changed its name to Yukon-Nevada Gold Corp.
At a Special General Meeting held on October 2, 2012, the Company consolidated its share capital on a ten (10) old Shares for one (1) new Share basis and changed its name to its name to its current name.
The Company has applied to have its Shares listed on the NYST MKT LLC which should be affected once the required quantitative criteria have been met for listing.
5
IntercorporateRelationships
Set forth below are the names of the Company’s material subsidiaries:
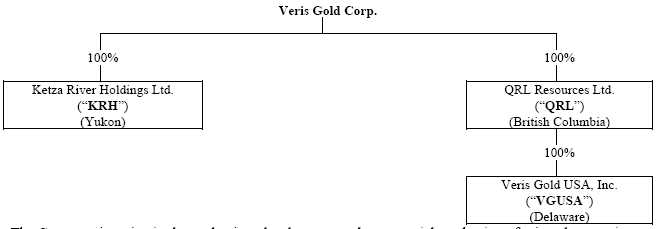
The Company is active in the evaluation, development and commercial production of mineral properties. The Company’s principal assets are the Jerritt Canyon gold mine, Nevada and the Ketza River property, Yukon Territory. The favourable price for gold has enabled the Company to raise equity financing, the proceeds of which are used to fund improvements to the Jerritt Canyon concentrator facilities and exploration of the Ketza River property.
ThreeYearHistory
The principal business of the Company is the production of gold in Nevada and the acquisition, exploration and development of mineral properties of merit with a particular focus on gold, silver, zinc and copper properties in the Yukon Territory and British Columbia in Canada and in Arizona and Nevada in the United States.
Jerritt Canyon
The Company acquired the Jerritt Canyon gold mine upon completion of its plan of arrangement with QRL on June 20, 2007. Jerritt Canyon is a gold property with two active underground mines (Smith and SSX-Steer Complex), ore stockpiles and a 1.5 million ton per year capacity processing plant (grinding, roasting and carbon-in-leach circuits). The approximately 119 square miles that comprise the Jerritt Canyon property is host to a number of defined mineral resources and reserves in addition to a significant number of advanced, early stage and district-scale exploration targets with potential to expand the currently defined mineral reserves and resources proximal to the producing mines.
Production
From August 1, 2012 to year-end 2012, total average underground mine production from Smith Mine and the SSX-Steer mine was 1,261 tons per day and 1,162 tons per day, respectively. Total 2012 underground mine production from the Smith and SSX-Steer Mines was 687,028 tons (405,904 tons from Smith by contract miner Small Mines Development, LLC (SMD) and 281,124 tons from the Company operated SSX-Steer). Also in November 2012, development commenced at the new Starvation Canyon underground mine by SMD. For the year ending December 31, 2011, total underground mine production from Smith Mine and SSX-Steer Complex was 1,300 tons per day (1,000 tpd from Smith by SMD and 300 tpd from SSX-Steer mined by VGUSA staff. Total 2011 underground mine production from Smith Mine and SSX-Steer Complex was 278,846 tons (269,795 tons from Smith and 9,051 tons from SSX-Steer Complex). As of December 31, 2011, the Company also obtained the necessary permits to develop the Starvation Canyon underground mine.
6
As of year-end 2010, total underground mine production from Smith Mine by SMD totalled 207,100 tons. For the last 10 months of 2010, the average underground mine production from Smith Mine was approximately 618 tons per day.
Drilling
In 2012, the Company completed 2,577 feet (2 drill holes) of surface reverse circulation (2 RC drill holes totalling 1,600 ft. and 2 diamond drill holes totalling 977 ft.) from several projects throughout the property; 23,942 feet (7,299.3m) of underground diamond drilling (30 drill holes at the Smith Mine totalling 29,333 ft. and 3 drill holes totalling 2,473 ft from SSX/Steer); 90,115 feet (27,474m) of cubex production drilling (826 drill holes) and 8,805 feet (2,684m) from the Smith and SSX-Steer underground mines. Drilling in 2012 focused on those areas proximal to existing underground developments above the groundwater table (in Zones 4 and 5 at Smith Mine and Zone 1 at SSX/Steer Mine) to: convert inferred resources to measured and indicated resources, better define existing reserves, and expand reserves. The Starvation Canyon geotechnical report was finalized in late 2012.
In 2011, the Company completed 134,277 feet (220 drill holes) of surface reverse circulation and diamond drilling from several projects throughout the property; 23,942 feet (7,299.3m) of underground diamond drilling (37 drill holes) at the Smith Mine; and 93,753 feet (28,583m) of cubex production drilling (809 drill holes) from the Smith and SSX-Steer underground mines. Drilling in 2011 focused on: those areas proximal to existing underground developments to convert inferred resources to measured and indicated resources, and in open pit areas with high potential for quick development (Burns Basin, Steer and Saval Canyon, and Pie Creek). In addition, a Titan 24 geophysical ground survey was conducted at Starvation Canyon in 2011 that identified several anomalies that are scheduled for drill testing in 2013. A geotechnical drilling program was also conducted in 2011 at the Starvation Canyon deposit area.
In 2010, the Company completed 8,126 feet of underground diamond drilling (8 drill holes) and 71,565 feet of underground cubex drilling (1,143 drill holes) at the Smith underground mine.
Resources and Reserves
The year-end 2012 resource and reserve Technical Report update is currently in progress and targeting to be completed in the second quarter of 2013. The December 31, 2011Mineral Resources and Reserveswere updated in a new NI 43-101 Technical Report dated April 27, 2012 by Practical Mining LLC. Mark Odell, P.E, is the primary author of the report, President of Practical Mining LLC, and is considered to be Independent of the Company and a Qualified Person (QP) as defined by NI 43-101 guidelines..Proven and Probable Reserves have moderately increased from the previous January 1, 2011 Technical Report and include a proven reserve of 1,980ktons averaging 0.189opt Au containing 374.8 koz, and a probable reserve of 4,077 ktons averaging 0.168opt Au containing 686 koz.
The year-end 2011 resources slightly increased relative to the previous year’s resource and include: a measured resource of 4,907 ktons averaging 0.210 opt Au containing 1,031 koz; an indicated resource of 7,383 ktons averaging 0.175 opt Au containing 1,289 koz Au; and an inferred resource of 4,116 ktons averaging 0.182 opt Au containing 748 koz Au. From January 1, 2011 to December 31, 2011 there was a total depletion of 55.3 koz Au based on reconciled oz from the mill that excludes reconciled oz from Newmont and other purchased ores during the same time period.
Reserve additions related to the December 31, 2011 update net of depletion total 344 koz relative to the previous NI 43-101 reserve. The reserve additions were concentrated at Murray and Smith underground mines with lesser additions at Saval open pit, Burns Basin open pit, SSX-Steer underground mine and Mill Creek open pit.
7
Resources and Reserves for the three most recent Jerritt Canyon NI 43-101 reports (YE 2007, YE2010, and YE2011) during VG’s ownership are listed below in Tables 1 to 3.
Table 1: Measured and Indicated Mineral Resources, Including Reserves from Year-End 2007 to Year-End 2011
Year
(Year-End) | Measured | Indicated | Measured + Indicated |
Kt |
opt | koz
Au |
kt |
opt | koz
Au |
kt |
opt | koz
Au |
| 2007 | 2,626.0 | 0.269 | 706.1 | 5,570.9 | 0.225 | 1,255.0 | 8,196.9 | 0.239 | 1,961.1 |
| 2010 | 4,549.9 | 0.236 | 1,073.1 | 6,459.5 | 0.204 | 1,316.8 | 11,009.4 | 0.217 | 2,389.9 |
| 2011 | 4,906.8 | 0.210 | 1,030.7 | 7,382.7 | 0.175 | 1,288.5 | 12,289.5 | 0.189 | 2,319.2 |
Table 2: Historic Inferred Mineral Resources from Year-End 2007 to Year-End 2011
Year
(Year-End) | Inferred |
kt |
opt | koz
Au |
| 2007 | 2,319.7 | 0.224 | 520.4 |
| 2010 | 3,872.6 | 0.194 | 751.3 |
| 2011 | 4,115.7 | 0.182 | 748.4 |
Table 3: Historic Proven and Probable Mineral Reserves from Year-End 2007 to Year-End 2011
Year
(Year-End) | Proven | Probable | Proven + Probable |
Kt |
Opt | koz
Au |
kt |
opt | koz
Au |
kt |
opt | koz
Au |
| 2007 | 653.4 | 0.229 | 149.9 | 2,501.8 | 0.227 | 567.4 | 3,155.2 | 0.227 | 717.3 |
| 2010 | 1,406.1 | 0.193 | 270.9 | 2,959.7 | 0.151 | 446.0 | 4,365.8 | 0.164 | 717.0 |
| 2011 | 1,980.2 | 0.189 | 374.8 | 4,076.7 | 0.168 | 686.0 | 6,056.9 | 0.175 | 1,060.8 |
VGUSA is targeting 2013 gold production of approximately 175,000 oz by ramping up to 1,200 tons per day production from the SSX-Steer mine and 1,200 tons per day from Smith Mine in 2013. In addition, the Company is targeting ore production from Starvation Canyon starting in March of 2013 with full ramp up to 600 tons per day in the second quarter of 2013. The Company is processing stockpiled ore to supplement current production.
The current permitted roaster capacity as of October 18, 2012 is 6,000tpd. With the expected ore feed from the operating underground mines at Jerritt Canyon, the Company plans to fill the remaining mill capacity with third party ores through toll milling contracts.
Ketza River
The Company has owned the Ketza River property in the Yukon since 1994 under its wholly-owned subsidiary, KRH. This former producing mine was shut down in November 1990 by the previous owner and operator (Canamax) due to the depletion of known oxide ore reserves identified at that time. The Ketza River property includes 731 mineral claims and leases, a gold mill, a 49-person camp and office facility, and necessary licences and permits to conduct exploration. The Company’s Senior Vice President – Acquisitions and Corporate Development, Graham Dickson, who is also a chemist, identified areas which were under-explored and which could be mined and processed by different methods than those employed in the past including some possibly significant quantities of sulphide ore. To date, the Company has completed the following work at Ketza River: diamond drilling from 1994 to 2011, a NI 43-101 compliant Technical Report dated June 28, 2011 that includes the current open pit and underground resources, and pre-feasibility work and permitting work to support the Yukon Environmental and Socio-economic Assessment Board (“YESAB”) application that was submitted in September 2011 for potential Mine development.
8
Exploration in 2012 focused on: geological surface mapping in the northern and southern parts of the district; compilation of all surface rock chips and soil geochemistry; a Low Frequency Electromagnetic (ELF) ground survey at the South Hill and North end of the district; trenching and rock and soil characterization of the proposed waste dump and mine facility areas; writing of an assessment report to support quartz claim renewal payments; compilation and assessment of pulp check assays for drilling years 2007 to 2010 received from the primary assay lab and a certified secondary (umpire) assay lab; and surface reclamation including drill access roads and pads. No surface drilling exploration was conducted at Ketza River in 2012.
Recent permitting activities in 2012 focused on submitting answers to the YESAB Executive Committee on various topics relating to the proposed project to advance the YESAB submission, and answering questions related to advancing the approval of the site water permit renewal application. Additional baseline studies relating to fisheries, environmental conditions, water quality studies, water balance, and geotechnical site conditions of the proposed mine area were performed to help answer questions raised in the Adequacy Review YESAB process. The Company answered questions raised in the Adequacy Review process that were submitted to the YESAB Executive Committee in mid-February 2013.
The 2011 exploration program consisted of a drilling program (26 drill holes totalling 14,441 ft. or 4,402m) that focused on the South Hill Target, the NW target, and the Penguin and Hoodoo Zones; 343 surface soil geochemical sampling in the OK target (located northeast of the QB Zone); 176 panel samples taken across the Canamax mill stockpile; sampling the last 13 geotechnical drill holes drilled in late 2010 at the lower tailings site; and the collection of 290 drill hole pulps (completed originally from 2007 to 2010) for duplicate Quality Assurance and Quality Control (QA/QC) analysis at ALS and Inspectorate. Other Work in 2011 included: installation of a 49-person replacement camp, upgrading of the camp infrastructure (new water well and sewer system); YESAB application work, drilling on the margins of the previously identified resource areas and in new exploration targets away from the known resources; submission of 293 drill hole samples for Acid Base Accounting (ABA) analyses; additional claim staking in the district; starting 9 additional humidity cell tests on waste rock from the Manto Zone deposits and the QB pit area; and the completion of a NI 43-101 Technical Report on June 28, 2011 that updates the Mineral Resources as of January 25, 2010 with drilling results up to year-end 2008.
The 2010 Ketza River exploration program consisted of a drilling program (128 diamond drill holes totalling 17,542m) that focused on expanding the resource areas at Peel, Gully Zone, Lab-Hoodoo, Penguin, and QB, surface mapping and rock-chip sampling at the South Hill target, and ground geophysical induced polarization (IP) survey at the OK Target. Additional condemnation drilling was conducted at the lower tailings dam area, along with additional hydrogeology and geotechnical drilling to help support the mine predevelopment work. Baseline studies and related public meetings were continued in 2010 to help support the YESAB application as were meetings with the nearby communities and First Nations.
Current exploration work at the site is focusing on compiling surface mapping information collected during the 2012 summer season, compilation of surface geochemical data and historical drill hole data, waiting for the final report of the ELF ground geophysical survey conducted in 2012 to help with exploration targeting, and additional targeting for future exploration programs.
In the fourth quarter of 2012 the Company recorded an impairment charge of $30.0 million on its Ketza River property. The impairment decision reflects the recent downturn observed in industry, specifically in relation to exploration and development stage mining projects comparable to Ketza River, which implied that the current carrying value may not be fully recoverable under existing market conditions. As set out above, the Company continued to work on the Ketza River property throughout 2012 and plans to continue the permitting process in 2013 while continuing to monitor the project for any further impairment indicators as the project progresses.
9
Silver Valley Property, Yukon
In the fourth quarter of 2012 an impairment charge of $1.8 million was taken to write-off the Company’s Silver Valley property.
YearEndedDecember31,2010
At the Company’s Special Meeting held January 12, 2010, shareholders approved the issuance of Inducement Warrants to holders of existing warrants who elected to exercise their warrants prior to their expiration date. The Company issued 17,040,000 warrants exercisable at a price of $3.20 per Share, 1,025,000 warrants exercisable at a price of $2.60 per Share, 1,000,000 warrants exercisable at a price of $1.28 per Share. All unexercised warrants expired on January 12, 2012.
In March 2010, the Company entered into an Engagement Letter with BNP Paribas of New York to facilitate the further development of the Jerritt Canyon mine. Under the terms of the Engagement Letter, BNP Paribas agreed to provide advice and financial services. The Company also provided an update of the assay resulted received for the diamond drilling program on the Ketza River property and the Jerritt Canyon property.
On March 26, 2010 the Company closed a non-brokered private placement of 2,272,727 Shares at $2.20 per Share for gross proceeds of $5,000,000. There was no commission paid.
In April 2010 the Company’s Board of Directors approved the appointment of Todd W. Johnson, M.Sc. Geol. Engineering, P.E. as its Vice President of Exploration.
On May 6 and 12, 2010, the Company closed two tranches of a brokered private placement of 3,455,909 Flow-Through Shares (the “FT Shares”) at a price of $2.75 per FT Share for gross proceeds of $9,503,750. A commission was paid on a portion of the private placement of 7.5% cash and 70,000 warrants exercisable at a price of $2.75 per share on or before May 12, 2012. All of the warrants were exercised.
At the Company’s 2010 Annual General Meeting held May 13, 2010, Graham Dickson, Robert Baldock, Pierre Besuchet, Jay Schnyder, John Greenslade, Simon Solomonidis, Jean-Edgar de Trentinian and Gerald Ruth were appointed to the Board of Directors. Robert Chafee, Terry Eisenman and John Fox resigned as directors. John Greenslade was also appointed the Company’s Chairman.
On July 2, 2010 François Marland was appointed to the Company’s Board of Directors and was appointed the Company’s Vice Chairman.
In July 2010, the Company commenced exploration drilling at its Jerritt Canyon mine.
On August 13, 2010 the Company closed a Senior Secured Note financing, issuing US$25,000,000 principal amount senior secured notes and 2,500,000 common share purchase warrants, raising gross proceeds of US$25,000,000. Each warrant entitled the holder to purchase one Share a price of $4.00 per Share for a period of three years following closing. The notes had a maturity date of December 31, 2012 and were secured by a charge over all the assets of the Company’s wholly owned subsidiaries, QRL and VGUSA as well as a share pledge over all shares in QRL and VGUSA. A commission of 4% of the gross proceeds raised was paid in Shares of the Company.
10
In August 2010, the Company settled its dispute between its subsidiary, QRL and Golden Eagle International Inc. arising as a result of QRL’s termination in 2009 of GEII’s arrangement to re-start operations at the Jerritt Canyon mine. The Company issued an aggregate of 200,000 shares to GEII and paid GEII $3,467,152.
In September 2010, the Company announced its first assay results from its Smith Mine underground exploration drilling program at Jerritt Canyon mine. The drilling identified new gold mineralization beyond the previously modelled resource boundaries. The Company also announced results from its diamond drilling program at the Break and B-Mag Zones at Ketza River.
By Agreement dated October 25, 2010, the Company entered into an ore purchase agreement with Newmont USA Limited whereby the Company will accept delivery of approximately 2,000 tons of gold bearing ore per day from several of Newmont's mines in Nevada.
On October 27, 2010 KPMG LLP resigned as the Company’s auditor and Deloitte LLP was appointed as the Company’s successor auditor.
YearendedDecember31,2011
In January 2011, the Company announced assay results on its 2010 Smith Mine underground exploration drilling at its Jerritt Canyon mine.
On January 28, 2011 the Company entered into a forward gold sale agreement with Monument Mining Ltd. (“Monument”) a public company the shares of which trade on the TSX Venture Exchange. The President of Monument is Robert Baldock, the former President of the Company. Graham Dickson and Jean-Edgar de Trentinian, directors of the Company are also directors of Monument. Under the agreement, Monument prepaid $5,000,800 for the gold and was to receive, in lieu of physical gold, an amount of $6,000,960 on or before June 30, 2011, which the Company paid on June 30, 2011.
In February 2011, the Company announced results from its 2010 drilling program at its Ketza River Property, Yukon. The Company also announced additional assay results from its ongoing Smith Mine underground drilling program at Jerritt Canyon.
On March 2, 2011, the Company completed a $7.1 million non-brokered flow-through private placement for 833,488 flow-through shares (the “FT Shares”) at $8.50 per FT Share. The proceeds were used for new resource exploration at Ketza River at new targets as well as at the Silver Valley property.
At a Special Meeting of the Company held March 8, 2011, shareholders approved the temporary reduction of the exercise price of eight series of unlisted warrants issued between April 2009 and August 2010 by approximately 18%. The holders of the warrants had 30 days from March 14, 2011 to exercise their warrants, after which the exercise prices of the warrants reverted to their original respective exercise prices. The original prices ranged from $0.80 to $4.00 per share and the reduced prices range from $0.70 to $3.30 per share. An aggregate of 5,981,333 warrants were exercised for gross proceeds of $12,637,880.
In May the Company announced a 30% increase from 2007 levels of to its mineral resource estimate for its Jerritt Canyon mine. The Company also announced that it had reached a $3.6M settlement as a result of a class action suit initiated by former employees.
11
During the period May 10 to 24, 2011, 14,040,000 warrants exercisable at a price of $3.20 per share held by an insider of the Company were purchased and exercised by various entities, raising an aggregate of $44,928,000 for the Company. Concurrent with the exercise of the warrants, the Company completed a private placement of 3,348,837 units of the Company at a price of $4.30 per Share, raising an aggregate of $14,400,000. Each unit was comprised of one Share and one warrant exercisable at a price of $5.50 for 24 months from closing, subject to an accelerated expiry.
On June 27, 2011, Graham Dickson, resigned as the Company’s COO and was appointed the Senior Vice President of Acquisitions and Corporate Development. Randy Reichert was appointed the Company’s COO.
Shareholders of the Company approved a Forward Gold Sale Agreement dated August 12, 2011 whereby Deutsche Bank AG (“Deutsche Bank”) prepaid US$120,000,000 for the purchase of a maximum of 173,880 ounces of gold produced from the Company’s Jerritt Canyon Mine. The gold is being delivered over a four year period at an average rate of 3,623 ounces per month.
In October 2011, the Company re-started mining at its SSX-Steer mine complex at its Jerritt Canyon mine.
In October 2011 the Company entered into a Shareholder Rights Plan Agreement (the “Shareholder Rights Plan”) with Computershare Trust Company, subject to acceptance by both the Toronto Stock Exchange and the shareholders of the Company. The agreement has a term of three years and its objective is to achieve full and fair value for the Company’s shareholders in the event of an unsolicited take-over bid.
On October 18, 2011, the Company and the other joint venture shareholders of YS Mining Company Inc. (“YSM”) agreed to dissolve YSM by way of a consent resolution authorizing the dissolution of YSM (the “Resolution”) and the execution of a Corporate Dissolution Agreement (the “Agreement”). During 2011 there had been minimal activity in the joint venture, including in YSM’s wholly owned subsidiary Yukon-Shaanxi Mining Company. Upon execution of the Agreement, all remaining assets, primarily cash, were distributed to the joint venture shareholders. The Company received CAD $2.2 million from the distribution of assets on October 25, 2011. YSM was dissolved on February 9, 2012.
Year ended December 31, 2012
During January of 2012, the Company announced a revised mineral resource estimate for its Jerritt Canyon gold mine. The mine’s measured and indicated mineral resource had increased by 428.8 koz of gold representing a 21% increase over year end 2007 levels, the results of the diamond drilling program on its 2011 Smith Mine undergrounds diamond drilling program at the Company’s Jerritt Canyon mine, the results of its 2011 surface drilling program at the Mahala Project and the Starvation Canyon Project, both located at the Company’s Jerritt Canyon mine as well as the completion of construction work on a new ore dryer and fine crushing conveying system as well as maintenance upgrades to the roasting facility at the Jerritt Canyon Mine.
On January 12, 2012 the Company entered into a second forward gold sale agreement with Monument. Under the agreement, Monument prepaid US$5,000,000 for the gold and will receive, in lieu of physical gold, an amount of US$6,000,000 on or before June 12, 2012. The terms of this agreement were subsequently changed to require on June 30, 2013 the delivery of 3,830 ounces or, in lieu of physical gold, an amount of US$6,600,000 to be paid.
On February 6, 2012, the Company announced the re-starting of production at its Jerritt Canyon mine.
12
On February 7, 2012 the Company entered into a Forward Gold Purchase Agreement with Deutsche Bank whereby Deutsche Bank funded a US$20 million prepaid gold forward facility. The Company is using the funds for working capital and to further invest in the expansion of the SSX-Steer mine in Nevada. In connection with the transaction, the Company issued to Deutsche Bank a share purchase warrant which can be exercised to purchase 4,000,000 common shares at a price of $4.40 per share on or before February 7, 2015. Under the terms of the agreement, in the event that the actual monthly quantity of gold delivered by the Company is less than the scheduled monthly amount, the shortfall can be made up, at the option of Deutsche Bank, by the issuance of Shares of the Company. The conversion price per share is the five day volume weighted average price of the Share as traded on the TSX immediately prior to the monthly delivery date for the scheduled delivery month in which such gold shortfall payment obligation arises, less the discount as permitted by the TSX.
In February and March 2012 the Company provided further up-dates to its 2011 surface drilling program on its Mahala Project and its 2011 surface drilling program which evaluated targets for open pit mining at its Jerritt Canyon mine.
On March 23, 2012 the Company received notification from the Federal Mine Safety and Health Administration that they had determined a Potential Pattern of Violations did not exist at the Jerritt Canyon mine.
In April 2012 the Company initiated a process to explore and evaluate potential strategic alternatives to maximize shareholder value. The Company formed a Strategic Review Committee comprised of three board members as well as Deutsche Bank Securities, Inc. and RBC Capital Markets as financial advisors.
In April 2012 the Company entered into a Socio-Economic Participation Agreement with the Kaska First Nations. The Agreement is designed to foster and promote social and economic opportunities for First Nations members and contractors.
On May 3, 2012 John Greenslade, Chairman of the Company, resigned due to other business concerns and on May 10, 2012, Shaun Heinrichs, Chief Financial Officer of the Company, was appointed a director of the Company.
On May 23, 2012, the Company closed a non-brokered private placement of 3,908,177 units at $2.30 per unit for gross proceeds of $8,988,809. Each unit was comprised of one Share and one share purchase warrant. Each warrant is exercisable at $4.00 per share for 36 months from closing, subject to an accelerated expiry. There was no commission paid.
On May 28, 2012, the Company settled outstanding indebtedness in the amount of $6,854,220 by the issuance of an aggregate of 2,284,740 Shares.
On June 7, 2012, the Company entered into an arrangement with Allied Nevada Gold Corp. to process Hycroft gold and silver laden carbon at the carbon plant at Jerritt Canyon.
On June 15, 2012, the Company completed a private placement of convertible debentures in the amount of $6,000,000 principal sum, which is convertible into up to 5,540,000 Shares, 2,010,125 warrants to purchase an additional 2,010,125 shares and 201,012 structuring shares.
On June 19, 2012, Mr. Baldock resigned as President and Chief Executive Officer of the Company. Mr. Shaun Heinrichs and Randy Reichert (Chief Financial Officer and Chief Operating Officer, respectively, of the Company) were appointed the Company’s Co-Chief Executive Officers; such appointments to be effective as at the date of the Company’s Annual General Meeting.
13
At the Company’s 2012 Annual General Meeting held June 27, 2012, Robert Baldock, Pierre Besuchet, Jean-Edgar de Trentinian, Graham Dickson, Gerald Ruth, Francois Marland, Shaun Heinrichs, Simon Solomonidis and Jay Schnyder were re-elected to the Company’s Board of Directors. Shareholders also approved the adoption of a stock option plan which reserves a maximum of 10% of the Company’s issued shares for grant to directors, officers, employees and consultants.
On July 6, 2012, Randy Reichert and Barry Goodfield were appointed to the Company’s Board and Cameron Paterson was appointed the Company’s Vice President – Finance.
On July 19, 2012, the Company completed a private placement of convertible debentures in the amount of $4,000,000 principal sum, which is convertible into up to 3,693,333 Shares, 1,333,333 warrants to purchase an additional 1,333,333 shares and 133,333 structuring shares.
On July 23, 2012, Mr. Marland, a director of the Company was appointed Executive Chairman of the Company and Gerald Ruth, a director of the Company, was appointed Lead Director of the Company. On July 26, 2012 Randy Reichert (COO and Co-CEO of the Company) was appointed a director of the Company and Dr. Barry A. Goodfield was also appointed to the board of directors.
In July 2012, the Company announced the results of the diamond drilling program on the Ketza River Project.
At the Company’s Special Meeting held October 2, 2012, shareholders approved the consolidation of the Company’s Shares on a ten (10) pre-consolidated common share for one (1) post consolidation Share and the change of the Company’s name to its current name.
On October 11, 2012, Whitebox Advisors LLC exercised its option to acquire $2,000,000 principal amount of additional unsecured convertible debentures. The option bears interest at a rate of 11% per annum and will mature 42 months from the closing date.
In October 2012, the Company filed a preliminary short form base shelf prospectus with the British Columbia, Alberta and Ontario Securities Commission and filed the final prospectus on October 31, 2012. The prospectus enabled the Company to make offerings of up to $60,000,000 during the 25 month period that the prospectus remains effective.
In December 2012, the Company closed an offering of 7,200,000 units at a price of $2.10 per Unit to raise an aggregate of $15,120,000. Each unit is comprised of one share and one-half share purchase warrant. Each whole warrant entitles the holder to purchase one share of the Company at a price of $2.35 expiring 48 months from closing.
In December 2012, the Company entered into a subsequent Shareholder Rights Plan Agreement with Computershare Trust Company, subject to acceptance by both the Toronto Stock Exchange and the shareholders of the Company. The Shareholder Rights Plan Agreement has a term of three years and its objective is to achieve full and fair value for the Company’s shareholders in the event of an unsolicited take-over bid.
Whitebox Advisors LLC exercised its option in December 2012 to amend the exercise price of its warrants from $3.00 to $1.95. The option was part of the terms of a subscription agreement entered into with the Company.
Events Subsequent to December 31, 2012
14
On January 16, 2013 the Company provided an update for the fourth quarter of 2012 for its Jerritt Canyon Property. The Company advised that 35,042 ounces of gold had been recovered and shipped 31,754 ounces of gold from processing of underground and stockpile ore at Jerritt Canyon.
On January 22, 2013 the Company announced the assay results from its 2012 underground drilling program at Jerritt Canyon Property.
On January 28, 2013 the Company announced the board of directors had adopted an Advance Notice Policy which policy, amongst other things, includes the provision that requires advance notice to the Company in circumstances where nominations of persons for election to the board of directors are made by shareholders of the Company.
On January 30, 2013 the Company announced that Whitebox Advisors LLC had exercised its option to amend the exercise price of warrants held by them from $3.00 (post consolidation) to $1.95.
On February 14, 2013 the Company provided an up-date on the progress of the development of its newest underground mine, Starvation Canyon, located in the southern portion of the Jerritt Canyon Property.
On February 28, 2013 the Company announced further assay results from its 2012 underground drilling program at Jerritt Canyon.
General
The principal businesses of the Company are the continued mining of the Jerritt Canyon gold mine in Nevada, as well as the acquisition, exploration and development of natural resource properties with a particular focus on the Ketza River and Silver Valley Properties in the Yukon Territory.
Jerritt Canyon is an operating gold complex with two producing underground mines, ore stockpiles and a 1.5 million ton per year capacity processing plant. In addition, the approximately 119 square miles that comprise the Jerritt Canyon property offer a significant number of advanced, early stage and district-scale exploration targets and potential to expand the currently defined mineral reserves and resources proximal to the producing mines. The Company intends to seek and acquire additional near production stage properties worthy of development and within economic trucking distance of the Jerritt Canyon mill.
Summary
The Company is engaged in the acquisition, exploration, development and operation of precious metal properties. The Company continues to investigate and negotiate the acquisition of additional precious metal mining properties or interests in such properties in order to increase the reserve life. There is no assurance that any such investigations or negotiations will result in the completion of an acquisition.
Production and Services
The Company’s principal product is gold, with gold production forming the primary source of revenues. There is a global gold market into which the Company can sell gold and, as a result, the Company is not dependent on a particular purchaser with regard to the sale of the gold that it produces.
Specialized Skill and Knowledge
In order to carry on exploration, mining and milling activities the Company draws on the expertise of various personnel including geologists, engineers, and metallurgists.
15
Competitive Conditions
The precious metal mineral exploration and mining business is a competitive business. The Company must compete with numerous other companies and individuals in the search for and the acquisition of attractive precious metal mineral properties, especially in the current market. The ability of the Company to acquire precious metal mineral properties in the future will depend not only on its ability to develop its present properties and provide necessary ore to the current facilities, but also on its ability to select and acquire suitable producing properties or prospects for precious metal development or mineral exploration.
Environmental Protection
The Jerritt Canyon facilities have been designed to mitigate environmental impacts. The operations have processes, procedures or facilities in place to manage substances that have the potential to be harmful to the environment. In order to prevent and control spills and protect water quality, the mine utilizes multiple levels of spill containment procedures and routine inspection and monitoring of its facilities. The mine has installed air pollution control devices on its facilities that exceeds the minimum requirements significantly and, in the case of mercury emissions, has set the new standard for the state of Nevada. The mine also has various programs to reuse and conserve water at its operations.
In 2009 the Company reached an agreement with the Nevada Division of Environmental Protection (“NDEP”) in the form of a Consent Decree issued by the Attorney General of the State of Nevada, representing the NDEP (the “Consent Decree”). The Consent Decree resolved all of the environmental compliance concerns of the NDEP in relation to the Jerritt Canyon mill and surrounding land holdings, as well as related environmental concerns, and gives the Company the right to operate the Jerritt Canyon milling facility from the effective date. The Consent Decree records and agrees both parties to the terms of an environmental work program and includes penalties for not completing these work programs. The company has completed all but the following work under the Consent Decree:
For 2012 the Company budgeted significant environmental expenditures (approximately $30 million) in order to not only meet the requirements of the Consent Decree (“CD”), but also to meet commitments made to the State of Nevada to improve the compliance of the operations and to improve its environmental performance. One of the most significant capital projects in 2012 was completion of the new tailings facility (“TSF2”) and ancillary water storage reservoirs. These reservoirs support ongoing operations and will facilitate the closure and reclamation of the first tailings pond (“TSF1”). Other significant restoration projects in 2012 included improvements to stormwater controls for several waste rock disposal areas (“RDA’s”) and the advancement of technologies for treating seepage from the RDA’s.
Beginning in 2012, TSF-2 will transition as a replacement repository for mill tailings. The Company anticipates TSF-1 will cease receiving tailings no later than January 2013. TSF-1 will then enter closure and reclamation. The Company is also planning to perform approximately $10.3 million in restoration projects at the mine site, including the initial actions for closure and reclamation of TSF1 and improvements to the reclamation of waste rock disposal areas to diminish the seepage from them.
In 2012, the Company will test on a pilot scale an active method to treat the DASH East Rock Disposal Area (RDA) seepage. If the efforts to diminish the flow rates and the applicable requirements cannot be met, then treatment may be required for the RDA seepages.
QRL has financed the Jerritt Canyon Operation’s reclamation and closure costs by funding a commutation account within an insurance policy with Chartis Insurance (Chartis). This insurance policy and additional cash placed by QRL in a money market account also with Chartis, collateralizes the surety provided to government agencies for closure and reclamation. As of early September 2011, the surety provided to Government agencies was US$81,590,537, including the closure and reclamation of the TSF-2, WSR, expanded mining activities, and additional costs mandated by the State for closure of TSF-1. Approximately 45% of the bond costs are related to control and remedy of the seepage from TSF-1. The Mine Reclamation Plan and Reclamation Cost Estimate dated June 2010 and later revised in September 2010 was submitted to the Bureau of Mining Reclamation (BMRR) Branch. The required surety to government agencies for reclamation of the private land facilities was $70,015,433. QRL estimates the net present value to its closure and reclamation obligations for the Jerritt Canyon Operations at the end of the mine life to be US$44,081,377 (using a 2.6% discount rate). Bond increases are a result of more surface disturbance, increased unit costs (labour, equipment, and fuel costs), and increased remedial actions mandated by government agencies.
16
Employees
As of December 31, 2012, the Company had 11 full-time employees at the head office in Vancouver, two full time employees and 18 seasonal workers, who work on a two weeks on and two weeks off schedule, at the Ketza River location (these numbers are subject to some seasonality), and approximately 355 employees at the Jerritt Canyon gold mine. The Company uses a number of consultants and contractors for a variety of specialized tasks.
Reorganization
Commencing in December 2003, Graham Dickson, the president of the Company, took the initiative in reorganizing the Company by restoring it with the Register of Companies and returning the Company to good standing as a reporting Company in the provinces of British Columbia and Alberta. On January 5, 2004, the Company’s share capital was consolidated on a five (5) old for one (1) new basis and its authorized share capital was increased from 4,000,000 Shares without par value to 100,000,000 Shares without par value; subsequently the Company’s share capital was increased to an unlimited number if Shares without par value. On April 13, 2005, the Company’s Shares commenced trading on the TSX. In 2007 the Company amalgamated with QRL by way of a Plan of Arrangement and renamed the Company from YGC Resources Ltd. to Yukon-Nevada Gold Corp. On October 9, 2012, the Company’s share capital was consolidated on a ten (10) old for one (1) new basis and changed its name to its current name.
Social or Environmental Policies
The Company believes in hiring the majority of the workforce from within the local community at both the Canadian and US properties to the extent possible. The Company has a policy of working with environmental agencies as closely as possible to ensure compliance with the ever-evolving environmental regulations.
Jerritt Canyon Property
The Company conducts ongoing exploration, mine production, closure, and restoration on the Jerritt Canyon Property. Precious metals production has been conducted continuously on the Jerritt Canyon Property for thirty years and the Company is now preparing for a new phase of productive life for the Jerritt Canyon Property. Several major permits have been renewed in the last two years and are being modified further to support ongoing operations while establishing the base for future growth. The Company and the NDEP entered into a Consent Decree in October of 2009 to address legacy issues and environmental controls. Several, but not all, modifications to operations are in response to that Consent Decree (CD). See “Description of the Business – General Environmental Protection” for more information. The Company has also responded to information requests from the United States Environmental Protection Agency (USEPA) on two issues described later in this section.
17
The Nevada mining permit which regulates water pollution control was renewed in June of 2009 for five years. In December of 2010 the Company submitted an application for a major modification to this permit to allow the construction of a new tailings storage facility (TSF2) that included another full update. This new TSF2 will replace the current tailings storage facility (TSF1) first constructed in 1981 and last modified in 1998 which is nearing capacity. The second tailings facility is anticipated to provide six years of storage at planned production rates. All current and planned mining operations have been incorporated into this permit.
An application to renew the site wide Title V Air Quality Permit was accepted by the State of Nevada in June 2008 for a five year time period. The Company is addressing new requirements under that permit as part of the new application. New air pollution control technologies have been installed under the CD in 2012 to control mercury emissions and the State of Nevada is modifying air pollution control permits for these emissions controls. These modifications will allow compliance with State and Federal air pollution control regulations. The end result will be the basis for a fully compliant and permitted Title V permit for the operations in 2013.
A large portion of the Jerritt Canyon mine is located on public land administered by the U.S. Forest Service. The Jerritt Canyon staff maintains a proactive relationship with the U.S. Forest Service personnel, which includes frequent site inspections and up-dates. A majority of the Jerritt Canyon mining district has undergone a formal National Environmental Policy Act (“NEPA”) review as part of the 30 year mining and exploration history of the District. Environmental resources and issues are well defined in this documentation and appropriate mitigation strategies are in place to support and expand operations. Evolving regulatory programs may result in additional review of environmental issues associated with ongoing or planned future operations. Periodic NEPA review of these issues may be required for future expansions and modifications in the operations.
The Company’s operations on public lands managed by the US Bureau of Land Management (BLM) are limited to a very small area associated with the Starvation Canyon Mine access road. The Company has the necessary approvals from the BLM. Additional approvals may be required for expanded exploration plans in the future.
In September, 2010, the site wide Reclamation Permit with the State of Nevada was renewed which includes all current activities at the Jerritt Canyon Property on public and private lands. This permit was modified in 2011 to allow construction of TSF2 and the water storage reserves as well as permit the opening of the Starvation Canyon Mine operations. The development of the access road and portal to Starvation Canyon Mine commenced in the fourth quarter of 2012 and production is anticipated late in the first quarter of 2013.
TSF1 is scheduled to enter closure during 2013 independent of the obligations under the CD. Successful closure and reclamation of TSF1 will lift a significant restoration obligation from the Company. As well, the Company improved surface water controls and testing of water treatment technologies for legacy waste rock disposal areas in 2012 with additional work anticipated for 2013. Reclamation projects are scheduled annually and are completed concurrently with the end of the productive life of the facilities. To date over 1,500 acres of mined lands have been reclaimed.
Reclamation and closure activities are defined and surety is provided to the Federal Government and the State of Nevada for the associated site restoration obligations in the total amount of US$54.88 million. These surety bonds are collateralized by a reclamation and closure insurance policy independently administered by Chartis Insurance Company (Chartis), formerly American Insurance Group (AIG). As reclamation is completed, payment for completing the insured activity is paid to the Company from a pre-funded Commutation Account administered by Chartis. The capacity of this collateralized bond was surpassed in 2010 and was supplemented with cash to make the collateral sufficient. The surety requirements are anticipated to increase as new facilities become necessary and older facilities have not yet been closed and reclaimed. The Company will ensure additional surety capacity as new mines and plant expansions develop in the future
18
The Company temporarily halted operations on the Jerritt Canyon Property in 2009. The State of Nevada then issued a regulatory Stop Order for the operations. The Company negotiated the Consent Decree with the State of Nevada to lift the Stop Order and resume operations. The Consent Decree required closure of certain legacy facilities, improvement of engineered controls for water pollution and development of new air pollution controls for mercury as a condition for lifting the Stop Order. At the time of writing this AIF, the Company was preparing to negotiate an extension and new terms for the CD for those actions not yet completed. Theremaining obligations are related to legacy water quality issues associated with the waste rock disposal areas which the Company is in the process of evaluating.
In 2009, the US Department of Justice (DOJ) signed a complaint against the Company but offered not to file the case with a court if the Company agreed to negotiate a settlement. The Company has maintained this agreement and the filing of the case has been held in abeyance with ongoing 6-month extensions while the matter is reviewed. The complaint has not been provided to the Company by the DOJ but the Company was informed that the complaint relates to the improvements to mercury emissions controls (performed as part of the Company’s compliance with the CD) and the resulting handling of scrubber liquids containing mercury at the Jerritt Canyon Property.
In 2009, the Jerritt Canyon Property was selected by the USEPA for a ‘desktop’ audit of annual reports submitted for its Toxic Release Inventory program. The Company worked with the USEPA to satisfy information requests in 2010. The Company, completely of its own volition, submitted updated reports in August 2011 for several previous years. As of December 31, 2012, the Company has received no response from the USEPA regarding the results of the audit or the updated reports.
The Company is committed to conducting its operations with high environmental values, ethics as well as to social issues. The Company operates in the following manner:
- Complies with applicable laws, regulations, and permit conditions and, where practicable, exceed their minimum requirements;
- Establishes and maintains management systems to monitor all environmental aspects of its activities;
- Reviews these management systems regularly to evaluate their effectiveness and modify them as appropriate to optimize their effectiveness;
- Proactively pursues and evaluates engineering alternatives to better address closure and reclamation obligations;
- Ensures that financial resources are available to meet environmental and reclamation obligations;
- Ensures that the Company’s employees and contractors are aware of the Company’s environmental policies and understand their relevant responsibilities; and
- Actively participates in the ongoing public and private sector debate on environmental and social matters that relate to the mining industry.
The Company is continually striving to improve its environmental performance. Planned environmental capital expenditures for 2013 are US$1.33 million and planned restoration expenditures for 2013 are US$1.54 million.
19
Ketza River Property
The Company currently manages the environmental compliance program in the Yukon Territory through a contracted environmental engineering firm and has onsite personnel to administer the monitoring requirements needed. There are regular consultations with the Yukon Territorial Government to ensure the Company is complying with regulatory requirements. The Company conducted a number of environmental and social impact studies relating to the Yukon Environmental and Socio-economic Assessment Board (YESAB) project proposal and application that was submitted in late September 2011. As of mid-February 2013, the Company has submitted responses to the first set of questions from YESAB as part of the Adequacy Review process. After the YESSA application has successfully passed Adequacy Review, the Screening process will continue. Approval of this project proposal will allow the Company to commence construction of the tailings facility at the site and allow for mine production.
RiskFactors
VG’s indebtedness and the conditions and restrictive covenants imposed on VG by various financing agreements could materially and adversely affect VG’s business and results of operations.
The Company is a party to various financing agreements, including various forward gold purchase contracts. Under the forward gold purchase contracts, the Company has committed to deliver specified amounts of gold in the aggregate amount of 166,628 ounces as of March 28, 2013 over specified periods of time in consideration for gross cash payments from the lenders. The Company’s ability to meet regularly scheduled gold deliveries under the forward gold purchase contracts will depend on the Company’s future operating performance, which in turn will depend on prevailing economic conditions and other factors, many of which may be beyond the Company’s control.
In addition, the Company’s forward gold purchase contracts include various conditions and covenants that require VG to obtain lenders’ consents prior to carrying out certain activities and entering into certain transactions, such as incurring additional debt, creating additional charges on Company assets, and providing additional guarantees or disposing of certain assets.
As a result of the restrictive covenants or other terms of any existing or new loan or other financing agreements, the Company may be significantly restricted in its ability to raise additional capital through bank borrowings and debt to engage in some transactions that VG expects to be of benefit to the Company. The inability to meet these conditions and covenants or obtain lenders’ consent to carry out restricted activities could materially and adversely affect the business and results of operations of VG.
Changes in the market price of gold and other precious metals, which in the past have fluctuated widely, affect the financial condition of VG.
The Company’s profitability and long-term viability depend, in large part, upon the market price of gold and other metals and minerals produced from the Company’s mineral properties. The market price of gold and other precious metals is volatile and is impacted by numerous factors beyond the Company’s control, including:
- global or regional consumption patterns;
- expectations with respect to the rate of inflation;
- the relative strength of the U.S. dollar and certain other currencies;
- interest rates;
- global or regional political or economic conditions, including interest rates and currency values;
- supply and demand for jewellery and industrial products containing metals; and
20
- sales by central banks and other holders, speculators and producers of metals in response to any of the above factors.
The Company cannot predict the effect of these factors on metal prices. A decrease in the market price of gold and other precious metals could affect the Company’s ability to finance its mineral projects. There can be no assurance that the market price of gold and other precious metals will remain at current levels or that such prices will improve. In particular, an increase in worldwide supply, and consequent downward pressure on prices, may result over the longer term from increased production from mines developed or expanded as a result of current metal price levels.
Changes in environmental regulations and permits could impact the ability or cost of VG to operate either the Nevada or Yukon properties.
The Company’s operations and exploration and development activities in Canada and the United States are subject to extensive federal, state, provincial, territorial and local laws and regulations governing various matters, including management of natural resources and environmental protections. The Company’s current and anticipated future operations, including further exploration and development activities and commencement of production on the Company’s properties, require permits from various United States and Canadian federal, state, provincial, territorial and local governmental authorities. There can be no assurance that all permits that the Company requires for the construction of mining facilities, to conduct mining operations and to conduct its other operations will be obtainable on reasonable terms, or at all. Delays or a failure to obtain such permits, or a failure to comply with the terms of any such permits that the Company has obtained, could have a material adverse impact on the Company.
The mine at Jerritt Canyon is currently operating under the Consent Decree relating to certain environmental issues that the Company is to address. Delays or a failure to remedy such issues could have a material adverse impact on the Company.
Operating costs and production are subject to a number of external factors that could impact the sustainability of the Jerritt Canyon mining operations.
The cost of gold production may be impacted by numerous variables including ore grade and gold recovery, backfill and development required, fuel and consumable costs, labour and benefit cost, equipment operating and maintenance costs, and numerous other factors.
Production risk factors may include poor gold recovery, unavailability of skilled labour and management, labour issues with the existing workforce, availability of mining equipment, availability of consumables used in mining, mine pan implementation, weather, governmental regulations and other operating factors.
The figures for VG’s resources and reserves are estimates based on interpretation and assumptions and may yield less mineral production under actual conditions than is currently estimated.
Unless otherwise indicated, mineralization figures presented in this Annual Information Form and in the Company’s other filings with securities regulatory authorities, press releases and other public statements that may be made from time to time are based upon estimates made by Company personnel and independent geologists. These estimates are imprecise and depend upon geologic interpretation and statistical inferences drawn from drilling and sampling analysis, which may prove to be unreliable. There can be no assurance that:
- these estimates will be accurate;
- reserve, resource or other mineralization figures will be accurate; or
21
- this mineralization could be mined or processed profitably.
Mineralization estimates for the Company’s properties may require adjustments or downward revisions based upon further exploration or development work or actual production experience. In addition, the grade of ore ultimately mined, if any, may differ from that indicated by drilling results. There can be no assurance that minerals recovered in small-scale tests will be duplicated in large-scale tests under on-site conditions or in production scale.
The estimating of mineral reserves and mineral resources is a subjective process that relies on the judgment of the persons preparing the estimates. The process relies on the quantity and quality of available data and is based on knowledge, mining experience, analysis of drilling results and industry practices. Valid estimates made at a given time may significantly change when new information becomes available. By their nature, mineral resource and reserve estimates are imprecise and depend, to a certain extent, upon analysis of drilling results and statistical inferences that may ultimately prove to be inaccurate. There can be no assurances that actual results will meet the estimates contained in studies. As well, further studies are required.
Estimated mineral reserves or mineral resources may have to be recalculated based on changes in metal prices, further exploration or development activity or actual production experience. This could materially and adversely affect estimates of the volume or grade of mineralization, estimated recovery rates or other important factors that influence mineral reserve or mineral resource estimates. The extent to which mineral resources may ultimately be reclassified as mineral reserves is dependent upon the demonstration of their profitable recovery. Any material changes in mineral resource estimates and grades of mineralization will affect the economic viability of placing a property into production and a property’s return on capital. The Company cannot provide assurance that mineralization can be mined or processed profitably.
The resource and reserve estimates contained in this Prospectus have been determined and valued based on assumed future prices, cut-off grades and operating costs that may prove to be inaccurate. Extended declines in market prices for precious metals may render portions of the Company’s mineralization uneconomic and result in reduced reported mineralization. Any material reductions in estimates of mineralization, or of the Company’s ability to extract this mineralization, could have a material adverse effect on VG’s results of operations or financial condition.
The failure to establish proven and probable reserves could restrict the Company’s ability to successfully implement its strategies for long-term growth and could impact future cash flows, earnings, results of operation and financial condition.
VG’s ability to continue its production and exploration activities, and to continue as a going concern, will depend in part on its ability to continue production and generate material revenues or to obtain suitable financing.
VG has limited financial resources. In the future, the Company’s ability to continue its production and exploration activities, if any, will depend in part on the Company’s ability to continue production and generate material revenues or to obtain suitable financing. Any unexpected costs, problems or delays could severely impact the Company’s ability to continue these activities.
There can be no assurance that the Company will continue production at its Jerritt Canyon Mine or generate sufficient revenues to meet its obligations as they become due or obtain necessary financing on acceptable terms, if at all. The Company’s failure to meet its ongoing obligations on a timely basis could result in the loss or substantial dilution of the Company’s interests (as existing or as proposed to be acquired) in its properties. In addition, should the Company incur significant losses in future periods, it may be unable to continue as a going concern, and realization of assets and settlement of liabilities in other than the normal course of business may be at amounts materially different than the Company’s estimates.
22
VG is exposed to credit, liquidity, interest rate and currency risk.
Credit risk is the risk of an unexpected loss if a customer or third party to a financial instrument fails to meet its contractual obligations. The Company’s cash equivalents and short-term investments are held through large Canadian financial institutions. Short-term and long-term investments (including those presented as part of cash and cash equivalents) are composed of financial instruments issued by Canadian banks and companies with high investment-grade ratings. These investments mature at various dates over the current operating period.
Liquidity risk is the risk of loss from not having sufficient funds to meet financial obligations as they fall due. The Company manages liquidity risk through forecasting its cash flows from operations and anticipating investing and financing activities. Senior management is actively involved in the review and approval of planned expenditures and typically ensures that it has sufficient cash on demand to meet expected operating expenses.
Interest rate risk is the risk that the fair values and future cash flows of the Company will fluctuate because of changes in market interest rates. The Company is exposed to interest rate risk on its cash and cash equivalents. The Company’s cash and cash equivalents contain highly liquid investments that earn interest at market rates. Fluctuations in market interest rates do not have a significant impact on the Company’s results from operations due to the short term to maturity of the investments held.
The Company is exposed to the financial risk related to the fluctuation of foreign exchange rates. The Company operates in Canada and the United States and a portion of its expenses are incurred in U.S. dollars. A significant change in the currency exchange rates between the Canadian dollar relative to the U.S. dollar could have an effect on the Company’s results of operations, financial position or cash flows. The Company has not hedged its exposure to currency fluctuations.
VG’s ability to continue as a going concern is dependent on raising additional capital, which it may not be able to do on favorable terms, or at all.
VG will need to raise additional capital to support its continuing operations. The Company can provide no assurance that additional funding will be available on a timely basis, on terms acceptable to the Company, or at all. If the Company is unsuccessful raising additional funding, its business may not continue as a going concern. Even if the Company does find additional funding sources, it may be required to issue securities with greater rights than those currently possessed by holders of its common shares. The Company may also be required to take other actions that may lessen the value of its common shares or dilute its common shareholders, including borrowing money on terms that are not favorable to the Company or issuing additional equity securities. If the Company experiences difficulties raising money in the future, its business and liquidity will be materially adversely affected.
General economic conditions may adversely affect VG’s growth, future profitability and ability to finance.
The unprecedented events in global financial markets in the past several years have had a profound impact on the global economy. Many industries, including the mining industry, are impacted by these market conditions. Some of the key impacts of the current financial market turmoil include contraction in credit markets resulting in a widening of credit risk, devaluations, high volatility in global equity, commodity, foreign exchange and precious metal markets and a lack of market liquidity. A worsening or slowdown in the financial markets or other economic conditions, including but not limited to, consumer spending, employment rates, business conditions, inflation, fuel and energy costs, consumer debt levels, lack of available credit, the state of the financial markets, interest rates and tax rates, may adversely affect the Company’s growth and ability to finance. Specifically:
23
- the global credit/liquidity crisis could impact the cost and availability of financing and the Company’s overall liquidity;
- the volatility of metal prices would impact the Company’s revenues, profits, losses and cash flow;
- negative economic pressures could adversely impact demand for the Company’s production;
- construction related costs could increase and adversely affect the economics of any of the Company’s projects;
- volatile energy, commodity and consumables prices and currency exchange rates would impact the Company’s production costs; and
- the devaluation and volatility of global stock markets would impact the valuation of the Company’s equity and other securities.
Significant uncertainty exists related to inferred mineral resources.
There is a risk that inferred mineral resources referred to in this Prospectus cannot be converted into measured or indicated mineral resources as there may be limited ability to assess geological continuity. Due to the uncertainty relating to inferred mineral resources, there is no assurance that inferred mineral resources will be upgraded to resources with sufficient geological continuity to constitute measured and indicated resources as a result of continued exploration. See“Cautionary Note to United States Investors”.
Mining is inherently dangerous and subject to conditions or events beyond VG’s control, which could have a material adverse effect on VG’s business.
Mining involves various types of risks and hazards, including:
- environmental hazards;
- industrial accidents;
- metallurgical and other processing problems;
- unusual or unexpected rock formations;
- structural cave-ins or slides;
- flooding;
- fires;
- power outages;
- labour disruptions;
- explosions;
- landslides and avalanches;
- mechanical equipment and facility performance problems;
- availability of materials and equipment;
- metals losses; and
- periodic interruptions due to inclement or hazardous weather conditions.
These risks could result in damage to, or destruction of, mineral properties, production facilities or other properties; personal injury or death, including to employees; environmental damage; delays in mining; increased production costs; asset write downs; monetary losses; and possible legal liability. The Company may not be able to obtain insurance to cover these risks at economically feasible premiums or at all. Insurance against certain environmental risks, including potential liability for pollution or other hazards as a result of the disposal of waste products occurring from production, is not generally available to the Company or to other companies within the mining industry. The Company may suffer a material adverse impact on its business if it incurs losses related to any significant events that are not covered by its insurance policies.
24
Exploration, construction and production activities may be limited and delayed by inclement weather and shortened exploration, construction and development seasons.
VG is subject to certain uninsured risks which may result in losses and have a material adverse effect upon the financial performance and results of operations of VG.
The Company’s business is subject to a number of risks and hazards generally, including adverse environmental conditions, industrial accidents, labour disputes, unusual or unexpected geological conditions, ground or slope failures, cave-ins, changes in the regulatory environment and natural phenomena such as inclement weather conditions, floods, fire and earthquakes. Such occurrences could result in damage to mineral properties or production facilities, personal injury or death, environmental damage to the Company’s properties or the properties of others, delays in mining, monetary losses and possible legal liability.
The Company currently maintains a limited amount of liability insurance. Although the Company may in the future maintain additional insurance to protect against certain risks in such amounts as it considers to be reasonable, its insurance will not cover all the potential risks associated with a mining company’s operations. VG may also be unable to maintain insurance to cover these risks at economically feasible premiums. Insurance coverage may not continue to be available or may not be adequate to cover any resulting liability. Moreover, insurance against risks such as environmental pollution or other hazards as a result of exploration and production is not generally available to the Company or to other companies in the mining industry on acceptable terms. The Company might also become subject to liability for pollution or other hazards which may not be insured against or which the Company may elect not to insure against because of premium costs or other reasons. Losses from these events may cause the Company to incur significant costs that could have a material adverse effect upon its financial performance and results of operations.
VG requires various permits to conduct its current and anticipated future operations, and delays or failures in renewing such permits, or a failure to comply with the terms of any such permits that VG has obtained, could have a material adverse impact on VG.
The Company’s current and anticipated future operations, including further exploration and development activities and commencement of production on the Company’s properties, require permits from various United States and Canadian federal, state, provincial, territorial and local governmental authorities. There can be no assurance that all permits that the Company requires for the construction of mining facilities and to conduct mining operations will be obtainable on reasonable terms, or at all. Delays or a failure to obtain such permits, or a failure to comply with the terms of any such permits that the Company has obtained, could have a material adverse impact on the Company.
The duration and success of efforts to obtain and renew permits are contingent upon many variables not within the Company’s control. Shortage of qualified and experienced personnel in the various levels of government could result in delays or inefficiencies. Backlog within the permitting agencies could affect the permitting timeline of the various projects. Other factors that could affect the permitting timeline include (i) the number of other large-scale projects currently in a more advanced stage of development which could slow down the review process and (ii) significant public response regarding a specific project. As well, it can be difficult to assess what specific permitting requirements will ultimately apply to all the projects.
25
VG is subject to significant regulation from various governmental authorities and failure to comply with their requirements may result in increased cost or an interruption in VG’s operations.
The Company’s operations and exploration and development activities in Canada and the United States are subject to extensive federal, state, provincial, territorial and local laws and regulations governing various matters, including:
- management of natural resources;
- exploration and development of mines, production and post-closure reclamation;
- exports;
- price controls;
- taxation and mining royalties;
- regulations concerning business dealings with native groups;
- labor standards and occupational health and safety, including mine safety; and
- historic and cultural preservation.
Failure to comply with applicable laws and regulations may result in civil or criminal fines or penalties or enforcement actions, including orders issued by regulatory or judicial authorities enjoining, curtailing or closing operations or requiring corrective measures, installation of additional equipment or remedial actions, any of which could result in the Company incurring significant expenditures. The Company may also be required to compensate private parties suffering loss or damage by reason of a breach of such laws, regulations or permitting requirements.It is also possible that future laws and regulations, or a more stringent enforcement of current laws and regulations by governmental authorities, could cause additional expense, capital expenditures, restrictions on or suspensions of the Company’s operations and delays in the exploration and development of the Company’s properties.
VG has ongoing reclamation on some of its mineral properties and may be required to fund additional work that could have a material adverse effect on its financial position.
Land reclamation requirements are generally imposed on mineral exploration companies (as well as companies with mining operations) in order to minimize long term effects of land disturbance. Reclamation may include requirements to:
- treat ground and surface water to drinking water standards;
- control dispersion of potentially deleterious effluents; and
- reasonably re-establish pre-disturbance land forms and vegetation.
Financial resources spent on reclamation might otherwise be spent on further exploration and development programs. In addition, regulatory changes could increase the Company’s obligations to perform reclamation and mine closing activities. There can be no assurance that the Company will not be required to fund additional reclamation work at these sites that could have a material adverse effect on the Company’s financial position.
26
Title and other rights to VG’s mineral properties cannot be guaranteed, are subject to agreements with other parties and may be subject to prior unregistered agreements, transfers or claims and other defects.
The Company cannot guarantee that title to its properties will not be challenged. The Company may not have, or may not be able to obtain, all necessary surface rights to develop a property. Title insurance is generally not available for mineral properties and the Company’s ability to ensure that it has obtained secure claim to individual mineral properties or mining concessions may be severely constrained. The Company’s mineral properties may be subject to prior unregistered agreements, transfers or claims, and title may be affected by, among other things, undetected defects. The Company has not conducted surveys of all of the claims in which it holds direct or indirect interests. A successful challenge to the precise area and location of these claims could result in the Company being unable to operate on its properties as permitted or being unable to enforce its rights with respect to its properties. This could result in the Company not being compensated for its prior expenditure relating to the property.
VG currently relies on a limited number of properties.
The principal property interests of the Company are currently its interest in the properties known as the Jerritt Canyon gold mine in Nevada and the Ketza River and Silver Valley Properties in the Yukon Territory. As a result, unless the Company acquires additional property interests, any adverse developments affecting those properties could have a material adverse effect upon the Company and could materially and adversely affect the potential mineral resource production, profitability, financial performance and results of operations of the Company.
VG’s issuance of debt may impair its ability to take advantage of future business opportunities.
The Company may enter into transactions to acquire assets or the shares of other corporations which may be financed partially or wholly with debt, which may increase its debt levels above industry standards. The Company’s articles do not limit the amount of indebtedness that it can incur. The level of the Company’s indebtedness could impair its ability to obtain additional financing in the future to take advantage of business opportunities that may arise.
VG may be subject to legal proceedings.
Due to the nature of its business, the Company may be subject to numerous regulatory investigations, claims, lawsuits and other proceedings in the ordinary course of its business. The results of these legal proceedings cannot be predicted with certainty due to the uncertainty inherent in litigation, including the effects of discovery of new evidence or advancement of new legal theories, the difficulty of predicting decisions of judges and juries and the possibility that decisions may be reversed on appeal. There can be no assurances that these matters will not have a material adverse effect on the Company’s business.
Recent high metal prices have encouraged mining exploration, development and construction activity, which has increased demand for and cost of contract mining services and equipment.
Recent increases in metal prices have encouraged increases in mining exploration, development and construction activities, which have resulted in increased demand for and cost of contract exploration, development and construction services and equipment. Increased demand for and cost of services and equipment could cause project costs to increase materially, resulting in delays if services or equipment cannot be obtained in a timely manner due to inadequate availability, and increased potential for scheduling difficulties and cost increases due to the need to coordinate the availability of services or equipment, any of which could materially increase project exploration, development or construction costs, result in project delays, or both.
27
Increased competition could adversely affect VG’s ability to attract necessary capital funding or acquire suitable producing properties or prospects for mineral exploration in the future.
The mining industry is intensely competitive. Significant competition exists for the acquisition of properties producing or capable of producing metals. The Company may be at a competitive disadvantage in acquiring additional mining properties because it must compete with other individuals and companies, many of which have greater financial resources, operational experience and technical capabilities than the Company or are further advanced in their development or are significantly larger and have access to greater mineral reserves, for the acquisition of mineral claims, leases and other mineral interests. The Company may also encounter increasing competition from other mining companies in its efforts to hire experienced mining professionals. Competition for exploration resources at all levels is currently very intense, particularly affecting the availability of manpower, drill rigs and helicopters. Increased competition could adversely affect the Company’s ability to attract necessary capital funding or acquire suitable producing properties or prospects for mineral exploration in the future. If the Company is unsuccessful in acquiring additional mineral properties or qualified personnel, it will not be able to grow at the rate it desires, or at all.
VG may experience difficulty attracting and retaining qualified management and technical personnel to meet the needs of its anticipated growth, and the failure to manage VG’s growth effectively could have a material adverse effect on VG’s business and financial condition.
The Company is dependent on the services of key executives. Due to the Company’s relatively small size, the loss of these persons or the Company’s inability to attract and retain additional highly skilled employees required for the development of the Company’s activities may have a material adverse effect on the Company’s business or future operations.
There can be no assurance that VG will successfully acquire additional mineral rights.
Most exploration projects do not result in the discovery of commercially mineable ore deposits and no assurance can be given that any particular level of recovery of ore reserves will be realized or that any identified mineral deposit will ever qualify as a commercially mineable (or viable) ore body which can be legally and economically exploited. Estimates of reserves, mineral deposits and production costs can also be affected by such factors as environmental permitting regulations and requirements, weather, environmental factors, unforeseen technical difficulties, unusual or unexpected geological formations and work interruptions. If current exploration programs do not result in the discovery of commercial ore, the Company may need to write-off part or all of its investment in existing exploration stage properties, and may need to acquire additional properties. Material changes in ore reserves, grades, stripping ratios or recovery rates may affect the economic viability of any project.
VG’s future growth and productivity will depend, in part, on its ability to identify and acquire additional mineral rights, and on the costs and results of continued exploration and development programs. Mineral exploration is highly speculative in nature and is frequently non-productive. Substantial expenditures are required to:
- establish ore reserves through drilling and metallurgical and other testing techniques;
- determine metal content and metallurgical recovery processes to extract metal from the ore; and
- construct, renovate or expand mining and processing facilities.
In addition, if the Company discovers a mineral deposit, it would take several years from the initial phases of exploration until production is possible. During this time, the economic feasibility of production may change. As a result of these uncertainties, there can be no assurance that the Company will successfully acquire additional mineral rights.
28
Some of the directors have conflicts of interest as a result of their involvement with other natural resource companies.
Certain of the directors of the Company also serve as directors, or have significant shareholdings in, other companies involved in natural resource exploration and development or mining-related activities. To the extent that such other companies may participate in ventures in which the Company may participate in, or in ventures which the Company may seek to participate in, the directors may have a conflict of interest. In all cases where the directors have an interest in other companies, such other companies may also compete with the Company for the acquisition of mineral property investments. Such conflicts of the directors may result in a material and adverse effect on the Company’s profitability, results of operation and financial condition. As a result of these conflicts of interest, the Company may miss the opportunity to participate in certain transactions, which may have a material adverse effect on the Company’s financial position.
Global climate change is an international concern, and could impact VG’s ability to conduct future operations.
Global climate change is an international issue and receives an enormous amount of publicity. The Company would expect that the imposition of international treaties or U.S. or Canadian federal, state, provincial or local laws or regulations pertaining to mandatory reductions in energy consumption or emissions of greenhouse gasses could affect the feasibility of mining projects and increase operating costs.
Adverse publicity from non-governmental organizations could have a material adverse effect on the Company.
There is an increasing level of public concern relating to the effect of mining production on its surroundings, communities and environment. Non-governmental organizations (“NGOs”), some of which oppose resource development, are often vocal critics of the mining industry. While the Company seeks to operate in a socially responsible manner, adverse publicity generated by such NGOs related to extractive industries, or the Company's operations specifically, could have an adverse effect on the reputation and financial condition of the Company or its relationships with the communities in which it operates.
VG may be a “passive foreign investment company” under the U.S. Internal Revenue Code, which could result in adverse tax consequences for investors in the United States.
VG is a Canadian company and U.S. investors may have difficulty bringing actions and enforcing judgments against the Company.
The Company is incorporated under the laws of British Columbia, Canada and certain of the Company’s directors and officers and experts named in this Prospectus are residents of Canada and Switzerland. Consequently, it may be difficult for U.S. investors to effect service of process within the United States upon the Company or upon such persons who are not residents of the United States, or to realize in the United States upon judgments of U.S. courts predicated upon civil liabilities under U.S. securities laws. A judgment of a U.S. court predicated solely upon such civil liabilities may be enforceable in Canada by a Canadian court if the U.S. court in which the judgment was obtained had jurisdiction, as determined by the Canadian court, in the matter. There is substantial doubt whether an original action could be brought successfully in Canada against any of such persons or the Company predicated solely upon such civil liabilities.
29
JerrittCanyonMine,Nevada
The following description summarizes selected information about the Company’s Jerritt Canyon Gold Project. Please refer to the Company’s Annual Information Form for the fiscal year ended December 31, 2011, and the NI 43-101 compliant technical report entitled “NI 43-101 Technical Report, Yukon-Nevada Gold Corp., Jerritt Canyon Property, Elko County, Nevada, USA” dated April 27, 2012 with an effective date of December 31, 2011 available atwww.sedar.com, for a further description of this property, including its location, accessibility, climate, local resources, infrastructure, physiography, geological setting, mineralization, past drilling programs and history.
Property Description and Location
Jerritt Canyon Mine is located in Elko County, Nevada, approximately 50 miles north of Elko in the Independence Mountains at Latitude 41º 23’ North, Longitude 116º West. The property is accessed by paved State Highway 225 about 45 miles to the paved mine access road. The property lies in ten townships within T39N to T41N and R52E to R54E relative to the Mount Diablo Base Line and Meridian (MDB&M). A property location map is shown below. The property boundaries are located in the field with wooden stakes and were likely originally measured by tape and compass either from Section corners or adjacent claims. All property boundaries have since been located with modern surveying equipment and/or GPS (Trimble 5800 RTK GPS Rover utilizing a Trimble base receiver for reference corrections) with an accuracy of ±0.5 cm horizontal accuracy and a vertical accuracy of ±1 cm.
All of the drill hole data stored in the acQuire drill hole database are projected in Jerritt Grid. All plan map figures and cross-sections presented are also presented in Jerritt Grid. Jerritt Grid is projected in foot units and equivalent to the NAD1927 State Plane, Nevada East, FIPS_2701 system with a difference of 2,000,000 feet subtracted from the northing grid values in order to limit the number of numeric characters to adhere to mining software constraints.
The property is 100% owned and operated by QRL which acquired the mine from the previous owner, a joint venture between Anglo Gold (70%) and Meridian Gold (30%), at the end of June 2003. QRL is a wholly owned subsidiary of VG. The following claim details were discussed with Mr. Joel Casburn, the current QRL Land Manager, on April 3, 2012.
The operations are located on a combination of public and private lands, with the mines and mining related surface facilities being primarily located on mining claims in United States Forest Service (USFS) land within the Humboldt-Toiyabe National Forest. The process facilities, office, shop, and tailings are located on private land owned by QRL. Additional claims in the southern part of the land package are mostly located on private land with some located on land administered by the United States Bureau of Land Management (BLM). Claim-related fees are annually paid to the BLM and Elko County.
QRL owns 2,851 claims, 1,011 acres of patented claims, and 12,433 acres of fee land; in addition, QRL leases 278 claims and 11,271 acres of fee land with mineral rights. A map depicting the 2010 general land package is shown below. All Jerritt Canyon property claims expire on September 1, 2012 but are always renewed every year by filing the necessary paperwork and claim fees with the BLM and the County. Estimated costs to maintain the 2,851 QRL-owned claims are $400,400 ($140 per claim) whereas the 278 leased claims are $38,920 (also at $140 per claim). Contributing author, Michele White, has reviewed the lease agreements and Jerritt claim map and finds them to be current and in good order.
30
Land and Claim Summary for QRL’s Jerritt Canyon Project
| Land Status | No. Claims | Acres | |
| Owned Claims | 2,851 | | |
| Leased Claims | 278 | | |
| Total Claims | 3,129 | | |
| Fee Land Owned | | 12,433 | |
| Patented Claims Owned | | 1,011 | |
| Fee Land Leased | | 11,271 | |
| Total Acres | | 24,715 | |
QRL controls more than 119 square miles of ground encompassing the mine area and surrounding acreage. The bulk of this is in the form of contiguous unpatented mining claims which are held in force by production from the mining activities. No production royalties are paid for gold deriving from these claims. Some property is leased from landowners in the region, and a royalty is paid on production from these lands. The royalty for mined material in 2011 varied by location and was as much as 5 percent of net smelter return (NSR), the total cost of which is dependent upon the gold sale price and the refining results.
31
General Location Map of the Jerritt Canyon Mine
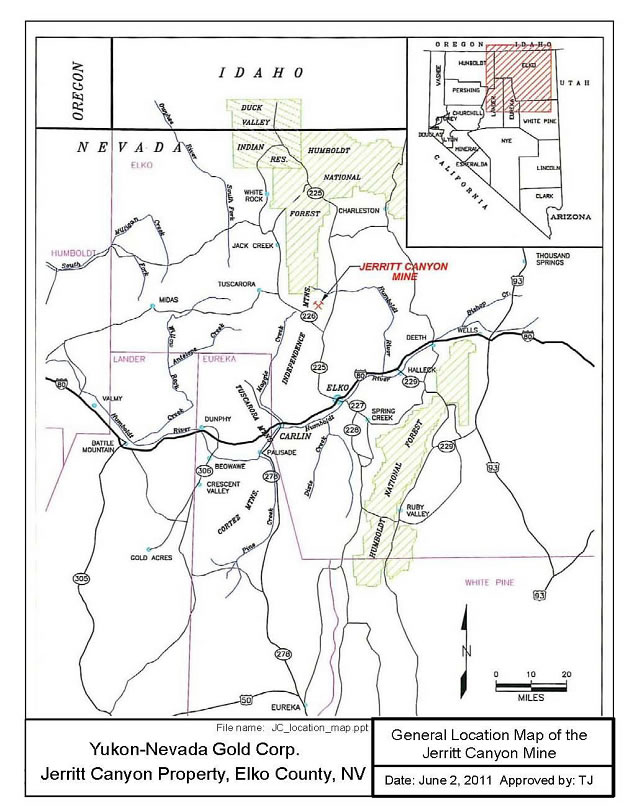
32
General Land Map of the Jerritt Canyon Property with Model Areas
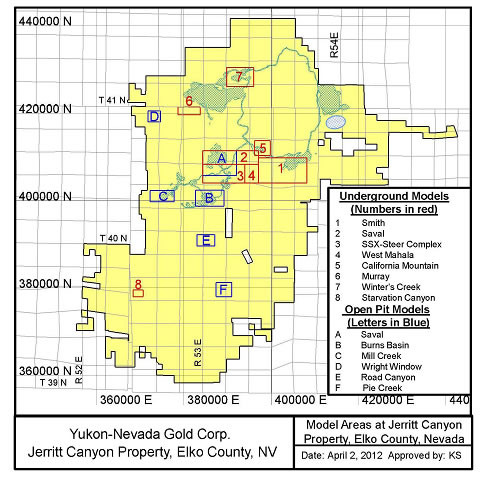
The resource and reserve areas and mine facilities are located within QRL owned or leased claims and fee land. The plan map above shows the location of the property and claim boundary along with the model areas which contain the resources and/or reserves. The blue lettered areas are open pit models and the red numbered areas are the underground models.
Mr. John Barta, QRL’s Environmental Manager, provided the review of environmental and permitting activities at the Jerrritt Canyon Project.
Environmental liabilities at the mine include:
- High sulfate and Total Dissolved Solids (TDS) in surface water seepage from four rock disposal areas (RDAs); and
- Site closure and restoration including management of underground seepage from the tailings impoundment.
Since being selected for inclusion in the 1981 Environmental Impact Statement (EIS), RDA design criteria have resulted in structuring the RDAs to drain toward the interior to avoid erosion. This design has resulted in four RDAs that exhibit seepage: the Marlboro Canyon, Gracie, Snow Canyon, and DASH East RDAs.
33
Jerritt Canyon staff has worked with the Nevada Division of Environmental Protection – Bureau of Mining Regulation and Reclamation (NDEP/BMRR) to develop mitigation and monitoring plans for these seepages. The Company is developing plans to diminish the flow rate of the seepages and to develop water quality standards for these discharges. In 2012, the Company will begin testing several different strategies to diminish the capture and infiltration of precipitation by the RDAs and to diminish RDA seepage to the extent practicable. The Company anticipates strategies that test successfully may be incorporated into future designs for RDAs.
In 2011 a pilot treatment plant was constructed and in 2012, the Company will test on a pilot scale an active method to treat the DASH East RDA seepage. If the efforts to diminish the flow rates and the applicable requirements cannot be met, then treatment may be required for the RDA seepages.
The mine installed a sulfate reduction trench, a passive method of treatment, in Marlboro Canyon to reduce the sulfate and TDS concentrations. Monitoring discharged material captured in the sulfate reduction trench showed sufficient reductions in the concentrations for the first 12-14 months but after that reductions were not considered acceptable to the NDEP. VG is testing organic additives to stimulate the reduction process and will test a stimulant in the field if a candidate stimulant is identified. Monitoring continued through 2011. The discharge ultimately flows into Jerritt Creek which flows into Independence Valley through several ranch properties and infiltrates into the sub-surface alluvium. Sample analyses downstream from the sulfate reduction trench have shown levels of sulfate and TDS acceptable to NDEP standards.
The first phase of the existing tailings storage facility (TSF-1) was designed in 1979-1980, incorporates an earthen embankment and liner and does not have a synthetic liner. The first phase of construction was completed in October of 1981. Seepage was first observed in March of 1982 and efforts to control and manage the seepage have been ongoing since that time. In 2011, the Company completed improvements as part of an updated optimization plan for the Seepage Recovery System (SRS). By September 2012, the Company expects to complete the construction a new Tailings Storage Facility (TSF-2) and ancillary Water Storage Reservoir (WSR). The TSF-2 is expected to transition in 2012 as a replacement repository for mill tailings. It is anticipated that TSF-1 will cease receiving mill tailings no later than January, 2014. TSF-1 will then enter closure and reclamation.
In response to requirements under the October 13, 2009 Consent Decree, the Company designed, installed and tested new control technology for mercury emissions for the roasters. The performance tests have proven to be successful, and it is expected that the technology will be installed in all stationary sources of mercury emissions by 2012. The calomel system was installed at the roaster facility and operational on July 20, 2009. The technology responsible for the calomel-based scrubber system is patent pending and owned by a senior VG executive. Stack tests are being done on a routine basis and monitored by a third party contractor to monitor the efficiency of the newly installed emissions control system and so far it is performing well and surpassing the thresholds defined in the Consent Decree and/or agreements with the NDEP.
Approved reclamation and closure plans are in place, and the mine is concurrently reclaiming disturbance when possible. Approximately 25% of the mining disturbances have already been reclaimed and await release of the re-vegetation requirement. Mine staff and the USFS/NDEP update the reclamation bond on an annual basis.
QRL has financed the Jerritt Canyon reclamation and closure costs by funding a commutation account within an insurance policy with Chartis Insurance (Chartis). This insurance policy, and additional cash placed by QRL in a money market account also with Chartis, collateralizes the surety Chartis provides to government agencies for closure and reclamation. As of early September 2011, the surety provided to government agencies was US$81,590,537, including the closure and reclamation of the TSF-2, WSR, expanded mining activities, and additional costs mandated by the State for closure of TSF-1. Approximately 45% of the bond costs are related to control and remedy of the seepage from TSF-1. The Mine Reclamation Plan and Reclamation Cost Estimate dated June 2010 and later revised in September 2010 was submitted to the Bureau of Mining Regulation and Reclamation (BMRR) Branch. The required surety to government agencies for reclamation of the private land facilities was $70,015,433. QRL estimates the net present value of to its closure and reclamation obligations for the Jerritt Canyon Operations at the end of the mine life to be US$36,407,843. Bond increases are a result of more surface disturbance, increased unit costs (labor, equipment, and fuel costs) and increased remedial actions mandated by government agencies.
34
Operating permits for the mine are in place and are presented in the table below. The mine is currently operating under a Consent Decree agreement (2009) between QRL and the State of Nevada. Environmental management systems are in place and are managed by an experienced and qualified onsite environmental staff. Operating and maintenance staffs are informed of their responsibilities during annual MSHA refresher classes. In addition to MSHA classes, the mine holds leadership classes for the supervisory staff. During these classes, supervisors are informed of their environmental responsibilities.
Permitting activities with the State of Nevada are completed to advance the Starvation Canyon project to an underground mine project. QRL has secured the Water Pollution Control Permit for this project and the Reclamation permit, including the bonding. Groundwater monitoring is in progress. The Nevada
Highway Department may also need to be notified if any Starvation Canyon ore is planned to be hauled on State Highways to the Jerritt Canyon Processing Facility.
Operating Permits
| Permit/Approval | Granting Agency | Comments |
| Plan of Operations | USFS | Still active. |
| Work Plans | USFS | Annual work plan submitted to USFS and NDEP |
| Clean Water Act Section 404 Permit | U.S. Army Corp. of Engineers | Expired in 2007. There are no triggers requiring the update. |
| EPA ID Number | U.S. Environmental Protection Agency | The Mine, a large-quantity generator, has the typical hazardous wastes found at a mine such as laboratory cupels and crucibles, and cleaners from maintenance operations. Wastes are accumulated and full drums are shipped once every calendar quarter for disposal. |
| Air Quality Permit | Nevada Division of Environmental Protection (NDEP/Bureau of Air Pollution Control | The Mine has a current Title V air permit. Improved pollution controls for mercury emissions and expanded monitoring and management systems developed under the Consent Decree are being incorporated in the permit. |
| Reclamation Permit | USFS and NDEP/Bureau of Mining Regulation and Reclamation (BMRR) | The bond estimate is updated annually with the USFS and the NDEP. The bonding includes the construction of the new tailings storage facility (TSF), water storage reservoir, expanded mining activities, and additional costs for the closure of the existing TSF. |
35
| Permit/Approval | Granting Agency | Comments |
| Water Pollution Control Permit | NDEP-BMRR | One water pollution control permit covers the entire mine area. The tailings seepage/chloride plume is managed by a recovery system and will be mitigated by closure of the existing TSF; and the high sulphate/total dissolved solids emanating from four rock disposal areas will be diminished by improved reclamation and surface water controls. |
| Underground Injection Control | NDEP/Bureau of Water Pollution Control | Addresses dewatering from the underground mines. There is currently no active underground injection. |
| Solid Waste Class III Landfill Waiver | NDEP/Bureau of Solid Waste | The Mine has three authorized landfills at the lower mill area, Burns Basin, and Alchem. Employees are instructed during annual MSHA refreshers with regard to what is acceptable to dispose of in the landfill. |
| General Stormwater Discharge Permit NVR300000 | NDEP/Bureau of Water Pollution Control | Annual reports are submitted to NDEP. No concerns have been noted. A general permit is in place. No concerns were noted. |
| Permit to Appropriate Waters | NV Division of Water Resources | No concerns were identified. The Mine has sufficient appropriations to cover processing and dewatering needs. |
Permit to Construct
Impoundments/Dam Safety | NV Division of Water Resources
| No concerns identified.
|
| Industrial Artificial Pond Permits | Nevada Department of Wildlife | No concerns identified. |
| Liquefied Petroleum Gas License | NV Board of the Regulation of Liquefied Petroleum Gas | No concerns identified. |
| Potable Water System | Nevada State Health Division | Potable water systems are located at the Murray, SSX, and millsite. Upgrades are underway in 2011 for the SSX and millsite systems. |
| Septic System Permit | Nevada State Health Division | The Mine has general permits for five systems: SSX; Steer; Murray; USA; and Smith. The mill site has a package plant that discharges to the tailings impoundment. No concerns identified. The package plan will be updated in 2011. |
Accessibility, Climate, Local Resources, Infrastructure and Physiography
The Jerritt Canyon Mine is located in Elko County, Nevada, approximately 50 miles north of Elko. Access to the property is by State Road 225 to the mine access road. The roads are paved and in excellent condition all the way to the main gate where the administrative offices, process plant, warehouse, and tailings impoundment are located. The mines are accessed by haul roads on QRL controlled land.
The climate is temperate with winter temperatures between 0º and 40º Fahrenheit and summer temperatures between 35º and 90º. Average annual precipitation at the tailings impoundment is estimated at 14 inches per year with an estimated annual average evaporation of 43 inches. A significant amount of the total precipitation falls as snow and increases with elevation to the mining areas. Mine operations are only rarely halted by weather conditions, although ore haulage from the mines may be slowed. The mill, warehouse, shop, and administrative facilities are at a lower elevation and therefore are less exposed to weather extremes. Snowfall is generally common from the months of December to May.
36
The vegetation is typical of the Basin and Range province with sagebrush vegetation dominant at the lower elevations. Small stands of aspen and isolated fir trees grow in canyons and drainages.
Jerritt Canyon mine is located in the Independence Mountain Range in the Basin and Range province of northern Nevada. The topography ranges from about 6,400 feet at the administrative facilities and mill site to about 8,000 feet at the highest point of the haul road to the mines.
Elko, Nevada with a population of 18,300, is the closest city to the mine. The city is on Interstate 80 and is serviced by daily commercial flights to Salt Lake City, Utah. Elko is a center for the mining operations in northern Nevada and services necessary for the mine are readily available there. The local population, along with the proximity of the other nearby cities (e.g. Salt Lake City in Utah and Battle Mountain, Winnemucca, Fernley, Fallon, Reno in Nevada) is large enough to supply most of the workers and supplies for all of the mines in the area.
Power to the minesite is purchased from Nevada Energy through a 125kV, 3-phase transmission line. Cost of electrical power is approximately US$0.066/kWh.
A new natural gas pipeline has recently been installed to the south of the property by another company. QRL is examining opportunities to use natural gas to help power some of the mine facilities.
There are sufficient supplies of water at the site to allow the processing facility and other mine facilities to efficiently operate. Approximately 700 gallons per minute (gpm) of water is required to operate the mill with two primary water sources: (1) a “dirty” water source consisting of the tailings storage facility 1 (TSF-1) seepage collection system that has contributions from 90 small diameter water wells around the TSF-1, four seepage collection trenches, and three embankment blanket drains that collectively produce 1,000 gpm; and (2) a cleaner water source from two deep water wells that are both capable of producing 500 gpm. A third deep water well exists at the property but is currently not operating. Once the TSF-1 is decommissioned and reclaimed, the additional necessary water sources for the mine facilities will come from the deep well sources and/or underground mine dewatering. All waters used at the Jerritt Canyon mine are from permitted and certificated water rights held by QRL and regulated by the Nevada Division of Water Resources.
There is sufficient room to place additional wastes on the property from future mining operations based on the existing claims owned by QRL. In addition, there is sufficient space to place the planned Tailings Storage Facility 2 (TSF-2) and Water Storage Reservoir (WSR) to the south of the existing tailings storage facility and existing evaporation pond.
History
The Jerritt Canyon mine is wholly owned by QRL after its purchase from the joint venture of Anglo Gold and Meridian Gold in June 2003. The joint venture was formed in 1976 between Freeport Minerals Company, later Freeport McMoran Inc., and FMC, later Meridian Gold. In 1990, Freeport sold its interest in Jerritt Canyon to Minorco and their wholly owned subsidiary, Independence Mining Company, which became the new joint venture partner and operator of the mine. In 1998, Minorco’s North American gold assets, including it’s70% interest in Jerritt Canyon were sold to Anglo Gold.
QRL is now a wholly owned subsidiary of Veris Gold Corp. which formed as a result of a merger between QRL and VG on June 20, 2007.
Prospectors explored for antimony in the 1910’s. Thirty to forty tons of stibnite as antimony ore were reportedly mined and shipped from the Burns Basin mine in the Jerritt Canyon district between 1918 and 1945. In the early 1970’s there was a renewed interest in antimony exploration when its price reached historic highs of $40 per pound. Around 1971, FMC began exploring for antimony in the Independence Mountains. In 1972, FMC, later known as Meridian Gold, discovered a disseminated gold deposit in the Jerritt Canyon area. In 1976, a joint venture was formed with Freeport Minerals Company to explore and develop the area, and mining commenced at Jerritt Canyon in 1981.
37
Open pit mining was conducted at the site from startup in 1981 until 1999. The first underground operation at Jerritt Canyon started up in 1993 at West Generator. Subsequently Underground Mining was initiated at Murray, SSX, MCE and Smith. Currently only the Smith and SSX mines are operating.
The mines are mechanized operations using backfill for ground control and to increase ore recovery. In the early years, the ores mined at the operation were less refractory and were processed through a “wet” mill. This “wet” mill continued to operate until 1997 and is still located on site. With ores becoming more carbonaceous and refractory, as well as with the introduction of higher-grade ore from underground operations, a dry mill with an ore roasting circuit was added in 1989 and is currently in operation.
On August 8, 2008, VG management decided to shut down mining operations due to increasing costs associated with the mine plan, required infrastructure expenditures that remained to be completed, and environmental concerns that remained to be addressed. The plan to continue toll milling after the shutdown of the mines was halted to complete repair work at the process mill. As a result, the workforce at Jerritt Canyon was reduced to maintenance levels while the Company undertook discussions with the Nevada Department of Environmental Protection (NDEP) to obtain permission to restart the facility and sought additional financing to fund the recommencement of operations. In order to obtain authorization to restart the NDEP required detailed plans on how the aforementioned concerns would be addressed. On October 20, 2009, with these detailed plans in place and approved by the NDEP, and many already completed, QRL was able to restart operations under a Consent Decree order issued by the Attorney General of the State of Nevada, representing the NDEP. To address the environmental concerns, QRL completed the installation of a calomel emission system on July 20, 2009 which is used to control mercury emissions. QRL also carried out significant overhauls and upgrades of many key components of the roaster, leach circuit, thickener, and other sections of the mill.
New technical staff was hired in 2009 with directives to design a new mine plan. Underground mining at Smith recommenced in late January 2010 using contract miner Small Mine Development (SMD). Underground mining at SSX-Steer Complex recommenced in early October using QRL staff. Ore materials from Jerritt Canyon that currently feed the processing facility include underground ore from the Smith Mine and stockpile materials that are either called remote or mill. The “remote” stockpiles are located in piles away from the processing facility and require hauling to the process plant while the “mill” stockpiles are located near the processing facilities.
Since its inception from July 1, 1981 to year-end 2011, the Jerritt Canyon Mine has produced 7.84 million ounces of gold. Annual production has historically averaged between 125,000 and 350,000 ounces of gold, at historical cash costs ranging from $240 to $554 per ounce. QRL internal reports indicate the total 2011 and 2010 mill production from Jerritt Canyon ores (including Jerritt Canyon stockpile and Newmont ores at 599,555 and 628,418 dry tons containing 73,823and 89,238 ounces, respectively.
QRL records indicate the 2008 mill production from Jerritt Canyon ore (including Jerritt sourced stockpiles) at 224,618 tons with 32,131 ounces of recovered gold attributed to the operation. Cash operating costs were high in 2008 due to mill shut downs in the early part of the year and the mine shut down on August 8, 2008.
Surface exploration drilling and underground core drilling which is also used as an exploration tool, generally decreased from 2000 to 2002, when the former owner, Anglo Gold shifted focus from exploration to reserve development. Drilling statistics for these recent years that document this change are presented below. After the acquisition of Jerritt Canyon at mid-2003, QRL started more aggressive exploration and mine development programs and those programs generally continued after the merger of QRL and VG in June 2007 up to the August 2008 mine shut down.
38
Historic Mineral Resource and Reserve Estimates
The measured and indicated mineral resources, including reserves, at Jerritt Canyon during QRL’s ownership, as documented in NI 43-101 filings are given below.
Historic Measured and Indicated Mineral Resources, Including Reserves
Year
(Year-End) | Measured | Indicated | Measured + Indicated |
kt |
opt | koz
Au |
kt |
opt | koz
Au |
kt |
opt | koz
Au |
| 2003 | 2,219.3 | 0.306 | 679.7 | 7,277.6 | 0.222 | 1,615.7 | 9,496.9 | 0.242 | 2,295.3 |
| 2004 | 2,263.0 | 0.287 | 650.1 | 7,724.8 | 0.228 | 1,759.5 | 9,987.8 | 0.241 | 2,409.6 |
| 2005 | 3,094.6 | 0.281 | 869.7 | 5,717.4 | 0.212 | 1,209.4 | 8,812.0 | 0.236 | 2,079.1 |
| 2006 | 2,573.9 | 0.272 | 700.1 | 5,629.3 | 0.214 | 1,207.1 | 8,203.2 | 0.232 | 1,907.2 |
| 2007 | 2,626.0 | 0.269 | 706.1 | 5,570.9 | 0.225 | 1,255.0 | 8,196.9 | 0.239 | 1,961.1 |
| 2010 | 4,549.9 | 0.236 | 1,073.1 | 6,459.5 | 0.204 | 1,316.8 | 11,009.4 | 0.217 | 2,389.9 |
Notes: | Data relates to historic measured and indicated resources during QRL’s ownership since 2003 and is from historically published NI 43-101 reports. |
Historic Inferred Mineral Resources
Year
(Year-End) | Inferred |
kt |
opt | koz
Au |
| 2003 | 5,415.4 | 0.191 | 1,034.0 |
| 2004 | 4,058.7 | 0.219 | 888.4 |
| 2005 | 2,646.5 | 0.229 | 605.6 |
| 2006 | 2,414.8 | 0.226 | 545.2 |
| 2007 | 2,319.7 | 0.224 | 520.4 |
| 2010 | 3,872.6 | 0.194 | 751.3 |
Notes: Data relates to historic proven and probable reserves during QRL’s ownership since 2003 and is from historically published NI 43-101 reports.
The proven and probable reserves at Jerritt Canyon during QRL’s ownership, as documented in NI 43-101 filings are as follows:
Historic Proven and Probable Mineral Reserves
Year
(Year-End) | Proven | Probable | Proven + Probable |
kt |
opt | koz
Au |
kt |
opt | koz
Au |
kt |
opt | koz
Au |
| 2003 | 932.8 | 0.299 | 279.0 | 2,132.4 | 0.254 | 541.1 | 3,065.3 | 0.268 | 820.1 |
| 2004 | 760.5 | 0.271 | 206.3 | 2,750.1 | 0.243 | 669.1 | 3,510.6 | 0.249 | 875.4 |
| 2005 | 1,211.3 | 0.257 | 311.7 | 2,511.7 | 0.225 | 566.2 | 3,723.0 | 0.236 | 877.9 |
| 2006 | 636.1 | 0.273 | 173.8 | 1,348.8 | 0.231 | 312.0 | 1,984.9 | 0.245 | 485.7 |
| 2007 | 653.4 | 0.229 | 149.9 | 2,501.8 | 0.227 | 567.4 | 3,155.2 | 0.227 | 717.3 |
| 2010 | 1,406.1 | 0.193 | 270.9 | 2,959.7 | 0.151 | 446.0 | 4,365.8 | 0.164 | 717.0 |
| Notes: | Data relates to historic proven and probable reserves during QRL’s ownership since 2003 and is from historically published NI 43-101 reports. |
The aforementioned resources and reserves since 2003 have been prepared by Qualified Persons employed by Pincock, Allen and Holt and SRK Consulting and are therefore viewed by the Qualified Person, Mark Odell, as being reliable and relevant. It is apparent that the historical proven and probable reserves documented every year in the NI 43-101 reports since 2003 range from 1,984.9 to 4,365.8 kt. It is also recognized that the measured and indicated resources documented every year in the NI 43-101 reports since 2003 range from 8,196.9 to 11,009.4 kt.
39
Geologic Setting and Mineralization
The Jerritt Canyon mining district is located in the Independence Mountain Range in northern Nevada. The range is part of the Basin and Range province of Nevada and is a horst block consisting primarily of Paleozoic sedimentary rocks with lesser Tertiary volcanic rocks and intrusive dikes. Much of this data was previously presented in other published reports and is still considered to be relevant.
Contributing author of this report, Michele White, has reviewed the geological information in the drill hole databases and finds that the geological determinations in the logs to be adequate for use in geological modeling of the resource areas and also deem them adequate for use in the present resource and reserve work.
There are four distinct assemblages in the district, characterized by their position relative to the Roberts Mountains thrust, a Devonian to Mississippian structure formed during the Antler orogeny:
- The western facies, or upper plate of the thrust, consists of the Cambrian to Ordovician Valmy Group and forms about 70% of the exposed rock. In the Jerritt Canyon district, the Valmy Group consists of the Snow Canyon formation, a chert, argillite, greenstone, and carbonaceous siltstone sequence, and the McAfee Quartzite, a sequence of massive quartzite and shale;
- The eastern facies, or lower plate of the thrust, consists of a sequence of Ordovician to Devonian shallow water sedimentary rocks that are exposed in tectonic and erosional windows through the upper plate. The gold mineralization in the district is contained with the eastern facies rocks. The Pogonip Group rock is exposed in the west-central part of the district and is composed of fossiliferous limestone with calcareous shale and dolomite interbeds. The Eureka Quartzite is a massive quartzite with minor interbeds of siltstone. The Hanson Creek Formation is one of two principal ore hosts in the district. It is divided into five units, with the contacts between the units being the favorable sites of gold mineralization. The Hanson Creek consists of interbedded silty limestone, calcareous siltstone, dolomite, chert, and carbonaceous limestone. The Roberts Mountains Formation is the second ore host and consists of calcareous, carbonaceous siltstone and thinly bedded, silty limestone. The Waterpipe Canyon formation is thought to have been deposited in a synkinematic foreland basin that formed during the Antler orogeny; it consists of carbonaceous shale with interbedded greywacke, chert pebble conglomerate, bedded chert, sandstone, and siltstone;
- The Schoonover sequence occurs north of the district and consists of basaltic and andesitic greenstone, chert, tuff, volcaniclastics, and siliciclastic and limestone turbidites of Devonian to Permian age; and
- The Antler overlap sequence is restricted to the north end of the range and consists of conglomerates, argillite, siltstone and limestone.
There are 3 ages of dikes: Pennsylvanian basalt dikes, Eocene basalt and quartz-monzonite dikes, and Miocene basalt dikes. The Pennsylvanian and Eocene basaltic dikes are altered and mineralized in most of the mines.
The regional structural setting of the Jerritt Canyon district is complex with several regional deformation events being evident. The Devonian to Mississippian Antler orogeny, resulting from west to east compression, is represented in the upper plate Snow Canyon Formation with north-south folds in both the hanging wall and footwall of the thrust. The Permian to Triassic Sonoma orogeny emplaced the Golconda allochthon over parts of the Roberts Mountains allochthon to the north of the district. The northwest to southeast compression associated with this deformation is rarely seen in the district. The Jurassic to Cretaceous Nevadan orogeny resulted in east-west folds that are often associated with mineralization.
40
Within the Jerritt Canyon area, gold can locally occur within all sedimentary formations, but is preferentially hosted by the Roberts Mountains and Hanson Creek Formations of the eastern facies in the lower plate of the Roberts Mountains thrust. The Roberts Mountains Formation consists of calcareous to dolomitic siltstones and silty limestones. The Hanson Creek Formation is divided into five members, numbered I through V from the top of the formation to the bottom. Hanson Creek I is a thinly bedded sequence of gray, medium-grained limestones and continuous blocky chert beds; it is typically brecciated. Hanson Creek II is a dark to light gray, irregularly bedded to massive, vuggy, dolomitic limestone. Hanson Creek III consists of intercalated carbonaceous micrites and laminated argillaceous limestones. Hanson Creek IV is a thickly bedded, medium to coarse-grained, carbonaceous limestone with discontinuous black chert nodules. Hanson Creek V consists of laminated, carbonaceous siltstone with chert lenses.
The contact between the Roberts Mountains Formation and the overlying Snow Canyon Formation is a regional thrust fault which transported the Snow Canyon eastward over the Roberts Mountains Formation. The contact between the Roberts Mountain Formation and the underlying Hanson Creek Formation is a discontinuity locally known as the Saval discontinuity. The discontinuity may be an angular unconformity of local extent or a thrust fault. Gold mineralization is typically enriched along this discontinuity. The base of the Hanson Creek is gradational into the Eureka Quartzite. Locally, the stratigraphic section has been repeated by thrust faulting as seen in the interpretive cross-section through the SSX mine.
Alteration in the Jerritt Canyon district includes silicification, dolomitization, remobilization, and reconstitution of organic carbon, decalcification, and argillization. The rocks also exhibit hypogene and supergene oxidation and bleaching. The most important alteration types relative to gold deposition are silicification, remobilization and reconstitution of organic carbon, and decalcification.
The drift connecting the SSX and Steer mines was completed in the latter half of 2005 and the mines have been operated as a single unit referred to as the SSX complex or SSX-Steer complex since then. In 2007 a drift was completed to the Saval 3 portal allowing access to resource extending into the pit wall.
The SSX deposit was discovered in the early 1990’s following the northeast structural trends between the Burns Basin and California Mountain deposits and the west-northwest trends from the Steer/Saval deposits. Mining at SSX started in 1997.
The modeled mineralized bodies show a distinct northwest trend in the SSX area but are generally more east-west in the other areas. The mineralized zones are more continuous in the SSX area ranging from 200 to 2000 feet in length along the northwest strike and 50 to 200 feet in width. The thickness of the mineralization at SSX ranges from 10 to 100 feet. The mineralization at Steer is less continuous ranging in strike length from 50 to 500 feet and 50 to 300 feet in width. The ore thickness at Steer ranges from 20 feet to rarely 100 feet. The depth to mineralization ranges from near surface at the west end of Steer to a depth of about 800 feet below the surface for most of SSX. Most of the mineralization is between 600 to 1000 feet below the surface.
Mineralization at the SSX mine occurs mostly in the micritic unit III of the Hanson Creek Formation. A smaller portion of the mineralization occurs in calcareous siltstone at the base of the Roberts Mountains Formation or in the upper two cherty and dolomitic members of the Hanson Creek Formation. Mineralized zones are localized in and near west-northwest trending steeply dipping dikes (e.g. South Boundary Dike); however, dike material is a minor component of the ore at SSX. Mineralization is also localized along cross-cutting northeast trending faults (the Purple Fault in Zones 4 and 6, and the Crestline Fault in Zone 1). Folding of the mineralized horizons is apparent along axes parallel to the west-northwest dike trend and, more prominently, parallel to the northeast fault set. Gold occurs in decarbonitized rock, commonly in association with variable amounts of orpiment and realgar. Silicification with stibnite can also be associated with gold in portions of the upper cherty member of the Hanson Creek Formation.
41
Gold mineralization in the Steer portion of the SSX complex has been identified in an area stretching approximately 3,000 feet east from the old Steer pit to halfway along the connection drift to SSX Zone 5. Most gold mineralization at Steer is associated with gently dipping structures cutting through the Hanson Creek III unit. These structures strike northeast and dip southeast, offsetting individual strata. Typical ore zones follow the structures and tend to be broad and relatively thin. The mineralized zones are usually at the contact between the Hanson Creek units III and IV and occasionally follow the structures up through the Hanson III. Both within the Steer portion and the western side of SSX several low-angle features have been observed. These features are at least partly responsible for the gold mineralization at the contact of the Hanson Creek Units III and IV.
In the eastern portion of the Steer area, high-grade mineralization is associated with the Husky fault, a major northeast trending normal fault with at least 300 feet of normal dip-slip displacement to the southeast. Major northwest trending dikes appear to have locally compartmentalized high-grade mineralization. The intersection of these dikes with the Hanson III unit and the Husky fault and its related structures offers excellent exploration potential. One of these dikes is interpreted to be the western extension of the South Boundary dike, which is an important ore-controlling structure at the SSX mine to the east.
At Steer and SSX the structural intersections are the primary targets for resource expansion, as well as the westward extension of the South Boundary dike.
Previous mining at Saval has included both open pit mining (1994-1997) and small-scale underground mining from 2004 to 2006 in the highwall of the Saval 2 pit. Gold mineralization in the Saval Basin area to the west of the SSX mine is primarily hosted in favorable Hanson Creek Formation unit III where it has been structurally prepared by faulting and has locally been compartmentalized by northwest-trending dike systems. In this area, a series of west-northwest trending structures have been cut by northeast-trending faults. Notable structural features include the west-northwest trending Saval horst and the northeast-trending Husky fault, which cuts across the older Saval horst and down-drops it to the southeast. Mineralization is mostly hosted in the Hanson III unit in the vicinity of structural intersections, often forming relatively steep, narrow, plunging bodies. Dikes, such as the Saval 3 pit dike can be traced for thousands of feet. High-grade gold mineralization has been concentrated along the Saval 3 dike in several locations, most prominently in the Saval 3 pit and in the north part of zone 5 at SSX.
Mineralization at Saval generally trends east-west from 200 to 1,000 feet. The width ranges from 50 to 200 feet and the thickness from 10 to 50 feet. The depth is from the surface to about 400 feet below the surface. Saval contains gold mineralization that has been recently remodeled with both 0.01 opt Au grade-shells and 0.10 opt gold grade-shells and is the only deposit that contains both underground and open pit minable resources and reserves. The Saval 4 underground deposit is located east of the current Saval open pit resource and reserve.
The Smith Mine, accessed from near the bottom of the Dash open pit, was started in 1999 as the pit was being mined out. The Smith Mine complex consists of several distinct areas that are accessed from the Smith portal, as well as an area to the east, East Dash, that will be accessed from a separate portal in the Dash pit. During 2006 a separate portal was developed to access mineralization in the east highwall of the Dash pit.
42
Gold mineralization in the main Smith, Mahala, and West Dash deposits is associated with the northeast trending Coulee Fault and west-northwest trending faults and dikes. In Zone 1, high-grade gold mineralization is hosted in the upper and middle portions of the Hanson Creek Formation unit III within a northwest trending horst block between the South Graben fault and the 170 fault. Mineralization in Zones 2 and 3 is directly associated with west-northwest trending dikes. High-grade mineralization occurs within the Hanson Creek units II and III along the steeply dipping dikes. Lesser amounts of mineralization exist at higher levels where the dikes intersect favorable beds in the Roberts Mountains Formation. An exception to the tight elevation controls on mineralization is at the intersection of the west-northwest trending dikes and Coulee fault. Here, high-grade mineralization blows out into the Hanson Creek unit III along the west plunging intersection of the dikes and the fault for a down-dip depth of 600 ft.
Gold mineralization in the Mahala area is spatially associated with the west-northwest trending Mahala fault and associated dikes and favorable ore-host stratigraphy including units II and III of the Hanson Creek Formation and lower beds of the Roberts Mountains Formation. Mineralization at East Mahala occurs primarily in broad, SE-dipping lenses in Roberts Mountains Formation in the hanging wall of the Coulee Fault.
The B-Pit deposit occurs as gently dipping, thin lenses of mineralized material north of the main Smith deposit. Three of the four lenses occur are stratigraphically bound within the Roberts Mountains Formation. The fourth lens occurs at the top of the Hanson unit III in the wall of a NW-trending horst block just to the south of the other three zones.
The West and East Dash deposits occur at the extreme ends of the west-northwest trending Dash Fault system which formed the mineralization mined in the Dash pit. The West Dash deposit occurs at the intersection of the Coulee fault and the west-northwest trending Dash fault. Most gold mineralization at West Dash occurs in fault-bounded slices of Hanson Creek unit III with minor amounts in the overlying Hanson Creek unit II and Roberts Mountains Formation. West Dash is accessed through the Smith Portal.
The East Dash deposit lies approximately 1,800 feet southeast of the Dash pit. A portion of this deposit has been accessed by a small portal in the pit. At East Dash, most gold occurs in two lenses parallel to the Dash Fault and dipping to the northeast. The largest lens is about 1,100 feet and is 15 feet to 25 feet thick. This mineralization is fairly flat lying and is hosted mostly at the contact between the Hanson Creek II and III units. The north edge of the lens seems to be bounded by a steep east-west trending fault that is locally mineralized with high-grade material. The second lens is smaller at about 350 feet across, but much thicker, up to 120 feet. Some 2011 drill holes tested the mineralization extent of the East Dash deposit.
The mineralization at Smith generally trends northwest with minor northeast trends along minor structures. The mineralization is continuous along the northwest trend ranging from 200 to 2,500 feet. The width of the mineralization ranges from 20 to 400 feet and the thickness ranges from 10 to 100 feet. The depth of the mineralization ranges from near surface at the Dash Pit to 1,200 feet below the surface to the south and east.
The Murray Mine occurs within the Roberts Mountains Formation and the top three units of the Hanson Creek Formation. A minor amount of mineralization also occurs within the silicified unit IV of the Hanson Creek Formation. It was originally discovered by condemnation drilling for a waste dump for one of the early open pits. Mineralization in the main Murray deposit occurs along the New Deep Fault which is a wrench fault striking west -northwest and dipping 50º to 60º to the northeast. Mineralization in Zone 7 located about 750 feet north of the New Deep Fault occurred within calcareous siltstone beds of the Roberts Mountains Formation. Zone 7 and the main Murray have been largely mined out, with remnant pockets of mineralization remaining.
43
Mineralization previously mined at Murray generally trends southwest but the southern body trends west-northwest. One strong north-south mineralized trend connects to the southern body on the west side. The main trends are continuous ranging from 500 to 2,500 feet. The width is generally 50 to 400 feet and the thickness from 20 to 200 feet. The depth ranges from the surface to 750 feet deep. The groundwater table at this former mine currently lies at approximately 6,100 feet in elevation; no dewatering wells are active at Murray today.
Remaining mineralization making up the current resource at Murray has been remodeled as multiple 0.10 opt Au grade-shells occurring in an area up to 1,500 feet long immediately west (and south) of the existing underground workings. These grade-shells range in size from 100 to 800 feet long, 20 to 230 feet wide, and 5 to 40 feet thick and are located on a sub-horizontal to gently to moderately westerly dipping anticlinal fold limb.
Mineralization in Zone 9 is included in the recently remodeled Murray resource. This mineralization is associated with a westward projection of the New Deep Fault and several northeast trending faults. It was the focus of drilling campaigns in 2002-2005. Although there was no additional drilling in this resource it was removed from reserves in 2006 because of economics and possible water issues; some of this mineralization has been added back to reserves this year based on more favorable mining economics. It consists of two separate areas, a relatively flat-lying zone at the base of the Roberts Mountains Formation and a main zone which is associated with the New Deep fault. Mineralization at Zone 9 is hosted by the Hanson Creek III which is locally overlain by the Snow Canyon Formation.
Starvation Canyon occurs in the southern half of the Jerritt Canyon property. Gold mineralization at Starvation Canyon occurs at the Hanson II-III contact and is localized along a west-northwest fault zone at northeast structural intersections. The majority of the mineralization is within the interbedded micrite and argillaceous limestone unit III of the Hanson Creek Formation, starting at or just beneath the contact. There are instances where mineralization has formed within the massive limestone of the basal Hanson Creek II, but these are rare. Drilling in 2007 and 2008 further defined the resource at Starvation, along its outer edges as well as the internal grade distributions. High angled structures have also been identified. In addition, core drilling has improved sample recovery.
The mineralized zone at Starvation Canyon trends northwest for a length of 1,500 feet and a width ranging from 150 to 400 feet. The mineralized trend has a thickness is 5 to 100 feet and the depth ranges from 300 to 600 feet below the surface. The reserves and resources at Starvation Canyon lie above the groundwater table.
The West Mahala mineralized zone lies between the Smith Mine to the east and the SSX Mine to the west and is hosted at the contact between the Roberts Mountain and Hanson Creek Formations. The West Mahala mineralization is generally 1,000 to 1,200 feet below the surface.
Two main pods of mineralization make up most of the resource at West Mahala. One of the mineralized pods is located just east of the existing SSX-Steer underground workings that strikes northwest and is approximately 900 feet long. This pod has been modeled with 4 separate, stacked 0.10 opt Au grade-shells ranging from 5 to up to 60 feet thick.
44
The northeastern pods of mineralization were modeled as two separate, continuous, gently westerly dipping and stacked 0.10 opt Au grade-shells and are approximately 1,100 feet long by up to 850 feet wide by 5 to 40 feet thick and are open to the west, east, and south. Mineralization in theses pods trends east-west with continuity ranging from 400 to 1,100 feet. The majority of the resources at West Mahala lie below the groundwater table.
Wright Window is a small open pit reserve and resource area located on the west side of the Independence Mountains to the west of the Murray mine. The deposit is hosted by the lower Roberts Mountains and Upper Hanson Creek Formations along the Saval Discontinuity. Mineralization in the resource occurs in four zones; the west zone mineralization outcrops at the surface and is about 50 feet thick. The higher-grade east area is about 200 by 300 feet long and wide, 45 feet thick, and lies about 400 feet below the surface.
Potentially economic gold mineralization occurs in a series of near-surface zones in the head of Pie Creek drainage on the east flank of Wheeler Mountain in the southern half of the Jerritt Canyon property. Indicated and inferred resources have been included in the block model and are shallow enough (<200 feet in depth below the surface) for consideration of open pit mining. The main pod of mineralization is about 800 feet long, dips moderately to the southeast at about 30°, and is 20 to 45 feet in cross-sectional thickness. Mineralization is hosted in the top of unit 3 of the Silurian-Ordovician aged Hanson Creek Formation (SOhc3) and is probably controlled by northeast-trending faults. Three other smaller mineralized pods are also hosted in the same rock unit but strike northwest and dip moderately to the north. The main mineralized pod occurs between two mineralized northwesterly cross structures.
Potentially economic gold mineralization at Mill Creek occurs in a small, near-surface zone located just down the hill from a mineralized zone previously mined by a series of small open-pits. The modeled remaining intact mineralized zone is about 400 ft across, dips moderately to the north at about 400, and varies from 20 to 70 ft in cross-sectional thickness. Mineralization is hosted in unit three of the Silurian-Ordovician aged Hanson Creek Formation (SOhc) and is localized in a structural wedge between intersecting east-west and northeast trending faults that down-drop Hanson Creek unit three against unit four. These faults splay off of the nearby major northeast-trending Mill Creek fault. The Mill Creek fault is of high displacement and cuts diagonally across the district, forming the western boundary of three major lower plate carbonate rock windows.
Potentially economic mineralization at Road Canyon occurs in a thin, near- or at-surface body10 to 25 feet thick hosted in colluvial material. This mineralization occurs over several hundred feet in length on a moderately sloped hillside. The modeled mineralization is interpreted as the weathered remains of a bedrock gold zone with some amount of downslope movement.
This mineralization was modeled in Vulcan as four separate 0.01 opt Au grade-shells. A much lighter tonnage factor of 17.5 ft3/ton was used for the grade-shell closest to the surface instead of the standard 12.6 ft3/ton in order to better represent swelling and pore space in the unconsolidated material. The unconsolidated material in the near surface mineralization could be potentially scraped or bulldozed in mining.
The Burns Basin area was previously open pit mined from 1988 to 1998. Gold mineralization that comprises the intact open pit and underground resources is mostly hosted at the contact zone between the Roberts Mountain Formation and the Hanson Creek Formation, and locally between the Hanson Creek III and IV units on a gently easterly dipping anticlinal fold limb. The remodeled 0.01 opt gold grade-shells that make up the bulk of the Burns Basin resource are continuous to semi-continuous, locally stacked shapes ranging from 125 to 3,400 feet long, 40 to 1,360 feet wide, and 20 to 100 feet thick. A significant amount of fill has been placed in portions of the Burns Basin pits, some of which is classified as municipal solid waste and debris from crates, cartons, and perhaps demolition of equipment.
45
A total of 61 surface drill holes were completed at Burns Basin in 2011 to help delineate and extend detection of the gold mineralization. The assays of these 2011 drill holes were not received in time to be included in this current Mineral Resource. However, information regarding the logged depth of fill and depth to intact rock were included in order to confirm the deepest mined topographical surface, which helped confirm the existing intact resources in the area.
Potentially economic mineralization in the California Mountain open pit and underground resources are located north and west of the existing California open pit that was mined from 1993 to 1994. This remaining mineralization is hosted both in the Roberts Mountain Formation near the upper contact with the Hanson Creek Formation, and within unit III of the Hanson Creek Formation. The remaining resource mineralization lies on a northeastern mineralized trend.
The Jerritt Canyon deposits are typical of the Carlin-type deposit consisting of micron to submicron-sized gold particles hosted primarily by carbonaceous, Paleozoic calcareous and sulfidic sedimentary rocks. Lesser amounts of ore are hosted by intermediate to mafic intrusive rock. The deposits often consist of several discrete pods or zones of mineralization whose location is controlled by intersections of major west-northwest and north-northeast structures that cut folded, permeable and chemically favorable host rocks. Locally, intrusive dikes that follow the northwest or northeast structures may be important host rocks. The combination of these structural and stratigraphic controls imparts a highly irregular shape to the ore zones, though most have more horizontal than vertical continuity depending upon the orientation of the host rocks.
Gold in the Jerritt Canyon ore deposits occurs as free particles of inter-granular, native gold, on or within pyrite, or in association with sedimentary carbonaceous material. Due to the sulfide and carbonaceous affinities, most of the gold deposits at Jerritt Canyon require fine grinding and oxidation to permit the gold particles to be liberated by standard, carbon-in-leach cyanidation.
The exploration program outlined in this document accounts for all of the previous exploration information that has been conducted in the past. In addition, the planned 2012 exploration program focuses on drilling resource conversion drill holes both proximal to the Smith and SSX-Steer underground mine infrastructure (underground workings), in the planned Starvation Canyon underground mine, and in open pit resources that have the best potential to advance into potential production. The drilling will be focused along well known mineralized trends (defined by previous drilling, mapping, geophysics, or soil/rock surface sampling) with adjacent in-place infrastructure (underground workings and/or access roads or mining facilities) in order to have the best chance of adding potential new resources and reserves. This will allow the Company to potentially keep feeding ore to the processing facility at Jerritt Canyon well into the foreseeable future. The drilling methods to be employed at Jerritt Canyon incorporate reverse circulation and diamond types which have been proven to work well at other northern Nevada Carlin-Type deposits.
The Jerritt Canyon district was explored by prospectors looking for antimony in the early 1900’s. FMC Corporation, exploring for antimony in the 1970’s), discovered gold occurring in similar habit to occurrences observed in the nearby Carlin trend. In 1976, FMC, (then Meridian Mining), formed a joint venture with Freeport Minerals to explore and develop the deposits. Mining commenced in 1981 with the North Generator open pit.
Since then, the operators of Jerritt Canyon have conducted exploration programs for the identification and development of new mineralized areas. Several open pit deposits were discovered, developed, and mined during the 1980’s and 1990’s, including North Generator, Alchem, Marlboro Canyon, Burns, Steer, Saval and Dash. The Dash open-pit was the last significant open pit to be mined on the property in 1999.
46
Underground targets were also identified, and the first to be exploited was the West Generator underground deposit in 1993. Underground mining has dominated at Jerritt Canyon since 1999 and has focused at Murray, Smith, and SSX.
The Murray deposit, originally discovered by condemnation drilling, produced over 1 million ounces. The SSX deposit was discovered in the early 1990’s by geologists following the structural trends between Burns Basin and California Mountain open pits. The SSX mine has also produced over 1 million ounces. The MCE, Smith, and Steer extension of SSX are more recent discoveries.
The Jerritt Canyon operation has had a history of exploration and discovery since the 1970’s. In the last few years until QRL’s acquisition of the property, most of the exploration efforts have been concentrated at and around the existing underground mines. Exploration efforts in the southern part of the range were directed to areas such as Water Pipe, Pie Creek, and Starvation Canyon. QRL has increased the exploration effort near the mine areas and also in the south. As a result, the known mineralization at Starvation Canyon has increased in size and quality so that a portion of it was included in the end of 2005 reserves. Additional drilling at Starvation Canyon in 2007 and 2008 was targeted toward further definition and expansion of the resource.
QRL has carried out an aggressive program of exploration since it acquired the property in mid-2003. Since then, a number of different contract drilling companies have completed both underground and surface drilling at the property. The drilling companies for each drill hole are listed on the drill logs kept in the digital drill hole databases (in acQuire software) and/or in the paper drill hole log files stored at the mine. In addition, since mid-2003 QRL owned the underground production drills (e.g. Solo, Secoma and Cubex), which also completed part of the underground drilling prior to the August 2008 mine shut down. The total underground and surface drilling completed since 2003 at the property is summarized below (excluding production drilling):
- 2003: 280,151 feet of underground and surface RC and Core Drilling;
- 2004: 710,896 feet of underground and surface RC and Core Drilling;
- 2005: 450,694 feet of underground and surface RC and Core Drilling;
- 2006: 396,063 feet of underground and surface RC and Core Drilling;
- 2007: 467,242 feet of underground and surface RC and Core Drilling;
- 2008: 237,250 feet of underground and surface RC and Core Drilling;
- 2009: no drilling was completed in 2009;
- 2010: 8,756 feet of underground RC and Core Drilling; and
- 2011: 157,769 feet of underground RC and Core Drilling.
The drilled data results stored in multiple datasets from August 2008 to December 31, 2010 were reviewed for the current analysis. Since the last technical report for this property, (Johnson et al., 2011; 2012) additional data derived from 2011 drilling was reviewed in detail by author, Michele White. These new datasets included: 1) the 2011 isis-format dataset used for modeling of the new resource and reserve estimates; 2) the centralized acQuire db; 3) Jerritt lab analysis results for underground production drilling; 4) SMD’s internal dataset used in their daily mine plan; and 5) outside certified lab results from ALS-Minerals commercial assay lab. Other data reviewed from 2011 drilling included drill hole collar locations, downhole surveys, and geologic identification of lithology. Data sets derived prior to 2011were in an excellent state of coherency and standardization as of March 2011, as verified by author Michele White – previous Data Manager for the Jerritt Canyon database. Paper drill hole log files, copies of assay certification, and other integral drill hole data information are also in a state of excellent condition for use in the new resource and reserve estimate. The geology logs for the surface drill holes compare well with one another in the local areas suggesting that the stratigraphy of the rock units was well understood by project geologists working at the property. Additional comments regarding the condition of the Jerritt Canyon drill hole data are discussed below.
47
There has been considerable geophysical work completed throughout the Jerritt Canyon property since the early 1970’s by numerous contract geophysical companies. A good portion of the property has airborne magnetic data, ground gravity, and ground I.P.-Resistivity. Certain dike sets are identified in the magnetic surveys. Clay alteration is typified with low resistivity response and gravity low whereas silicification typically show up as resistivity highs and associated gravity highs. In addition, deep IP magnetotelluric (MT) surveys and Controlled Source Audio Frequency Magnetotellurics (CSAMT) surveys have been applied locally on the property and have been able to identify main structures that cross the property.
There have also been considerable soil surveys, rock chip sampling, and trench and road-cut sampling performed in the district by employees of the Jerritt Canyon mine. The soils have been typically collected on a predefined north-south oriented grid and analyzed for multi-element geochemistry. Soils overlying shallow ore bodies at Jerritt Canyon are generally enriched in As and Au. The surface geochemistry is stored in a separate acQuire database.
Exploration expenditures by QRL in recent years are listed below:
- 2007: $7.23 million;
- 2008: $6.48 million;
- 2009: $0;
- 2010: $0.8 million; and
- 2011: $8.04 million.
Exploration and development drilling conducted in 2011 targeted either: (1) locating new areas of resources and reserves away from existing underground development; (2) converting existing resources to reserve (near-mine); or (3) drilling in previously disturbed areas including historic open pits. In addition, ground geophysics (I.P.) was conducted in the south part of the district over Starvation Canyon and adjacent exploration targets, and geotechnical drilling was completed in the Starvation Canyon deposit. The proposed 2012 Jerritt Canyon geological program, consisting mostly of development and resource conversion drilling, totals $5.6 million dollars and is separated into three phases.
A significant portion of the future exploration programs at Jerritt Canyon will be devoted to drilling in or around the historic open pits. Most of the historical open pit resources have not been reassessed prior to the current technical report when the gold price was at a much lower price per ounce than it is today.
Drilling and Sampling Methodology
Numerous drilling campaigns have been executed at Jerritt Canyon since its discovery in the 1970’s. Exploration drilling programs typically consist of vertically oriented RC drilling at about 200 foot centers. The spacing is then reduced to about 140 feet and finally, to 100 foot centers or less. Surface core drilling typically makes up about 5% to 10% of the total drilling. During the early drilling years in the 1970’s and 1980’s when shallow open-pit targets were being pursued, most of the surface drill holes were drilled to a maximum depth of 600 feet below the surface and stopped regardless of the geological rock unit or alteration that was encountered. As a result, the district-wide surface drilling is extensive but only for shallow examination. The potential for deeper targets is yet to be investigated.
48
In the underground mines up to December 31, 2011, definition drilling included core drilling on 50-foot centers from underground stations, using NQ-sized (1.875 inches in diameter) core. In mid-2011 drilling with HQ core was used locally. HQ core is 2.5 inches in diameter. In 2010, underground diamond drilling was used for exploration and resource conversion. Underground RC drilling (Cubex) is used for resource confirmation and is generally drilled on 20 to 40 foot centers. Underground RC drill holes are generally less than 150 feet in length, but can be as long as 300 feet. Up to August 2008, underground production sample drilling consisted of Cubex and rotary percussion drilling (Solo and Secoma). In 2010 and 2011, a 5200 DRC Cubex (RC) drill, owned and operated by SMD, was used primarily for underground production sample drilling at the Smith Mine. These production drill holes were generally short, less than 60 feet, and were drilled on close centers of 10 to 20 feet. The majority of drill holes, other than the production holes, have been measured for downhole deviation. A used Cubex drill rig was purchased in 2011 by QRL to conduct underground production drilling at SSX-Steer.
Tens of thousands of holes have been drilled on the property over the years. As of December 31, 2011, there are a total of 15,093 surface drill holes totaling 8,583,348 feet and 37,663 underground drill holes totaling 3,185,739 feet in the acQuire digital drill hole databases. The Murray mine has over 22,000 holes with more than 2 million feet drilled; the Smith mine has over 7,500 underground drill holes with more than 1.61 million feet; the SSX mine has nearly 21,700 underground drill holes with 2.75 million feet of drilling. (The new, 2011 drill holes are symbolized with round, red dots for collars.)
Drilling at Jerritt Canyon for the last eleven years is shown below. Drilling in 2000 through 2002 for AngloGold and Meridian was conducted either by contract drilling companies and underground drill rigs owned by Anglo Gold and Meridian Gold. Since QRL purchased the project in 2003 has been performed using underground drill rigs owned by QRL or contract drilling companies. The name of the drilling company is listed on each drill hole log stored either in the acQuire digital drill hole database or listed on the paper drill hole log files stored at the mine.
Drill hole data in the acQuire drill hole database is suitable for use for the current resource and reserve work. Additional details of the quality of the drill hole data are discussed in Section 12 of this report.
Drilling in 2008 was conducted both underground at the SSX and Smith Mines and throughout the property on the surface. 2010 underground drilling was conducted at the Smith Mine. No underground drilling was conducted in 2009. No surface drilling was conducted on the surface in 2009 or 2010. All of the surface and underground drilling methodologies used in 2008 and 2010 were similar to that performed in 2007 as described in previous technical reports and are summarized below.
The 2011 reverse circulation (RC) drilling was conducted by three separate contract companies (Rimrock, National EWP, and WDC). Down-hole surveys were taken by a contractor (IDS) using a gyroscopic instrument. Drill hole collar locations were surveyed by in-house surveyors. The vast majority of the 2011 drilling targeted conversion of both underground (ug) and open-pit (op) resources in the following areas: Mahala (ug), East Mahala/East Dash (ug), West Mahala (ug), Starvation Canyon (ug), Burns Basin (op), Saval (op), West Generator (op), and Pie Creek (op).
The 2011 surface RC holes ranged from 4 5/8 inches to 5 ½ inches in diameter (dependent upon bit type – hammer vs. tri-cone). Sample collection was conducted on 5 foot intervals, according to the following protocol established by QRL.
- RC drilling operations collected samples in 10 x 17 inch polypropylene bags throughout the entire length of each drill hole.
- The wet splitter was thoroughly cleaned prior to drilling at the start of the drill shift. The rotation speed of the splitter was set to collect a continuous split from the bulk sample that is dropped out
of the cyclone. The recommended rotation speed was 60 rpm but may vary due to drilling conditions. The splitter was sprayed clean after each rod change or 5-foot sample interval depending on drilling conditions and thoroughly cleaned and checked during the rod change. The number of “pie covers” used for the upper part of the hole varied significantly due to drilling conditions and was usually determined by the driller and on-site geologist. If more than one pie was open for sample collection, all openings must be symmetrical. Two symmetrical pie division openings are usually sufficient to collect an appropriate volume of material (10 pounds to 15 pounds). Exceptions are; 1) zones of poor return, 2) extreme groundwater production that requires the use of a tri-cone bit, and 3) unique conditions agreed to by the driller and geologist. In these cases a variable number of openings was needed to obtain a continuous split;
49
- Samples were collected in a labeled bag that was placed inside the bucket. Diluted liquid flocculent was added prior to placing the bucket under the splitter. After the interval was drilled the sample was stirred and allowed to set for a brief period to allow clearing of the water, usually 15 seconds to 30 seconds. Excessive clear water was then decanted off;
- RC drill chips were collected in a hand sieve from the waste port of the splitter and then put into the sample tray to represent each five-foot interval and sent to the logging facility for the geologist to log formation, alteration, and other minerals. Intervals of no sample return were marked on the tray with “No Sample” or “Void”; and
- A drill interval that does not return any sample was marked on the sample bag as “No Sample” and placed in the appropriate shipping bag along with the other samples.
QRL representatives transported the RC samples, on a nearly daily basis, from the drill site to the lay-down area immediately adjacent to the surface core logging facility. Approximately 150-200 samples per day (on average) were handled at the lay-down area and prepared for shipment to the commercial lab. Sample shipments occurred twice a week. American Laboratory Services (ALS) provided transport of samples (RC & Core) to their Elko, NV sample preparation facility. During non-operational business hours the security of samples at the lay-down area was maintained by Jerritt Canyon Mine Security Department.
2011 surface diamond drilling and geotechnical drilling was conducted by American Drilling, Inc. at the Starvation Canyon deposit using HQ diameter (2.5 inches) core. Two contract companies (IDS & COLOG) were utilized to conduct down-hole gyroscopic and tele-viewer surveys, respectively, to enable 3 dimensional orientation of the core. Representatives of Golder & Associates engineering firm conducted core orientation, collection of geotechnical data and photographing the drill core as specified by QRL. QRL representatives conducted geologic logging and subsequent sampling of the core. Sampling was conducted by halving the core using a diamond bladed masonry saw. Surface diamond drilling, for resource conversion, was conducted at West Mahala, Mahala, and East Mahala/East Dash. Pre-collared holes were drilled by reverse circulation to a depth of 800 feet and casing was installed. HQ core was drilled from the bottoms of the RC pre-collars to pre-planned total depths. QRL representatives collected the core from the respective drill sites and delivered it to the Jerritt Canyon core shed. The core was photographed then logged for lithological information and for geotechnical data according to the Jerritt Canyon logging manual at the logging facility. Surface core was cut or split with a diamond saw or hydraulic splitter and half of the core was sent to the lab for analysis while the remaining half core was re-boxed and secured in containers under lock and key.
In 2011, underground drilling consisted of Cubex RC drilling for the purpose of ore definition / delineation. Diamond drilling was conducted for the primary purpose of resource conversion with a limited amount of exploration drilling.
One Cubex RC drill was used underground in 2011 at the Smith Mine and was owned and operated by Small Mine Development LLC (SMD). The Cubex drill performed almost all definition drilling and only 630 feet of resource conversion drilling by utilizing a conventional crossover tube above the down-hole hammer with a 3.94 -inch (100 mm) bit. The air cuttings were run through a cyclone but no splitter was used. Drill hole spacing was targeted at 30 to 50 foot centers throughout the deposit and typically drilled in a ring pattern. The attitude of the drill hole can be at any inclination to the mineralized unit although it was preferred to be as close to normal to the ore-controlling structure as possible.
50
Drill hole length was generally less than 100 feet but occasionally ranged up to 235 feet. The sample interval was 5 feet. Tyvek 11 x 17 inch sample bags were used for the 2010 Cubex drilling. The sample bag was placed in an open-ended sample bag holding apparatus (not a bucket). Drill station ring locations begin at least 5 feet back from the face and were evenly spaced generally every 15 to 30 feet down the heading, and were surveyed and marked in the drift prior to drilling. A Leica Total Robotic Station, owned and operated by SMD, was used as the main underground survey tool.
The driller measured and recorded the location of the drill hole collar after drilling of the drill hole. Collars were not resurveyed after the drill hole is completed. No down-hole survey was performed on the 2011 cubex drill holes. The azimuth for each underground Cubex drill hole comes from the original drill station ring survey. The inclination was measured by the driller during setup using a magnetic angle finder that he attached to the drill rods.
A limited amount of Cubex drilling was conducted at the SSX-Steer mine (QRL operated) in 2011. Drilling, sampling, and survey operations were coincident with that described above for the Smith mine.
Diamond drilling in 2011 was conducted by American Drilling Corp. utilizing a Diamec U8 hydraulic-electric drill and drilled HQ diameter core. The underground core rig was used to drill exploration and resource conversion drill holes. All of the drill holes were surveyed at the collar by SMD after the completion of the drill hole. Magnetic declination used at Smith mine was 13° 45’E. Downhole surveys were conducted using a downhole survey instrument (Flexit) either owned by QRL or rented by American Drilling Corp.
The diamond drill core was placed in labeled cardboard boxes and transported by the drill contractor to the Jerritt Canyon surface core logging facility. Once the diamond drill core arrived at the core logging facility, the core was stored in this locked facility or supervised by a geotechnician or a geologist during normal operating business hours during the core logging and sampling process. The core was placed on tables in the core logging facility and sample intervals were selected by the geologist at 5 foot intervals or as determined by the geologist based on lithology, mineralogy, or alteration. Photographs were taken of the core for archive purposes. The geologist then logged the geology of the drill hole on paper using a predefined logging scheme specific to the project that includes geology, alteration, mineralization, and geotechnical data if core is being examined.
Once geologically logged, the drill core was sawed into two equal pieces where the rock was competent or equally split where the rock was strongly fractured or broken. One half of the core was typically sent out for analysis at ALS Laboratory and the other half was returned to the core box and stored at the mine typically in a locked truck container for archival purposes. In general, sample lengths were set at a minimum of 6 inches to a maximum of 5 feet. An experienced Jerritt Canyon geologist monitored the progress of the diamond drill by occasionally visiting the underground work site. The 2011 sampling procedures, collection, and security for the underground diamond drilling at the Smith mine have been completed under the direction of the Jerritt Canyon Chief Geologist.
51
Sample Preparation, Analyses, Security, and QA/QC
Drill hole samples in 2008 2010 and 2011 were analyzed at both the Jerritt Canyon assay lab and two commercial laboratories: ALS and American Assay Laboratory (AAL). The discussion below details the procedures and protocols used to collect and store the data for the Jerritt Canyon property. The Quality Assurance and Quality Control (QA/QC) programs are also detailed below.
In 2008, 2010 and 2011 the mine utilized the non-certified Jerritt Canyon assay laboratory (JC lab) for analytical work on the underground samples with check samples sent to the certified (ISO/IEC 17025:2005) ALS Laboratory Group (or ALS Chemex lab or ALS) for comparison. In 2010 and 2011, the JC lab was utilized for analytical work on the underground production Cubex drill hole samples with check samples sent on a quarterly basis to ALS Chemex for comparisons. The samples for most of the surface drilling in the West Dash resource area in 2006 were also analyzed at the Jerritt Canyon facility. The JC lab is located in a separate building close to the ore processing plant. The JC lab has all the normal sample preparation equipment and facilities but is a noncertified lab.
Towards the end of 2011, the JC lab replaced the two disc pulverizers with 2 BICO ring and puck mills to increase production and obtain a more consistent grind for the assay pulps. In 2008, the laboratory operated continually with a crew of 16 and performed about 500 fire assays per day with a 24-hour turnaround from receipt of sample to reporting of assays. In 2010, the Jerritt Canyon assay lab was operated using one 12-hour work shift with a crew of 15 and performed approximately 360 assays per day. At the beginning of 2011, the JC Lab converted to running 24 hours a day utilizing four 4-man crews working 12 hour shifts. Shifts were supervised with 2 lead personnel who worked dayshift each directing 2 crews. The regular assay processes workload remained the same in 2011 as in 2010.
At the end of 2011, all of the fire assay furnaces in the JC lab were replaced with new furnaces that included a multi-pour system. The ventilation system for the JC fire lab was completely re-engineered and replaced with a more efficient, safer system that included the addition of a bag-house specifically designed to collect lead emissions from the fire assay process.
In anticipation of the potential for handling complex refractory ores, the JC lab also purchased a new AGILANT (Varian) 200 Series atomic adsorption spectrophotometer with an AGILANT Sample Introduction Pump System (SIPS 10/20). This device will enable the JC lab to complete assays using an instrument finish as opposed to a gravimetric finish for more accurate results, particularly for lower-grade ores but has not been implemented yet..
All of the underground samples received at the JC lab in 2008-2011 arrived with bar-coded labels and were transported to the front laydown area in front of the garage door by the drillers, QRL staff geologists, drilling support staff, or mine staff working with the contract miner SMD. The labels on the bags correlate to sample logs maintained by samplers and drillers in the Jerritt Canyon Underground Department. Sample bar-codes in 2008 were scanned into the LIMS (an automated sample tracking system that utilizes bar-code scanning devices). As a result of this event, assay lots were auto-created in a database. During the process of bar-code acquisition, in 2009 and the first half of 2010, some labels were manually entered into the database by hand because the LIMS system software was not fully operational. The surface drill hole sample numbers arrived at the lab with labels on the sample bags and then those sample numbers were hand-logged into the LIMS system by the lab technicians. All logged samples in 2008 and 2009 dried for four to six hours at 325°F prior to further preparation for sampling procedures.
All logged samples in 2010-2011 were dried for four to eighteen hours at 205°F in ovens at the lab prior to any further sample preparation described below.
52
From 2008 and 2011, a rotary (automatic) 1:4 split (50 rotary cuts minimum) followed the first stage of crushing. Core samples were first-stage crushed 99% to1-inch prior to the split; all other types are typically crushed to 1/2 inch prior to the first-stage split. Second stage crushing (99% to 3/8 inch) automatically passes through a rotary splitter (50 cut minimum). The assay split is then pulverized in a plate mill to 95%-150 mesh (Tyler) and blended for five minutes on a rotary blending wheel. In 2012 the pulverizing will be completed using ring & puck mills as opposed to the disc pulverizers used in the past. The processed samples are then placed in bar-coded sample cups and transferred to fire assay.
A tray of 24 thirty-gram charge crucibles is prepared with a standard litharge flux. Each sample is weighed at one assay ton. In 2008 and 2009, of the 24 samples on each tray, one was a repeat sample, one was a standard, one was a blank, and one was a blind standard inserted into the sample stream by the Geology department. The samples in 2008-2011 were fired by the method of fusion/cupellation with a gravimetric finish. The balance used for the final weighing from 2008-2011 is a Cahn C-30 microbalance that was serviced and calibrated on a semi-annual basis by Microlab Services. During 2012 the JC lab will introduce the multi-pour system and the instrument finish for gold determination to increase accuracy and production rate.
The fire assay method used in 2008, as itemized above, provided a template for assay methodology in 2010-2011. Differences in the 2010-2011 method utilized in 2010-2011 include, of the 24 samples on each tray, one was a triplicate sample (in the eleventh position of the sample sequence for facilitating retrieval to send to ALS Commercial Lab for an assay check), one was a blank (second in the sequence), and one was a blind standard inserted into the 24th position of the sample sequence by the JC lab department. The standards used in 2010 and 2011 were the same standards used in 2008 by the Geology Department and presented to the JC lab by the Jerritt Geology staff as pre-labeled blind pulp bags. A few non-certified standards were used by the JC lab in the first half of 2010 for a short period of time while certified standards were being purchased or made. All reference standards utilized in the JC lab during 2011 were certified standards.
For 2008 to 2011, the JC lab in-house quality assurance/quality control (QA/QC) procedure for checking the accuracy of the Jerritt Canyon lab consists of submitting material from saved duplicate samples of the mill feed and tail daily samples to outside labs for comparison. Samples in 2008 were submitted on a weekly basis to either Rocky Mountain Geochemical or Chemex Laboratories. Data was compiled from the JC daily assay sheet and then compared with the results from the two outside labs. The results of the comparison were entered into a statistical program and a running check was maintained on the data.
During 2011, randomly selected samples from production drill hole material were submitted on a quarterly basis to ALS-Chemex Lab by the Jerritt Geology staff for QA/QC checks. The JC lab staff compiles the results of each 24-sample assay batch and forwards the final results to the Geology Department as individual .csv spreadsheet files. The Geology Department compiles the Production drill hole assay results and QA/QC sample result from the JC daily assay sheets and imports the data to acQuire database software. The results from both the JC assay lab and outside labs are compared and monitored using QA/QC protocols set up in acQuire and described below.
Surface RC and diamond drilling completed in 2008 were sent to the primary lab ALS Minerals Laboratory Group (also referred to as ALS Chemex or ALS in this document) and the secondary lab American Assay Laboratories (AAL) in Reno and Sparks, respectively, Nevada. For 2008 and 2009, samples above 0.100 opt gold were routinely fire assayed with a gravimetric finish. For 2010, the ALS Chemex lab in Reno, Nevada was used for all of the underground diamond drill hole analyses. Samples above 0.070 opt Au were routinely fire assayed with a gravimetric finish. For all years 2008-2011, blanks, standards, and pulps were routinely inserted into the sample stream for QA/QC, and check assay.
53
ALS Chemex typically picked up the cut samples (bagged and labeled with bar codes) at the Jerritt Canyon core logging facility and brought them to their lab in Elko for sample preparation. The 2010 sample preparation procedures for ALS Chemex include:
- the PREP-31 ALS method code that consists of cataloging the sample number, weighing the sample, fine crushing the sample to better than 70 percent passing a 2mm (Tyler 9 mesh, US Std. No 10) screen, splitting off up to 250 g and pulverizing the split to better than 85% passing a 75 micron (Tyler 200 mesh, US std. No. 200) screen;
- Dry-21 ALS method code; and
- CRU-21 ALS method code that consists of a primary crush to approximately -6mm.
- Once the samples were prepared by Jerritt Canyon geologists (geologically logged and sample intervals defined) and geotechnical staff (split or sawed core into two equal pieces and placing one half of the core into a labeled and sealed sample bags for assay analysis), they were picked up at the Jerritt Canyon mine site by ALS representatives who transported the samples to their sample preparation lab in Elko, Nevada and eventually to their assay lab in Reno, Nevada for analysis. The 2010 assay procedures for ALS Chemex included:
- The Au-AA23 ALS method code that consists of a 30g fire assay for gold that uses an aqua regia digest and analysis by atomic absorption spectroscopy (AAS) finish. A prepared sample is fused with a mixture of lead oxide, sodium carbonate, borax, silica, and other reagents as required, with 6 mg of gold-free silver and cupelled to yield a precious metal bead. The bead is digested in 0.5 mL dilute nitric acid in the microwave oven; 0.5 mL concentrated hydrochloric acid is then added and the bead is further digested in the microwave at a lower power setting. The digested solution is cooled, diluted to a total volume of 4 mL with de-mineralized water, and analyzed by atomic absorption spectroscopy against matrix-matched standards. The assay range for this analysis is from 0.005 to 10 ppm; all results >1 ppm were automatically re-analyzed by method Au-GRA21;
- The Au-GRA21 ALS method code that consists of a 30g Au fire assay with a gravimetric finish. The sample is fused with a mixture of lead oxide, sodium carbonate, borax, silica, and other reagents in order to produce a lead button; the lead button containing the precious metals is cupelled to remove the lead; the remaining gold (and silver) bead is parted in dilute nitric acid, annealed and weighed as gold. The assay range for this analysis is from 0.05 to 1,000 ppm Au. This assay method is used automatically for over-limit results from the Au-AA23 assay method.
American Assay Lab (AAL) uses similar sample preparation and assay analysis procedures as ALS Chemex. American Assay Laboratory is an ISO noncertified lab and has a sample preparation facility in Elko, Nevada and an assay laboratory in Sparks, Nevada.
Diamond-drilled core was transported from the underground drill stations to the Jerritt Canyon core logging facility by the contract drillers and/or QRL geological staff and the diamond-drilled core was stored and logged in a secure (lockable) facility until it was processed for shipment to an assay lab.
In 2011, the laboratory QA/QC procedures were as follows:
Jerritt Canyon Laboratory
- One standard sample per 24 samples;
- One blank sample, consisting of silica sand, per 24 samples;
- One triplicate sample per 24 samples;
- Check assays consist of in-house QA/QC procedures identified above, and submitting saved triplicates of the production drill hole samples to an outside certified lab for comparison. The production drill hole samples are submitted on a quarterly basis to ALS Chemex Laboratories.
54
The QA/QC program targeted approximately 1% of the total sample population to be check assayed by ALS.
Commercial Laboratory
A commercial laboratory was used to assay surface and underground exploration and resource conversion drill holes. The (2 Tiered) QA/QC protocol for 2011 is summarized below:
Tier 1
- A blank sample consisting of silica sand inserted as the second sample for each drill hole;
- One standard sample (listed below) inserted into the assay sample stream every 20th sample. Standards are inserted sequentially (based on either ascending or descending assay value) throughout the entire length of a given drill hole;
Tier 2
- On a quarterly basis submit the original pulp reject (assayed at ALS Chemex lab) to ALS Chemex. The samples are re-labeled with new sample identification numbers. For the underground drill core, approximately 15% of the original samples assaying > 0.070 opt. and 5% of original samples assaying 0.010-0.069 opt. are randomly selected from the total sample population. For the surface drilling (RC & Core) the same percentiles of original samples are randomly selected but from 30% of the total sample population. Blanks and standards (as per Tier 1) are submitted with the pulp rejects.
- On a quarterly basis submit original pulp reject (assayed at ALS lab) to AAL lab using the same sample numbers as the original sample. The sample selection criteria are identical to that described above (excluding those samples selected to be re-submitted to ALS).
All samples submitted to be initially analyzed via Fire Assay with an AA finish. Samples with initial assay result > 0.070 opt. Au are re-analyzed via Fire Assay with a Gravimetric Finish. In this instance the database recognizes the result attained from Fire Assay with a Gravimetric Finish as the “best assay”.
The 4 standards, listed below, were used in 2011. Standards Si54 & SK52 were sourced from a certified commercial laboratory (Rocklabs Ltd.). Standards JCQ06 &07 were sourced from Jerritt Canyon ores. The determined gold concentrations, for each standard used throughout 2011, are as follows:
- JCQ06 – 0.159opt (Jerritt Canyon mineralized rock source);
- JCQ07 – 0.241opt (Jerritt Canyon mineralized rock source);
- Si54 – 0.0519opt (Rocklabs certified standard); and
- SK52 – 0.1198opt (Rocklabs certified standard).
The Jerritt Canyon sourced standards JCQ06 and JCQ07 consist of low-sulfide bearing carbonaceous limestone material that were collected from the Jerritt Canyon ore-dryer baghouse in early spring 2010 and approximate the size fraction of a pulp generated from a certified commercial lab. A large amount of each sample was submitted to American Assay Laboratory (AAL) Lab in Sparks, Nevada where they used a large blending machine to help homogenize the standards. After homogenization was attained, the standards were submitted to 3 different assay laboratories as random “blind” pulp samples with labelled identification numbers. The assay results of the standards from all of the labs were reviewed together. The recommended ideal Au values were calculated and based on the mean value. The upper and lower acceptable limits for each standard were calculated based on adding and subtracting two standard deviations to the mean value from all three labs.
55
The RockLab standards were analyzed by over 40 different assay labs around the world, have a 95% confidence level, and lower standard deviations and therefore lower acceptable limits for passing the Jerritt Canyon QA/QC protocol.
In order for an assay batch to pass the QA/QC review, > 90% of the standard assay results must be within two standard deviations (accuracy) of the recommended standard value listed above. Various graphs and a discussion of the results for the 2011 QA/QC program are below.
Results from the standards or duplicates are reviewed by geologists upon receipt from the laboratory. If there is significant deviation from the expected value then the batch of samples is re-fired. If the lab is unable to match the original results within reasonable limits then the sample is re-fired until assay values match or a valid reason for the standard assay discrepancy is determined (e.g. a mislabeled standard or a standard that was inserted out of sequence).
Surface and underground drill data are segregated in the Jerritt Canyon drill-hole database hence the QA/QC data is reported upon separately. In the underground drill-hole database standard and blank sample data are captured for only the exploration diamond drilling.
For the 2011 surface drilling:
Tier 1 QA/QC consisted of submitting (to ALS) a total of 850 blank and standard samples. Zero (0) errors were encountered in the assay results for the 160 blank samples (100% accuracy). For the four (4) standards listed an aggregate of 690 samples were submitted. From the assay results 32 samples (4.5% of total sample population) were found to be in error (the independent laboratory, ALS, had 95.5 % accuracy on the aggregate standard sample population in 2011).
The accuracy for the respective sample populations of the four (4) individual standards is as follows:
Si54: 231 total samples; 96.1% accuracy
SK52: 208 total samples; 94.3% accuracy
JCQ06: 154 total samples; 94.8% accuracy
JCQ07: 100 total samples; 95.0% accuracy
In each instance (for those samples analyzed by fire assay with gravimetric finish- Au_Grav_opt) an excellent correlation is seen between the initial assay and the check assay results attained by both ALS and AAL. Initial analysis of the 45 check samples (fire assay with AA finish-Au_AA_opt) conducted by AAL contained a substantial number of results outside of the error limit. The bulk of these samples had gold contents (0.060 opt) that are of no current economic importance and as such the results are not considered significant. An error was committed on the sample submittal form to ALS resulting in the check samples only being analyzed via Fire Assay with Gravimetric Finish.
For the 2011 underground drilling:
Tier 1 QA/QC consisted of submitting (to ALS) a total of 189 blank and standard samples. Zero (0) errors were encountered in the assay results for the 28 blank samples (100% accuracy). For the four (4) standards listed in section 11.1.1 an aggregate of 161 samples were submitted. From the assay results 13 samples (8.1% of total sample population) were found to be in error (the independent laboratory, ALS, had 91.9 % accuracy on the aggregate standard sample population in 2011).
The accuracy for the respective sample populations of the four (4) individual standards is as follows:
Si54: 45 total samples; 95.6% accuracy
56
SK52: 47 total samples; 93.6% accuracy
JCQ06: 41 total samples; 90.2% accuracy
JCQ07: 28 total samples; 85.7% accuracy
The results attained from standard JCQ07 are not considered to be a cause for concern. The results are derived from a sample population considered too small to make a qualitative assessment. In addition the combined results (surface & underground drilling) for standard JCQ07 resulted in 93.0% accuracy overall.
Tier 2 QA/QC consisted of submitting 32 check samples to ALS and 30 check samples to AAL. Detailed results can be seen on Fig. 11-13 (2011 QAQC Underground Drilling Duplicates ALS-Chemex Lab vs ALS-Chemex Lab) and Fig. 11-14 (2011 QAQC Jerritt Canyon Mine QAQC Underground Drilling Duplicates ASL-Chemex Lab vs American Assays Lab). An excellent correlation is seen between the initial assay and the check assay results attained by ALS (for those samples analyzed by Fire Assay with Gravimetric Finish-Au_Grav_opt). An error was committed on the sample submittal form to ALS resulting in the check samples only being analyzed via Fire Assay with Gravimetric Finish.
The results of the check assays conducted by AAL appear “at first glance” to be concerning due to a substantial number of samples having results outside the error limit for both methods of analysis. A closer look shows that the bulk of the error samples lie immediately adjacent to the error limit indicating that AAL was unable to repeat the ALS assay value to the third decimal value (0.00X opt). In addition, considering the limited sample population, these results are of limited concern.
Lastly external QA/QC is conducted on production drilling samples that are analyzed by the Jerritt Canyon lab (JC lab). The JC lab analyzes production drilling samples via fire assay with a gravimetric finish. In 2011 a total of 360 check samples were submitted to ALS for analysis via fire assay with gravimetric finish. ALS does not guarantee 95% accuracy on samples with gold content < 3ppm (approximately 0.093 opt) when analyzed via fire assay with gravimetric finish. In excess of 85% of the total sample population (360 check samples) submitted to ALS in 2011 had original assay values < 3ppm. As such only +- 15% of the sample population is providing qualitative data for comparison. In lieu of these circumstances the QA/QC for the JC lab becomes subjective to the individual assessing the results.
In conclusion the results of the 2011 QA/QC for the surface and underground exploration and resource conversion drilling is considered excellent and as such the reported final assays comprising these drill programs are considered valid. The protocol for the external QA/QC for the JC lab should be revised to enable a greater number of check samples having initial assays >3ppm to enable a more qualitative analysis. The 2011 Jerritt Canyon QA/QC data was compiled under the supervision of, and reported upon here, by William Hofer, Chief Geologist, QRL Resources, USA-Jerritt Canyon Mine.
Data Verification
The Jerritt Canyon mine has thousands of completed drill holes throughout the land package in the active mines, mined out areas, and exploration targets. Over the years the property has been the subject of many audits in which data verification procedures were carried out.
In 2000, Mineral Resources Development Inc. (MRDI) conducted a review and audit of resources and reserves of the Jerritt Canyon operation. MRDI reviewed the database used at Murray and SSX mines, and did not find any significant errors or problems. Their review of the spreadsheets used for Resource and Reserve tabulation found no errors.
In 2003, Pincock, Allen, and Holt (PAH) reviewed a portion of the database as part of its due diligence review of the Jerritt Canyon operations. Checks of several records of the SSX mine database performed against original logs confirmed the assays values and geological-geotechnical codes. Data validation checks identified a few errors in the drill hole database such as duplicate holes and missing intervals in downhole surveys which were then corrected.
57
In 2004 and 2005 PAH conducted reviews of Jerritt Canyon resources and reserves, during which they performed checks on several drill hole records and original assay certificates against the database. Their focus was new resource and reserve areas. Data validation identified minor errors in 2005 that were then corrected and no errors in 2004.
In 2006, SRK conducted data validation checks as part of its review of the Jerritt Canyon resources and reserves. The database in new reserve areas such as Starvation Canyon and West Dash were checked against the original logs and assay certificates and no errors were found. Spot checks were also performed on the resource and reserve tables for tons and grade and no errors were found.
In 2007, SRK reviewed the Jerritt Canyon assay QA/QC data and found the results within industry standards.
From 2007 to August of 2008, Geological data and assay data were analyzed by geologists using MineSight software and acQuire. The geological block models for both production and resource were generated in MineSight and converted into the Vulcan software environment for use primarily by mine engineers.
The mine shut down in August 2008. After that data, new company geological staff reviewed the status of the acQuire drill hole databases and the 3-D mining software used for exploration, development, and resource and reserve planning. The new geology group elected to stop using MineSight software and to only use Vulcan software. All usable digital project data stored in MineSight and not already in Vulcan were transferred into Vulcan. In most cases, new digitized 0.10 opt Au grade-shells and geological contacts were hand digitized on systematic cross sections in the primary work areas (SSX-Steer, Smith, and Starvation) in order to make 3-D solids for new block models to help support updated resource and reserve estimations.
The acQuire drill hole databases were heavily scrutinized and cleaned up from February 2010 to March 2011. Hua Jin (M Sc. in Geology), the Corporate VG Geologist at the time who managed the Company’s databases, performed a majority of the acQuire work with the assistance from several acQuire Technical Support staff and other Jerritt geological staff including primary author Michele White. Data corrections were performed on a record to record basis. The numerous edits are all documented in a January 16, 2011 memo by Ms. Jin entitled “Summary of the Jerritt geological database work”, which resides on the computer server and in the annual QA/QC notebooks at the mine.
In the third quarter of 2010, the acQuire software was updated from version 3.9 to 4.2.1.4 and as a result the SQL server software required an update to SQL 2008 R2 to help support the newer acQuire software version. This acQuire upgrade allowed the geology group to migrate the Jerritt drill hole database from the standard model acQuire database management system (ADBS) to the corp model system for all three Jerritt databases: the JC production underground drill hole database, the JC surface drill hole database, and the JC geochem database. This allowed the use of data capture tools (importers) and objects (QA/QC analysis tools) in acQuire to import and help validate all of the captured original raw geological data and assay data as efficiently as possible and to help eliminate human errors as much as possible.
Periodic drill hole data extracts from acQuire are made from both the underground and surface drill holes which consist of .csv files for drill hole collar, drill hole down hole survey, drill hole geology, and drill hole assays. The .csv files are loaded into Vulcan as current ..isis drill hole databases which are used for modeling purposes and ultimately for resource and reserve estimations.
58
After 2008, the new Jerritt geology team decided to use Vulcan as the primary geological modeling software. Many of the underground mine projects stored in the acquire database were found to have similar underground drill hole identification numbers. In order for Vulcan to work efficiently, all of the underground drill holes in the database needed to have a unique drill hole identification number. This was accomplished by adding a unique three-letter prefix to the 5 major underground mine areas: SMI- for Smith; SSX- for SSX, STR- for Steer, MUR- for Murray, and MCE- for MCE mines.
In addition, numerous surface geochemical samples and drill hole geological and assay data related to the June to August 2008 Jerritt Canyon mine and exploration drilling programs were imported into the acQuire databases. Some of the drill holes from the Steer underground mine area required geological logging and sampling. Vice President of Exploration for VG, Todd Johnson, was responsible for securing these drill hole samples in safe locations throughout the mine until financing and geological staff were made available to process them. The securing of the samples mostly meant bagging the samples up in bean bags and properly labeling and securing them with wire ties, then storing them inside secure buildings to keep them away from the harsh winter weather conditions. In addition, Mr. Johnson made certain to store all of the relevant hard paper copies of the 2008 drill hole assay certificates and other drill hole data (e.g. geology logs, down hole survey, collar survey, sample transmittals, geotechnical logs, and QA/QC assay data) in the appropriate binders in the main Jerritt Canyon drill hole library.
The QRL historical drill hole geology logs and assay data for the Jerritt Canyon property were mostly stored in the Elko Exploration office during the mine shut down in August 2008. During that time, Mr. Johnson was also responsible for securing and moving all of the Jerritt Canyon exploration data, including the drill hole geology logs and assay certificates and historic geology maps and claim maps from the Elko office to the Administration Building at the Jerritt Canyon mine. Several of the paper copies of the drill hole logs were also located at the Geology offices at the mine. These binders were properly filed with the other drill hole data into one central drill hole data room location.
Numerous duplicate or suspicious geology logs were checked and revised based on visual examination of the hard copy paper geological drill hole logs. It was noticed in mid- to late 2010 that numerous data gaps existed in the surface drill hole database for both Geology and Assay records. A geologist was hired to help collect some of the missing assay and geology records for those areas that were a priority for future exploration or development work. The geological database revisions were documented in internal memos and emails that are stored at the mine site. The addition of the historical geological and assay data to acQuire along with updating all of the 2008 and 2010 drill hole data into acQuire allowed the modeling work at SSX-Steer and Smith to proceed on schedule and also allowed more geological and assay data to be used in the new models.
In addition to the acQuire database work, QA/QC protocols and procedures were reviewed and new guidelines were made. Other data verification was performed during the modeling work and in the construction of the block models and are described below.
A drill hole data audit was performed on the 2008 to 2010 drill hole assay data by Jerritt Geology staff in May 2010. The drill hole data stored in acQuire for certain drill hole records were compared with original assay certificates from the Jerritt Canyon assay lab and the commercial labs. A total of 16% of the 2008 and 2010 total assay records were reviewed for this data audit. The details of this audit are stored on the computer server at the mine.
59
Only 132 out of the 11,413 reviewed 2008 to 2010 drill hole assay records reviewed (1.2 percent) were found to contain different assay values in the acQuire database when compared with the original assay certificate. Most of these errors are likely the result of: (1) assay reruns for drill holes that were analyzed at the Jerritt Canyon assay lab which were not documented or copied into the paper drill hole files, or (2) data import errors related to data that was occasionally hand-entered. No conflicting assay data values were found for the 2010 underground exploration (diamond drill hole) assays conducted by ALS. The low amount of data input errors found in the 2008 and 2010 assay data verifies the significant amount of effort that the post-August 2008 Jerritt Geology group expended to create a robust drill hole database to help support a revised geologic model. A total of 4 percent of the reviewed 2008 underground exploration drill holes from the Smith mine contained no original assay certificate. These assay certificates should be pursued by Jerritt geological staff to fully update the drill hole files. The 132 corrected drill hole assay records will be fixed for future models.
Additional results of the drill hole audit indicate that the former Jerritt geology staff (pre-August 2008) did not routinely store paper copies of the original assay certificates for the underground production drill holes. Most of the Jerritt Canyon assays were directly loaded from LIMS output files directly into the acQuire Production drill hole database.
There are several instances where the Jerritt Canyon assay certificates contain formatting errors which do not allow the straight import of the data into acQuire. For these cases, the acQuire data entry person must determine what the error is and physically revise the assay spreadsheet in order to correctly import the data into acQuire. The assay lab reports must follow the protocols and formats that have been defined for the final assay certificates in order to allow the efficient flow of assay data into acQuire.
The Geology department has largely completed the task of storing drill hole logging information and assay data into the acQuire databases. Assay data is directly downloaded from the lab (both commercial and Jerritt Canyon’s) and goes through automatic and visual validations before being recorded, thus eliminating most data entry errors.
In January 2012, Qualified Person, Michele White, (C.P.G. Geologic Consultant and Exploration and Mining Data Consultant), retrieved digital copies of data specific to supporting the updated resource and reserve estimate at Jerritt Canyon. There was no surface drilling in 2010. Drilled data up to March 2011 had been cleaned and vetted in multiple previous studies accepted for validation by the primary author. As a result, the current validation of 2011 data was limited to only drill hole data utilized in the Vulcan model and to a term between January and December 2011. The digital files provided original results to compare with the actual dataset utilized in Vulcan including collar locations, downhole surveys, lithology, and assay results.
The 2011 datasets validated included:
- The Vulcan-derived isis database used for reserve / resource calculation for collar, survey, assay, alteration, and lithology.
- Direct exports from acQuire of drill hole collar, survey, assay, and lithology.
- Scanned .PDF files of original assay certificates from the accredited outside laboratory: ALS.
- Jerritt Lab direct reporting assay certificates.
- Assay results from ALS used for uploading into acQuire.
- Small Mine Development (SMD) assay datasets derived from the Jerritt lab and subsequently merged into an edited, centralized database for daily mine development.
- Drilling QA/QC protocols including quarterly reports for 2011, standards definitions, statistical analysis and graphs, and other protocol checks.
60
Issues with the 2011 drilled data set include:
- Utilizing data in Vulcan directly from SMD, which bypasses acQuire.
- Edits to raw data such as using place holders and codes in acQuire and Vulcan.
- Typographical errors in sample ID from the Jerritt lab
Details of these issues:
- The underground drilling data from SMD was more complete than the acQuire database by the end of 2011 due to daily updates to the SMD database, whereas the underground drilling data was last updated in acQuire in late May, 2011. This is due to being understaffed during summer of 2011 drilling. In order to utilize the most up-to-date results for resource modeling in Vulcan, the independent consultant, Karl Swanson, loaded SMD’s underground drill hole database for the period of July 2010 to December 2011 directly into Vulcan. This action over-wrote any previous acQuire data for the underground drill holes in Vulcan for that period. Jerritt staff conducted an audit of the resultant dataset and concluded the data to be almost the same as data in acQuire. The different values were found to be correct in the SMD data based on checks with the source results from the Jerritt lab.
- The 2011 assay results used in the resource and reserve estimate are derived from 2 labs: ALS Chemex lab and the Jerritt Lab. The commercial lab reported assay results in .csv file formats for direct upload to acQuire according to standardization built-into the acQuire importers to adhere to business rules of protocol for QA/QC compliance. ALS reported results for Au in ppb and also a calculated field for Au in opt. Results higher than 0.1 opt were re-assayed with Au-GRA21 finish in opt, which automatically supersedes the Au ppb results in acQuire as “best sample” for the exports to Vulcan. Deviation from an expected value, (such as a code for a missing sample or place holders for blank spaces), has to be edited for use in Vulcan. Other edits for Vulcan software include removing characters, such as “<” and “>”. As a result, direct correlation between the isis database would be expected to differ from the raw assay results in spreadsheet from the labs.
- The Jerritt lab will eventually rely on an automated LIMS system. Currently, the Jerritt lab reports assay results with frequent errors in the sample ID. The values of the assay results are not suspect because they are derived from the LIMS-monitored system but the sample ID errors are human derived. These errors in sample ID are easy to detect and edit. This situation hinders a direct comparison of raw Jerritt lab results with the clean isis database.
The Qualified Person, Michele White, accepts this sequence of events in addressing the listed issues with satisfactory results. The 2011 data is valid for use in the isis database because: 1) the SMD data was more complete and is derived from the same source as acQuire, that is the Jerritt lab, 2) the insertion of special characters and place holders by acQuire is a track-able procedure that was examined for error propagation in the dataset used for this update and did not incur errors, 3) the sampleID errors in the Jerritt lab data are predominantly below 0.1 opt and therefore do not impact the resource or reserve.
The assay data verification analysis produced satisfactory correlations between the source data and the isis database. The underground samples derived from Cubex drilling were submitted to the Jerritt lab for assaying and the underground diamond drilling and surface drilling samples are sent to ALS Chemex for certified results. Both labs produced results that fall within industry standards after QA/QC analysis of results.
There are 14,089 total assay results for 2011 in the isis underground assay database. Assay results >0.1 opt have an acceptable correlation between the isis database and the Jerritt lab (about 17% of the assay population is >0.1 opt and the direct matches for those values are consistent). The correlation between the isis underground assay database and the ALS lab results for samples >0.1 opt is100%. There is a direct match of 60% records between the isis database and total source data. The result of the data validation for the isis underground drilling database from January to December 2011 has been reviewed and is considered acceptable by the primary author.
61
The acQuire surface drill hole database is in an excellent state of verification. Of 37,225 assay records for surface drilling results from ALS, only 17,614 assay results were utilized in the isis surface drilling database. Of these 17,614 isis assay records, there are 1,113 intervals that differ from source data. Of these differences, only 307 samples are >0.1 opt and therefore, only 307 out of 17,614 records could possibly impact the resource / reserve estimate. That is a 93% acceptable correlation of matching records between the original source data and the isis database. This is a very good correlation.
The results of the 2011 data vetting analysis support the opinion that the isis database is based on correct values to within acceptable industry standards. This dataset in conjunction with the previously accepted datasets of drilling results, such as collar location, down-hole survey, lithology, and assay results, form a cohesive, validated database for use by engineers in evaluating and reporting on resources and reserves at Jerritt Canyon for the current Technical Report Update, dated December 31, 2011.
The Qualified Person for data vetting has independently verified the quality of the drill hole data (both collar information and gold assays) used for the current resource and reserve work and finds it adequate for use in the current study. Based on this assessment, the primary author’s opinion is confident that Jerritt Canyon is conducting exploration and development sampling and analysis programs using standard practices and that the data can be effectively used in the estimation of resources and reserves. It is recommended that the logging of geological drill hole data that is currently being done on paper using pencils be done on the computer or hand-held digital device in order to standardize the pick lists and more efficiently process the data in the future.
The mineral processing operation at Jerritt Canyon is very complex and is one of only three processing plants in Nevada that uses roasting in its treatment of refractory ores. Initially, Jerritt Canyon was designed to process oxide and mildly refractory gold ores by conventional cyanidation using chlorine gas for pre-oxidation of the refractory ores. The use of the wet mill to help treat the mildly refractory ores, which used chlorine for ore oxidation pre-treatment, was stopped in February of 1987. In 1989, the roasting circuit (a dry milling process) was added to the process flowsheet for the treatment of highly refractory ores which continues to be used at Jerritt Canyon today for processing of the Jerritt Canyon and other second party (purchased) ores.
Numerous metallurgical studies have been conducted on the ores by the various mine owners at the property including cyanidation and roasting test work since the late 1970’s. In addition, early metallurgical testwork on ores from resource areas, including bottle roll tests for WaterPipe II, have also been conducted. These reports are in the files stored at the mine site. The actual Au recoveries for the various deposits that have been previously mined and processed are also noted in historic documents stored at the mine site.
The Jerritt Canyon ores are double refractory in nature since the gold mineralization is both included in solid solution within sulfide minerals (arsenic-rich pyrite), and locally associated with organic carbon in the host rock. Some limited amount of gold mineralization has also been noted in previous mineralogical studies to be tied up in quartz (silicification). The Jerritt Canyon roaster helps oxidize the majority of the refractory ores for subsequent cyanidation.
A significant portion of the Jerritt Canyon ore contains high amounts of clays and moisture during the winter months. These cause serious handling problems in the plugging of chutes in the crushing circuits.
62
As a result of these conditions, the processing plant capacity during the summer and fall is typically 20% to 40% higher than winter, largely because the dry mill capacity is adversely affected by high moisture in the feed, due to snowfall and ice.
In 2011, VG updated the Jerritt Canyon resource estimate incorporating additional drilling from the 2011 drill campaign. An additional 145 surface drill holes and 1,717 underground drill holes were added since the last NI 43-101 report. The December 2011 resource estimates were done by Mark Odell, Owner, Practical Mining, LLC, P.E. and Karl Swanson, Independent Consultant, SME, MAusIMM using the Vulcan Software version 8.1.3.
The deposits at Jerritt Canyon which were re-estimated and new resources and/or reserves calculated since the last NI 43-101 report are: Burns Basin, California Mtn, Mill Creek, Murray, Pie Creek, Road Canyon, Saval, Smith, Starvation, Steer-SSX, West Mahala, Winters Creek, and Wright Window. Open pit and underground block models were built for the respective deposits. The open pit models were based on both 0.01 opt and 0.1 opt grade-shells whereas the underground models were based on 0.1 opt grade-shells. All block models include the geologic models of the stratigraphic units within the deposit.
The deposits with open pit block models are: Burns Basin, Mill Creek, Pie Creek, Road Canyon, Saval, Wright, and Window. The deposits with underground block models are: California Mtn, Murray, Saval, Smith, Starvation, Steer-SSX, West Mahala, and Winters Creek. Note that only the Saval deposit has both an open pit and underground block model. Due to their close proximity to each other, the Saval, Steer-SSX, and West Mahala deposits are included as a single underground block model called SSX. The stockpiles reposing at the mine portals or remaining from earlier open pit extraction are included in the resource and reserve tables.
Mineral Resource Classification
All blocks which have an estimated gold grade are subsequently classified based on the confidence in the estimation. The confidence is based on the number of composites used in the estimation, the distance to these composites, and the number of drill holes for the selected composites. The Jerritt Canyon mineral resource was classified into Measured, Indicated and Inferred categories using logic consistent with the CIM (2005) definitions referred to in Canadian National Instrument 43-101 and described in the glossary. The highest confidence is called Measured (CLASSNAME = "meas" or CLASS = 1), the next is Indicated (CLASSNAME = "ind" or CLASS = 2), and the lowest confidence is "Inferred" (CLASSNAME = "inf" or CLASS = 3).
Based on the drill hole spacing distance at each of the deposits, distances were chosen which define the classification of the estimated block. At Murray, Smith, and SSX, underground production drilling is spaced between 10 and 25 feet apart. The variograms show a sill range just over 50 feet so a slightly conservative range was chosen. The measured classification for all models except Starvation are blocks that were estimated with an ellipse range of 40x40x20 feet with a minimum of 8 and a maximum of 12 composites which requires a minimum of three drill holes using a maximum of three composites per drill hole.
The indicated classification for all models except Starvation are blocks that were estimated with an ellipse range of 100x100x50 feet with a minimum of 5 and a maximum of 12 composites which requires a minimum of two drill holes using a maximum of three composites per drill hole.
The inferred classification for all models except Starvation are blocks that were estimated with an ellipse range of 300x300x150 feet or 500x500x250 feet with a minimum of 2 and a maximum of 12 composites which requires a minimum of one drill hole using a maximum of three composites per drill hole. The large increase in range is to ensure that all of the blocks within the grade-shells that were not estimated with the measured or indicated estimations get estimated and are called inferred.
63
Starvation was the first model completed and the classification criteria, which is used for all the other models had not been instituted yet. At Starvation, the classification of the blocks is calculated with a script after the blocks are estimated. A block is measured if the average distance to all of the composites used in the estimation is less than 35 feet and the number of composites is seven or more. Indicated class is when the average distance to the composites used is less than 100 feet, the number of composites is five or more and the block has not been classified as measured. All other blocks are inferred. A maximum of two samples per drill hole is also used for all estimations. Because the average drill spacing distance is between 50 and 100 feet, very few blocks are classified as measured at Starvation.
The drill hole composites were displayed with cross section views of the block models to visually inspect the local estimations of the gold grade by comparing the composite grades to the block grades. Those areas inspected for each block model, especially where high-grade composites exist, looked appropriate and correlated well given the search distance and number of samples used. The modeling method itself ensured that mineralization and the estimate was constrained within the 0.10 opt and/or 0.01 opt Au grade-shells created in Vulcan.
The block models at Jerritt Canyon have been created with standard modeling practices and can be considered reasonable predictors of resources within the modeled areas.
Drill hole composite statistics were compared to the block statistics for each block model. All of the estimated blocks, measured, indicated, and inferred were used to calculate the average block grade. All composites flagged as inside the grade-shells with a grade greater than zero were used to calculate the average composite grade.
The comparison on this global scale was acceptable. In addition, ongoing reconciliation studies done in 2010 and early 2011 that compare actual mined grade and tonnage vs. that predicted in the block model for the Smith mine compare very well.
The average estimated grade is lower than the average composite grade as is expected. The exception in is the Murray deposit where the higher grade samples are grouped in such a way spatially that they are estimating a larger volume than the lower grade samples. This is biasing the estimation slightly and giving a higher grade estimate than expected. Where more than one estimation method exists, the average estimated grades compare favorably by deposit.
Mineral Resource Statement
The Jerritt Canyon mineral resources, including reserves, as of December 31, 2011 are as follows:
Mine | Measured | Indicated | Measured + Indicated | Inferred |
| kt | opt | koz | kt | opt | koz | kt | opt | koz | kt | opt | koz |
| Underground | | | | | | | | | | | | |
| Smith | 2,098.1 | 0.224 | 470.2 | 2,133.4 | 0.215 | 458.6 | 4,231.5 | 0.220 | 928.8 | 979.5 | 0.196 | 191.8 |
| SSX | 2,248.2 | 0.211 | 474.0 | 1,451.1 | 0.205 | 298.2 | 3,699.2 | 0.209 | 772.2 | 371.7 | 0.198 | 73.7 |
| Saval | 55.9 | 0.237 | 13.2 | 277.7 | 0.222 | 61.5 | 333.6 | 0.224 | 74.8 | 95.4 | 0.200 | 19.1 |
| West Mahala | 25.3 | 0.196 | 5.0 | 363.5 | 0.190 | 68.9 | 388.7 | 0.190 | 73.9 | 1,854.6 | 0.175 | 324.0 |
| Murray | 163.0 | 0.207 | 33.7 | 427.2 | 0.216 | 92.2 | 590.2 | 0.213 | 125.9 | 86.0 | 0.215 | 18.5 |
| Starvation | 5.9 | 0.294 | 1.7 | 519.4 | 0.250 | 130.0 | 525.2 | 0.251 | 131.8 | 255.4 | 0.253 | 64.6 |
| California Mtn. | | | | 4.5 | 0.184 | 0.8 | 4.5 | 0.184 | 0.8 | 29.5 | 0.192 | 5.7 |
| Winters Creek | | | | 90.3 | 0.162 | 14.6 | 90.3 | 0.162 | 14.6 | 9.2 | 0.186 | 1.7 |
| Subtotal | 4,596.3 | 0.217 | 997.9 | 5,267 | 0.214 | 1,124.9 | 9,863 | 0.215 | 2,122.8 | 3,681.2 | 0.190 | 699.1 |
| Open Pit | | | | | | | | | | | | |
| Burns Basin | 34.5 | 0.087 | 3.0 | 309.9 | 0.097 | 30.2 | 344.5 | 0.096 | 33.2 | 14.0 | 0.079 | 1.1 |
64
| | Measured | Indicated | Measured + Indicated | Inferred |
| Mine | kt | opt | koz | kt | opt | koz | kt | opt | koz | kt | opt | koz |
| Mill Creek | 3.2 | 0.091 | 0.3 | 272.9 | 0.094 | 25.8 | 276.2 | 0.094 | 26.1 | 3.4 | 0.154 | 0.5 |
| Saval OP | 84.8 | 0.135 | 11.4 | 569.5 | 0.065 | 37.2 | 654.3 | 0.074 | 48.6 | 222.2 | 0.142 | 31.6 |
| Wright | | | | | | | | | | | | |
| Window | 7.9 | 0.142 | 1.1 | 117.8 | 0.090 | 10.6 | 125.8 | 0.094 | 11.8 | 4.8 | 0.093 | 0.4 |
| Pie Creek | | | | 205.4 | 0.087 | 17.9 | 205.4 | 0.087 | 17.9 | 4.9 | 0.090 | 0.4 |
| Road Canyon | | - | | 17.5 | 0.069 | 1.2 | 17.5 | 0.069 | 1.2 | 185.1 | 0.082 | 15.1 |
| Subtotal | 130.4 | 0.121 | 15.8 | 1,493.1 | 0.082 | 122.9 | 1,623.6 | 0.085 | 138.7 | 434.5 | 0.113 | 49.3 |
| Stockpiles | 180.0 | 0.094 | 17.0 | 622.6 | 0.065 | 40.7 | 802.6 | 0.072 | 57.7 | - | - | - |
| Total | 4,906.8 | 0.210 | 1,030.7 | 7,382.7 | 0.175 | 1,288.5 | 12,289.5 | 0.189 | 2,319.2 | 4,115.7 | 0.182 | 748.4 |
Notes: | (1) | The following parameters were used to determine the gold cutoff grade for each resource area: a US$1,400 per oz gold price which is equal to a 24-month trailing average gold price of US$1,400oz |
| | (2) | Mineral resources that are not mineral reserves do not have demonstrated economic viability |
Underground mineral resources where estimated by creating grade shells containing only those blocks greater than 0.12 opt (0.13 opt at Starvation) and are located outside of the sterilization solids described above. The grade shells were also reviewed by the QP and further reductions made where the grade shells were deemed unrecoverable based on factors of size, distance from existing or planned workings or potential interference from previously mined large un-filled stopes which could extend beyond the sterilization solids. Finally a mining recovery factor of 5% and dilution factor of 10% was applied to the resources inside the remaining grade shells. These factors are reasonable for the type and scale of underground mining practiced at the Jerritt Canyon Mines.
Open pit resources were estimated by creating a Lerch Grossman optimized $1,400/ ounce pit shell using measured, indicated and inferred blocks, all other blocks are considered waste. The operating costs used in the analysis are those given below. Metallurgical recovery is a function of grade and is estimated using the equation listed below. The resultant pit only mines those ore blocks which will provide a positive value when including the cost of mining all the overlying waste blocks. The resource only includes the measured, indicated and inferred blocks that are inside the $1,400 pit shell and exceed the minimum cutoff grades. The reported open pit resources also include 5% mining dilution and 5% mining losses. These factors are reasonable for the scale and scope of the resource pits.
Dewatering will be required for 46% of the Murray Mine resources, 24% of the Smith Mine resources and 100% of the West Mahala resources. QRL plans to construct dewatering wells, treatment facilities and disposal facilities to handle all dewatering that cannot be consumed in the process plant.
We are not aware of any possible adverse or unusual restrictions on mining resulting from legal or title issues, taxation, socio-economic, environmental, political, or others that would affect the Jerritt Canyon operation. The mine has or expects to receive the permits necessary for operation.
Mineral Reserve Estimate
Mineral reserves were estimated by Practical Mining LLC under the direction of Mark Odell (P.E.), Consulting Mine Engineer.
Jerritt Canyon Mineral Reserves – December 31, 2011
Mine | Measured | Indicated | Measured + Indicated | Inferred |
| kt | opt | koz | kt | opt | koz | kt | opt | koz | kt | opt | koz |
| Underground | | | | | | | | | | | | |
| Smith | 2,098.1 | 0.224 | 470.2 | 2,133.4 | 0.215 | 458.6 | 4,231.5 | 0.220 | 928.8 | 979.5 | 0.196 | 191.8 |
| SSX | 2,248.2 | 0.211 | 474.0 | 1,451.1 | 0.205 | 298.2 | 3,699.2 | 0.209 | 772.2 | 371.7 | 0.198 | 73.7 |
| Saval | 55.9 | 0.237 | 13.2 | 277.7 | 0.222 | 61.5 | 333.6 | 0.224 | 74.8 | 95.4 | 0.200 | 19.1 |
| West Mahala | 25.3 | 0.196 | 5.0 | 363.5 | 0.190 | 68.9 | 388.7 | 0.190 | 73.9 | 1,854.6 | 0.175 | 324.0 |
| Murray | 163.0 | 0.207 | 33.7 | 427.2 | 0.216 | 92.2 | 590.2 | 0.213 | 125.9 | 86.0 | 0.215 | 18.5 |
| Starvation | 5.9 | 0.294 | 1.7 | 519.4 | 0.250 | 130.0 | 525.2 | 0.251 | 131.8 | 255.4 | 0.253 | 64.6 |
65
Mine | Measured | Indicated | Measured + Indicated | Inferred |
| kt | opt | koz | kt | opt | koz | kt | opt | koz | kt | opt | koz |
| California Mtn. | | | | 4.5 | 0.184 | 0.8 | 4.5 | 0.184 | 0.8 | 29.5 | 0.192 | 5.7 |
| Winters Creek | | | | 90.3 | 0.162 | 14.6 | 90.3 | 0.162 | 14.6 | 9.2 | 0.186 | 1.7 |
| Subtotal | 4,596.3 | 0.217 | 997.9 | 5,267 | 0.214 | 1,124.9 | 9,863 | 0.215 | 2,122.8 | 3,681.2 | 0.190 | 699.1 |
| Open Pit | | | | | | | | | | | | |
| Burns Basin | 34.5 | 0.087 | 3.0 | 309.9 | 0.097 | 30.2 | 344.5 | 0.096 | 33.2 | 14.0 | 0.079 | 1.1 |
| Mill Creek | 3.2 | 0.091 | 0.3 | 272.9 | 0.094 | 25.8 | 276.2 | 0.094 | 26.1 | 3.4 | 0.154 | 0.5 |
| Saval OP | 84.8 | 0.135 | 11.4 | 569.5 | 0.065 | 37.2 | 654.3 | 0.074 | 48.6 | 222.2 | 0.142 | 31.6 |
| Wright | | | | | | | | | | | | |
| Window | 7.9 | 0.142 | 1.1 | 117.8 | 0.090 | 10.6 | 125.8 | 0.094 | 11.8 | 4.8 | 0.093 | 0.4 |
| Pie Creek | | | | 205.4 | 0.087 | 17.9 | 205.4 | 0.087 | 17.9 | 4.9 | 0.090 | 0.4 |
| Road Canyon | | - | | 17.5 | 0.069 | 1.2 | 17.5 | 0.069 | 1.2 | 185.1 | 0.082 | 15.1 |
| Subtotal | 130.4 | 0.121 | 15.8 | 1,493.1 | 0.082 | 122.9 | 1,623.6 | 0.085 | 138.7 | 434.5 | 0.113 | 49.3 |
| Stockpiles | 180.0 | 0.094 | 17.0 | 622.6 | 0.065 | 40.7 | 802.6 | 0.072 | 57.7 | - | - | - |
| Total | 4,906.8 | 0.210 | 1,030.7 | 7,382.7 | 0.175 | 1,288.5 | 12,289.5 | 0.189 | 2,319.2 | 4,115.7 | 0.182 | 748.4 |
Underground mining accounts for over 90% of the Jerritt Canyon Reserves at year end 2011. The reserves are distributed among 5 underground mines located throughout the district. These are, listed in decreasing order of reserves, the Smith Mine, SSX complex which includes the SSX, Steer and West Mahala reserves, Murray, Starvation and Saval. The Smith and SSX mines are currently operating, and the Murray Mine operated from 1994 to 2006. Starvation and Saval are both proposed new mines.
Mine designs for each mine have been created using Vulcan software. Each mine design consists of a collection of individual excavations, each designed in accordance with the outlined parameters. The excavations are oriented along preferred mining directions in each stoping area and arranged to extract as much of the measured and indicated resource that meets the minimum breakeven cutoff grade requirements discussed while minimizing the amount of diluting material included.
The stope average grade must exceed the minimum breakeven cutoff grade after the application of 5% mining losses and 10% dilution to be considered for inclusion in mineral reserves. If an excavation is required to access a stope or other development drift and after the application of mining recovery and dilution factors the average grade of the excavation exceeds the incremental cutoff grade, will it be considered for inclusion in mineral reserves. Only the measured and indicated resources within the mine design excavations are used for the calculation of proven and probable reserves.
The cut off grades for underground reserves were determined using a gold price of $1,275 per ounce and the mining, haulage, processing and administrative costs. Process recoveries are grade dependent and vary between 75 and 90%.
Included in the reserve are 184 koz. located below the local water table. These include all of the West Mahala reserves, the reserves at Murray below the 6100 foot elevation, Smith Mine Zones 2, 3 and 4 reserves below the 6,600 foot elevation and the Smith East Zone 9 reserves below the 6,300 foot elevation. The company plans to dewater these reserves by drilling wells from the surface into targeted ground water compartments. This water will either be used in the process or treated and discharged to a rapid infiltration basin. Engineering of the dewatering system is ongoing and the permitting process will be initiated in 2012. The Reserves Life of Mine Plan includes capital spending and schedule allowances for the dewatering operations.
Open pit reserves are contained in four different Mining Areas. These are, in decreasing order of reserves, Burns Basin, Mill Creek, Saval and Wright Window. Open pit reserves were estimated by creating a Lerch Grossman optimized $1,275 per ounce pit shell using only measured and indicated blocks. The resultant pit only mines those measured and indicated blocks which will provide a positive value when including the cost of mining all the overlying waste blocks.
66
Using the optimized pit shell as a guide a final engineered pit was designed with haulage ramps and catch berms. If, after the application of mining recovery and dilution factors, the final pit has positive economic value then the measured and indicated blocks contained inside the pit design that are greater than the cutoffs grades can be considered proven and probable reserves.
The open pits included in the reserve estimation are of limited size and scope. Three of the four are also located in areas previously mined by open pits and none of them will require dewatering. The combination of these factors will allow timely receipt regulatory approvals.
Recent operating results, including production costs, of the Jerritt Canyon mines are presented in this section. In addition, geotechnical parameters, mining methods, ore control, stockpile resources and reserve reconciliation are presented in this section.
Jerritt Canyon is an operating property with over 20 years of production experience, during which approximately 7.8 million ounces of gold have been produced up to year-end 2011. The Jerritt Canyon mine complex currently consists of two operating underground mines (Smith and SSX) located several miles southwest of the processing plant and administration facilities which are 50 miles north of Elko, Nevada. Mining operations resumed at the SSX-Steer complex during the third quarter of 2011. The Murray underground mine was closed in 2006 and the MCE underground mine in 2004.
Recent operating results, including production costs, of the Jerritt Canyon mines, are presented in this section. In addition, geotechnical parameters, mining fleets and ore control are presented in this section. Stockpile resources and reserves and reconciliation are also presented in this section.
All mines feed the same processing plant, with output from the underground operations and other sources (e.g. remote and mill Jerritt stockpiles) totalling nearly 0.37 million tons during 2011 and 0.41 million tons in 2010. The producing properties at Jerritt Canyon excluding third party purchased ores (e.g. Newmont), and their annual production rates for years 2010 and 2011, are given below and represent ore materials processed through the mill on a dry ton basis.
The full processing plant has the capability of treating approximately 6,000 tons/day (125 tph for each roaster). The historical processing capacity rate of 4,320 tpd (90tph for each roaster) was quite attainable when the feed derived mainly from open pit operations, but has been a significant surplus when accepting material from the underground mines simply because the total mine output cannot attain this daily rate. In mid-2007 QRL amended an agreement with Newmont USA Limited to purchase material delivered to Jerritt Canyon by Newmont, which would supplement mined ores feeding the roasters and thereby reduce certain unit operating costs.
The plant processed a total of 628,418 tons in 2011 and operated for 339 total days to achieve an average processing rate of 1,853 tons/day for the year. Gold produced in 2011 from all sources was 76,585 ounces (recovered) from 628,418 tons of processed ore and purchased material at a metallurgical recovery that averaged 85.8% . The Smith underground mine reported production of 269,795 tons of ore containing 46,971 ounces of Au. The daily average ore production rate from the Smith Mine in the fourth quarter of 2011 was approximately 1,169 tons. Underground mining at the SSX-Steer mine Complex started in early October of 2011 and averaged approximately 150 tons of ore per day in the fourth quarter of 2011. Ore production at SSX-Steer is planned to increase to 1,250 tons per day by the second quarter of 2012. A total of 95,351 tons of Jerritt stockpile material containing 7,182 oz of Au was processed through the mill in 2011.
The plant processed a total of 599,555 dry tons in 2010 and operated for 322 total days to achieve an average processing rate of 1,862 tons/day for the year. Gold produced in 2010 from all sources was 65,104 ounces (recovered) from 599,555 tons of processed ore and purchased material at a metallurgical recovery that averaged 88.2% . For 2010, the Smith underground mine reported production of 176,409 dry tons of ore containing 29,278 ounces of Au, along with 186,650 waste tons. The daily ore production rate from the Smith Mine in the third quarter of 2010 reached the target of 1,000 ore tons. A total of 233,731 tons of Jerritt stockpile material containing 14,122 oz of Au was processed through the mill in 2010.
67
The plant processed a total of 338,350 tons in 2008 and only operated for 159 days that year due to the significant amount of down time. The plant therefore processed an average of 2,128 tons/day in 2008. Plant capacity is limited to some extent by the “fuel content” of the ore (principally contained pyrite) which tends to enhance temperatures in the roaster and so must be regulated carefully when this type of rock serves as feedstock. Blending of various mined products is practiced constantly to reduce deleterious impacts from rock types with high fuel content, high arsenic content, and so forth. Also the capacity was somewhat limited because of air permit requirements at that time. Gold produced in 2008 from all sources was 44,732 ounces from 338,350 tons of processed ore and purchased material at a metallurgical recovery that averaged 87.3% .
The Smith and SSX-Steer underground mines reported production of 135,909 tons of ore, along with 136,070 waste tons in 2008. This tonnage figure was significantly less than the 2008 budgeted amount of nearly 336,641 ore tons at a projected mined grade of 0.284 ounces/ton which can be mostly attributed to the August 2008 mine shut down and other mill shut downs in early 2008. In 2008 a total of 88,709 tons of Jerritt Canyon stockpile (remote + mill) was processed through the mill. Of this total, 32,793 tons of remote stockpile material containing an average grade of 0.170 opt Au was delivered to the mill and processed. In addition, a total of 55,916 tons of mill stockpile at a grade of 0.141 opt Au was processed in 2008.
Due to poor record keeping in 2009 by the contract mill operator, Golden Eagle, the total amount of ore tons processed in 2009 was not recorded by VG but they reportedly produced 9,770 ounces of Au for the year. All ore materials processed in 2009 were not separated by source and were a mixture of Newmont, Hollister, and Jerritt stockpile materials located at the mill. It is assumed that no remote Jerritt Canyon stockpile materials were hauled to the mill in 2009. The mill only operated for 130 days in 2009 as a result of several “stop” orders received from the NDEP.
Newmont ores continued to be purchased and processed by QRL in 2011. In 2011, QRL processed 254,221 dry tons containing 33,968 ounces. Ore purchasing contracts with Newmont were made in 2010. A total of 86,257 wet tons of ore containing 16,905 ounces of Au were purchased from Newmont (all in Quarter 4 in 2010) and delivered to the mill in 2010. During 2008 and 2010, QRL processed 113,732 and 189,415 dry tons, respectively, of Newmont material. The Newmont stockpile ores processed in 2010 included material delivered to the mine prior to 2010. The amount of Newmont ores processed in 2009 is unknown due to poor record keeping by the contract mill operator.
A scheduled mill shut down is planned for at least three weeks in January in 2012 for maintenance and also to replace and move the ore dryer to the front end of the circuit. Instead of drying ore after secondary crushing, the new ore dryer will dry ore after primary crushing which will increase the drying efficiency. The new dryer will also be sized larger to handle more ore. In addition, the material handling (conveyors) after the secondary crusher will also be re-arranged and optimized during the planned mill shut down. Other planned modifications to the processing facilities will include a change-out of the Merrill-Crowe precipitation circuit with an electrowinning circuit, replacement of a quench tank, and improvements to the oxygen plant.
Underground Mining at Jerritt Canyon consists of two primary mining methods, longhole open stoping with delayed backfill and modified drift and fill. The preferred sequence for longhole stopes is to mine from the bottom up and for drift and fill to mine underhand or from the top down. These methods have been employed successfully at Jerritt Canyon since 1993.
68
The stope development drifts for longhole open stoping and for drift and fill are typically from 15 to 20 feet high and 15 to 25 feet in width depending on the ground conditions and geometry of the ore. The excavations are created using conventional drill, blast, muck and support techniques. All aspects of the mining cycle are fully mechanized to provide the highest safety standards and productivity levels.
Split set rock bolts and welded wire mesh provide the primary means of ground support. These can be supplemented with resin anchor rebar bolts, cable bolts and/or shotcrete when conditions require additional support.
The development drifts for longhole stopes are spaced with a minimum back to sill separation of 25 feet vertically. This vertical separation can be increased to as much as 100 feet if the geometry of the deposit will allow. Once the top and bottom stope development drift is completed the intervening ore will be drilled with a mechanized production drill using 2 ¾ inch to 4 in diameter blast holes. The blast holes will be loaded with either ANFO or emulsion explosives and fired in groups of three or four rows progressing from the hanging wall to footwall of the stope. Following each blast the broken ore is removed from the stope by means of a remotely operated load haul dump unit. Remote operation allows the operator to stay at a safe location under bolted ground at all times.
Once the stope has been extracted it is backfilled to the level of the top access drift sill. The backfill material used is a cemented rock fill which contains from 4 to 8% cement and will have unconfined compression strengths of 400 to 600 pounds per square inch (psi). The backfill will reach its required strength within three to seven days at which time development of the adjacent stope may begin. If there are no further adjacent stopes to be extracted the stope can be backfilled with unconsolidated waste or left open. If there is another stope immediately above the backfilled stope then the top access drift of the prior stope will serve as the bottom access for the next otherwise it will be backfilled in preparation to mine the adjacent stope.
If the vertical thickness of the ore is not great enough to allow long hole stoping then drift and fill methods are employed. In this method a top access drift will be driven at the upper extent of the ore. Any ore remaining below the access drift is removed by means of breasting up the sill or of the access drift. During breasting the footwall can be ramped at up to a -25% gradient to allow LHD access. The height of the breast can reach up to 40 feet. Upon completion of the stope it will be backfilled similar to a long hole stope.
Any underground mining dilution occurs at the fringes of the ore pods or lenses. Within the pods, slices or drifts are extracted and then backfilled with cemented waste material. When the backfill has consolidated, the ore between the primary stopes or drifts is then extracted. In the primary cuts, the interior stope boundaries are surrounded by ore, so little dilution results. Within the secondary cuts, the walls and/or back are cemented backfill, which has less jointing than the ore or enclosing rocks, and thus little dilution takes place. It is primarily on the fringes of the individual ore bodies that dilution occurs, with the amount also being dependent upon the mining method. Historically dilution at Jerritt Canyon has averaged 10% or less for all mines and mining methods. All dilution material is applied at zero ounces per ton. All of the underground reserves have also been adjusted to include a mining recovery factor of 95%.
Access drifts to the stoping areas are excavated in a manner similar to stope development drifts. Access drift dimensions are 15 feet wide by 15 feet high to accommodate 30 ton haul trucks and provide a large enough cross sectional area for ventilation. The gradient of access drifts can vary form -15% to +15%.
69
Access drifts are also equipped with compressed air piping, 4160 volt electrical distribution systems, mine water supply piping, water discharge piping and communication systems.
Capital development rates will be as much as 9,800 feet per year at SSX and 8,900 feet per year at Smith in order to achieve the planned ore production levels.
The Hanson Creek host rock at Jerritt Canyon has a fair to poor classification with RMR values typically in the 30 – 40 range. These conditions are managed by limiting the span or hydraulic radius of open excavations through the use of cemented backfill. And by applying the ground support materials mentioned above. On occasion geologic structures are encountered with adverse orientations to the mine workings. These are controlled with the application of the additional ground support materials. Under the most severe conditions the drift will be advanced following the installation of spiling or steel sets.
Underground Mining at Jerritt Canyon relies heavily on diesel equipment to extract the ores. This requires large amounts of fresh ventilation air to remove the diesel exhaust and maintain a healthy environment. A combination of the main access drifts and vertical raises are arranged in a manner to provide a complete ventilation circuit. The mine portals can be either intake or exhaust.
A portion of the reserves and resources located in the Smith and SSX/West Mahala areas are located below local ground water table and will require dewatering. Dewatering will be accomplished by means of high capacity production wells drilled from the surface and targeted into specific compartmentalized ground water horizons. Each well can have a capacity of up to 500 gallons per minute. Discharge from the wells will be used to provide the 700 gallons per minute of process makeup water required or will be treated and disposed of in a rapid infiltration basin. Water treatment will be required to maintain allowed levels of arsenic, antimony and total dissolved solids.
Two wells are budgeted to be completed in 2012 and will be initially used to test the ground water response to pumping and provide additional water quality data for detailed engineering of the water treatment plant and rapid infiltration basin. Additional wells will be completed as mining progresses into each of the areas requiring dewatering.
Dewatering will also be required at the Murray Mine. During its operation the Murray mine was dewatered through a series of small underground wells drilled to target specific water bearing structures. This water did not require treatment and was pumped to 3 injection wells located below the Alchem pit for disposal. The system remains in place and will be rehabilitated with the reopening of the Murray Mine.
The Life of Mine Reserves Plan contains $36M in capital for the design and construction of the dewatering facilities. Production from the areas requiring dewatering is not scheduled to begin until mid-2014. Engineering of these facilities is underway and permitting will commence in 2012 and is not expected to delay mining.
Open pit methods will be used to extract some of the reserves at Jerritt Canyon. Three of these areas, Burns Basin, Mill Creek and Saval were mined previously by open pit methods. The fourth area, Wright Window, has not been the site of any previous mining activity. Open pit mining will provide between 100,000 and 350,000 tons of ore per year beginning in 2013. Stripping ratios will vary from a low of 2:1 at Wright Window to a high of 17:1 at Saval.
The open pits will be conventional drill, blast, load and haul operations utilizing 10 to 15 cubic yard loaders and 100 – 150 ton haul trucks. The pits will be worked in 20 foot benches with the ore and waste delineated using blast hole assays. It is anticipated that all open pit mining will be performed by a qualified contractor. Operating and capital costs in the Life of Mine Plan have been adjusted accordingly.
70
Previous open pit mining allowed for a 55 – 65 degree bench face angle and a 45 degree inter-ramp slope angle. These operations resulted in stable pit slopes that remain intact over 10 years following the cessation of mining activity in these areas. Similar allowances have been made in the planned reserve pits.
Mining recovery and dilution factors of 95% and 5% have been applied to all open pit reserves. The diluting material is assumed to be waste with no recoverable gold values. These factors are within acceptable industry limits.
Waste Rock will be disposed of in waste rock storage facilities adjacent to the pits, or will be backfilled into previously mined pits. The limited size and scope of the open pits and proximity to previous mining activity does not present any permitting or environmental issues that could delay or prevent exploitation of open pit reserves and resources.
Muck from each round is hauled from the portal and piled in discreet windrows at the muck laydown area of each mine. Miners label each pile with a lath including heading, date, and shift. Three samples are collected per round. An ore control technician will walk around the entire pile taking representative scoop samples to fill three 5 pound sample bags. Flagging is tied to the lath to indicate the pile has been sampled. Bags are hand labeled with unique sample identification numbers and transported to the Jerritt Canyon assay lab.
Assay results are issued 24 to 72 hours later. The Geologist or Engineer marks the piles ore or waste by painting the lath orange for ore or blue for waste. Once a pile has been marked ore or waste, it is hauled to its corresponding destination.
Stockpile materials are mined with 50- or 150-ton haul trucks and a front-end loader. Muck material to be mined has previously been assayed for grade control and is typically flagged in the field as ore or waste. Stockpile ore is delivered to the ROM whereas waste is delivered to a local waste dump.
The various stockpiles at Jerritt Canyon are categorized based on their spatial distance to the mill. The Remote Stockpile consists of numerous individual stockpiles that reside proximal to their original mined source. These stockpiles are located at varied distances distal to the mill. Prior to Year-End 2009 these stockpiles were inventoried by physical survey then subsequently reconciled to the Year-End 2007 (NI 43-101) stockpile resource. This reconciliation formed the basis for the reported Year-End 2010 reserves/resources.
The Mill Stockpile (a.k.a. ROM) consists of numerous individual stockpiles located proximal to the primary crusher facility at the mill. Ores derived from various sources (including the remote stockpiles) are delivered to the ROM prior to processing thru the mill. All ROM deliveries are segregated by source.
ROM stockpiles are inventoried on a monthly basis via physical survey conducted by the mine Engineering Department. This inventory provides the baseline for the monthly mine/mill reconciliation and subsequent reserve/resource depletions.
Jerritt Canyon Stockpile Reserve/Resource Summary
| | Year-End 2010 | Year-End 2011 | Net Depletions |
Stockpile |
Tons | Ounces
(Au) | Grade
(opt) |
Tons | Ounces
(Au) | Grade
(opt) |
Tons | Ounces
(Au) | Grade
(opt) |
| Remote | 745,570 | 54,072 | 0.073 | 622,621 | 40,678 | 0.065 | | | |
| Mill | 143,555 | 18,021 | 0.125 | 180,012 | 16,990 | 0.094 | | | |
| TOTAL | 889,425 | 72,093 | 0.081 | 802,603 | 57,668 | 0.072 | 86,792 | 14,425 | 0.166 |
71
Jerritt Canyon Ore Stockpile assayed sample results were reviewed and verified by Qualified Person, Michele White, based on review of data for assay checking and chain of custody including:
- Raw assay reports from Jerritt lab
- Certified assay results from outside laboratory
- Compilations of sample assays in spreadsheet format from staff: Paul Noland (Chief Geologist, 2009), William Hofer (Chief Geologist, 2010- current), John Vipham (Staff Surveyor).
The datasets provided were reviewed for chain of custody from 2009 analysis performed by Paul Noland to current analysis by William Hofer, including additions and editing by John Vipham. The sample results were reviewed for accuracy by comparing assay reports with subsequent eras of compilation spreadsheets between 2009 and December 2011. Some of the initial stockpile samples from 2009 were sent to ALS Chemex lab. Otherwise, all the samples were assayed on-site at the Jerritt lab and continue to be so.
In 2010, a regular sampling program had been initiated for remote stockpiles from which an estimate of the potential for inclusion in site resources is referenced. Of the total assay population used in the stockpile compilations, 22 percent were matched to corresponding records in previous compilations and traced to original assay certificates. This is an acceptable representative population of stockpile assay results.
There is excellent correlation between lab results and corresponding compilation spreadsheets (100%). The chain of custody between sequential copies of stockpile assay assessment is also 100% accurate. Based on excellent correlation between subsequent compilations and assay-checks the Jerritt Canyon Ore Stockpile compilations are considered accurate by the primary author.
The unit operations at the Jerritt Canyon processing plant are comprised of the following circuits:
- Primary crushing;
- Secondary crushing;
- Fine ore drying;
- Tertiary crushing;
- Dry grinding;
- Roasting;
- Carbon-in-leach (“CIL”) with cyanidation and carbon adsorption;
- Carbon stripping;
- Carbon reactivation;
- Electro-winning,
- Merrill-Crowe process using zinc cementation of gold and silver;
- Precipitate refining;
- Oxygen plant;
- Water evaporation pond; and
- Tailing impoundment.
As part of the Consent Decree Agreement noted above, the Jerritt Canyon processing plant is currently under a production restriction of 180tph through its two roasters. Stack tests are being done on a periodic basis to make sure that QRL adheres to the emissions thresholds listed in the Consent Decree or agreed to with the NDEP.
The Smith underground mine is currently the primary local mine source feeding the mill with approximately 1000 ore tons per day in March 2012. Targeted ore production from Smith is 1,250 tons per day starting in April 2012. Approximately 325 tons per day of ore from the SSX-Steer mine was mined in March 2012. It is expected that SSX-Steer ore production will ramp up to 1,200 tons per day by May 2012. The Jerritt Canyon ore stockpiles are another major mill feed source at the site. A total of 5,848 tons of remote stockpile material was fed to the mill in March 2012
72
Ore production from the Starvation Canyon mine will commence in 2013 at a targeted rate of 300 to 500 ore tons per day. Other potential sources of mill feed include those from Newmont at their Carlin mining operations located approximately 21 miles west of Elko, Nevada, and other nearby mines owned by various companies in the region which are currently being assessed for potential business opportunities by the QRL and VG staff to help feed the Jerritt Canyon mill. The LoM plan is targeting mill through put of 4,110 tpd. Current production through the mill as of the end of March 2012 is approximately 38,540 tons.
The mill was shut down to complete a winterization and refurbishment program from January 6, 2012 to January 27, 2012. During the shutdown period the following items were addressed:
- constructing a new drying facility;
- reconfiguring the conveying system in fine crushing;
- the old dryer was replaced with a new ore dryer closer to the front end of the circuit which includes its own mercury scrubbing system;
- installation of a new Distributed Control System (“DCS”) for the entire plant;
- installation of a new quench tank for the East Roaster which is one of the final requirements for compliance with the Consent Decree;
- realignment of the crushing conveyors;
- rebuild of the thickener rakes;
- rebuild of the OSEPA particle-sizing system;
- replacement of the pinion on the ball mill;
- replacement of the feed-end of the ball mill;
- replacement of portions of the dust-control ventilation system;
- replacement of air-slides feeding the roasters;
- clean-out of the roasters and some refractory repair;
- replacement and repair of the fine ore bin conveyor and belt;
- rebuild of the CIL carbon screens;
- replacement of the retort and furnace in the refinery;
- the Merrill-Crowe precipitation circuit was replaced with an electrowinning circuit; and
- replacement of some key components in the oxygen plant.
The new ore dryer has been placed before the screens and chutes of the secondary cone crusher. The old ore dryer has been eliminated from the processing facility and used to be located after the secondary and tertiary crusher, which allowed wet ore to freeze and result in handling problems. These ore handling problems have now been eliminated with the new ore dryer configuration and are expected to help maintain more consistent ore production throughout the year and through the winter months.
Commissioning of the new ore dryer, fine-crushing conveying, and the DCS commenced on January 23, 2012. The remaining portions of the winterization and refurbishment program were commissioned on February 1, 2012. The mercury scrubbing system associated with the roasting circuit was commissioned in November 2009.
The wet milling facilities are currently not in use but include two lines with each containing one 800HP SAG Mill and a 700 HP Ball Mill with a capacity of approximately 1,450 tons/day. The existing wet mill therefore contains a maximum feed capacity for approximately 3,000 t/d. The Jerritt Geology and Mining groups are targeting ores from previously mined open pits and/or new on-site open pit resources within the Jerritt Canyon Property that will be considered for processed using the existing wet milling facilities.
73
For 2011 the gold recovery averaged 85.8% of contained metal delivered to the process plant. The Au recovery for 2011 was 85.8 percent which is lower than previous years listed. It is believed that the lower 2011 Au recoveries are related to equipment issues in the CIL circuit which reduced leaching retention time and thus Au recovery. Future Au recovery for 2012 is forecast at 89% based on the equipment upgrades made in the early 2012 mill shutdown. Recent Au recovery for March 2012 was approximately 88.4 percent. The Au recovery for 2010 and 2007 was the same at 88.2 percent. The lower Au recoveries attained in 2008 and 2009 are likely a result of the significant down time for the mill and not being able to maintain steady state production. The authors consider these figures acceptable, given the deposit characteristics and the method of extraction.
The Jerritt Canyon process plant operated at only 64% of its design capacity in 2007 due to bull gear problems with the grinding mill. The bull gear was replaced in second quarter 2006. The mine shutdown in August 2008 significantly impacted total mill production figures for 2008 and 2009. In addition unaccounted and “lost” ounces in 2009 and 2010, respectively, along with unexpected NDEP charges increased the processing costs and total costs for these years.
In March 2006, an agreement was reached between QRL and Newmont USA Limited (Newmont) whereby a minimum of 500,000 tons of ore per year from Newmont operations would be purchased by QRL and processed through the Jerritt Canyon processing plant. This agreement was in effect for two years (2006 and 2007) with an option for three additional years (2008-2010). New agreements were made with Newmont on October 25, 2010 that called for the delivery of 2,000 ore tons/day until December 31, 2010. A subsequent agreement with Newmont signed in April 2011, allows deliveries of Newmont ore to continue until December 31, 2011 with no specified quantities dictated in this agreement.
QRL forecasts 2012 gold production to be approximately 195,951 ounces from 1,504,000 ktons of total ore feed. The average gold recovery is forecast to be 87.7% for 2012.
Since open pit mine production is being proposed at Burns Basin and Saval and other sites that contain lower gold grades than current underground ore head grades, the open pit mine models have used a historic Au recovery equation for roast ores (Type II ore) that was previously used in historic Jerritt open pit ore reserve estimates (Birak and Cole; 1990). The linear Au recovery equation is listed below:
- Au recovery = 0.9042x +0.75169 with a cutoff grade of 0.053 opt Au.
This equation calculates a 90 percent recovery at 0.164 opt Au head grade. In addition, this recovery equation was calculated using the tons and grade reported at the fine crushing plant.
The Qualified Persons consider the projected production and cost estimates achievable, especially with the continued increasing underground ore production from the SSX-Steer mine complex, and the expected startup for the Starvation Canyon underground mine at the end of the 3rd Quarter of 2012.
Market Studies and Contracts
Gold markets are mature, global markets with reputable smelters and refiners located throughout the world. Gold prices have increased every year since 2002 and reached record levels in September 2011 when the monthly average price was $1,756 per ounce. The lowest monthly average price during the past year was recorded in January at $1,356 per ounce. Gold prices ended the year at $1,652 per ounce. At the end of 2011 the 36 month trailing average price reached $1,275 per ounce while the 24 month trailing averaged reached $1,400.
74
Markets for doré are readily available. Jerritt Canyon ships its doré to the Johnson Matthey refinery in Salt Lake City, Utah.
Jerritt Canyon has operational contracts in place at the present time. Certain exploration drilling activities are under contract. In addition, as of November, 2009, Small Mine Development (SMD) is under contract to perform mining operations at the Smith Mine. The term of the contract is either until 250,000 troy ounces of Au are produced or until September 30, 2012, whichever comes first.
The company has entered into two gold loan agreements with Duetsche Bank. The first in August 2011 and the second in February 2012 to secure the capital funding necessary for the Construction of Tailings Storage Facility 2, replacing the ore dryer, purchasing mining equipment and other capital projects. The terms of these agreements have been incorporated into the financial model used for the evaluation of reserves.
In March 2006, an agreement was reached between QRL and Newmont whereby a minimum of 500,000 tons of ore per year from Newmont operations will be purchased by QRL and processed through the Jerritt Canyon processing plant. This agreement was in effect for two years (2006 and 2007) with an option for three additional years (2008-2010).
New agreements were made with Newmont on October 25, 2010 that called for the delivery of 2,000 ore tons/day until December 31, 2010. A subsequent agreement with Newmont signed in April 2011, allows additional ore deliveries (at no specified quantities) of Newmont ore until December 31, 2011. The Jerritt processing plan does not include any ore purchased from Newmont.
The primary author, Mark Odell, finds the terms of the aforementioned contracts to be within industry standards.
QRL has financed the Jerritt Canyon Operations’ reclamation and closure costs by funding a commutation account within an insurance policy with Chartis Insurance (Chartis). This insurance policy, and additional cash placed by QRL in a money market account also with Chartis, collateralizes the surety Chartis provides to government agencies for closure and reclamation. As of early September 2011, the surety provided to government agencies was US$81,590,537, including the closure and reclamation of the TSF-2, WSR, expanded mining activities, and additional costs mandated by the State for closure of TSF-1. Approximately 45% of the bond costs are related to control and remedy of the seepage from TSF-1.
The Mine Reclamation Plan and Reclamation Cost Estimate dated June 2010 and later revised in September 2010 was submitted to the Bureau of Mining Regulation and Reclamation (BMRR) Branch. The required surety to government agencies for reclamation of the private land facilities was $70,015,433. QRL estimates the net present value of to its closure and reclamation obligations for the Jerritt Canyon Operations at the end of the mine life to be US$36,407,843.
Permitting activities with the State of Nevada to advance the Starvation Canyon project to an underground mine project have been completed. The Nevada Highway Department may need to be notified because Starvation Canyon ores are planned to be hauled on State Highways to the Jerritt Canyon Processing Facility.
Environmental management systems are in place and there are qualified environmental staff on site. Various mitigation programs are in effect as required under the several plans of operations that have been filed and approved for the project. No unusual costs associated with any of these programs were identified.
75
The surety costs for the agency bond for publically-owned lands are calculated under the U.S. Forest Service bonding guidelines and the surety costs for privately-owned lands are calculated under the requirements of the State of Nevada; this figure includes agency oversight and administration and is described above. QRL has a policy with the Chartis to fund the closure and reclamation costs, and that policy, with additional cash in a money market account, provides the collateral for the surety that has been accepted by the regulatory agencies to serve both to fund the physical reclamation and post-closure site management, and meet agency requirements for bonding.
Closure and reclamation will consist of the following actions:
- Open pits will be reclaimed by partially backfilling the pits with mine waste rock produced in the underground mining operations. Level areas in the pit bottom will be covered with fine-grained waste rock or growth medium and re-vegetated. Most open pits exist in a near-reclaimed state.
- Portals for the underground mines will be sealed by blasting, backfilling or bulk-heading. Raises extending to the surface will be backfilled. Regional groundwater levels are below the elevation of the mine portals or raises, therefore seepage from the mines is not expected.
- Waste rock disposal area will be left in a condition meeting slope stability requirements. Portions of the older rock disposal areas will be left with angle of repose side slopes that are covered with durable non-acid generating rock. Other rock disposal areas will have final slopes of 2.5H to 1V. Tops of the rock disposal areas will be graded to route surface water runoff off of the flat surfaces and away from rock disposal area slopes. Level surfaces of the rock disposal areas and the 2.5H to 1V side slopes will be covered with growth media and re-vegetated.
- Haul roads and access roads not included in the USFS Travel Management Plan will be re-graded to conform to the original ground contours and re-vegetated. Haul roads that may be left partially reclaimed and permanently open will likely require some level of reclamation to reduce overall road width.
- Sediment control structures will be reclaimed by breaching ponds and basins after sediment and erosion control issues are controlled through reclamation of the areas draining to the structures.
- TSF-1 will be closed with the construction of a working platform of rock from the spent heap leach and from the DASH East RDA. The working platform will provide the location of forced evaporation of the free surface water and groundwater seepage from TSF-1. The working surface will have a synthetic liner installed with 2 feet of growth medium applied over the liner. Operation of the seepage recovery system will need to continue for a period of time after TSF-1 is closed and seepage ceases.
- Spent heap leach materials from a leach pad adjacent to the tailings impoundment will be excavated and placed as fill for grading TSF-1.
- Solution ponds associated with the heap leach pad and the processing plant will be reclaimed by removing solution from the pond, and disposal of all contained sludge in the tailings impoundment. Pond liners will be folded into the ponds and backfilled. Growth medium will be placed over the backfilled ponds and re-vegetated.
- Buildings and structures will be dismantled to the level of foundations and either salvaged or disposed of in an approved landfill. Process piping will be rinsed and neutralized. Disposition of underground piping is not specifically addressed; however SRK would assume it will be necessary to remove all piping.
As the mine progresses closer to closure, the overall detail of the closure plan may require refinement.
Capital and Operating Costs
Jerritt Canyon is forecasting an expenditure of $183 million over the coming four and one half year period for mine-related capital items. Underground mine development is the largest capital requirement and accounts for $99.7M of total capital spending. Mining and processing facilities total $53.9M and include $36M for dewatering wells, treatment plant and disposal systems and $12.1M for the completion of Tailings Storage Facility 2. Mining equipment and sustaining capital total $29.2M.
76
Actual operating costs for 2011 were reviewed and form the basis of the processing and administrative cost projections. Processing costs were categorized as variable if it is a function of process throughput or fixed if it is independent of process throughput. Additionally some cost accounts will see an improvement in efficiency with the completion of the plant upgrades and also achieving planned processing rates. As a result of this analysis a linear function relating throughput to processing cost was developed.
Processing Cost US $/Ton= 15.55 + ($21,259,000 tons processed per annum).
An annual plant processing rate of 1,500,000 tons per year yields a unit processing cost of $29.72 / ton. All administrative costs were classified as fixed and totaled $12,515,000 in 2011. At the planned 1.5M tons/year rate this equates to $8.35/ ore ton. For 2011 off site refining charges averaged $0.40/oz. of recovered gold.
The company began using its own crews and equipment for underground mining late in 2011 and does not have sufficient cost history to permit the use of actual cost projections. Practical Mining estimated the underground mining costs using local labor rates and consumable costs and applied these to the cutoff grade calculations and financial modeling. Variations occur in mining costs between the different underground mines is the result of varying proportions of stoping, ore development drifting, backfill volumes, expensed waste drifting and dewatering requirements.
The contract with Small Mine Development will expire in 2012. Costs for the Smith Mine assume that a new contract will be negotiated with costs similar to existing contract. Open pit mining costs are based on similar operations and include a premium for employing a contractor to exploit the open pit reserves. The base price for open pit mining is $2.75/ton mined. Finally ore haulage costs to the process facility were estimated for each deposit using the total haulage distance and grade profile.
In order to determine the portion of the Measured and Indicated resources that would qualify for Proven and Probable reserve status, it is necessary to configure the Measured and Indicated resources into mineable shapes for the selected mining method, and then apply economic tests for establishing validity that the reserve blocks will, indeed, show positive economics.
The economic exercise for this reserve study is normally accomplished by calculating a breakeven cutoff grade, stated in ounces of gold per ton (oz Au/ton), which equates the total operating costs at the property with gold recovery from the process plant, and the expected return from gold sales. Total costs include mining, processing, assessed charges, and site administrative costs. Process recovery is a function of grade and is expected to average 89.1 % over the 4 ½ year reserve life of mine plan. Revenues reflect an average gold price experienced during the previous three years, after subtraction of refining charges and royalties
Incremental cutoff grades are sometimes employed where certain costs have already been expended (sunk costs), and the block now must cover only the remaining down-stream charges. This material can either be stockpiled for processing later in the mine life or added to the process stream if there is unused capacity. An example is mineralized material which must be mined in order to gain access to stopes that lie beyond. Now that the drilling, blasting, loading and underground haulage have been expended, it may be possible that the rock contains sufficient gold to pay for surface hauling to the process plant or stockpile, and the process costs as well, rather than being carried to a waste dump for disposal. An incremental cutoff grade calculation at this point will be lower than a breakeven grade, but this material should provide a positive contribution to the operations cash flow.
77
The accepted formulas for calculating cutoff grade are given below:
| Breakeven Cut-off grade | = | Total Costs of Production |
| (Gold Price – Deducts) x Process Recovery |
| | | |
| Incremental Cut-off grade | = | Remaining Production Costs |
| (Gold Price – Deducts) x Process Recovery |
The LoM plan, technical and economic projections in the LoM model include forward looking statements that are not historical facts and are required in accordance with the reporting requirements of the Canadian Securities and Exchange. These forward looking statements are estimates and involve risks and uncertainties that could cause actual results to differ materially. The LoM plan includes an assessment using proven and probable reserves only.
The annual production schedule from each mine used as the basis for the life of mine plan and economic analysis. The Smith and SSX mines are both planned to produce 1250 ore tons per day with the Smith mine producing over the entire 4.5 year mine life. The other mines and stockpiles are scheduled to provide the balance of 1.5M tons per year of ore to the process facility.
The Jerritt Canyon Mine has a positive cash flow in all years except 2013 which has an increase in capital spending. Since the cash flow is positive in the first year of the plan the internal rate of return is not defined. Other Statistics indicate robust economics at the reserve gold price of $1,275/ounce. The average gold sales price net of the gold loans is $1,097 per ounce.
The gold loans entered into in 2011 and 2012 with Deutsche Bank require repayments to follow a specified schedule. When the gold is delivered, QRL will receive the market price less $850 per ounce. The reduction in revenues is reflected as an adjustment to revenue when the gold is delivered to Deutsche Bank. In the financial evaluation the market price is assumed to be the three year trailing average gold price of $1,275 per ounce.
QRL has previous year tax losses to apply against future federal tax liabilities. These losses will be exhausted by year end 2013. Federal taxes are calculated at the 35% US corporate tax rate. The 5% Nevada Net Proceeds tax is included in G&A costs. Payroll, employment taxes and sales taxes are included with labor and supplies costs.
A 12% decrease in gold prices will result in a NPV of zero. However the project is less sensitive to variations in operating or capital costs.
Current and Planned Activities
QRL has signed an agreement in early 2011 to purchase ore from Newmont that will allow QRL to utilize the full capacity of the mill. As the process improvements take effect and the mill capacity exceeds the supply of ores from Jerritt Canyon, processing of Newmont ore will provide additional revenues and lower the overall unit cost for processing and administration.
QRL will pursue an aggressive program of resource development in order to convert a large portion of the measured and indicated resources not in reserves into proven and probable reserves. Based on historic conversion rates and exploration success, there is a reasonable expectation of converting a portion of Jerritt Canyon’s resources to reserves. In particular, significant opportunities exist at the Jerritt Canyon property to extend and/or deepen the existing open pits based on exploration potential and the continued rise in gold prices above the $1,275 three year trailing average. A significant amount of the future drilling will be targeting these open-pit opportunities.
78
As underground mining develops new resources and reserves favorable drill platforms are created to explore for and delineate additional resources that that were previously cost prohibitive or unreachable from the existing drill platforms. The reopening of the Murray Mine and subsequent development of new reserves to the west will provide such a platform to explore a potential area extending 2000 feet along strike that has seen little exploration activity.
KetzaRiverProject,YukonTerritory
The Company's interest in the Ketza River Property is the subject of the Technical Report (the “KR Report”) of Mark Odell, Mine Engineer Consultant, P.E., Todd W. Johnson, P.E., VP Exploration of the Company, John Fox, Consulting Metallurgical Engineer, P.Eng. and Karl Swanson, Mining Consultant, SME, MAusIMM with an effective date of January 25, 2010 and an issue date of June 28, 2011 and is summarized below. The complete text of the Ketza River Report is available at www.sedar.com.
PropertyDescriptionandLocation
Topography, Elevation and Land Use
The Property is located in the Pelly Mountains in south central Yukon. Terrain is mountainous with elevations ranging from 1,300m above mean sea level (amsl) to 2,100m amsl. Land use in the area is limited to mining, trapping, hunting and recreation.
Climate and Length of Operating Season
Average daytime temperatures range from highs of +25oC in summer to lows of -40oC in winter. Average annual precipitation in Faro, the nearest location for which weather statistics are available, is 31.6cm and includes annual averages of 21.4cm of rainfall and 111.6cm of snowfall (http://climate.weatheroffice.ec.gc.ca/climate_normals). Daylight extends to nearly 24hr/day in the summer months, particularly June. There are only short periods of daylight during the winter. Exploration can be conducted year-round but heavy winter snow may limit access to some areas. Mining can be conducted year-round.
Vegetation
Vegetation consists of dwarf birch, spruce, alder and balsam trees up to the tree line at approximately 1,600m amsl.
Access to Property
The Property is accessible by a 40km all-weather road from Km 323 on the Robert Campbell Highway. The Property is approximately 80km by road from Ross River and 460km from Whitehorse. The 40km access road is kept open year-round and is passable for tractor-trailer-size supply trucks.
Surface Rights
The surface is owned by the Crown and leased to the Company under the Government of Yukon Lease. Total annual lease payment for the occupation of land for the purpose of a commercial mine, mill, campsite, tailings pond and other mine-related facilities is C$7,350 + GST (C$7,717.50 total).
79
Local Resources and Infrastructure
The community of Ross River is 90km from the Project and supplies food, fuel and basic medical service. Personnel trained in first aid are on site at the Ketza River camp at all times and a fully stocked Industrial Ambulance is available. There is an airstrip in Ross River and contractors for electrical, plumbing, mechanical and vehicle maintenance are available in Ross River or Whitehorse.
Power Supply
Power to the camp and facilities is provided by 160kV and 210kV diesel generators. One generator remains off while the other generator provides power. The two are used alternately to allow for maintenance. A smaller 60kV generator is available as backup. Power for any future mining activities will be provided by additional generators.
EnvironmentalLiabilities
History
Gold Mineralized Zones and Existing Facilities
Geology
Regional Geology
The Property is located in the Pelly Mountains of central Yukon. The mountains are made up of a shallow marine miogeoclinal sequence of rocks forming a carbonate platform bounded by the Omenica Tectonic Belt to the southwest and a faulted lobe of the Yukon Tanana Terrain to the northeast across the Tintina Fault. This carbonate platform is known as the Cassiar Terrain or Pelly-Cassiar Platform (Pelly-Cassiar).
The Pelly-Cassiar is a displaced continental margin of the ancient North American continent. Rocks of the Pelly-Cassiar consist of a continental margin sedimentary sequence of the Rocky Mountain Assemblage composed of interbedded carbonate and clastic units of Paleozoic age. Several major deformation events have affected the region including a Mesozoic-age arc-continent collision, doming and uplift during the intrusion of mid-Cretaceous stocks and an estimated 450km of dextral strike-slip displacement on the Tintina Fault from the Cretaceous to Tertiary periods.
Four significant thrust faults, the McConnell, Porcupine-Seagull, Cloutier, and St. Cyr thrusts, parallel the Tintina Fault and dip generally southwest (Abbott, 1986). Thrusting is believed to have occurred during the Late Jurassic and Early Cretaceous.
Rocks in the Watson Lake District belong to the Cloutier Thrust Sheet, which is exposed within an erosional window in the overlying Porcupine-Seagull Thrust Sheet. The window, known as the Ketza-Seagull arch, forms an elongated northwest-trending structure probably related to buried Cretaceous intrusions. The intrusions are apparently centered in two areas known as the Ketza Uplift and the Seagull Uplift. Structures in the window are characterized by steeply dipping normal faults.
An apophysis of a mid-Cretaceous stock is postulated to lie beneath the core of the Ketza Uplift and the Peel Creek anticline (Fonseca, 1998; Cathro, 1988; Parry et al., 1986 and 1984); however, no major intrusive rock bodies, and only rare narrow dikelets have been identified on the property to date. The uplift exposed the oldest rocks of the Clouthier Thrust Sheet, which are Lower Cambrian carbonates and older clastic rocks. The rocks surrounding the uplift are Upper Cambrian and younger clastic and carbonate rocks. The following supporting evidence has been cited for the presence of a buried intrusive body:
80
- The presence of an aeromagnetic anomaly;
- Mapped biotite-rich hornfels in sedimentary rocks (unit 1a) centered near Shamrock Mountain and Peel Creek;
Hornfelsed metasedimentary rock from rock unit 1a was dated at 101+/-4Ma (Mid-Cretaceous) using the whole rock K-Ar method (Cathro, 1988). One 40Ar/39Ar analysis of white mica from quartz+sulfide veined rock from the Shamrock zone gave a mid-Cretaceous age (108 ± 0.3Ma) for mineralization which coincides with the emplacement of the Cassiar Plutonic suite (Fonseca, 1998).
Geology of the Ketza River Property
The geology of the Ketza River property has been described by numerous investigators including Canamax (1984-1991), Abercrombie (1990), Fonseca (1998; 1998a), Stroshein (1996), and Cathro (1988; 1986). The Property is underlain by Lower Cambrian carbonate and clastic sedimentary rock units. The Lower Cambrian units (Map Units 1a, 1b, 1c, 1d, and 1e) form a conformable series (Figure 5-1) which is unconformably overlain by Late Cambrian black shale (Fonseca, 1998). The lithostratigraphic succession described below was adopted by previous workers (Read, 1980). The general surface geology is outlined below.
81
Stratigraphic Column
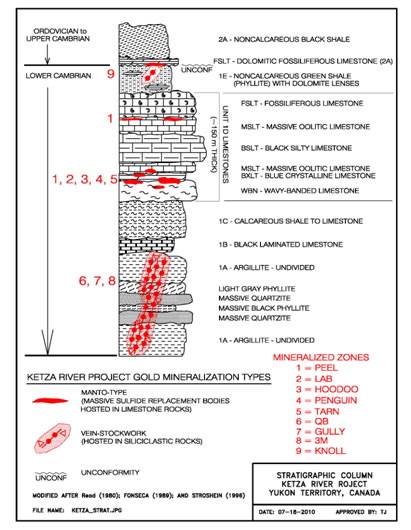
Exploration
Aurora Geosciences completed an Extremely Low Frequency EM ground survey in the summer of 2012 that focused on the South Hill and Misery targets. The ELF survey is relatively new technology and is designed to map conductivity, structure and alteration zones from approximately 10 to 1,000 m depth.
Drilling
Summary of Diamond Drilling 2005 Through 2010
| Year | Operator | No. of Holes | Type Drilling | No. of m Drilled |
| 2005 | YGC Resources Ltd. | 99 | Diamond | 12,734 |
| 2006 | YGC Resources Ltd. | 270 | Diamond | 33,874 |
| 2007 | YGC Resources Ltd./KRH | 305 | Diamond | 41,587 |
| 2008 | Ketza River Holdings Ltd. | 225 | Diamond | 30,436 |
| 2009 | Ketza River Holdings Ltd. | 2 | Diamond | 483 |
| 2010 | Ketza River Holdings Ltd. | 128 | Diamond | 17,542 |
| Total | | 1,029 | | 136,656 |
82
SamplingandLaboratoryProcedures
DataVerification
MineralResourceandMineralReserveEstimates
Including Oxide and Sulfide and Mixed Oxide + Sulfide Ores
| | Open Pit Resource | Underground Resource | Combined (OP+UG) |
| Area | kt | g/t-Au | koz | kt | g/t-Au | koz | kt | g/t-Au | koz |
| Measured | | | | | | | | | |
| Peel | 85.2 | 5.76 | 15.8 | 3.7 | 8.41 | 1.0 | 88.9 | 5.87 | 16.8 |
| Penguin | 14.0 | 1.88 | 0.8 | 0.0 | 0.00 | 0.0 | 14.0 | 1.88 | 0.8 |
| Lab-Hoodoo | 9.4 | 6.92 | 2.1 | 0.0 | 0.00 | 0.0 | 9.4 | 6.92 | 2.1 |
| Tarn | 11.4 | 4.73 | 1.7 | 0.0 | 0.00 | 0.0 | 11.4 | 4.73 | 1.7 |
| Gully | 7.0 | 5.60 | 1.3 | 2.1 | 7.41 | 0.5 | 9.1 | 6.01 | 1.8 |
| QB | 23.4 | 4.55 | 3.4 | 0.4 | 3.81 | 0.0 | 23.8 | 4.47 | 3.4 |
| Knoll | 11.1 | 6.66 | 2.4 | 0.0 | 0.00 | 0.0 | 11.1 | 6.66 | 2.4 |
| Total Measured | 161.5 | 5.30 | 27.5 | 6.3 | 7.39 | 1.5 | 167.8 | 5.38 | 29.0 |
| | | | | | | | | | |
| Indicated | | | | | | | | | |
| Peel | 1,053.4 | 6.22 | 210.6 | 204.6 | 8.83 | 58.1 | 1,258.0 | 6.64 | 268.7 |
| Penguin | 233.6 | 2.89 | 21.7 | 0.0 | 0.00 | 0.0 | 233.6 | 2.89 | 21.7 |
| Lab-Hoodoo | 243.2 | 5.20 | 40.6 | 22.1 | 6.90 | 4.9 | 265.3 | 5.34 | 45.5 |
| Tarn | 79.3 | 3.88 | 9.9 | 0.0 | 0.00 | 0.0 | 79.3 | 3.88 | 9.9 |
| Gully | 45.1 | 3.57 | 5.2 | 14.7 | 8.04 | 3.8 | 59.8 | 4.67 | 9.0 |
| QB | 298.0 | 3.21 | 30.8 | 15.5 | 5.22 | 2.6 | 313.5 | 3.31 | 33.4 |
| Knoll | 2.9 | 4.54 | 0.4 | 0.0 | 0.00 | 0.0 | 2.9 | 4.54 | 0.4 |
| Total Indicated | 1,955.4 | 5.08 | 319.3 | 256.9 | 8.40 | 69.4 | 2,212.3 | 5.46 | 388.7 |
| | | | | | | | | | |
| Measured and | | | | | | | | | |
| Indicated | | | | | | | | | |
| Peel | 1,138.6 | 6.19 | 226.4 | 208.3 | 8.82 | 59.1 | 1,346.9 | 6.59 | 285.5 |
| Penguin | 247.6 | 2.84 | 22.6 | 0.0 | 0.00 | 0.0 | 247.6 | 2.84 | 22.6 |
| Lab-Hoodoo | 252.6 | 5.26 | 42.7 | 22.1 | 6.90 | 4.9 | 274.7 | 5.39 | 47.6 |
| Tarn | 90.7 | 3.99 | 11.6 | 0.0 | 0.00 | 0.0 | 90.7 | 3.99 | 11.6 |
| Gully | 52.1 | 3.85 | 6.4 | 16.9 | 7.91 | 4.3 | 69.0 | 4.84 | 10.7 |
| QB | 321.4 | 3.31 | 34.2 | 15.9 | 5.09 | 2.6 | 337.3 | 3.39 | 36.8 |
| Knoll | 14.0 | 6.22 | 2.8 | 0.0 | 0.00 | 0.0 | 14.0 | 6.22 | 2.8 |
| Total M&I | 2,116.9 | 5.09 | 346.8 | 263.2 | 8.38 | 70.9 | 2,380.1 | 5.46 | 417.7 |
| | | | | | | | | | |
| Inferred | | | | | | | | | |
| Peel | 195.2 | 5.30 | 33.2 | 24.2 | 6.55 | 5.1 | 219.4 | 5.43 | 38.3 |
| Penguin | 44.0 | 2.49 | 3.5 | 0.0 | 0.00 | 0.0 | 44.0 | 2.49 | 3.5 |
| Lab-Hoodoo | 37.5 | 4.38 | 5.3 | 10.1 | 5.54 | 1.8 | 47.6 | 4.62 | 7.1 |
| Tarn | 3.2 | 3.50 | 0.4 | 0.0 | 0.00 | 0.0 | 3.2 | 3.50 | 0.4 |
| Gully | 15.9 | 3.46 | 1.8 | 5.6 | 8.89 | 1.6 | 21.5 | 4.87 | 3.4 |
| QB | 113.5 | 3.80 | 13.9 | 4.4 | 5.66 | 0.8 | 117.9 | 3.87 | 14.7 |
| Knoll | 0.0 | 0.00 | 0.0 | 0.0 | 0.00 | 0.0 | 0.0 | 0.00 | 0.0 |
| Total Inferred | 409.4 | 4.41 | 58.0 | 44.3 | 6.56 | 9.3 | 453.7 | 4.62 | 67.3 |
ConclusionsandRecommendations
SilverValleyProperty,Yukon
The Company was granted an option to acquire a 100% interest in six claims located in the Yukon Territory. The primary focus of exploration for this property will be silver, with a secondary focus on gold, lead and zinc. The Company has staked or acquired 143 additional quartz claims and leases around the original six claims, and these are registered in the name of the Company. As of year-end 2012, there are a total of 149 quartz claims and quartz leases showing in the figure below that comprise the Silver Valley Project all of which are owned 100% by KRH. There are a total of 6 quartz leases in the Silver Valley property that comprise 202 acres.
83
Silver Valley Claim Map
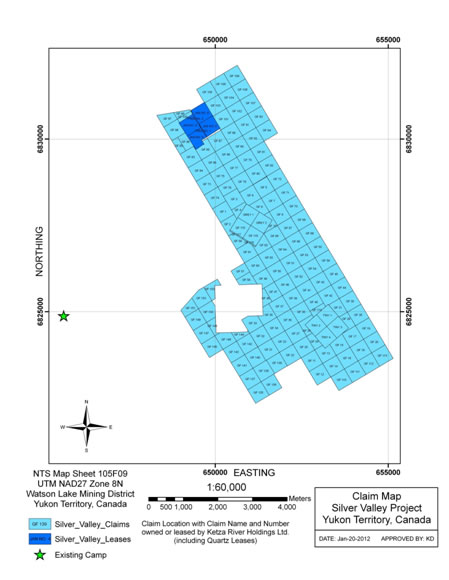
Historical Work
The Silver Valley Property consists mostly of Ag-Pb-Au±Cu±Zn veins and is located approximately 1 kilometre east of the main Ketza River gold project. The K18B underground mine is a past producer of Ag and Pb and minor Au that operated from 1965 to 1969 (including exploration work) by Stump Mines Ltd. and later again for a brief time in 1980 and 1981 by Iona Silver Mines Ltd. Development work at the K18B vein was reportedly stopped in 1981 when a fire destroyed the compressor shack.
84
Exploration Drilling
Diamond drilling totalling 75 holes in 11,163 m has been conducted at the Silver Valley project in 2006, 2007, 2009 and during January of 2010 by KRH as shown in the table below. A total of seven drill holes were completed in 2010 which tested two horizontal-loop E-M geophysical anomalies that were identified during the 2007 field season. No drilling was performed at Silver Valley in 2011 or 2012.
| Year | Drill Holes
Completed | Total Meters | Total Footage |
| K-18B South | | | |
| 2006 | 4 | 1.014.7 | 3,328.2 |
| 2007 | 58 | 8,903.5 | 29,203.3 |
| 2008 | 0 | 0 | 0 |
| 2010 | 7 | 1,244.8 | 4,082.9 |
| 2011 | 0 | 0 | 0 |
| 2012 | 0 | 0 | 0 |
| Total | 75 | 11,163.0 | 36,614.4 |
Drilling
Drilling at the Silver Valley Project in 2010 focused on the River’s Edge and K18B South targets. The QA/QC procedures used for the Silver Valley Project were similar to those used for the 2008 Ketza River drilling program described previously; a couple different certified standards containing Pb, Zn, and Ag were used for the Silver Valley assay programs. The same Ketza River geological staff and camp support have been used to conduct the exploration and drilling work at the Silver Valley Project.
Five drill holes were completed at the River’s Edge target which identified three sub-parallel quartz-siderite-pyrite veins with minor amounts of galena and tetrahedrite. The highlight was SV-10-70 which intercepted 0.9 meters grading 5.25 g/t Au, 27.7 g/t Ag and 0.16% Cu.
Two drill holes were also completed on the north end of the K-18B South target. This target may be a fault-offset of the K-18B Vein which was the focus of drilling in 2007. The two drill holes intersected two pyrite-dominant veins approximately 3 meters in width. Galena, sphalerite, tetrahedrite and stibnite were also present in these vein zones. The best intercept came from drill hole SV-10-75 which intersected 1.39 meters that assayed 103 g/t Ag, 0.4% Pb, 0.28 g/t Au, and 0.2% Cu.
Geophysics
VG has conducted several geophysical surveys in the area. An aerial helicopeter Dighem electromagnetic survey was conducted over the property by Fugro in 2007 with lines spaced every 0.1 km. A ground horizontal-loop E-M (HLEM) geophysical ground survey was also conducted in 2007.
A Bouger gravity survey was conducted over portions of the Silver Valley Property in 2011. Two grids, one northwest grid covering 355 hectares, and another southeast grid covering 108 hectares was completed using a Scintrex CG-5 Gravimeter. Approximately 469 gravity stations were collected with stations spaced 100m apart from one another.
Trenching and Reclamation
During the 2008 field season, a total of 557 meters of trenches were excavated for exploration purposes using a track-mounted excavator. These trenches were sampled and later re-contoured late in the 2010 field season.
85
OtherProperties
Bay Property, Yukon – The Company has staked 36 claims near Watson Lake, Yukon. The primary focus of exploration for this property will be silver.
Silver Bar, Arizona -The Company has a 100% interest in 55 claims in Pinal County, Arizona. The focus of exploration of this property will be gold and copper. In 2010 the Company reduced the carrying value to a nominal amount as management has no current plans to conduct exploration t this property.
To date, the Company has not paid any cash dividends or distributions on its securities. The Company does not have any restriction that could prevent it from paying dividends or distributions and has no dividend or distribution policy.
The Company is authorized to issue an unlimited number of shares without par value (the “Shares”). 107,641,344 Shares are issued and outstanding as at March 28, 2013. The Company also has 19,302,040 Share Purchase Warrants (the “Warrants”) issued and outstanding. Each Warrant, when exercised, will entitle the holder to purchase one Share of the Company at a price of between $5.50 and $1.95 per share.
Holders of Shares of the Company shall be entitled to notice of, to attend and vote at any meeting of the shareholders of the Company and to one vote per share on a ballot. Shareholders will be entitled to receive dividends as and when declared by the Board of Directors of the Company as a class, subject to prior satisfaction of all preferential rights to dividends attached to all shares of other classes of shares ranking in priority to the Company’s Shares in respect of dividends. Shareholders shall be entitled in the event of any liquidation, dissolution or winding-up of the Company, whether voluntary or involuntary, or any other distribution of the assets among its shareholder for the purpose of winding-up its affairs, and subject to prior satisfaction of all preferential rights to return of capital upon dissolution attached to all shares of other classes of shares ranking in priority to Shares in respect of return of capital on dissolution, to share rateably, together with the holders of shares of any class of shares ranking equally in respect of return of capital, in such assets of the Company as are available for distribution.
TradingPriceandVolume
The following table sets out the market price range and trading volume of the Shares on the Exchange under the symbolVGfor the periods indicated:
| Period | High ($) | Low ($) | Volume |
| 2012 January | 3.15 | 2.30 | 28,471,073 |
| February | 4.75 | 2.80 | 25,019,487 |
| March | 4.00 | 3.05 | 9,754,318 |
| April | 3.40 | 2.55 | 9,784,131 |
| May | 3.00 | 2.30 | 7,120,159 |
| June | 3.40 | 2.75 | 6,095,382 |
| July | 3.50 | 3.00 | 10,153,858 |
| August | 3.15 | 2.45 | 8,290,384 |
| September | 3.20 | 2.55 | 10,448,877 |
| October | 3.38 | 2.31 | 1,590,761 |
| November | 3.20 | 2.40 | 1,300,332 |
| December | 2.52 | 1.56 | 2,494,016 |
| 2013 January | 1.95 | 1.55 | 2,238,748 |
| February | 1.70 | 1.27 | 2,626,164 |
| March 1 | 1.65 | 1.51 | 113,634 |
86
| Period | High ($) | Low ($) | Volume |
| Week ending March 8 | 1.67 | 1.53 | 456,407 |
| Week ending March 15 | 1.69 | 1.61 | 521,157 |
| Week ending March 22 | 1.69 | 1.56 | 371,107 |
The Company had 21,175,932 warrants which, commencing November 7, 2007, traded on the Exchange under the symbolYNG.WT. The Warrants expired on June 20, 2012. These warrants are not shown on a post consolidation basis.
| Period | High ($) | Low ($) | Volume |
| 2012 - January | 0.01 | 0.005 | 55,000 |
| February | 0.015 | 0.005 | 1,461,000 |
| March | 0.01 | 0.01 | 105,500 |
| April | 0.00 | 0.00 | 0 |
| �� May | 0.00 | 0.00 | 0 |
| June | 0.005 | 0.005 | 101,000 |
Name,OccupationandSecurityHolding
Name of Director/Executive
Officer, Province or State and
Country of Residence |
Principal Occupation during the past five
years |
Current Position and Date of
Appointment |
Robert F. Baldock(4)(5) (6)
Scion, Switzerland | President and CEO of Monument Mining Limited; June 2005 to date. | Director since April 12, 2009. |
Pierre Besuchet(3)
Switzerland | Director the Faisal Private Bank (Switzerland) and the Indufina Industrielle et Finance Holding (Switzerland) and is a director of W2 Energy Inc. and FNDS3000 (South Africa). | Director since May 13, 2010. |
Jean-Edgar de Trentinian
Switzerland | President and CEO of Orifer SA. | Director since August 1, 2009. |
Graham Dickson(4)(5)
British Columbia, Canada | President of Celec Inc. since June 1993; President and CEO of NouGht Technologies. | Senior Vice President of Acquisitions and Corporate Development since June 27, 2011; Director since April 17, 1997. |
Barry A. Goodfield(1)
Arizona, USA | Founding Director of The Goodfield Institute LLC since June 1974; President, The Goodfield Foundation NGO registered in The Hague. | Director since July 6, 2012. |
Shaun Heinrichs(4)(5)(6)
British Columbia, Canada | Co-CEO since June 2012, CFO since November 2008, Controller from January 2008 to November 2008. | Co-CEO since June 27, 2012; CFO since November 21, 2008. Director since May 8, 2012. |
Todd Johnson
British Columbia, Canada | Vice President of the Company since April 2010; Consultant for Veris from January 2008 to March 2010. | Vice President of Exploration since April 1, 2010. |
Francois Marland
Switzerland | Businessman and Executive; formerly a Lawyer and a Writer. | Executive Chairman since July 23, 2012; Director since July 2, 2010. |
87
Name of Director/Executive
Officer, Province or State and
Country of Residence |
Principal Occupation during the past five
years |
Current Position and Date of
Appointment |
Cameron Paterson
British Columbia, Canada | Vice President of the Company since July 2012; Corporate Controller of the Company from June 2011 to June 2012; Auditor at Deloitte LLP from 2003 to 2011. | Vice-President Finance since July 6, 2012. |
Randy Reichert
British Columbia, Canada | Co-CEO of the Company since June 2012; COO of the Company since June 2011; President and COO for Colossus Minerals Inc. from 2009 to June 2011; COO. Of Orsu Metals from 2008-2009; COO of Oriel Resources plc (2007 to 2008). | Co-CEO since June 27, 2012; COO since June 27, 2011; Director since July 6, 2012. |
Gerald B. Ruth(1)(2) (3) (4) (5) (6)
Ontario, Canada | CEO of Gersan Capital Corp. and a Director of Eagle Hill Exploration Corp. and Monument Mining Limited. | Lead Director since July 23, 2012; Director since May 13, 2010. |
Jay W. Schnyder(1)(2)
Switzerland | A member of the management committee (Head of Refining) of MKS Finance SA. | Director since May 13, 2010. |
Graham Scott
British Columbia, Canada | Lawyer; Principal, Vector Corporate Finance Lawyers since July 2001. | Secretary since May 19, 2005. |
Simon Solomonidis(2)(5)
Switzerland | Independent Consultant since 2008. | Director since August 1, 2009. |
| 1. | Member of the Audit Committee |
| 2. | Member of the Compensation Committee |
| 3. | Member of the Corporate Governance Committee |
| 4. | Member of the Special Committee |
| 5. | Member of the Disclosure Committee (Corporate Disclosure Policy) |
| 6. | Member of the Audit Sub-Committee (Financial Disclosure) |
The directors are elected at the Annual General Meeting for a period of one year. The Company’s next Annual General Meeting is scheduled to be held on June 18, 2013 and it is anticipated that all of the above directors will be nominated for re-election. Officers of the Company are appointed by the Board of Directors.
As of March 28, 2013, 29,347,508 Shares of the Company are beneficially owned, or controlled or directed, directly or indirectly by the directors and executive officers, as a group, representing 27.26% of the issued and outstanding voting securities (107,641,344 Shares).
CeaseTradeOrders,Bankruptcies,PenaltiesorSanctions
To the knowledge of the Company,, during the 10 years prior to the date of this AIF, no directors or executive officers of the Company has been a director or officer of any other Company that:
| (a) | was the subject of an order that was issued while the director or executive officer was acting in the capacity as director, chief executive officer or chief financial officer, or |
| (b) | was subject to an order that was issued after the director or executive officer ceased to be a director, chief executive officer or chief financial officer and which resulted from an event that occurred while that person was acting in the capacity as director, chief executive officer or chief financial officer. |
88
To the knowledge of the Company, no director or executive officer or a shareholder holding a sufficient number of securities of the Company to affect materially the control of the Company:
| (a) | is, as at the date of this AIF, or has been within the 10 years before the date of this AIF, a director or executive officer of any company (including VG) that: |
| | | |
| (i) | while that person was acting in the that capacity, or within a year of that person ceasing to act in that capacity, became bankrupt, made a proposal under any legislation relating to bankruptcy or insolvency or was subject to or instituted any proceedings, arrangement or compromise with creditors or had a receiver, receiver manager or trustee appointed to hold its assets; or |
| | | |
| (ii) | became bankrupt, made a proposal under any legislation relating to bankruptcy or insolvency, or became subject to or instituted any proceedings, arrangement or compromise with creditors, or had a receiver, receiver manager or trustee appointed to hold the assets of the director, executive officer or shareholder. |
To the knowledge of the Company, no director or executive officer or a shareholder holding a sufficient number of securities of the Company to affect materially the control of the Company:
| (a) | has been subject to: |
| | | |
| (i) | any penalties or sanctions imposed by a court relating to securities legislation or by a securities regulatory authority or has entered into a settlement agreement with a securities regulatory authority; or |
| | | |
| (ii) | any other penalties or sanctions imposed by a court or regulatory body that would likely be considered important to a reasonable investor in making an investment decision. |
ConflictsofInterest
The Company has adopted, in accordance with Appendix M of the Company’s Corporate Governance Manual, a code of conduct and conflict of interest guidelines for directors and officers including disclosure requirements.
To the knowledge of the Company there are no existing or potential conflicts of interest between the Company and any directors or officers as a result of such individuals outside business interests as of the date hereof.
Under the definition of “promoter” contained in Section 1 of theSecurities Act (British Columbia), other than the directors and officers of the Company, management is not aware of any person or company who could be characterized as a promoter of the Company or a subsidiary of the Company within the two most recently completed financial years or during the current financial year.
The Company is not aware of any legal proceeding or regulatory actions to which the Company is or is likely to be a party other than as disclosed in the Company’s annual audited financial statements.
Each of the following directors and senior officers has an interest in the Company’s Stock Option Plan which was approved by the Company’s shareholders on May 13, 2010:
89
Name of Optionee | Position of Optionee
(Director/Officer) |
Date of Grant | No. of
Shares | Exercise
Price |
Expiry Date |
| JE de Trentinian | Director | July 26,2009 | 100,000 | $1.50 | July 26, 2014 |
| Robert Baldock | Director | July 26,2009 | 400,000 | $1.50 | July 26, 2014 |
| Graham Dickson | Director and Officer | July 26,2009 | 400,000 | $1.50 | July 26, 2014 |
| Simon Solomonidis | Director | July 26,2009 | 50,000 | $1.50 | July 26, 2014 |
| Graham Scott | Officer | July 26,2009 | 50,000 | $1.50 | July 26, 2014 |
| Shaun Heinrichs | Director and Officer | July 26,2009 | 150,000 | $1.50 | July 26, 2014 |
| Todd Johnson | Officer | July 26, 2009 | 22,500 | $1.50 | July 26, 2014 |
| Robert Baldock | Director | March 23, 2010 | 800,000 | $3.20 | March 23, 2015 |
| Graham Dickson | Director and Officer | March 23, 2010 | 800,000 | $3.20 | March 23, 2015 |
| Todd Johnson | Officer | March 23, 2010 | 77,500 | $3.20 | March 23,2015 |
| Francois Marland | Director | July 12, 2010 | 900,000 | $3.20 | July 12, 2015 |
| Pierre Besuchet | Director | July 15, 2010 | 100,000 | $2.60 | July 15, 2015 |
| Jay Schnyder | Director | July 15, 2010 | 100,000 | $2.60 | July 15, 2015 |
| Gerald Ruth | Director | July 15, 2010 | 100,000 | $2.60 | July 15, 2015 |
| Simon Solomonidis | Director | July 15, 2010 | 50,000 | $2.60 | July 15, 2015 |
| Todd Johnson | Officer | September 9, 2011 | 25,000 | $4.50 | September 9, 2016 |
| Shaun Heinrichs | Director and Officer | May 31, 2011 | 75,000 | $5.00 | May 31, 2016 |
| Randy Reichert | Director and Officer | May 31, 2011 | 150,000 | $5.00 | May 31, 2016 |
| Cameron Paterson | Officer | May 31,2011 | 20,000 | $5.00 | May 31, 2016 |
| Shaun Heinrichs | Director and Officer | May 31, 2011 | 75,000 | $5.00 | May 31, 2016 |
| Todd Johnson | Officer | September 9, 2011 | 25,000 | $4.50 | September 9, 2016 |
| Randy Reichert | Director and Officer | January 11, 2012 | 200,000 | $5.00 | January 11, 2017 |
| Cameron Paterson | Officer | April 16, 2012 | 10,000 | $2.60 | April 16, 2017 |
| Randy Reichert | Director and Officer | July 6, 2012 | 50,000 | $3.00 | July 6, 2017 |
| Shaun Heinrichs | Director and Officer | July 6, 2012 | 75,000 | $3.00 | July 6, 2017 |
| Barry Goodfield | Director | July 6, 2012 | 100,000 | $3.00 | July 6, 2017 |
The Company believes no director or executive officer of the Company or any person or company that is the direct or indirect beneficial owner of, or who exercise control or direction over, more than 10% of the Company’s outstanding voting securities or any associate or affiliate of any of the persons or companies referred to above has any material interest, direct or indirect, in any transactions occurring during the year ended December 31, 2012 which materially affected or would materially affect the Company or any of its subsidiaries.
The Registrar and Transfer Agent for the Company is:
| Computershare Trust Company of Canada | ComputerShare Investor Services |
| 2nd Floor, 510 Burrard Street | 100 University Ave, 9thFloor |
| Vancouver, B.C., V6C 3B9 | Toronto, ON M5J 2Y1 |
Set forth below are details of every contract, other than a contract entered into in the ordinary course of business, that is material to the Company and that was entered into within the most recently completed financial year, or before the most recently completed financial year but is still in effect:
| 1. | Incentive Stock Option Plan (the “Plan”) authorizing the reservation of no more than 10% of the Company’s outstanding Shares for issuance under the Plan. |
| | |
| 2. | Shareholder Rights Plan Agreement with Computershare Trust Company of Canada dated December 20, 2012. |
90
NamesofExperts
Karl Swanson, Mining Consultant, of Larkspur, Colorado (AusIMM #304871 and SME #4043076),Mark Odell, Mine Engineer Consultant and President of Practical Mining LLC, of Elko, Nevada (P.E. #13708, Nevada), John Fox, Metallurgical Consultant and owner of Laurion Consulting Inc. of Vancouver, Canada (P.Eng. #12578, British Columbia), and Michele White, CPG, of Lake George Colorado (AIPG #11252) are the authors of the technical report referred to in Section 4.4(a) hereof.
Messrs. Todd Johnson (Vice President of the Company of Vancouver, British Columbia (P.E. #16748, Nevada) Swanson,Odell, and Fox, M are the authors of the Technical Report referred to in Section 4.4(b) hereof.
InterestsofExperts
Mr. Johnson is an officer of the Company and Mr. Fox was director of the Company (2005 to 2010). Both of Messrs. Fox and Johnson hold stock options to purchase securities of the Company. Messrs. Swanson, Odell, and White have no registered or beneficial, direct or indirect, interest in the securities of the Company.
Deloitte LLP is the Company’s auditor and is independent within the meaning of the Rules of Professional Conduct of the Institute of Chartered Accountants of British Columbia.
Additional information relating to the Company may be found on SEDAR atwww.sedar.com. Additional information, including directors’ and officers’ remuneration and indebtedness, principal holders of the Company’s securities, and securities authorized for issuance under equity compensation plans, if applicable, is also contained in the Company’s Information Circular pertaining to its most recent Annual General Meeting that involved the election of directors and in the Company’s comparative financial statements and MD&A for its most recently completed financial year.
Set forth below is the additional information required pursuant to Form 52-110F1,Audit Committee Information Required in an AIF:
1. The Audit Committee’s Charter
The Company’s audit committee (the “Audit Committee”) is governed by an audit committee charter, the text of which is attached as Schedule “A” to this AIF. The Audit Committee has also adopted a “Whistleblower Policy”, the text of which is attached as Schedule “B” to this AIF.
The purpose of the Audit Committee is to act as the representative of the Board of Directors in carrying out its oversight responsibilities relating to:
- The audit process;
- The financial accounting and reporting process to shareholders and regulatory bodies; and
- The system of internal financial controls.
91
2. Composition of the Audit Committee
The Company’s audit committee is comprised of three directors, Jay Schnyder, Gerald Ruth (Chair) and Barry Goodfield. As defined in NI 52-110, the Board of Directors of the Company has determined that all members of the Audit Committee are “independent” and financially literate, meaning that they are able to read and understand financial statements.
3. Relevant Education and Experience
NI 52-110 provides that an individual is “financially literate” if he or she has the ability to read and understand a set of financial statements that present a breadth and level of complexity of accounting issues that are generally comparable to the breadth and complexity of the issues that can reasonably be expected to be raised by the Company’s financial statements. All members of the Audit Committee are financially literate as that term is defined.
Gerald Ruth graduated from Wilfred Laurier University with a Bachelor of Business Administration (Hons.) in 1981 and earned his designation as a Chartered Accountant in 1983. He has been an independent corporate finance consultant since 2003, a Director and audit committee member of various private and public companies.
Jay Schnyder graduated with a Master in Business Administration in 1987 from the University of Lausanne, Switzerland and developed his education on precious metals and currency trading at MKS FINANCE before taking over the groups business development with various public and private family owned mining groups which amongst the individual financial evaluations of such groups for compliance and credit purposes included structuring hedging and bridge financing programs.
Barry A. Goodfield is the Founding Director of The Goodfield Institute LLC in USA and Europe. He holds a Ph.D. in Psychology and Human Behaviour in 1976 after studying at the University of California and Rutgers from Alliant International University. In 1996 he became CEO of The Goodfield Foundation: for the Study of Conflict Communication and Peace Building. He is a Senior Professor at Henley-Putnam University instructing doctoral level students in strategic communication analysis; most individuals are from the intelligence, and counterterrorism community. He is author of three books and numerous articles in professional journals.
4. Reliance on Certain Exemptions
At no time since the commencement of the Company’s most recently completed financial year, has the Company relied on the following exemptions:
| (a) | the exemption in section 2.4,De Minimis Non-audit Services; |
| (b) | the exemption in section 3.2,Initial Public Offerings; |
| (c) | the exemption in section 3.4,Events Outside Control of Member; |
| (d) | the exemption in section 3.5,Death, Disability or Resignation of Audit Committee Member; or |
| (e) | an exemption from National Instrument 52-110,Audit Committees, in whole or part granted under Section 8,Exemptions. |
5. Reliance on the Exemption in Subsection 3.3(2) or Section 3.6
At no time since the commencement of the Company’s most recently completed financial year, has the Company relied on the exemption in subsection 3.3(2),Controlled Companies, or section 3.6,Temporary Exemption for Limited and Exceptional Circumstances.
92
6. Reliance on Section 3.8
At no time since the commencement of the Company’s most recently completed financial year, has the Company relied on the exemption in section 3.8,Acquisition of Financial Literacy.
7. Audit Committee Oversight
At no time since the commencement of the Company’s most recently completed financial year, has a recommendation of the Committee to nominate or compensate an external auditor not been adopted by the Board of Directors.
8. Pre-Approval Policies and Procedures
The Committee has adopted specific policies regarding the engagement of the external auditors appointed by the shareholders of the Company (the “Auditors”) consistent with the Committee’s charter attached as Schedule “A” with a view to ensuring the Auditors’ independence. These pre-approval policies relate to the engagement of audit services, audit-related services and non-audit-related services.
9. External Auditor Service Fees (By Category)
Set forth below are details of fees billed by the Company’s external auditor in each of the last two fiscal years for audit services:
Fiscal Year End |
Audit Fees |
Audit-Related Fees(1) |
Tax Fees(2) | All Other
Fees(3) |
| December 31, 2011 | 337,000 | 40,000 | 53,000 | – |
| December 31, 2012 | 387,000 | 73,391 | – | – |
| (1) | The aggregate fees billed in each of the last two fiscal years for assurance and related services by the Company’s external auditor that are reasonably related to the performance of the audit or review of the Company’s financial statements and are not reported under “Audit Fees”. |
| (2) | The aggregate fees billed in each of the last two fiscal years for professional services rendered by the Company’s external auditor for tax compliance, tax advice and tax planning. |
| (3) | The aggregate fees billed in each of the last two fiscal years for products and services provided by the Company’s external auditor, other than the services reported under clauses 1 and 2 above. |
| 93 |
| |
| |
| Schedule “A” to the Annual Information Form of |
| Veris Gold Corp. (the “Company”) |
| |
| |
| |
This charter (the “Charter”) sets forth the purpose, composition, responsibilities, duties, powers and authority of the Audit Committee (the “Committee”) of the Board of Directors (the “Board”) of the Company.
1.0 Purpose
The purpose of the Committee is to: (a) assist the Board in fulfilling its oversight responsibilities with respect to financial reporting and disclosure requirements; (b) ensure that an effective risk management and financial control framework has been implemented by management of the Company; and (c) be responsible for external and internal audit processes.
2.0 Composition and Membership
The Board will appoint the members (“Members”) of the Committee after the annual general meeting of shareholders of the Company. The Members will be appointed to hold office until the next annual general meeting of shareholders of the Company or until their successors are appointed. The Board may remove a Member at any time and may fill any vacancy occurring on the Committee. A Member may resign at any time and a Member will cease to be a Member upon ceasing to be a director.
The Committee will consist of three directors that meet the criteria for independence and financial literacy established by applicable laws and the rules of the stock exchange upon which the Company’s securities are listed, including National Instrument 52-110 – Audit Committees. In addition, each director will be free of any relationship which could, in the view of the Board, reasonably interfere with the exercise of a member’s independent judgment.
The Board will appoint one of the Members to act as the Chairman of the Committee. The secretary of the Company (the “Secretary”) will be the secretary of all meetings and will maintain minutes of all meetings and deliberations of the Committee. In the absence of the Secretary at any meeting, the Committee will appoint another person who may, but need not, be a Member to be the secretary of that meeting.
3.0 Meetings
Meetings of the Committee will be held at such times and places as the Chairman may determine, but in any event not less than four times per year. Twenty-four (24) hours advance notice of each meeting will be given to each Member orally, by telephone, by facsimile or email, unless all Members are present and waive notice, or if those absent waive notice before or after a meeting. Members may attend all meetings either in person or by conference call.
At the request of the external auditors of the Company, the Chief Executive Officer or the Chief Financial Officer of the Company or any member of the Committee, the Chairman will convene a meeting of the Committee. Any such request will set out in reasonable detail the business proposed to be conducted at the meeting so requested.
The Chairman, if present, will act as the Chairman of meetings of the Committee. If the Chairman is not present at a meeting of the Committee, then the Members present may select one their number to act as Chairman of the meeting.
94
A majority of Members will constitute a quorum for a meeting of the Committee. Each Member will have one vote and decisions of the Committee will be made by an affirmative vote of the majority. The Chairman will not have a deciding or casting vote in the case of an equality of votes. Powers of the Committee may also be exercised by written resolution signed by all Members.
The Committee may invite from time to time such persons as it sees fit to attend its meetings and to take part in the discussion and consideration of the affairs of the Committee.
In advance of every regular meeting of the Committee, the Chairman, with the assistance of the Secretary, will prepare and distribute to the Members and others as deemed appropriate by the Chairman, an agenda of matters to be addressed at the meeting together with appropriate briefing materials. The Committee may require officers and employees of the Company to produce such information and reports as the Committee may deem appropriate in order to fulfil its duties.
4.0 Duties and Responsibilities
Subject to the powers and duties of the Board, the duties and responsibilities of the Committee are as follows:
| A. | The Committee shall review and recommend updates to its terms of reference to the Corporate Governance Committee of the Board annually. |
| | |
| B. | The Committee shall meet not less often than four times per year. |
| | |
| C. | The Committee shall have responsibility for: |
| | i. | reviewing the financial statements of the Company and if appropriate recommending the approval of such financial statements by the Board; |
| | | |
| | ii. | reviewing the internal financial and accounting, audit and reporting systems controls of the Company; |
| | | |
| | iii. | reviewing the independence, qualifications and objectivity of the Company’s auditors, and making recommendations to the Board in the ease of vacancy of an auditor, as to the selection of the Company's auditors; |
| | | |
| | iv. | reviewing and recommending auditors’ remuneration; |
| | | |
| | v. | reviewing the scope, results and findings of the Company’s auditors, audit and non-audit services; and |
| | | |
| | vi. | reviewing annually the status of significant current and potential legal matters. |
| D. | The Committee shall ensure that effective lines of communication are maintained with the external auditor, internal auditors, financial management and the Board. |
| | |
| E. | The Committee shall review with the auditors of the Company the relationships existing between them and the management of the Company to ensure an effective liaison in the coordination of audit effort regarding completeness of coverage, avoidance of redundant efforts and the effective use of audit resources. |
| | |
| F. | The Committee shall review, discuss and consider with the auditors their approach to risk assessment, scope and plan of their audits. The review may include: |
95
| | i. | an annual assessment of areas of greatest risk to the Company and steps taken to address those risks; |
| | | |
| | ii. | the annual assessment of the Company's insurance coverage, including the adequacy and cost thereof; |
| | | |
| | iii. | the annual audit plan and overall audit universe; |
| | | |
| | iv. | changes made from time to time in the audit universe and reasons therefor; |
| | | |
| | v. | methods employed by management of the Company to assess risk and to prioritize the various audit proposals identified in the annual plan as well as unscheduled audit proposals: and |
| | | |
| | vi. | any unusual occurrence affecting the management which may preclude the completion of the audit plan. |
| G. | The Committee shall consider and review with the auditors and management of the Company: |
| | | |
| i. | the adequacy of the Company's internal financial controls; |
| | | |
| ii. | recommendations for the improvement of the Company's accounting procedures and internal financial controls; and |
| | | |
| iii. | any related significant findings and recommendations together with management's responses thereto. |
| H. | The Committee shall review the annual consolidated financial statements which are to he submitted to the Board including management's discussion and analysis, if any, contained therein, or in any other relevant documentation. The review, may include: |
| | i. | reports from the auditors as to the results of their examination to date and advise them of any problems regarding financial reporting in the annual report of the Company, including any disagreements that may have arisen between the auditors and management in any area: |
| | | |
| | ii. | meeting(s) with management of the Company who shall outline any problems as to financial policies, financial reporting or matters relating to internal control and any matters in contention with or under consideration by the auditors or management of the Company; |
| | | |
| | iii. | the appropriateness of existing accounting principles being employed and any change in accounting policy or practice which the auditors may refer to in their audit report; |
| | | |
| | iv. | any proposed changes in financial statement presentation or footnote the auditors may recommend: and |
| | | |
| | v. | other matters related to the conduct of the audit which are to be communicated to the Audit Committee under generally accepted auditing standards. |
| I. | The Committee shall review with management of the Company and the auditors quarterly interim financial statements and if appropriate recommend approval of such quarterly statements to the Board. |
| | |
| J. | The Committee shall consider and review with management: |
96
| | i. | any difficulties encountered in the course of the audits conducted by the auditors, including any changes to or restrictions on the scope of their work or access to required information; |
| | | |
| | ii. | the internal auditing department budget and staffing and |
| | | |
| | iii. | the internal auditing department charter including the internal audit plan. |
| K. | The Committee shall review legal, regulatory and social matters that may have a material impact on the financial statements, related the Company compliance policies and programs and reports prepared to manage and monitor the Company compliance policies. The Committee shall receive reports concerning the Company's environmental management program on a quarterly basis, and review ongoing environmental compliance Issues. |
| | |
| L. | The Committee shall confirm and assure the independence of the auditors, including a review of management consulting services and related fees provided by the auditors. |
| | |
| M. | The Committee shall meet with management and the auditors in separate executive sessions to discuss any matters that the Committee or these groups believe should be discussed privately with the Committee. |
| | |
| N. | The Committee shall have the power to conduct or authorize investigations into any matters within the Committee's scope of responsibilities. The Committee shall be empowered to retain independent counsel, accountants, or others to assist it in the conduct of any investigation. |
| | |
| O. | The Committee shall perform such other functions as assigned by law or the Board, and may review other items of an internal control or risk management nature which may from time to time he brought before the Committee. |
| | |
| P. | The Committee shall conduct a self-assessment at least annually, and discuss the results with the Board. |
| Schedule “B” to the Annual Information Form of |
| Veris Gold Corp. (the "Company") |
| |
| |
| WHISTLEBLOWER POLICY |
| |
The Company’s confidential whistleblowing policy is posted on its website at: (http://www.verisgold.com/s/Governance.asp).