UNITED STATES
SECURITIES AND EXCHANGE COMMISSION
Washington, D.C. 20549
FORM 10-K
| x | Annual Report pursuant to Section 13 or 15(d) of the Securities Exchange Act of 1934 for the fiscal year ended December 31, 2006 or |
| ¨ | Transition Report pursuant to Section 13 or 15(d) of the Securities Exchange Act of 1934 for the transition period from to . |
Commission File Number 000-50952
EDUCATE, INC.
(Exact name of registrant as specified in its charter)
| | |
| Delaware | | 37-1465722 |
| (State or other jurisdiction of incorporation or organization) | | (I.R.S. Employer Identification No.) |
| | |
| 1001 Fleet Street, Baltimore, Maryland | | 21202 |
| (Address of principal executive offices) | | (Zip Code) |
Registrant’s telephone number, including area code: 410-843-8000
Securities registered pursuant to Section 12(b) of the Act:
| | |
Title of each class | | Name of each exchange on which registered |
| Common stock, par value $0.01 per share | | NASDAQ Global Select Market |
Securities registered pursuant to Section 12(g) of the Act: None
Indicate by check mark if the registrant is a well-known seasoned issuer, as defined in Rule 405 of the Securities Act. Yes ¨ No x
Indicate by check mark if the registrant is not required to file reports pursuant to Section 13 or Section 15(d) of the Act. Yes ¨ No x
Indicate by check mark whether the registrant (1) has filed all reports required to be filed by Section 13 or 15(d) of the Securities Exchange Act of 1934 during the preceding 12 months (or for such shorter period that the registrant was required to file such reports), and (2) has been subject to such filing requirements for the past 90 days. Yes x No ¨
Indicate by check mark if disclosure of delinquent filers pursuant to Item 405 of Regulation S-K (§ 229.405 of this chapter) is not contained herein, and will not be contained, to the best of registrant’s knowledge, in definitive proxy or information statements incorporated by reference in Part III of this Form 10-K or any amendment to this Form 10-K. x
Indicate by check mark whether the registrant is a large accelerated filer, an accelerated filer, or a non-accelerated filer. See definition of “accelerated filer and large accelerated filer” in Rule 12b-2 of the Exchange Act. (Check one):
| | | | |
| Large accelerated filer ¨ | | Accelerated filer x | | Non-accelerated filer ¨ |
Indicate by check mark whether the registrant is a shell company (as defined in Rule 12b-2 of the Act). Yes ¨ No x
The aggregate market value of the common stock held by non-affiliates computed using the closing stock price on the NASDAQ Global Select Market as of June 30, 2006 was $131,021,245. For purposes of this calculation, the registrant considers directors, executive officers and holders of more than 5% of the outstanding common stock to be affiliates. The registrant had 43,163,307 shares of common stock outstanding as of March 5, 2007.
DOCUMENTS INCORPORATED BY REFERENCE
Portions of the registrant’s Definitive Proxy Statement to be filed no later than April 30, 2007 are incorporated by reference into Part III of this Annual Report.
EDUCATE, INC.
INDEX
PART I.
Overview
Educate, Inc. (“we” or “the Company”) is a leading pre-K-12 education company delivering supplemental education services and products to students and their families. In our 25-year history, we have provided trusted, personalized instruction to millions of students improving their academic achievement and helping them experience the joy of learning.
We provide supplemental, remedial and enrichment instruction through Sylvan Learning - North America’s largest network of tutoring centers - the best-known and most trusted tutoring brand. We are the leading provider of educational services to public and non-public schools through our school partnership business, Catapult Learning. We also deliver educational products, including the highly regarded Hooked on Phonics early reading, math and study skills programs through our Educate Products business.
We expect that we will continue to benefit from increased national attention on the quality of pre-K-12 education. We believe that parents have become more proactive in seeking education products and services that supplement their children’s education and are willing to pay for these products and services. In addition, over the past ten years, the market for supplemental education services has benefited from increased spending in both public and private schools. Further, increased education spending by governmental authorities has enjoyed continued bipartisan support. We believe these market forces have contributed to our growth.
Merger Agreement
On September 25, 2006 we announced that our Board of Directors had received a nonbinding proposal from a management group led by R. Christopher Hoehn-Saric, our Chairman and Chief Executive Officer, and other investors to acquire all of the Company’s outstanding shares for $8.00 per share in cash.
On January 28, 2007, we entered into a definitive Agreement and Plan of Merger (the “Merger Agreement”) with Edge Acquisition, LLC, a Company affiliated with Sterling Partners and Citigroup Private Equity, and with Mr Hoehn-Saric (the “Merger”). Under the terms of the Merger Agreement, our stockholders will receive $8.00 in cash for each share of Educate common stock they own. Completion of the Merger is subject to customary closing conditions, including, among others, (i) approval by our stockholders, and (ii) the absence of any order or injunction prohibiting the consummation of the Merger. The Company expects the Merger to close in the second quarter of 2007.
The Merger Agreement was filed on a Current Report on Form 8-K filed with the Securities and Exchange Commission on January 29, 2007. The foregoing description of the Merger Agreement is qualified in its entirety by reference to the full text of the Merger Agreement.
Overview of the Sylvan Learning Network
Sylvan is of the most highly recognized brand names in the supplemental education services industry. We develop and deliver trusted, personalized tutoring programs to students in grades pre-K-12 through a network of 912 territories supporting 1,134 franchised and company-owned learning centers primarily in North America operating under the Sylvan brand name.
Sylvan Learning has operated for over 25 years providing supplemental, remedial and enrichment instruction, primarily in reading and mathematics, and to an increasing extent, writing, study skills and test preparation. Our programs feature an extensive series of standardized diagnostic tests, personalized instruction, a student motivational program and ongoing involvement of parents and the students’ regular school teachers. High awareness of the Sylvan brand and our targeted advertising programs motivate parents to inquire about our services on behalf of their children, primarily by telephone or the Internet. Our corporate call center, regional call centers or franchise operators respond to these inquiries and seek to convince parents of the value of our services and to make an appointment for a diagnostic assessment. One of our company-trained educators performs these tests, which include the California Achievement Test, a nationally-recognized diagnostic test, which identifies particular skill gaps of each student. We then use these assessments to create a personalized learning plan for the student.
Our students generally enroll in a 60 to 120 hour program with instruction two to four times per week for one to two hours per visit. In our core reading and math programs, each teacher typically works with up to three students at a U-shaped table designed to facilitate the learning experience. Within this setting, a teacher works with each of the students individually in turn while the other two students
1
work independently on their own programs. Each teacher is trained in using our proprietary learning systems, which address the particular skill gaps identified in the diagnostic testing. Students generally work with multiple teachers throughout their course of instruction. We also incorporate a motivational program using tokens redeemable for novelties and toys to inspire students to achieve their objectives, build self-confidence and strengthen their enthusiasm for learning. We measure and evaluate each student’s progress after every 36 hours of instruction, hold parent conferences after every 12 hours of a student’s program, and schedule periodic updates with the student’s regular school teachers during the program. Our Sylvan Learning Centers guarantee that each math and reading student will achieve at least one grade level equivalent of improvement within the first 36 hours of instruction or the student will receive 12 hours of additional instruction for free.
The cost of an education program is dependent upon the student’s individual needs. The program costs approximately $3,200 to $4,400, with the actual amount dependent upon the price per hour for tutoring and the number of hours of tutoring provided. Consumers may pay for the full program upon enrollment or prepay on a monthly basis using cash or a credit or debit card. Many of our customers also use third-party financing programs offered by recommended vendors.
We also provide tutoring services for the Scholastic Aptitude Test (“SAT”) and other standardized tests in our Sylvan Learning Centers using materials developed by our subsidiary, Ivy West Educational Services, Inc. Ivy West instructors also provide one-on-one tutoring and test preparation services to students in their homes through a staff averaging 500 instructors for a year.
Our company-owned and franchise learning centers deliver tutoring services under the Ace it! brand to students that are institutionally funded through the supplemental education services provision of the No Child Left Behind legislation.
Our Sylvan Learning Centers are staffed by trained teachers who deliver high quality education programs that are personalized for each student based upon the results of extensive diagnostic testing. These centers are leading a significant shift in the provision of pre-K-12 supplemental education services, away from the traditional model in which individual tutors provide in-home homework help to students. We seek to instill in each student our “Learning Feels Good” philosophy through a motivational program that inspires students to achieve their objectives, builds self-confidence and strengthens each student’s enthusiasm for learning.
Based on our market research, we believe that 98% of women within our target demographic recognize the Sylvan brand name. Our long history of successfully providing tutoring services and our substantial investments in advertising and direct marketing on national, regional and local levels have contributed to consumers’ recognition of the Sylvan brand. We have found an integrated marketing strategy, including television and Web advertising, to be effective at delivering a compelling message to consumers.
Our Learning Center operations are comprised of franchised and company-owned territories. A territory reflects the geographically-specified area where an operator controls rights to provision of services under the Sylvan license agreement. Due to changes in demographics over time and levels of demand, territories often support more than one Sylvan Learning Center. As of December 31, 2006, there were 178 Company-owned territories and 734 franchised Sylvan territories.
Continuing our focus on maximizing service delivery throughout the entire Sylvan network, management has evaluated all Company-owned territories and has concluded that greater focus in specifically targeted geographical areas is necessary to maximize system revenue potential and to efficiently manage Company-owned operations. Therefore, we anticipate that selected Company-owned territories in targeted markets will be re-franchised to franchisees that will apply best practices in center operations. Current expectations are that this multi-year re-franchising program will eventually result in increasing franchised centers to approximately 85% of the total network.
Business Segments
We operate through seven business segments that served more than 430,000 students in 2006. During the fourth quarter of 2006, management changed the manner in which it reviews segment operating performance, and increased the number of reporting segments to include Franchise Services, Catapult Learning, European, Company-Owned Centers, Educate Products, Progressus, and Educate Online. Additionally, Franchise Services, Catapult Learning and European businesses are also reviewed together as “Educate Services” for financial analysis purposes due to common executive management. Segment revenues and operating income are presented on this basis for all periods.
Franchise Services
Franchising is a core element of our business strategy. Our Franchise Services segment manages our system of franchised Sylvan Learning territories. We generate income in our Franchise Services segment from franchising activities primarily through royalties, which are calculated as a fixed percentage of franchisee cash receipts. We generate additional licensing fees from the
2
sale of new franchise territories, within which a franchisee is allowed to open learning centers, and from sales of learning materials and other materials to franchisees. Our Franchise Services segment also provides SAT preparation services in California under the Ivy West brand name.
Our franchise agreements grant the franchisee a license to operate Sylvan Learning Centers and to use Sylvan’s trademarks within a specified geographical territory. Our franchise agreements generally have an initial term of ten years, subject to unlimited additional ten-year extensions at the franchisee’s option under the same terms and conditions. The license fees and royalty rates vary depending upon the demographics of the territory. If a franchisee proposes to sell a franchised center, we have the right to acquire the franchised center on the same terms as the proposed buyer.
We actively manage our franchise system to enhance our brand and maintain a consistent, high quality of service. Franchisees must obtain our approval for the location and design of learning centers and for all advertising. Franchisees must also operate their learning centers in accordance with our methods, standards and specifications. We monitor educational quality at our franchised centers through a variety of procedures, including access to pre- and post-diagnostic test data for students of our franchisees. Each franchisee is required to purchase from us certain diagnostic and instructional materials, student record forms, parental information booklets and explanatory and promotional brochures developed by us. We specify requirements for other items necessary for operation of a learning center, such as computers, instructional materials and furniture, and we offer our franchisees the opportunity to purchase these items from preferred vendors. Generally franchisees provide us with periodic business updates and must submit monthly financial and operating data to us. We require franchisees and their employees to attend a one-week initial training program and to pass a certification examination in our learning center operations and educational programs. We also offer franchisees continuing training each year through a number of different methods. We employ franchise business consultants to provide assistance to franchisees in marketing, education and operations, technology implementation and business development. These employees also facilitate regular communications between franchisees and us and assist us in assuring a consistently high quality of service in each Sylvan Learning Center.
Our franchisees are true owner-operators, as evidenced by the fact that 80% of our franchisees own only one or two centers and no franchisee owns more than 14 centers. We believe that this allows franchise owners to remain focused and committed to the success of their centers.
As of December 31, 2006, there were 734 territories, which supported franchised Sylvan Learning Centers located primarily in North America, including 794 in the United States and 83 in Canada. During 2006, we expanded our franchised network by 9 territories. Our Franchise Services segment generated revenues of $59.7 million during 2006, representing 17% of our total revenues. Of this amount, $11.4 million represented intercompany royalty from our Company-Owned Centers segment.
Catapult Learning
Our Catapult Learning segment, formerly referred to as Institutional Services, provides tutoring and other supplemental education services, to eligible students in public and private schools through government-funded contracts under the Catapult Learning and other brand names.
Since 1993, Catapult Learning has provided supplemental instruction programs primarily in reading and math to students in schools, school districts and private educational entities (primarily parochial schools) across the country. These programs encompass a wide variety of education services that supplement and expand those provided by these institutions. Our services are typically provided on location at the client school or a conveniently located community organization’s facility. These services are funded by federal, state and local governments. While funding for our programs comes from a variety of sources, there are two federal government programs that are significant sources of funds for the services that we offer: Title I of the Elementary and Secondary Education Act and the Individuals with Disabilities Education Act (IDEA). Title I funds are provided by the Federal government to address the needs of educationally and economically disadvantaged students in public and private schools. IDEA funds are provided by the Federal government to address the needs of students identified for special education. We also provide professional development services through federal funding under Title IIa. This includes providing workshops and other training materials to teachers in public and private schools.
The largest component of our Catapult Learning business is small group instruction to non-public school, pre-K-12 students who have been identified by their school as requiring these services. Additionally, we offer a variety of supplemental programs and services that cater to the specific needs of our institutional partners, such as summer school programs, early childhood development programs and special education services. The services that we provide to institutions are typically governed by school-year contracts subject to annual renewal that have had and continue to have high rates of repeat business.
3
In 2006, our Catapult Learning segment generated revenues of $73.5 million, representing 21% of our total revenues. We believe that the increasing willingness of school districts and private schools to utilize third parties to provide supplemental education and specialized support services to the students in their schools, the increases in Title I spending, and access to IDEA funding and state education funds provide us with opportunities for continued growth.
During 2006, we completed the sale of our Education Station business, which delivered site-based NCLB services to public schools. Education Station was a component unit within the Catapult Learning operating segment. The operations of Education Station are classified as discontinued operations for all periods presented.
European
Our European segment operates a network of company-owned and franchised centers under the Schülerhilfe brand name. Schülerhilfe has provided after school tutoring, consisting primarily of homework support, to primary and secondary students in Germany and Austria for over 30 years.
Our European segment generates revenue primarily from the operation of company-owned centers and the receipt of monthly fixed fees from franchisees. As in our Sylvan Learning Centers, the aim of Schülerhilfe’s center-based tutoring is for students to improve their grades and develop their self-confidence. Schülerhilfe provides tutoring in a number of subjects, including German, math, English, Latin, and French, using the child’s own textbooks and Schülerhilfe material. After an initial consultation, students visit a Schülerhilfe center after school an average of twice per week for 90 minutes. Students work with teachers on addressing their skill gaps using a combination of schoolwork, homework, and Schülerhilfe curriculum. Sessions are taught in small groups of five or fewer students per teacher. On average, parents pay €125 per month for eight sessions.
As of December 31, 2006, Schülerhilfe operated 264 company-owned learning centers and 755 franchised centers in Germany, and 61 franchised centers in Austria. Our European segment generated revenues of $35.1 million during 2006, representing 10% of our total revenues.
Company-Owned Centers
Our Company-Owned Centers segment manages our network of company-owned Sylvan Learning territories. Our Company-owned centers enable us to test and refine new educational programs, marketing plans and learning center management procedures before offering these programs and procedures to our franchisees. Our company-owned territories serve as best practice models where significant operational and educational improvements can be developed and implemented quickly. On average, company-owned territories have higher sales than franchised territories primarily due to higher average revenue per student. In 2006, our company-owned territories generated average sales per territory of $780,000 and we received royalties from our franchisees that imply average cash receipts per franchised territory of $510,000.
As of December 31, 2006, we operated 178 company-owned territories including 251 company-owned Sylvan Learning Centers in 33 markets in North America. During 2006, we increased the number of company-owned territories by 6, primarily through opening centers in previously undeveloped territories. Our Company-Owned Centers segment generated revenues of $143.8 million during 2006, representing 41% of our total revenues.
Educate Products
Our Educate Products business creates, manufactures, and sells educational products that are fun, easy to use, and effective, including the highly regarded Hooked on Phonics early reading, math and study skills programs. Since the launch of the first product in 1987, more than two million families and thousands of schools have turned to the Hooked on Phonics library of award-winning programs. We work with educators, interactive designers, writers, artists and parents to develop step-by-step learning programs that help teach children critical reading, math and study skills. Our line of educational programs and products are distributed through national retailers such as Wal-Mart, Target, K-mart, Costco, Sam’s Club and Amazon, directly to consumers through catalogs and our web sitewww.hookedonphonics.com, and internationally through international distributors. Our Educate Products segment derives a significant portion of revenue from a small number of customers in the club channel. Customers in our Products segment are granted payment terms customary in the industry, which typically range from 90 to 120 days. This segment also sells Reading Rainbow branded products.
Our Educate Products segment generated revenues of $18.2 million during 2006, representing 5% of our total revenues.
Progressus
Our Progressus segment provides certified occupational therapists, physical therapists and speech-language pathologists to public and non-public school districts, community-based centers, early intervention programs, State Departments of Education and State
4
Departments of Health and Human Services. We are one of the largest, most experienced providers of contracted educational services in the country. Progressus operates in 18 states throughout the United States and in the District of Columbia.
School districts are experiencing significant pressure to provide quality special education and related services programs for children with a broad range of learning needs and disabilities. Their challenge is complicated by persistent shortages of speech-language pathologists, occupational therapists and physical therapists.
Our Progressus segment supplies full-time and part-time qualified occupational therapists, physical therapists and speech-language pathologists who provide therapy and early intervention programs under Parts B & C of IDEA. Our therapists provide services that are designed to help meet the educational and developmental needs of eligible children with disabilities. Our Progressus segment (including predecessor companies) has over 15 years of educational therapy experience.
Our Progressus segment generated revenues of $22.0 million during 2006, representing 6% of our total revenues.
Educate Online
Our Educate Online segment is a leading provider of online tutoring to students with functional grade levels of third through ninth grades, under the Sylvan Online and Catapult Online brand names. Through Sylvan Online we deliver trusted diagnostic, prescriptive tutoring programs utilizing the Sylvan Learning Center network of franchised and company-owned learning centers. Through Catapult Online we provide tutoring to eligible students in public and private schools through government-funded contracts. (Catapult Online operates independently from Catapult Learning.) Our programs are staffed by trained, state certified teachers who deliver high quality education programs that are personalized for each student based upon the results of extensive diagnostic testing.
Our Educate Online segment generated revenues of $14.3 million during 2006, representing 4% of our total revenues.
Segment and geographic area information for the three years ended December 31, 2006 is incorporated by reference to Note 15 to our consolidated financial statements included in Item 8 of this Form 10-K.
Sales and Marketing
Learning Center
Philosophy
We have positioned ourselves as a provider of tutoring services that inspire students to achieve their objectives, build self-confidence and strengthen each student’s enthusiasm for learning by instilling our “Learning Feels Good™” philosophy. We developed our philosophy through qualitative and quantitative consumer research of women within our target audience. We have used consumer research to identify the most compelling message as well as the benefits and features that are most relevant and believable to our target audience.
Marketing
We believe our multi-year investment in advertising has driven a high level of brand awareness and favorable consumer perceptions about our brand. Our marketing strategy relies primarily on direct response marketing using an integrated, multi-channel approach. Our marketing materials are designed to generate a response from consumers, usually in the form of a call or email to one of our learning centers. This direct marketing strategy allows us to quantitatively and qualitatively test the effectiveness of various aspects of our marketing campaigns by measuring consumer response and making appropriate modifications to the campaign to improve consumer response.
We have found television advertising, such as our “We have a Tutor for that” campaign, to be effective at delivering a compelling message to consumers. Accordingly, we commit a majority of our advertising funds to television and Internet advertising. Other important marketing strategies include public relations, word of mouth marketing, educator relations and direct mail/conversion marketing. As part of our quantitative and qualitative analysis, each year we test the performance of our newly developed advertising materials and compare the results to the benchmarks set by the best performing advertising materials in our previous campaigns to determine if the new material will be used throughout the system.
5
Our marketing is coordinated across three tiers, the national marketing fund, regional cooperative marketing funds, and local marketing. Substantially all franchised and company-owned centers pay a monthly fee into the national marketing fund, which is jointly managed by representatives of the company and the franchise community, while regional cooperative marketing funds are managed by members of the region, and local funds are managed individually by franchisees or company-owned territory management. These three tiers use a combination of marketing channels, including television, internet, print, direct mail and grassroots public and community relations, such as appearances at public school parent assemblies, local street fairs and festivals, and other community events sponsored by local civic and religious groups. We maintain a consistent and targeted advertising message across each of these tiers and in each of the marketing channels through the centralized development and distribution of all advertising material used, including the materials used by franchisees and company-owned centers in local markets, and through specific recommendations to our franchisees of the appropriate mix of marketing channels.
In 2006, we launched Sylvan branded products and pre-packaged services available through Costco and QVC. These new distribution channels have opened the opportunity to enhance brand affinity for Sylvan through retail channels.
Catapult Learning and Progressus
Our Catapult Learning and Progressus segments seek to understand the needs of a particular institution and develop specific programs to address those needs within the scope of available funding. Our institutional services are marketed primarily through direct, personal contact with superintendents of school districts, school principals and other key decision makers at targeted institutions by our relationship managers and sales force. Through these sales efforts, we seek to maintain and expand our relationships with existing institutional customers. This focus on our existing relationship allows us to market additional supplemental services to them, which is less expensive than new client development efforts.
European
We believe Schülerhilfe has a high level of brand awareness in the German market. We have developed our brand awareness through effective marketing in multiple channels. We have experienced success in our nationwide advertising campaigns including television, online, and print advertising.
Educate Products
We market our Educate Products brand to both trade and consumer audiences including club and retailers. Our trade customers are typically decision makers that we reach through a variety of methods including direct mail, trade shows and advertising in targeted trade publications. Our consumer target consists primarily of parents of children ages 3 to 12. We reach these consumers through a variety of means including print, online, and television advertising as well as direct mail and public relations programs.
Industry Overview
We believe the pre-K-12 education services industry is large, growing and fragmented and that the overall size of this industry has significant potential to grow as a result of a number of factors. These factors include favorable demographics, increasing parental dissatisfaction with the quality of public education, an increasingly competitive educational system and the heightened focus on school performance due to the continued failure of many students to achieve basic skills. According to the U.S. Department of Education, enrollment in elementary and secondary schools rose 22% between 1985 and 2005 to 54.7 million students and is expected to rise by an additional two million students between 2005 and 2014. We believe these trends will drive demand in both the public and private sectors for the types of supplemental education services that we provide.
Private Sector Demand. Demand for supplemental education services is growing due to parents’ dissatisfaction with the quality of public pre-K-12 education. We believe that the demand for private pre-K-12 tutoring services has grown, and will continue to grow, as children face additional federally-mandated standardized tests throughout their pre-K-12 years, and a growing number of qualified students vie for positions at top colleges. At the same time, the monetary value of a college degree is increasing, as evidenced by U.S. Census Bureau data. In 2004, holders of a bachelor’s degree earned 80% more on average than those with only a high school diploma, as compared with 66% more on average in 1984. In addition, many schools have ended the practice of social promotion and now require students to pass end-of-year exams to advance to the next grade. These high stakes tests create additional pressures on students’ school performance. We believe that all of these factors will increase private sector demand for supplemental education services.
Public Sector Demand. According to data published by the U.S. Department of Education in the 2002-2003 school year, the total K-12 expenditures by U.S. governmental entities for purchased instructional services was approximately $7 billion. The size of that market has increased since the 2000-2001 school year due in part to the adoption of federal legislation. The most recent major federal legislation, NCLB, increased federal funding for addressing the needs of low income students by 3% from $12.3 billion in 2004 to $12.7 billion in 2005.
NCLB also provides for more alternatives to public schools, and a heightened focus on results and school accountability. Funding for outsourced programs and services comes from a variety of sources, including federal, state and local governments. The federal
6
government provides funds through two main programs, Title I of the Elementary and Secondary Education Act and IDEA. Title I funding has grown 3% from $14.4 billion in 2004 to $14.8 billion in 2005, and IDEA funding has grown 6% from 10.0 billion in 2004 to $10.6 billion in 2005.
European Demand. According to the German Institute for Statistics, parents spend approximately €4.6 billion a year on tutoring. Approximately one third of German students receive private tutoring outside of school. German students primarily utilize private tutors to remain on grade level, however, approximately 25% of students utilize tutors to improve their grades. The majority of students who seek private tutoring are in their 7th to 10th school year.
Competition
While we face competition in each of our business segments, the markets in which our segments operate are very fragmented and penetrations are low.
We are aware of only six direct national corporate competitors in our Sylan Learning business: Huntington Learning Centers, Inc., Kumon Educational Institutes, The Princeton Review, Kaplan Educational Centers, SCORE! Education Centers, and Club Z!. With the exception of Kumon Educational Institutes, which is comprised of a large number of locations mostly operated in facilities primarily used by other organizations, we believe these competitors operate fewer learning centers and provide services within a smaller geographic area than we do. In most areas served by our Sylvan Learning network, competition also exists from individual tutors and local learning centers. Sylvan Learning competition focuses on education quality, convenient locations and price.
In our Catapult Learning segment, competition is primarily based on education quality, reputation and price. We compete with individuals that provide tutoring services to institutional customers, state and local education agencies that provide supplemental education services and national providers of supplemental education services, such as Kaplan K12 Services and The Princeton Review. We also compete with several other entities that currently provide Title I and state-based programs on a contract basis for students attending parochial and private schools.
In our European segment, our primary competition consists of Studienkries, a slightly-larger national provider of tutoring services in Germany, smaller regional tutoring chains and individual local tutors.
In our Products segment, we compete primarily in the preschool and early elementary categories of educational products. Our products compete with a variety of brands in both the toy and publishing industries. In the toy industry we compete with electronic learning aid products including those produced by LeapFrog and VTech Corporation. In the publishing industry we compete with companies, including School Zone and Scholastic, whose products are designed to teach children basic phonics, reading and math skills. We believe the principal competitive factors impacting the market for our products in retail stores are brand, design, overall educational efficacy, quality and price.
In our Progressus segment, our primary competition comes from several national providers, such as EBS Healthcare Columbus Organization, Solient Health, CompHealth and Career Staff. We also compete with some well established regional therapy businesses, including PediaStaff, Bilingual Therapy and Cobb Therapy, as well as many local providers.
The No Child Left Behind Supplemental Education Services (SES) industry in which Educate Online competes is highly fragmented featuring few companies with national scope and hundreds of regional and local companies with limited ability to scale beyond their current geographic area. The majority of SES companies deliver face to face, facility-based services. While there are a handful of companies that provide online services across the country, we are the only company operating nationally in this industry and we are the only company that provides the combination of live, individualized, in home instruction with U.S.-based, state-certified teachers. SES competition focuses on academic quality and parental and student convenience.
Employees
The following table sets forth information regarding the numbers of employees as of December 31, 2006 by segment:
| | | | | | |
| | | Full Time
Employees | | Part Time
Employees | | Total |
Segment: | | | | | | |
Franchise Services | | 172 | | 431 | | 603 |
Catapult Learning | | 939 | | 1,178 | | 2,117 |
European | | 84 | | 728 | | 812 |
Company-Owned Centers | | 730 | | 4,564 | | 5,294 |
Educate Products | | 70 | | 1 | | 71 |
Progressus | | 281 | | 41 | | 322 |
Educate Online | | 62 | | 756 | | 818 |
Corporate services | | 123 | | 1 | | 124 |
| | | | | | |
Total | | 2,461 | | 7,700 | | 10,161 |
| | | | | | |
7
Approximately 135 employees in our European segment are represented by a Works Council. We consider our relationship with the Council to be good. During December 2006, 17 employees in Lakewood, New Jersey who work in the Catapult Learning segment became members of the American Federation of Teachers, AFL-CIO (the “Union”). We have begun negotiating a collective bargaining agreement with the Union, but have not finalized an agreement. None of our other employees is party to any collective bargaining agreement with us and we consider our relationships with employees to be good.
Government Regulation
Franchise Regulation. Various state authorities as well as the Federal Trade Commission (“FTC”) regulate the sales of franchises in the United States. The FTC requires that franchisors make extensive disclosures to prospective franchisees but does not require registration. A number of states require registration and prior approval of the franchise-offering document. In addition, many states have “franchise relationship laws” or “business opportunity laws” that limit the ability of a franchisor to terminate franchise agreements or to withhold consent to the renewal or transfer of these agreements. While our franchising operations have not been materially adversely affected by existing regulation, we cannot assure you that we will not be adversely affected in the future nor can we predict the effect of any future legislation or regulation.
Our international franchise agreements and franchise operations are regulated by various foreign laws, rules and regulations. To date, these laws have not precluded us from selling franchise licenses in any given territory and have not had a material adverse effect on our operations.
Title I. Title I eligible school districts are responsible for implementing Title I and carrying out their educational programs. Title I provisions and regulations direct eligible districts to satisfy obligations including, among others, involving parents in their children’s education, evaluating and reporting on student progress, providing equitable services and other benefits to eligible non-public school students in the district and other fiscal requirements. In contracting with school districts to provide Title I services, we are, and will continue to be, subject to various Title I requirements and may become responsible to the school district for carrying out specific functions required by law. For example, we have responsibility for introducing program content adequate to achieve certain educational gains and maintaining the confidentiality of student records. Our failure to adhere to Title I requirements or to carry out regulatory responsibilities undertaken by contract may result in contract termination, financial liability or other sanctions.
Intellectual Property
We have federal trademark registrations for the words “Sylvan,” “Sylvan Learning Center,” “eSylvan”, “Hooked on Phonics”, “Hooked on Reading” and distinctive logos, along with various other trademarks, patents and service marks and have applications pending for a number of other distinctive phrases, including “Ace it!,” “Catapult Learning,” “Hooked on,” “Progressus,” and “Progressus Therapy, Inc.” We cannot predict whether our trademark and service mark applications will be approved. We cannot assure you that our existing or future trademarks, patents or service marks will provide meaningful protection. We also have obtained foreign registrations of Sylvan in over 50 countries. Our License Agreement grants our franchisees the right to use certain of our trademarks and service marks in connection with operation of a franchised learning center subject to certain quality control and other provisions.
Corporate Information
Educate was formed by an investor group led by affiliates of Apollo Advisors, L.P. (“Apollo”), a private equity investment company and certain management stockholders on June 30, 2003 to acquire the pre-K-12 educational services business of Laureate Education, Inc. (formerly known as Sylvan Learning Systems, Inc.) (“Laureate”). Apollo is Educate’s controlling stockholder.
As of December 31, 2006, affiliates of Apollo owned 52% of our outstanding shares of common stock. Apollo was founded in 1990 and is among the most active private investment firms in the United States in terms of both number of investment transactions completed and aggregate dollars invested. Since its inception, Apollo has managed the investment of an aggregate of approximately $16 billion in equity capital in a wide variety of industries, both domestically and internationally.
We are a holding company and all of our operations are conducted through our operating subsidiaries. Our principal executive offices are located at 1001 Fleet Street, Baltimore, Maryland 21202. Our telephone number is 410-843-8000. Our website iswww.educate-inc.com. Information on our website is not a part of and is not incorporated by reference into this Annual Report on Form 10-K. Our filings with the Securities and Exchange Commission are available without charge on our website as soon as reasonably practicable after filing. Copies of our Form 10-K are available free of charge by writing to 1001 Fleet Street, Attn: Investor Relations, Baltimore, Maryland 21202.
8
Our inability to adequately manage our growth could have an adverse effect on our operations.
We have increased the number of our company-owned Sylvan Learning Center territories from 49 as of January 1, 2000 to 178 as of December 31, 2006. We may not be able to integrate the territories we acquired from franchisees in 2005 and 2006 into our other operations without substantial costs, delays or other operational or financial problems. In particular, in 2006 we experienced higher than expected integration costs and lower than expected revenues from many of our acquired territories. In addition, as our business grows, more resources will be required to support our operations, including hiring teachers, directors of education, center directors and area managers, particularly if this growth occurs outside of the 33 markets in which we now operate company-owned territories. In our products business, our inability to effectively open new distribution channels for Educate Products and our inability to determine and predict consumer sell-through could have an adverse effect on our operations. Requirements to fund the start-up of Educate Products including product development, inventory build and extended terms on distribution partner receivable balances may also be a significant harm to our products business. Our inability to manage our anticipated growth may adversely affect the quality and consistency of our programs, our ability to integrate new personnel and our ability to capitalize on new business opportunities.
In response to our same territory revenue growth in 2006, we implemented a new strategy to restore growth, but we cannot assure you that our new strategy will be effective.
In 2006, our same territory revenues declined compared to the prior year in our Company-Owned Centers segment. While segment revenues grew by 7% over 2005 due primarily to acquisitions we made in 2005, same territory revenues declined by 8%. Inquiries declined from the prior year, and we did not achieve expected levels of revenue growth.
Our refranchising plan may not be effective in improving our financial results.
The plan to refranchise some of our Company-owned centers will have two impacts on our business. The costs of operating centers that are sold and the profits or losses associated with each center will become the responsibility of the buyer. Our Learning Center business will receive ongoing royalties and other fees from the buyer of the center. We cannot be sure that royalties and fees received will be more profitable than operating income from each center had it remained a Company owned-center.
Actions of teachers, instructors and other personnel could lead to liability claims and damage to our reputation, which could cause us to incur substantial costs and strain our relationships with franchisees.
We could become liable for the actions of teachers and other personnel in our company-owned learning territories or in other areas in which we provide services, including schools and students’ homes. In the event of accidents or injuries or other harm to students, we could face claims alleging that we were negligent, provided inadequate supervision or were otherwise liable for the injuries. A liability claim against us or any of our employees could adversely affect our reputation with our customers, which could adversely affect our enrollment and revenue. Even if unsuccessful, such a claim could create unfavorable publicity, cause us to incur substantial expenses and divert the time and attention of management. Unfavorable publicity resulting from a liability claim against us or any of our employees may also adversely affect our franchisees’ businesses, which could strain our relationships with franchisees.
Actions taken by our franchisees may harm our business.
Our business is dependent upon our franchisees and the manner in which they operate their franchised territories under our licensed brand. If a franchisee were to engage in unauthorized or unlawful conduct, the general public may associate this conduct with our brand, and negative publicity associated with this conduct could affect the reputation and success of all of our centers. Our business may also be adversely affected if our franchisees do not operate their territories and provide tutoring services in a manner consistent with our standards and requirements or do not hire and train qualified teachers. Our license agreements with our franchisees do not require them to conduct background checks on prospective employees. In addition, a liability claim against a franchised center or any center personnel may result in unfavorable publicity for all of our learning centers, whether or not the claim is successful.
Our ability to grow may be hindered and our business may suffer if our franchisees do not adopt and effectively implement improved programs and business practices we develop.
We are dependent on the willingness of our franchisees to adopt and effectively implement improved programs and business practices we develop in order to increase franchised center-based revenues and resulting royalties paid to us. However, franchisees often are not required to adopt these practices and they may adopt and implement our programs and business practices more slowly than we anticipate, or not at all. Any of these delays or failures could result in lower franchised center-based revenues and royalties paid to us, thus limiting our growth.
9
Our failure to maintain good relationships with our franchisees could significantly reduce our revenue and income.
We derive significant revenue from franchised operations, which comprised 17% and 19% of our revenue in 2006 and 2005, respectively. Our relationships with our franchisees may deteriorate in the future. Any deterioration in our relationship with our franchisees could significantly reduce our revenue and require management to direct their time and effort to rebuild strained relationships with franchisees. If management’s attention is focused on repairing relationships with franchisees instead of developing new programs and processes to increase revenue and income, our business and prospects may be adversely affected.
If we fail to sell licenses for new franchise territories, our financial performance and growth prospects may be adversely affected.
The growth of our business is dependent upon increasing the number of our franchised centers by selling licenses for new territories. Damage to our reputation and competition from other franchised supplemental education service providers may adversely affect our ability to sell licenses for additional franchise territories. If this were to occur, continued expansion would require the opening of a larger number of company-owned centers than we currently have planned which would require significantly more time and capital expenditures by us and could hinder or prevent our expansion.
The sale of licenses for new franchise territories could harm our relationship with existing franchisees.
Some or our franchisees presently benefit from being located adjacent to unlicensed territories. If we sell licenses for those unlicensed territories, the existing franchisees may have an adverse reaction, potentially straining our relationship with them.
New programs, services, and products may not be accepted and purchased by institutional customers and consumers.
As part of our growth strategy, we intend to implement, offer, and sell new programs, services, and products. There can be no guarantee that the new programs, services, and products will be successful or that our institutional customers and consumers will accept and purchase them.
Our ability to grow may be hindered by product-related problems.
A source of growth of our business will be in the creation, manufacture and sale of educational products that are fun, easy to use, and effective. We may experience manufacturing problems, distribution problems, and inventory management problems. In particular, during 2006 our products business experienced a negative $19 million operating income swing due to increased operating costs incurred to prepare the segment for future growth. Increased infrastructure costs to expand production and distribution as well as a dramatic increase in the development cost for new products combined to result in a significant decline in operating performance for the Product business. If we continue to incur similar levels of necessary infrastructure and development costs without an increase in revenue through expansion of our distribution channels, our ability to grow or maintain our other businesses may be adversely effected. In addition, there are risks due to the seasonal nature of the product business and we may experience problems as we sell the products internationally.
We rely on the accuracy of the unaudited financial information we receive from our franchisees, over which we do not have direct supervision or control and which we do not routinely audit.
Under their license agreements with us, our franchisees are required to report financial and other data to us, including their learning center revenues and results of operations. We rely on franchisee data to make important business decisions. However, we do not routinely audit the information that our franchisees report to us, and we do not have direct supervision over the reporting of our franchisees. Therefore, we are unable to ensure that the data reported by our franchisees is accurate. If the data reported by our franchisees is not accurate, it may result in less informed business decisions by management.
Franchise regulations could limit our ability to terminate or replace unproductive franchises, which could result in lower franchise royalties.
Applicable laws may delay or prevent us from terminating an unproductive franchise or withholding our consent to renew or transfer a franchise, which could result in lower franchise royalties. As a franchisor, we are subject to federal, state and international laws regulating the offer and sale of franchises. These laws also frequently apply substantive standards to the relationship between franchisor and franchisee and limit the ability of a franchisor to terminate or refuse to renew a franchise. Compliance with federal, state and international franchise laws can be costly and time consuming, and we cannot be certain that we will not encounter delays, expenses or other difficulties in this area. Further, we cannot predict the nature and effect of any future legislation or regulation of our franchise operations.
10
Economic, political and other risks associated with our European and Canadian centers could adversely affect our business.
Our European and Canadian centers are subject to a number of risks inherent to operating in foreign countries. For example, risks affecting our European and Canadian centers include:
| | • | | fluctuations in foreign currency exchange rates; |
| | • | | differences or unexpected changes in regulatory requirements; |
| | • | | foreign governments’ restrictive trade policies; |
| | • | | the imposition of, or increase in, duties, taxes, government royalties or non-tariff trade barriers; |
| | • | | challenges of operating in international markets with different cultural bases and consumer preferences; and |
| | • | | increased dependence on local country managers. |
Most of these risks are beyond our control. We cannot predict the nature or likelihood of any such events. However, if such an event should occur, it could adversely affect our business, financial condition and results of operations.
Our Catapult Learning segment conducts business largely with local education authorities, which change from time to time. As a result of these changes, our relationship can be adversely affected, leading to reductions in business and harm to our reputation.
A substantial portion of our revenue, 21% and 20% in 2006 and 2005, respectively, is generated by our Catapult Learning segment. This segment provides services to government agencies, primarily to school districts, and therefore is exposed to the risks associated with government contracting. Many of our contracts with school districts are school-year contracts subject to annual renewal at the option of the school district, and in many instances the school district can terminate or modify the contracts at their convenience. Any negative publicity, whether or not the reason for such publicity is within our control, could cause a school district to terminate or fail to renew a contract. Changes in the composition of local school boards or changes in school district administration may adversely affect a school district’s willingness to contract with us. In addition, any termination or non-renewal of a contract with a school district could have an adverse effect on our results of operations, and a termination or non-renewal caused by our failure to improve the poor academic performance of students enrolled in our programs could adversely affect our ability to secure contracts with other school districts.
Changes in Federal and state laws reducing or eliminating funding for third-party suppliers of supplemental education services could adversely affect our business.
Our Catapult Learning segment relies almost exclusively on government-funded programs. The federal government and state governments may, at any time, reduce, or lower the rate of growth of, funding under the Elementary and Secondary Education Act (ESEA), the Individuals with Disabilities Education Act (IDEA) or similar programs. The U.S. Congress may modify or repeal the ESEA (currently reauthorized as the No Child Left Behind Act) or modify the IDEA, thus reducing the amount of federal money available to fund our programs. The Federal and state governments may eliminate or specifically limit the amount of funds spent on third-party supplemental education services. Any such reduction, limitation or elimination of funding could adversely affect our revenue.
If we fail to comply with applicable state and federal regulations, we may face government sanctions.
As a result of providing services funded by government programs, we are subject to state and federal regulations. Compliance with state and federal regulations can be costly and time consuming, and we cannot be sure that we will not encounter delays, expenses or other difficulties. Further, our failure to comply with these regulations could result in financial penalties or restrictions on our operations.
Additional Risks Relating to Our Business and Industry
Our operating results may vary significantly from quarter to quarter as a result of seasonal and other variations to which our business is subject. This may result in volatility or adversely affect our stock price.
We experience seasonality in results of operations primarily as a result of changes in the level of student enrollments during the course of the school year and the duration of the school year. Also, we recognize franchise royalty revenue based upon our cash receipts from franchisees, in accordance with the terms of our franchise agreements. Because many customers prepay for programs at the time of enrollment, the timing of our franchise royalty revenues tends to correspond to student enrollment dates. In our company-owned center and other businesses, however, we recognize revenue as we deliver services. We typically generate the largest portion of our
11
revenue in our Franchise Services, Company-Owned Centers and Catapult Learning segments in the second quarter, and we experience lower revenues from franchise royalties in the fourth quarter as a result of prepayments by customers to our franchisees in other quarters. As a result, we believe that quarter-to-quarter comparisons of our results of operations may not be a fair indicator and should not be relied upon as a measure of future performance.
Our historical results of operations may not be indicative of future performance, which is difficult to forecast. We expect our results to vary from quarter to quarter.
We expect results of operations to fluctuate in response to factors in addition to seasonal fluctuations. These factors include customer issuance of purchase orders and acceptance of product, the timing of receipt of payment from our customers, including those under government contracts funded under Title I and other legislation, changes in the percentage of customers prepaying in our franchised centers and the timing of revenue recognition of franchise license fees. Changes in the pattern of customer prepayments in our franchised centers would cause fluctuations of operating results because these changes impact our franchise royalty revenues. In our Catapult Learning and Educate Online segments, we often experience significant delays in payment by the school districts.
We make substantial investments in advertising campaigns, which may not be effective.
Our business is dependent upon inquiry calls from potential customers. Most of these calls are generated in response to television and internet advertising. In January 2007 we began airing new television advertisement. We cannot be certain this new advertisement will generate more inquiries per dollar spent on media than in prior years. Additionally, in October 2006 we launched a revision of our Educate.com website intended to improve responsiveness from customers. We cannot be certain this new website will be more responsive than the site it replaced.
In 2007, we modified our mix of television, radio and web media purchases. We cannot be sure this new mix of media will be more effective than our prior strategy.
We have a limited operating history as an independent company, which may make our business difficult to evaluate.
We commenced operations as an independent company in 2003. As a result, we have only a limited operating history as an independent company upon which you can evaluate our business and prospects. We will encounter risks, uncertainties and difficulties frequently experienced by other similarly situated companies, such as maintaining adequate internal controls and procedures and managing the expansion of our operations. If we do not successfully manage these risks, our business, financial condition and results of operations will be adversely affected.
We expect that new products and programs we develop will expose us to risks that may be difficult to identify until such products or programs are implemented.
We are currently developing, and in the future will continue to develop, new products and programs, the risks of which will be difficult to ascertain until these future programs are implemented. For example, in February 2005, we acquired the Hooked on Phonics brand of educational programs. These new products and programs differ significantly from the services our Sylvan Learning Center franchisees currently provide in their learning centers. Any negative events or results that may arise as we develop new products or programs may adversely affect our reputation, business, financial condition and results of operations.
New products and programs we develop may compete with our current programs.
We are presently developing, and will likely in the future develop, products and programs that compete with our existing programs. For example, we are currently piloting programs to address homework assistance and premium tutoring opportunities to complement our traditional center-based diagnostic, prescriptive learning programs. Our Hooked on Phonics brand, to some extent, also competed with our existing programs.
Our success depends on our ability to recruit and retain necessary personnel.
Our success also depends, in large part, upon our ability to attract and retain highly qualified personnel. For example, our Progressus Therapy business must recruit qualified occupational therapists, physical therapists and speech language pathologists to administer the specialized services we provide. A shortage of qualified therapists and pathologists currently exists, which may inhibit us from satisfying demand and could limit our growth. In addition, as a result of higher elementary school enrollment and the retirement of veteran teachers, a shortage of teachers may develop over the next decade. Similar shortages have occurred in the past. We may have difficulty locating and hiring qualified teachers and retaining such personnel once hired. We depend on key personnel, including
12
R. Christopher Hoehn-Saric, Peter Cohen, Donna Dixon, Christopher Paucek and Kevin Shaffer, to effectively operate our business. If any of our key personnel left our company and we failed to effectively manage a transition to new personnel, or if we fail to attract and retain qualified and experienced personnel on acceptable terms, our business, financial condition and results of operations could adversely be affected.
Our substantial indebtedness could adversely affect our financial condition and impact our business and growth prospects.
As of December 31, 2006, our total indebtedness was approximately $178.4 million. Our substantial indebtedness could have important consequences. For example, it could:
| | • | | require the use of all or a large portion of our cash to pay principal and interest on our operating company’s secured credit facility, which could reduce the availability of cash to fund working capital, capital expenditures and other business activities; |
| | • | | increase our vulnerability to general adverse economic and industry conditions; |
| | • | | limit our flexibility in planning for, or reacting to, changes in our business and the industry in which we operate; |
| | • | | restrict us from making strategic acquisitions or exploiting business opportunities; |
| | • | | place us at a competitive disadvantage compared to our competitors that have less debt; and |
| | • | | limit our ability to borrow additional funds, dispose of assets or pay cash dividends, if we choose to pay dividends in the future. |
Furthermore, all of our indebtedness under our operating company’s secured credit facility bears interest at variable rates. If these rates were to increase significantly, our interest expense would increase, our ability to borrow additional funds may be reduced and the risks related to our substantial indebtedness would intensify.
The terms of our secured credit facility restrict us from engaging in many activities and require us to satisfy various financial tests. We expect that any credit facilities that we obtain in the future will contain similar restrictions and requirements.
Our secured credit facility contains covenants that restrict, among other things, our ability to incur additional debt, pay cash dividends, create liens, change our fundamental organization or lines of business, make investments and engage in transactions with affiliates and that contains events of default that are triggered, among other things, if there is a change of control of us or our subsidiaries and for certain changes in the composition of our Board of Directors, all of which may adversely affect our ability to grow and to pursue new business opportunities. The secured credit facility also requires us to maintain specific financial ratios. Events beyond our control could affect our ability to meet those financial ratios, and we cannot assure you that we will meet them. A breach of any of the covenants contained in our secured credit facility could allow the lenders to declare all amounts outstanding under the secured credit facility to be immediately due and payable. We have pledged substantially all of our assets to the lenders as collateral under our secured credit facility. The lenders could proceed against the collateral granted to them if we are unable to meet our debt service obligations. If the amounts outstanding under our secured credit facility are accelerated, we may be forced to restructure or refinance our obligations, obtain equity financing or sell assets, which we may be unable to accomplish in a timely manner, on terms satisfactory to us or at all. If we are unable to restructure or refinance our obligations, we may default under our obligations. In order to replace our existing secured credit facility or raise additional capital, we may seek to obtain one or more credit facilities in the future. We expect that any credit facilities we enter into in the future will contain restrictions and requirements similar to those described above.
As discussed more fully in the Notes to the Consolidated Financial Statements as of December 31, 2006, on March 15, 2007, we obtained a waiver of certain violations of these financial covenants as of December 31, 2006 and March 31, 2007 from our bank syndicate. We believe we will fail to comply with these same financial covenants at subsequent quarterly reporting dates in 2007, and accordingly, will need to obtain waivers or amend the terms of the credit facility to avoid triggering the facility’s demand repayment provisions. As a result, we classified the $175.8 million of outstanding borrowings under the credit facility at December 31, 2006 as a current liability in the accompanying 2006 consolidated balance sheet, resulting in a working capital deficit of $170.0 million.
We considered attempting to negotiate revised financial covenants to allow for compliance in 2007 based on projected operating results. However, because we have entered into a definitive merger agreement for the sale of the Company and expect to close that transaction by June 30, 2007, we determined it was not prudent to negotiate new terms and incur additional costs to amend our credit facility. However, we cannot assure you that lenders will waive their right to demand repayment of outstanding borrowings upon the likely default of the credit facility’s provisions in the June 30, 2007 and subsequent quarterly reporting periods, and in the event of demanded repayment, that we can refinance the loans on acceptable terms. If we are unable to refinance the indebtedness or obtain a waiver of a default, then we may be unable to continue as a going concern. In addition, we cannot assure you that the Merger will be completed within this timeframe, or at all.
13
Business uncertainties and contractual restrictions while the proposed merger is pending may have an adverse effect on us.
Uncertainty about the effect of the Merger on employees, suppliers and partners may have an adverse effect on us. These uncertainties may impair our ability to attract, retain and motivate key personnel until the Merger is consummated, and could cause others that deal with us to defer decisions concerning us, or seek to change existing business relationships with us. Employee retention may be particularly challenging while the Merger is pending, as employees may experience uncertainty about their future roles with the post-merger entity. In addition, the Merger Agreement restricts us from taking specified actions without the buyer’s approval. These restrictions could prevent us from pursuing attractive business opportunities that may arise prior to the completion of the Merger.
Failure to complete the Merger may negatively impact on our ongoing business.
If the Merger is not approved by our stockholders or if the Merger is not completed for any other reason, we will remain an independent public company and our common stock will continue to be listed and traded on the NASDAQ Global Select Market. While we expect that management will operate the business in a manner similar to that in which it is being operated today, if the merger is not completed, we may suffer negative financial ramifications, including as a result of paying the $16 million termination fee if such termination fee is required to be paid and the expenses incurred as a result of the proposed merger and the decline of the market price of our shares of common stock to the extent that the current market price reflects a market assumption that the proposed merger will be completed. In addition, a failed merger may result in negative publicity and/or a negative impression of us in the investment community. As a result, our business, prospects, results of operations or stock price could be adversely impacted.
Natural or manmade disasters could interrupt our business.
Natural disasters, fire, power shortages, terrorist attacks and other hostile acts, labor disputes, public health issues, and other events beyond our control could interrupt our business operations. We cannot predict the occurrences or consequences of these events, which could decrease demand for our products and services, or make it difficult or impossible for us to deliver products and services to our customers. These events have adversely affected our operating results and financial condition in the past, and may adversely affect us in the future. For example, during 2005 Hurricane Katrina adversely affected the delivery of services in the Catapult Learning segment in the Gulf Coast region, thus adversely affecting our operating results.
| Item 1B. | Unresolved Staff Comments. |
None.
All of our Sylvan Learning Centers in our Company-Owned Centers segment are located on premises with short-term leases (typically three to five years) that generally comprise approximately 3,000 square feet. All of our company-owned centers in our European segment are located on leased premises that typically comprise approximately 1,500 square feet. All of our franchisee-owned in both our Franchise Services and European segments are located on premises leased or owned by the franchisee. No single center is material to our operations.
14
As of December 31, 2006 our learning centers operated in the following locations:
| | | | | | |
Sylvan Learning Centers: United States and Territories | | Company-Owned | | Franchisee-Owned | | Total |
Alabama | | 4 | | 14 | | 18 |
Alaska | | — | | 4 | | 4 |
Arizona | | 2 | | 13 | | 15 |
Arkansas | | — | | 7 | | 7 |
California | | 54 | | 56 | | 110 |
Colorado | | 4 | | 10 | | 14 |
Connecticut | | — | | 15 | | 15 |
Delaware | | 2 | | — | | 2 |
Florida | | 16 | | 54 | | 70 |
Georgia | | 15 | | 24 | | 39 |
Hawaii | | — | | 3 | | 3 |
Idaho | | — | | 4 | | 4 |
Illinois | | 14 | | 28 | | 42 |
Indiana | | 2 | | 24 | | 26 |
Iowa | | 4 | | 8 | | 12 |
Kansas | | — | | 8 | | 8 |
Kentucky | | 1 | | 14 | | 15 |
Louisiana | | — | | 20 | | 20 |
Maine | | — | | 4 | | 4 |
Maryland | | 15 | | 10 | | 25 |
Massachusetts | | 11 | | 9 | | 20 |
Michigan | | — | | 48 | | 48 |
Minnesota | | 9 | | 13 | | 22 |
Mississippi | | — | | 8 | | 8 |
Missouri | | — | | 24 | | 24 |
Montana | | — | | 7 | | 7 |
Nebraska | | — | | 9 | | 9 |
Nevada | | 2 | | 4 | | 6 |
New Hampshire | | 1 | | 6 | | 7 |
New Jersey | | 4 | | 23 | | 27 |
New Mexico | | — | | 4 | | 4 |
New York | | — | | 40 | | 40 |
North Carolina | | — | | 47 | | 47 |
North Dakota | | — | | 3 | | 3 |
Ohio | | 14 | | 29 | | 43 |
Oklahoma | | 2 | | 5 | | 7 |
Oregon | | — | | 15 | | 15 |
Pennsylvania | | 10 | | 30 | | 40 |
Rhode Island | | 1 | | 5 | | 6 |
South Carolina | | — | | 12 | | 12 |
South Dakota | | — | | 2 | | 2 |
Tennessee | | 1 | | 22 | | 23 |
Texas | | 34 | | 35 | | 69 |
Utah | | 5 | | 2 | | 7 |
Vermont | | — | | 1 | | 1 |
Virginia | | 11 | | 16 | | 27 |
Washington | | — | | 32 | | 32 |
West Virginia | | — | | 6 | | 6 |
Wisconsin | | 4 | | 17 | | 21 |
Guam | | — | | 1 | | 1 |
Puerto Rico | | — | | 3 | | 3 |
| | | | | | |
Total Sylvan Learning Centers: United States and Territories | | 242 | | 798 | | 1,040 |
| | | | | | |
| | | | | | |
Sylvan Learning Centers: International | | Company-Owned | | Franchisee-Owned | | Total |
Canada | | 9 | | 83 | | 92 |
Hong Kong | | — | | 2 | | 2 |
| | | | | | |
Total Sylvan Learning Centers: International | | 9 | | 85 | | 94 |
| | | | | | |
Total Sylvan Learning Centers | | 251 | | 883 | | 1,134 |
| | | | | | |
| | | | | | |
Schülerhilfe | | Company-Owned | | Franchisee-Owned | | Total |
Austria | | — | | 61 | | 61 |
Germany | | 264 | | 755 | | 1,019 |
| | | | | | |
Total Schülerhilfe | | 264 | | 816 | | 1,080 |
| | | | | | |
15
We lease approximately 16,000 square feet of space in Elkridge, Maryland that serves as a national contact center for our Company-owned Sylvan Learning Centers. The lease expires on December 31, 2009 and is renewable for an additional three-year term at our discretion.
Catapult Learning leases approximately 15 regional administrative offices located in strategic points throughout the United States. The leased premises range in size from 1,000 to 11,000 square feet, totaling approximately 48,000 square feet. The leases are generally short-term with many having annual renewals.
Schülerhilfe (European segment) leases approximately 14,000 square feet of office space in Gelsenkirchen, Germany, which serves as its corporate and franchise headquarters.
Educate Products leases approximately 5,000 square feet in Costa Mesa, California. The lease term expires April 30, 2007.
Our Progressus segment leases approximately 5,000 square feet in Tampa, Florida. The lease term expires in January 2010.
We lease office space for our corporate headquarters at 1001 Fleet Street in Baltimore, Maryland, which is used by all of our business segments. At our corporate headquarters, we sublease approximately 57,000 square feet of office space plus approximately 1,000 square feet as our proportionate share of the mailroom and cafeteria from Laureate. The initial term of the sublease for our headquarters expires on August 30, 2011.
We sublease two other properties from Laureate in Baltimore, Maryland. The first property consists of approximately 26,000 square feet. The sublease for this property expires on September 30, 2009 and is renewable for two additional periods totaling 10 years at our discretion. This property is used primarily by the Catapult Learning segment, Educate Online segment and our corporate function. The second property consists of office space totaling approximately 7,000 square feet, which is used by both the Company-Owned Centers and Catapult Learning segments. The sublease term for this property expired on November 30, 2006 and is on a month-to-month basis.
We lease approximately 21,000 square feet of corporate office space in Baltimore, Maryland under two separate lease agreements. This property is used by the Company-Owned Centers segment and our corporate function. These leases expire on August 31, 2010 with early termination rights on one lease.
| Item 3. | Legal Proceedings. |
Since the public announcement that the Company had entered into the Merger Agreement, one civil action has been commenced in the Circuit Court for Baltimore City, Maryland alleging that the directors of the Company have breached their fiduciary duties by pursuing the proposed Merger. The action seeks to enjoin the consummation of the Merger or, in the event that the Merger is consummated, to rescind the Merger or to obtain an award of damages in an unspecified amount. The Company and all of its directors have been named as defendants. The action purports to have been brought on behalf of a class consisting of all of the Company’s stockholders except for the defendants and their affiliates. The Company believes that the claims asserted in the action are without merit and intends to defend the action vigorously.
Our company is involved in various other lawsuits in the ordinary course of business, usually related to employment matters or commercial disputes. We maintain liability insurance to cover claims over a deductible amount. In our opinion, amounts accrued for exposure relating to legal proceedings are adequate and, accordingly, the ultimate resolution of these matters is not expected to have a material adverse effect on our financial statements.
| Item 4. | Submission of Matters to a Vote of Security Holders. |
No matters were submitted to be voted on by security holders during the fourth quarter ended December 31, 2006.
PART II.
| Item 5. | Market for Registrants’ Common Equity, Related Stockholder Matters and Issuer Purchases of Equity Securities. |
Our common stock trades on the NASDAQ Global Select Market under the ticker symbol “EEEE”. The high and low trade prices of our common stock as reported by NASDAQ are set forth in the following table for the periods indicated.
| | | | | | |
| | | High | | Low |
Year Ended December 31, 2005 | | | | | | |
First Quarter | | $ | 14.23 | | $ | 12.02 |
Second Quarter | | | 14.52 | | | 10.22 |
Third Quarter | | | 17.11 | | | 13.49 |
Fourth Quarter | | | 15.07 | | | 9.96 |
Year Ended December 31, 2006 | | | | | | |
First Quarter | | $ | 13.03 | | $ | 8.19 |
Second Quarter | | | 8.94 | | | 7.39 |
Third Quarter | | | 8.13 | | | 5.69 |
Fourth Quarter | | | 8.06 | | | 7.03 |
16
We do not anticipate paying dividends in the foreseeable future. Instead, we anticipate that all of our earnings, if any, in the foreseeable future will be used to repay debt, for working capital, to support our operations and to finance the growth and development of our business. Any future determination relating to dividend policy will be made at the discretion of our Board of Directors and will depend on a number of factors, including restrictions in our debt instruments, our future earnings, capital requirements, financial condition, future prospects and the General Corporation Law of the State of Delaware, which provides that dividends are only payable out of surplus or current net profits. We are currently restricted from declaring or paying cash dividends pursuant to the terms of our secured credit facility and the merger agreement.
On September 20, 2004, we effected a 1.00 for 1.25 reverse stock split of our common stock. We have restated all share and per share amounts for all periods to give retroactive effect to the reverse stock split.
There were 53 registered shareholders of record as of March 9, 2007, including one company acting as holder of record for all investors whose stock is held in street name.
Stock Performance Graph
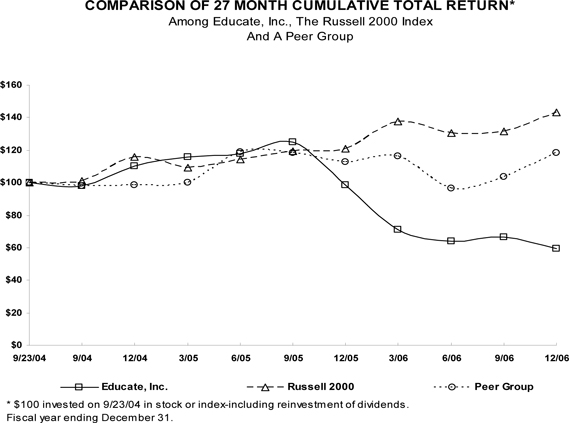
17
| Item 6. | Selected Financial Data. |
You should read the following selected consolidated financial data together with our historical consolidated financial statements and the related notes, the combined financial statements and the related notes of our predecessor, and with “Management’s Discussion and Analysis of Financial Condition and Results of Operations,” included in Items 7 and 8 of this Form 10-K. References to our predecessor refer to the pre-K-12 business we acquired from Laureate.
The combined statement of operations data of our predecessor for the year ended December 31, 2002 and the six months ended June 30, 2003 and balance sheet data as of December 31, 2002 are derived from financial statements audited by Ernst & Young LLP, independent registered public accounting firm, and are not included in this Form 10-K.
Our consolidated statement of operations data for the period from June 30, 2003 (date of inception) through December 31, 2003 and balance sheet data as of December 31, 2003 are derived from financial statements audited by Ernst & Young LLP, independent registered public accounting firm, and are not included in this Form 10-K.
Our consolidated statement of operations data for the years ended December 31, 2006, 2005 and 2004 and our consolidated balance sheet data as of December 31, 2006 and 2005 have been derived from our audited consolidated financial statements included in Item 8 of this Form 10-K, which have been audited by Ernst & Young LLP, whose report is included herein.
18
SELECTED CONSOLIDATED FINANCIAL DATA
(dollar amounts in thousands, except per share data)
| | | | | | | | | | | | | | | | | | | | | | | | | | |
| | | Educate | | | | | | | Predecessor |
| | | Year ended
December 31, | | | | | | | | | Period from
June 30, 2003
through
December 31, | | | | | | | Six
months
ended
June 30, | | Year ended
December 31, |
| | | 2006 | | | 2005 | | | 2004 | | | 2003 | | | | | | | 2003 | | 2002 |
| | | (1) | | | (3) | | | (4) (5) (6) | | | (7) (8) | | | | | | | (7) | | (9) |
Statement of Operations Data: | | | | | | | | | | | | | | | | | | | | | | | | | | |
Service revenues | | $ | 329,996 | | | $ | 296,629 | | | $ | 265,095 | | | $ | 107,944 | | | | | | | $ | 119,835 | | $ | 206,997 |
Net product sales | | | 24,672 | | | | 33,785 | | | | 8,029 | | | | 3,294 | | | | | | | | 4,503 | | | 9,299 |
| | | | | | | | | | | | | | | | | | | | | | | | | | | |
Total revenues | | | 354,668 | | | | 330,414 | | | | 273,124 | | | | 111,238 | | | | | | | | 124,338 | | | 216,296 |
Operating expenses | | | 348,725 | | | | 284,769 | | | | 234,928 | | | | 92,577 | | | | | | | | 103,624 | | | 193,392 |
Operating income | | | 5,943 | | | | 45,645 | | | | 38,196 | | | | 18,661 | | | | | | | | 20,714 | | | 22,904 |
| | | | | | | | | | | | | | | | | | | | | | | | | | | |
Income (loss) from continuing operations | | $ | (8,684 | ) | | $ | 22,011 | | | $ | 13,447 | | | $ | 7,267 | | | | | | | $ | 10,781 | | $ | 8,708 |
| | | | | | | | | | | | | | | | | | | | | | | | | | | |
Dividends per common share | | $ | — | | | $ | — | | | $ | 0.24 | | | $ | — | | | | | | | | | | | |
Earnings per share from continuing operations | | | | | | | | | | | | | | | | | | | | | | | | | | |
—basic | | $ | (0.20 | ) | | $ | 0.52 | | | $ | 0.35 | | | $ | 0.20 | | | | | | | | | | | |
—diluted | | $ | (0.20 | ) | | $ | 0.50 | | | $ | 0.34 | | | $ | 0.20 | | | | | | | | | | | |
Weighted average common shares outstanding | | | | | | | | | | | | | | | | | | | | | | | | | | |
—basic (in thousands) | | | 42,933 | | | | 42,646 | | | | 38,637 | | | | 36,800 | | | | | | | | | | | |
—diluted (in thousands) | | | 42,933 | | | | 44,054 | | | | 39,847 | | | | 36,800 | | | | | | | | | | | |
| | | | | | | | |
Other Operating Data: | | | | | | | | | | | | | | | | | | | | | | | | | | |
| As of December 31, | | 2006 | | | 2005 | | | 2004 | | | 2003 | | | | | 2002 | | |
Number of Sylvan Learning Territories: | | | | | | | | | | | | | | | | | | | | | | | |
Company-owned | | | 178 | | | | 171 | | | | 111 | | | | 85 | | | | | 76 | | | |
Franchisee-owned | | | 734 | | | | 725 | | | | 738 | | | | 732 | | | | | 700 | | | |
| | | | | | | | | | | | | | | | | | | | | | | | |
Total | | | 912 | | | | 896 | | | | 849 | | | | 817 | | | | | 776 | | | |
Number of Sylvan Learning Centers: | | | | | | | | | | | | | | | | | | | | | | | |
Company-owned | | | 251 | | | | 245 | | | | 163 | | | | 135 | | | | | 127 | | | |
Franchisee-owned | | | 883 | | | | 876 | | | | 896 | | | | 862 | | | | | 822 | | | |
| | | | | | | | | | | | | | | | | | | | | | | | |
Total | | | 1,134 | | | | 1,121 | | | | 1,059 | | | | 997 | | | | | 949 | | | |
Debt to equity ratio (10) | | | .87 | x | | | .77 | x | | | .62 | x | | | 1.18 | x | | | | | | | |
Interest coverage ratio (11) | | | .47 | x | | | 5.75 | x | | | 3.91 | x | | | 2.68 | x | | | | | | | |
| | | | | | | |
Balance Sheet Data: | | | | | | | | | | | | | | | | | | | | | | | |
| As of December 31, | | 2006 | | | 2005 | | | 2004 | | | 2003 | | | | | 2002 | | |
Cash and cash equivalents | | $ | 535 | | | $ | 2,414 | | | $ | 14,592 | | | $ | 20,226 | | | | | $ 4,909 | | | |
Working capital (2) | | | (170,003 | ) | | | 8,394 | | | | 10,802 | | | | 7,624 | | | | | 5,574 | | | |
Total assets | | | 464,777 | | | | 451,888 | | | | 381,382 | | | | 362,195 | | | | | 137,966 | | | |
Debt outstanding (including current portion) | | | 178,357 | | | | 162,848 | | | | 122,513 | | | | 167,865 | | | | | 293 | | | |
| (1) | On April 10, 2006, we closed on a co-production agreement for Reading Rainbow and the acquisition of the assets of Great Plains National Instructional Library (“GPN”) for $4.9 million. The results of operations of the acquired business are included in our consolidated statements of income beginning April 10, 2006. See Note 3 to our consolidated financial statements included in Item 8 of this Form 10-K. |
| (2) | Working capital declined in 2006 because we are not able to determine it is probable we will comply with certain financial covenants of the 2005 Term Loan for quarterly reporting periods in 2007. As a result, we classified all outstanding debt under the 2005 Term Loan as a current liability in the balance sheet as of December 31, 2006. See Note 6 to our consolidated financial statements included in Item 8 of this Form 10-K. |
19
| (3) | On February 8, 2005, we acquired Gateway Learning Corporation (“HOP”), the owner of the branded “Hooked on Phonics early reading, math and study skills programs. The results of operations of HOP are included in our consolidated statements of income beginning February 1, 2005. During the year ended December 31, 2005, we acquired 60 Sylvan Learning Center franchised territories comprising 78 centers in separate transactions with franchisees. See Note 3 to our consolidated financial statements included in Item 8 of this Form 10-K. |
| (4) | In connection with a public offering of our common stock in 2004, we received proceeds of $47.7 million in cash and effected a 1.00 for 1.25 reverse stock split of our common stock. All share and per share amounts have been restated for all periods to give retroactive effect to the reverse stock split. We also declared and paid a cash dividend to our existing stockholders in the amount of $9 million or $0.24 per common share. See our Annual Report on Form 10-K for the year ended December 31, 2006 for more information regarding these items. |
| (5) | In 2004, we entered into a new secured credit facility and borrowed the full $170 million under the term loan facility primarily to repay all amounts outstanding under the subordinated note issued to Laureate Education, Inc. (formerly known as Sylvan Learning Systems, Inc., or “Laureate”) in our formation and to refinance borrowings under the old secured credit facility. See our Annual Report on Form 10-K for the year ended December 31, 2004 for more information regarding these transactions. |
| (6) | In 2004, we recognized $8.8 million in non-cash stock compensation expense related to restricted common stock and options granted to employees and directors to purchase common stock at prices less than the estimated fair value of our common stock. See our Annual Report on Form 10-K for the year ended December 31, 2004 for more information regarding these transactions. |
| (7) | Our acquisition of the pre-K-12 business of Laureate Educate, Inc. was completed on June 30, 2003. Simultaneously with the closing of our acquisition, we entered into a $130 million secured credit facility. See our Annual Report on Form 10-K for the year ended December 31, 2004 for more information regarding these transactions. |
| (8) | In 2003, we acquired Progressus Therapy, Inc., a provider of professional physical, occupational, and speech therapy services to schools for approximately $4.3 million. See our Annual Report on Form 10-K for the year ended December 31, 2004 for more information regarding this transaction. |
| (9) | On January 1, 2002, we acquired 30 franchised Sylvan Learning Centers for approximately $22.2 million. See our Annual Report on Form 10-K for the year ended December 31, 2004 for more information regarding these transactions. |
| (10) | Debt to equity ratio is the ratio of outstanding debt to total stockholders’ equity for the respective periods. |
| (11) | Interest coverage ratio is the ratio of operating income to consolidated interest expense for the respective periods. |
| Item 7. | Management’s Discussion and Analysis of Financial Condition and Results of Operations. |
The following discussion of our financial condition and results of operations should be read in conjunction with our consolidated financial statements and related notes to those statements included in Item 8 of this Annual Report on Form 10-K.
Information Regarding Forward-Looking Statements
The statements contained herein include forward-looking statements within the meaning of Section 21E of the Securities Exchange Act of 1934, as amended. Forward-looking statements include information about possible or assumed results of operations, business strategies, financing plans, competitive position and potential growth opportunities. Forward-looking statements include all statements that are not historical facts and are generally accompanied by words such as “may,” “will,” “intend,” “anticipate,” “believe,” “estimate,” “expect,” “should” or similar expressions or the negative of such words or expressions. These statements also relate to our contingent payment obligations relating to acquisitions, future capital requirements, potential acquisitions and our future development plans and are based on current expectations. Forward-looking statements involve various risks, uncertainties and assumptions. Our actual results may differ materially from those expressed in these forward-looking statements.
Future events and actual results could differ materially from those set forth in the forward-looking statements as a result of many factors. The following factors are some of the factors that might cause such a difference: the occurrence of any event, change or other circumstances that could give rise to the termination of the merger agreement; the outcome of any legal proceedings that have been or may be instituted against the Company and others following announcement of the proposal or the merger agreement; the inability to complete the merger due to the failure to obtain stockholder approval or the failure to satisfy other conditions to the completion of the merger, including receipt of required regulatory approvals; risks that the proposed transaction disrupts current plans and operations and the potential difficulties in employee retention as a result of the merger; the amount of the costs, fees, expenses and charges related to the merger and the actual terms of certain financings that will be obtained for the merger; the development and expansion of the
20
Sylvan Learning franchise system; changes in the relationships among Sylvan Learning and its franchisees; our ability to effectively manage business growth; changes in our ability to effectively integrate recently acquired companies; increased competition from other educational service providers; changes in laws and government policies and programs; changes in the acceptance of our services and products by institutional customers and consumers; changes in customer relationships; acceptance of new programs, services and products by institutional customers and consumers; the seasonality of operating results; global economic conditions, including interest and currency rate fluctuations and inflation rates; fluctuations in our consolidated effective tax rate due to potential changes in the mix of earnings; and the other factors described in this Form 10-K. Additional information regarding these and other risk factors and uncertainties are set forth from time to time in our filings with the Securities and Exchange Commission, available for viewing on our website atwww.educate-inc.com. These forward-looking statements are based on estimates, projections, beliefs and assumptions of management and speak only as of the date made and are not guarantees of future performance. We do not undertake any obligation to release publicly any revisions to these forward-looking statements to reflect events or circumstances after the date of this report or to reflect the occurrence of unanticipated events, except as may be required under applicable securities law.
Overview
We are a leading pre-K-12 education company delivering supplemental education services and products to students and their families. We operate through seven business segments that offer distinct supplemental education services and products from which we earn revenues. During the fourth quarter of 2006, management changed the manner in which it reviews segment operating performance, and increased the number of reporting segments to include Franchise Services, Catapult Learning, European, Company-Owned Centers, Educate Products, Progressus, and Educate Online. Additionally, Franchise Services, Catapult Learning and European businesses are also reviewed together as “Educate Services” for financial analysis purposes due to common executive management. Segment revenues and operating income are presented on this basis for all periods.
| | • | | Our Franchise Services segment manages our system of franchised Sylvan Learning territories |
| | • | | Our Catapult Learning segment provides tutoring and other supplemental education services to students in public and private schools through government-funded contracts |
| | • | | Our European segment operates a network of company-owned and franchised centers providing tutoring in Germany and Austria |
| | • | | Our Company-Owned Centers segment manages our network of company-owned Sylvan Learning territories |
| | • | | Our Educate Products segment creates, manufactures, and sells educational products including the Hooked on Phonics early reading, math and study skills programs |
| | • | | Our Progressus segment provides pediatric therapies such as physical, occupational and speech therapies to K-12 children with special education needs under contracts with school districts |
| | • | | Our Educate Online segment provides online tutoring to students in the third through ninth grades |
On August 23, 2006, we completed the sale of our Education Station business, which delivered site-based No Child Left Behind services to public schools. Education Station was a component unit within the Catapult Learning operating segment. On the closing date we also entered into a Technology License Agreement and a Transition Services Agreement with the buyer of Education Station. See Note 2 to our consolidated financial statements for further information regarding these transactions. The operations of Education Station are classified as discontinued operations for all periods presented. On September 20, 2004, we sold our ownership interest in Connections Academy, Inc., which operates virtual public and charter schools for K-8 students to an entity controlled by some of the Company’s investors including our majority shareholder. See Note 2 to our consolidated financial statements for further information regarding these transactions. The operations of Education Station and Connections Academy are classified as discontinued operations for all periods presented.
Our consolidated financial statements reflect our financial position as of December 31, 2006 and 2005, and our results of operations and cash flows for the years ended December 31, 2006, 2005 and 2004.
Merger Agreement
On September 25, 2006 we announced that our Board of Directors had received a nonbinding proposal from a management group led by R. Christopher Hoehn-Saric, our Chairman and Chief Executive Officer, and other investors to acquire all of the Company’s outstanding shares for $8.00 per share in cash.
On January 28, 2007, we entered into a definitive Agreement and Plan of Merger (the “Merger Agreement”) with Edge Acquisition, LLC, a Company affiliated with Sterling Partners and Citigroup Private Equity, and with Mr Hoehn-Saric (the “Merger”). Under the terms of the Merger Agreement, our stockholders will receive $8.00 in cash for each share of Educate common stock they own.
21
Completion of the Merger is subject to customary closing conditions, including, among others, (i) approval by our stockholders, and (ii) the absence of any order or injunction prohibiting the consummation of the Merger. The Company expects the Merger to close in the second quarter of 2007.
The Merger Agreement was filed on a Current Report on Form 8-K filed with the Securities and Exchange Commission on January 29, 2007. The foregoing description of the Merger Agreement is qualified in its entirety by reference to the full text of the Merger Agreement.
Business Strategy
Our goal is to strengthen our position as a leading international provider of tutoring and other supplemental education services and products. Our strategy includes the following elements:
Drive Same Territory Learning Center Growth. We intend to drive same territory growth in revenue and operating income by optimizing the impact of our advertising and marketing campaigns, researching and assisting in the implementation of proven best practices in service, offering competitive pricing and service convenience while expanding our service offerings (i.e. In-Home, Homework Help, and Sylvan Online) to address growing consumer demand.
Expand Our Sylvan Learning Center System. We believe there is significant potential to establish new franchised Sylvan Learning Centers in new territories.
Expand Use of the Sylvan and Hooked on Phonics Brands. We continue to look for opportunities to expand the use of our brands, including potentially licensing them to educational book and software publishers and for other educational products and by developing products and services that appeal to a broader range of customers, including parents of children in the pre-school and early elementary learning levels.
Expand Our Product Offerings. We intend to grow our products business by increasing the number of products offered and expanding our distribution channels.
Expand Use of our Online Services. We intend to grow our Catapult Online business through contracting with additional school districts to provide tutoring to eligible students through government-funded contracts, and to increase the amount of online tutoring delivered through the Sylvan Learning network of franchised and company-owned centers by increasing consumer awareness of this convenient and effective alternative to in-center instruction.
Some of the information contained in this section and elsewhere in this Form 10-K includes forward-looking statements. Our historical and expected financial performance is influenced by several important trends.
| | • | | In our Sylvan Learning Center network, revenues have increased due to several factors. Since January 1, 2000, the number of franchised territories has increased by 126 from 608 to 734 at December 31, 2006, contributing to our revenue growth through licensing fees on the sales of franchise territories and increased royalties. Over the same period, the number of company-owned territories has grown by 129 from 49 to 178, principally through the acquisition of franchisee-owned territories and, to a lesser extent, the opening of new company-owned territories. We actively seek to increase our revenues in existing territories by focusing on key variables, such as advertising response rates, pricing (rate/hour) and frequency (hours/student). Some of the strategies that we have employed include improving the effectiveness of our advertising message, recommending diagnostic tests in multiple subjects, improving our consultative sales processes, enhancing financing options for our customers, offering more convenient and individual focused services, and increasing the frequency of sessions to promote more rapid student progress. |
| | • | | In 2006, we acquired 2 franchise territories, significantly less than the 60 acquired in 2005. Territory acquisitions during 2004 and 2005 were the primary driver of the Company’s revenue growth during that period. While the full year effect of 2005 acquisitions contributed to revenue growth during 2006, the acquisitions made during 2006 will not contribute significantly to future revenue growth. Additionally, we anticipate that due to unfavorable financial results from the integration of newly acquired and opened centers, certain Company-owned territories in targeted markets will be re-franchised to franchisees. This may result in declines in revenue but an increase in operating margin as a percentage of revenue since we will no longer recognize the full revenues and cost of these territories on a consolidated basis but instead will recognize the franchise royalties alone. |
22
| | • | | We have experienced and will continue to experience fluctuations in our same territory sales results. In 2006 our franchisee-owned same territory revenue growth was 1% while our Company-owned same territory revenue decreased by 8%. Both metrics were unfavorable compared to the 2005 increases of 3% and 1% respectively. These declines in 2006 were due primarily to inquiry shortfalls attributable to a less effective marketing campaign, high turnover and limited experience of center directors, fewer average sessions per enrolled student, and operations issues encountered as a result of the rapid growth in the number of Company-owned centers. |
| | • | | In our Catapult Learning segment, our long-standing relationships with our institutional customers and the expansion of our service offerings have been the key drivers of our revenue growth. Although many of our contracts with institutional customers are school-year contracts subject to annual renewal at the option of the institutional customer, we have had and continue to have high rates of repeat business in this segment. For example, 88% of our top 25 clients based on revenue in our school services business line for the 1998-1999 school year have renewed their contracts in each subsequent year and remain our clients through the 2005-2006 school year. These long-standing relationships enable us to market additional services to existing customers without significant incremental sales and marketing expenses. We anticipate that these high levels of contract retention will continue. |
| | • | | Our total revenues have also increased due to selected acquisitions of businesses in addition to franchised territories. Our October 2003 acquisition of Progressus Therapy, a provider of speech, physical and occupational therapy to special needs students, allows us to extend the breadth of services we provide to our institutional customers. In February 2005, we acquired Gateway Learning Corporation, which owned the Hooked on Phonics early reading, math and study skills programs. In April 2006, we acquired rights to Reading Rainbow, a PBS television series, and Great Plains National Instructional Library (“GPN”), a distributor of video and interactive media learning packages. We expect these businesses to contribute to revenue and operating income growth. |
| | • | | Our Educate Products business, including the “Hooked on” line of products, and Reading Rainbow and GPN incurred operating losses during 2006 primarily as a result of shifts in product mix, higher costs of initial production runs of numerous new products developed during 2006, and additional infrastructure costs to prepare the business for future growth. As the Company completes the transition of Hooked on Phonics from a Direct-to-Consumer business to a producer of products sold to retailers, and incorporates its Sylvan and Reading Rainbow brands into its products sold to an increasing number of retailers domestically and internationally, the revenues and operating income of this segment of the business are expected to improve. |
| | • | | In order to properly motivate our employees, we have continued the practice of granting options to our key employees. At the time of our formation, we granted options to purchase 3.4 million shares of our common stock to members of our management team and other key employees. During 2004, we granted 604,000 shares of restricted common stock and options to acquire in the aggregate an additional 374,000 shares of common stock at prices less than the estimated fair value of our common stock. Therefore, during 2004 we incurred $8.5 million in non-cash stock compensation expense related to options and restricted common stock that vested immediately upon issuance. We granted these shares of restricted common stock and options in recognition of the service of members of our management team leading up to the offering. Additionally, in the normal course of business we issued options to employees that will vest over a period of three to four years. The intrinsic value of options at the date of grant as well as the fair value of options granted subsequent to the Company’s initial public offering are currently being expensed over the related vesting period, which resulted in $1.0 million in non-cash stock compensation in 2006. See Note 9 to our consolidated financial statements. We intend to make future grants of stock and stock options to our key employees. |
Our revenues and operating income are characterized by significant seasonal fluctuations. See “Seasonality and Other Quarterly Fluctuations” below.
Components of Revenues and Expenses
Revenues. We operate through seven business segments that offer supplemental education services or products from which we earn revenues. Our Company-Owned Center segment earns revenues principally by tutoring students in our company-owned learning centers. Our Franchise Services segment revenue consists principally of monthly Sylvan Learning Centers franchise royalty fees, and also includes licensing fees for the sales of franchise territories, standardized test preparation revenue from our Ivy West brand and product sales revenues from the sale of Sylvan learning programs and related materials to franchised territories. European revenues consist primarily of revenues from tutoring students in our company-owned learning centers, royalties earned from franchisee-owned centers, sales of franchise territories and through the sale of educational products in Europe. Our Educate Products segment sales consist primarily of sales of the Hooked on Phonics, Reading Rainbow and Sylvan brands of products. These products are sold both direct to the consumer and through retail establishments. Our Catapult Learning and Progressus segments earn revenue principally from school-year contracts to provide supplemental remedial instruction and therapy services to public and non-public schools.
23
Our revenue recognition policies are discussed more fully in the section below entitled “Critical Accounting Policies and Estimates” and in Note 1 to our consolidated financial statements. In order to provide a more meaningful basis for comparison, in our Franchise Services and Company-Owned Center segments, we focus primarily on same territory revenue growth as this is the metric that best measures our success in reaching our customers in a specific geographic territory, particularly in light of our emphasis on providing convenient services to our customers. Providing convenient services often requires increasing the locations of service delivery, expanding service hours and days, and developing in home tutoring options including online tutoring.
Instructional and Franchise Operations Costs. In our Company-Owned Center and European segments, instructional and franchise operations costs include company-owned territory and center operating costs, principally comprised of labor costs for instructors and center management personnel, facility rent expense and instructional materials and supplies. From our Franchise Services segment we also include in this caption the costs of managing our extensive network of franchised territories, which consists principally of labor costs. In our Catapult Learning, Progressus and Online segments, instructional costs consist primarily of labor costs to provide our services. In our Educate Products segment, instructional and franchise operations costs consist primarily of labor costs to provide production, distribution, and operational support to our products business.
Marketing and Advertising. We incur significant marketing and advertising costs to market our services to our customers in each segment. These costs are expensed when incurred.
Cost of Goods Sold. Cost of goods sold includes the materials and production cost of inventory sold during the period as well as shipping and distribution costs of the products. Cost of goods sold also includes the amortization of copyrights and the costs of computer software and media developed for sale to third parties.
Depreciation and Amortization. Depreciation and amortization are the expenses we record each period from depreciating our property and equipment over estimated useful lives that generally range from two to ten years. We also amortize certain intangible assets that we acquired over periods ranging from one to twenty-five years.
General and Administrative Expenses. Our general and administrative expenses are general management and related administrative costs that we incur to manage our segments. These costs consist of labor costs associated with our executive, accounting, human resource, legal and information technology staffs. Also included in general and administrative expenses are professional fees, insurance and rent associated with our centralized management functions. We do not allocate expenses incurred by corporate, such as general and administrative costs and corporate depreciation and amortization, to our segments when determining operating income from reportable segments.
Interest Expense. Interest expense consists principally of interest expense related to the term loan and revolving credit facility that we have entered into to finance our operating and working capital requirements.
Other Financing Costs. Other financing costs are comprised of costs associated with obtaining debt financing that have been charged to expense upon the refinancing of the related debt or the determination that the debt financing will not be consummated.
Income Tax Expense. We incur federal and state income tax expense related to our consolidated domestic operations and our operations in Europe that are taxed principally in Germany.
Loss From Discontinued Operations. On August 23, 2006, we completed the sale of our Education Station business, which delivered site-based No Child Left Behind services to public schools. Education Station was a component unit within the Catapult Learning operating segment. In September 2004, we sold our ownership interest in Connections Academy, Inc. to an ownership group including certain of our existing stockholders. We will have no ongoing involvement with either business. Accordingly, we have classified the operating results of Education Station and Connections Academy as a separate component of our consolidated operating results in our financial statements for all periods presented. See Note 2 to our consolidated financial statements for additional information about Education Station and Connections Academy and our accounting policies in connection with the sale of these businesses.
Our revenues and operating income are characterized by significant seasonal fluctuations as described below.
24
Seasonality and Other Quarterly Fluctuations
The following table sets forth selected information related to seasonality and other quarterly fluctuations:
| | | | | | | | | | | | | | | | | | | | | | | | | | | | | | | | |
| | | 2006 | | | 2005 | |
| (Dollars in millions) | | First
Quarter | | | Second
Quarter | | | Third
Quarter | | | Fourth
Quarter | | | First
Quarter | | | Second
Quarter | | | Third
Quarter | | | Fourth Quarter | |
| | | | | | (Restated) | | | (Restated) | | | | | | | | | | | | | | | | |
Revenues: | | | | | | | | | | | | | | | | | | | | | | | | | | | | | | | | |
Franchise Services | | $ | 17.3 | | | $ | 16.7 | | | $ | 13.8 | | | $ | 11.9 | | | $ | 17.0 | | | $ | 17.8 | | | $ | 14.8 | | | $ | 12.8 | |
Catapult Learning | | | 20.1 | | | | 21.2 | | | | 11.2 | | | | 21.0 | | | | 20.3 | | | | 20.2 | | | | 8.4 | | | | 18.7 | |
European | | | 8.8 | | | | 9.5 | | | | 8.1 | | | | 8.7 | | | | 8.2 | | | | 8.2 | | | | 6.8 | | | | 7.1 | |
Company-Owned Centers | | | 35.9 | | | | 41.7 | | | | 39.4 | | | | 26.8 | | | | 28.2 | | | | 36.1 | | | | 41.5 | | | | 28.9 | |
Progressus | | | 6.1 | | | | 5.4 | | | | 4.3 | | | | 6.2 | | | | 4.8 | | | | 5.0 | | | | 3.6 | | | | 5.2 | |
Educate Products | | | 2.7 | | | | 1.8 | | | | 9.9 | | | | 3.8 | | | | 5.1 | | | | 7.3 | | | | 6.4 | | | | 4.8 | |
Educate Online | | | 5.0 | | | | 6.1 | | | | 1.3 | | | | 1.9 | | | | 1.2 | | | | 1.0 | | | | 0.3 | | | | 1.4 | |
Eliminations | | | (3.0 | ) | | | (3.4 | ) | | | (3.2 | ) | | | (2.4 | ) | | | (2.3 | ) | | | (2.9 | ) | | | (3.3 | ) | | | (2.3 | ) |
| | | | | | | | | | | | | | | | | | | | | | | | | | | | | | | | |
Total revenues | | $ | 92.9 | | | $ | 99.0 | | | $ | 84.8 | | | $ | 77.9 | | | $ | 82.5 | | | $ | 92.7 | | | $ | 78.5 | | | $ | 76.6 | |
Percentage of annual revenues | | | 26 | % | | | 28 | % | | | 24 | % | | | 22 | % | | | 25 | % | | | 28 | % | | | 24 | % | | | 23 | % |
Operating income (loss) | | $ | 5.9 | | | $ | 10.5 | | | $ | 1.8 | | | $ | (12.3 | ) | | $ | 12.6 | | | $ | 22.3 | | | $ | 10.3 | | | $ | 0.4 | |
Income (loss) from continuing operations | | $ | 1.4 | | | $ | 4.4 | | | $ | (3.8 | ) | | $ | (10.6 | ) | | $ | 6.8 | | | $ | 11.7 | | | $ | 5.2 | | | $ | (1.7 | ) |
Like other companies that provide tutoring and other supplemental education services and products, we are subject to seasonality in our revenue streams that can affect our results of operations. This seasonality arises from a number of factors, primarily driven by the timing of school semester cycles. Our quarterly results are also affected by our license agreements with franchisees that require the payment of royalties to us based on a percentage of their cash receipts, a significant portion of which consist of prepayments by customers for services to be provided by our franchisees more than a month in the future.
First Quarter. In our Company-Owned Centers segment, we generally experience increased enrollments as a result of the initiation of more intensive advertising and increased parental focus on their children’s performance associated with the receipt of academic results from the first part of the school year. In our Franchise Services segment our royalties increase as our franchisees begin to receive advance payment for services to be provided during the second half of the school year. Our Educate Products segment may experience a slowdown in revenue due to softness in retailers’ sales in this post holiday period. In our Catapult Learning, Progressus, and Educate Online segments, we deliver services under school-based programs during this quarter.
Second Quarter. In our Sylvan Learning Center network, we generally experience a higher level of revenues as we benefit from our continued investment in advertising, delivery of services in our company-owned territories and increased receipts of franchise royalties due to prepayment for summer programs. In our Catapult Learning segment, we complete delivery of our institutional services in conjunction with the ending of the school year. The Educate Online segment experiences its highest quarterly revenue of the year as the sessions delivered to students under Catapult Online increase with the number of active school district programs during the quarter.
Third Quarter. The third quarter is a significant service delivery period in our Sylvan Learning Centers. We recognize revenue as we deliver these services in our company-owned territories. However, with respect to our franchised territories, our royalties decline as the cash receipts our franchisees receive from their customers decline from peak second quarter levels. Our product sales are expected to modestly increase in this quarter as retailers purchase more educational products in preparation for back to school sales. Due to summer recess, we provide limited summer school services in our Catapult Learning segment during this period, which results in the lowest segment revenue for the year. However, we gain visibility for the upcoming year because the majority of our institutional contracts are renewed during the third quarter. In our Educate Online segment, the second half of the year generally reflects an emphasis on marketing and student enrollment activities within Catapult Online, resulting in the lowest quarterly revenue activity of the year.
Fourth Quarter. In our Company-Owned Centers segment, enrollments are at their lowest levels of the year as a result of lower advertising expenditures, students taking a greater number of vacations during the holiday season and parental optimism towards their children’s improved school performance associated with the beginning of a new school year. In addition, we experience lower
25
revenues from franchise royalties in the fourth quarter as a result of prepayments by our franchisees’ customers in earlier quarters. In our products business, we believe that we may experience relatively higher revenues in this quarter due to new product introductions and as retailers restock in expectation of higher sales during the holiday period. The period reflects increased revenues in Catapult Learning and Progressus as schools are back in session and programs begin.
Other. The timing of school year services, advertising spending, critical enrollment periods, changes in consumer behavior, and new product introductions can affect our revenues at any time during the year.
As a result of the foregoing factors, we believe that quarter-to-quarter comparisons of our results of operations may not be a fair indicator and should not be relied upon as a measure of our future performance.
26
Results of Operations
Comparison of results for the years ended December 31, 2006 and 2005.
| | | | | | | | | | | |
| | | Year ended December 31, | | | | |
| | | 2006 | | | 2005 | | | % Increase
(Decrease) | |
| | | (Dollars in millions) | | | | |
Revenues | | | | | | | | | | | |
Franchise Services (1) | | $ | 59.7 | | | $ | 62.4 | | | (4 | )% |
Catapult Learning | | | 73.5 | | | | 67.7 | | | 9 | % |
European | | | 35.1 | | | | 30.3 | | | 16 | % |
| | | | | | | | | | | |
Total Educate Services | | | 168.3 | | | | 160.4 | | | 5 | % |
Company-Owned Centers | | | 143.8 | | | | 134.7 | | | 7 | % |
Educate Products | | | 18.2 | | | | 23.7 | | | (23 | )% |
Progressus | | | 22.0 | | | | 18.5 | | | 19 | % |
Educate Online | | | 14.3 | | | | 3.9 | | | 267 | % |
Eliminations (1) | | | (11.9 | ) | | | (10.8 | ) | | 10 | % |
| | | | | | | | | | | |
Total | | $ | 354.7 | | | $ | 330.4 | | | 7 | % |
| | | | | | | | | | | |
| | | |
Business Metrics | | | | | | | | | | | |
Sylvan Learning same territory revenue growth: (2) | | | | | | | | | | | |
Franchise Services | | | 1 | % | | | 3 | % | | | |
Company-Owned Centers | | | (8 | )% | | | 1 | % | | | |
Number of Sylvan Learning Territories as of December 31: | | | | | | | | | | | |
Franchisee-owned | | | 734 | | | | 725 | | | 1 | % |
Company-owned | | | 178 | | | | 171 | | | 4 | % |
| | | | | | | | | | | |
Total | | | 912 | | | | 896 | | | 2 | % |
| | | | | | | | | | | |
Number of Sylvan Learning Centers as of December 31: | | | | | | | | | | | |
Franchisee-owned | | | 883 | | | | 876 | | | 1 | % |
Company-owned | | | 251 | | | | 245 | | | 2 | % |
| | | | | | | | | | | |
Total | | | 1,134 | | | | 1,121 | | | 1 | % |
| | | | | | | | | | | |
| (1) | Franchise Services revenue includes intercompany royalty and other service fees from Company-Owned Centers segment to Franchise Services segment of $11.9 million and $10.8 million during the years ended December 31, 2006 and 2005, respectively. The “eliminations” line presents the elimination of intercompany transactions in consolidation. |
| (2) | “Same Territory” amounts, for both company-owned and franchised territories, include the results of territories for the identical months for each period presented in the comparison, commencing with the 13th full month the territory has been operating as either a company-owned or franchised territory, as the case may be. Same territory growth is presented as the aggregate growth for franchise or company-owned territory, as the case may be, during the period. Franchise Services revenue includes royalties and other services revenue earned in the territories. A territory reflects the geographically specified area where an operator controls rights to provision of services under the Sylvan franchise agreement. |
Revenues. Revenues from continuing operations for the year increased 7% to $354.7 million, driven primarily by growth in the Catapult Learning, Company-Owned Centers, Educate Online and European business segments. The Sylvan Learning network of franchised and Company-owned locations experienced a net increase of 16 territories during the year. Franchisees utilized experience from their longer tenure in the Sylvan system to counteract weaker marketing results and were able to generate same territory revenue growth of 1% for the year. The shorter tenured directors of Company-owned centers, particularly in recently acquired territories, were not as successful in counteracting weaker marketing results in Company-owned territories. Sylvan Company-owned territories experienced 8% same territory revenue declines as a result of lower enrollments entering the year, inquiry declines in 2006 and a shorter average length of stay of enrolled students. Margin declines were compounded by increased district and regional expenses as well as additional costs incurred in testing of new service concepts for in-home tutoring and homework support.
The increase in revenue during the year ended December 31, 2006 of $24.3 million compared to the same period of the prior year was due to growth in the Educate Online segment of $10.4 million, the Catapult Learning segment of $5.8 million, theCompany-Owned Centers segment of $9.1 million, the Progressus segment of $3.5 million, and the European segment of $4.8 million, offset by a decline in Educate Products of $5.5 million and Franchise Services of $2.7 million. Revenue eliminations increased by $1.1 million.
27
Franchise Services— North American franchise services revenues declined by $2.7 million due primarily to a decrease in product sales compared to the prior year. Sales of the Beginning Reading and Study Skills educational programs that were released to the Sylvan Learning network in 2005 decreased by $3.6 million from the prior year. This decrease was partially offset by same territory revenue growth of 1% and an increase of 16 in the number of Sylvan Learning territories as of December 31, 2006 compared to the prior year.
Catapult Learning— Catapult Learning’s $5.8 million revenue increase was due primarily to an increase in Title I, Summer School, and Title IIA Professional Development programs. This increase related to both contract value and an increase in the number of students served. Revenue from Title I private and religious schools increased $4.3 million because of increases in funding from several existing markets such as Milwaukee, New Orleans and Chicago. Also, Summer School program revenue increased $1.2 million due to a new contract in the U.S. Virgin Islands. Catapult also concentrated on a new product line in 2006 which resulted in $1.0 million in new business. The new product line delivers professional development programs to private and religious school instructors. Catapult’s revenue increases were offset by losses in the Career Starter program primarily due to lost funding and in the Early Childhood business where several former Catapult managed programs began to be managed by the school districts.
European— European revenues, which include both company-owned and franchise territory results, increased $4.8 million. The increase was due primarily to increased enrollment and growth in the number of Company-owned and franchised centers. Total franchise revenues grew 16.6% due to the number of franchised centers increasing by 45 to 816, royalties growing by 15% and franchise fees by 30%. Other franchise revenues including merchandise sales and seminars increased by 14%. Total Company-owned center revenues grew by 14.8% primarily because of the opening of 21 new corporate centers. Same center revenue grew by 7% and the average revenue per student increased by 1% in 2006.
Company-Owned Centers— Revenues from Company-owned territories increased approximately $9.1 million compared to the prior year. Of this revenue increase, $17.3 million was generated by the full year impact of the 60 franchised territories acquired during 2005, $1.6 million from the partial year impact of 3 franchised territories acquired in 2006 and $3.4 million from 14 startup centers opened in 2006. These gains were partially offset by a $13.2 million revenue decrease in existing centers due to flat student counts and a decline in revenue per new enrollment.
Educate Products—Revenues declined by 23% to $18.2 million during 2006 primarily because we modified our distribution channel mix and experienced delays in developing and selling through new products into new channels.
Progressus— Revenue for Progressus increased 19% to $22.0 million during the year which was primarily due to an increased number of therapists fulfilling school outsource needs combined with higher overall billing rates. The average bill rate increased $4 per hour and an additional 33,000 hours were billed in 2006 compared to 2005. Some factors contributing to this net increase were the growth of new markets previously not served, and the increase in bill rate with several long-time clients to competitive market standards. In addition, Progressus recognized $0.4 million of revenue from a summer pilot program. The program was a partnership with a local school district to provide compensatory speech and language pathology and occupational therapy services in a collaborative service delivery model to address children’s Individual Education Plan goals.
Educate Online— The $10.4 million increase in revenue during the year ended December 31, 2006 compared to the same period of the prior year was primarily due to growth in the Catapult Online channel. During the later part of 2004 we initiated a sales strategy to offer the Catapult Online program in multiple districts throughout the country for the 2005-2006 school year. The result of this sales strategy was an increase of $9.6 million in revenue in the Catapult Online channel. Additionally, commencing in April 2005 we made the Sylvan Online program available to Sylvan Learning Centers and this channel’s revenue growth from inception was $0.8 million for the year.
28
| | | | | | | | | | | |
| | | Years ended December 31, | | | | |
| | | 2006 | | | 2005 | | | % Increase
(Decrease) | |
| | | (Dollars in millions) | | | | |
Segment Operating Costs | | | | | | | | | | | |
Franchise Services | | $ | 24.1 | | | $ | 26.0 | | | (7 | )% |
Catapult Learning | | | 60.2 | | | | 52.9 | | | 14 | % |
European | | | 29.2 | | | | 24.9 | | | 17 | % |
| | | | | | | | | | | |
Total Educate Services | | | 113.5 | | | | 103.8 | | | 9 | % |
Company-Owned Centers (1) | | | 156.8 | | | | 131.1 | | | 20 | % |
Educate Products | | | 31.7 | | | | 18.2 | | | 74 | % |
Progressus | | | 21.3 | | | | 18.4 | | | 16 | % |
Educate Online | | | 17.7 | | | | 7.7 | | | 130 | % |
Eliminations (1) | | | (11.9 | ) | | | (10.8 | ) | | 10 | % |
| | | | | | | | | | | |
Total Segment Operating Costs | | $ | 329.1 | | | $ | 268.4 | | | 23 | % |
| | | |
Segment Operating Income | | | | | | | | | | | |
Franchise Services | | $ | 35.6 | | | $ | 36.4 | | | (2 | )% |
Catapult Learning | | | 13.3 | | | | 14.8 | | | (10 | )% |
European | | | 5.9 | | | | 5.4 | | | 9 | % |
| | | | | | | | | | | |
Total Educate Services | | | 54.8 | | | | 56.6 | | | (3 | )% |
Company-Owned Centers | | | (13.0 | ) | | | 3.6 | | | (461 | )% |
Educate Products | | | (13.5 | ) | | | 5.5 | | | (345 | )% |
Progressus | | | 0.7 | | | | 0.1 | | | 600 | % |
Educate Online | | | (3.4 | ) | | | (3.8 | ) | | (11 | )% |
| | | | | | | | | | | |
Total Segment Operating Income | | $ | 25.6 | | | $ | 62.0 | | | (59 | )% |
| | | |
Corporate Expenses | | | | | | | | | | | |
Corporate depreciation and amortization expenses | | $ | 1.6 | | | $ | 1.6 | | | 0 | % |
General and administrative expenses | | | 18.1 | | | | 14.7 | | | 23 | % |
Interest expense, net | | | 12.4 | | | | 7.4 | | | 68 | % |
Other financing costs | | | 1.1 | | | | 1.5 | | | (27 | )% |
Foreign exchange (gains) losses and other | | | 0.5 | | | | 0.1 | | | 400 | % |
Income tax expense | | | 0.6 | | | | 14.7 | | | (96 | )% |
| | | | | | | | | | | |
Total Corporate Expenses | | | 34.3 | | | | 40.0 | | | (14 | )% |
| | | | | | | | | | | |
Income from continuing operations | | $ | (8.7 | ) | | $ | 22.0 | | | (140 | )% |
| | | | | | | | | | | |
| | | |
Business Metrics | | | | | | | | | | | |
Segment Operating Margin (2) | | | | | | | | | | | |
Franchise Services | | | 60 | % | | | 58 | % | | | |
Catapult Learning | | | 18 | % | | | 22 | % | | | |
European | | | 17 | % | | | 18 | % | | | |
Company-Owned Centers | | | (9 | )% | | | 3 | % | | | |
Educate Products | | | (74 | )% | | | 23 | % | | | |
Progressus | | | 3 | % | | | 1 | % | | | |
Educate Online | | | (24 | )% | | | (97 | )% | | | |
| (1) | Company-Owned Centers operating costs includes intercompany royalty and other service fees from Company-Owned Centers segment to Franchise Services segment of $11.9 million and $10.8 million during the years ended December 31, 2006 and 2005, respectively. The “eliminations” line presents the elimination of intercompany transactions in consolidation. |
| (2) | Segment operating margin is calculated by dividing segment operating income by segment revenue. |
29
Segment Operating Income. While Educate Services revenues increased 5% to $168.3 million, the overall business demonstrated a decline in operating income of 3% from $56.6 million in 2005 to $54,8 million in 2006 due to the decrease in franchise service revenues resulting from a decrease in product sales and the storm-related loss of 2005 – 2006 school year Catapult contracts in New Orleans.
The decrease in segment operating income during the year ended December 31, 2006 of $36.4 million compared to the same period of the prior year was due to declines in Educate Products of $19 million, theCompany-owned centers segment of $16.6 million, the Catapult Learning segment of $1.5 million and the Franchise Services segment of $0.8 million, offset by increases in the Progressus segment of $0.6 million, the European segment of $0.5 million, and the Educate Online segment of $0.4 million.
Franchise Services— Segment operating income decreased by $0.8 million primarily due to the total revenue decline of $2.7 million. The revenue decline was due to declines in product sales.
Catapult Learning— Segment operating income decreased $1.5 million due, in part, to the establishment of a full time sales and marketing group for private and religious services. The increase in costs related to sales and marketing was $1.1 million. Other costs increased relative to Catapult’s revenue increase, including $6.1 million in labor related costs and $0.2 million in bad debt expense.
European— Segment operating income increased $0.5 million, or 9%. The increase was primarily due to revenue growth of $4.8 million, offset by increases in operating expenses $4.3 million primarily in company-owned centers. Expense increases included quality management, field management, development of programs for German universities, and testing of new service offerings such as tutoring at home.
Company-Owned Centers— Segment operating income decreased by $16.5 million. The year-over-year decline in profitability is primarily the result of initial startup costs associated with new center openings, investment in additional infrastructure to support the growing center base and additional investments in consumer research, product development and customer satisfaction initiatives. Shorter tenured directors of Company-owned centers, particularly in recently acquired territories, were not as successful in counteracting weaker marketing results in Company-owned territories. Sylvan Company-owned territories experienced 8% same territory revenue declines as a result of lower enrollments entering the year, inquiry declines in 2006 and a shorter average length of stay of enrolled students. Margin declines were compounded by increased district and regional expenses as well as additional costs incurred in testing of new service concepts for in home tutoring and homework support.
Continuing its focus on maximizing service delivery throughout the entire Sylvan network, management has evaluated all Company-owned territories and has concluded that greater focus in specifically targeted geographical areas is necessary to maximize system revenue potential and to efficiently manage Company-owned operations. Therefore, it is anticipated that selected Company-owned territories in targeted markets will be re-franchised to franchisees that will apply best practices in center operations.
Educate Products—Educate Products operating income decreased by $19.0 million. Increased infrastructure costs to expand production and distribution, delays in the development and sell through of new products into new distribution channels, as well as a dramatic increase in the development costs for new products combined to result in a significant decline in operating performance for the Products business.
Progressus—Operating income increased $0.6 million compared to the prior year. This increase is primarily related to the $3.5 million increase in revenue in the current year. Offsetting revenue were increased operating costs of $2.8 million that can primarily be attributed to higher wage costs associated with the 33,000 additional hours worked. Increased operating costs also resulted from an increased focus on quality control including therapist continuing education opportunities and an increased focus on marketing efforts to improve recruiting of therapists.
30
Educate Online— Educate Online’s operating loss decreased by $0.4 million, or 11%, in the year ended December 31, 2006 compared to the prior year. The decreased loss is primarily related to the focusing on two new distribution channels which provided significant revenue growth. These new distribution channels incurred program specific costs related to the higher session volumes, marketing and advertising costs as well as certain costs related to start-up.
Corporate Expenses— Corporate general and administrative and depreciation and amortization expenses increased to $19.7 million for the year ended December 31, 2006 from $16.3 million in 2005, primarily to support the expansion of the business. Net interest expense increased by $5.0 million, which was primarily a result of higher debt levels and higher short-term interest rates on the credit facility. Other financing costs decreased by $0.4 million due to fewer costs attributable to the credit facility debt refinanced in 2006 compared to debt refinanced in 2005. Our income tax expense decreased to $0.6 million for the year ended December 31, 2006 from $14.7 million in 2005, due to a pretax loss in 2006, partially offset by a higher effective tax rate in 2006. Also, during the third quarter we recorded a valuation allowance of approximately $1.7 million to fully reserve certain historical net state deferred tax assets due to uncertainty surrounding the future realization of these state tax benefits because of declines in operating results. Excluding this discrete tax charge, our annual effective tax rate increased to 46% for the year ended December 31, 2006 compared to 38% for the year ended December 31, 2005. The increase is primarily due to not recording the tax benefit of pretax losses in certain states due to the uncertain realization of those benefits, the effect of permanent tax differences on lower pretax earnings, the mix of domestic and international pretax income, and state tax law changes.
31
Comparison of results for the years ended December 31, 2005 and 2004.
| | | | | | | | | | | |
| | | Year ended December 31, | | | | |
| | | 2005 | | | 2004 | | | % Increase
(Decrease) | |
| | | (Dollars in millions) | | | | |
Revenues | | | | | | | | | | | |
Franchise Services (1) | | $ | 62.4 | | | $ | 59.0 | | | 6 | % |
Catapult Learning | | | 67.7 | | | | 72.2 | | | (6 | )% |
European | | | 30.3 | | | | 27.5 | | | 10 | % |
| | | | | | | | | | | |
Total Educate Services | | | 160.4 | | | | 158.7 | | | 1 | % |
Company-Owned Centers | | | 134.7 | | | | 100.3 | | | 34 | % |
Educate Products | | | 23.7 | | | | — | | | — | |
Progressus | | | 18.5 | | | | 19.2 | | | (4 | )% |
Educate Online | | | 3.9 | | | | 2.9 | | | 34 | % |
Eliminations (1) | | | (10.8 | ) | | | (8.0 | ) | | 35 | % |
| | | | | | | | | | | |
Total | | $ | 330.4 | | | $ | 273.1 | | | 21 | % |
| | | | | | | | | | | |
| | | |
Business Metrics | | | | | | | | | | | |
Sylvan Learning same territory revenue growth: (2) | | | | | | | | | | | |
Franchise Services | | | 3 | % | | | 1 | % | | | |
Company-Owned Centers | | | 1 | % | | | 2 | % | | | |
Number of Sylvan Learning Territories as of December 31: | | | | | | | | | | | |
Franchisee-owned | | | 725 | | | | 738 | | | (2 | )% |
Company-owned | | | 171 | | | | 111 | | | 54 | % |
| | | | | | | | | | | |
Total | | | 896 | | | | 849 | | | 6 | % |
| | | | | | | | | | | |
Number of Sylvan Learning Centers as of December 31: | | | | | | | | | | | |
Franchisee-owned | | | 876 | | | | 896 | | | (2 | )% |
Company-owned | | | 245 | | | | 163 | | | 50 | % |
| | | | | | | | | | | |
Total | | | 1,121 | | | | 1,059 | | | 6 | % |
| | | | | | | | | | | |
| (1) | Franchise Services revenue includes intercompany royalty from Company-Owned Centers segment to Franchise Services segment of $10.8 million and $8.0 million during the years ended December 31, 2005 and 2004, respectively. The “eliminations” line presents the elimination of intercompany transactions in consolidation. |
| (2) | “Same Territory” amounts, for both company-owned and franchised territories, include the results of territories for the identical months for each period presented in the comparison, commencing with the 13th full month the territory has been operating as either a company-owned or franchised territory, as the case may be. Same territory growth is presented as the aggregate growth for franchise or company-owned territory, as the case may be, during the period. Franchise Services revenue includes royalties and other services revenue earned in the territories. A territory reflects the geographically specified area where an operator controls rights to provision of services under the Sylvan franchise agreement. |
Revenues. Revenues for the year increased 21% over the same period in 2004 to $330.4 million, driven primarily by growth in the Company-Owned Centers and Educate Products segments. Revenue growth during the year was fueled by the acquisition of 60 franchise territories, expanding the scope and distribution of Hooked on Phonics educational programs and expansion of the Learning Center network by 47 territories. During the first half of 2005, the company experienced solid same territory revenue growth and strong growth in total revenues. During the second half of the year, overall revenue growth remained strong; however, the company experienced a slowdown in the learning center business. Additionally, integration problems experienced in recently acquired territories resulted in lower than expected enrollments.
The increase in revenue during the year ended December 31, 2005 of $57.3 million, compared to the prior year, was due to growth in the Company-Owned Centers segment of $9.1 million, Educate Products of $23.7 million, Franchise Services of $3.4 million, the European segment of $2.8 million and the Educate Online segment of $1.0 million, offset by a decline in the Catapult Learning segment of $4.5 million, and the Progressus segment of $0.7 million. Revenue eliminations increased by $2.8 million.
32
Franchise Services— Franchise Services revenues increased by $3.4 million over the prior year due primarily to an increase in product sales of $2.9 million. Two new educational programs were released to the Sylvan Learning network in 2005. Sales of the Beginning Reading and Study Skills programs were the largest contributors to this increase. The remaining increase was primarily due to same territory revenue growth of 1% for franchised territories.
Catapult Learning— Catapult Learning revenues decreased by $4.5 million. This was caused primarily by a decrease in the number of summer school, Early Childhood, and Career Starter programs provided by Catapult. Several west coast public school contracts did not renew during the school year, resulting in a reduction in revenue of $1.6 million. Several local school districts also decided to provide Early Childhood services themselves which had previously been provided by Catapult. This resulted in a reduction in Catapult revenue of $2.2 million. In addition, funding for several Career Starter programs was discontinued in 2005, resulting in a reduction of revenue of $0.7 million between 2005 and 2004.
European— European revenues, which include both company-owned and franchised territories, increased $2.8 million over the prior year. The revenue increase was due primarily to increases in enrollment across both company-owned and franchised territories. Total company-owned center revenue grew by 10.3% due mainly to the opening of 15 new centers. Same center revenue grew by 6% and the average revenue per student increased by 3% in 2005. Total franchise revenue grew by 17.4% and was due mainly to an increase in the number of franchised centers by 33 in 2005. Franchise royalties grew by 15% and franchise fees grew by 36% in 2005. Other franchise revenues, including merchandise sales and seminars, increased by 33%. Foreign currency exchange rate movements during the year had minimal impact on revenues.
Company-Owned Centers—Revenues from company-owned territories increased approximately $34.4 million primarily as a result of the acquisition of 60 franchised territories during 2005. Same territory revenue growth was 1% in 2005, down from 2% in the prior year. Integration problems experienced in recently acquired territories resulted in lower than expected enrollments.
Educate Products—Net product sales grew $23.7 million primarily as a result of the acquisition of Hooked on Phonics programs and services, which we acquired during the first quarter of 2005.
Progressus— Revenues decreased 4%, or $0.7 million, compared to the prior year due primarily to a lower average number of therapists and billable hours during the first half of the year.
Educate Online—The $1.0 million increase in revenue during the year ended December 31, 2005 compared to the prior year was primarily due to growth in the Catapult Online channel of $2.9 million and an increase in Sylvan Online revenues of $0.3 million. This was offset by a decline in eSylvan revenues as we ceased marketing our services directly to customers in April 2005 when we launched Sylvan Online.
33
| | | | | | | | | | | |
| | | Years ended December 31, | | | | |
| | | 2005 | | | 2004 | | | % Increase
(Decrease) | |
| | | (Dollars in millions) | | | | |
Segment Operating Costs | | | | | | | | | | | |
Franchise Services | | $ | 26.0 | | | $ | 22.1 | | | 18 | % |
Catapult Learning | | | 52.9 | | | | 56.0 | | | (6 | )% |
European | | | 24.9 | | | | 22.7 | | | 10 | % |
| | | | | | | | | | | |
Total Educate Services | | | 103.8 | | | | 100.8 | | | 3 | % |
Company-Owned Centers (1) | | | 131.1 | | | | 92.6 | | | 42 | % |
Educate Products | | | 18.2 | | | | — | | | — | |
Progressus | | | 18.4 | | | | 19.4 | | | (5 | )% |
Educate Online | | | 7.7 | | | | 7.3 | | | 5 | % |
Eliminations (1) | | | (10.8 | ) | | | (8.0 | ) | | 35 | % |
| | | | | | | | | | | |
Total Segment Operating Costs | | $ | 268.4 | | | $ | 212.1 | | | 27 | % |
Segment Operating Income | | | | | | | | | | | |
Franchise services | | $ | 36.4 | | | $ | 36.9 | | | (1 | )% |
Catapult Learning | | | 14.8 | | | | 16.2 | | | (9 | )% |
European | | | 5.4 | | | | 4.8 | | | 13 | % |
| | | | | | | | | | | |
Total Educate Services | | | 56.6 | | | | 57.9 | | | (2 | )% |
Company-Owned Centers | | | 3.6 | | | | 7.7 | | | (53 | )% |
Educate Products | | | 5.5 | | | | — | | | — | |
Progressus | | | 0.1 | | | | (0.2 | ) | | (150 | )% |
Educate Online | | | (3.8 | ) | | | (4.4 | ) | | (14 | )% |
| | | | | | | | | | | |
Total Segment Operating Income | | $ | 62.0 | | | $ | 61.0 | | | 2 | % |
Corporate Expenses | | | | | | | | | | | |
Corporate depreciation and amortization expenses | | $ | 1.6 | | | $ | 1.7 | | | (6 | )% |
General and administrative expenses | | | 14.7 | | | | 21.1 | | | (30 | )% |
Interest expense, net | | | 7.4 | | | | 9.4 | | | (21 | )% |
Other financing costs | | | 1.5 | | | | 5.4 | | | (72 | )% |
Foreign exchange (gains) and other | | | 0.1 | | | | (1.2 | ) | | (108 | )% |
Income tax expense | | | 14.7 | | | | 11.1 | | | 32 | % |
| | | | | | | | | | | |
Total Corporate Expenses | | | 40.0 | | | | 47.5 | | | (16 | )% |
| | | | | | | | | | | |
Income from continuing operations | | $ | 22.0 | | | $ | 13.5 | | | 63 | % |
| | | | | | | | | | | |
Business Metrics | | | | | | | | | | | |
Segment Operating Margin (1) | | | | | | | | | | | |
Franchise Services | | | 58 | % | | | 63 | % | | | |
Catapult Learning | | | 22 | % | | | 22 | % | | | |
European | | | 18 | % | | | 17 | % | | | |
Company-Owned Centers | | | 3 | % | | | 8 | % | | | |
Educate Products | | | 23 | % | | | — | | | | |
Progressus | | | 1 | % | | | (1 | )% | | | |
Educate Online | | | (97 | )% | | | (152 | )% | | | |
| (1) | Company-Owned Centers operating costs includes intercompany royalty from Company-Owned Centers segment to Franchise Services segment of $10.8 million and $8.0 million during the years ended December 31, 2005 and 2004, respectively. The “eliminations” line presents the elimination of intercompany transactions in consolidation. |
| (2) | Segment operating margin is calculated by dividing segment operating income by segment revenue. |
34
Segment Operating Income. The increase in segment operating income during the year ended December 31, 2005 of $1.0 million compared to the same period of the prior year was due to increases in Educate Products of $5.5 million, the European segment of $0.6 million, the Educate Online segment of $0.6 million, and the Progressus segment of $0.3 million; offset by decreases in theCompany-owned centers segment of $4.1 million, the Catapult Learning segment of $1.4 million and the Franchise Services segment of $0.5 million.
Franchise Services— Segment operating income decreased by $0.5 million in 2005 compared to 2004. The increase in revenue attributable to the low margin educational program sales did not yield sufficient incremental gross margin to overcome the increase in costs to develop new programs and services and to deliver services in our Ivy West business.
Catapult Learning— Segment operating income decreased $1.4 million due to the loss of contracts in our summer school and early childhood programs. The income reduction was due, in part, to a reduction in summer school program income of $1.3 million and early childhood program income of $1 million. These reductions were offset by improved margins in several programs related to special education and public school programs of $1 million.
European— Segment operating income increased $0.6 million compared to the prior year. The contribution of the corporate business grew by 6% in 2005 and contribution of the franchise business grew by 15% in 2005. Franchise expenses went up by 21% in 2005.
Company-Owned Centers— Segment operating income decreased $4.1 million compared to the prior year. Segment operating costs increased by $38.5 million in 2005 compared to the prior year primarily as a result of the additional costs associated with operating and integrating the 60 company-owned territories acquired during 2005. These costs consist primarily of instructional and advertising costs. Additionally, integration problems experienced in recently acquired territories resulted in lower than expected enrollments and unanticipated operating expenses.
Educate Products— Segment operating income increased to $5.5 million due to product sales of the Hooked on Phonics products through retail distribution as well as continued direct-to-consumer sales. The Hooked on Phonics business was acquired in the first quarter of 2005.
Progressus—Segment operating income increased $0.3 million compared to the prior year. This increase is primarily attributed to the $1.0 million decrease in operating costs in the current year, offset by the $0.7 million decrease in revenue. Operating costs decreased primarily due to the lower wage costs associated with the lower average number of therapists. Also contributing to the lower operating costs was the better overall management of expenses.
Educate Online— Educate Online’s operating loss decreased by $0.6 million, or 14%, for the year ended December 31, 2005 compared to the prior year. The decreased loss is primarily due to increased revenues for Catapult Online and newly launched Sylvan Online programs in addition to a reduction in sales, marketing and advertising costs in 2005 compared to the prior year, partially offset by higher start-up costs and lower revenue per session.
Corporate Expenses— Corporate general and administrative and depreciation and amortization expenses were $16.3 million for the year ended December 31, 2005 and $22.8 million during the same period of 2004 The decrease in the amount of these expenses of $6.5 million is due to the recording of $8.1 million of non-cash stock compensation expense in 2004 related to restricted common stock and options granted to employees and directors to purchase common stock at prices less than the estimated fair value of common stock. The remaining increase of $1.6 million is in response to needs to support the expanding business and to operate as a public company. Net interest expense decreased by $2.0 million primarily as a result of the refinancing of senior debt in April 2005, the payoff of the seller note in April of 2004, and repayment in September 2004 of a portion of our term loan facility with the proceeds from our initial public offering, offset partially by an increase in short-term interest rates and borrowings on the revolving credit line under the facility. Other financing costs decreased $3.9 million due to a terminated financing transaction in 2004. Our income tax expense increased to $14.7 million for the year ended December 31, 2005 from $11.1 million for the year ended December 31, 2004 due to higher pretax earnings in 2005, offset partially by a higher effective tax rate in 2004. Our effective tax rate was 40% for the year ended December 31, 2005 and 48% for the year ended December 31, 2004. The decrease in the full year effective tax rate in 2005 was primarily due to the recording of non-deductible stock compensation expense in 2004.
35
Liquidity and Capital Resources
The following table summarizes major changes in our cash position during the years ended:
| | | | | | | | | | | | |
| | | December 31, | |
| | | 2006 | | | 2005 | | | 2004 | |
| | | (Dollars in millions) | |
Beginning cash balance | | $ | 2.4 | | | $ | 14.6 | | | $ | 20.3 | |
Operating activities – continuing operations | | | 7.0 | | | | 16.4 | | | | 34.6 | |
Operating activities – discontinued operations | | | 4.2 | | | | (5.7 | ) | | | (11.0 | ) |
Investing activities | | | (30.2 | ) | | | (60.5 | ) | | | (19.2 | ) |
Financing activities | | | 16.6 | | | | 37.6 | | | | (10.1 | ) |
Effect of exchange rates | | | 0.5 | | | | — | | | | — | |
| | | | | | | | | | | | |
Ending cash balance | | $ | 0.5 | | | $ | 2.4 | | | $ | 14.6 | |
| | | | | | | | | | | | |
Historically, we have generated significant cash flows from our operations which have allowed us to meet our working capital needs and provide the cash we require to make investments in property and equipment, open new company-owned Learning Center territories, and acquire franchised territories and other businesses.
Our working capital requirements are favorably impacted by the fact that our largest segments, the Franchise Services and Company-Owned Centers segments, generate positive working capital even during growth periods. In our Sylvan Learning businesses, customers must pay in advance of services, which contributes to our cash position. Company-owned territories benefit from customer prepayment and, in connection with franchised territories, we receive royalty payments from franchisees based upon net cash collected in the prior month.
Our working capital needs are greater in our Catapult Learning segment because our customers are primarily public school districts that pay us in arrears, often 60 days or longer after we perform our services. Customers in our Educate Products segment are granted payment terms customary in the industry, which may extend up to 240 days. The Products segment has also used cash to develop new products and to finance production and growth in inventory levels during the current and prior years.
For the years ended December 31, 2006 and 2005, our cash flows from continuing operations were $7.0 million and $16.4 million, respectively. The decrease of $9.4 million was attributed primarily to a decrease in income from continuing operations before non-cash charges of $30.7 million, partially offset by an increase in working capital and other assets of $24.6 million. Cash provided by (used in) operating activities of discontinued operations was $4.2 million in 2006 compared to $(5.7) million in 2005.
Our investing activities have historically consisted of acquisitions of franchised territories and other businesses, investments in property and equipment and internally developed software and media. Our ability to make future acquisitions and investments in property and equipment will be dependent on the cash flows we generate from our operations and our ability to obtain additional capital.
During the year ended December 31, 2006, we invested $0.9 million in Learning Center acquisitions, $5.5 million to acquire Reading Rainbow and GPN, and $20.4 million in property and equipment and internally developed software and media. See Note 3 to our consolidated financial statements for more information regarding these acquisitions.
As described more fully in the Note 6 to our consolidated financial statements, we amended our term loan facility during the first quarter of 2006, increasing the term loan outstanding from $139.0 million to $159.7 million at March 31, 2006. Using proceeds from the term loan amendment, $21.1 million of revolving credit borrowings were repaid. As of December 31, 2006, the Company was not in compliance with certain financial covenants of the 2005 Term Loan, as amended. On March 15, 2007, the Company obtained a waiver of violations of these financial covenants as of December 31, 2006 and March 31, 2007 from its bank syndicate. The Company believes it will fail to comply with these same financial covenants at subsequent quarterly reporting dates in 2007, and accordingly, will need to obtain waivers or amend the terms of the credit facility to avoid triggering the facility’s demand repayment provisions. As a result, the Company classified the $175,844 of outstanding borrowings under the credit facility at December 31, 2006 as a current liability in the accompanying 2006 consolidated balance sheet, resulting in a working capital deficit of $170,003.
Management considered attempting to negotiate revised financial covenants to allow for compliance in 2007 based on projected operating results. However, because the Company has entered into a definitive merger agreement for the sale of the Company and expects to close that transaction by June 30, 2007, the Company determined it was not prudent to negotiate new terms and incur additional costs to amend its credit facility. However, there can be no assurance that lenders will waive their right to demand repayment of outstanding borrowings upon the likely default of the credit facility’s provisions in the June 30, 2007 and subsequent
36
quarterly reporting periods, and in the event of demanded repayment, that the Company can refinance the loans on acceptable terms. The 2006 financial statements do not include any adjustments to reflect the possible future effects on the recoverability and classification of assets or the amounts and classification of liabilities that may result from the outcome of this uncertainty.
Assuming that our existing credit facility and planned acquisition financing are available as we anticipate, we believe that cash flows from operations, available cash and these credit facilities will be sufficient to meet our operating requirements, including expansion of our existing business, funding of program and software development and operating costs for the next year. Our future capital requirements will depend on many factors, including our rate of revenue growth, the expansion of sales and marketing activities, the timing of introductions of new services and enhancements to existing programs and products. If our existing credit facility is not available and we are unable to refinance the indebtedness, obtain a waiver or complete the merger, then we may be unable to continue as a going concern.
Contingent Matters
The following tables reflect our contractual obligations and other commercial commitments as of December 31, 2006:
| | | | | | | | | | | | | | | |
| | | | | Payments due by period |
| | | Total | | 2007 | | 2008-2009 | | 2010-2011 | | 2012 and
after |
| | | | | | | (Dollars in Millions) | | |
Contractual Obligations | | | | | | | | | | | | | | | |
Long-term debt | | $ | 178.4 | | $ | 176.6 | | $ | 1.1 | | $ | 0.3 | | $ | 0.4 |
Interest on long-term debt (1) | | | 78.2 | | | 16.3 | | | 31.2 | | | 28.9 | | | 1.8 |
Operating leases | | | 59.6 | | | 22.3 | | | 29.9 | | | 7.0 | | | 0.4 |
| | | | | | | | | | | | | | | |
Total Contractual Cash Obligations | | $ | 316.2 | | $ | 215.2 | | $ | 62.2 | | $ | 36.2 | | $ | 2.6 |
| | | | | | | | | | | | | | | |
| (1) | Calculated on scheduled outstanding long-term debt amounts using applicable fixed rate or interest rate in effect at December 31, 2006 for variable rate loans. |
| | | |
Other Commercial Commitments (Dollars in Millions) | | Amount
Committed |
Guarantees expiring in 2007 | | $ | 2.0 |
Standby letters of credit expiring in 2008 | | | 1.3 |
Franchisee bank loan guarantees with various expiration dates | | | 0.1 |
| | | |
Total commercial commitments | | $ | 3.4 |
| | | |
We have guaranteed a bank loan of the Sylvan National Advertising Fund, which is a separate legal entity that the Company does not control, in the amount of $2.0 million, which expires in 2007.
We have guaranteed certain bank loans of franchisees related to financing the purchase of educational programs and other purchased instructional material. Of the $0.7 million of available credit under this program, $0.1 million was outstanding at December 31, 2006. These guarantees are secured by the assets of the business of the individual franchisee utilizing this financing arrangement.
The Company maintains a number of standby letters of credit totaling $1.3 million as of December 31, 2006 to guarantee its insurance program and the potential payment under a franchisee acquisition through 2008.
The Company also has other obligations recorded within long-term liabilities of $3.9 million that have no specified payment dates.
International Exposure
Our Franchise Services, European and Company-Owned Centers segments have operations outside the United States, primarily in Germany and Canada. These international operations subject us to political uncertainties, currency devaluations and national regulations affecting the provision of educational services. Accordingly, our revenues and income in any period may be impacted by international developments outside our control.
37
Critical Accounting Policies and Estimates
Management’s Discussion and Analysis of Financial Condition and Results of Operations discusses our consolidated financial statements, which have been prepared in accordance with U.S. generally accepted accounting principles. The preparation of these financial statements requires management to make estimates and assumptions that affect the reported amounts of assets and liabilities at the date of the financial statements and the reported amounts of revenues and expenses during the reporting period. On an ongoing basis, management evaluates its estimates and judgments, including those related to revenue, intangible assets and contingencies. Management bases its estimates and judgments on historical experience and on various other factors that are believed to be reasonable under the circumstances, the results of which form the basis for making judgments about the carrying value of assets and liabilities that are not readily apparent from other sources. Actual results may differ from these estimates under different assumptions or conditions.
Our significant accounting policies are described in Note 1 to our consolidated financial statements. The following discussion addresses our critical accounting policies, which are those that require management’s most difficult and subjective judgments, often as a result of the need to make estimates about the effect of matters that are inherently uncertain.
Revenue Recognition
Company-Owned Centers and Educate Online segments
Fees from providing supplemental education services to students through company-owned learning centers and online learning programs are recognized as revenue in the period the services are provided.
Franchise Services and Educate Products segments
Revenue related to license fees on the initial sale of a franchise territory that transfer the right to operate a learning center in a specified geographic area is recognized when all material services or conditions relating to the sales have been substantially performed or satisfied by us and collectibility of the fee is reasonably assured. The criteria for substantial performance include:
| (1) | receipt of an executed franchise license agreement, |
| (2) | a determination that collectibility of the fee is reasonably assured, |
| (3) | completion of requisite training by the franchisee or center director, and |
| (4) | completion of required site selection assistance. |
Initial franchise fees not meeting the recognition criteria are recorded as deferred revenue if not refundable, or deposits from franchisees if refundable.
Franchised learning centers also pay a monthly royalty fee based on cash receipts, payable by the fifteenth day of the following month. Royalty fees are recorded in the month earned if collectibility is reasonably assured. Estimates of royalties earned but unreported by franchisees at the balance sheet date are recorded as revenue and accounts receivable, and are adjusted to actual amounts when reported and paid by the franchisee.
Sales of educational products and materials to customers and franchisees is recognized when title passes and all substantial risks of ownership transfer to the buyer, which generally occurs either upon shipment or upon delivery based on contractual terms. Revenue is net of provisions for cash discounts, returns, customer discounts, cooperative advertising and other sales-related discounts.
Catapult Learning and Progressus segments
Revenue consists principally of revenue from arrangements with school districts receiving funds under federal and state-based programs. For arrangements that specify a fixed fee per student for educational services over a stated period, revenue is recognized ratably over the arrangement’s service period. Arrangements with school districts generally specify monthly billings of service fees. We also earn revenue from arrangements that specify hourly rates for services provided, which is recognized as services are rendered.
Allowances for Accounts Receivable
Our assets include receivables from franchisees related to royalties and product sales which are collected typically in less than one month and receivables from schools districts which typically have a collection cycle in excess of 60 days. We maintain an allowance for doubtful accounts for estimated losses resulting from the inability of our customers to make required payments. We calculate the allowance based on a specific analysis of past due balances and also consider historical trends of write-offs. We review our past due balances monthly and write off those that are deemed uncollectible. Actual collection experience has not differed significantly from our estimates, due primarily to credit and collections practices and the financial strength of our customers. Accounts and notes receivable balances due from franchisees are secured by the assets of the franchisee’s business. Other accounts receivable balances, primarily due from governmental agencies, product distributors and retailers, are not collateralized.
38
Sales of educational products to retailers and product distributors generally allow the customer to return the product for a full refund or credit. The Company provides a sales allowance against accounts receivable to estimate the value of products that will be returned and to state accounts receivable at estimated net realizable value. The allowance is calculated based upon historical return experience giving specific consideration to customer type.
Intangibles and Indefinite Lived Assets
At December 31, 2006, our total assets included approximately $351.2 million of intangible assets, net, representing approximately 171% of our net assets. We recorded approximately $267.4 million of goodwill and other intangible assets resulting from our acquisition of the pre-K-12 business of Laureate on June 30, 2003.
Our intangible assets include $239.9 million of franchise rights, tradenames and licensing agreements that have an indefinite life. We determined that these assets have an indefinite life because there are no significant legal, regulatory, or contractual provisions that limit the useful life. In addition, we determined that the effects of obsolescence, demand, competition, and other economic factors are not factors that are expected to significantly affect the useful life of the assets. Our Sylvan franchise license agreements license to each franchisee the exclusive right to operate a Sylvan Learning Center in a specified territory for an initial term of ten years. The franchise license agreements are known as “evergreen” agreements, because each franchisee may renew its license for no additional fee for consecutive ten-year terms. The franchisee may also transfer the license to a third-party with our consent, which may not be unreasonably withheld, for a nominal fee. We are not aware of any franchise license agreement that was not renewed on the renewal date, and, historically, the average failure rate of franchise territories is less than 1% per year. Because of the evergreen provisions of our franchise license agreements, our substantial experience with renewals, and the very low failure rate associated with our franchisee population, we have determined that the life of our franchise license agreements is indefinite.
Intangible assets with indefinite lives are not amortized, but rather are tested for impairment annually on October 1 of each year, and whenever an impairment indicator is identified. The impairment test requires the determination of the fair value of the intangible asset. If the fair value of the intangible asset is less than its carrying value, an impairment loss is recognized for an amount equal to the difference, and the intangible asset is then carried at its new fair value. Fair value is determined using estimates of discounted cash flows. The fair values of our Sylvan Learning Center franchise rights and tradenames are determined based on estimates of future royalties that we expect to receive from the franchised learning centers we acquired on June 30, 2003, discounted using the rate of return required for investments of like risk. Estimates of future royalties that we will earn likely will change over time as we perform our impairment assessments. Even if the estimate of future royalties does not decrease, the fair value of these assets may be adversely affected by increases in interest rates and the applicable discount rate. In addition, if we experience unexpected franchisee attrition, we may determine that our Sylvan franchise license rights do not have an indefinite life and should be subsequently amortized over their remaining estimated useful life.
At December 31, 2006, we had $93.1 million of goodwill. Goodwill is initially measured as the excess of the cost of a business we acquired over the fair value of the identifiable net assets. We do not amortize goodwill, but rather review its carrying value for impairment annually on October 1 of each year, and whenever an impairment indicator is identified. The goodwill impairment test involves a two-step approach. Under the first step, we determine the fair value of each reporting unit to which goodwill has been assigned. The reporting units for purposes of the impairment test are our seven segments, as these are the components of the business for which discrete financial information is available and our segment managers regularly review the operating results of those components. We estimate the fair value of each reporting unit by estimating the present value of the reporting unit’s future cash flows, and then compare the fair value of each reporting unit to its carrying value, including goodwill. If the fair value exceeds the carrying value, no impairment loss is recognized. If the carrying value exceeds the fair value, the goodwill of the reporting unit is considered potentially impaired and the second step is completed in order to measure the impairment loss. Under the second step, we calculate the implied fair value of goodwill by deducting the fair value of all tangible and intangible net assets, including any unrecognized intangible assets, of the reporting unit from the fair value of the reporting unit as determined in the first step. The implied fair value of goodwill is then compared to the carrying value of goodwill. If the implied fair value of goodwill is less than the carrying value of goodwill, we recognize an impairment loss equal to the difference.
Currently, 34% of our goodwill is included in our Franchise Services, Catapult Learning and European segments, which are our most profitable and stable reporting segments. If the estimated cash flows from the reporting units comprising these segments were to decline, due to the effects of increased competition or reduced demand or other factors, we could incur a material goodwill impairment charge.
39
New Accounting Pronouncements
As more fully described in Note 1 to our consolidated financial statements, the FASB issued Interpretation No. 48,Accounting for Uncertainty in Income Taxes, an interpretation of FASB Statement No. 109 (“FIN 48”) in June 2006 and Statement of Financial Accounting Standards No. 157,Fair Value Measurements (“SFAS 157”) in September 2006. We are still evaluating the impact of these pronouncements on our financial statements.
| Item 7A. | Quantitative and Qualitative Disclosures About Market Risk. |
We are exposed to certain market risks, which exist as part of our ongoing business operations. We use derivative financial instruments, where appropriate, to manage these risks. As a matter of policy, we do not engage in trading or speculative transactions. See Note 1 to our consolidated financial statements in this Form 10-K for further information on accounting policies related to derivative financial instruments.
Foreign Currency Risk
During the year ended December 31, 2006, approximately 12% of our revenues were derived from customers outside the United States. Most of this business is transacted through international subsidiaries, generally in the local currency that is considered the functional currency of that foreign subsidiary. Expenses are also incurred in the foreign currencies to match revenues earned and minimize the exchange rate exposure of our operating margins. We are vulnerable to changes in U.S. dollar / euro and U.S. dollar / Canadian dollar exchange rates. A hypothetical 10% adverse change in average annual foreign currency movements would have decreased both net income and cash flows for the year ended December 31, 2006 by approximately $0.3 million. We are also exposed to fluctuations in the value of foreign currency investments in subsidiaries and cash flows related to repatriation of these investments. We generally view our equity investment in foreign subsidiaries, comprised of Schülerhilfe, located in Germany, and Sylvan Canada, as long-term. The effects of a change in foreign currency exchange rates on our net investment in foreign subsidiaries are reflected in other comprehensive income (loss). A hypothetical 10% average change in depreciation in functional currencies relative to the U.S. dollar would have resulted in a decrease in our net investment in foreign subsidiaries of approximately $2.6 million at December 31, 2006.
Interest Rate Risk
We hold cash and cash equivalents in high quality, short-term, fixed income securities. Consequently, the fair value of our cash and cash equivalents would not be significantly impacted by either a 100 basis point increase or decrease in interest rates.
We are exposed to interest rate volatility with regard to future issuances of fixed rate debt and existing and future issuance of variable rate debt. Primary exposures include movements in U.S. Treasury rates, London Interbank Offered Rates (LIBOR) and commercial paper. We currently have interest rate swaps in place to reduce interest rate volatility associated with our secured credit facility, and to achieve a desired proportion of variable versus fixed rate debt.
Note 6 to our consolidated financial statements provides information on our significant indebtedness and on our interest rate swap agreements. The total notional amount of interest rate swaps at December 31, 2006 was $50.0 million, representing a settlement asset of $0.4 million. Assuming average variable rate debt levels, a one percentage point increase in interest rates would have increased interest expense by approximately $1.9 million for the year ended December 31, 2006.
All the potential impacts noted above are based on sensitivity analysis performed on our financial position at December 31, 2006. Actual results may differ materially.
40
| Item 8. | Financial Statements and Supplementary Data. |
INDEX TO THE FINANCIAL STATEMENTS
41
Report of Independent Registered Public Accounting Firm
The Board of Directors and Shareholders
Educate, Inc.
We have audited the accompanying consolidated balance sheets of Educate, Inc. as of December 31, 2006 and 2005, and the related consolidated statements of operations, stockholders’ equity, and cash flows for each of the three years in the period ended December 31, 2006. Our audits also included the financial statement schedules listed in the Index at Item 15(a). These financial statements and schedules are the responsibility of the Company’s management. Our responsibility is to express an opinion on these financial statements and schedules based on our audits.
We conducted our audits in accordance with the standards of the Public Company Accounting Oversight Board (United States). Those standards require that we plan and perform the audit to obtain reasonable assurance about whether the financial statements are free of material misstatement. An audit includes examining, on a test basis, evidence supporting the amounts and disclosures in the financial statements. An audit also includes assessing the accounting principles used and significant estimates made by management, as well as evaluating the overall financial statement presentation. We believe that our audits provide a reasonable basis for our opinion.
In our opinion, the financial statements referred to above present fairly, in all material respects, the consolidated financial position of Educate, Inc. at December 31, 2006 and 2005, and the consolidated results of its operations and its cash flows for each of the three years in the period ended December 31, 2006, in conformity with U.S. generally accepted accounting principles. Also, in our opinion, the related financial statement schedules, when considered in relation to the basic financial statements taken as a whole, present fairly in all material respects the information set forth therein.
The accompanying financial statements have been prepared assuming that Educate, Inc. will continue as a going concern. As more fully described in Note 6, at December 31, 2006 the Company did not comply with covenants of loan agreements with a syndicate of banks. Although the Company obtained a waiver of these defaults as of December 31, 2006, it is likely that the Company will need to obtain additional waivers of these covenants in 2007 to avoid triggering the debt’s demand repayment provisions. Accordingly, at December 31, 2006 the Company classified $175.8 million of long-term debt in default as a current liability, thereby resulting in a working capital deficit of $170.0 million. These conditions raise substantial doubt about the Company’s ability to continue as a going concern. Management’s plans in regard to these matters also are described in Note 17. The 2006 financial statements do not include any adjustments to reflect the possible future effects on the recoverability and classification of assets or the amounts and classification of liabilities that may result from the outcome of this uncertainty.
As discussed more fully in Note 9 to the consolidated financial statements, on January 1, 2006 the Company adopted the provisions of Statement of Financial Accounting Standards No. 123(R),Share-Based Payment,and changed its method of accounting for share-based payments using the modified prospective transition method.
We also have audited, in accordance with the standards of the Public Company Accounting Oversight Board (United States), the effectiveness of Educate, Inc.’s internal control over financial reporting as of December 31, 2006, based on criteria established in Internal Control-Integrated Framework issued by the Committee of Sponsoring Organizations of the Treadway Commission and our report dated March 15, 2007 expressed an unqualified opinion on management’ assessment, and an adverse opinion on the effectiveness of internal control over financial reporting.
/s/ Ernst & Young LLP
Baltimore, Maryland
March 15, 2007
42
Educate, Inc.
Consolidated Balance Sheets
(Dollar amounts in thousands)
| | | | | | | | |
| | | December 31,
2006 | | | December 31,
2005 | |
Assets | | | | | | | | |
Current assets: | | | | | | | | |
Cash and cash equivalents | | $ | 535 | | | $ | 2,414 | |
Receivables: | | | | | | | | |
Accounts receivable | | | 53,891 | | | | 51,883 | |
Notes receivable | | | 183 | | | | 140 | |
| | | | | | | | |
| | | 54,074 | | | | 52,023 | |
Allowances | | | (4,949 | ) | | | (4,764 | ) |
| | | | | | | | |
| | | 49,125 | | | | 47,259 | |
Finished goods inventory | | | 14,885 | | | | 11,685 | |
Prepaid expenses | | | 3,313 | | | | 3,246 | |
Other current assets | | | 818 | | | | 1,958 | |
Other receivables | | | 3,224 | | | | 5,667 | |
Deferred income taxes | | | 2,169 | | | | 24 | |
Assets of discontinued operations held for sale | | | — | | | | 1,683 | |
| | | | | | | | |
Total current assets | | | 74,069 | | | | 73,936 | |
Property and equipment: | | | | | | | | |
Furniture and fixtures | | | 6,398 | | | | 5,190 | |
Education materials | | | 4,918 | | | | 3,950 | |
Computer equipment and software | | | 14,751 | | | | 10,770 | |
Leasehold improvements | | | 19,481 | | | | 14,013 | |
| | | | | | | | |
| | | 45,548 | | | | 33,923 | |
Accumulated depreciation and amortization | | | (22,677 | ) | | | (14,854 | ) |
| | | | | | | | |
| | | 22,871 | | | | 19,069 | |
Intangible assets: | | | | | | | | |
Goodwill | | | 93,148 | | | | 92,077 | |
Tradenames | | | 148,489 | | | | 147,894 | |
Franchise license rights | | | 91,914 | | | | 90,590 | |
Other intangible assets | | | 23,951 | | | | 11,295 | |
| | | | | | | | |
| | | 357,502 | | | | 341,856 | |
Accumulated amortization | | | (6,254 | ) | | | (2,957 | ) |
| | | | | | | | |
| | | 351,248 | | | | 338,899 | |
Noncurrent assets of discontinued operations held for sale | | | — | | | | 9,755 | |
Other assets | | | 16,589 | | | | 10,229 | |
| | | | | | | | |
Total assets | | $ | 464,777 | | | $ | 451,888 | |
| | | | | | | | |
See notes to consolidated financial statements.
43
Educate, Inc.
Consolidated Balance Sheets (continued)
(Dollar amounts in thousands, except per share data)
| | | | | | |
| | | December 31,
2006 | | December 31,
2005 |
Liabilities and stockholders’ equity | | | | | | |
Current liabilities: | | | | | | |
Accounts payable and accrued expenses | | $ | 31,914 | | $ | 25,312 |
Accrued compensation and related benefits | | | 10,967 | | | 13,203 |
Income taxes payable | | | 1,063 | | | 724 |
Current portion of long-term debt | | | 176,597 | | | 2,734 |
Deferred revenue | | | 23,271 | | | 23,340 |
Other current liabilities | | | 260 | | | 231 |
| | | | | | |
Total current liabilities | | | 244,072 | | | 65,544 |
Long-term debt, less current portion | | | 1,760 | | | 160,114 |
Other long-term liabilities | | | 5,900 | | | 4,703 |
Deferred income taxes | | | 8,064 | | | 9,819 |
| | | | | | |
Total liabilities | | | 259,796 | | | 240,180 |
Commitments and contingencies | | | — | | | — |
Stockholders’ equity: | | | | | | |
Common stock, par value $0.01, 120,000,000 shares authorized, 43,154,123 and 42,731,868 shares issued and outstanding as of December 31, 2006 and December 31, 2005, respectively | | | 432 | | | 427 |
Additional paid-in capital | | | 195,639 | | | 192,608 |
Retained earnings | | | 6,323 | | | 18,212 |
Accumulated other comprehensive income | | | 2,587 | | | 461 |
| | | | | | |
Total stockholders’ equity | | | 204,981 | | | 211,708 |
| | | | | | |
Total liabilities and stockholders’ equity | | $ | 464,777 | | $ | 451,888 |
| | | | | | |
See notes to consolidated financial statements.
44
Educate, Inc.
Consolidated Statements of Operations
(Dollar amounts in thousands, except per share data)
| | | | | | | | | | | | |
| | | Year ended December 31, | |
| | | 2006 | | | 2005 | | | 2004 | |
Revenues | | | | | | | | | | | | |
Service revenues | | $ | 329,996 | | | $ | 296,629 | | | $ | 265,095 | |
Net product sales | | | 24,672 | | | | 33,785 | | | | 8,029 | |
| | | | | | | | | | | | |
Total revenues | | | 354,668 | | | | 330,414 | | | | 273,124 | |
Costs and expenses | | | | | | | | | | | | |
Instructional and franchise operations costs (1) (2) | | | 266,142 | | | | 217,107 | | | | 179,934 | |
Marketing and advertising | | | 35,584 | | | | 30,074 | | | | 22,950 | |
Cost of goods sold (2) | | | 20,500 | | | | 16,080 | | | | 4,652 | |
Depreciation and amortization (2) | | | 8,447 | | | | 6,787 | | | | 6,300 | |
General and administrative expenses (1) | | | 18,052 | | | | 14,721 | | | | 21,092 | |
| | | | | | | | | | | | |
Total costs and expenses | | | 348,725 | | | | 284,769 | | | | 234,928 | |
| | | | | | | | | | | | |
Operating income | | | 5,943 | | | | 45,645 | | | | 38,196 | |
Other income (expense) | | | | | | | | | | | | |
Interest income | | | 411 | | | | 411 | | | | 380 | |
Interest expense | | | (12,759 | ) | | | (7,932 | ) | | | (9,778 | ) |
Other financing costs | | | (1,149 | ) | | | (1,506 | ) | | | (5,420 | ) |
Foreign exchange gains (losses) and other | | | (486 | ) | | | 142 | | | | 1,159 | |
| | | | | | | | | | | | |
Income (loss) from continuing operations before income taxes | | | (8,040 | ) | | | 36,760 | | | | 24,537 | |
Income tax expense | | | (644 | ) | | | (14,749 | ) | | | (11,090 | ) |
| | | | | | | | | | | | |
Income (loss) from continuing operations | | | (8,684 | ) | | | 22,011 | | | | 13,447 | |
Loss from discontinued operations, net of income tax benefit of $973 in 2006, $4,404 in 2005 and $4,068 in 2004 | | | (1,957 | ) | | | (6,606 | ) | | | (7,118 | ) |
Gain (loss) on disposal of discontinued operations, net of income tax benefit (expense) of $620 in 2006 and ($51) in 2004 | | | (1,248 | ) | | | — | | | | 83 | |
| | | | | | | | | | | | |
Net income (loss) | | $ | (11,889 | ) | | $ | 15,405 | | | $ | 6,412 | |
| | | | | | | | | | | | |
Dividends per common share | | $ | — | | | $ | — | | | $ | 0.24 | |
| | | | | | | | | | | | |
Earnings (loss) per common share - basic | | | | | | | | | | | | |
Income (loss) from continuing operations | | $ | (0.20 | ) | | $ | 0.52 | | | $ | 0.35 | |
Loss from discontinued operations, net of tax | | | (0.08 | ) | | | (0.16 | ) | | | (0.18 | ) |
| | | | | | | | | | | | |
Net income (loss) | | $ | (0.28 | ) | | $ | 0.36 | | | $ | 0.17 | |
| | | | | | | | | | | | |
Earnings (loss) per common share – diluted | | | | | | | | | | | | |
Income (loss) from continuing operations | | $ | (0.20 | ) | | $ | 0.50 | | | $ | 0.34 | |
Loss from discontinued operations, net of tax | | | (0.08 | ) | | | (0.15 | ) | | | (0.18 | ) |
| | | | | | | | | | | | |
Net income (loss) | | $ | (0.28 | ) | | $ | 0.35 | | | $ | 0.16 | |
| | | | | | | | | | | | |
(1) Line item includes non-cash stock compensation as follows: | | | | | | | | | | | | |
Instructional and franchise operations costs | | $ | 553 | | | $ | 246 | | | $ | 788 | |
General and administrative expenses | | | 409 | | | | 217 | | | | 8,059 | |
| | | | | | | | | | | | |
Total | | $ | 962 | | | $ | 463 | | | $ | 8,847 | |
| | | | | | | | | | | | |
(2) Amount of depreciation and amortization directly attributed to generation of revenue excluded from: | | | | | | | | | | | | |
Instructional and franchise operations costs | | $ | 6,701 | | | $ | 5,123 | | | $ | 4,531 | |
Cost of goods sold | | | 129 | | | | 26 | | | | 95 | |
| | | | | | | | | | | | |
Total | | $ | 6,830 | | | $ | 5,149 | | | $ | 4,626 | |
| | | | | | | | | | | | |
See notes to consolidated financial statements.
45
Educate, Inc.
Consolidated Statement of Stockholder’s Equity
(Dollar amounts in thousands)
| | | | | | | | | | | | | | | | | | | |
| | | Common
Stock | | Additional
Paid-in
Capital | | | Retained
Earnings | | | Accumulated
Other
Comprehensive
Income | | | Total
Stockholders’
Equity | |
Balance at January 1, 2004 | | $ | 368 | | $ | 137,336 | | | $ | 1,701 | | | $ | 2,502 | | | $ | 141,907 | |
| | | | | | | | | | | | | | | | | | | |
Options exercised for purchase of 182,583 shares of common stock, including excess income tax benefit of $126 | | | 2 | | | 802 | | | | — | | | | — | | | | 804 | |
Issuance of 604,000 shares of restricted stock to employees for cash and services | | | 6 | | | 7,598 | | | | — | | | | — | | | | 7,604 | |
Issuance of 5,000,000 shares of common stock (less direct costs of issuance of $7,317) | | | 50 | | | 47,633 | | | | — | | | | — | | | | 47,683 | |
Issuance of options to purchase common stock to employees and directors | | | — | | | 1,327 | | | | — | | | | — | | | | 1,327 | |
Cash dividends to stockholders | | | — | | | (3,694 | ) | | | (5,306 | ) | | | — | | | | (9,000 | ) |
Comprehensive income: | | | | | | | | | | | | | | | | | | | |
Net income for 2004 | | | — | | | — | | | | 6,412 | | | | — | | | | 6,412 | |
Other comprehensive income: | | | | | | | | | | | | | | | | | | | |
Change in fair value of derivative financial instrument | | | — | | | — | | | | — | | | | 303 | | | | 303 | |
Foreign currency translation adjustment | | | — | | | — | | | | — | | | | 661 | | | | 661 | |
| | | | | | | | | | | | | | | | | | | |
Total comprehensive income | | | | | | | | | | | | | | | | | | 7,376 | |
| | | | | | | | | | | | | | | | | | | |
Balance at December 31, 2004 | | | 426 | | | 191,002 | | | | 2,807 | | | | 3,466 | | | | 197,701 | |
| | | | | | | | | | | | | | | | | | | |
Options exercised for purchase of 146,967 shares of common stock, including excess income tax benefit of $577 | | | 1 | | | 1,143 | | | | — | | | | — | | | | 1,144 | |
Non-cash stock compensation expense | | | — | | | 463 | | | | — | | | | — | | | | 463 | |
Comprehensive income: | | | | | | | | | | | | | | | | | | | |
Net income for 2005 | | | — | | | — | | | | 15,405 | | | | — | | | | 15,405 | |
Other comprehensive income (loss): | | | | | | | | | | | | | | | | | | | |
Change in fair value of derivative financial instrument | | | — | | | — | | | | — | | | | 411 | | | | 411 | |
Foreign currency translation adjustment | | | — | | | — | | | | — | | | | (3,416 | ) | | | (3,416 | ) |
| | | | | | | | | | | | | | | | | | | |
Total comprehensive income (loss) | | | | | | | | | | | | | | | | | | 12,400 | |
| | | | | | | | | | | | | | | | | | | |
Balance at December 31, 2005 | | | 427 | | | 192,608 | | | | 18,212 | | | | 461 | | | | 211,708 | |
| | | | | | | | | | | | | | | | | | | |
Options exercised for purchase of 319,606 shares of common stock | | | 4 | | | 1,183 | | | | — | | | | — | | | | 1,187 | |
Issuance of 102,649 shares of common stock for 401(k) match | | | 1 | | | 845 | | | | — | | | | — | | | | 846 | |
Non-cash stock compensation expense | | | — | | | 1,003 | | | | — | | | | — | | | | 1,003 | |
Comprehensive income: | | | | | | | | | | | | | | | | | | | |
Net loss for 2006 | | | — | | | — | | | | (11,889 | ) | | | — | | | | (11,889 | ) |
Other comprehensive income (loss): | | | | | | | | | | | | | | | | | | | |
Change in fair value of derivative financial instrument | | | — | | | — | | | | — | | | | (360 | ) | | | (360 | ) |
Foreign currency translation adjustment | | | — | | | — | | | | — | | | | 2,486 | | | | 2,486 | |
| | | | | | | | | | | | | | | | | | | |
Total comprehensive income (loss) | | | | | | | | | | | | | | | | | | (9,763 | ) |
| | | | | | | | | | | | | | | | | | | |
Balance at December 31, 2006 | | $ | 432 | | $ | 195,639 | | | $ | 6,323 | | | $ | 2,587 | | | $ | 204,981 | |
| | | | | | | | | | | | | | | | | | | |
See notes to consolidated financial statements.
46
Educate, Inc.
Consolidated Statements of Cash Flows
(Dollar amounts in thousands)
| | | | | | | | | | | | |
| | | Year ended December 31, | |
| | | 2006 | | | 2005 | | | 2004 | |
Operating activities | | | | | | | | | | | | |
Net income (loss) | | $ | (11,889 | ) | | $ | 15,405 | | | $ | 6,412 | |
Loss from discontinued operations | | | 1,957 | | | | 6,606 | | | | 7,118 | |
(Gain) loss on disposal of discontinued operations | | | 1,248 | | | | — | | | | (83 | ) |
| | | | | | | | | | | | |
Income (loss) from continuing operations | | | (8,684 | ) | | | 22,011 | | | | 13,447 | |
| | | | | | | | | | | | |
Adjustments to reconcile income (loss) from continuing operations to net cash provided by continuing operations: | | | | | | | | | | | | |
Depreciation | | | 7,739 | | | | 6,068 | | | | 5,851 | |
Amortization | | | 708 | | | | 719 | | | | 449 | |
Bad debt expense | | | 2,138 | | | | 612 | | | | 622 | |
Deferred income taxes | | | (2,363 | ) | | | 7,276 | | | | 4,858 | |
Amortization of copyrights and software and media intangible assets | | | 3,267 | | | | 1,616 | | | | — | |
Non-cash stock compensation | | | 962 | | | | 463 | | | | 8,847 | |
Other financing costs | | | 1,149 | | | | 1,506 | | | | 5,747 | |
Other non-cash items | | | 1,501 | | | | 210 | | | | (664 | ) |
Changes in operating assets and liabilities: | | | | | | | | | | | | |
Receivables | | | (3,803 | ) | | | (7,858 | ) | | | 2,075 | |
Prepaid expenses and other current assets | | | 1,080 | | | | (482 | ) | | | (1,168 | ) |
Inventory | | | (2,808 | ) | | | (7,522 | ) | | | (2,082 | ) |
Other assets | | | (1,113 | ) | | | (382 | ) | | | 1,971 | |
Accounts payable, accrued expenses, and other current liabilities | | | 5,098 | | | | 3,645 | | | | (9,103 | ) |
Income taxes payable | | | 4,360 | | | | (3,744 | ) | | | 233 | |
Deferred revenue | | | 1 | | | | (6,718 | ) | | | 2,070 | |
Accrued compensation and related benefits | | | (2,270 | ) | | | (970 | ) | | | 1,431 | |
| | | | | | | | | | | | |
Net cash provided by continuing operations | | | 6,962 | | | | 16,450 | | | | 34,584 | |
| | | | | | | | | | | | |
Adjustments for discontinued operations to reconcile net cash provided by continuing operations to net cash provided by operating activities: | | | | | | | | | | | | |
Loss from discontinued operations, including loss on disposal | | | (3,205 | ) | | | (6,606 | ) | | | (7,035 | ) |
(Gain) loss on disposal of discontinued operations | | | 1,248 | | | | — | | | | (83 | ) |
Changes in operating assets and liabilities | | | 6,142 | | | | (853 | ) | | | (5,632 | ) |
Depreciation and other non-cash items | | | 41 | | | | 1,732 | | | | 1,763 | |
| | | | | | | | | | | | |
Net cash provided by (used in) discontinued operations | | | 4,226 | | | | (5,727 | ) | | | (10,987 | ) |
| | | | | | | | | | | | |
Net cash provided by operating activities | | | 11,188 | | | | 10,723 | | | | 23,597 | |
(continued on the following page)
See notes to consolidated financial statements.
47
Educate, Inc.
Consolidated Statements of Cash Flows (continued)
(Dollar amounts in thousands)
| | | | | | | | | | | | |
| | | Year ended December 31, | |
| | | 2006 | | | 2005 | | | 2004 | |
Investing activities | | | | | | | | | | | | |
Cash paid for acquired businesses, net of cash acquired (including acquisition costs of $795 in 2006, $1,521 in 2005, and $361 in 2004) | | $ | (6,212 | ) | | $ | (37,885 | ) | | $ | (8,830 | ) |
Proceeds from sale of discontinued operations | | | 1,698 | | | | — | | | | 2,166 | |
Cash paid for internally developed software and media | | | (8,624 | ) | | | (5,030 | ) | | | (3,699 | ) |
Purchases of property and equipment | | | (11,784 | ) | | | (12,441 | ) | | | (5,079 | ) |
Net investing activities of discontinued operations | | | (1,479 | ) | | | (2,527 | ) | | | (2,804 | ) |
Change in other assets | | | (3,793 | ) | | | (2,629 | ) | | | (988 | ) |
| | | | | | | | | | | | |
Net cash used in investing activities | | | (30,194 | ) | | | (60,512 | ) | | | (19,234 | ) |
Financing activities | | | | | | | | | | | | |
Proceeds from exercises of stock options | | | 1,249 | | | | 567 | | | | 552 | |
Proceeds from issuance of common stock (less cash paid for direct costs of issuance of $7,317) | | | — | | | | — | | | | 47,689 | |
Borrowings on revolving credit facility | | | 30,000 | | | | 33,000 | | | | — | |
Payments on revolving credit facility | | | (33,000 | ) | | | (13,000 | ) | | | — | |
Cash received upon issuance of debt | | | 21,050 | | | | 140,000 | | | | 170,000 | |
Payments on debt | | | (2,861 | ) | | | (123,629 | ) | | | (216,558 | ) |
Dividends paid | | | — | | | | — | | | | (9,000 | ) |
Deferred financing costs | | | (1,005 | ) | | | (427 | ) | | | (3,574 | ) |
Change in other long-term liabilities | | | 1,188 | | | | 1,092 | | | | 820 | |
| | | | | | | | | | | | |
Net cash provided by (used in) financing activities | | | 16,621 | | | | 37,603 | | | | (10,071 | ) |
Effect of exchange rate changes on cash | | | 506 | | | | 8 | | | | 40 | |
| | | | | | | | | | | | |
Net change in cash and cash equivalents | | | (1,879 | ) | | | (12,178 | ) | | | (5,668 | ) |
Cash and cash equivalents at beginning of year | | | 2,414 | | | | 14,592 | | | | 20,260 | |
| | | | | | | | | | | | |
Cash and cash equivalents at end of year | | $ | 535 | | | $ | 2,414 | | | $ | 14,592 | |
| | | | | | | | | | | | |
Supplemental cash flow information: | | | | | | | | | | | | |
Interest paid | | $ | 14,663 | | | $ | 7,834 | | | $ | 13,372 | |
Income taxes paid (excluding tax refunds of $4,579 in 2006) | | $ | 1,286 | | | $ | 6,480 | | | $ | 343 | |
See notes to consolidated financial statements.
48
Educate, Inc.
Notes to Consolidated Financial Statements
(Dollars in thousands, except per share data)
1. Organization, Basis of Presentation, and Summary of Significant Accounting Policies
Description of Business
Educate, Inc. and subsidiaries (the “Company”, “Educate” or “we”) is a leading pre-K-12 education company delivering supplemental education services and products to students and their families. For over 25 years, we have provided trusted, personalized instruction to millions of students improving their academic achievement and helping them experience the joy of learning.
We provide supplemental, remedial and enrichment instruction through Sylvan Learning - North America’s largest network of tutoring centers. We are also the leading provider of educational services to public and non-public schools through our school partnership business, Catapult Learning. We also deliver educational products, including the highly regarded Hooked on Phonics early reading, math and study skills programs through our Educate Products business. See Note 15 for further discussion of the Company’s business segments.
Basis of Presentation
The accompanying consolidated financial statements represent the consolidated financial position, results of operations and cash flows of the Company prepared in accordance with accounting principles generally accepted in the United States. The Company’s management has made estimates and assumptions that affect reported amounts and related disclosures. Actual results could differ from those estimates. All significant intercompany transactions and balances have been eliminated in consolidation.
Due principally to the timing of school semesters and holiday schedules, the Company is subject to seasonality of reported revenues and expenses that affect reported results of operations. The Company’s Franchise Services and Company-Owned Centers segments generally experience lower revenues in the fourth quarter. Franchisees pay royalties to the Company based on a percentage of cash receipts. Since customers of these franchisees frequently make payments for services in advance, royalty revenues earned by the Company are higher in periods of increased enrollment, particularly in the spring months prior to commencement of peak summer service periods. In addition, the Company’s Catapult Learning segment generates a disproportionate amount of revenues during the first six months of the calendar year. This occurs because many school districts are on break during the summer months and use the first semester which occurs primarily in the fourth calendar quarter to evaluate the specific needs of individual students prior to enrolling students into the Company’s supplemental education programs. As a result of these factors, quarter-to-quarter comparisons of results of operation may not be indicative of future results of operations.
On August 23, 2006, the Company completed the sale of its Education Station business. Also, on September 20, 2004, Educate, Inc. sold its subsidiary Connections Academy, Inc., an operator of K-8 virtual public and charter schools. The accompanying consolidated financial statements present the results of operations of Education Station and Connections Academy as discontinued operations. See also Note 2.
The Company consolidates investments where it has a controlling financial interest. The usual condition for a controlling financial interest is ownership of a majority of the voting interest and, therefore, as a general rule ownership, directly or indirectly, of over fifty percent of the outstanding voting shares is a condition for consolidation. For investments in variable interest entities, as defined by Financial Accounting Standards Board (“FASB”) Interpretation No. 46,Consolidation of Variable Interest Entities, the Company consolidates when it is determined to be the primary beneficiary of the variable interest entity. The Company is not the primary beneficiary of any variable interest entity.
Summary of Significant Accounting Policies
Cash Equivalents
The Company considers all highly liquid investments with maturities of three months or less when purchased to be cash equivalents.
Allowances for Accounts Receivable
The Company reports accounts and notes receivable at net realizable value. The Company maintains an allowance for doubtful accounts for estimated losses resulting from the inability of its customers to make required payments. The Company calculates the allowance based on a specific analysis of past due balances and also considers historical trends of write-offs. Past due status is based
49
on how recently payments have been received by customers. Actual collection experience has not differed significantly from the Company’s estimates, due primarily to credit and collections practices and the financial strength of its customers. Balances are written off when management determines that collection is unlikely. Accounts and notes receivable balances due from franchisees are secured by the assets of the franchisee’s business. Other accounts receivable balances, primarily due from governmental agencies, product distributors and retailer, are not collateralized.
Sales of educational products to retailers and product distributors generally allow the customer to return the product for a full refund or credit. The Company provides an allowance against accounts receivable to estimate the value of products that will be returned and to state accounts receivable at net realizable value. The allowance is calculated based upon historical return experience giving specific consideration to customer type.
Inventory
Inventory, consisting primarily of educational and instructional products for sale to retailers and consumers, and educational programs and materials for sale to franchisees, is stated at the lower of cost (average cost) or market value.
Cost of Goods Sold
Cost of goods sold includes the materials and production cost of inventory sold during the period as well as shipping and distribution costs of the products. Cost of goods sold also includes the amortization of the costs of computer software and media developed for sale to third parties.
Property and Equipment
Property and equipment is stated at cost. Included in property and equipment are the direct costs of developing or obtaining software for internal use. Depreciation is computed using the straight-line method over the estimated useful lives of the assets. Amortization of leasehold improvements is computed using the straight-line method over the lesser of the useful life of the asset or the remaining term of the lease.
Useful lives are as follows:
| | |
Furniture and fixtures | | 2 – 7 years |
Education materials | | 2 – 5 years |
Computer equipment and software | | 2 – 3 years |
Leasehold improvements | | Lease term |
Goodwill
Goodwill is initially measured as the excess of the cost of an acquired business over the fair value of the identifiable net assets acquired. The Company does not amortize goodwill, but rather reviews its carrying value for impairment annually, and whenever an impairment indicator is identified. The Company performs impairment tests for goodwill and indefinite lived intangible assets as of October 1 of each year.
The goodwill impairment test involves a two-step approach. Under the first step, the Company determines the fair value of each reporting unit to which goodwill has been assigned. The reporting units of the Company for purposes of the impairment test are the Company’s major operating subsidiaries, as these are the components of reportable segments for which discrete financial information is available and segment management regularly reviews the operating results of those components. The Company then compares the fair value of each reporting unit to its carrying value, including goodwill. The Company estimates the fair value of each reporting unit by estimating the present value of the reporting unit’s future cash flows. If the fair value exceeds the carrying value, no impairment loss is recognized. If the carrying value exceeds the fair value, the goodwill of the reporting unit is considered potentially impaired and the second step is completed in order to measure the impairment loss. Under the second step, the Company calculates the implied fair value of goodwill by deducting the fair value of all tangible and intangible net assets, including any unrecognized intangible assets, of the reporting unit from the fair value of the reporting unit as determined in the first step. The Company then compares the implied fair value of goodwill to the carrying value of goodwill. If the implied fair value of goodwill is less than the carrying value of goodwill, the Company recognizes an impairment loss equal to the difference.
Intangible Assets Other Than Goodwill
Intangible assets other than goodwill consist principally of tradenames, franchise license rights, and licensing agreements acquired in business combinations and internally developed software and media. Intangible assets with finite lives are amortized over their estimated useful lives, which range from 1 year to 25 years.
50
Intangible assets with indefinite lives are not amortized, but rather are tested for impairment annually and whenever an impairment indicator is identified. The impairment test requires the determination of the fair value of the intangible asset. If the fair value of the intangible asset is less than its carrying value, an impairment loss is recognized for an amount equal to the difference. The intangible asset is then carried at its new fair value. Fair value is determined using estimates of discounted cash flows. These estimates of discounted cash flows will likely change over time as impairment tests are performed. Estimates of fair value are also adversely affected by increases in interest rates and the applicable discount rate.
Impairment of Long-Lived Assets
Long-lived assets, including amortizable intangible assets, are reviewed for impairment whenever events or changes in circumstances indicate that the carrying amount of an asset or group of assets may not be fully recoverable. These events or changes in circumstances may include a significant deterioration of operating results, changes in business plans, or changes in anticipated future cash flows. If an impairment indicator is present, the Company evaluates recoverability by a comparison of the carrying amount of the assets to future undiscounted net cash flows expected to be generated by the assets. Assets are grouped at the lowest level for which there are identifiable cash flows that are largely independent of the cash flows generated by other asset groups. If the assets are impaired, the impairment recognized is measured by the amount by which the carrying amount exceeds the fair value of the assets. Fair value is generally determined by estimates of discounted cash flows. The discount rate used in any estimate of discounted cash flows would be the rate required for a similar investment of like risk.
Assets to be disposed of are reported at the lower of carrying value or fair values, less estimated costs of disposal.
Revenue Recognition
Company-Owned Centers and Educate Online segments
Fees from providing supplemental education services to students through company-owned learning centers and online learning programs are recognized as revenue in the period the services are provided.
Franchise Services and Educate Products segments
Revenue related to license fees on the initial sale of a franchise territory that transfer the right to operate a learning center in a specified geographic area is recognized when all material services or conditions relating to the sales have been substantially performed or satisfied by the Company and collectibility of the fee is reasonably assured. The criteria for substantial performance include:
| | (1) | receipt of an executed franchise license agreement, |
| | (2) | a determination that collectibility of the fee is reasonably assured, |
| | (3) | completion of requisite training by the franchisee or center director, and |
| | (4) | completion of required site selection assistance. |
Initial franchise fees not meeting the recognition criteria are recorded as deferred revenue if not refundable, or deposits from franchisees if refundable.
Franchised learning centers also pay a monthly royalty fee based on cash receipts, payable by the fifteenth day of the following month. Royalty fees are recorded in the month earned if collectibility is reasonably assured. Estimates of royalties earned but unreported by franchisees at the balance sheet date are recorded as revenue and accounts receivable, and are adjusted to actual amounts when reported and paid by the franchisee.
Sales of educational products and materials to customers and franchisees is recognized when title passes and all substantial risks of ownership transfer to the buyer, which generally occurs either upon shipment or upon delivery based on contractual terms. Revenue is net of provisions for cash discounts, returns, customer discounts, cooperative advertising and other sales-related discounts.
Catapult Learning and Progressus segments
Revenue consists principally of revenue from arrangements with school districts receiving funds under federal and state-based programs. For arrangements that specify a fixed fee per student for educational services over a stated period, revenue is recognized ratably over the arrangement’s service period. Arrangements with school districts generally specify monthly billings of service fees. The Company also earns revenue from arrangements that specify hourly rates for services provided, which is recognized as services are rendered.
51
Deferred Costs
The Company incurs direct and incremental costs to set up site-based and virtual classrooms for its arrangements with school districts in the Catapult Learning and Educate Online segments. These costs are deferred and recognized ratably over the service period. These deferred costs are included in other assets in the accompanying consolidated balance sheets.
Marketing and Advertising
The Company expenses marketing and advertising costs as incurred.
Stock-Based Compensation
Prior to 2006, the Company accounted for all stock-based compensation plans using the intrinsic value method. Under the intrinsic value method, if the exercise price of the employee stock option equals the estimated fair value of the underlying stock on the date of grant, no compensation expense is generally recognized. The Company recorded compensation expense for awards with pro rata vesting on a straight-line basis over the vesting period.
On January 1, 2006, the Company adopted Statement of Financial Accounting Standards (“SFAS”) No. 123(R), Share-Based Payment (“SFAS 123(R)”). This statement requires the Company to expense the fair value of grants of various stock-based compensation programs over the vesting period of the awards. The Company adopted SFAS 123(R) using the modified prospective transition method, which does not result in the restatement of previously issued financial statements. The application of SFAS 123(R)’s transition provisions and the measurement of fair value are described more fully in Note 9. The resulting compensation expense is recognized in the statement of operations ratably over the vesting periods of the awards.
Foreign Currency Translation
The financial statements of foreign subsidiaries with a functional currency other than the U.S. dollar have been translated into U.S. dollars using the current rate method. Assets and liabilities have been translated using the exchange rates at year-end. Income and expense amounts have been translated using the average exchange rate prevailing for the period. Translation gains or losses resulting from the changes in exchange rates have been reported as a component of accumulated other comprehensive income included in the consolidated statement of stockholders’ equity.
Comprehensive Income
Comprehensive income is the change in equity of a business enterprise during a period from transactions and other events from non-owner sources. Other comprehensive income refers to revenue, expenses, gains and losses that under U.S. generally accepted accounting principles, are included in comprehensive income, but excluded from net income. The elements of other comprehensive income (loss), net of tax, consisted of foreign currency translation adjustments and the changes in fair value of derivative financial instruments accounted for as a hedge. Because deferred taxes are not provided for the unremitted earnings of foreign subsidiaries, deferred taxes are not provided for translation adjustments.
Hedging and Derivative Activities
The Company sometimes uses derivative instruments, consisting primarily of interest rate swap agreements, to manage its exposure to changes in interest rates. The Company does not use derivative instruments for trading or other speculative purposes.
All derivative instruments are reported in the consolidated balance sheets at fair value in the other assets or other long-term liabilities captions. Changes in a derivative’s fair value are recognized currently in earnings unless specified hedge criteria are met. If an interest rate swap is designated a cash flow hedge, the effective portions of the changes in the fair value of the swap are recorded in other comprehensive income. Ineffective portions of changes in the fair value of cash flow hedges are recognized in earnings.
As part of managing its exposure to changes in the market interest rate of variable rate debt over a three-year period, the Company entered into interest rate swap transactions with a financial institution acting as the counterparty. To ensure both appropriate use as a hedge and hedge accounting treatment, the swaps entered into were designated according to the hedge objective against a specific debt issue. The notional amount, rate and maturities of the interest rate swaps are closely matched to the related terms of the hedged debt obligation, and any ineffective portion is not material. The interest rate swaps would not result in a significant loss to the Company if the counterparty failed to perform according to the terms of the agreements.
52
Income Taxes
The Company accounts for income taxes using the liability method. Under the liability method, deferred tax assets and liabilities are determined based on the temporary differences between the financial statement carrying amounts and the tax bases of existing assets and liabilities, measured at prevailing enacted tax rates that are expected to be in effect when these temporary differences are settled or realized.
New Accounting Pronouncements
In June 2006, the FASB issued Interpretation No. 48,Accounting for Uncertainty in Income Taxes, an interpretation of FASB Statement No. 109 (“FIN 48”). FIN 48 clarifies the accounting for uncertainty in income taxes recognized in an enterprise’s financial statements in accordance with SFAS No. 109,Accounting for Income Taxes. FIN 48 prescribes a recognition threshold and measurement attribute for the financial statement recognition and measurement of a tax position taken or expected to be taken in a tax return, and provides guidance on derecognition, classification, interest and penalties, accounting in interim periods, disclosure, and transition. The Company will adopt the provisions of FIN 48 effective January 1, 2007. The provisions of FIN 48 will be applied to all tax positions upon initial adoption. Only tax positions that meet a more-likely-than-not recognition threshold at the effective date may be recognized or continue to be recognized upon adoption. The cumulative effect of applying the provisions of FIN 48 will be reported as an adjustment to the opening balance of retained earnings (or other appropriate components of equity or net assets in the balance sheet) for fiscal year 2007. The Company is currently analyzing its uncertain tax positions. However, based on information currently available, we believe that the impact of adopting FIN 48 will be immaterial to our financial condition.
In September 2006, the FASB issued SFAS No. 157,Fair Value Measurements (“SFAS 157”). SFAS 157 defines fair value, establishes a framework for measuring fair value under generally accepted accounting principles, and expands disclosures about fair value measurements. SFAS 157 emphasizes that fair value is a market-based measurement, not an entity-specific measurement, and states that a fair value measurement should be determined based on the assumptions that market participants would use in pricing the asset or liability. This Statement applies under other accounting pronouncements that require or permit fair value measurements, the FASB having previously concluded in those accounting pronouncements that fair value is the relevant measurement attribute. Accordingly, this Statement does not require any new fair value measurements. SFAS 157 is effective for fiscal years beginning after November 15, 2007, which the Company intends to adopt on January 1, 2008. SFAS 157 requires prospective application, with limited exceptions for certain financial instruments not currently held by the Company. The Company is still evaluating the impact of this pronouncement on its financial statements, however, based on information currently available, we believe that the impact of adopting SFAS 157 will be immaterial to our financial condition.
2. Discontinued Operations
Education Station
On October 27, 2005, the Company announced its intention to sell its Education Station business, which delivered site-based No Child Left Behind services to public schools. Education Station was a component unit within the Catapult Learning operating segment. On August 23, 2006, the Company completed the sale of its Education Station business to Knowledge Learning Corporation (“KLC”) for cash payments aggregating up to $6,000.
The aggregate purchase price of $6,000 consisted of $3,000 paid into escrow at closing, and $1,000 payable on each of the first three anniversaries of the closing date. The escrow was to be released based on the attainment of specified customer contract renewals. The Company attained the required conditions and the escrow was fully collected by January 2007. The fair value of the total consideration to be received from KLC was estimated to be $5,520.
The purchase agreement includes a non-competition provision whereby the Company has agreed, for a period of five years after the closing date, not to engage in the site-based business conducted by Education Station. However, the Company is permitted to provide NCLB services online, and the Company’s franchisees within the Sylvan Learning Center business may also provide NCLB services in their current and future territories.
On the closing date, the Company and KLC also entered into a Technology License Agreement (“License Agreement”) whereby the Company granted a non-exclusive, non-transferable license to KLC of certain proprietary software used in providing real-time online NCLB services. The term of the License Agreement is four years, and provides for a license fee of $10,000, payable in three installments of $3,000 within 30 days following each of the first three anniversaries of the closing date, and a final installment of $1,000 within 30 days following the fourth anniversary. KLC has the right to terminate the License Agreement if the Company fails to deliver the licensed technology within 30 days following the closing date, if KLC makes a warranty claim during the first year that cannot be timely remedied and results in a material impairment to KLC’s use of the licensed technology, or if the federal government terminates funding for NCLB services without replacing NCLB with, or approving, similar legislation.
53
On the closing date, the Company and KLC also entered into a Transition Services Agreement for the Company to provide certain information technology, finance, and human resources and benefits services to KLC for an initial term of one year for $2,000. The Transition Services Agreement may be terminated by KLC upon 30 days written notice, or by either party for default. The agreement also provides for possible renewal for two additional one-year terms.
As a result of the sale, the Company recorded a loss of $1,248 (or $0.03 per diluted common share), net of a tax benefit of $620, which represented the difference between the fair value of the net proceeds received and the net assets sold. Goodwill in the amount of $353, representing a portion of the Catapult reporting unit goodwill, was assigned to Education Station and was included in the net assets sold in determining the loss on disposal. The Company incurred $750 in transaction costs in connection with the sale.
The sale of Education Station will allow management to focus greater attention and resources on the opportunities available in the Company’s other remaining businesses.
The operations of Education Station are reported as discontinued operations for all periods presented. In addition, the net assets of Education Station were classified as assets held for sale at December 31, 2005.
Connections Academy
On September 20, 2004, the Company sold for cash of $2,100 its ownership interest in Connections Academy, Inc., a subsidiary, to an entity controlled by certain of the Company’s investors including its majority shareholder. As a result, the Company recorded a gain of $83, net of tax expense of $51, which represented the difference between the net proceeds received and the book value of the net assets sold. Upon the Company’s acquisition of the business in June 2003, the Company agreed to pay up to $10,000 of contingent consideration to the prior owners if Connections Academy achieved specified levels of earnings through December 31, 2007. As part of the sale, the Company transferred this contingent liability to the buyer.
Summarized Operating Results of Discontinued Operations
Summarized operating results from the discontinued operations included in the Company’s consolidated statements of operations were as follows:
| | | | | | | | | | | | |
| | | Year Ended December 31, | |
Education Station | | 2006 | | | 2005 | | | 2004 | |
Revenues | | $ | 27,508 | | | $ | 33,117 | | | $ | 27,153 | |
| | | | | | | | | | | | |
Loss from operations before income taxes | | | (2,930 | ) | | | (11,010 | ) | | | (6,903 | ) |
Income tax benefit | | | 973 | | | | 4,404 | | | | 2,623 | |
| | | | | | | | | | | | |
Loss from discontinued operations | | $ | (1,957 | ) | | $ | (6,606 | ) | | $ | (4,280 | ) |
| | | | | | | | | | | | |
| | | | |
Connections Academy | | Year Ended
December 31,
2004 | |
Revenues | | $ | 5,160 | |
| | | | |
Loss from continuing operations before income taxes | | | (4,283 | ) |
Income tax benefit | | | 1,445 | |
| | | | |
Loss from discontinued operations | | $ | (2,838 | ) |
| | | | |
Assets and liabilities of the discontinued operations of Education Station as of the date of sale and as of December 31, 2005 were as follows:
| | | | | | |
| | | August 23,
2006 | | December 31,
2005 |
Current assets | | $ | 771 | | $ | 1,683 |
Property and equipment, net | | | 5,105 | | | 3,797 |
Other long-term assets | | | 363 | | | 5,958 |
Long-term liabilities | | | 531 | | | — |
| | | | | | |
Net assets of discontinued operations | | $ | 5,708 | | $ | 11,438 |
| | | | | | |
54
3. Acquisitions
GPN
On April 10, 2006, the Company closed on a co-production agreement for Reading Rainbow and the acquisition of the assets of Great Plains National Instructional Library (“GPN”) for $4,900 in cash and contingent payments based upon future revenues. Reading Rainbow, a PBS television series, has garnered more than 250 awards including the Peabody, 9 Parent’s Choice Awards and 24 Emmy Awards. In this transaction, the Company acquired the rights to a library of 148 programs and rights to all Reading Rainbow programs to be produced in the future. GPN is the largest non-profit educators’ source for classroom-use video and interactive media learning packages. The results of operations of the acquired business are included in the Company’s consolidated statements of operations beginning April 10, 2006.
The purchase price totaled approximately $5,547 including acquisition costs of $647. Contingent consideration may be payable to the seller based upon future revenues exceeding a threshold in any of the five annual periods commencing on the closing date. No amounts are currently payable nor are amounts expected to be paid under the contingent consideration provisions of the purchase agreement.
The purchase price was allocated to acquired assets, excluding goodwill, of $4,311, including inventory of $376 and identifiable amortizable and indefinite-lived intangible assets of $526 (weighted-average amortization period of 6 years) and $3,409, respectively. The Company recognized $1,236 of goodwill, all of which is expected to be deductible for tax purposes.
Hooked on Phonics
On February 8, 2005, the Company acquired all the common stock of Gateway Learning Corporation (“HOP”), the owner of the branded “Hooked on Phonics” early reading, math and study skills programs. The Company plans to expand HOP product and service offerings and expand the use of the Hooked on Phonics brand by developing products and services that appeal to a broader range of customers. The results of operations of HOP are included in the Company’s consolidated statements of operations beginning February 1, 2005.
The purchase price totaled approximately $11,335 including acquisition costs of $1,319. The Company also extinguished $2,982 of acquired debt at closing. The purchase price was allocated to acquired assets totaling $20,968, including identifiable amortizable and indefinite-lived intangible assets of $1,290 and $7,046 respectively, and liabilities of $11,621. The weighted average amortization period for all identifiable amortizable intangible assets acquired was approximately 2.7 years. The purchase price allocation includes a contingent sales tax liability of $750 and an equal amount in escrow included within other current assets. The sales tax contingency will be resolved based upon final determination of state sales tax obligations, which is expected to occur in 2007. The following table summarizes the allocation of the purchase price to acquired assets and liabilities, other than cash received in the acquisition. This table has been updated to reflect the final determination of the amounts of acquired deferred tax assets and deferred tax liabilities, which occurred during 2006:
| | | |
Accounts receivable, net | | $ | 3,756 |
Other current assets | | | 1,866 |
Property and equipment | | | 13 |
Deferred tax assets | | | 6,959 |
Intangible assets subject to amortization: | | | |
Copyrights (amortization period of 3 years) | | | 1,076 |
Customer list (amortization period of 1 year) | | | 214 |
Indefinite lived intangible assets: | | | |
Tradenames | | | 7,046 |
Other assets | | | 38 |
| | | |
Total assets acquired, excluding cash of $1,988 | | | 20,968 |
Current liabilities | | | 4,509 |
Contingent sales tax liability | | | 750 |
Long-term debt | | | 2,982 |
Deferred tax liabilities | | | 3,380 |
| | | |
Total liabilities assumed | | | 11,621 |
| | | |
Purchase price, net of cash received of $1,988 | | $ | 9,347 |
| | | |
55
Franchisee-Owned Learning Center Territories
During the year ended December 31, 2006, the Company purchased two Sylvan Learning Center franchised territories comprising three centers. The combined purchase price of these territories was $902, consisting of cash and short term notes payable to the sellers, including acquisition costs of $15. The combined purchase price was preliminarily allocated to acquired assets, including accounts receivable of $2 and identifiable indefinite-lived intangible assets of $1,047, and liabilities assumed of $147, which consisted primarily of obligations to provide services to customers.
During the year ended December 31, 2005, the Company purchased 60 Sylvan Learning Center franchised territories comprising 78 centers in 60 separate transactions with franchisees. The combined purchase price of these territories totaled cash paid of $28,723, including acquisition costs of $309. Significant components of the combined purchase price allocation included goodwill of $25,624, identifiable indefinite-lived intangible assets of $14,325, and the assumption of liabilities of $12,739, which consisted primarily of obligations to provide services to customers. Approximately $26,218 of goodwill and indefinite lived intangible assets is expected to be deductible for tax purposes.
These acquisitions were considered multiple element transactions due to the preexisting relationship between the Company and the franchisee. Management estimated the fair value of settlement amounts using an income approach to determine the amount by which the royalty rate under the Sylvan Operating Agreement was favorable or unfavorable to the Company compared to pricing for current market transactions. During the years ended December 31, 2006 and 2005, the Company recognized net settlement losses in the amount of $58 and $212, respectively, which were classified within foreign exchange gains (losses) and other in the consolidated statements of operations.
Pro Forma Information – 2006 and 2005
The following unaudited consolidated pro forma results of operations of the Company for the years ended December 31, 2006 and 2005 give effect to: (i) the acquisition of GPN as if the acquisition had occurred on January 1, 2006; (ii) the acquisitions of the Sylvan Learning Center territories as if the acquisitions had occurred on January 1 of the respective year; and (iii) the acquisition of HOP as if the acquisition had occurred on January 1, 2005:
| | | | | | | |
| | | Year ended December 31, |
| | | 2006 | | | 2005 |
Revenues | | $ | 355,741 | | | $ | 357,121 |
Income (loss) from continuing operations before income taxes | | | (7,647 | ) | | | 37,978 |
Net income (loss) | | | (11,676 | ) | | | 16,136 |
Diluted earnings (loss) per share | | $ | (0.27 | ) | | $ | 0.37 |
The pro forma information is not necessarily indicative of the results which actually would have occurred if the above transactions had been consummated as described above, nor does it purport to represent the results of operations for future periods.
56
4. Goodwill
Changes in the carrying amount of goodwill are summarized by segment as follows:
| | | | | | | | | | | | | | | | | | | | | | | | | | | | | |
| | | Franchise
Services | | Catapult
Learning | | European | | | Subtotal -
Educate
Services | | | Company
Owned
Centers | | | Progressus | | | Educate
Products | | Total | |
Goodwill at January 1, 2005 | | $ | 10,294 | | $ | 6,222 | | $ | 14,937 | | | $ | 31,453 | | | $ | 34,329 | | | $ | 2,637 | | | $ | — | | $ | 68,419 | |
Acquisition of franchisee-owned learning centers | | | — | | | — | | | — | | | | — | | | | 25,624 | | | | — | | | | — | | | 25,624 | |
Adjustment to purchase price allocation of Progressus | | | — | | | — | | | — | | | | — | | | | — | | | | (128 | ) | | | — | | | (128 | ) |
Foreign currency translation adjustment | | | — | | | — | | | (1,901 | ) | | | (1,901 | ) | | | 63 | | | | | | | | — | | | (1,838 | ) |
| | | | | | | | | | | | | | | | | | | | | | | | | | | | | |
Goodwill at December 31, 2005 | | | 10,294 | | | 6,222 | | | 13,036 | | | | 29,552 | | | | 60,016 | | | | 2,509 | | | | — | | | 92,077 | |
| | | | | | | | | | | | | | | | | | | | | | | | | | | | | |
Adjustment to purchase price allocation of franchisee-owned learning centers | | | — | | | — | | | — | | | | — | | | | (1,996 | ) | | | — | | | | — | | | (1,996 | ) |
Acquisition of GPN | | | — | | | — | | | — | | | | — | | | | — | | | | — | | | | 1,236 | | | 1,236 | |
Adjustment to allocation of goodwill to discontinued operations | | | — | | | 338 | | | — | | | | 338 | | | | — | | | | — | | | | — | | | 338 | |
Foreign currency translation adjustment | | | — | | | — | | | 1,496 | | | | 1,496 | | | | (3 | ) | | | — | | | | — | | | 1,493 | |
| | | | | | | | | | | | | | | | | | | | | | | | | | | | | |
Goodwill at December 31, 2006 | | $ | 10,294 | | $ | 6,560 | | $ | 14,532 | | | $ | 31,386 | | | $ | 58,017 | | | $ | 2,509 | | | $ | 1,236 | | $ | 93,148 | |
| | | | | | | | | | | | | | | | | | | | | | | | | | | | | |
57
Educate, Inc.
5. Intangible Assets Other Than Goodwill
A summary of other intangible assets at December 31, 2006 and December 31, 2005 is as follows:
| | | | | | | | | | | |
| | | December 31, 2006 |
| | | Useful Life
In Years | | Gross
Carrying
Amount | | Accumulated
Amortization | | Net
Carrying
Amount |
Intangible assets subject to amortization: | | | | | | | | | | | |
Contract rights (Catapult Learning segment) | | 5 | | | 1,084 | | | 755 | | | 329 |
Schülerhilfe franchise license rights (European segment) | | 25 | | | 3,892 | | | 822 | | | 3,070 |
Customer list (Educate Products segment) | | 1 | | | 229 | | | 225 | | | 4 |
Copyrights (Educate Products segment) | | 3 | | | 1,211 | | | 1,025 | | | 186 |
Distribution agreements (Educate Products segment) | | 5 | | | 432 | | | 65 | | | 367 |
Internet domain names (primarily Educate Products segment) | | 10 | | | 112 | | | 7 | | | 105 |
Internally developed software and media (Franchise Services segment) | | 5-7 | | | 10,201 | | | 2,359 | | | 7,842 |
Internally developed software and media (Educate Products segment) | | 5-7 | | | 7,274 | | | 996 | | | 6,278 |
| | | | | | | | | | | |
Total intangible assets subject to amortization | | | | | 24,435 | | | 6,254 | | | 18,181 |
Indefinite-lived intangible assets not subject to amortization: | | | | | | | | | | | |
Tradenames (Company-Owned Centers segment) | | N/A | | | 132,349 | | | — | | | 132,349 |
Tradenames (European segment) | | N/A | | | 9,171 | | | — | | | 9,171 |
Tradenames (Educate Products segment) | | N/A | | | 6,968 | | | — | | | 6,968 |
Franchise license rights (Franchise Services segment) | | N/A | | | 88,022 | | | — | | | 88,022 |
Licensing agreements (Educate Products) | | N/A | | | 3,409 | | | — | | | 3,409 |
| | | | | | | | | | | |
Total indefinite-lived intangible assets | | | | | 239,919 | | | — | | | 239,919 |
| | | | | | | | | | | |
Total intangible assets other than goodwill | | | | $ | 264,354 | | $ | 6,254 | | $ | 258,100 |
| | | | | | | | | | | |
| | | | | | | | | | | |
| | | December 31, 2005 |
| | | Useful Life
In Years | | Gross
Carrying
Amount | | Accumulated
Amortization | | Net
Carrying
Amount |
Intangible assets subject to amortization: | | | | | | | | | | | |
Acquired backlog (Company-Owned Centers segment) | | 0.5 | | $ | 115 | | $ | 115 | | $ | — |
Contract rights (Catapult Learning segment) | | 5 | | | 1,084 | | | 539 | | | 545 |
Schülerhilfe franchise license rights (European segment) | | 25 | | | 3,491 | | | 478 | | | 3,013 |
Customer list (Educate Products segment) | | 1 | | | 228 | | | 209 | | | 19 |
Copyrights (Educate Products segment) | | 3 | | | 1,137 | | | 672 | | | 465 |
Internally developed software and media (Franchise Services segment) | | 5-7 | | | 7,323 | | | 871 | | | 6,452 |
Internally developed software and media (Educate Products segment) | | 5-7 | | | 1,408 | | | 73 | | | 1,335 |
| | | | | | | | | | | |
Total intangible assets subject to amortization | | | | | 14,786 | | | 2,957 | | | 11,829 |
Indefinite-lived intangible assets not subject to amortization: | | | | | | | | | | | |
Tradenames (Company-Owned Centers segment) | | N/A | | | 132,226 | | | — | | | 132,226 |
Tradenames (European segment) | | N/A | | | 8,225 | | | — | | | 8,225 |
Tradenames (Educate Products segment) | | N/A | | | 7,443 | | | — | | | 7,443 |
Franchise license rights (Franchise Services segment) | | N/A | | | 87,099 | | | — | | | 87,099 |
| | | | | | | | | | | |
Total indefinite-lived intangible assets | | | | | 234,993 | | | — | | | 234,993 |
| | | | | | | | | | | |
Total intangible assets other than goodwill | | | | $ | 249,779 | | $ | 2,957 | | $ | 246,822 |
| | | | | | | | | | | |
58
Educate, Inc.
As of December 31, 2006, estimated future amortization expense of intangible assets subject to amortization is as follows:
| | | |
Year ending December 31, | | | |
2007 | | $ | 5,109 |
2008 | | | 4,350 |
2009 | | | 3,646 |
2010 | | | 2,035 |
2011 | | | 1,461 |
Thereafter | | | 1,580 |
| | | |
Total | | $ | 18,181 |
| | | |
6. Debt
Debt consists of the following:
| | | | | | | | |
| | | December 31,
2006 | | | December 31,
2005 | |
Senior term loan payable to a bank (“2005 Term Loan”) in quarterly installments through March 2012. The loan bears interest at the bank’s prime rate or the Eurodollar rate, plus specified margins, as elected by the Company (aggregating to 9.36% and 6.03% per annum at December 31, 2006 and December 31, 2005, respectively). | | $ | 158,844 | | | $ | 138,950 | |
Revolving loan payable to a bank (under the “2005 Term Loan”) maturing April 27, 2009. The loan bears interest at the bank’s prime rate or the Eurodollar rate, plus specified margins, as elected by the Company (various interest rates ranging from 9.31% to 11.25% per annum). | | | 17,000 | | | | 20,000 | |
Note payable, due in semi-annual installments through June 30, 2009. The note does not bear interest, and is recorded net of a discount of $121 and $221 at December 31, 2006 and December 31, 2005, respectively. | | | 1,089 | | | | 1,656 | |
Various notes payable bearing interest at fixed rates ranging from 5.00% to 8.25% per annum, with maturity dates ranging from February 2007 to September 2015. | | | 1,424 | | | | 2,242 | |
| | | | | | | | |
| | | 178,357 | | | | 162,848 | |
Less: current portion of long-term debt | | | (176,597 | ) | | | (2,734 | ) |
| | | | | | | | |
Total long-term debt | | $ | 1,760 | | | $ | 160,114 | |
| | | | | | | | |
In order to manage interest rate exposure and to comply with certain covenants of the Company’s credit agreement, the Company entered into three interest rate swap agreements. A notional amount of $40,000 in variable rate debt was swapped to a counterparty in exchange for a fixed interest rate commitment of 2.58% per annum. A second agreement with a notional amount of $10,000 in variable rate debt was swapped to a counterparty in exchange for a fixed interest rate commitment of 3.44% per annum. These agreements terminated on July 1, 2006. A third agreement effective from July 1, 2006 through May 1, 2007 with a notional amount of $50,000 in variable rate debt was swapped to a counter party in exchange for a fixed interest rate commitment of 4.03% per annum. Net interest paid or received under these agreements is recorded as interest expense in the period in which it is incurred.
On March 31, 2006, the Company amended the 2005 Term Loan with a bank syndicate (the “Amendment”), which increased the term loan facility to $160,000, increased the interest rate spread over a base rate and the quarterly maturities over the existing term of the loan, and provided for increased flexibility in certain other terms and conditions of the term loan facility, including covenants concerning financial condition, certain capital expenditures and required interest rate protection coverage. The Amendment also provided consent for the sale of the Company’s Education Station business, and modified the required prepayments of amounts outstanding under the facility to 50% of the net cash proceeds from such sale. No changes were made to the agreement concerning the $30,000 revolving credit facility. The Company paid down $21,050 of the revolving loan with the proceeds from the Amendment.
59
Educate, Inc.
At the Company’s election, the 2005 Term Loan and Amendment bears interest at the base rate or Eurodollar rate plus a margin, which was 400 basis points at December 31, 2006. Pursuant to the 2005 Term Loan and Amendment, quarterly principal payments based upon a 100-year amortization schedule are due through September 30, 2011 with two balloon payments in equal amounts due at the end of each of the following quarters. The obligations under the 2005 Term Loan are guaranteed by the Company and certain direct and indirect subsidiaries of the Company. These obligations are secured by a senior interest in substantially all of the assets of the consolidated subsidiaries of the Company.
The Amendment constituted a substantial modification of the terms of the prior agreement and as a result, the Company wrote-off unamortized deferred financing costs of approximately $144 related to the prior term loan facility and expensed an additional $922 related to the modification during the quarter ended March 31, 2006.
The 2005 Term Loan and Amendment includes customary covenants for transactions of this type, including covenants limiting liens on assets of certain of the Company’s subsidiaries, certain asset sales, payment of dividends, incurrence of additional indebtedness, and mergers or fundamental business changes. The 2005 Term Loan also required compliance with financial covenants and otherwise restricted certain payments to the Company. At December 31, 2006, restricted net assets of the subsidiary were $232,218.
On August 8, 2006 the Company amended certain financial covenants within the 2005 Term Loan and Amendment for the June 30, 2006 and subsequent quarterly reporting periods to provide additional flexibility to achieve these covenants (“Second Amendment”). Without the Second Amendment, the Company would not have been in compliance with two financial covenants at June 30, 2006 that require the Company to maintain a certain consolidated leverage ratio and an interest coverage ratio.
On November 27, 2006, the Company amended the 2005 Term Loan, as amended (“Third Amendment”). The Third Amendment provides for increased flexibility in the 2005 Term Loan’s financial covenants, including the required leverage ratio, interest coverage ratio and fixed charge coverage ratio, for the September 30, 2006 and December 31, 2006 quarterly reporting periods. Without the Third Amendment, the Company would not have been in compliance with these covenants at September 30, 2006. The Third Amendment also increased the interest rate spread over a base rate for term loan and revolving credit facility borrowings by an additional twenty-five to seventy-five basis points depending upon the leverage ratio achieved. The Third Amendment also restricts certain acquisition and new center opening expenditures through March 31, 2007 and amends the definitions of Product Development Expenditures and Consolidated EBITDA to clarify the treatment of certain product development expenditures in calculations of covenant compliance. During the year ended December 31, 2006, the Company capitalized $1,695 and expensed $71 related to the Second and Third Amendments.
On March 15, 2007, in connection with the Fourth Amendment to the 2005 Term Loan, the Company obtained a waiver from its bank syndicate for violations of certain financial covenants within the 2005 Term Loan, as amended, for the December 31, 2006 and March 31, 2007 reporting periods. As a result of deteriorating operating results and the fact that the financial covenants are calculated using a rolling four quarter adjusted EBITDA measure, it is likely that the Company will be required to obtain waivers or amend the Term Loan facility in the June 30, 2007 and subsequent quarters to remain in compliance with the covenants prescribed in the facility and avoid the facility’s demand repayment provisions. As a result, the Company classified all of the outstanding debt of $175,844 under the 2005 Term Loan as a current liability in the consolidated balance sheet as of December 31, 2006. Management considered negotiating with the lenders under the 2005 Term Loan to obtain, for the next four quarterly reporting periods, covenant amendments that were achievable based on the projected operating results of the Company. Such amendments would provide for the classification of the debt as long-term or current under the maturity provisions of the facility. However, due to the proposed sale of the Company as evidenced by a January 2007 definitive merger agreement, the Company chose to obtain a waiver for the current and likely March 31, 2007 violations without negotiating amendments as to future periods. The merger is expected to close during the second quarter of 2007.
Of the $30,000 revolving credit facility, $11,740 was available to the Company due to outstanding standby letters of credit totaling $1,260 as of December 31, 2006.
The fair value of debt at December 31, 2006 approximates its carrying value at that date based on an assessment of market interest rates associated with similar debt.
60
Educate, Inc.
Aggregate maturities of debt at December 31, 2006 are as follows:
| | | |
Year ending December 31: | | | |
2007 | | $ | 176,597 |
2008 | | | 726 |
2009 | | | 386 |
2010 | | | 149 |
2011 | | | 158 |
Thereafter | | | 341 |
| | | |
Total | | $ | 178,357 |
| | | |
7. Leases
The Company conducts significant operations from leased facilities. These facilities include office locations, warehouse space and company-owned learning centers. The lease terms of substantially all of these leases are five years or less. Many of the leases contain options to renew, generally with one or two renewal periods ranging from one to three years. The Company also leases certain equipment under non-cancelable operating leases, the majority of which are for terms of 36 months or less.
Future minimum lease payments at December 31, 2006, by year and in the aggregate, under all non-cancelable operating leases are as follows:
| | | |
Year ending December 31: | | | |
2007 | | | 22,293 |
2008 | | | 17,432 |
2009 | | | 12,495 |
2010 | | | 5,161 |
2011 | | | 1,823 |
Thereafter | | | 384 |
| | | |
Total | | $ | 59,588 |
| | | |
Rent expense was approximately $26,537, $21,972 and $15,690 for the years ended December 31, 2006, 2005 and 2004, respectively.
8. Commitments and Contingencies
In connection with the 2003 acquisition of the pre-K-12 business from Laureate Education, Inc. (“Laureate”), the Company and Laureate entered into a three-year shared services agreement that expired June 30, 2006. Under the terms of the shared service agreement, the Company provided certain support services including, but not limited to, specified accounting, benefits, information technology, human resources, purchasing and payroll services to Laureate. Conversely, Laureate provided certain support services, primarily in the areas of tax, treasury, and facilities administration to the Company. Laureate and the Company are considered related parties because two individuals, one of whom is the Company’s CEO, serve on the Board of Directors of both companies.
On July 1, 2006, the Company and Laureate extended its shared service agreement through December 31, 2007 for a portion of the originally contracted services. Under the extended agreement, the Company will continue to provide specified accounting, benefits, human resources, purchasing and payroll services to Laureate through the end of 2007. Laureate will continue to provide certain facilities administration functions to the Company through the end of the first quarter of 2007.
The shared services agreement provides for the Company to receive net payments consisting of a base fee plus specified volume-based increases to the fees attributable to the services. The net base fees to be received by the Company under the extended agreement are approximately $383 each quarter. These payments are accounted for as a reduction of general and administrative expenses.
The Company is subject to legal actions arising in the ordinary course of its business. In management’s opinion, the Company has adequate legal defenses and/or insurance coverage with respect to the eventuality of such actions and does not believe any settlement would materially affect the Company’s financial position.
The Company maintains a number of standby letters of credit totaling $1,260 as of December 31, 2006 to guarantee certain of its insurance programs and the potential payment under a franchisee acquisition through 2008.
61
Educate, Inc.
The Company has guaranteed certain bank loans of franchisees related to financing the purchase of educational programs and other purchased instructional material. Of the $680 of available credit under this program, $145 was outstanding at December 31, 2006. These guarantees are secured by the assets of the business of the individual franchisee utilizing this financing arrangement.
The Company has guaranteed a bank loan of the Sylvan National Advertising Fund (“Fund”) in the amount of $2.0 million, which expires in May 2007. All Sylvan Learning Centers pay advertising fees into the Fund, which coordinates national advertising campaigns for the benefit of the Learning Center network. The Fund is a separate legal entity, which the Company does not control. Provision of the guarantee allowed the Fund to obtain external financing at more favorable terms. The Company would be required to perform under the guarantee in the event of default on the loan by the Fund. An event of default under the 2005 Term Loan would be an event of default under this loan to the Fund.
9. Share-Based Payments
On January 1, 2006, the Company adopted Statement 123(R),Share-Based Payment, which is a revision of Statement 123,Accounting for Stock-Based Compensation. Statement 123(R) requires all share-based payments to employees, including grants of employee stock options, to be recognized in the income statement based on their estimated fair values. Pro forma disclosure is no longer an alternative.
Prior to January 1, 2006, the Company accounted for all stock-based awards under the intrinsic value recognition and measurement provisions of APB Opinion No. 25,Accounting for Stock Issued to Employees, and related Interpretations (“Opinion 25”), as permitted by Statement 123. On January 1, 2006, the Company adopted the provisions of Statement 123(R) using the “modified prospective” method. Under the “modified prospective” method, compensation cost is recognized beginning with the effective date for (a) all new share-based payments granted after the effective date; (b) all awards modified, repurchased, or cancelled after the effective date; and (c) the remaining portion of the requisite service under previously-granted unvested awards outstanding as of the effective date. For options that vest ratably, the Company recognizes compensation cost on a straight-line basis over the requisite service period for the entire award.
Unvested stock-based awards issued prior to May 14, 2004, the date the Company filed a registration statement with the SEC to sell its common stock in a public offering, and disclosed in the financial statements using the minimum value method (rather than the estimated fair value using an option-pricing model) were accounted for at the date of adoption using the intrinsic value method originally applied to those awards. Awards issued after May 14, 2004 and through December 31, 2005 that have not vested were accounted for at the date of adoption using the same estimate of the grant-date fair value disclosed in the historical financial statements and estimated in accordance with the provisions of Statement 123. As a result of adopting Statement 123(R), no future expense will be recognized for unvested options granted prior to May 14, 2004 that had no intrinsic value at the grant date.
As a result of adopting Statement 123(R), the Company’s income before income taxes, income from continuing operations, and net income for the year ended December 31, 2006 are $561, $359 and $380 lower, respectively than if the Company had continued to account for share-based compensation under Opinion 25. Basic and diluted loss per share for the year ended December 31, 2006 was $0.01 lower as a result of adopting Statement 123(R). Results for prior periods have not been restated.
Prior to the adoption of Statement 123(R), the Company presented all tax benefits of deductions resulting from the exercise of stock options as operating cash flows in the statement of cash flows. Statement 123(R) requires the cash flows resulting from the tax benefits resulting from tax deductions in excess of the compensation cost recognized for those options (excess tax benefits) to be classified as financing cash flows.
Prior to adoption of Statement 123(R), the Company accounted for all stock-based compensation awards using the intrinsic value method. Under the intrinsic value method, if the exercise price of the employee stock option equals the estimated fair value of the underlying stock on the date of grant, no compensation expense was generally recognized. Statement 123(R) requires the disclosure of pro forma data based on the original provisions of Statement 123 in the notes to the financial statements for periods prior to the date of adoption for companies adopting using the modified prospective method.
Pro forma net income and earnings per share data have been determined as if the Company had accounted for its stock-based awards using the prescribed fair value based method. For all grants prior to May 14, 2004, the date the Company filed a registration statement with the SEC to sell its common stock in a public offering, the Company used the minimum value method. The minimum value
62
Educate, Inc.
method assumes that the fair value of an award is equal to the excess of the fair value of the underlying common stock at the date of grant over the present value of both the exercise price and the expected dividend payments, each discounted at the risk-free rate, over the expected life of the option.
For all stock options granted after May 14, 2004, the Company used the Black-Scholes option-pricing model. The Black-Scholes option-pricing model was developed for estimating the fair value of traded options that have no vesting restrictions and are fully transferable. Black-Scholes and other option valuation models require the input of highly subjective assumptions. These assumptions may change in future periods, and the effects could be material. Significant assumptions used during the year to estimate the fair value of stock options are described below:
| | • | | Expected Term. Because the Company was formed in June 2003, it has limited historical experience regarding its employees’ exercise and post-vesting employment termination behavior. The Company’s options have the characteristics of “plain vanilla” options described in Staff Accounting Bulletin No. 107 (“SAB 107”), and as such, the expected term is calculated using SAB 107’s simplified method. |
| | • | | Expected Volatility. Because the Company’s common stock has only been publicly traded since September 2004, the expected stock price volatility over the expected life of granted options has been based on published volatility measures of companies with similar characteristics. |
| | • | | Expected Dividend Yield. The Company does not anticipate paying dividends in the foreseeable future. |
| | • | | Risk-Free Interest Rates. The risk-free interest rates for stock options are based on the U.S. Treasury yield curve rates in effect at the time of grant for maturities similar to the expected term of the stock options. |
The weighted average assumptions used in the 2006 valuation model are presented in the table below.
| | | |
| | | Year ended
December 31, 2006 | |
Expected term (in years) | | 6.02 | |
Expected volatility | | 40 | % |
Expected dividend yield | | 0 | % |
Risk-free interest rate (range) | | 4.92 – 5.13 | % |
The following assumptions (weighted averages) were used in calculating 2005 and 2004 pro forma stock compensation expense:
| | | | | | |
| | | Year ended December 31, | |
| | | 2005 | | | 2004 | |
Expected term (in years) | | 4 | | | 4 | |
Expected volatility | | 45 | % | | 47 | % |
Expected dividend yield | | 0 | % | | 0 | % |
Risk-free interest rate (range) | | 3.81 – 4.18 | % | | 2.81 – 3.55 | % |
The weighted average estimated fair value of stock-based awards granted during the year ended December 31, 2006, 2005 and 2004 was $3.85, $5.36 and $7.39, respectively.
For the purpose of pro forma disclosures, the estimated fair value of the options in periods prior to adoption of Statement 123(R) was expensed over the options’ vesting periods. The Company’s pro forma information is as follows:
63
Educate, Inc.
| | | | | | | | |
| | | Year ended December 31, | |
| | | 2005 | | | 2004 | |
Net income, as reported | | $ | 15,405 | | | $ | 6,412 | |
Add: Stock-based employee compensation expense included in net income as reported, net of tax benefit of $186 and $4,285 in 2005 and 2004, respectively. | | | 277 | | | | 4,642 | |
Less: Stock-based employee compensation expense using prescribed fair value based methods, net of tax benefit of $482 and $4,546 in 2005 and 2004, respectively. | | | (719 | ) | | | (4,925 | ) |
| | | | | | | | |
Pro forma net income | | $ | 14,963 | | | $ | 6,129 | |
| | | | | | | | |
Earnings per common share—basic | | | | | | | | |
As reported | | $ | 0.36 | | | $ | 0.17 | |
Pro forma | | $ | 0.35 | | | $ | 0.16 | |
Earnings per common share—diluted | | | | | | | | |
As reported | | $ | 0.35 | | | $ | 0.16 | |
Pro forma | | $ | 0.34 | | | $ | 0.15 | |
Description of Plans
2003 Omnibus Stock Incentive Plan
During 2003, the Company adopted a stock option plan that provides for the granting of options to purchase up to 4,360,000 shares of common stock to selected employees and directors of the Company. Options to purchase 3,898,800 shares of common stock were granted under this plan. Of this amount, 104,000 shares immediately vested with the remainder vesting ratably over thirty-six or forty-eight months. Options under this plan expire 10 years after the grant date. Options to purchase 374,000 shares of common stock were granted in 2004 under this plan with an exercise price less than the estimated fair value of the Company’s common stock at the grant date. The Company can no longer grant options under this plan.
2004 Omnibus Stock Incentive Plan
During 2004, the Company adopted a stock option plan that provides for the granting to selected employees and directors of the Company of options to purchase up to 700,000 shares of common stock plus an annual increase added automatically on the first day of the fiscal year equal to the lesser of (i) 400,000 shares or (ii) one percent of the number of outstanding shares on the last day of the immediately preceding fiscal year. Options under this plan expire 10 years after the grant date.
The annual automatic increases on January 1, 2006 and 2005 each resulted in 400,000 additional shares of common stock available for issuance under the 2004 stock option plan, and after taking into account shares already granted, 901,208 shares of common stock are available for issuance as of December 31, 2006. Options vest ratably over a forty-eight month period.
Restricted Common Stock Awards
In June 2004, the Company issued 604,000 shares of restricted common stock for $0.01 per share to certain employees that vested immediately. These shares of common stock are restricted as to resale over a three to five-year period. The Company estimated that due to the restrictions on resale, the common stock had an estimated fair value of $12.60 at the grant date, or 90% of the estimated fair value of an unrestricted share of common stock. The Company recorded aggregate compensation expense of $7,604 in June 2004 related to these common stock grants.
64
Educate, Inc.
The following tables summarize the Company’s stock option activity (options in thousands):
| | | | | | | | | | | |
| | | Options | | | Weighted
Average
Exercise
Price | | Weighted
Average
Remaining
Contractual
Term (in
Years) | | Aggregate
Intrinsic
Value |
Outstanding – December 31, 2005 | | 3,586 | | | $ | 4.78 | | | | | |
Granted | | 388 | | | | 8.19 | | | | | |
Exercised | | (320 | ) | | | 3.91 | | | | | |
Forfeited | | (273 | ) | | | 9.22 | | | | | |
| | | | | | | | | | | |
Outstanding – December 31, 2006 | | 3,381 | | | $ | 4.88 | | 7.0 | | $ | 9,197 |
| | | | | | | | | | | |
Vested and expected to vest – December 31, 2006 | | 3,276 | | | $ | 4.80 | | 7.1 | | $ | 11,475 |
| | | | | | | | | | | |
Exercisable – December 31, 2006 | | 2,894 | | | $ | 4.26 | | 6.7 | | $ | 8,980 |
| | | | | | | | | | | |
The aggregate intrinsic value in the table above represents the difference between the Company’s closing stock price on the last trading day of the year (December 29, 2006) and the exercise price, multiplied by the number of in-the-money options outstanding, whether vested or not vested.
The total intrinsic value of stock options exercised, based on the difference between the Company’s stock price at the time of exercise and the related exercise price, was $1,302, $1,518 and $292 during the year ended December 31, 2006, 2005 and 2004, respectively.
The total fair value of stock options vested was $999, $835 and $1,459 during the year ended December 31, 2006, 2005 and 2004, respectively. The related income tax benefit recognized during the year ended December 31, 2006 was $350. At December 31, 2006, unrecognized compensation cost related to stock options outstanding as of December 31, 2006 was $2,146 ($1,288 after income taxes), which is expected to be recognized over a weighted average remaining vesting period of 2.9 years.
10. Income Taxes
Significant components of income tax expense (benefit) from continuing operations are as follows:
| | | | | | | | | | | |
| | | Year ended December 31, | |
| | | 2006 | | | 2005 | | 2004 | |
Current: | | | | | | | | | | | |
U.S. Federal | | $ | (1,632 | ) | | $ | 3,708 | | $ | 688 | |
U.S. State | | | 496 | | | | 408 | | | 952 | |
Foreign | | | 1,277 | | | | 520 | | | 368 | |
| | | | | | | | | | | |
| | | 141 | | | | 4,636 | | | 2,008 | |
Deferred: | | | | | | | | | | | |
U.S. Federal | | | (2,435 | ) | | | 8,102 | | | 7,926 | |
U.S. State | | | 1,501 | | | | 299 | | | (447 | ) |
Foreign | | | 1,437 | | | | 1,712 | | | 1,603 | |
| | | | | | | | | | | |
| | | 503 | | | | 10,113 | | | 9,082 | |
| | | | | | | | | | | |
Total income tax expense | | $ | 644 | | | $ | 14,749 | | $ | 11,090 | |
| | | | | | | | | | | |
Foreign income before income taxes | | $ | 5,533 | | | $ | 5,424 | | $ | 5,393 | |
| | | | | | | | | | | |
65
Educate, Inc.
The Company uses the liability method to account for income taxes. Deferred income taxes reflect the net tax effects of temporary differences between the carrying amounts of assets and liabilities for financial reporting purposes and the amounts used for income tax purposes, and the tax effects of operating loss and tax credit carryforwards. Significant components of the Company’s deferred tax assets and liabilities as of December 31, 2006 and 2005 are summarized as follows:
| | | | | | | |
| | | December 31, |
| | | 2006 | | | 2005 |
Deferred tax assets: | | | | | | | |
Net operating loss carryforwards | | $ | 22,649 | | | $ | 9,444 |
Receivables | | | 428 | | | | — |
Allowance for doubtful accounts | | | 965 | | | | 143 |
Inventory | | | 916 | | | | — |
Fixed asset basis | | | 3,163 | | | | 883 |
Nondeductible reserves | | | 171 | | | | 280 |
Deferred compensation | | | 2,123 | | | | 1,722 |
Accrued compensation | | | 1,078 | | | | — |
Tax credit carryforwards | | | 1,291 | | | | 578 |
Other | | | 90 | | | | — |
| | | | | | | |
Total deferred tax assets | | | 32,874 | | | | 13,050 |
Deferred tax liabilities: | | | | | | | |
Amortization of intangible assets | | | 32,263 | | | | 21,522 |
Prepaid expenses | | | 526 | | | | — |
Other | | | — | | | | 754 |
| | | | | | | |
Total deferred tax liabilities | | | 32,789 | | | | 22,276 |
| | | | | | | |
Net deferred tax (assets) liabilities | | | (85 | ) | | | 9,226 |
Valuation allowance for deferred tax assets | | | 5,165 | | | | 569 |
| | | | | | | |
Net deferred tax liabilities | | $ | 5,080 | | | $ | 9,795 |
| | | | | | | |
Federal, foreign, and state net operating loss carryforwards at December 31, 2006 were $52,075, $1,047 and $79,297, respectively, of which $19,343 were acquired in the acquisition of HOP, $12,307 were acquired in the acquisition of the pre-K-12 business of Laureate and $4,020 were acquired in the acquisitions of various learning centers from franchisees. These net operating loss carryforwards will begin to expire in 2019. Acquired net operating losses are subject to limitation under the Internal Revenue Code. A valuation allowance was recorded against certain federal tax credits and state and foreign income tax benefits of certain subsidiaries for which the Company currently believes it is more likely than not that the asset will not be realizable. Of the valuation allowance that was recorded, $203 was recorded against certain tax benefits that were generated by discontinued operations during the year ended December 31, 2006. Certain tax credit carryforwards will begin to expire in 2013.
The reconciliation of the reported income tax expense to the amount that would result by applying the U.S. federal statutory tax rate of 35% to income from continuing operations before income taxes is as follows:
| | | | | | | | | | | | |
| | | Year ended December 31, | |
| | | 2006 | | | 2005 | | | 2004 | |
Tax expense (benefit) at U.S. statutory rate | | $ | (2,814 | ) | | $ | 12,866 | | | $ | 8,588 | |
Permanent differences | | | 364 | | | | 656 | | | | 570 | |
State income tax expense (benefit) | | | (1,134 | ) | | | 707 | | | | 390 | |
Tax effect of foreign income taxed at different rate | | | 205 | | | | 334 | | | | 43 | |
Change in valuation allowance | | | 4,302 | | | | 268 | | | | — | |
Foreign tax credits | | | (279 | ) | | | (76 | ) | | | (241 | ) |
Non-deductible stock compensation | | | — | | | | — | | | | 1,740 | |
Other | | | — | | | | (6 | ) | | | — | |
| | | | | | | | | | | | |
Total income tax expense from continuing operations | | $ | 644 | | | $ | 14,749 | | | $ | 11,090 | |
| | | | | | | | | | | | |
66
Educate, Inc.
11. Comprehensive Income
The components of comprehensive income, net of related taxes, are as follows:
| | | | | | | | | | | |
| | | Year ended December 31, |
| | | 2006 | | | 2005 | | | 2004 |
Net income (loss) | | $ | (11,889 | ) | | $ | 15,405 | | | $ | 6,412 |
Change in fair value of derivative financial instruments | | | (360 | ) | | | 411 | | | | 303 |
Foreign currency translation adjustment | | | 2,486 | | | | (3,416 | ) | | | 661 |
| | | | | | | | | | | |
Comprehensive income (loss) | | $ | (9,763 | ) | | $ | 12,400 | | | $ | 7,376 |
| | | | | | | | | | | |
Income tax expense (benefit) related to the derivative financial instrument in the table above was $(204), $252 and $185 for the years ended December 31, 2006, 2005 and 2004, respectively. Income tax expense (benefit) related to the foreign currency translation adjustment in the table above was $(410) and $410 for the years ended December 31, 2005 and 2004, respectively.
The components of accumulated other comprehensive income are summarized as follows:
| | | | | | | | | | | | |
| | | Foreign Currency
Translation
Adjustment | | | Derivative
Financial
Instruments | | | Total | |
Balance at January 1, 2004 | | $ | 2,627 | | | $ | (125 | ) | | $ | 2,502 | |
Gains (losses) recorded in other comprehensive income, net of tax | | | 661 | | | | 303 | | | | 964 | |
| | | | | | | | | | | | |
Balance at December 31, 2004 | | | 3,288 | | | | 178 | | | | 3,466 | |
Gains (losses) recorded in other comprehensive income, net of tax | | | (3,416 | ) | | | 411 | | | | (3,005 | ) |
| | | | | | | | | | | | |
Balance at December 31, 2005 | | | (128 | ) | | | 589 | | | | 461 | |
Gains (losses) recorded in other comprehensive income, net of tax | | | 2,486 | | | | (360 | ) | | | 2,126 | |
| | | | | | | | | | | | |
Balance at December 31, 2006 | | $ | 2,358 | | | $ | 229 | | | $ | 2,587 | |
| | | | | | | | | | | | |
12. Earnings Per Share
Basic earnings (loss) per common share is computed by dividing net income (loss) by the weighted average number of common shares outstanding for the period. Diluted earnings (loss) per common share include the potential dilution that could occur if securities or other contracts to issue common stock were exercised or converted into common stock.
67
Educate, Inc.
A reconciliation of the numerators and denominators for basic and diluted earnings (loss) per common share is as follows:
| | | | | | | | | | | | |
| | | Year ended December 31, | |
| | | 2006 | | | 2005 | | | 2004 | |
Numerator | | | | | | | | | | | | |
Income (loss) from continuing operations | | $ | (8,684 | ) | | $ | 22,011 | | | $ | 13,447 | |
Loss from discontinued operations, net of tax | | | (3,205 | ) | | | (6,606 | ) | | | (7,035 | ) |
| | | | | | | | | | | | |
Net income (loss) | | $ | (11,889 | ) | | $ | 15,405 | | | $ | 6,412 | |
| | | | | | | | | | | | |
Denominator (shares in thousands) | | | | | | | | | | | | |
Basic: | | | | | | | | | | | | |
Weighted-average shares outstanding | | | 42,933 | | | | 42,646 | | | | 38,637 | |
| | | | | | | | | | | | |
Diluted: | | | | | | | | | | | | |
Weighted-average shares outstanding | | | 42,933 | | | | 42,646 | | | | 38,637 | |
Dilutive effect of stock options | | | — | | | | 1,408 | | | | 1,210 | |
| | | | | | | | | | | | |
Total | | | 42,933 | | | | 44,054 | | | | 39,847 | |
| | | | | | | | | | | | |
Earnings (loss) per common share - basic | | | | | | | | | | | | |
Income (loss) from continuing operations | | $ | (0.20 | ) | | $ | 0.52 | | | $ | 0.35 | |
Loss from discontinued operations, net of tax | | | (0.08 | ) | | | (0.16 | ) | | | (0.18 | ) |
| | | | | | | | | | | | |
Net income (loss) | | $ | (0.28 | ) | | $ | 0.36 | | | $ | 0.17 | |
| | | | | | | | | | | | |
Earnings (loss) per common share - diluted | | | | | | | | | | | | |
Income (loss) from continuing operations | | $ | (0.20 | ) | | $ | 0.50 | | | $ | 0.34 | |
Loss from discontinued operations, net of tax | | | (0.08 | ) | | | (0.15 | ) | | | (0.18 | ) |
| | | | | | | | | | | | |
Net income (loss) | | $ | (0.28 | ) | | $ | 0.35 | | | $ | 0.16 | |
| | | | | | | | | | | | |
Because the Company reported a loss from continuing operations during the year ended December 31, 2006, all stock options were excluded from that year’s weighted-average shares outstanding computation. Since their exercise price exceeded the market value of the Company’s common stock, options to purchase 224,763 and 70,000 shares of common stock were excluded from the 2005 and 2004 computations, respectively, because the effect was antidilutive.
13. Dividend to Common Stockholders
In June 2004, the Company declared and paid a dividend to its existing stockholders in the amount of $9,000, or $0.24 per common share.
14. Employee Benefit Plan
The Company sponsors a defined contribution retirement plan under section 401(k) of the Internal Revenue Code. The provisions of this plan allow for voluntary employee contributions of up to 20% of salary, subject to certain annual limitations. All employees are eligible after meeting certain minimum service requirements.
The Company may at its discretion make matching contributions, which are allocated to eligible participants. The Company made discretionary contributions to this plan of 102,649 shares of Educate, Inc. common stock valued at $846 and $13 in cash during the year ended December 31, 2006 and $741 and $703 in cash during the years ended December 31, 2005 and 2004, respectively.
68
Educate, Inc.
15. Businesses and Geographic Segment Information
The Company is primarily organized on the basis of educational services or products provided. The Company operates through seven business segments that offer distinct supplemental education services and products from which revenues are earned. During the fourth quarter of 2006, management changed the manner in which it reviews segment operating performance, and increased the number of reporting segments to include Franchise Services, Catapult Learning, European, Company-Owned Centers, Educate Products, Progressus, and Educate Online. Additionally, Franchise Services, Catapult Learning and European segments are also reviewed together as “Educate Services” for financial analysis purposes due to common executive management. Segment revenues and operating income are presented on this basis for all periods. The following describes the Company’s reportable segments:
| | • | | Franchise Services - manages our system of franchised Sylvan Learning territories |
| | • | | Catapult Learning - provides tutoring and other supplemental education services, to eligible students in public and private schools through government-funded contracts |
| | • | | European - operates a network of company-owned and franchised centers providing tutoring in Germany and Austria |
| | • | | Company-Owned Centers - manages our network of company-owned Sylvan Learning territories |
| | • | | Educate Products - creates, manufactures, and sells educational products including the Hooked on Phonics early reading, math and study skills programs |
| | • | | Progressus - provides pediatric therapies such as physical, occupational and speech therapies to K-12 children with special education needs under contracts with school districts |
| | • | | Educate Online - provides online tutoring to students in the third through ninth grades |
The Company evaluates performance and allocates resources based on operating income. In the following tables, revenue of the Franchise Services segment and operating income of the Company-Owned Centers segment includes an intercompany royalty and other service fees from the Company-Owned Centers segment to the Franchise Services segment which were $11,936, $10,779 and $8,024 during the years ended December 31, 2006, 2005 and 2004, respectively. The “Corporate and Eliminations” column combines the elimination of intercompany transactions and general and administrative expenses that are not allocated to segments, which are necessary to reconcile the respective line items to the consolidated financial statements. All other significant intercompany sales or transfers are eliminated.
69
Educate, Inc.
The following tables set forth information on the Company’s reportable segments:
| | | | | | | | | | | | | | | | | | | | | | | | | | | | | | | | | | | | | | | | |
Year ended December
31, | | | | | | | | | | | | | | | | | | | | | | | | | | | | | | |
2006 | | Franchise
Services | | | Catapult
Learning | | | European | | | Subtotal -
Educate
Services | | | Company-
Owned
Centers | | | Educate
Products | | | Progressus | | | Educate
Online | | | Corporate &
Eliminations | | | Total | |
Revenues | | $ | 59,670 | | | $ | 73,516 | | | $ | 35,103 | | | $ | 168,289 | | | $ | 143,848 | | | $ | 18,180 | | | $ | 21,954 | | | $ | 14,333 | | | $ | (11,936 | ) | | $ | 354,668 | |
| | | | | | | | | | | | | | | | | | | | | | | | | | | | | | | | | | | | | | | | |
Operating income before depreciation and amortization | | | 36,147 | | | | 14,077 | | | | 6,389 | | | | 56,613 | | | | (8,583 | ) | | | (13,270 | ) | | | 780 | | | | (3,098 | ) | | | (18,052 | ) | | | 14,390 | |
Depreciation and amortization (1) | | | (558 | ) | | | (740 | ) | | | (490 | ) | | | (1,788 | ) | | | (4,376 | ) | | | (271 | ) | | | (49 | ) | | | (346 | ) | | | (1,617 | ) | | | (8,447 | ) |
| | | | | | | | | | | | | | | | | | | | | | | | | | | | | | | | | | | | | | | | |
Operating income (loss) | | $ | 35,589 | | | $ | 13,337 | | | $ | 5,899 | | | $ | 54,825 | | | $ | (12,959 | ) | | $ | (13,541 | ) | | $ | 731 | | | $ | (3,444 | ) | | $ | (19,669 | ) | | $ | 5,943 | |
| | | | | | | | | | | | | | | | | | | | | | | | | | | | | | | | | | | | | | | | |
Total expenditures for additions to long-lived assets | | | 3,194 | | | | 408 | | | | 826 | | | | 4,428 | | | | 9,243 | | | | 6,322 | | | | 40 | | | | 744 | | | | — | | | | 20,777 | |
| | | | | | | | | | | | | | | | | | | | | | | | | | | | | | | | | | | | | | | | |
2005 | | | | | | | | | | | | | | | | | | | | | | | | | | | | | | |
Revenues | | $ | 62,417 | | | $ | 67,641 | | | $ | 30,340 | | | $ | 160,398 | | | $ | 134,736 | | | $ | 23,638 | | | $ | 18,519 | | | $ | 3,902 | | | $ | (10,779 | ) | | $ | 330,414 | |
| | | | | | | | | | | | | | | | | | | | | | | | | | | | | | | | | | | | | | | | |
Operating income before depreciation and amortization | | | 36,709 | | | | 15,453 | | | | 5,887 | | | | 58,049 | | | | 6,791 | | | | 5,727 | | | | 179 | | | | (3,594 | ) | | | (14,720 | ) | | | 52,432 | |
Depreciation and amortization (1) | | | (310 | ) | | | (650 | ) | | | (440 | ) | | | (1,400 | ) | | | (3,228 | ) | | | (248 | ) | | | (45 | ) | | | (228 | ) | | | (1,638 | ) | | | (6,787 | ) |
| | | | | | | | | | | | | | | | | | | | | | | | | | | | | | | | | | | | | | | | |
Operating income (loss) | | $ | 36,399 | | | $ | 14,803 | | | $ | 5,447 | | | $ | 56,649 | | | $ | 3,563 | | | $ | 5,479 | | | $ | 134 | | | $ | (3,822 | ) | | $ | (16,358 | ) | | $ | 45,645 | |
| | | | | | | | | | | | | | | | | | | | | | | | | | | | | | | | | | | | | | | | |
Total expenditures for additions to long-lived assets | | | 6,212 | | | | 949 | | | | 532 | | | | 7,693 | | | | 9,003 | | | | 1,696 | | | | 46 | | | | 533 | | | | — | | | | 18,971 | |
| | | | | | | | | | | | | | | | | | | | | | | | | | | | | | | | | | | | | | | | |
2004 | | | | | | | | | | | | | | | | | | | | | | | | | | | | | | |
Revenues | | $ | 59,011 | | | $ | 72,156 | | | $ | 27,502 | | | $ | 158,669 | | | $ | 100,296 | | | $ | — | | | $ | 19,250 | | | $ | 2,933 | | | $ | (8,024 | ) | | $ | 273,124 | |
| | | | | | | | | | | | | | | | | | | | | | | | | | | | | | | | | | | | | | | | |
Operating income before depreciation and amortization | | | 37,434 | | | | 16,975 | | | | 5,162 | | | | 59,571 | | | | 10,362 | | | | — | | | | (235 | ) | | | (4,110 | ) | | | (21,092 | ) | | | 44,496 | |
Depreciation and amortization (1) | | | (544 | ) | | | (726 | ) | | | (360 | ) | | | (1,630 | ) | | | (2,631 | ) | | | — | | | | (39 | ) | | | (326 | ) | | | (1,674 | ) | | | (6,300 | ) |
| | | | | | | | | | | | | | | | | | | | | | | | | | | | | | | | | | | | | | | | |
Operating income (loss) | | $ | 36,890 | | | $ | 16,249 | | | $ | 4,802 | | | $ | 57,941 | | | $ | 7,731 | | | $ | — | | | $ | (274 | ) | | $ | (4,436 | ) | | $ | (22,766 | ) | | $ | 38,196 | |
Total expenditures for additions to long-lived assets | | | 6,805 | | | | 2,876 | | | | 424 | | | | 10,105 | | | | 3,258 | | | | — | | | | 23 | | | | 154 | | | | — | | | | 13,540 | |
| | | | | | | | | | | | | | | | | | | | | | | | | | | | | | | | | | | | | | | | |
| (1) | excludes amortization of copyrights and computer software and media intangible assets |
70
Educate, Inc.
The following tables reconcile operating income from reportable segments in the table above to income (loss) from continuing operations before income taxes reported in the consolidated statements of operations and segment assets to total assets reported on the consolidated balance sheets:
| | | | | | | | | | | | |
| | | Year ended December 31, | |
| | | 2006 | | | 2005 | | | 2004 | |
Total operating income from reportable segments | | $ | 5,943 | | | $ | 45,645 | | | $ | 38,196 | |
Interest income | | | 411 | | | | 411 | | | | 380 | |
Interest expense | | | (12,759 | ) | | | (7,932 | ) | | | (9,778 | ) |
Other financing costs | | | (1,149 | ) | | | (1,506 | ) | | | (5,420 | ) |
Foreign exchange gains (losses) and other | | | (486 | ) | | | 142 | | | | 1,159 | |
| | | | | | | | | | | | |
Income (loss) from continuing operations before income taxes | | $ | (8,040 | ) | | $ | 36,760 | | | $ | 24,537 | |
| | | | | | | | | | | | |
| | | | | | | | | |
| | | December 31, |
| | | 2006 | | 2005 | | 2004 |
Franchise Services segment assets | | $ | 235,863 | | $ | 235,189 | | $ | 230,219 |
Catapult Learning segment assets | | | 30,600 | | | 38,553 | | | 38,667 |
European segment assets | | | 33,243 | | | 30,026 | | | 44,335 |
| | | | | | | | | |
Total Educate Services | | | 299,706 | | | 303,768 | | | 313,221 |
Company-Owned Centers segment assets | | | 92,925 | | | 89,718 | | | 35,028 |
Educate Products segment assets | | | 44,097 | | | 26,384 | | | — |
Progressus segment assets | | | 8,489 | | | 4,339 | | | 4,267 |
Educate Online segment assets | | | 6,720 | | | 2,326 | | | 960 |
| | | | | | | | | |
Total assets for reportable segments | | | 451,937 | | | 426,535 | | | 353,476 |
Unallocated corporate assets | | | 12,840 | | | 13,914 | | | 20,485 |
Assets of discontinued operations held for sale | | | — | | | 11,439 | | | 7,421 |
| | | | | | | | | |
Total assets | | $ | 464,777 | | $ | 451,888 | | $ | 381,382 |
| | | | | | | | | |
Revenues by geographic area are as follows:
| | | | | | | | | |
| | | Year ended December 31, |
| | | 2006 | | 2005 | | 2004 |
United States | | $ | 312,978 | | $ | 296,160 | | $ | 243,620 |
Germany | | | 34,698 | | | 29,958 | | | 27,197 |
Other | | | 6,992 | | | 4,296 | | | 2,307 |
| | | | | | | | | |
Consolidated total | | $ | 354,668 | | $ | 330,414 | | $ | 273,124 |
| | | | | | | | | |
Revenues are attributed to countries based on the location of the customer. No country other than the United States represents more than 10% of consolidated revenues for any period presented. Substantially all long-lived assets are located in the United States.
Information regarding the number of Sylvan Learning Centers is as follows:
| | | | | | |
| | | December 31,
2006 | | December 31,
2005 | | December 31,
2004 |
During the year ended: | | | | | | |
Franchises sold, net of closures | | 10 | | 58 | | 66 |
Franchises purchased | | 3 | | 78 | | 32 |
| | | |
At December 31, | | | | | | |
Franchisee-owned | | 883 | | 876 | | 896 |
Company-owned | | 251 | | 245 | | 163 |
71
Educate, Inc.
16. Quarterly Financial Data (Unaudited, dollar amounts in thousands, except per share data)
The following tables present certain unaudited consolidated quarterly financial information for each of the eight quarters ended December 31, 2006. This quarterly information has been prepared on the same basis as the consolidated financial statements and includes all adjustments necessary to state fairly the information for the periods presented. The results of operations for any quarter are not necessarily indicative of results for the full year or for any future period.
During the fourth quarter of 2006, as a result of the Company’s identification of a revenue recognition material weakness related to cut-off, the Company performed a review of the timing of revenue recognition for product shipments by the Educate Products segment for each of the quarters during 2006. As a result of the review, management concluded that an error was made in the quarter ended June 30, 2006 through the recordation of revenue and cost of goods sold on certain shipments of product prior to the time that title was transferred to the customer as specified by customer terms. As a result of this error, revenue and cost of goods sold in the amount of $3,467 and $1,024 respectively, originally recorded in the quarter ended June 30, 2006, should have been recorded in the quarter ended September 30, 2006. The amounts presented in the table below for these two quarters have been restated to correct the error.
| | | | | | | | | | | | | | | | |
| | | Quarter Ended | |
2006 | | March 31 | | | June 30 | | | September 30 | | | December 31 | |
| | | | | | (Restated) | | | (Restated) | | | | |
Net revenues | | $ | 92,925 | | | $ | 99,024 | | | $ | 84,787 | | | $ | 77,932 | |
Instructional and franchise operations costs | | | 68,081 | | | | 69,920 | | | | 61,043 | | | | 67,097 | |
Cost of goods sold | | | 4,155 | | | | 2,783 | | | | 6,538 | | | | 7,024 | |
Operating income (loss) | | | 5,915 | | | | 10,519 | | | | 1,850 | | | | (12,340 | ) |
Income tax (expense) benefit | | | (870 | ) | | | (2,967 | ) | | | (2,373 | ) | | | 5,565 | |
Income (loss) from continuing operations | | | 1,360 | | | | 4,409 | | | | (3,824 | ) | | | (10,629 | ) |
Discontinued operations, net of tax and loss on disposal | | | 1,973 | | | | (1,590 | ) | | | (3,198 | ) | | | (390 | ) |
| | | | | | | | | | | | | | | | |
Net income (loss) | | $ | 3,333 | | | $ | 2,819 | | | $ | (7,022 | ) | | $ | (11,019 | ) |
| | | | | | | | | | | | | | | | |
Net income (loss) per share - basic | | $ | 0.08 | | | $ | 0.07 | | | $ | (0.16 | ) | | $ | (0.26 | ) |
| | | | | | | | | | | | | | | | |
Net income (loss) per share – diluted | | $ | 0.08 | | | $ | 0.06 | | | $ | (0.16 | ) | | $ | (0.26 | ) |
| | | | | | | | | | | | | | | | |
Weighted average shares (in thousands): | | | | | | | | | | | | | | | | |
Basic | | | 42,751 | | | | 42,917 | | | | 42,981 | | | | 43,080 | |
Diluted | | | 43,844 | | | | 43,758 | | | | 42,981 | | | | 43,080 | |
| | | | | | | | | | | | | | | |
| | | Quarter Ended | |
2005 | | March 31 | | June 30 | | | September 30 | | | December 31 | |
Net revenues | | $ | 82,495 | | $ | 92,735 | | | $ | 78,540 | | | $ | 76,644 | |
Instructional and franchise operations costs | | | 52,735 | | | 53,763 | | | | 51,948 | | | | 58,661 | |
Cost of goods sold | | | 3,916 | | | 4,233 | | | | 3,601 | | | | 4,330 | |
Operating income | | | 12,621 | | | 22,273 | | | | 10,314 | | | | 437 | |
Income tax expense | | | 4,157 | | | 7,188 | | | | 3,189 | | | | 215 | |
Income (loss) from continuing operations | | | 6,782 | | | 11,728 | | | | 5,204 | | | | (1,703 | ) |
Discontinued operations, net of tax | | | 711 | | | (1,750 | ) | | | (2,537 | ) | | | (3,030 | ) |
| | | | | | | | | | | | | | | |
Net income (loss) | | | 7,493 | | | 9,978 | | | | 2,667 | | | | (4,733 | ) |
| | | | | | | | | | | | | | | |
Net income (loss) per share - basic | | $ | 0.18 | | $ | 0.23 | | | $ | 0.06 | | | $ | (0.11 | ) |
| | | | | | | | | | | | | | | |
Net income (loss) per share – diluted | | $ | 0.17 | | $ | 0.23 | | | $ | 0.06 | | | $ | (0.11 | ) |
| | | | | | | | | | | | | | | |
Weighted average shares (in thousands): | | | | | | | | | | | | | | | |
Basic | | | 42,586 | | | 42,598 | | | | 42,672 | | | | 42,725 | |
Diluted | | | 44,022 | | | 44,010 | | | | 44,166 | | | | 44,016 | |
72
Educate, Inc.
The table above presents quarterly information as if Education Station had been classified as a discontinued operation as of January 1, 2005. Results for the quarter ended September 30, 2006 include the disposal of Education Station. Discontinued operations are more fully discussed in Note 2.
Results for the quarter ended June 30, 2005 included $1,500 of expense related to the substantial modification of our term debt facility.
Results for the quarter ended March 31, 2006 included $1,100 of expense related to the refinancing of our credit facility, which is more fully discussed in Note 6.
During the quarter ended September 30, 2006, the Company recorded a valuation allowance of approximately $1,700 to fully reserve certain historical net state deferred tax assets due to uncertainty surrounding the future realization of these state tax benefits because of declines in operating results.
17. Liquidity and Capital Resources
As discussed more fully in Note 6, the Company maintains a credit facility that requires compliance with certain financial covenants. On March 15, 2007, the Company obtained a waiver of violations of these financial covenants as of December 31, 2006 and March 31, 2007 from its bank syndicate. The Company believes it will fail to comply with these same financial covenants at subsequent quarterly reporting dates in 2007, and accordingly, will need to obtain waivers or amend the terms of the credit facility to avoid triggering the facility’s demand repayment provisions. As a result, the Company classified the $175,844 of outstanding borrowings under the credit facility at December 31, 2006 as a current liability in the accompanying 2006 consolidated balance sheet, resulting in a working capital deficit of $170,003.
Management considered attempting to negotiate revised financial covenants to allow for compliance in 2007 based on projected operating results. However, because the Company has entered into a definitive merger agreement for the sale of the Company and expects to close that transaction by June 30, 2007, the Company determined it was not prudent to negotiate new terms and incur additional costs to amend its credit facility. However, there can be no assurance that lenders will waive their right to demand repayment of outstanding borrowings upon the likely default of the credit facility’s provisions in the June 30, 2007 and subsequent quarterly reporting periods, and in the event of demanded repayment, that the Company can refinance the loans on acceptable terms or meet its obligations in the ordinary course of business. The 2006 financial statements do not include any adjustments to reflect the possible future effects on the recoverability and classification of assets or the amounts and classification of liabilities that may result from the outcome of this uncertainty.
73
Educate, Inc.
| Item 9. | Changes in and Disagreements with Accountants on Accounting and Financial Disclosure. |
There were no changes in accountants, disagreements, or other events requiring disclosure under this Item.
| Item 9A. | Controls and Procedures. |
The Company’s management, with the participation of our principal executive and principal financial officers, has evaluated the effectiveness of our disclosure controls and procedures (as defined in Rules 13a-15(e) and 15d-15(e) of the Securities Exchange Act of 1934, as amended (the “Exchange Act”)) as of December 31, 2006. Disclosure controls and procedures are designed to provide reasonable assurance that the information required to be disclosed in reports that the Company files or submits under the Exchange Act has been appropriately recorded, processed, summarized and reported within the time periods specified in the SEC’s rules and forms, and that such information is accumulated and communicated to the Company’s management, including its principal executive and principal financial officers, to allow timely decisions regarding required disclosure. Based on this evaluation, our Chief Executive Officer and Chief Financial Officer concluded that, as a result of the material weakness set forth below, our disclosure controls and procedures were not effective as of December 31, 2006.
After management concluded that there was a material weakness, we performed additional analyses and other post-closing procedures to determine that our consolidated financial statements included in this Annual Report on Form 10-K were prepared in accordance with generally accepted accounting principles and present fairly in all material respects our financial position, results of operations and cash flows for the periods presented.
There was no change in our internal control over financial reporting during the fourth quarter of the year ended December 31, 2006 that has materially affected, or is reasonably likely to materially affect, our internal control over financial reporting.
MANAGEMENT’S REPORT ON INTERNAL CONTROL OVER FINANCIAL REPORTING
The Company’s management is responsible for establishing and maintaining adequate internal control over financial reporting (as defined in Rule 13a-15(f) under the Securities Exchange Act of 1934, as amended). The Company’s internal control system was designed to provide reasonable assurance regarding the preparation and fair presentation of published financial statements. Because of its inherent limitations, internal control over financial reporting may not prevent or detect misstatements. Also, projections of any evaluation of effectiveness to future periods are subject to the risk that controls may become inadequate because of changes in conditions, or that the degree of compliance with the policies or procedures may deteriorate. Under the supervision and with the participation of Company’s management, including the Chief Executive Officer and Chief Financial Officer, the Company evaluated the effectiveness of the design and operation of the its internal control over financial reporting based on the framework in Internal Control – Integrated Framework issued by the Committee of Sponsoring Organizations of the Treadway Commission (“COSO”).
A material weakness, as defined under standards established by the Public Company Accounting Oversight Board’s Auditing Standard No. 2, is a control deficiency, or combination of control deficiencies, that results in more than a remote likelihood that a material misstatement of annual or interim financial statements would not be prevented or detected.
Based on management’s assessment of the effectiveness of internal control over financial reporting, the Company’s Chief Executive Officer and Chief Financial Officer concluded that the Company’s internal control over financial reporting was not effective as of December 31, 2006 because of the following material weakness:
We identified certain transactions recorded as revenue by our Educate Products division in 2006 that did not meet the criteria for revenue recognition in such period. The year ended December 31, 2006 was the initial year that Educate Products was subject to the provisions of Section 404 of the Sarbanes Oxley Act of 2002 concerning the effectiveness of the design and operation of its internal control over financial reporting. The errors identified were the result of a deficiency in the operation of controls requiring the supervisory review of transaction documentation to ensure proper revenue cutoff at period end. Specifically, key contract terms specifying when title to products shipped was transferred to the customer and related shipping documents were not properly reviewed and evaluated by responsible officials of the Company prior to recording revenue in the accounting records. The errors associated with these transactions resulted in an audit adjustment to correct an overstatement of recorded revenue of approximately $2.3 million, and an understatement of loss from continuing operations of approximately $1.1 million for the year ended December 31, 2006.
74
Educate, Inc.
Ernst & Young LLP, the Company’s independent registered public accounting firm, audited management’s assessment of the effectiveness of internal control over financial reporting and, based on that audit, issued the report set forth on the following page.
REMEDIATION OF MATERIAL WEAKNESS
Management is required to ensure that its personnel throughout all areas of the Company have the competence, resources, training, and supervision to successfully perform their assigned duties; that policies and procedures necessary for their assigned levels of responsibility are in place; and that sufficient staff is present to effectively perform all processes necessary to maintaining a proper internal control environment. Management is also responsible for maintaining effective internal control processes over its financial close and reporting process.
In order to remediate the aforementioned material weakness, management is taking the following actions:
| | i. | Improving training, education, documentation and accounting reviews designed to ensure that all relevant personnel involved in sale transactions understand and apply proper revenue recognition accounting. |
| | ii. | Reviewing all shipping terms and documentation to ensure proper revenue recognition in accordance with the terms of our agreements with our customers; and |
| | iii. | Reviewing all existing and new sales agreements to ensure that proper revenue recognition occurs. |
We primarily began these remediation steps subsequent to December 31, 2006 and expect to finalize them during the first quarter of 2007.
The Audit Committee of the Board of Directors has been informed of our assessment of our internal controls environment and the above material weakness conclusion. They are being updated as to our remediation progress, and we would expect this communication to continue until all control deficiency issues are addressed and remediated to their satisfaction.
75
Educate, Inc.
Report of Independent Registered Public Accounting Firm
The Board of Directors and Shareholders of Educate, Inc.
We have audited management’s assessment, included in the accompanying Management’s Report on Internal Control Over Financial Reporting, that Educate, Inc. did not maintain effective internal control over financial reporting as of December 31, 2006, because of the effect of the material weakness described below, based on criteria established in Internal Control—Integrated Framework issued by the Committee of Sponsoring Organizations of the Treadway Commission (the COSO criteria). Educate, Inc’s management is responsible for maintaining effective internal control over financial reporting and for its assessment of the effectiveness of internal control over financial reporting. Our responsibility is to express an opinion on management’s assessment and an opinion on the effectiveness of the company’s internal control over financial reporting based on our audit.
We conducted our audit in accordance with the standards of the Public Company Accounting Oversight Board (United States). Those standards require that we plan and perform the audit to obtain reasonable assurance about whether effective internal control over financial reporting was maintained in all material respects. Our audit included obtaining an understanding of internal control over financial reporting, evaluating management’s assessment, testing and evaluating the design and operating effectiveness of internal control, and performing such other procedures as we considered necessary in the circumstances. We believe that our audit provides a reasonable basis for our opinion.
A company’s internal control over financial reporting is a process designed to provide reasonable assurance regarding the reliability of financial reporting and the preparation of financial statements for external purposes in accordance with generally accepted accounting principles. A company’s internal control over financial reporting includes those policies and procedures that (1) pertain to the maintenance of records that, in reasonable detail, accurately and fairly reflect the transactions and dispositions of the assets of the company; (2) provide reasonable assurance that transactions are recorded as necessary to permit preparation of financial statements in accordance with generally accepted accounting principles, and that receipts and expenditures of the company are being made only in accordance with authorizations of management and directors of the company; and (3) provide reasonable assurance regarding prevention or timely detection of unauthorized acquisition, use, or disposition of the company’s assets that could have a material effect on the financial statements.
Because of its inherent limitations, internal control over financial reporting may not prevent or detect misstatements. Also, projections of any evaluation of effectiveness to future periods are subject to the risk that controls may become inadequate because of changes in conditions, or that the degree of compliance with the policies or procedures may deteriorate.
A material weakness is a control deficiency, or combination of control deficiencies, that results in more than a remote likelihood that a material misstatement of the annual or interim financial statements will not be prevented or detected. The following material weakness has been identified and included in management’s assessment. The internal controls designed to determine that revenue from product sales are recorded in the proper period were not functioning as designed. Specifically, key contract terms specifying when title to products shipped was transferred to the customer were not reviewed and evaluated by responsible accounting officials of the Company prior to recording revenue in the accounting records. This material weakness in internal control resulted in audit adjustments that reversed revenue previously recorded in December 2006 and that had corresponding effects on accounts receivable, inventory and cost of goods sold. This material weakness was considered in determining the nature, timing, and extent of audit tests applied in our audit of the 2006 financial statements, and this report does not affect our report dated March 15, 2007 on those financial statements.
In our opinion, management’s assessment that Educate, Inc. did not maintain effective internal control over financial reporting as of December 31, 2006, is fairly stated, in all material respects, based on the COSO criteria. Also, in our opinion, because of the effect of the material weakness described above on the achievement of the objectives of the control criteria, Educate, Inc. has not maintained effective internal control over financial reporting as of December 31, 2006, based on the COSO criteria.
/s/ Ernst & Young LLP
Baltimore, Maryland
March 15, 2007
76
Educate, Inc.
| Item 9B. | Other Information. |
None.
PART III.
| Item 10. | Directors, Executive Officers and Corporate Governance. |
The following table sets forth certain information regarding our directors and executive officers as of March 1, 2007.
| | | | |
Name | | Age | | Position(s) |
R. Christopher Hoehn-Saric | | 44 | | Chief Executive Officer; Chairman of the Board of Directors |
Peter J. Cohen | | 52 | | President, Chief Operating Officer |
Kevin E. Shaffer | | 44 | | Chief Financial Officer |
Jeffrey H. Cohen | | 41 | | President, Catapult Learning segment |
Christopher Paucek | | 36 | | President, Educate Products |
C. Alan Schroeder | | 49 | | General Counsel, Secretary |
Douglas L. Becker | | 41 | | Director |
Laurence Berg | | 40 | | Director |
Michael F. Devine, III | | 48 | | Director |
David W. Hornbeck | | 65 | | Director |
Cheryl Krongard | | 51 | | Director |
Aaron Stone | | 34 | | Director |
Michael D. Weiner | | 54 | | Director |
Raul Yzaguirre | | 67 | | Director |
R. Christopher Hoehn-Saric became our Chief Executive Officer in July 2003 and Chairman of our Board of Directors in April 2004. From February 2000 until July 2003, he was Chairman and Chief Executive Officer of Sylvan Ventures, the incubator subsidiary of our predecessor, Sylvan Learning Systems, Inc., which is now known as Laureate. He served as Chairman of the Board of Sylvan Learning Systems, Inc. from April 1993 until February 2000 and as co-Chief Executive Officer of Sylvan Learning Systems, Inc. from December 1995 until February 2000. He also served as Sylvan Learning Systems, Inc. President from 1988 to 1993. He was a member of Sylvan Learning Systems, Inc.’s Board of Directors from 1986 through July 2003 and has been a member of Laureate’s Board of Directors since July 2003.
Peter J. Cohen became our President and Chief Operating Officer in July 2003. In January 2006 he also became President of the Learning Center segment of our Company. From February 2000 until July 2003, he was President and Chief Operating Officer of Sylvan Learning Systems, Inc., which is now known as Laureate Education, Inc. He joined Sylvan Learning Systems, Inc. in 1996 as President of the Sylvan Learning Centers division. From 1994 to 1996, he served as Chief Executive Officer of The Pet Practice, Inc., a national chain of branded pet hospitals.
Kevin E. Shaffer became our Chief Financial Officer in July 2003. From June 1999 until July 2003 he served as Vice President of Finance and Corporate Controller of Sylvan Learning Systems, Inc., which is now known as Laureate Education, Inc. Prior to joining Sylvan Learning Systems, Inc., he was an executive with Ernst & Young LLP, providing audit and consulting services to clients in a variety of industries from 1984 to 1999.
Jeffrey H. Cohen became the President of Catapult Learning in July 2003. He previously served in that role with Sylvan Learning Systems, Inc., which is now known as Laureate Education, Inc., from August 2001 to July 2003. Prior to joining Sylvan Learning Systems, Inc., from February 1998 until July 2001, he was with Prometric, Inc., a provider of computer-based assessment and examination services, serving first as the Vice President of Prometric’s Academic, Professional and Corporate Services Business Unit and later as the Senior Vice President for Business Unit Management. He also served as a political appointee in the Clinton Administration.
77
Educate, Inc.
Christopher (Chip) J. Paucek became the President of Educate Products in November 2005. From January 2005 to November 2005 he was General Manager of Hooked on Phonics and from July 2004 to January 2005 he was Vice President of Corporate Business Development for Educate, Inc. From January 2004 to November 2004, he was Deputy Campaign Manager of U.S. Senator Barbara Mikulski’s 2004 re-election campaign. In December 1993, he founded Cerebellum Corporation and served as Co-Chief Executive Officer from that month until January 2004. Cerebellum Corporation sold products under the Cerebellum and Standard Deviants brands and produced, among other things, the PBS television series Standard Deviants.
C. Alan Schroeder became General Counsel and Secretary in August 2004. Previously, Mr. Schroeder was Of Counsel to Piper Rudnick LLP from May 2002 to August 2004. From March 1994 to January 2002, Mr. Schroeder was Executive Vice President—General Counsel and Secretary of Prime Retail, Inc., an owner of shopping centers. On September 12, 2000, Mr. Schroeder was elected director and officer of E-Outlets Resolution Corporation, a subsidiary of Prime Retail, Inc., for the sole purpose of executing the bankruptcy filings of E-Outlets Resolution Corporation, which had ceased operations on April 4, 2000. The bankruptcy petition was filed November 6, 2000.
Douglas L. Becker has served as one of our directors since September 2004. Since February 2000, Mr. Becker has been the Chairman and Chief Executive Officer of Laureate Education, Inc., which was known prior to May 2004 as Sylvan Learning Systems, Inc. (together, “Laureate”). Previously, Mr. Becker served as President and co-Chief Executive Officer of Laureate since April 1993. From February 1991 until April 1993, Mr. Becker was the Chief Executive Officer of the Sylvan Learning Center Division of Laureate. Mr. Becker also serves as a director of Constellation Energy Corporation.
Laurence Berg. Mr. Berg has served as one of our directors since March 2003 and served as Chairman of our Board of Directors from March 2003 to April 2004. Mr. Berg is a senior partner of Apollo Advisors, L.P., which, together with its affiliates, acts as managing general partner of the Apollo Investment Funds, a series of private securities investment funds. He has worked at Apollo since 1992. Prior to joining Apollo, Mr. Berg was a member of the Mergers and Acquisition Group at Drexel Burnham Lambert. Mr. Berg is also a director of Goodman Global Holdings, Jacuzzi Bath Inc., Rent-A-Center, Inc., and Rexnord Inc.
Michael F. Devine, III.Mr. Devine has served as one of our directors since December 2004. Mr. Devine is the Senior Vice President and Chief Financial Officer of Coach, Inc., a designer, producer, and marketer of fine accessories and gifts. He has served in that position since December 2001. Prior to joining Coach, Inc., from 2000 to 2001, Mr. Devine was Executive Vice President and Chief Financial Officer of Mothers Work, Inc., the world’s largest designer, manufacturer and retailer of maternity apparel. From 1997 to 2000, Mr. Devine served as Chief Financial Officer, Treasurer and Secretary of Strategic Distribution, Inc. Prior to that, from 1995 to 1997, Mr. Devine was Chief Financial Officer of Industrial Systems Associates, a subsidiary of Strategic Distribution, Inc. Mr. Devine previously held Director of Operations and Director of Finance positions at McMaster-Carr Supply Company from 1989 to 1995 and progressively senior finance positions at Honeywell, Inc. from 1980 to 1989.
David Hornbeck.Mr. Hornbeck has served as one of our directors since September 2004. Mr. Hornbeck is President of the Children’s Defense Fund. From October 2003 to December 2004, Mr. Hornbeck was President and Chief Executive Officer of the International Youth Foundation (“IYF”), a public foundation dedicated to bringing resources and attention to the needs of young people around the world. He remains a member of the Board of Directors, an officer and a full-time employee of IYF. From 2000 to 2003, Mr. Hornbeck was self-employed as a writer and consultant. Previously, Mr. Hornbeck served as Superintendent of the Philadelphia Public Schools for six years and State Superintendent of Schools in Maryland for 12 years.
Cheryl Krongard.Ms. Krongard has served as one of our directors since June 2004. Ms. Krongard was nominated for election by Apollo. Ms. Krongard is a private investor. Ms. Krongard is a former partner of Apollo Advisors, L.P., where she worked from 2002 until 2004. Ms. Krongard was the Chief Executive Officer of Rothschild Asset Management from 1995 to 2000. She served as Senior Managing Director for Rothschild North America from 1993 until 2000. Ms. Krongard is a director of U.S. Airways Group, Inc. and Legg Mason, Inc. She is a Governor of the Iowa State University Board of Governors. Ms. Krongard is also a member of the Dean’s Advisory Council, Iowa State University College of Business. She is a director of the Investment Committee for the Iowa State University Foundation. She is Trustee of the Mount Sinai Medical Center.
Aaron Stone. Mr. Stone has served as one of our directors since April 2004. Mr. Stone is a partner of Apollo Advisors, L.P., which, together with its affiliates, acts as managing general partner of the Apollo Investment Funds, a series of private securities investment funds. Mr. Stone has worked at Apollo since 1997. Prior to joining Apollo, Mr. Stone was a member of the Mergers and Acquisition Group at Smith Barney, Inc. Mr. Stone is also a director of AMC Entertainment Inc., Hughes Communications, Inc., Intelsat, Ltd., and SkyTerra Communications, Inc.
78
Educate, Inc.
Michael D. Weiner.Mr. Weiner has served as one of our directors since April 2006. Mr. Weiner was nominated for election by Apollo. Since September 2006, Mr. Weiner has served as Chief Legal Officer and General Counsel of Ares Management, Inc., a private investment management firm. From 1992 until August 2006, Mr. Weiner served as the General Counsel of Apollo Management, L.P. Before joining Apollo in 1992, Mr. Weiner was a partner with Morgan, Lewis & Bockius, specializing in securities law, public and private financings, and corporate and commercial transactions. Mr. Weiner is also a director of Hughes Communications, Inc., SkyTerra Communications, Inc., and Goodman Global Holdings, Inc.
Raul Yzaguirre. Mr. Yzaguirre has served as one of our directors since September 2004. Mr. Yzaguirre is the Presidential Professor of Practice for Community Development and Civil Rights at Arizona State University. Mr. Yzaguirre resigned on January 1, 2005 from the post of President and Chief Executive Officer of National Council of LaRaza, a community development and public policy organization, a capacity in which he served since 1974. Mr. Yzaguirre is also a past Chairperson of the Independent Sector, a nonprofit coalition of over 850 corporate, foundation and voluntary organizations. He is the current Chairman of the board of directors of AARP Services, Inc., and was formerly a director of the Better Business Bureaus and Sears, Roebuck and Company.
Other information required by this item is incorporated by reference to the information to be set forth in the Company’s Definitive Proxy Statement or set forth in an amendment to this Annual Report on Form 10-K which will be filed on or before April 30, 2007.
The Company has adopted a Code of Business Conduct and Ethics for Directors and Employees (Code of Ethics), including the principal executive officer, principal financial officer, principal accounting officer and persons performing similar functions. Copies of the Code of Ethics are available free of charge by writing to Investor Relations at 1001 Fleet Street, Baltimore, Maryland 21202. Any waivers of the Code of Ethics must be approved, in advance, by the full Board of Directors. Any amendments to, or waivers from the Code of Ethics must be approved, in advance, by the full Board of Directors. Any amendments to, or waivers from the Code of Ethics that apply to executive officers and directors will be posted on the “Corporate Governance” section of our Internet website located atwww.educate-inc.com.
| Item 11. | Executive Compensation. |
Information required by this item is incorporated by reference to the information to be set forth in the Company’s Definitive Proxy Statement or set forth in an amendment to this Annual Report on Form 10-K which will be filed on or before April 30, 2007.
| Item 12. | Security Ownership of Certain Beneficial Owners and Management and Related Stockholder Matters. |
Information required by this item is incorporated by reference to the information to be set forth in the Company’s Definitive Proxy Statement or set forth in an amendment to this Annual Report on Form 10-K which will be filed on or before April 30, 2007.
| Item 13. | Certain Relationships and Related Transactions, and Director Independence. |
Information required by this item is incorporated by reference to the information to be set forth in the Company’s Definitive Proxy Statement or set forth in an amendment to this Annual Report on Form 10-K which will be filed on or before April 30, 2007.
| Item 14. | Principal Accounting Fees and Services. |
Information required by this item is incorporated by reference to the information to be set forth in the Company’s Definitive Proxy Statement or set forth in an amendment to this Annual Report on Form 10-K which will be filed on or before April 30, 2007.
| Item 15. | Exhibits, Financial Statement Schedules. |
(a) The following documents are filed as a part of this report:
The financial statements filed as a part of this report are included in the Index to the Financial Statements under Item 8 of this Annual Report on Form 10-K.
| | (2) | Financial Statement Schedules |
79
Educate, Inc.
The following consolidated financial statement schedules of Educate, Inc. are included in Item 15(a):
Educate, Inc.
Schedule I—Condensed Financial Information of Registrant
Schedule II—Valuation and Qualifying Accounts
All other schedules for which provision is made in the applicable accounting regulations of the SEC are not required under the related instructions or are inapplicable and, therefore, have been omitted.
| | |
| Exhibit | | |
| Number | | Description |
| |
| 2.1 | | Asset Purchase Agreement among Educate, Inc., Educate Operating Company, LLC, Apollo Sylvan, LLC, Apollo Sylvan II, LLC, Sylvan Learning Systems, Inc., Sylvan Ventures, L.L.C. and Apollo Management IV, L.P., dated as of March 10, 2003. (1) |
| |
| 2.2 | | Amendment No. 1 to Asset Purchase Agreement among Educate, Inc., Educate Operating Company, LLC, Apollo Sylvan, LLC, Apollo Sylvan II, LLC, Sylvan Learning Systems, Inc., Sylvan Ventures, L.L.C. and Apollo Management IV, L.P., dated as of June 30, 2003. (1) |
| |
| 2.3 | | Agreement and Plan of Merger, dated as of January 28, 2007, by and among Edge Acquisition, LLC, Edge Acquisition Corporation and Educate, Inc. (9) |
| |
| 3.1 | | Amended and Restated Certificate of Incorporation of Educate, Inc., a Delaware corporation. (2) |
| |
| 3.2 | | Amended and Restated By-Laws of Educate Inc., a Delaware corporation. (1) |
| |
| 3.3 | | Specimen of stock certificate for common stock. (1) |
| |
| 4.1 | | Form of Registration Rights Agreement, by and among Educate, Inc., and certain of its stockholders. (1) |
| |
| 10.1 | | $170,000,000 Amended and Restated Credit Agreement, dated as of April 28, 2005, among Educate Operating Company, LLC, the several banks and other financial institutions party thereto, Merrill Lynch Capital, as documentation agent and JPMorgan Chase Bank, N.A. as administrative agent. (3) |
| |
| 10.2 | | First Amendment, dated as of April 28, 2005, to the Guarantee and Collateral Agreement, dated as of April 27, 2004, among Educate, Inc., Educate Operating Company, LLC and the other guarantors party thereto in favor of JPMorgan Chase Bank, N.A. as administrative agent for the banks and other financial institutions party to the Amended and Restated Credit Agreement. (3) |
| |
| 10.3 | | Sublease, dated as of June 30, 2003, between Sylvan Learning Systems, Inc. and Educate Operating Company, LLC, for the property located at 1001 Fleet Street, Baltimore, Maryland 21202. (1) |
| |
| 10.4 | | Sublease, dated as of June 30, 2003, between Sylvan Learning Systems, Inc. and Educate Operating Company, LLC, for the property located at 506 S. Central, Baltimore, Maryland 21202. (1) |
| |
| 10.5 | | Shared Services Agreement, dated June 30, 2003, between Sylvan Learning Systems, Inc. and Educate Operating Company, LLC. (1) |
| |
| 10.6 | | Patent License Agreement, dated as of June 30, 2003, between Sylvan Learning Systems, Inc. and Educate, Inc. (1) |
| |
| 10.7 | | Employment Agreement of Christopher Hoehn-Saric, dated June 30, 2003. (1) |
80
Educate, Inc.
| | |
| 10.8 | | Indemnification Agreement between Educate, Inc. and Christopher Hoehn-Saric, dated June 30, 2000. (1) |
| |
| 10.9 | | Stock Subscription Agreement, dated June 30, 2003 among the stockholders party thereto and Educate, Inc. (1) |
| |
| 10.10 | | Stock Subscription Agreement, dated June 30, 2003 among Apollo Sylvan, LLC, Apollo Sylvan II, LLC and Educate, Inc. (1) |
| |
| 10.11 | | Educate, Inc. 2003 Omnibus Stock Incentive Plan. (1) |
| |
| 10.12 | | Indemnification Agreement. (1) |
| |
| 10.13 | | Nominating Agreement, dated as of July 26, 2004, among Educate, Inc., Apollo Sylvan, LLC and Apollo Sylvan II, LLC. (1) |
| |
| 10.14 | | Educate, Inc. 2004 Omnibus Stock Incentive Plan. (4) |
| |
| 10.15 | | Form of Employee Option Grant Agreement. (5) |
| |
| 10.16 | | Form of Director Option Grant Agreement. (5) |
| |
| 10.17 | | First Amendment and Consent, dated as of March 31, 2006, to the Amended and Restated Credit Agreement, dated as of April 28, 2005, among Educate Operating Company, LLC, the several banks and other financial institutions party thereto, Merrill Lynch Capital, as documentation agent, and JPMorgan Chase Bank, N.A., as administrative agent. (6) |
| |
| 10.18 | | Second Amendment, dated as of August 8, 2006, to the Amended and Restated Credit Agreement, dated as of April 28, 2005, among Educate Operating Company, LLC, the several banks and other financial institutions party thereto, Merrill Lynch Capital, as documentation agent, and JPMorgan Chase Bank, N.A., as administrative agent. (7) |
| |
| 10.19 | | Third Amendment, dated as of November 27, 2006, to the Amended and Restated Credit Agreement, dated as of April 28, 2005, among Educate Operating Company, LLC, the several banks and other financial institutions party thereto, Merrill Lynch Capital, as documentation agent, and JPMorgan Chase Bank, N.A., as administrative agent. (8) |
| |
| 10.20 | | Limited Guarantee, dated as of January 28, 2007, by Sterling Capital Partners, L.P. in favor of Educate, Inc. (9) |
| |
| 10.21 | | Limited Guarantee, dated as of January 28, 2007, by Sterling Capital Partners II, L.P. in favor of Educate, Inc. (9) |
| |
| 10.22 | | Limited Guarantee, dated as of January 28, 2007, by Citigroup Capital Partners II 2007 Citigroup Investment, L.P. in favor of Educate, Inc. (9) |
| |
| 10.23 | | Limited Guarantee, dated as of January 28, 2007, by Citigroup Capital Partners II Employee Master Fund, L.P. in favor of Educate, Inc. (9) |
| |
| 10.24 | | Limited Guarantee, dated as of January 28, 2007, by Citigroup Capital Partners II Onshore, L.P. in favor of Educate, Inc. (9) |
| |
| 10.25 | | Limited Guarantee, dated as of January 28, 2007, by Citigroup Capital Partners II Cayman Holdings, L.P. in favor of Educate, Inc. (9) |
| |
| 10.26 | | Limited Guarantee, dated as of January 28, 2007, by CGI CPE LLC in favor of Educate, Inc. (9) |
| |
| 21.1 | | List of Subsidiaries. |
| |
| 23.1 | | Consent of Ernst & Young LLP, Independent Registered Public Accounting Firm. |
| |
| 31(i).1 | | Certification of R. Christopher Hoehn-Saric pursuant to Section 302 of the Sarbanes-Oxley Act of 2002. |
| |
| 31(i).2 | | Certification of Kevin E. Shaffer pursuant to Section 302 of the Sarbanes-Oxley Act of 2002. |
| |
| 32.1 | | Certification of R. Christopher Hoehn-Saric pursuant to Section 906 of the Sarbanes-Oxley Act of 2002. |
| |
| 32.2 | | Certification of Kevin E. Shaffer pursuant to Section 906 of the Sarbanes-Oxley Act of 2002. |
| (1) | Incorporated by reference to our Registration Statement on Form S-1 (File No. 333-115496). |
| (2) | Incorporated by reference to the Registrant’s Registration Statement on Form 8-A filed on September 22, 2004. |
| (3) | Incorporated by reference to the Registrant’s Quarterly Report on Form 10-Q for the period ended March 31, 2005. |
81
Educate, Inc.
| (4) | Incorporated by reference to the Registrant’s Registration Statement on Form S-8 (File No. 333-121244). |
| (5) | Incorporated by reference to the Registrant’s Current Report on Form 8-K filed on September 30, 2004. |
| (6) | Incorporated by reference to our Quarterly Report on Form 10-Q for the quarter ended March 31, 2006. |
| (7) | Incorporated by reference to our Quarterly Report on Form 10-Q for the quarter ended June 30, 2006. |
| (8) | Incorporated by reference to the Registrant’s Current Report on Form 8-K filed on November 29, 2006. |
| (9) | Incorporated by reference to the Registrant’s Current Report on Form 8-K filed on January 29, 2007. |
82
SIGNATURES
Pursuant to the requirements of the Securities Exchange Act of 1934, the Registrant has duly caused this report to be signed on its behalf by the undersigned, thereunto duly authorized.
| | |
| EDUCATE, INC. |
| |
| By: | | /s/ Kevin E. Shaffer |
| Name: | | Kevin E. Shaffer |
| Title: | | Chief Financial Officer |
| |
| Date: | | March 16, 2007 |
Pursuant to the requirements of the Securities Exchange Act of 1934, this report has been signed below by the following persons on behalf of the Registrant and in the capacities indicated and on March 16, 2007.
| | |
Signature | | Capacity |
| |
/s/ R. Christopher Hoehn-Saric R. Christopher Hoehn-Saric | | Director, Chairman of the Board and Chief Executive Officer (Principal Executive Officer) |
| |
/s/ Kevin E. Shaffer Kevin E. Shaffer | | Chief Financial Officer (Principal Financial and Accounting Officer) |
| |
/s/ Douglas L. Becker Douglas L. Becker | | Director |
| |
/s/ Laurence Berg Laurence Berg | | Director |
| |
/s/ Michael F. Devine, III Michael F. Devine, III | | Director |
| |
/s/ David W. Hornbeck David W. Hornbeck | | Director |
| |
/s/ Cheryl Krongard Cheryl Krongard | | Director |
| |
/s/ Aaron Stone Aaron Stone | | Director |
| |
/s/ Michael D. Weiner Michael D. Weiner | | Director |
| |
/s/ Raul Yzaguirre Raul Yzaguirre | | Director |
83
Schedule I – Condensed Financial Information of Registrant
Educate, Inc.
Condensed Balance Sheets
(Dollar amounts in thousands)
| | | | | | | | | |
| | | December 31, 2006 | | December 31, 2005 | | December 31, 2004 |
Assets | | | | | | | | | |
Investment in and advances to subsidiaries | | $ | 204,981 | | $ | 211,708 | | $ | 197,701 |
| | | | | | | | | |
Total assets | | $ | 204,781 | | $ | 211,708 | | $ | 197,701 |
| | | | | | | | | |
| | | |
Stockholders’ equity | | | | | | | | | |
Common stock | | $ | 432 | | $ | 427 | | $ | 426 |
Additional paid in capital | | | 195,639 | | | 192,608 | | | 191,002 |
Retained earnings | | | 6,323 | | | 18,212 | | | 2,807 |
Accumulated other comprehensive income | | | 2,587 | | | 461 | | | 3,466 |
| | | | | | | | | |
Total stockholders’ equity | | $ | 204,981 | | $ | 211,708 | | $ | 197,701 |
| | | | | | | | | |
See accompanying notes to condensed financial information of registrant.
Schedule I – Condensed Financial Information of Registrant (Continued)
Educate, Inc.
Statements of Operations and Cash Flows
(Dollar amounts in thousands)
Statements of Operations
| | | | | | | | | | | | |
| | | Year ended December 31, | |
| | | 2006 | | | 2005 | | | 2004 | |
Revenues | | $ | — | | | $ | — | | | $ | — | |
Interest expense | | | — | | | | — | | | | (2,134 | ) |
| | | | | | | | | | | | |
Loss before income taxes and equity in net income of consolidated subsidiaries | | | — | | | | — | | | | (2,134 | ) |
Income tax benefit | | | — | | | | — | | | | 896 | |
| | | | | | | | | | | | |
Loss before equity in net income of consolidated subsidiaries | | | — | | | | — | | | | (1,238 | ) |
Equity in net income (loss) of consolidated subsidiaries | | | (11,889 | ) | | | 15,405 | | | | 7,650 | |
| | | | | | | | | | | | |
Net income (loss) | | $ | (11,889 | ) | | $ | 15,405 | | | $ | 6,412 | |
| | | | | | | | | | | | |
| | | |
Statements of Cash Flows | | | | | | | | | | | | |
| | | |
Operating activities | | | | | | | | | | | | |
Net income (loss) | | $ | (11,889 | ) | | $ | 15,405 | | | $ | 6,412 | |
Adjustments to reconcile net income (loss) to net cash provided by operating activities: | | | | | | | | | | | | |
Equity in net income (loss) of subsidiaries | | | 11,889 | | | | (15,405 | ) | | | (7,650 | ) |
Excess tax benefits of exercised options | | | (62 | ) | | | 577 | | | | 126 | |
Change in interest payable | | | — | | | | — | | | | (3,327 | ) |
| | | | | | | | | | | | |
Net cash (used in) provided by operating activities | | | (62 | ) | | | 577 | | | | (4,439 | ) |
| | | |
Investing activities | | | | | | | | | | | | |
Net investment in and advances to subsidiary | | | (1,187 | ) | | | (1,144 | ) | | | 20,198 | |
| | | | | | | | | | | | |
Net cash provided by (used in) investing activities | | | (1,187 | ) | | | (1,144 | ) | | | 20,198 | |
| | | |
Financing activities | | | | | | | | | | | | |
Proceeds from exercise of options | | | 1,249 | | | | 567 | | | | 552 | |
Proceeds from issuance of common stock, less cash paid for direct costs of issuance of $7,317 | | | — | | | | — | | | | 47,689 | |
Dividend paid | | | — | | | | — | | | | (9,000 | ) |
Payment of debt | | | — | | | | — | | | | (55,000 | ) |
| | | | | | | | | | | | |
Net cash (used in) provided by financing activities | | | 1,249 | | | | 567 | | | | (15,759 | ) |
| | | | | | | | | | | | |
Cash and net change in cash | | $ | — | | | $ | — | | | $ | — | |
| | | | | | | | | | | | |
See accompanying notes to condensed financial information of registrant.
Schedule I – Notes to Condensed Financial Information of Registrant (Continued)
Educate, Inc.
1. Basis of Presentation
The accompanying condensed financial statements present the unconsolidated financial position, results of operations and cash flows of Educate, Inc. In these parent company only financial statements, Educate’s investment in its subsidiaries is stated at cost plus equity in undistributed earnings of subsidiaries since the date of formation. Educate’s share of the net income of its subsidiaries is included in income using the equity method of accounting. These parent company only financial statements should be read in conjunction with Educate’s consolidated financial statements.
2. Dividends From Subsidiaries
There were no dividends paid to Educate, Inc. from its consolidated subsidiaries since inception on June 30, 2003.
Schedule II – Valuation and Qualifying Accounts
Educate, Inc.
(in thousands)
| | | | | | | | | | | | | | | | | | | |
| | | | | Additions | | | | | |
Description | | Balance at
Beginning
of Period | | Charges to
Costs and
Expenses | | Recorded
for
Acquired
Businesses | | Charges to
Other
Accounts
(1) | | Deductions
(2) | | | Balance at
End of
Period |
Year Ended December 31, 2004 | | | | | | | | | | | | | | | | | | | |
Allowance for doubtful accounts | | $ | 4,070 | | $ | 622 | | $ | — | | $ | 46 | | $ | (1,232 | ) | | $ | 3,506 |
Deferred tax asset valuation account | | | 78 | | | 223 | | | — | | | — | | | — | | | | 301 |
Year Ended December 31, 2005 | | | | | | | | | | | | | | | | | | | |
Allowance for doubtful accounts | | | 3,506 | | | 3,628 | | | 277 | | | 7 | | | (2,195 | ) | | | 5,223 |
Deferred tax asset valuation account | | | 301 | | | 268 | | | — | | | — | | | — | | | | 569 |
Year Ended December 31, 2006 | | | | | | | | | | | | | | | | | | | |
Allowance for doubtful accounts | | | 5,223 | | | 2,159 | | | — | | | 68 | | | (2,501 | ) | | | 4,949 |
Deferred tax asset valuation account | | | 569 | | | 4,487 | | | 109 | | | — | | | ��� | | | | 5,165 |
| (1) | For the years ended December 31, 2006, 2005 and 2004, other charges consist of foreign currency translation adjustments. |
| (2) | Uncollectible accounts written-off, net of recoveries and product returns. |