
September 18, 2014 Exhibit 99.1

2 Various statements herein and remarks that we may make today about Xerium's future expectations, plans and prospects are forward-looking statements which reflect our current views with respect to future events and financial performance. Statements which include the words “expect,” “intend,” “plan,” “believe,” “project,” anticipate”, and similar statements of a future or forward-looking nature identify forward-looking statements for the purposes of the federal securities laws or otherwise. Our actual results and stock price performance may differ materially from these forward-looking statements and estimates as a result of various important factors, including those discussed in our earnings press release dated August 5, 2014, which is posted in the Investor Relations section of our website at www.xerium.com, and other factors discussed in our filings with the SEC, including our Form 10-K for the year ended December 31, 2013, all of which are on file with the SEC and are also available in the investor relations section of our website at www.xerium.com under the heading "SEC Filings." In addition, market data about the production volumes of our end-users is no guarantee of future production levels. Last, any forward-looking statements which we make in this presentation or in remarks today, represent our views only as of today. We disclaim any duty to update any such forward looking statements. We also plan to discuss supplementary non-GAAP financial measures, such as Adjusted EBITDA, that we use internally to assess financial performance, and therefore, believe will assist you in better understanding our company. Reconciliations of these measures to the comparable GAAP numbers are available in our most recent earnings press release, in this presentation and in an additional reconciliation schedule, all of which are posted in the Investor Relations section of our website at www.xerium.com. Forward Looking Statements and Non-GAAP Reconciliations

3 Harold Bevis President, CEO and Director Mr. Bevis has been the President and CEO since 2012. He has 29 years of experience leading manufacturing companies and has been a CEO for 14 years. Management in Attendance Cliff Pietrafitta Chief Financial Officer Mr. Pietrafitta has been the Chief Financial Officer since 2011. He has 24 years of experience leading financial functions at manufacturing companies and has been a CFO for 14 years. David Pretty President – Xerium North America & Europe Mr. Pretty has been President at Xerium since 2008. He has 25 years of experience with Xerium, has led many areas of the Company, and is an industry veteran.

4 Xerium Technologies, Inc. Three businesses Machine Clothing Rolls and Mechanical Services SMART® machine automation 27 plants, 2 new greenfield plants under construction 3200 employees, 20 countries 370 patents, 202 years old Approximately $550 million sales NYSE small cap stock - ~$220 million equity value Machine Clothing Roll Covers & Spreader Rolls SMART® Machine Automation

5 Xerium is a Long-Term Global Leader But Taking a Fresh Approach to Growth

6 CEO Harold Bevis Xerium is a 202 Year Old Company Have a New Team of Seasoned Veterans Driving a New Strategy 2012 2014 President NA & EMEA Dave Pretty 2013 President South America Eduardo Fracasso 2008 EVP Human Resources Mike Bly 2013 EVP & CTO Bill Butterfield 2013 VP Global Corp. Accounts and ValueResults Joel Farmer 2013 EVP & CFO Cliff Pietrafitta 2011 General Counsel Kevin McDougall 2010 VP Operations Machine Clothing Jürgen Hartmann 2013 VP Operations Rolls & Service Bernd Hahne 2013 VP & GM Specialty Products Steve Johnston 2013 - Experienced New Leadership Team Just Getting Started - President Asia Paul Wang New Position Start Date Listed Below Their Title

7 Xerium Has Invested To Permanently Lower Its Cost Structure and Improve its Quality in its Core Product and Service Categories This New Team has ripled the Stock (315%) Since It Began Working Together Xerium’s Stock has Been in the Top 2% of S&P Global Small Cap Companies Xerium’s TSR Performance has been substantial over a short period of time as measured against our internal index benchmark, the S&P Global SmallCap Index. Xerium’s stock price performance is in the Top 2% performers, beating out 7,039 stocks of approximately 7,200 companies globally -150 -100 -50 0 50 100 150 200 250 300 350 400 TSR % Percentile Rank S&P Global SmallCap TSR Distribution (9/30/12 to Present*) S&P Global SmallCap TSR Distribution XRM TSR Compensation Peer TSRs 25% 50% 75% Median TSR = 35.5% *Returns through 8/8/14

8 2 year trend line is at 3% We assume underlying market growth to be 1 - 2% Have plans to organically grow sales 2% to 4% per year Have plans to grow EBITDA to 24% of sales Have plans to grow discretionary free cash flow from current levels of approximately $50 million per year We will continue our Operational Excellence programs We will continue moving production to low cost countries Have plans to gradually pay down over half of our debt Payoff and/or refinance all bonds prior to their maturity Improvement is expected to be driven by increased EBITDA, lower spending, and lower interest Current Discretionary Free Cash Flow Calculation: 2014 Adjusted EBITDA Guidance (midpoint) $ 118 Cash Interest (33) Cash Taxes (10) Pension Contribution (7) Maintenance Capital Expenditures (15) Discretionary FCF $ 53 The Leadership Team Has Plans to Continue Stock Growth Revenue Potential of a Growth Stock, Cashflow of a Value Stock

9 Help Our Customers Win Be a specialist and complete solution provider, no gaps Increase our delivered value Multifunctional effort by R&D, sales and service Xerium Business Strategy #1 or #2 Choice for Our Customers Leadership Operational Structure Be a primary partner for provision of products & services Maintain a systematic stream of new, innovative solutions Cost leadership in chosen markets Dependable and repeatable quality and supply chains Mission Statement Be the undisputed world leader at delivering machine optimization solutions

10 Asia ~50% of world market today but only 19% of Xerium sales, Xerium has historically been underexposed to growth in the region. Putting new capacity in position Four Big Themes in Xerium’s Growth Plan Cost Optimization $40 million cost take-out opportunity, additional plant closings & openings, each plant needs to achieve its own targeted cost-per-unit goals Rolls & Service Expansion Secure new business due to secular increase underway globally to out-source and co-source discrete machine conversion work, component refurbishment, low-end machine upgrades & advancements. Putting new capacity in position Innovation Globalize SMART® commercial effort, fill product gaps, advance product and process solutions, advance mechanical services portfolio, over 96 patent applications in process right now that would add to the 370 patentable solutions in house and on machines

11 Growth Markets Significant Investment & Repositioning Program is Underway to Enable Higher Growth & Profit Rates in the Future Machine Automation Emerging countries High-growth applications New market segments Accretive growth rates Mechanical Service Secular shift to co-sourced service, machine refurbishment & upgrades Accretive growth rates Expansion of SMART® machine automation program Desire for real-time, closed loop machine optimization Accretive growth rates Legacy Machine Clothing and Rolls Business Cash Know-how

12 Value-Added Supplier Creative solutions to help them make their products, and run their machines better, cheaper, faster AND be responsible with regards to impact on the environment Xerium’s Customers Are at the Top of Our List They Want Creative Solutions And Measurable Results Full Product Line Contemporary Business Practices Consistent Quality No product gaps, no geographic gaps, no capacity or service constraints Transparent and electronic business practices, dependable and predictable supply chain Every piece, every service should have the same performance, every time Xerium works hand-in-hand with large machine operators to do its work. Lower fiber usage Lower energy usage Lower chemical usage Less scrap Higher recycled content usage Higher output Xerium Delivers These Results to Customers Cost Optimization Product Quality Better surface quality Consistent web formation Better printability Improved bulk Enhanced bond strength Upgraded coating properties

13 Xerium’s Organic Growth Opportunities are Significant ~ $4 Billion Addressable Market Proportional to the Regional Size North America South America Source: Management Estimates Existing Xerium Sales Machine Clothing Rolls Mechanical Services Europe Growth Opportunities Asia South America

14 2.9% 2.6% 1.1% 0.5% 0.6% 1.7% 2.2% 0% 1% 2% 3% 4% A n n u a l D emand G ro w th R ate % Global Paper and Board Market is Large and Growing Global demand for pulp and paperboard showed a 0.6% gain in 2013, with stronger growth in packaging and tissue offset by continued declines in graphic paper demand RISI predicts world paper and board demand growth to continue to increase driven primarily by containerboard and tissue Containerboard is forecast to grow at an average of 3.4 million tons per year through 2018 driven by economic development in global markets and increasing disposable income Sources: RISI, Numera Analytics, Bloomberg, Wall Street research, US Census Bureau, Freedonia Group 1%-2% Annual Growth World Market for Pulp, Paper and Board Xerium provides machine clothing, roll covers and mechanical services that are used in the production of these products

15 99.5 100.0 100.5 101.0 101.5 102.0 102.5 103.0 103.5 104.0 104.5 Q1 Q2 Q3 Q4 Pulp, Paper, Board and Tissue Market is Growing -- But Transforming Graphical Grades & Mature Markets Declining, GDP Grades & Emerging Markets Increasing Source: Numera Analytics World Demand by Quarter 2014 2012 2013 World Demand by Region YTD June ‘13 vs YTD June ‘14 4% 3% 2% 1% 0% -1% “GDP” grades digital substitution emerging wealth grades bar width equates to grade mix tonnes World Demand by Grade YTD June ‘13 vs YTD June ‘14 2.7% 0.5% 2.1% -0.6% -6.9% 2014 – 1% higher than 2013 2013 – 1% higher than 2012 2.5% 2% 1.5% 1% 0% -1.0% bar width equates to regional market size -1.2% 0.6% 0% 1.8% 1% 2012 2013 2014 World Production by Month 31.0 30.5 30.0 29.5 29.0 28.5 28.0 27.5 27.0 M ill io n T o n n e s M ill io n T o n n e s

16 Fiber Cement Market is Global and Growing 1.7 1.7 1.7 1.9 2.1 2.2 2.4 2.6 2.9 0.0 0.5 1.0 1.5 2.0 2.5 3.0 2009 2010 2011 2012 2013 2014 2015 2016 2017 U .S . D emand M ill io n T o n s 8.5% CAGR 80% of fiber cement market is outside of the U.S. Fiber cement products continue to gain share as a building material choice (and vinyl siding continues to lose share) due to its performance characteristics and customer desirability – life, weather resistance, fire resistance, durability Global fiber cement market is growing. Rates and timing will be correlated to home construction and remodeling U.S. Fiber Cement Market Sources: Freedonia Group, Plastics News Fiber Cement Products Fiber Cement Production Machine
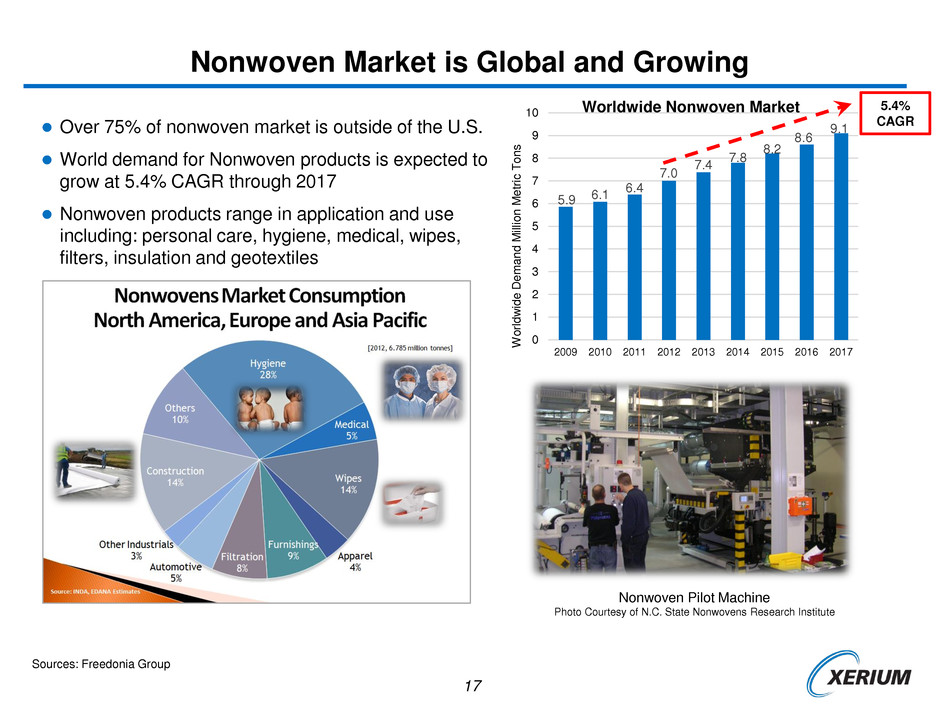
17 Nonwoven Market is Global and Growing 5.9 6.1 6.4 7.0 7.4 7.8 8.2 8.6 9.1 0 1 2 3 4 5 6 7 8 9 10 2009 2010 2011 2012 2013 2014 2015 2016 2017 W o rl d w id e De m a n d M ill io n M e tr ic T o n s 5.4% CAGR Over 75% of nonwoven market is outside of the U.S. World demand for Nonwoven products is expected to grow at 5.4% CAGR through 2017 Nonwoven products range in application and use including: personal care, hygiene, medical, wipes, filters, insulation and geotextiles Worldwide Nonwoven Market Sources: Freedonia Group Nonwoven Pilot Machine Photo Courtesy of N.C. State Nonwovens Research Institute
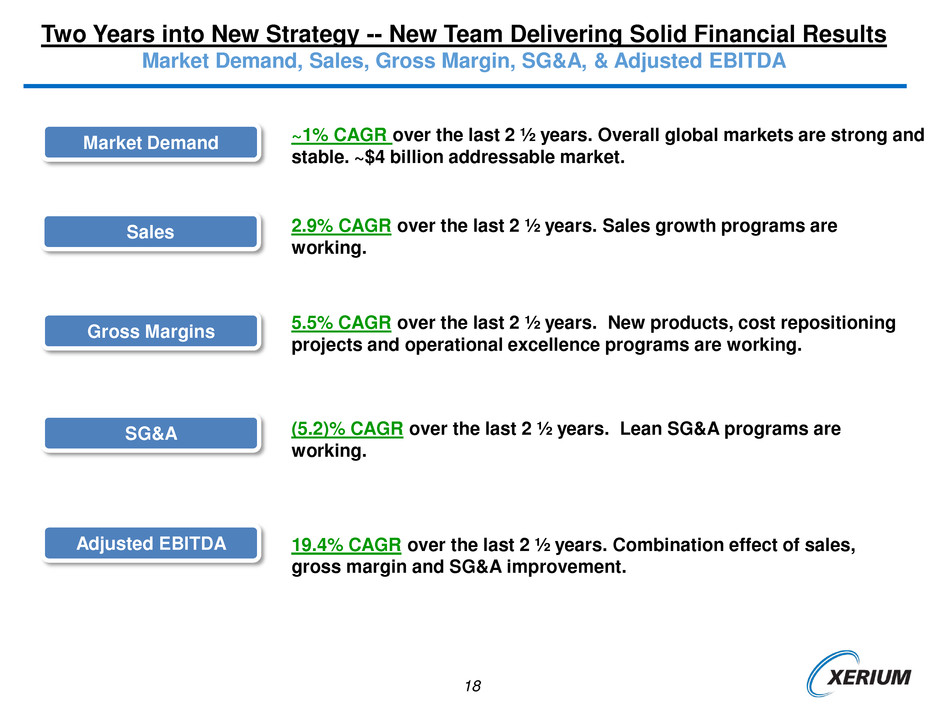
18 Two Years into New Strategy -- New Team Delivering Solid Financial Results Market Demand, Sales, Gross Margin, SG&A, & Adjusted EBITDA Market Demand ~1% CAGR over the last 2 ½ years. Overall global markets are strong and stable. ~$4 billion addressable market. Sales 2.9% CAGR over the last 2 ½ years. Sales growth programs are working. Gross Margins 5.5% CAGR over the last 2 ½ years. New products, cost repositioning projects and operational excellence programs are working. SG&A (5.2)% CAGR over the last 2 ½ years. Lean SG&A programs are working. 19.4% CAGR over the last 2 ½ years. Combination effect of sales, gross margin and SG&A improvement. Adjusted EBITDA

19 New Team and New Strategy is Already Yielding Strong Financial Returns $130 $134 $133 $132 $137 $138 $136 $133 $135 $140 $110 $115 $120 $125 $130 $135 $140 $145 $150 Q1 12 Q2 12 Q3 12 Q4 12 Q1 13 Q2 13 Q3 13 Q4 13 Q1 14 Q2 14 M ill io n $ Sales Increasing ~3% 2.9% CAGR 35% 37% 37% 35% 39% 38% 40% 37% 39% 40% 25% 27% 29% 31% 33% 35% 37% 39% 41% 43% 45% Q1 12 Q2 12 Q3 12 Q4 12 Q1 13 Q2 13 Q3 13 Q4 13 Q1 14 Q2 14 % o f S a le s Gross Margin Increasing ~5% 5.5% CAGR $40 $36 $37 $38 $36 $36 $35 $35 $35 $35 $32 $34 $36 $38 $40 $42 $44 $46 Q1 12 Q2 12 Q3 12 Q4 12 Q1 13 Q2 13 Q3 13 Q4 13 Q1 14 Q2 14 M ill io n $ - 5.2% CAGR SG&A Decreasing ~5% $19 $25 $24 $21 $29 $27 $27 $24 $26 $29 $14 $16 $18 $20 $22 $24 $26 $28 $30 $32 $34 Q1 12 Q2 12 Q3 12 Q4 12 Q1 13 Q2 13 Q3 13 Q4 13 Q1 14 Q2 14 M ill io n $ Adjusted EBITDA Increasing ~19% 19.4% CAGR

20 Adjusted Earnings Per Share Up 54% in Last Twelve Months $1.75 Per Share +16% Per Share Amounts (basic and adjusted basic, net of taxes)
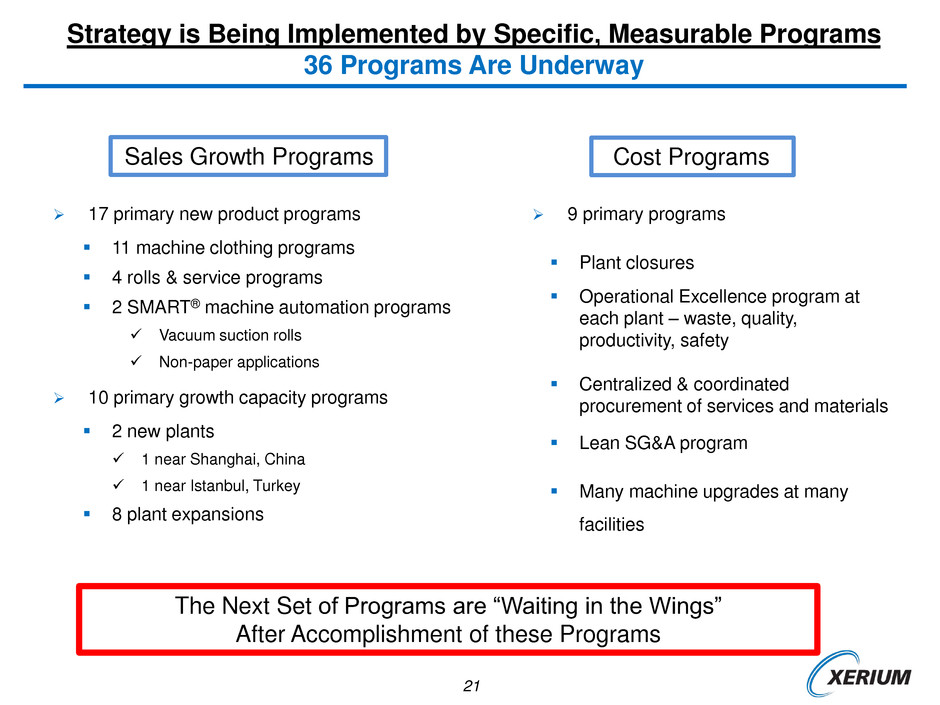
21 17 primary new product programs 11 machine clothing programs 4 rolls & service programs 2 SMART® machine automation programs Vacuum suction rolls Non-paper applications 10 primary growth capacity programs 2 new plants 1 near Shanghai, China 1 near Istanbul, Turkey 8 plant expansions Strategy is Being Implemented by Specific, Measurable Programs 36 Programs Are Underway 9 primary programs Plant closures Operational Excellence program at each plant – waste, quality, productivity, safety Centralized & coordinated procurement of services and materials Lean SG&A program Many machine upgrades at many facilities Sales Growth Programs Cost Programs The Next Set of Programs are “Waiting in the Wings” After Accomplishment of these Programs
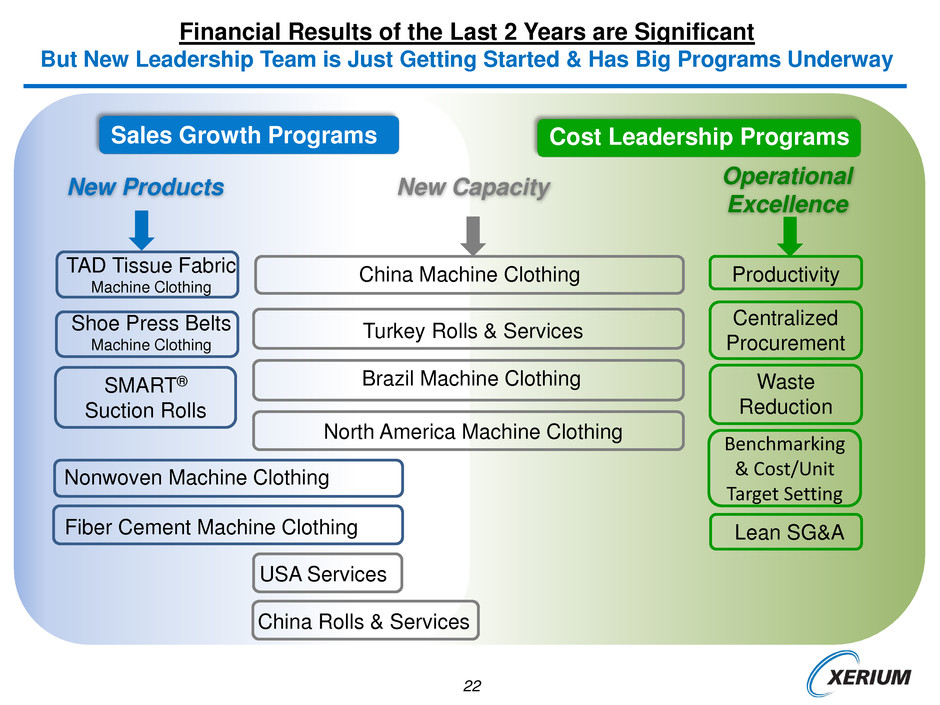
22 Financial Results of the Last 2 Years are Significant But New Leadership Team is Just Getting Started & Has Big Programs Underway Sales Growth Programs New Products New Capacity TAD Tissue Fabric Machine Clothing China Machine Clothing Shoe Press Belts Machine Clothing SMART® Suction Rolls Turkey Rolls & Services Brazil Machine Clothing Nonwoven Machine Clothing Fiber Cement Machine Clothing USA Services Operational Excellence Productivity Centralized Procurement Waste Reduction Lean SG&A Cost Leadership Programs Benchmarking & Cost/Unit Target Setting North America Machine Clothing China Rolls & Services
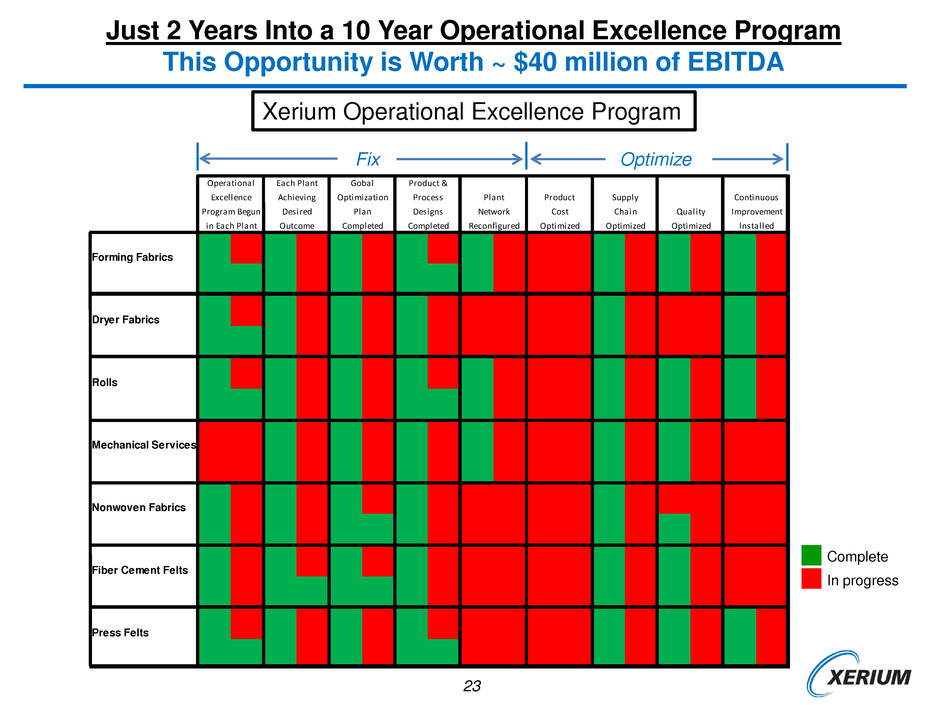
23 Forming Fabrics Dryer Fabrics Rolls Mechanical Services Nonwoven Fabrics Fiber Cement Felts Press Felts Continuous Improvement Installed Plant Network Reconfigured Product Cost Optimized Supply Chain Optimized Quality Optimized Gobal Optimization Plan Completed Product & Process Designs Completed Each Plant Achieving Desired Outcome Operational Excellence Program Begun in Each Plant Just 2 Years Into a 10 Year Operational Excellence Program This Opportunity is Worth ~ $40 million of EBITDA Complete In progress Fix Optimize Xerium Operational Excellence Program

24 Xerium Has Invested To Permanently Lower Its Cost Structure and Improve its Quality in its Core Product and Service Categories Xerium is Underway With Programs to Achieve its Operational Excellence Goals These Programs Will Keep Driving Gross Margins Up. A Few Examples … Specifically, we spent $22.3 million on restructuring activities and took out over $23 million of costs in 2013, with over an additional $25 million of savings projected in 2014. Here are a few examples: Consolidation of production from Heidenheim, Germany to Duren, Germany, Schloss Holte, Germany, and Cardano, Italy completed in Q2 2014. Equipment redeployment to Turkey. Upgrading equipment, improving quality and lowering costs. Consolidation and Upgrade of Rolls and Mechanical Services Production Duren, Germany Consolidation of production from Buenos Aires, Argentina to Piracicaba, Brazil is scheduled to be completed in Q4 2014. Upgrading equipment, improving quality and lowering costs. Consolidation and Upgrade of Dryer Fabric Production Piracicaba, Brazil

25 Xerium is Increasing its Industry Leading Innovation Program Size of Activity Continues to Increase As lean SG&A model has been implemented, have selectively re-invested back into R&D resources Technical team is over 175 people Added another PhD to the staff focused on high-end surface sensitive fabrics - like tissue and printable packaging board Large engineering coop program Added pilot equipment & test equipment for fast prototyping Upgraded pilot machine for fiber cement Upgrading pilot machine for SMART machine automation Upgraded pilot forming fabric loom Leading edge 3D Printer and CT Scanner Invention rate is ramping up Xerium has 372 issued patents And now has 96 pending applications! • 3D Printer • CT Scanner Capability

26 Xerium is Investing $69 Million to Grow Sales Over the Next Several Years. Xerium’s Innovation Program Has 96 New Patent Applications in Process These Products Will Drive Sales and Gross Margins Up. A Few Examples … TAD Tissue Product A 2-year new product development program for Through-Air-Dryer fabrics is nearing completion, with field validation trials in the 2nd half of 2014 followed by an early 2015 product launch. Completes PMC product portfolio for the growing tissue market. SMART® Roll for Suction Press Applications A Xerium gamechanger Paper, packaging and tissue makers can now view and manage nip conditions in suction roll applications. Field validation trials now in process with early 2015 launch. Special high-end machine clothing belt for press rolls on high-demand press configurations. Currently in field validation phase and slated for launch in early 2015. Shoe Press Belt

27 0 100 200 300 400 500 600 2007 2008 2009 2010 2011 2012 2013 2014 Nu m b e r o f S M A R T ® A ut o m at io n In s ta llat io n s SMART® Installations SMART® Machine Automation Installations Are Taking Off We are Just Beginning the Globalization of this Product SMART® is a machine automation solution a high-end, self-contained, patented sensor/feedback kit that enables machine optimization in critical performance areas of the machine that have never been able to be optimized well before. YTD

28 Suction Box Completed Suction Roll Global Rolls and Service Expansion is Just Getting Started Fill in Open Spots in Global Service Model, New Turkey Location is Just a Start This business is growing at greater than 10% per year Customers want specialized service from Xerium to refurbish & upgrade key machine components. There is a secular trend to co-source this service from 3rd parties versus performing these activities in-house. >10% Growth Rate August 14 YTD versus August 13 YTD

29 Xerium is Investing $69 Million to Grow Sales Over the Next Several Years. Xerium is Underway With Investment Program to Grow Sales in the Future These Programs are Not Showing Financial Results Yet, But Will Be Accretive. A Few Examples … New Press Felt Plant Ba Cheng, China Construction is underway to expand high-end press felt capacity for Asian market. These felts are key consumable products for newer, high-speed machines installed in the region. Rolls and Mechanical Services Plant Expansion Ruston, LA Construction will be completed in Q3 to expand mechanical service capacity for Southeast USA market. A key service requirement of tissue, packaging and paper producers. Look for better pic Erection and installation of high-tech needle loom, will be completed at the end of Q3. Expands capacity for press felt production. Machine Clothing Plant Expansion Gloggnitz, Austria

30 - 50.0 100.0 150.0 200.0 250.0 2014 2015 2016 2017 2018 2019 2020 $ M ill io n s Incremental Sales Base Case Incremental Growth Upside Incremental Growth $120 m Xerium’s Revenue Growth Potential is High Assumptions 1. Base Case: Xerium closes 25% of its competitive gap in machine clothing through specific programs; Upside: Xerium closes 50% of its competitive gap 2. SMART® machine automation continues on its current growth trajectory 3. Rolls & Mechanical Services continues on its current growth trajectory $200 m

31 New management team has delivered over 300% investment return, and has plans to continue stock growth ~$4 billion accessible global market is large and growing, and Xerium is pursuing a fresh, aggressive approach to leadership in these markets Xerium’s sales and orders are growing faster than the market, and our sales programs are just beginning There will be pronounced monthly and quarterly volatility in the global industry as it adjusts Xerium has an attractive list of sales growth programs for both new products & focused capacity investments that will benefit future periods Xerium has an attractive list of consolidation & Operational Excellence programs Investments made in 2013 and 2014 will have continuing financial benefits from 2015 thru 2017 Xerium Executive Summary Revenue Potential of a Growth Stock, Cashflow of a Value Stock Xerium pioneered the self-contained sensor kit idea Collect and report critical operational parameters to machine operators. SMART® Technology is now used on various machine applications across multiple industries. #1 global market share. N ip pressure (m p a ) ® Nip Pressure Profile
September 18, 2014