UNITED STATES
SECURITIES AND EXCHANGE COMMISSION
Washington, D.C. 20549
Form N-CSR
CERTIFIED SHAREHOLDER REPORT OF REGISTERED
MANAGEMENT INVESTMENT COMPANIES
Investment Company Act File Number: 811-21563
Eaton Vance Short Duration Diversified Income Fund
(Exact Name of Registrant as Specified in Charter)
Two International Place, Boston, Massachusetts 02110
(Address of Principal Executive Offices)
Maureen A. Gemma
Two International Place, Boston, Massachusetts 02110
(Name and Address of Agent for Services)
(617) 482-8260
(Registrant’s Telephone Number)
October 31
Date of Fiscal Year End
October 31, 2016
Date of Reporting Period
Item 1. Reports to Stockholders

Eaton Vance
Short Duration Diversified Income Fund (EVG)
Annual Report
October 31, 2016

Commodity Futures Trading Commission Registration. Effective December 31, 2012, the Commodity Futures Trading Commission (“CFTC”) adopted certain regulatory changes that subject registered investment companies and advisers to regulation by the CFTC if a fund invests more than a prescribed level of its assets in certain CFTC-regulated instruments (including futures, certain options and swap agreements) or markets itself as providing investment exposure to such instruments. The Fund has claimed an exclusion from the definition of the term “commodity pool operator” under the Commodity Exchange Act. Accordingly, neither the Fund nor the adviser with respect to the operation of the Fund is subject to CFTC regulation. Because of its management of other strategies, the Fund’s adviser is registered with the CFTC as a commodity pool operator and a commodity trading advisor.
Managed Distribution Plan. Pursuant to an exemptive order issued by the Securities and Exchange Commission (Order), the Fund is authorized to distribute long-term capital gains to shareholders more frequently than once per year. Pursuant to the Order, the Fund’s Board of Trustees approved a Managed Distribution Plan (MDP) pursuant to which the Fund makes monthly cash distributions to common shareholders, stated in terms of a fixed amount per common share.
The Fund currently distributes monthly cash distributions equal to $0.09 per share in accordance with the MDP. You should not draw any conclusions about the Fund’s investment performance from the amount of these distributions or from the terms of the MDP. The MDP will be subject to regular periodic review by the Fund’s Board of Trustees and the Board may amend or terminate the MDP at any time without prior notice to Fund shareholders. However, at this time there are no reasonably foreseeable circumstances that might cause the termination of the MDP.
The Fund may distribute more than its net investment income and net realized capital gains and, therefore, a distribution may include a return of capital. A return of capital distribution does not necessarily reflect the Fund’s investment performance and should not be confused with “yield” or “income.” With each distribution, the Fund will issue a notice to shareholders and a press release containing information about the amount and sources of the distribution and other related information. The amounts and sources of distributions contained in the notice and press release are only estimates and are not provided for tax purposes. The amounts and sources of the Fund’s distributions for tax purposes will be reported to shareholders on Form 1099-DIV for each calendar year.
Fund shares are not insured by the FDIC and are not deposits or other obligations of, or guaranteed by, any depository institution. Shares are subject to investment risks, including possible loss of principal invested.
Annual Report October 31, 2016
Eaton Vance
Short Duration Diversified Income Fund
Table of Contents
| | | | |
Management’s Discussion of Fund Performance | | | 2 | |
| |
Performance | | | 3 | |
| |
Fund Profile | | | 3 | |
| |
Endnotes and Additional Disclosures | | | 4 | |
| |
Financial Statements | | | 5 | |
| |
Report of Independent Registered Public Accounting Firm | | | 41 | |
| |
Federal Tax Information | | | 42 | |
| |
Notice to Shareholders | | | 43 | |
| |
Dividend Reinvestment Plan | | | 44 | |
| |
Management and Organization | | | 46 | |
| |
Important Notices | | | 49 | |
Eaton Vance
Short Duration Diversified Income Fund
October 31, 2016
Management’s Discussion of Fund Performance1
Economic and Market Conditions
During the 12-month period ended October 31, 2016, the accommodative policies of major central banks fueled broad gains across the world’s financial markets. Equity returns were positive on a global basis and particularly strong in emerging markets. Key U.S. and international bond indexes climbed higher as interest rates fell and credit spreads narrowed. Emerging market currencies generally strengthened versus the U.S. dollar, while developed market currencies weakened.
As the fiscal year began, investors were preparing for the first interest-rate increase from the Federal Reserve (the Fed) in nearly a decade. While the Fed raised rates 0.25% on December 2015, it held policy steady over the remainder of the period amid uneven U.S. economic growth and slowing growth abroad. Foreign central banks aggressively eased policy in efforts to bolster their respective economies. The Bank of England cut interest rates to an all-time low and expanded its asset purchase program following “Brexit,” the U.K.’s June 2016 vote to leave the European Union. The Bank of Japan introduced negative rates, and the European Central Bank cut rates deeper into negative territory and increased its monthly bond purchases.
The price of gold surged nearly 20% during the period, buoyed by central bank actions and uncertainty surrounding Brexit and the U.S. presidential election. Oil prices started to recover in February 2016; however, the rally was not strong enough to offset sharp losses suffered earlier in the fiscal year. The weakness in oil drove a modest decline in the broad commodity market for the full 12 months.
Fund Performance
For the fiscal year ended October 31, 2016, Eaton Vance Short Duration Diversified Income Fund (the Fund) had a total return of 6.10% at net asset value (NAV).
Investments in mortgage-backed securities (MBS) had a positive contribution to the Fund’s performance. The Fund maintained its focus on high-coupon seasoned agency MBS, due to the prepay protection of loans originated more than a decade ago. The Fund benefited from these investments, as they outperformed similar duration8 U.S. Treasurys over the period. The Fund also benefited from its investments in the Agency Collateralized Mortgage Obligation market, as spreads tightened on the lower coupon securities the Fund invests in.
Investments in senior secured loans also contributed to Fund performance. For the 12-month period, BB-rated9 loans in the S&P/LSTA Leveraged Loan Index2 (the Index) returned 5.16%, B-rated loans in the Index returned 6.77%, CCC-rated loans in the Index returned 14.48% and D-rated (defaulted) loans in the Index returned 11.04%. Though the Fund remained underweight to the better-performing, higher-credit risk tiers of the market, the limited weight of these segments kept the relative impact limited. The Fund’s overweight to the higher-quality loans in the B ratings range — which outperformed the market at large — contributed more than enough to counterbalance the impact of being underweight the riskier loans.
The Fund’s exposure to foreign currency instruments around the world contributed to Fund performance during the 12-month period. Eastern Europe was the best performing region, led by long exposure to Russia’s ruble and a long position in the Serbian dinar versus the euro. The Fund also benefited from positions in Asia including long exposure to the Indonesian rupiah and Bangladeshi taka. Latin America was another region that helped performance, driven by long exposure to Argentina’s peso and Brazil’s real. Other holdings notably impacting performance included positive contribution from a long position in the Icelandic krona, while a long position in the Mexican peso detracted.
See Endnotes and Additional Disclosures in this report.
Past performance is no guarantee of future results. Returns are historical and are calculated by determining the percentage change in net asset value (NAV) or market price (as applicable) with all distributions reinvested and include management fees and other expenses. Fund performance at market price will differ from its results at NAV due to factors such as changing perceptions about the Fund, market conditions, fluctuations in supply and demand for Fund shares, or changes in Fund distributions. Investment return and principal value will fluctuate so that shares, when sold, may be worth more or less than their original cost. Performance less than or equal to one year is cumulative. Performance is for the stated time period only; due to market volatility, current Fund performance may be lower or higher than the quoted return. For performance as of the most recent month-end, please refer to eatonvance.com.
Eaton Vance
Short Duration Diversified Income Fund
October 31, 2016
Performance3
Portfolio Managers Scott H. Page, CFA, Payson F. Swaffield, CFA, Catherine C. McDermott, Andrew Szczurowski, CFA, Eric Stein, CFA and Sarah Orvin, CFA
| | | | | | | | | | | | | | | | |
| % Average Annual Total Returns | | Inception Date | | | One Year | | | Five Years | | | Ten Years | |
Fund at NAV | | | 02/28/2005 | | | | 6.10 | % | | | 3.85 | % | | | 5.52 | % |
Fund at Market Price | | | — | | | | 6.60 | | | | 3.15 | | | | 4.66 | |
| | | | |
| | | | | | | | | | | | | | | | |
| % Premium/Discount to NAV4 | | | | | | | | | | | | |
| | | | | | | | | | | | | | | –11.23 | % |
| | | | |
| | | | | | | | | | | | | | | | |
| Distributions5 | | | | | | | | | | | | |
Total Distributions per share for the period | | | | | | | | | | | | | | | $1.080 | |
Distribution Rate at NAV | | | | | | | | | | | | | | | 7.18 | % |
Distribution Rate at Market Price | | | | | | | | | | | | | | | 8.08 | % |
| | | | |
| | | | | | | | | | | | | | | | |
| % Total Leverage6 | | | | | | | | | | | | |
Derivatives | | | | | | | | | | | | | | | 25.29 | % |
Borrowings | | | | | | | | | | | | | | | 20.53 | |
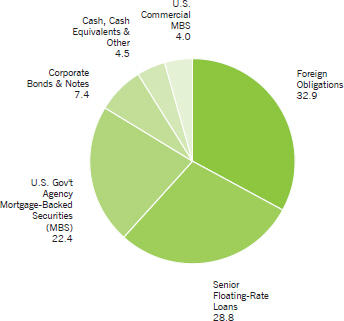
Fund Profile
Asset Allocation (% of total leveraged assets)7
See Endnotes and Additional Disclosures in this report.
Past performance is no guarantee of future results. Returns are historical and are calculated by determining the percentage change in net asset value (NAV) or market price (as applicable) with all distributions reinvested and include management fees and other expenses. Fund performance at market price will differ from its results at NAV due to factors such as changing perceptions about the Fund, market conditions, fluctuations in supply and demand for Fund shares, or changes in Fund distributions. Investment return and principal value will fluctuate so that shares, when sold, may be worth more or less than their original cost. Performance less than or equal to one year is cumulative. Performance is for the stated time period only; due to market volatility, current Fund performance may be lower or higher than the quoted return. For performance as of the most recent month-end, please refer to eatonvance.com.
Eaton Vance
Short Duration Diversified Income Fund
October 31, 2016
Endnotes and Additional Disclosures
| 1 | The views expressed in this report are those of the portfolio
manager(s) and are current only through the date stated at the top of this page. These views are subject to change at any time based upon market or other conditions, and Eaton Vance and the Fund(s) disclaim any responsibility to update such views. These views may not be relied upon as investment advice and, because investment decisions are based on many factors, may not be relied upon as an indication of trading intent on behalf of any Eaton Vance fund. This commentary may contain statements that are not historical facts, referred to as “forward looking statements”. The Fund’s actual future results may differ significantly from those stated in any forward looking statement, depending on factors such as changes in securities or financial markets or general economic conditions, the volume of sales and purchases of Fund shares, the continuation of investment advisory, administrative and service contracts, and other risks discussed from time to time in the Fund’s filings with the Securities and Exchange Commission. |
| 2 | S&P/LSTA Leveraged Loan Index is an unmanaged index of the institutional leveraged loan market. Unless otherwise stated, index returns do not reflect the effect of any applicable sales charges, commissions, expenses, taxes or leverage, as applicable. It is not possible to invest directly in an index. |
| 3 | Performance results reflect the effects of leverage. Absent an expense waiver by the investment adviser, if applicable, the returns would be lower. |
| 4 | The shares of the Fund often trade at a discount or premium from their net asset value. The discount or premium of the Fund may vary over time and may be higher or lower than what is quoted in this report. For up-to-date premium/discount information, please refer to http://eatonvance.com/closedend. |
| 5 | The Distribution Rate is based on the Fund’s last regular distribution per share in the period (annualized) divided by the Fund’s NAV or market price at the end of the period. The Fund’s distributions may be comprised of amounts characterized for federal income tax purposes as qualified and non-qualified ordinary dividends, capital gains and nondividend distributions, also known as return of capital. For additional information about nondividend distributions, please refer to Eaton Vance Closed-End Fund Distribution Notices (19a) posted on our website, eatonvance.com. The Fund will determine the federal income tax character of distributions paid to a shareholder after the end of the calendar year. This is reported on the IRS form 1099-DIV and provided to the shareholder shortly after each year-end. For information about the tax character of distributions made in prior calendar years, please refer to Performance-Tax Character of Distributions on the Fund’s webpage available at eatonvance.com. The Fund’s distributions are determined by the investment adviser based on its current assessment of the Fund’s long-term return potential. Fund distributions may be affected by numerous factors including changes in Fund performance, the cost of financing for leverage, portfolio holdings, realized and projected returns, and other factors. As portfolio and market conditions change, the rate of distributions paid by the Fund could change. |
| 6 | The Fund employs leverage through derivatives and borrowings. Total leverage is shown as a percentage of the Fund’s aggregate net assets plus the absolute notional value of long and short derivatives and borrowings outstanding. Use of leverage creates an opportunity for income, but creates risks including greater price volatility. The cost of borrowings rises and falls with changes in short-term interest rates. The Fund may be required to maintain prescribed asset coverage for its leverage and may be required to reduce its leverage at an inopportune time. |
| 7 | Total leveraged assets include all assets of the Fund (including those acquired with financial leverage) and derivatives held by the Fund. Asset Allocation as a percentage of the Fund’s net assets amounted to 184.6%. Please refer to the definition of total leveraged assets within the Notes to Financial Statements included herein. |
| 8 | Duration is a measure of the expected change in price of a bond — in percentage terms — given a one percent change in interest rates, all else being constant. Securities with lower durations tend to be less sensitive to interest rate changes. |
| 9 | Credit ratings are categorized using S&P. Ratings, which are subject to change, apply to the creditworthiness of the issuers of the underlying securities and not to the Fund or its shares. Credit ratings measure the quality of a bond based on the issuer’s creditworthiness, with ratings ranging from AAA, being the highest, to D, being the lowest based on S&P’s measures. Ratings of BBB or higher by S&P are considered to be investment-grade quality. Credit ratings are based largely on the ratings agency’s analysis at the time of rating. The rating assigned to any particular security is not necessarily a reflection of the issuer’s current financial condition and does not necessarily reflect its assessment of the volatility of a security’s market value or of the liquidity of an investment in the security. |
| | Fund profile subject to change due to active management. |
Important Notice to Shareholders
| | Effective December 1, 2016, Sarah Orvin, CFA, Vice President of EVM, became a portfolio manager of the Fund, joining current managers Scott H. Page, CFA, Payson F. Swaffield, CFA, Catherine C. McDermott, Andrew Szczurowski, CFA and Eric Stein, CFA. |
Eaton Vance
Short Duration Diversified Income Fund
October 31, 2016
Portfolio of Investments
| | | | | | | | | | | | |
| Senior Floating-Rate Loans — 53.1%(1) | |
| | | |
| | | | | | | | | | | | |
| Borrower/Tranche Description | | | | | Principal Amount* (000’s omitted) | | | Value | |
| | | | | | | | | | | | |
|
Aerospace and Defense — 0.8% | |
BE Aerospace, Inc. | | | | | | | | | | | | |
Term Loan, 3.82%, Maturing December 16, 2021 | | | | | | | 188 | | | $ | 189,865 | |
Silver II US Holdings, LLC | | | | | | | | | | | | |
Term Loan, 4.00%, Maturing December 13, 2019 | | | | | | | 358 | | | | 330,882 | |
TransDigm, Inc. | | | | | | | | | | | | |
Term Loan, 3.82%, Maturing February 28, 2020 | | | | | | | 500 | | | | 500,765 | |
Term Loan, 3.83%, Maturing June 4, 2021 | | | | | | | 318 | | | | 317,390 | |
Term Loan, 3.75%, Maturing June 9, 2023 | | | | | | | 669 | | | | 667,897 | |
Wesco Aircraft Hardware Corp. | | | | | | | | | | | | |
Term Loan, 3.29%, Maturing September 23, 2021 | | | | | | | 175 | | | | 174,781 | |
| | | | | | | | | | | | | |
| | | | | | | | | | $ | 2,181,580 | |
| | | | | | | | | | | | | |
|
Air Transport — 0.2% | |
Virgin America, Inc. | | | | | | | | | | | | |
Term Loan, 5.36%, Maturing April 4, 2019 | | | | | | | 450 | | | $ | 456,750 | |
| | | | | | | | | | | | | |
| | | | | | | | | | $ | 456,750 | |
| | | | | | | | | | | | | |
|
Automotive — 2.1% | |
Allison Transmission, Inc. | | | | | | | | | | | | |
Term Loan, 3.25%, Maturing September 23, 2022 | | | | | | | 236 | | | $ | 238,105 | |
CS Intermediate Holdco 2, LLC | | | | | | | | | | | | |
Term Loan, 4.00%, Maturing April 4, 2021 | | | | | | | 562 | | | | 564,638 | |
Term Loan, Maturing October 26, 2023(2) | | | | | | | 25 | | | | 25,125 | |
Dayco Products, LLC | | | | | | | | | | | | |
Term Loan, 5.25%, Maturing December 12, 2019 | | | | | | | 171 | | | | 171,052 | |
FCA US, LLC | | | | | | | | | | | | |
Term Loan, 3.50%, Maturing May 24, 2017 | | | | | | | 515 | | | | 516,305 | |
Term Loan, 3.25%, Maturing December 31, 2018 | | | | | | | 216 | | | | 216,251 | |
Federal-Mogul Holdings Corporation | | | | | | | | | | | | |
Term Loan, 4.75%, Maturing April 15, 2021 | | | | | | | 660 | | | | 640,348 | |
Goodyear Tire & Rubber Company (The) | | | | | | | | | | | | |
Term Loan - Second Lien, 3.86%, Maturing April 30, 2019 | | | | | | | 575 | | | | 579,415 | |
Horizon Global Corporation | | | | | | | | | | | | |
Term Loan, 7.00%, Maturing June 30, 2021 | | | | | | | 169 | | | | 169,383 | |
MPG Holdco I, Inc. | | | | | | | | | | | | |
Term Loan, 3.75%, Maturing October 20, 2021 | | | | | | | 1,401 | | | | 1,408,805 | |
TI Group Automotive Systems, LLC | | | | | | | | | | | | |
Term Loan, 4.50%, Maturing June 30, 2022 | | | | | | | 223 | | | | 223,491 | |
Tower Automotive Holdings USA, LLC | | | | | | | | | | | | |
Term Loan, 4.00%, Maturing April 23, 2020 | | | | | | | 524 | | | | 524,224 | |
Tweddle Group, Inc. | | | | | | | | | | | | |
Term Loan, Maturing October 13, 2023(2) | | | | | | | 150 | | | | 147,750 | |
| | | | | | | | | | | | |
| Borrower/Tranche Description | | | | | Principal Amount* (000’s omitted) | | | Value | |
| | | | | | | | | | | | |
|
Automotive (continued) | |
Visteon Corporation | | | | | | | | | | | | |
Term Loan, 3.55%, Maturing April 9, 2021 | | | | | | | 102 | | | $ | 102,487 | |
| | | | | | | | | | | | | |
| | | | | | | | | | $ | 5,527,379 | |
| | | | | | | | | | | | | |
|
Beverage and Tobacco — 0.1% | |
Flavors Holdings, Inc. | | | | | | | | | | | | |
Term Loan, 6.75%, Maturing April 3, 2020 | | | | | | | 366 | | | $ | 310,904 | |
| | | | | | | | | | | | | |
| | | | | | | | | | $ | 310,904 | |
| | | | | | | | | | | | | |
|
Brokerage / Securities Dealers / Investment Houses — 0.2% | |
Aretec Group, Inc. | | | | | | | | | | | | |
Term Loan, 8.00%, Maturing May 25, 2023 | | | | | | | 65 | | | $ | 65,134 | |
Term Loan - Second Lien, 6.50%, (2.00% Cash, 4.50% PIK), Maturing May 23, 2021 | | | | | | | 265 | | | | 214,460 | |
Salient Partners L.P. | | | | | | | | | | | | |
Term Loan, 9.50%, Maturing May 19, 2021 | | | | | | | 144 | | | | 137,401 | |
| | | | | | | | | | | | | |
| | | | | | | | | | $ | 416,995 | |
| | | | | | | | | | | | | |
|
Building and Development — 1.0% | |
American Builders & Contractors Supply Co. | | | | | | | | | | | | |
Term Loan, Maturing October 31,
2023(2) | | | | | | | 475 | | | $ | 477,672 | |
Auction.com, LLC | | | | | | | | | | | | |
Term Loan, 6.00%, Maturing May 12, 2019 | | | | | | | 197 | | | | 198,231 | |
CPG International, Inc. | | | | | | | | | | | | |
Term Loan, 4.75%, Maturing September 30, 2020 | | | | | | | 395 | | | | 397,165 | |
DTZ U.S. Borrower, LLC | | | | | | | | | | | | |
Term Loan, 4.25%, Maturing November 4, 2021 | | | | | | | 469 | | | | 469,062 | |
Ply Gem Industries, Inc. | | | | | | | | | | | | |
Term Loan, 4.00%, Maturing February 1, 2021 | | | | | | | 419 | | | | 421,331 | |
Quikrete Holdings, Inc. | | | | | | | | | | | | |
Term Loan, 4.00%, Maturing September 28, 2020 | | | | | | | 190 | | | | 191,405 | |
RE/MAX International, Inc. | | | | | | | | | | | | |
Term Loan, 4.00%, Maturing July 31, 2020 | | | | | | | 328 | | | | 327,946 | |
Summit Materials Companies I, LLC | | | | | | | | | | | | |
Term Loan, 4.00%, Maturing July 17, 2022 | | | | | | | 123 | | | | 124,460 | |
| | | | | | | | | | | | | |
| | | | | | | | | | $ | 2,607,272 | |
| | | | | | | | | | | | | |
|
Business Equipment and Services — 4.2% | |
Acosta Holdco, Inc. | | | | | | | | | | | | |
Term Loan, 4.25%, Maturing September 26, 2021 | | | | | | | 538 | | | $ | 518,292 | |
AlixPartners, LLP | | | | | | | | | | | | |
Term Loan, 4.00%, Maturing July 28, 2022 | | | | | | | 367 | | | | 368,461 | |
Altisource Solutions S.a.r.l. | | | | | | | | | | | | |
Term Loan, 4.50%, Maturing December 9, 2020 | | | | | | | 124 | | | | 120,337 | |
| | | | |
| | 5 | | See Notes to Financial Statements. |
Eaton Vance
Short Duration Diversified Income Fund
October 31, 2016
Portfolio of Investments — continued
| | | | | | | | | | | | |
| Borrower/Tranche Description | | | | | Principal Amount* (000’s omitted) | | | Value | |
| | | | | | | | | | | | |
|
Business Equipment and Services (continued) | |
Brickman Group Ltd., LLC | | | | | | | | | | | | |
Term Loan, 4.00%, Maturing December 18, 2020 | | | | | | | 146 | | | $ | 145,857 | |
Camelot UK Holdco Limited | | | | | | | | | | | | |
Term Loan, 4.75%, Maturing October 3, 2023 | | | | | | | 200 | | | | 200,531 | |
CCC Information Services, Inc. | | | | | | | | | | | | |
Term Loan, 4.00%, Maturing December 20, 2019 | | | | | | | 843 | | | | 843,945 | |
Ceridian, LLC | | | | | | | | | | | | |
Term Loan, 4.50%, Maturing September 15, 2020 | | | | | | | 605 | | | | 595,099 | |
Corporate Capital Trust, Inc. | | | | | | | | | | | | |
Term Loan, 4.13%, Maturing May 20, 2019 | | | | | | | 1,059 | | | | 1,062,738 | |
CPM Holdings, Inc. | | | | | | | | | | | | |
Term Loan, 6.00%, Maturing April 11, 2022 | | | | | | | 248 | | | | 249,920 | |
Education Management, LLC | | | | | | | | | | | | |
Term Loan, 5.50%, Maturing July 2, 2020 | | | | | | | 80 | | | | 21,935 | |
Term Loan, 8.50%, (2.00% Cash, 6.50% PIK) Maturing July 2, 2020 | | | | | | | 149 | | | | 8,201 | |
EIG Investors Corp. | | | | | | | | | | | | |
Term Loan, 6.48%, Maturing November 9, 2019 | | | | | | | 447 | | | | 436,629 | |
Emdeon Business Services, LLC | | | | | | | | | | | | |
Term Loan, 3.75%, Maturing November 2, 2018 | | | | | | | 264 | | | | 264,461 | |
Extreme Reach, Inc. | | | | | | | | | | | | |
Term Loan, 7.25%, Maturing February 7, 2020 | | | | | | | 115 | | | | 115,826 | |
Garda World Security Corporation | | | | | | | | | | | | |
Term Loan, 4.00%, Maturing November 6, 2020 | | | | | | | 59 | | | | 58,993 | |
Term Loan, 4.00%, Maturing November 6, 2020 | | | | | | | 331 | | | | 328,410 | |
Global Payments, Inc. | | | | | | | | | | | | |
Term Loan, 3.03%, Maturing April 22, 2023 | | | | | | | 65 | | | | 65,224 | |
IG Investment Holdings, LLC | | | | | | | | | | | | |
Term Loan, 6.00%, Maturing October 29, 2021 | | | | | | | 439 | | | | 442,852 | |
Information Resources, Inc. | | | | | | | | | | | | |
Term Loan, 4.75%, Maturing September 30, 2020 | | | | | | | 217 | | | | 217,946 | |
ION Trading Finance Limited | | | | | | | | | | | | |
Term Loan, 4.25%, Maturing August 11, 2023 | | | EUR | | | | 164 | | | | 182,124 | |
J.D. Power and Associates | | | | | | | | | | | | |
Term Loan, 5.25%, Maturing September 7, 2023 | | | | | | | 125 | | | | 126,406 | |
KAR Auction Services, Inc. | | | | | | | | | | | | |
Term Loan, 4.06%, Maturing March 11, 2021 | | | | | | | 534 | | | | 537,984 | |
Kronos Incorporated | | | | | | | | | | | | |
Term Loan, 4.50%, Maturing October 30, 2019 | | | | | | | 431 | | | | 432,449 | |
Term Loan, Maturing October 4, 2023(2) | | | | | | | 1,050 | | | | 1,055,824 | |
Term Loan - Second Lien, 9.75%, Maturing April 30, 2020 | | | | | | | 200 | | | | 203,918 | |
MCS AMS Sub-Holdings, LLC | | | | | | | | | | | | |
Term Loan, 7.50%, Maturing October 15, 2019 | | | | | | | 79 | | | | 73,422 | |
| | | | | | | | | | | | |
| Borrower/Tranche Description | | | | | Principal Amount* (000’s omitted) | | | Value | |
| | | | | | | | | | | | |
|
Business Equipment and Services (continued) | |
Monitronics International, Inc. | | | | | | | | | | | | |
Term Loan, 6.50%, Maturing September 30, 2022 | | | | | | | 397 | | | $ | 395,235 | |
PGX Holdings, Inc. | | | | | | | | | | | | |
Term Loan, 5.75%, Maturing September 29, 2020 | | | | | | | 354 | | | | 354,800 | |
Prime Security Services Borrower, LLC | | | | | | | | | | | | |
Term Loan, 4.75%, Maturing May 2, 2022 | | | | | | | 200 | | | | 201,146 | |
ServiceMaster Company | | | | | | | | | | | | |
Term Loan, 4.25%, Maturing July 1, 2021 | | | | | | | 764 | | | | 767,374 | |
Spin Holdco, Inc. | | | | | | | | | | | | |
Term Loan, 4.25%, Maturing November 14, 2019 | | | | | | | 620 | | | | 617,958 | |
Travelport Finance (Luxembourg) S.a.r.l. | | | | | | | | | | | | |
Term Loan, 5.00%, Maturing September 2, 2021 | | | | | | | 216 | | | | 217,781 | |
WASH Multifamily Laundry Systems, LLC | | | | | | | | | | | | |
Term Loan, 4.25%, Maturing May 14, 2022 | | | | | | | 211 | | | | 211,353 | |
| | | | | | | | | | | | | |
| | | | | | | | | | $ | 11,443,431 | |
| | | | | | | | | | | | | |
|
Cable and Satellite Television — 1.3% | |
Altice US Finance I Corporation | | | | | | | | | | | | |
Term Loan, Maturing January 15, 2025(2) | | | | | | | 200 | | | $ | 201,000 | |
Atlantic Broadband Finance, LLC | | | | | | | | | | | | |
Term Loan, 3.25%, Maturing November 30, 2019 | | | | | | | 129 | | | | 129,732 | |
Block Communications, Inc. | | | | | | | | | | | | |
Term Loan, 4.09%, Maturing November 7, 2021 | | | | | | | 198 | | | | 199,604 | |
Charter Communications Operating, LLC | | | | | | | | | | | | |
Term Loan, 3.50%, Maturing January 24, 2023 | | | | | | | 373 | | | | 375,820 | |
CSC Holdings, LLC | | | | | | | | | | | | |
Term Loan, 3.88%, Maturing October 11, 2024 | | | | | | | 461 | | | | 462,733 | |
MCC Iowa, LLC | | | | | | | | | | | | |
Term Loan, 3.25%, Maturing January 29, 2021 | | | | | | | 169 | | | | 170,238 | |
Term Loan, 3.75%, Maturing June 30, 2021 | | | | | | | 147 | | | | 147,473 | |
Numericable Group SA | | | | | | | | | | | | |
Term Loan, 4.56%, Maturing July 31, 2022 | | | | | | | 74 | | | | 74,343 | |
Term Loan, 4.00%, Maturing July 31, 2023 | | | EUR | | | | 124 | | | | 137,506 | |
Numericable U.S., LLC | | | | | | | | | | | | |
Term Loan, 5.14%, Maturing January 15, 2024 | | | | | | | 149 | | | | 150,369 | |
Telenet International Finance S.a.r.l. | | | | | | | | | | | | |
Term Loan, 4.36%, Maturing June 30, 2024 | | | | | | | 150 | | | | 150,562 | |
Virgin Media Investment Holdings Limited | | | | | | | | | | | | |
Term Loan, 3.50%, Maturing June 30, 2023 | | | | | | | 639 | | | | 641,784 | |
Term Loan, 4.25%, Maturing June 30, 2023 | | | GBP | | | | 300 | | | | 368,983 | |
Ziggo Secured Finance BV | | | | | | | | | | | | |
Term Loan, 3.75%, Maturing August 31, 2024 | | | EUR | | | | 350 | | | | 387,068 | |
| | | | | | | | | | | | | |
| | | | | | | | | | $ | 3,597,215 | |
| | | | | | | | | | | | | |
| | | | |
| | 6 | | See Notes to Financial Statements. |
Eaton Vance
Short Duration Diversified Income Fund
October 31, 2016
Portfolio of Investments — continued
| | | | | | | | | | | | |
| Borrower/Tranche Description | | | | | Principal Amount* (000’s omitted) | | | Value | |
| | | | | | | | | | | | |
|
Chemicals and Plastics — 2.8% | |
Aruba Investments, Inc. | | | | | | | | | | | | |
Term Loan, 4.50%, Maturing February 2, 2022 | | | | | | | 58 | | | $ | 57,934 | |
Axalta Coating Systems US Holdings, Inc. | | | | | | | | | | | | |
Term Loan, 3.75%, Maturing February 1, 2020 | | | | | | | 425 | | | | 428,143 | |
Emerald Performance Materials, LLC | | | | | | | | | | | | |
Term Loan, 4.50%, Maturing August 1, 2021 | | | | | | | 337 | | | | 339,442 | |
Term Loan - Second Lien, 7.75%, Maturing August 1, 2022 | | | | | | | 100 | | | | 99,750 | |
Flint Group GmbH | | | | | | | | | | | | |
Term Loan, 4.50%, Maturing September 7, 2021 | | | | | | | 24 | | | | 24,268 | |
Flint Group US, LLC | | | | | | | | | | | | |
Term Loan, 4.50%, Maturing September 7, 2021 | | | | | | | 147 | | | | 146,864 | |
Gemini HDPE, LLC | | | | | | | | | | | | |
Term Loan, 4.75%, Maturing August 7, 2021 | | | | | | | 367 | | | | 369,549 | |
Huntsman International, LLC | | | | | | | | | | | | |
Term Loan, 3.59%, Maturing April 19, 2019 | | | | | | | 1,086 | | | | 1,093,208 | |
Term Loan, 3.75%, Maturing October 1, 2021 | | | | | | | 368 | | | | 370,798 | |
Term Loan, 4.25%, Maturing April 1, 2023 | | | | | | | 100 | | | | 100,680 | |
Ineos US Finance, LLC | | | | | | | | | | | | |
Term Loan, 3.75%, Maturing May 4, 2018 | | | | | | | 1,317 | | | | 1,321,257 | |
Term Loan, 4.25%, Maturing March 31, 2022 | | | | | | | 123 | | | | 123,868 | |
Kraton Polymers, LLC | | | | | | | | | | | | |
Term Loan, 6.00%, Maturing January 6, 2022 | | | | | | | 250 | | | | 252,136 | |
Kronos Worldwide, Inc. | | | | | | | | | | | | |
Term Loan, 4.00%, Maturing February 18, 2020 | | | | | | | 49 | | | | 48,141 | |
MacDermid, Inc. | | | | | | | | | | | | |
Term Loan, 5.50%, Maturing June 7, 2020 | | | | | | | 99 | | | | 99,970 | |
Term Loan, 5.00%, Maturing June 7, 2023 | | | | | | | 335 | | | | 337,895 | |
Minerals Technologies, Inc. | | | | | | | | | | | | |
Term Loan, 3.75%, Maturing May 9, 2021 | | | | | | | 188 | | | | 189,769 | |
Orion Engineered Carbons GmbH | | | | | | | | | | | | |
Term Loan, 3.75%, Maturing July 25, 2021 | | | EUR | | | | 173 | | | | 193,611 | |
Term Loan, 3.84%, Maturing July 25, 2021 | | | | | | | 84 | | | | 84,842 | |
OXEA Finance, LLC | | | | | | | | | | | | |
Term Loan, 4.25%, Maturing January 15, 2020 | | | | | | | 121 | | | | 116,097 | |
PolyOne Corporation | | | | | | | | | | | | |
Term Loan, 3.50%, Maturing November 11, 2022 | | | | | | | 99 | | | | 99,974 | |
PQ Corporation | | | | | | | | | | | | |
Term Loan, 5.75%, Maturing November 4, 2022 | | | | | | | 224 | | | | 225,965 | |
Solenis International L.P. | | | | | | | | | | | | |
Term Loan, 4.50%, Maturing July 31, 2021 | | | EUR | | | | 172 | | | | 190,696 | |
Tata Chemicals North America, Inc. | | | | | | | | | | | | |
Term Loan, 3.75%, Maturing August 7, 2020 | | | | | | | 176 | | | | 175,768 | |
Trinseo Materials Operating S.C.A. | | | | | | | | | | | | |
Term Loan, 4.25%, Maturing November 5, 2021 | | | | | | | 49 | | | | 49,673 | |
| | | | | | | | | | | | |
| Borrower/Tranche Description | | | | | Principal Amount* (000’s omitted) | | | Value | |
| | | | | | | | | | | | |
|
Chemicals and Plastics (continued) | |
Tronox Pigments (Netherlands) B.V. | | | | | | | | | | | | |
Term Loan, 4.50%, Maturing March 19, 2020 | | | | | | | 386 | | | $ | 384,572 | |
Univar, Inc. | | | | | | | | | | | | |
Term Loan, 4.25%, Maturing July 1, 2022 | | | | | | | 594 | | | | 595,237 | |
Zep, Inc. | | | | | | | | | | | | |
Term Loan, 5.50%, Maturing June 27, 2022 | | | | | | | 74 | | | | 74,340 | |
| | | | | | | | | | | | | |
| | | | | | | | | | $ | 7,594,447 | |
| | | | | | | | | | | | | |
|
Clothing / Textiles — 0.1% | |
Ascena Retail Group, Inc. | | | | | | | | | | | | |
Term Loan, 5.25%, Maturing August 21, 2022 | | | | | | | 277 | | | $ | 270,824 | |
| | | | | | | | | | | | | |
| | | | | | | | | | $ | 270,824 | |
| | | | | | | | | | | | | |
|
Conglomerates — 0.4% | |
RGIS Services, LLC | | | | | | | | | | | | |
Term Loan, 5.50%, Maturing October 18, 2017 | | | | | | | 717 | | | $ | 671,755 | |
Spectrum Brands, Inc. | | | | | | | | | | | | |
Term Loan, 3.29%, Maturing June 23, 2022 | | | | | | | 277 | | | | 280,389 | |
| | | | | | | | | | | | | |
| | | | | | | | | | $ | 952,144 | |
| | | | | | | | | | | | | |
|
Containers and Glass Products — 2.2% | |
Berry Plastics Holding Corporation | | | | | | | | | | | | |
Term Loan, 3.50%, Maturing February 8, 2020 | | | | | | | 410 | | | $ | 411,364 | |
Term Loan, 3.50%, Maturing January 6, 2021 | | | | | | | 797 | | | | 799,086 | |
Term Loan, 3.75%, Maturing October 1, 2022 | | | | | | | 171 | | | | 172,156 | |
Hilex Poly Co., LLC | | | | | | | | | | | | |
Term Loan, 6.00%, Maturing December 5, 2021 | | | | | | | 788 | | | | 796,649 | |
Horizon Holdings III SAS | | | | | | | | | | | | |
Term Loan, 4.50%, Maturing August 1, 2022 | | | EUR | | | | 300 | | | | 333,282 | |
Libbey Glass, Inc. | | | | | | | | | | | | |
Term Loan, 3.75%, Maturing April 9, 2021 | | | | | | | 47 | | | | 47,278 | |
Pelican Products, Inc. | | | | | | | | | | | | |
Term Loan, 5.25%, Maturing April 10, 2020 | | | | | | | 421 | | | | 417,281 | |
Reynolds Group Holdings, Inc. | | | | | | | | | | | | |
Term Loan, 4.25%, Maturing February 5, 2023 | | | | | | | 1,903 | | | | 1,909,945 | |
SIG Combibloc Purchase Co. S.a.r.l. | | | | | | | | | | | | |
Term Loan, 3.75%, Maturing March 13, 2022 | | | EUR | | | | 394 | | | | 437,028 | |
SIG Combibloc US Acquisition, Inc. | | | | | | | | | | | | |
Term Loan, 4.00%, Maturing March 13, 2022 | | | | | | | 222 | | | | 222,231 | |
TricorBraun, Inc. | | | | | | | | | | | | |
Term Loan, 4.00%, Maturing May 3, 2018 | | | | | | | 388 | | | | 388,664 | |
| | | | | | | | | | | | | |
| | | | | | | | | | $ | 5,934,964 | |
| | | | | | | | | | | | | |
| | | | |
| | 7 | | See Notes to Financial Statements. |
Eaton Vance
Short Duration Diversified Income Fund
October 31, 2016
Portfolio of Investments — continued
| | | | | | | | | | | | |
| Borrower/Tranche Description | | | | | Principal Amount* (000’s omitted) | | | Value | |
| | | | | | | | | | | | |
|
Cosmetics / Toiletries — 0.3% | |
Coty, Inc. | | | | | | | | | | | | |
Term Loan, 3.03%, Maturing October 27, 2022 | | | | | | | 149 | | | $ | 149,530 | |
Galleria Co. | | | | | | | | | | | | |
Term Loan, 3.75%, Maturing January 26, 2023 | | | | | | | 325 | | | | 327,434 | |
KIK Custom Products, Inc. | | | | | | | | | | | | |
Term Loan, 6.00%, Maturing August 26, 2022 | | | | | | | 272 | | | | 272,250 | |
Revlon Consumer Products Corporation | | | | | | | | | | | | |
Term Loan, 4.25%, Maturing September 7, 2023 | | | | | | | 75 | | | | 75,269 | |
| | | | | | | | | | | | | |
| | | | | | | | | | $ | 824,483 | |
| | | | | | | | | | | | | |
|
Drugs — 2.4% | |
Albany Molecular Research, Inc. | | | | | | | | | | | | |
Term Loan, 5.75%, Maturing July 16, 2021 | | | | | | | 620 | | | $ | 623,535 | |
Alkermes, Inc. | | | | | | | | | | | | |
Term Loan, 3.59%, Maturing September 25, 2021 | | | | | | | 72 | | | | 72,361 | |
AMAG Pharmaceuticals, Inc. | | | | | | | | | | | | |
Term Loan, 4.75%, Maturing August 13, 2021 | | | | | | | 190 | | | | 190,475 | |
Amneal Pharmaceuticals, LLC | | | | | | | | | | | | |
Term Loan, 4.50%, Maturing November 1, 2019 | | | | | | | 637 | | | | 640,422 | |
Arbor Pharmaceuticals, Inc. | | | | | | | | | | | | |
Term Loan, 6.00%, Maturing June 28, 2023 | | | | | | | 275 | | | | 277,922 | |
DPx Holdings B.V. | | | | | | | | | | | | |
Term Loan, 4.25%, Maturing March 11, 2021 | | | | | | | 540 | | | | 540,702 | |
Endo Luxembourg Finance Company I S.a.r.l. | | | | | | | | | | | | |
Term Loan, 3.75%, Maturing September 26, 2022 | | | | | | | 496 | | | | 496,173 | |
Horizon Pharma, Inc. | | | | | | | | | | | | |
Term Loan, 4.00%, Maturing May 7, 2021 | | | | | | | 444 | | | | 443,819 | |
Term Loan, Maturing October 18,
2021(2) | | | | | | | 125 | | | | 125,703 | |
Jaguar Holding Company II | | | | | | | | | | | | |
Term Loan, 4.25%, Maturing August 18, 2022 | | | | | | | 865 | | | | 865,433 | |
Mallinckrodt International Finance S.A. | | | | | | | | | | | | |
Term Loan, 3.34%, Maturing March 19, 2021 | | | | | | | 268 | | | | 268,041 | |
Term Loan, 3.59%, Maturing March 19, 2021 | | | | | | | 221 | | | | 220,672 | |
Valeant Pharmaceuticals International, Inc. | | | | | | | | | | | | |
Term Loan, 5.25%, Maturing December 11, 2019 | | | | | | | 331 | | | | 331,065 | |
Term Loan, 5.25%, Maturing August 5, 2020 | | | | | | | 695 | | | | 695,229 | |
Term Loan, 5.50%, Maturing April 1, 2022 | | | | | | | 662 | | | | 663,008 | |
| | | | | | | | | | | | | |
| | | | | | | | | | $ | 6,454,560 | |
| | | | | | | | | | | | | |
|
Ecological Services and Equipment — 0.4% | |
ADS Waste Holdings, Inc. | | | | | | | | | | | | |
Term Loan, 3.75%, Maturing October 9, 2019 | | | | | | | 302 | | | $ | 302,803 | |
EnergySolutions, LLC | | | | | | | | | | | | |
Term Loan, 6.75%, Maturing May 29, 2020 | | | | | | | 559 | | | | 560,532 | |
| | | | | | | | | | | | |
| Borrower/Tranche Description | | | | | Principal Amount* (000’s omitted) | | | Value | |
| | | | | | | | | | | | |
|
Ecological Services and Equipment (continued) | |
GFL Environmental, Inc. | | | | | | | | | | | | |
Term Loan, 3.75%, Maturing September 23, 2023 | | | | | | | 150 | | | $ | 150,375 | |
| | | | | | | | | | | | | |
| | | | | | | | | | $ | 1,013,710 | |
| | | | | | | | | | | | | |
|
Electronics / Electrical — 4.8% | |
Answers Corporation | | | | | | | | | | | | |
Term Loan, 0.00%, Maturing October 3, 2021(3) | | | | | | | 222 | | | $ | 118,015 | |
Avago Technologies Cayman, Ltd. | | | | | | | | | | | | |
Term Loan, 3.53%, Maturing February 1, 2023 | | | | | | | 1,096 | | | | 1,109,097 | |
Avast Software B.V. | | | | | | | | | | | | |
Term Loan, 5.00%, Maturing September 30, 2022 | | | | | | | 350 | | | | 353,413 | |
Campaign Monitor Finance Pty. Limited | | | | | | | | | | | | |
Term Loan, 6.25%, Maturing March 18, 2021 | | | | | | | 119 | | | | 116,151 | |
CommScope, Inc. | | | | | | | | | | | | |
Term Loan, 3.54%, Maturing January 14, 2018 | | | | | | | 100 | | | | 99,917 | |
Term Loan, 3.25%, Maturing December 29, 2022 | | | | | | | 173 | | | | 174,419 | |
Cypress Semiconductor Corporation | | | | | | | | | | | | |
Term Loan, 6.50%, Maturing July 5, 2021 | | | | | | | 198 | | | | 199,886 | |
Deltek, Inc. | | | | | | | | | | | | |
Term Loan, 5.00%, Maturing June 25, 2022 | | | | | | | 350 | | | | 352,319 | |
Electrical Components International, Inc. | | | | | | | | | | | | |
Term Loan, 5.75%, Maturing May 28, 2021 | | | | | | | 617 | | | | 618,469 | |
Entegris, Inc. | | | | | | | | | | | | |
Term Loan, 3.50%, Maturing April 30, 2021 | | | | | | | 42 | | | | 42,468 | |
Excelitas Technologies Corp. | | | | | | | | | | | | |
Term Loan, 6.00%, Maturing October 31, 2020 | | | | | | | 144 | | | | 140,718 | |
Go Daddy Operating Company, LLC | | | | | | | | | | | | |
Term Loan, 4.25%, Maturing May 13, 2021 | | | | | | | 640 | | | | 644,681 | |
Infor (US), Inc. | | | | | | | | | | | | |
Term Loan, 3.75%, Maturing June 3, 2020 | | | | | | | 890 | | | | 888,436 | |
Informatica Corporation | | | | | | | | | | | | |
Term Loan, 4.50%, Maturing August 5, 2022 | | | | | | | 421 | | | | 414,071 | |
Lattice Semiconductor Corporation | | | | | | | | | | | | |
Term Loan, 5.51%, Maturing March 10, 2021 | | | | | | | 98 | | | | 97,537 | |
M/A-COM Technology Solutions Holdings, Inc. | | | | | | | | | | | | |
Term Loan, 4.63%, Maturing May 7, 2021 | | | | | | | 148 | | | | 149,283 | |
MA FinanceCo., LLC | | | | | | | | | | | | |
Term Loan, 4.50%, Maturing November 20, 2019 | | | | | | | 191 | | | | 192,258 | |
Term Loan, 4.50%, Maturing November 20, 2021 | | | | | | | 691 | | | | 694,430 | |
Magic Newco, LLC | | | | | | | | | | | | |
Term Loan, 6.50%, Maturing December 12, 2018 | | | | | | | 264 | | | | 264,769 | |
MH Sub I, LLC | | | | | | | | | | | | |
Term Loan, 4.75%, Maturing July 8, 2021 | | | | | | | 221 | | | | 221,591 | |
Microsemi Corporation | | | | | | | | | | | | |
Term Loan, 3.75%, Maturing January 15, 2023 | | | | | | | 69 | | | | 70,163 | |
| | | | |
| | 8 | | See Notes to Financial Statements. |
Eaton Vance
Short Duration Diversified Income Fund
October 31, 2016
Portfolio of Investments — continued
| | | | | | | | | | | | |
| Borrower/Tranche Description | | | | | Principal Amount* (000’s omitted) | | | Value | |
| | | | | | | | | | | | |
|
Electronics / Electrical (continued) | |
MTS Systems Corporation | | | | | | | | | | | | |
Term Loan, 5.00%, Maturing July 5, 2023 | | | | | | | 250 | | | $ | 253,125 | |
NXP B.V. | | | | | | | | | | | | |
Term Loan, 3.34%, Maturing January 11, 2020 | | | | | | | 340 | | | | 341,339 | |
Term Loan, 3.41%, Maturing December 7, 2020 | | | | | | | 173 | | | | 174,089 | |
ON Semiconductor Corporation | | | | | | | | | | | | |
Term Loan, 3.78%, Maturing March 31, 2023 | | | | | | | 200 | | | | 201,393 | |
Renaissance Learning, Inc. | | | | | | | | | | | | |
Term Loan, 4.50%, Maturing April 9, 2021 | | | | | | | 122 | | | | 121,824 | |
Rocket Software, Inc. | | | | | | | | | | | | |
Term Loan, 5.25%, Maturing October 14, 2023 | | | | | | | 200 | | | | 201,250 | |
SGS Cayman L.P. | | | | | | | | | | | | |
Term Loan, 6.00%, Maturing April 23, 2021 | | | | | | | 37 | | | | 36,686 | |
SkillSoft Corporation | | | | | | | | | | | | |
Term Loan, 5.84%, Maturing April 28, 2021 | | | | | | | 690 | | | | 615,603 | |
Southwire Company | | | | | | | | | | | | |
Term Loan, 3.00%, Maturing February 10, 2021 | | | | | | | 393 | | | | 391,689 | |
SS&C Technologies, Inc. | | | | | | | | | | | | |
Term Loan, 4.00%, Maturing July 8, 2022 | | | | | | | 39 | | | | 38,930 | |
Term Loan, 4.00%, Maturing July 8, 2022 | | | | | | | 317 | | | | 319,888 | |
SunEdison Semiconductor B.V. | | | | | | | | | | | | |
Term Loan, 6.50%, Maturing May 27, 2019 | | | | | | | 115 | | | | 115,058 | |
SurveyMonkey, Inc. | | | | | | | | | | | | |
Term Loan, 6.25%, Maturing February 5, 2019 | | | | | | | 95 | | | | 95,008 | |
Sutherland Global Services, Inc. | | | | | | | | | | | | |
Term Loan, 6.00%, Maturing April 23, 2021 | | | | | | | 159 | | | | 157,599 | |
Uber Technologies | | | | | | | | | | | | |
Term Loan, 5.00%, Maturing July 13, 2023 | | | | | | | 325 | | | | 326,828 | |
Vantiv, LLC | | | | | | | | | | | | |
Term Loan, 3.25%, Maturing October 14, 2023 | | | | | | | 82 | | | | 82,297 | |
VeriFone, Inc. | | | | | | | | | | | | |
Term Loan, 3.50%, Maturing July 8, 2021 | | | | | | | 489 | | | | 487,324 | |
Veritas US, Inc. | | | | | | | | | | | | |
Term Loan, 6.63%, Maturing January 27, 2023 | | | | | | | 423 | | | | 395,546 | |
Vertafore, Inc. | | | | | | | | | | | | |
Term Loan, 4.75%, Maturing June 30, 2023 | | | | | | | 425 | | | | 427,158 | |
Wall Street Systems Delaware, Inc. | | | | | | | | | | | | |
Term Loan, 4.75%, Maturing August 23, 2023 | | | | | | | 492 | | | | 493,727 | |
Western Digital Corporation | | | | | | | | | | | | |
Term Loan, 4.50%, Maturing April 29, 2023 | | | | | | | 419 | | | | 424,318 | |
Zebra Technologies Corporation | | | | | | | | | | | | |
Term Loan, 4.09%, Maturing October 27, 2021 | | | | | | | 348 | | | | 351,784 | |
| | | | | | | | | | | | | |
| | | | | | | | | | $ | 13,014,554 | |
| | | | | | | | | | | | | |
| | | | | | | | | | | | |
| Borrower/Tranche Description | | | | | Principal Amount* (000’s omitted) | | | Value | |
| | | | | | | | | | | | |
|
Equipment Leasing — 0.3% | |
Delos Finance S.a.r.l. | | | | | | | | | | | | |
Term Loan, 3.59%, Maturing March 6, 2021 | | | | | | | 425 | | | $ | 428,506 | |
Flying Fortress, Inc. | | | | | | | | | | | | |
Term Loan, 3.59%, Maturing April 30, 2020 | | | | | | | 500 | | | | 504,141 | |
| | | | | | | | | | | | | |
| | | | | | | | | | $ | 932,647 | |
| | | | | | | | | | | | | |
|
Financial Intermediaries — 1.8% | |
Armor Holding II, LLC | | | | | | | | | | | | |
Term Loan, 5.75%, Maturing June 26, 2020 | | | | | | | 414 | | | $ | 406,088 | |
Citco Funding, LLC | | | | | | | | | | | | |
Term Loan, 4.25%, Maturing June 29, 2018 | | | | | | | 665 | | | | 667,387 | |
Clipper Acquisitions Corp. | | | | | | | | | | | | |
Term Loan, 3.09%, Maturing February 6, 2020 | | | | | | | 96 | | | | 96,432 | |
Donnelley Financial Solutions, Inc. | | | | | | | | | | | | |
Term Loan, 5.00%, Maturing September 30, 2023 | | | | | | | 100 | | | | 100,625 | |
First Data Corporation | | | | | | | | | | | | |
Term Loan, 4.27%, Maturing July 8, 2022 | | | | | | | 525 | | | | 529,302 | |
Grosvenor Capital Management Holdings, LLP | | | | | | | | | | | | |
Term Loan, 3.75%, Maturing January 4, 2021 | | | | | | | 492 | | | | 489,380 | |
Guggenheim Partners, LLC | | | | | | | | | | | | |
Term Loan, 3.50%, Maturing July 21, 2023 | | | | | | | 213 | | | | 213,870 | |
Harbourvest Partners, LLC | | | | | | | | | | | | |
Term Loan, 3.38%, Maturing February 4, 2021 | | | | | | | 112 | | | | 111,787 | |
LPL Holdings, Inc. | | | | | | | | | | | | |
Term Loan, 4.25%, Maturing March 29, 2021 | | | | | | | 563 | | | | 567,456 | |
Medley, LLC | | | | | | | | | | | | |
Term Loan, 6.50%, Maturing June 15, 2019(4) | | | | | | | 41 | | | | 37,799 | |
NXT Capital, Inc. | | | | | | | | | | | | |
Term Loan, 6.25%, Maturing September 4, 2018 | | | | | | | 123 | | | | 123,404 | |
Ocwen Financial Corporation | | | | | | | | | | | | |
Term Loan, 5.50%, Maturing February 15, 2018 | | | | | | | 188 | | | | 188,248 | |
Outerwall, Inc. | | | | | | | | | | | | |
Term Loan, 5.25%, Maturing September 27, 2023 | | | | | | | 75 | | | | 75,688 | |
Sesac Holdco II, LLC | | | | | | | | | | | | |
Term Loan, 5.25%, Maturing February 8, 2019 | | | | | | | 282 | | | | 282,004 | |
Starwood Property Trust, Inc. | | | | | | | | | | | | |
Term Loan, 3.50%, Maturing April 17, 2020 | | | | | | | 121 | | | | 121,458 | |
Walker & Dunlop, Inc. | | | | | | | | | | | | |
Term Loan, 5.25%, Maturing December 11, 2020 | | | | | | | 120 | | | | 120,764 | |
Walter Investment Management Corp. | | | | | | | | | | | | |
Term Loan, 4.75%, Maturing December 19, 2020 | | | | | | | 699 | | | | 657,872 | |
| | | | | | | | | | | | | |
| | | | | | | | | | $ | 4,789,564 | |
| | | | | | | | | | | | | |
| | | | |
| | 9 | | See Notes to Financial Statements. |
Eaton Vance
Short Duration Diversified Income Fund
October 31, 2016
Portfolio of Investments — continued
| | | | | | | | | | | | |
| Borrower/Tranche Description | | | | | Principal Amount* (000’s omitted) | | | Value | |
| | | | | | | | | | | | |
|
Food Products — 1.6% | |
AdvancePierre Foods, Inc. | | | | | | | | | | | | |
Term Loan, 4.50%, Maturing June 2, 2023 | | | | | | | 442 | | | $ | 446,081 | |
Blue Buffalo Company, Ltd. | | | | | | | | | | | | |
Term Loan, 3.75%, Maturing August 8, 2019 | | | | | | | 240 | | | | 241,530 | |
Charger OpCo B.V. | | | | | | | | | | | | |
Term Loan, 4.25%, Maturing July 2, 2022 | | | EUR | | | | 56 | | | | 61,948 | |
Clearwater Seafoods Limited Partnership | | | | | | | | | | | | |
Term Loan, 4.75%, Maturing June 26, 2019 | | | | | | | 157 | | | | 157,268 | |
Del Monte Foods, Inc. | | | | | | | | | | | | |
Term Loan, 4.25%, Maturing February 18, 2021 | | | | | | | 122 | | | | 113,154 | |
Dole Food Company, Inc. | | | | | | | | | | | | |
Term Loan, 4.56%, Maturing November 1, 2018 | | | | | | | 92 | | | | 92,132 | |
High Liner Foods Incorporated | | | | | | | | | | | | |
Term Loan, 4.25%, Maturing April 24, 2021 | | | | | | | 134 | | | | 133,209 | |
JBS USA, LLC | | | | | | | | | | | | |
Term Loan, 3.75%, Maturing May 25, 2018 | | | | | | | 866 | | | | 866,918 | |
Term Loan, 3.75%, Maturing September 18, 2020 | | | | | | | 291 | | | | 291,000 | |
Term Loan, 4.00%, Maturing October 30, 2022 | | | | | | | 124 | | | | 124,061 | |
Keurig Green Mountain, Inc. | | | | | | | | | | | | |
Term Loan, 5.25%, Maturing March 3, 2023 | | | | | | | 170 | | | | 172,205 | |
NBTY, Inc. | | | | | | | | | | | | |
Term Loan, 5.00%, Maturing May 5, 2023 | | | | | | | 698 | | | | 700,956 | |
Oak Tea, Inc. | | | | | | | | | | | | |
Term Loan, 4.25%, Maturing July 2, 2022 | | | | | | | 308 | | | | 308,093 | |
Pinnacle Foods Finance, LLC | | | | | | | | | | | | |
Term Loan, 3.25%, Maturing April 29, 2020 | | | | | | | 121 | | | | 122,105 | |
Term Loan, 3.39%, Maturing April 29, 2020 | | | | | | | 605 | | | | 609,712 | |
| | | | | | | | | | | | | |
| | | | | | | | | | $ | 4,440,372 | |
| | | | | | | | | | | | | |
|
Food Service — 1.0% | |
1011778 B.C. Unlimited Liability Company | | | | | | | | | | | | |
Term Loan, 3.75%, Maturing December 10, 2021 | | | | | | | 913 | | | $ | 917,850 | |
Focus Brands, Inc. | | | | | | | | | | | | |
Term Loan, 5.00%, Maturing October 3, 2023 | | | | | | | 75 | | | | 75,735 | |
Landry’s, Inc. | | | | | | | | | | | | |
Term Loan, 4.00%, Maturing October 4, 2023 | | | | | | | 475 | | | | 478,464 | |
Manitowoc Foodservice, Inc. | | | | | | | | | | | | |
Term Loan, 5.75%, Maturing March 3, 2023 | | | | | | | 159 | | | | 161,459 | |
Weight Watchers International, Inc. | | | | | | | | | | | | |
Term Loan, 4.07%, Maturing April 2, 2020 | | | | | | | 1,007 | | | | 774,766 | |
Yum! Brands, Inc. | | | | | | | | | | | | |
Term Loan, 3.29%, Maturing June 16, 2023 | | | | | | | 175 | | | | 176,526 | |
| | | | | | | | | | | | | |
| | | | | | | | | | $ | 2,584,800 | |
| | | | | | | | | | | | | |
| | | | | | | | | | | | |
| Borrower/Tranche Description | | | | | Principal Amount* (000’s omitted) | | | Value | |
| | | | | | | | | | | | |
|
Food / Drug Retailers — 0.9% | |
Albertsons, LLC | | | | | | | | | | | | |
Term Loan, 4.50%, Maturing August 25, 2021 | | | | | | | 248 | | | $ | 250,431 | |
Term Loan, 4.75%, Maturing June 22, 2023 | | | | | | | 496 | | | | 501,113 | |
General Nutrition Centers, Inc. | | | | | | | | | | | | |
Term Loan, 3.25%, Maturing March 4, 2019 | | | | | | | 742 | | | | 729,886 | |
Rite Aid Corporation | | | | | | | | | | | | |
Term Loan - Second Lien, 5.75%, Maturing August 21, 2020 | | | | | | | 100 | | | | 100,484 | |
Supervalu, Inc. | | | | | | | | | | | | |
Term Loan, 5.50%, Maturing March 21, 2019 | | | | | | | 913 | | | | 916,452 | |
| | | | | | | | | | | | | |
| | | | | | | | | | $ | 2,498,366 | |
| | | | | | | | | | | | | |
|
Forest Products — 0.1% | |
Expera Specialty Solutions, LLC | | | | | | | | | | | | |
Term Loan, Maturing October 27, 2023(2) | | | | | | | 175 | | | $ | 173,250 | |
| | | | | | | | | | | | | |
| | | | | | | | | | $ | 173,250 | |
| | | | | | | | | | | | | |
|
Health Care — 5.7% | |
ADMI Corp. | | | | | | | | | | | | |
Term Loan, 5.25%, Maturing April 30, 2022 | | | | | | | 248 | | | $ | 250,352 | |
Akorn, Inc. | | | | | | | | | | | | |
Term Loan, 5.25%, Maturing April 16, 2021 | | | | | | | 159 | | | | 161,213 | |
Alere, Inc. | | | | | | | | | | | | |
Term Loan, 4.25%, Maturing June 18, 2022 | | | | | | | 299 | | | | 298,280 | |
Alliance Healthcare Services, Inc. | | | | | | | | | | | | |
Term Loan, 4.25%, Maturing June 3, 2019 | | | | | | | 215 | | | | 207,329 | |
AmSurg Corp. | | | | | | | | | | | | |
Term Loan, 3.50%, Maturing July 16, 2021 | | | | | | | 98 | | | | 97,887 | |
Auris Luxembourg III S.a.r.l. | | | | | | | | | | | | |
Term Loan, 4.25%, Maturing January 15, 2022 | | | | | | | 743 | | | | 747,877 | |
Beaver-Visitec International, Inc. | | | | | | | | | | | | |
Term Loan, 6.00%, Maturing August 21, 2023 | | | | | | | 150 | | | | 149,625 | |
CareCore National, LLC | | | | | | | | | | | | |
Term Loan, 5.50%, Maturing March 5, 2021 | | | | | | | 585 | | | | 576,926 | |
CHG Healthcare Services, Inc. | | | | | | | | | | | | |
Term Loan, 4.75%, Maturing June 7, 2023 | | | | | | | 373 | | | | 375,657 | |
Community Health Systems, Inc. | | | | | | | | | | | | |
Term Loan, 4.08%, Maturing December 31, 2018 | | | | | | | 325 | | | | 318,465 | |
Term Loan, 3.75%, Maturing December 31, 2019 | | | | | | | 497 | | | | 473,530 | |
Term Loan, 4.00%, Maturing January 27, 2021 | | | | | | | 914 | | | | 868,452 | |
CPI Buyer, LLC | | | | | | | | | | | | |
Term Loan, 5.50%, Maturing August 15, 2021 | | | | | | | 193 | | | | 192,547 | |
DaVita HealthCare Partners, Inc. | | | | | | | | | | | | |
Term Loan, 3.50%, Maturing June 24, 2021 | | | | | | | 538 | | | | 539,103 | |
| | | | |
| | 10 | | See Notes to Financial Statements. |
Eaton Vance
Short Duration Diversified Income Fund
October 31, 2016
Portfolio of Investments — continued
| | | | | | | | | | | | |
| Borrower/Tranche Description | | | | | Principal Amount* (000’s omitted) | | | Value | |
| | | | | | | | | | | | |
|
Health Care (continued) | |
DJO Finance, LLC | | | | | | | | | | | | |
Term Loan, 4.25%, Maturing June 8, 2020 | | | | | | | 395 | | | $ | 390,754 | |
Envision Healthcare Corporation | | | | | | | | | | | | |
Term Loan, 4.25%, Maturing May 25, 2018 | | | | | | | 392 | | | | 392,604 | |
Genoa, a QoL Healthcare Company, LLC | | | | | | | | | | | | |
Term Loan, Maturing October 25,
2023(2) | | | | | | | 100 | | | | 100,156 | |
Global Healthcare Exchange, LLC | | | | | | | | | | | | |
Term Loan, 5.25%, Maturing August 15, 2022 | | | | | | | 198 | | | | 199,739 | |
Greatbatch Ltd. | | | | | | | | | | | | |
Term Loan, 5.25%, Maturing October 27, 2022 | | | | | | | 174 | | | | 171,603 | |
Grifols Worldwide Operations USA, Inc. | | | | | | | | | | | | |
Term Loan, 3.46%, Maturing February 27, 2021 | | | | | | | 804 | | | | 812,419 | |
Iasis Healthcare, LLC | | | | | | | | | | | | |
Term Loan, 4.50%, Maturing May 3, 2018 | | | | | | | 307 | | | | 306,109 | |
IMS Health Incorporated | | | | | | | | | | | | |
Term Loan, 3.50%, Maturing March 17, 2021 | | | | | | | 977 | | | | 982,789 | |
Indivior Finance S.a.r.l. | | | | | | | | | | | | |
Term Loan, 7.00%, Maturing December 19, 2019 | | | | | | | 183 | | | | 182,500 | |
inVentiv Health, Inc. | | | | | | | | | | | | |
Term Loan, 8.75%, Maturing May 15, 2018 | | | | | | | 533 | | | | 534,255 | |
Kindred Healthcare, Inc. | | | | | | | | | | | | |
Term Loan, 4.25%, Maturing April 9, 2021 | | | | | | | 737 | | | | 738,350 | |
Kinetic Concepts, Inc. | | | | | | | | | | | | |
Term Loan, 5.00%, Maturing November 4, 2020 | | | | | | | 907 | | | | 914,008 | |
KUEHG Corp. | | | | | | | | | | | | |
Term Loan, 5.25%, Maturing August 12, 2022 | | | | | | | 198 | | | | 198,743 | |
MMM Holdings, Inc. | | | | | | | | | | | | |
Term Loan, 9.75%, Maturing December 12, 2017 | | | | | | | 104 | | | | 98,331 | |
MPH Acquisition Holdings, LLC | | | | | | | | | | | | |
Term Loan, 5.00%, Maturing June 7, 2023 | | | | | | | 431 | | | | 436,037 | |
MSO of Puerto Rico, Inc. | | | | | | | | | | | | |
Term Loan, 9.75%, Maturing December 12, 2017 | | | | | | | 75 | | | | 71,486 | |
New Millennium Holdco, Inc. | | | | | | | | | | | | |
Term Loan, 7.50%, Maturing December 21, 2020 | | | | | | | 88 | | | | 56,220 | |
Onex Carestream Finance L.P. | | | | | | | | | | | | |
Term Loan, 5.00%, Maturing June 7, 2019 | | | | | | | 414 | | | | 386,354 | |
Opal Acquisition, Inc. | | | | | | | | | | | | |
Term Loan, 5.00%, Maturing November 27, 2020 | | | | | | | 291 | | | | 269,478 | |
Ortho-Clinical Diagnostics, Inc. | | | | | | | | | | | | |
Term Loan, 4.75%, Maturing June 30, 2021 | | | | | | | 538 | | | | 525,445 | |
PRA Holdings, Inc. | | | | | | | | | | | | |
Term Loan, 4.50%, Maturing September 23, 2020 | | | | | | | 486 | | | | 489,357 | |
Quality Care Properties, Inc. | | | | | | | | | | | | |
Term Loan, Maturing September 12, 2022(2) | | | | | | | 475 | | | | 475,594 | |
| | | | | | | | | | | | |
| Borrower/Tranche Description | | | | | Principal Amount* (000’s omitted) | | | Value | |
| | | | | | | | | | | | |
|
Health Care (continued) | |
RadNet, Inc. | | | | | | | | | | | | |
Term Loan, 4.77%, Maturing July 1, 2023 | | | | | | | 275 | | | $ | 276,088 | |
Select Medical Corporation | | | | | | | | | | | | |
Term Loan, 6.00%, Maturing June 1, 2018 | | | | | | | 806 | | | | 809,737 | |
Sterigenics-Nordion Holdings, LLC | | | | | | | | | | | | |
Term Loan, 4.25%, Maturing May 15, 2022 | | | | | | | 124 | | | | 123,750 | |
Tecomet, Inc. | | | | | | | | | | | | |
Term Loan, 5.75%, Maturing December 5, 2021 | | | | | | | 221 | | | | 219,957 | |
| | | | | | | | | | | | | |
| | | | | | | | | | $ | 15,419,106 | |
| | | | | | | | | | | | | |
|
Home Furnishings — 0.5% | |
Serta Simmons Holdings, LLC | | | | | | | | | | | | |
Term Loan, 4.25%, Maturing October 1, 2019 | | | | | | | 1,255 | | | $ | 1,255,845 | |
| | | | | | | | | | | | | |
| | | | | | | | | | $ | 1,255,845 | |
| | | | | | | | | | | | | |
|
Industrial Equipment — 2.4% | |
Apex Tool Group, LLC | | | | | | | | | | | | |
Term Loan, 4.50%, Maturing January 31, 2020 | | | | | | | 535 | | | $ | 527,966 | |
Blount International, Inc. | | | | | | | | | | | | |
Term Loan, 7.25%, Maturing April 12, 2023 | | | | | | | 399 | | | | 404,237 | |
Delachaux S.A. | | | | | | | | | | | | |
Term Loan, 4.50%, Maturing October 28, 2021 | | | | | | | 73 | | | | 70,452 | |
Doosan Infracore International, Inc. | | | | | | | | | | | | |
Term Loan, 4.50%, Maturing May 28, 2021 | | | | | | | 146 | | | | 146,695 | |
EWT Holdings III Corp. | | | | | | | | | | | | |
Term Loan, 4.75%, Maturing January 15, 2021 | | | | | | | 662 | | | | 663,285 | |
Term Loan, 5.50%, Maturing January 15, 2021 | | | | | | | 100 | | | | 99,998 | |
Filtration Group Corporation | | | | | | | | | | | | |
Term Loan, Maturing November 21, 2020(2) | | | | | | | 30 | | | | 30,628 | |
Term Loan, Maturing November 21, 2020(2) | | | | | | | 70 | | | | 69,501 | |
Gardner Denver, Inc. | | | | | | | | | | | | |
Term Loan, 4.25%, Maturing July 30, 2020 | | | | | | | 340 | | | | 330,349 | |
Gates Global, Inc. | | | | | | | | | | | | |
Term Loan, 4.25%, Maturing July 6, 2021 | | | | | | | 1,016 | | | | 1,002,138 | |
Generac Power Systems, Inc. | | | | | | | | | | | | |
Term Loan, 3.60%, Maturing May 31, 2020 | | | | | | | 258 | | | | 258,616 | |
Husky Injection Molding Systems Ltd. | | | | | | | | | | | | |
Term Loan, 4.25%, Maturing June 30, 2021 | | | | | | | 513 | | | | 513,448 | |
Milacron, LLC | | | | | | | | | | | | |
Term Loan, 4.25%, Maturing September 28, 2020 | | | | | | | 215 | | | | 215,791 | |
Paladin Brands Holding, Inc. | | | | | | | | | | | | |
Term Loan, 7.25%, Maturing August 16, 2019 | | | | | | | 376 | | | | 338,441 | |
Paternoster Holding IV GmbH | | | | | | | | | | | | |
Term Loan, 7.13%, Maturing February 10, 2022 | | | EUR | | | | 175 | | | | 191,626 | |
| | | | |
| | 11 | | See Notes to Financial Statements. |
Eaton Vance
Short Duration Diversified Income Fund
October 31, 2016
Portfolio of Investments — continued
| | | | | | | | | | | | |
| Borrower/Tranche Description | | | | | Principal Amount* (000’s omitted) | | | Value | |
| | | | | | | | | | | | |
|
Industrial Equipment (continued) | |
Rexnord, LLC | | | | | | | | | | | | |
Term Loan, 4.00%, Maturing August 21, 2020 | | | | | | | 785 | | | $ | 787,287 | |
Signode Industrial Group US, Inc. | | | | | | | | | | | | |
Term Loan, 3.75%, Maturing May 1, 2021 | | | | | | | 141 | | | | 140,607 | |
STS Operating, Inc. | | | | | | | | | | | | |
Term Loan, 4.75%, Maturing February 12, 2021 | | | | | | | 334 | | | | 305,063 | |
Tank Holding Corp. | | | | | | | | | | | | |
Term Loan, 5.25%, Maturing March 16, 2022 | | | | | | | 144 | | | | 140,922 | |
Terex Corporation | | | | | | | | | | | | |
Term Loan, 3.50%, Maturing August 13, 2021 | | | EUR | | | | 294 | | | | 322,840 | |
| | | | | | | | | | | | | |
| | | | | | | | | | $ | 6,559,890 | |
| | | | | | | | | | | | | |
|
Insurance — 1.7% | |
Alliant Holdings I, Inc. | | | | | | | | | | | | |
Term Loan, 4.75%, Maturing August 12, 2022 | | | | | | | 346 | | | $ | 346,309 | |
AmWINS Group, LLC | | | | | | | | | | | | |
Term Loan, 4.75%, Maturing September 6, 2019 | | | | | | | 891 | | | | 897,859 | |
AssuredPartners, Inc. | | | | | | | | | | | | |
Term Loan, 5.75%, Maturing October 21, 2022 | | | | | | | 149 | | | | 149,994 | |
Term Loan - Second Lien, 10.00%, Maturing October 20, 2023 | | | | | | | 125 | | | | 125,781 | |
Asurion, LLC | | | | | | | | | | | | |
Term Loan, 5.00%, Maturing May 24, 2019 | | | | | | | 537 | | | | 538,278 | |
Term Loan, 5.00%, Maturing August 4, 2022 | | | | | | | 976 | | | | 982,352 | |
Term Loan - Second Lien, 8.50%, Maturing March 3, 2021 | | | | | | | 375 | | | | 377,187 | |
Cunningham Lindsey U.S., Inc. | | | | | | | | | | | | |
Term Loan, 5.00%, Maturing December 10, 2019 | | | | | | | 165 | | | | 139,944 | |
Hub International Limited | | | | | | | | | | | | |
Term Loan, 4.00%, Maturing October 2, 2020 | | | | | | | 509 | | | | 509,563 | |
USI, Inc. | | | | | | | | | | | | |
Term Loan, 4.25%, Maturing December 27, 2019 | | | | | | | 458 | | | | 458,665 | |
| | | | | | | | | | | | | |
| | | | | | | | | | $ | 4,525,932 | |
| | | | | | | | | | | | | |
|
Leisure Goods / Activities / Movies — 2.3% | |
AMC Entertainment, Inc. | | | | | | | | | | | | |
Term Loan, 4.00%, Maturing December 15, 2022 | | | | | | | 396 | | | $ | 399,041 | |
Term Loan, Maturing December 15, 2023(2) | | | | | | | 100 | | | | 99,750 | |
Ancestry.com Operations, Inc. | | | | | | | | | | | | |
Term Loan, 5.25%, Maturing October 19, 2023 | | | | | | | 375 | | | | 376,359 | |
Bombardier Recreational Products, Inc. | | | | | | | | | | | | |
Term Loan, 3.75%, Maturing June 30, 2023 | | | | | | | 825 | | | | 827,888 | |
CDS U.S. Intermediate Holdings, Inc. | | | | | | | | | | | | |
Term Loan, 5.00%, Maturing July 8, 2022 | | | | | | | 372 | | | | 373,622 | |
| | | | | | | | | | | | |
| Borrower/Tranche Description | | | | | Principal Amount* (000’s omitted) | | | Value | |
| | | | | | | | | | | | |
|
Leisure Goods / Activities / Movies (continued) | |
ClubCorp Club Operations, Inc. | | | | | | | | | | | | |
Term Loan, 4.00%, Maturing December 15, 2022 | | | | | | | 350 | | | $ | 351,969 | |
Emerald Expositions Holding, Inc. | | | | | | | | | | | | |
Term Loan, 4.75%, Maturing June 17, 2020 | | | | | | | 239 | | | | 239,786 | |
Kasima, LLC | | | | | | | | | | | | |
Term Loan, 3.33%, Maturing May 17, 2021 | | | | | | | 90 | | | | 90,299 | |
Lindblad Expeditions, Inc. | | | | | | | | | | | | |
Term Loan, 5.50%, Maturing May 8, 2021 | | | | | | | 45 | | | | 45,369 | |
Term Loan, 5.50%, Maturing May 8, 2021 | | | | | | | 350 | | | | 351,606 | |
Live Nation Entertainment, Inc. | | | | | | | | | | | | |
Term Loan, 3.34%, Maturing October 26, 2023 | | | | | | | 493 | | | | 493,944 | |
LTF Merger Sub, Inc. | | | | | | | | | | | | |
Term Loan, 4.25%, Maturing June 10, 2022 | | | | | | | 247 | | | | 247,426 | |
Match Group, Inc. | | | | | | | | | | | | |
Term Loan, 5.50%, Maturing November 16, 2022 | | | | | | | 98 | | | | 98,292 | |
Nord Anglia Education Finance, LLC | | | | | | | | | | | | |
Term Loan, 5.00%, Maturing March 31, 2021 | | | | | | | 638 | | | | 642,333 | |
Sabre, Inc. | | | | | | | | | | | | |
Term Loan, 4.00%, Maturing February 19, 2019 | | | | | | | 180 | | | | 181,078 | |
SeaWorld Parks & Entertainment, Inc. | | | | | | | | | | | | |
Term Loan, 3.09%, Maturing May 14, 2020 | | | | | | | 330 | | | | 325,533 | |
SRAM, LLC | | | | | | | | | | | | |
Term Loan, 4.01%, Maturing April 10, 2020 | | | | | | | 305 | | | | 297,691 | |
Steinway Musical Instruments, Inc. | | | | | | | | | | | | |
Term Loan, 4.75%, Maturing September 19, 2019 | | | | | | | 373 | | | | 365,093 | |
UFC Holdings, LLC | | | | | | | | | | | | |
Term Loan, 5.00%, Maturing August 18, 2023 | | | | | | | 250 | | | | 252,552 | |
WMG Acquisition Corp. | | | | | | | | | | | | |
Term Loan, 3.75%, Maturing July 1, 2020 | | | | | | | 131 | | | | 130,672 | |
Term Loan, Maturing October 20,
2023(2) | | | | | | | 100 | | | | 99,875 | |
| | | | | | | | | | | | | |
| | | | | | | | | | $ | 6,290,178 | |
| | | | | | | | | | | | | |
|
Lodging and Casinos — 2.3% | |
Amaya Holdings B.V. | | | | | | | | | | | | |
Term Loan, 5.00%, Maturing August 1, 2021 | | | | | | | 638 | | | $ | 638,535 | |
Term Loan - Second Lien, 8.00%, Maturing August 1, 2022 | | | | | | | 539 | | | | 539,207 | |
Boyd Gaming Corporation | | | | | | | | | | | | |
Term Loan, 4.00%, Maturing August 14, 2020 | | | | | | | 30 | | | | 30,662 | |
Term Loan, 3.53%, Maturing September 15, 2023 | | | | | | | 150 | | | | 151,238 | |
Caesars Entertainment Operating Company | | | | | | | | | | | | |
Term Loan, 0.00%, Maturing March 1, 2017(3) | | | | | | | 345 | | | | 382,909 | |
CityCenter Holdings, LLC | | | | | | | | | | | | |
Term Loan, 4.25%, Maturing October 16, 2020 | | | | | | | 511 | | | | 515,119 | |
| | | | |
| | 12 | | See Notes to Financial Statements. |
Eaton Vance
Short Duration Diversified Income Fund
October 31, 2016
Portfolio of Investments — continued
| | | | | | | | | | | | |
| Borrower/Tranche Description | | | | | Principal Amount* (000’s omitted) | | | Value | |
| | | | | | | | | | | | |
|
Lodging and Casinos (continued) | |
ESH Hospitality, Inc. | | | | | | | | | | | | |
Term Loan, 3.75%, Maturing August 30, 2023 | | | | | | | 250 | | | $ | 251,875 | |
Four Seasons Holdings, Inc. | | | | | | | | | | | | |
Term Loan, 5.25%, Maturing June 27, 2020 | | | | | | | 96 | | | | 96,846 | |
Term Loan - Second Lien, 6.25%, Maturing December 27, 2020 | | | | | | | 500 | | | | 504,062 | |
Golden Nugget, Inc. | | | | | | | | | | | | |
Term Loan, 4.50%, Maturing November 21, 2019 | | | | | | | 103 | | | | 103,942 | |
Term Loan, 4.50%, Maturing November 21, 2019 | | | | | | | 240 | | | | 242,532 | |
Hilton Worldwide Finance, LLC | | | | | | | | | | | | |
Term Loan, 3.50%, Maturing October 26, 2020 | | | | | | | 78 | | | | 77,952 | |
Term Loan, 3.03%, Maturing October 25, 2023 | | | | | | | 792 | | | | 797,662 | |
La Quinta Intermediate Holdings, LLC | | | | | | | | | | | | |
Term Loan, 3.75%, Maturing April 14, 2021 | | | | | | | 562 | | | | 561,348 | |
MGM Growth Properties Operating Partnership L.P. | | | | | | | | | | | | |
Term Loan, 4.00%, Maturing April 25, 2023 | | | | | | | 373 | | | | 374,816 | |
Playa Resorts Holding B.V. | | | | | | | | | | | | |
Term Loan, 4.00%, Maturing August 9, 2019 | | | | | | | 97 | | | | 97,000 | |
RHP Hotel Properties L.P. | | | | | | | | | | | | |
Term Loan, 3.59%, Maturing January 15, 2021 | | | | | | | 122 | | | | 123,161 | |
Scientific Games International, Inc. | | | | | | | | | | | | |
Term Loan, 6.00%, Maturing October 18, 2020 | | | | | | | 613 | | | | 617,273 | |
| | | | | | | | | | | | | |
| | | | | | | | | | $ | 6,106,139 | |
| | | | | | | | | | | | | |
|
Nonferrous Metals / Minerals — 0.7% | |
Arch Coal, Inc. | | | | | | | | | | | | |
Term Loan, 10.00%, Maturing June 15, 2021 | | | | | | | 96 | | | $ | 98,062 | |
Dynacast International, LLC | | | | | | | | | | | | |
Term Loan, 4.50%, Maturing January 28, 2022 | | | | | | | 148 | | | | 148,924 | |
Fairmount Santrol, Inc. | | | | | | | | | | | | |
Term Loan, 4.50%, Maturing September 5, 2019 | | | | | | | 364 | | | | 346,813 | |
Global Brass & Copper, Inc. | | | | | | | | | | | | |
Term Loan, 5.25%, Maturing July 18, 2023 | | | | | | | 150 | | | | 151,781 | |
Murray Energy Corporation | | | | | | | | | | | | |
Term Loan, 9.25%, Maturing April 16, 2017 | | | | | | | 49 | | | | 49,290 | |
Term Loan, 8.25%, Maturing April 16, 2020 | | | | | | | 360 | | | | 334,298 | |
Noranda Aluminum Acquisition Corporation | | | | | | | | | | | | |
Term Loan, 0.00%, Maturing February 28, 2019(3)(4) | | | | | | | 91 | | | | 37,663 | |
Novelis, Inc. | | | | | | | | | | | | |
Term Loan, 4.00%, Maturing June 2, 2022 | | | | | | | 494 | | | | 495,848 | |
Oxbow Carbon, LLC | | | | | | | | | | | | |
Term Loan, 4.25%, Maturing July 19, 2019 | | | | | | | 19 | | | | 19,070 | |
Term Loan - Second Lien, 8.00%, Maturing January 17, 2020 | | | | | | | 150 | | | | 147,000 | |
| | | | | | | | | | | | | |
| | | | | | | | | | $ | 1,828,749 | |
| | | | | | | | | | | | | |
| | | | | | | | | | | | |
| Borrower/Tranche Description | | | | | Principal Amount* (000’s omitted) | | | Value | |
| | | | | | | | | | | | |
|
Oil and Gas — 1.3% | |
Ameriforge Group, Inc. | | | | | | | | | | | | |
Term Loan, 5.00%, Maturing December 19, 2019 | | | | | | | 317 | | | $ | 166,441 | |
Bronco Midstream Funding, LLC | | | | | | | | | | | | |
Term Loan, 5.00%, Maturing August 15, 2020 | | | | | | | 260 | | | | 242,739 | |
CITGO Holding, Inc. | | | | | | | | | | | | |
Term Loan, 9.50%, Maturing May 12, 2018 | | | | | | | 152 | | | | 153,450 | |
CITGO Petroleum Corporation | | | | | | | | | | | | |
Term Loan, 4.50%, Maturing July 29, 2021 | | | | | | | 196 | | | | 195,020 | |
Crestwood Holdings, LLC | | | | | | | | | | | | |
Term Loan, 9.00%, Maturing June 19, 2019 | | | | | | | 163 | | | | 152,878 | |
Drillships Ocean Ventures, Inc. | | | | | | | | | | | | |
Term Loan, 5.50%, Maturing July 25, 2021 | | | | | | | 45 | | | | 32,232 | |
Fieldwood Energy, LLC | | | | | | | | | | | | |
Term Loan, 3.88%, Maturing October 1, 2018 | | | | | | | 196 | | | | 180,464 | |
MEG Energy Corp. | | | | | | | | | | | | |
Term Loan, 3.75%, Maturing March 31, 2020 | | | | | | | 1,017 | | | | 962,305 | |
Paragon Offshore Finance Company | | | | | | | | | | | | |
Term Loan, 5.25%, Maturing July 18, 2021 | | | | | | | 148 | | | | 49,622 | |
Samson Investment Company | | | | | | | | | | | | |
Term Loan - Second Lien, 0.00%, Maturing September 25, 2018(3) | | | | | | | 175 | | | | 42,437 | |
Seadrill Partners Finco, LLC | | | | | | | | | | | | |
Term Loan, 4.00%, Maturing February 21, 2021 | | | | | | | 554 | | | | 314,489 | |
Sheridan Investment Partners II L.P. | | | | | | | | | | | | |
Term Loan, 4.34%, Maturing December 16, 2020 | | | | | | | 28 | | | | 20,455 | |
Term Loan, 4.34%, Maturing December 16, 2020 | | | | | | | 74 | | | | 54,847 | |
Term Loan, 4.34%, Maturing December 16, 2020 | | | | | | | 533 | | | | 394,279 | |
Sheridan Production Partners I, LLC | | | | | | | | | | | | |
Term Loan, 4.25%, Maturing October 1, 2019 | | | | | | | 30 | | | | 23,572 | |
Term Loan, 4.25%, Maturing October 1, 2019 | | | | | | | 50 | | | | 38,591 | |
Term Loan, 4.25%, Maturing October 1, 2019 | | | | | | | 376 | | | | 291,237 | |
Tervita Corporation | | | | | | | | | | | | |
Term Loan, 7.50%, Maturing May 15, 2018 | | | | | | | 106 | | | | 105,259 | |
| | | | | | | | | | | | | |
| | | | | | | | | | $ | 3,420,317 | |
| | | | | | | | | | | | | |
|
Publishing — 0.9% | |
Ascend Learning, LLC | | | | | | | | | | | | |
Term Loan, 5.50%, Maturing July 31, 2019 | | | | | | | 219 | | | $ | 219,747 | |
Getty Images, Inc. | | | | | | | | | | | | |
Term Loan, 4.75%, Maturing October 18, 2019 | | | | | | | 914 | | | | 775,847 | |
Laureate Education, Inc. | | | | | | | | | | | | |
Term Loan, 5.00%, Maturing June 15, 2018 | | | | | | | 486 | | | | 483,380 | |
LSC Communications, Inc. | | | | | | | | | | | | |
Term Loan, 7.00%, Maturing September 26, 2022 | | | | | | | 225 | | | | 223,875 | |
| | | | |
| | 13 | | See Notes to Financial Statements. |
Eaton Vance
Short Duration Diversified Income Fund
October 31, 2016
Portfolio of Investments — continued
| | | | | | | | | | | | |
| Borrower/Tranche Description | | | | | Principal Amount* (000’s omitted) | | | Value | |
| | | | | | | | | | | | |
|
Publishing (continued) | |
Merrill Communications, LLC | | | | | | | | | | | | |
Term Loan, 6.25%, Maturing June 1, 2022 | | | | | | | 123 | | | $ | 117,179 | |
ProQuest, LLC | | | | | | | | | | | | |
Term Loan, 5.75%, Maturing October 24, 2021 | | | | | | | 322 | | | | 322,699 | |
Springer Science+Business Media Deutschland GmbH | | | | | | | | | | | | |
Term Loan, 4.75%, Maturing August 14, 2020 | | | | | | | 243 | | | | 237,021 | |
| | | | | | | | | | | | | |
| | | | | | | | | | $ | 2,379,748 | |
| | | | | | | | | | | | | |
|
Radio and Television — 1.2% | |
AP NMT Acquisition B.V. | | | | | | | | | | | | |
Term Loan, 6.75%, Maturing August 13, 2021 | | | | | | | 98 | | | $ | 88,874 | |
CBS Radio, Inc. | | | | | | | | | | | | |
Term Loan, 4.50%, Maturing October 17, 2023 | | | | | | | 250 | | | | 251,680 | |
Cumulus Media Holdings, Inc. | | | | | | | | | | | | |
Term Loan, 4.25%, Maturing December 23, 2020 | | | | | | | 729 | | | | 506,407 | |
Entercom Radio, LLC | | | | | | | | | | | | |
Term Loan, Maturing October 25,
2023(2) | | | | | | | 175 | | | | 176,312 | |
Hubbard Radio, LLC | | | | | | | | | | | | |
Term Loan, 4.25%, Maturing May 27, 2022 | | | | | | | 106 | | | | 104,789 | |
iHeartCommunications, Inc. | | | | | | | | | | | | |
Term Loan, 8.03%, Maturing July 30, 2019 | | | | | | | 450 | | | | 344,531 | |
Lions Gate Entertainment Corp. | | | | | | | | | | | | |
Term Loan, Maturing October 12,
2023(2) | | | | | | | 150 | | | | 150,438 | |
MGOC, Inc. | | | | | | | | | | | | |
Term Loan, 4.00%, Maturing July 31, 2020 | | | | | | | 239 | | | | 239,574 | |
Mission Broadcasting, Inc. | | | | | | | | | | | | |
Term Loan, 3.75%, Maturing October 1, 2020 | | | | | | | 125 | | | | 125,377 | |
Nexstar Broadcasting, Inc. | | | | | | | | | | | | |
Term Loan, 3.75%, Maturing October 1, 2020 | | | | | | | 142 | | | | 142,179 | |
Univision Communications, Inc. | | | | | | | | | | | | |
Term Loan, 4.00%, Maturing March 1, 2020 | | | | | | | 1,123 | | | | 1,125,657 | |
| | | | | | | | | | | | | |
| | | | | | | | | | $ | 3,255,818 | |
| | | | | | | | | | | | | |
|
Retailers (Except Food and Drug) — 2.1% | |
Bass Pro Group, LLC | | | | | | | | | | | | |
Term Loan, 4.00%, Maturing June 5, 2020 | | | | | | | 436 | | | $ | 437,146 | |
CDW, LLC | | | | | | | | | | | | |
Term Loan, 3.00%, Maturing August 4, 2023 | | | | | | | 362 | | | | 363,524 | |
Coinamatic Canada, Inc. | | | | | | | | | | | | |
Term Loan, 4.25%, Maturing May 14, 2022 | | | | | | | 37 | | | | 37,014 | |
David’s Bridal, Inc. | | | | | | | | | | | | |
Term Loan, 5.00%, Maturing October 11, 2019 | | | | | | | 368 | | | | 343,879 | |
| | | | | | | | | | | | |
| Borrower/Tranche Description | | | | | Principal Amount* (000’s omitted) | | | Value | |
| | | | | | | | | | | | |
|
Retailers (Except Food and Drug) (continued) | |
Dollar Tree, Inc. | | | | | | | | | | | | |
Term Loan, 3.00%, Maturing July 6, 2022 | | | | | | | 127 | | | $ | 128,588 | |
Evergreen Acqco 1 L.P. | | | | | | | | | | | | |
Term Loan, 5.00%, Maturing July 9, 2019 | | | | | | | 368 | | | | 341,099 | |
Harbor Freight Tools USA, Inc. | | | | | | | | | | | | |
Term Loan, 4.14%, Maturing August 19, 2023 | | | | | | | 474 | | | | 477,451 | |
J. Crew Group, Inc. | | | | | | | | | | | | |
Term Loan, 4.00%, Maturing March 5, 2021 | | | | | | | 537 | | | | 414,014 | |
Men’s Wearhouse, Inc. (The) | | | | | | | | | | | | |
Term Loan, 4.50%, Maturing June 18, 2021 | | | | | | | 147 | | | | 145,677 | |
Michaels Stores, Inc. | | | | | | | | | | | | |
Term Loan, 3.75%, Maturing January 27, 2023 | | | | | | | 962 | | | | 970,384 | |
Neiman Marcus Group, Inc. (The) | | | | | | | | | | | | |
Term Loan, 4.25%, Maturing October 25, 2020 | | | | | | | 553 | | | | 510,070 | |
Party City Holdings, Inc. | | | | | | | | | | | | |
Term Loan, 4.20%, Maturing August 19, 2022 | | | | | | | 458 | | | | 459,663 | |
PetSmart, Inc. | | | | | | | | | | | | |
Term Loan, 4.00%, Maturing March 11, 2022 | | | | | | | 911 | | | | 913,972 | |
Pier 1 Imports (U.S.), Inc. | | | | | | | | | | | | |
Term Loan, 4.50%, Maturing April 30, 2021 | | | | | | | 98 | | | | 86,998 | |
Vivid Seats, Ltd. | | | | | | | | | | | | |
Term Loan, 6.75%, Maturing October 7, 2022 | | | | | | | 150 | | | | 148,313 | |
| | | | | | | | | | | | | |
| | | | | | | | | | $ | 5,777,792 | |
| | | | | | | | | | | | | |
|
Steel — 0.4% | |
FMG Resources (August 2006) Pty. Ltd. | | | | | | | | | | | | |
Term Loan, 3.75%, Maturing June 30, 2019 | | | | | | | 856 | | | $ | 856,305 | |
Neenah Foundry Company | | | | | | | | | | | | |
Term Loan, 6.75%, Maturing April 26, 2017 | | | | | | | 76 | | | | 75,332 | |
Zekelman Industries, Inc. | | | | | | | | | | | | |
Term Loan, 6.00%, Maturing June 14, 2021 | | | | | | | 128 | | | | 129,506 | |
| | | | | | | | | | | | | |
| | | | | | | | | | $ | 1,061,143 | |
| | | | | | | | | | | | | |
|
Surface Transport — 0.2% | |
Hertz Corporation (The) | | | | | | | | | | | | |
Term Loan, 3.50%, Maturing June 30, 2023 | | | | | | | 200 | | | $ | 201,014 | |
Kenan Advantage Group, Inc. | | | | | | | | | | | | |
Term Loan, 1.50%, Maturing January 31, 2017(5) | | | | | | | 5 | | | | 5,032 | |
Term Loan, 4.00%, Maturing July 31, 2022 | | | | | | | 22 | | | | 22,049 | |
Term Loan, 4.00%, Maturing July 31, 2022 | | | | | | | 72 | | | | 71,801 | |
Stena International S.a.r.l. | | | | | | | | | | | | |
Term Loan, 4.24%, Maturing March 3, 2021 | | | | | | | 268 | | | | 229,917 | |
| | | | | | | | | | | | | |
| | | | | | | | | | $ | 529,813 | |
| | | | | | | | | | | | | |
| | | | |
| | 14 | | See Notes to Financial Statements. |
Eaton Vance
Short Duration Diversified Income Fund
October 31, 2016
Portfolio of Investments — continued
| | | | | | | | | | | | |
| Borrower/Tranche Description | | | | | Principal Amount* (000’s omitted) | | | Value | |
| | | | | | | | | | | | |
|
Telecommunications — 1.0% | |
Intelsat Jackson Holdings S.A. | | | | | | | | | | | | |
Term Loan, 3.75%, Maturing June 30, 2019 | | | | | | | 650 | | | $ | 622,781 | |
IPC Corp. | | | | | | | | | | | | |
Term Loan, 5.50%, Maturing August 6, 2021 | | | | | | | 345 | | | | 328,375 | |
Mitel US Holdings, Inc. | | | | | | | | | | | | |
Term Loan, 5.50%, Maturing April 29, 2022 | | | | | | | 134 | | | | 135,642 | |
SBA Senior Finance II, LLC | | | | | | | | | | | | |
Term Loan, 3.34%, Maturing March 24, 2021 | | | | | | | 342 | | | | 342,862 | |
Syniverse Holdings, Inc. | | | | | | | | | | | | |
Term Loan, 4.00%, Maturing April 23, 2019 | | | | | | | 237 | | | | 217,711 | |
Term Loan, 4.00%, Maturing April 23, 2019 | | | | | | | 328 | | | | 301,748 | |
Telesat Canada | | | | | | | | | | | | |
Term Loan, 3.50%, Maturing March 28, 2019 | | | | | | | 646 | | | | 647,904 | |
Windstream Corporation | | | | | | | | | | | | |
Term Loan, 3.50%, Maturing August 8, 2019 | | | | | | | 120 | | | | 119,930 | |
| | | | | | | | | | | | | |
| | | | | | | | | | $ | 2,716,953 | |
| | | | | | | | | | | | | |
|
Utilities — 1.4% | |
Calpine Construction Finance Company L.P. | | | | | | | | | | | | |
Term Loan, 3.09%, Maturing May 3, 2020 | | | | | | | 194 | | | $ | 192,714 | |
Term Loan, 3.34%, Maturing January 31, 2022 | | | | | | | 73 | | | | 72,188 | |
Calpine Corporation | | | | | | | | | | | | |
Term Loan, 3.59%, Maturing May 27, 2022 | | | | | | | 890 | | | | 893,369 | |
Dynegy Holdings, Inc. | | | | | | | | | | | | |
Term Loan, 4.00%, Maturing April 23, 2020 | | | | | | | 1,158 | | | | 1,160,534 | |
Energy Future Intermediate Holding Co., LLC | | | | | | | | | | | | |
DIP Loan, 4.25%, Maturing June 30, 2017 | | | | | | | 300 | | | | 301,937 | |
Granite Acquisition, Inc. | | | | | | | | | | | | |
Term Loan, 5.00%, Maturing December 19, 2021 | | | | | | | 21 | | | | 20,925 | |
Term Loan, 5.00%, Maturing December 19, 2021 | | | | | | | 471 | | | | 467,252 | |
Invenergy Thermal Operating I, LLC | | | | | | | | | | | | |
Term Loan, 6.50%, Maturing October 19, 2022 | | | | | | | 219 | | | | 210,234 | |
Lonestar Generation, LLC | | | | | | | | | | | | |
Term Loan, 5.47%, Maturing February 22, 2021 | | | | | | | 98 | | | | 85,743 | |
TPF II Power, LLC | | | | | | | | | | | | |
Term Loan, 5.00%, Maturing October 2, 2021 | | | | | | | 256 | | | | 259,895 | |
| | | | | | | | | | | | | |
| | | | | | | | | | $ | 3,664,791 | |
| | | | | | | | | | | | | |
| |
Total Senior Floating-Rate Loans
(identified cost $144,559,903) | | | $ | 142,812,425 | |
| | | | | | | | | | | | | |
| | | | | | | | | | | | |
| Collateralized Mortgage Obligations — 26.4% | |
| | | |
| | | | | | | | | | | | |
| Security | | | | | Principal Amount (000’s omitted) | | | Value | |
| | | | | | | | | | | | |
Federal Home Loan Mortgage Corp.: | |
Series 2113, Class QG, 6.00%, 1/15/29 | | | | | | $ | 887 | | | $ | 1,006,130 | |
Series 2167, Class BZ, 7.00%, 6/15/29 | | | | | | | 664 | | | | 767,860 | |
Series 2182, Class ZB, 8.00%, 9/15/29 | | | | | | | 1,218 | | | | 1,457,184 | |
Series 2631, (Interest Only), Class DS, 6.565%, 6/15/33(6)(7) | | | | | | | 1,679 | | | | 305,456 | |
Series 2770, (Interest Only), Class SH, 6.565%, 3/15/34(6)(7) | | | | | | | 2,133 | | | | 472,331 | |
Series 2981, (Interest Only), Class CS, 6.185%, 5/15/35(6)(7) | | | | | | | 1,187 | | | | 231,291 | |
Series 3114, (Interest Only), Class TS, 6.115%, 9/15/30(6)(7) | | | | | | | 3,092 | | | | 505,437 | |
Series 3309, (Principal Only), Class DO, 0.00%, 4/15/37(8) | | | | | | | 2,010 | | | | 1,782,657 | |
Series 3339, (Interest Only), Class JI, 6.055%, 7/15/37(6)(7) | | | | | | | 2,417 | | | | 517,729 | |
Series 4109, (Interest Only), Class ES, 5.615%, 12/15/41(6)(7) | | | | | | | 36 | | | | 7,784 | |
Series 4163, (Interest Only), Class GS, 5.665%, 11/15/32(6)(7) | | | | | | | 5,247 | | | | 1,193,367 | |
Series 4169, (Interest Only), Class AS, 5.715%, 2/15/33(6)(7) | | | | | | | 3,188 | | | | 617,625 | |
Series 4180, (Interest Only), Class GI, 3.50%, 8/15/26(7) | | | | | | | 2,981 | | | | 282,985 | |
Series 4203, (Interest Only), Class QS, 5.715%, 5/15/43(6)(7) | | | | | | | 3,280 | | | | 572,403 | |
Series 4212, (Interest Only), Class SA, 5.665%, 7/15/38(6)(7) | | | | | | | 6,115 | | | | 777,536 | |
Series 4273, Class PU, 4.00%, 11/15/43 | | | | | | | 766 | | | | 794,530 | |
Series 4316, (Interest Only), Class JS, 5.565%, 1/15/44(6)(7) | | | | | | | 2,278 | | | | 296,071 | |
Series 4326, Class TS, 12.073%, 4/15/44(6) | | | | | | | 182 | | | | 183,710 | |
Series 4332, (Interest Only), Class KI, 4.00%, 9/15/43(7) | | | | | | | 1,788 | | | | 185,774 | |
Series 4336, Class GU, 3.50%, 2/15/53 | | | | | | | 1,100 | | | | 1,113,544 | |
Series 4337, Class YT, 3.50%, 4/15/49 | | | | | | | 2,649 | | | | 2,698,444 | |
Series 4370, (Interest Only), Class IO, 3.50%, 9/15/41(7) | | | | | | | 2,170 | | | | 192,333 | |
Series 4416, Class SU, 7.546%, 12/15/44(6) | | | | | | | 3,078 | | | | 3,192,878 | |
Series 4452, Class ZJ, 3.00%, 11/15/44 | | | | | | | 1,319 | | | | 1,282,465 | |
Series 4478, (Principal Only), Class PO, 0.00%, 5/15/45(8) | | | | | | | 1,558 | | | | 1,427,079 | |
Series 4497, (Interest Only), Class CS, 5.665%, 9/15/44(6)(7) | | | | | | | 4,616 | | | | 717,541 | |
Series 4507, (Interest Only), Class EI, 4.00%, 8/15/44(7) | | | | | | | 4,479 | | | | 812,026 | |
Series 4535, (Interest Only), Class JS, 5.565%, 11/15/43(6)(7) | | | | | | | 6,342 | | | | 732,256 | |
| | | | |
| | 15 | | See Notes to Financial Statements. |
Eaton Vance
Short Duration Diversified Income Fund
October 31, 2016
Portfolio of Investments — continued
| | | | | | | | | | | | |
| Security | | | | | Principal Amount (000’s omitted) | | | Value | |
| | | | | | | | | | | | |
Federal Home Loan Mortgage Corp.: (continued) | |
Series 4548, (Interest Only), Class JS, 5.565%, 9/15/43(6)(7) | | | | | | $ | 5,760 | | | $ | 694,953 | |
Series 4550, Class ZT, 2.00%, 1/15/45 | | | | | | | 351 | | | | 350,922 | |
Series 4584, Class PM, 3.00%, 5/15/46 | | | | | | | 2,093 | | | | 2,153,977 | |
Series 4630, Class CZ, 3.00%, 12/15/43(9) | | | | | | | 2,000 | | | | 1,990,972 | |
| | | | | | | | | | | | | |
| | | | | | | | | | $ | 29,317,250 | |
| | | | | | | | | | | | | |
Federal Home Loan Mortgage Corp. Structured Agency Credit Risk Debt Notes: | |
Series 2015-DNA3, Class M3, 5.234%, 4/25/28(10) | | | | | | $ | 2,000 | | | $ | 2,113,447 | |
Series 2016-DNA1, Class M3, 6.084%, 7/25/28(10) | | | | | | | 2,000 | | | | 2,169,124 | |
| | | | | | | | | | | | | |
| | | | | | | | | | $ | 4,282,571 | |
| | | | | | | | | | | | | |
Federal National Mortgage Association: | |
Series 1989-89, Class H, 9.00%, 11/25/19 | | | | | | $ | 17 | | | $ | 18,208 | |
Series 1991-122, Class N, 7.50%, 9/25/21 | | | | | | | 130 | | | | 141,909 | |
Series 1994-42, Class K, 6.50%, 4/25/24 | | | | | | | 323 | | | | 356,388 | |
Series 1997-38, Class N, 8.00%, 5/20/27 | | | | | | | 371 | | | | 429,239 | |
Series 2004-46, (Interest Only), Class SI, 5.466%, 5/25/34(6)(7) | | | | | | | 2,139 | | | | 320,397 | |
Series 2005-17, (Interest Only), Class SA, 6.166%, 3/25/35(6)(7) | | | | | | | 1,645 | | | | 378,194 | |
Series 2006-42, (Interest Only), Class PI, 6.056%, 6/25/36(6)(7) | | | | | | | 2,745 | | | | 557,407 | |
Series 2006-44, (Interest Only), Class IS, 6.066%, 6/25/36(6)(7) | | | | | | | 2,229 | | | | 450,891 | |
Series 2006-72, (Interest Only), Class GI, 6.046%, 8/25/36(6)(7) | | | | | | | 4,049 | | | | 810,560 | |
Series 2006-8, (Principal Only), Class WQ, 0.00%, 3/25/36(8) | | | | | | | 1,403 | | | | 1,249,032 | |
Series 2007-50, (Interest Only), Class LS, 5.916%, 6/25/37(6)(7) | | | | | | | 1,586 | | | | 303,471 | |
Series 2007-74, Class AC, 5.00%, 8/25/37 | | | | | | | 2,089 | | | | 2,280,659 | |
Series 2008-26, (Interest Only), Class SA, 5.666%, 4/25/38(6)(7) | | | | | | | 2,784 | | | | 531,879 | |
Series 2008-29, (Interest Only), Class CI, 5.00%, 9/25/35(7) | | | | | | | 755 | | | | 16,724 | |
Series 2008-61, (Interest Only), Class S, 5.566%, 7/25/38(6)(7) | | | | | | | 3,775 | | | | 731,590 | |
Series 2010-99, (Interest Only), Class NS, 6.066%, 3/25/39(6)(7) | | | | | | | 2,412 | | | | 144,776 | |
Series 2010-109, (Interest Only), Class PS, 6.066%, 10/25/40(6)(7) | | | | | | | 4,330 | | | | 828,897 | |
Series 2010-119, (Interest Only), Class SK, 5.466%, 4/25/40(6)(7) | | | | | | | 491 | | | | 9,740 | |
Series 2010-124, (Interest Only), Class SJ, 5.516%, 11/25/38(6)(7) | | | | | | | 2,512 | | | | 221,690 | |
Series 2010-147, (Interest Only), Class KS, 5.416%, 1/25/41(6)(7) | | | | | | | 5,559 | | | | 945,267 | |
| | | | | | | | | | | | |
| Security | | | | | Principal Amount (000’s omitted) | | | Value | |
| | | | | | | | | | | | |
Federal National Mortgage Association: (continued) | |
Series 2010-150, (Interest Only), Class GS, 6.216%, 1/25/21(6)(7) | | | | | | $ | 2,845 | | | $ | 253,250 | |
Series 2010-151, (Interest Only), Class PI, 4.00%, 5/25/28(7) | | | | | | | 1,765 | | | | 13,977 | |
Series 2011-22, (Interest Only), Class IC, 3.50%, 12/25/25(7) | | | | | | | 4,609 | | | | 399,344 | |
Series 2011-49, Class NT, 6.00%, 6/25/41(6) | | | | | | | 704 | | | | 783,669 | |
Series 2012-52, (Interest Only), Class AI, 3.50%, 8/25/26(7) | | | | | | | 5,244 | | | | 401,732 | |
Series 2012-56, (Interest Only), Class SU, 6.216%, 8/25/26(6)(7) | | | | | | | 1,564 | | | | 122,188 | |
Series 2012-63, (Interest Only), Class EI, 3.50%, 8/25/40(7) | | | | | | | 4,845 | | | | 297,844 | |
Series 2012-103, (Interest Only), Class GS, 5.566%, 2/25/40(6)(7) | | | | | | | 5,751 | | | | 606,738 | |
Series 2012-134, Class ZT, 2.00%, 12/25/42 | | | | | | | 1,890 | | | | 1,720,993 | |
Series 2012-150, (Interest Only), Class PS, 5.616%, 1/25/43(6)(7) | | | | | | | 6,526 | | | | 1,259,484 | |
Series 2012-150, (Interest Only), Class SK, 5.616%, 1/25/43(6)(7) | | | | | | | 3,636 | | | | 727,447 | |
Series 2013-23, (Interest Only), Class CS, 5.716%, 3/25/33(6)(7) | | | | | | | 3,122 | | | | 629,357 | |
Series 2013-52, Class MD, 1.25%, 6/25/43 | | | | | | | 2,456 | | | | 2,369,941 | |
Series 2013-54, (Interest Only), Class HS, 5.766%, 10/25/41(6)(7) | | | | | | | 2,915 | | | | 383,759 | |
Series 2013-6, Class TA, 1.50%, 1/25/43 | | | | | | | 1,976 | | | | 1,939,223 | |
Series 2014-32, (Interest Only), Class EI, 4.00%, 6/25/44(7) | | | | | | | 1,399 | | | | 197,956 | |
Series 2014-36, (Interest Only), Class ID, 4.00%, 6/25/44(7) | | | | | | | 1,154 | | | | 140,346 | |
Series 2014-55, (Interest Only), Class IN, 3.50%, 7/25/44(7) | | | | | | | 3,964 | | | | 543,909 | |
Series 2014-72, Class CS, 8.087%, 11/25/44(6) | | | | | | | 28 | | | | 28,611 | |
Series 2014-80, (Interest Only), Class BI, 3.00%, 12/25/44(7) | | | | | | | 6,810 | | | | 813,957 | |
Series 2014-89, (Interest Only), Class IO, 3.50%, 1/25/45(7) | | | | | | | 3,113 | | | | 457,049 | |
Series 2015-14, (Interest Only), Class KI, 3.00%, 3/25/45(7) | | | | | | | 6,932 | | | | 811,690 | |
Series 2015-17, (Interest Only), Class SA, 5.666%, 11/25/43(6)(7) | | | | | | | 5,686 | | | | 689,041 | |
Series 2015-52, (Interest Only), Class MI, 3.50%, 7/25/45(7) | | | | | | | 3,801 | | | | 518,148 | |
Series 2015-57, (Interest Only), Class IO, 3.00%, 8/25/45(7) | | | | | | | 16,486 | | | | 1,935,416 | |
Series 2015-74, Class SL, 2.036%, 10/25/45(6) | | | | | | | 1,732 | | | | 1,661,948 | |
Series 2015-89, Class ZB, 3.00%, 5/25/54 | | | | | | | 1,419 | | | | 1,406,927 | |
Series 2015-93, (Interest Only), Class BS, 5.616%, 8/25/45(6)(7) | | | | | | | 5,503 | | | | 852,301 | |
| | | | |
| | 16 | | See Notes to Financial Statements. |
Eaton Vance
Short Duration Diversified Income Fund
October 31, 2016
Portfolio of Investments — continued
| | | | | | | | | | | | |
| Security | | | | | Principal Amount (000’s omitted) | | | Value | |
| | | | | | | | | | | | |
Federal National Mortgage Association: (continued) | |
Series 2015-95, (Interest Only), Class SB, 5.466%, 1/25/46(6)(7) | | | | | | $ | 4,443 | | | $ | 970,970 | |
Series G-33, Class PT, 7.00%, 10/25/21 | | | | | | | 107 | | | | 114,414 | |
| | | | | | | | | | | | | |
| | | | | | | | | | $ | 33,778,547 | |
| | | | | | | | | | | | | |
Government National Mortgage Association: | |
Series 2011-156, Class GA, 2.00%, 12/16/41 | | | | | | $ | 744 | | | $ | 705,664 | |
Series 2013-131, Class GS, 2.973%, 6/20/43(6) | | | | | | | 1,604 | | | | 1,466,817 | |
Series 2014-146, Class S, 5.362%, 10/20/44(6) | | | | | | | 1 | | | | 585 | |
Series 2015-79, Class CS, 5.099%, 5/20/45(6) | | | | | | | 240 | | | | 241,322 | |
Series 2016-75, Class WZ, 2.25%, 11/16/43 | | | | | | | 1,238 | | | | 1,236,993 | |
| | | | | | | | | | | | | |
| | | | | | | | | | $ | 3,651,381 | |
| | | | | | | | | | | | | |
| |
Total Collateralized Mortgage Obligations
(identified cost $73,500,165) | | | $ | 71,029,749 | |
| | | | | | | | | | | | | |
|
| Commercial Mortgage-Backed Securities — 7.4% | |
| | | |
| | | | | | | | | | | | |
| Security | | | | | Principal Amount (000’s omitted) | | | Value | |
Citigroup Commercial Mortgage Trust | |
Series 2015-P1, Class D, 3.225%, 9/15/48(11)(12) | | | | | | $ | 4,000 | | | $ | 3,126,864 | |
COMM Mortgage Trust | |
Series 2014-LC17, Class D, 3.687%, 10/10/47(11) | | | | | | | 1,065 | | | | 833,297 | |
JPMBB Commercial Mortgage Securities Trust | |
Series 2014-C19, Class D, 4.668%, 4/15/47(11)(12) | | | | | | | 1,425 | | | | 1,229,565 | |
Series 2014-C21, Class D, 4.661%, 8/15/47(11)(12) | | | | | | | 650 | | | | 546,740 | |
Series 2014-C22, Class D, 4.56%, 9/15/47(11)(12) | | | | | | | 1,850 | | | | 1,502,921 | |
Series 2014-C23, Class D, 3.959%, 9/15/47(11)(12) | | | | | | | 850 | | | | 699,633 | |
JPMorgan Chase Commercial Mortgage Securities Trust | |
Series 2011-C5, Class D, 5.394%, 8/15/46(11)(12) | | | | | | | 1,850 | | | | 1,904,605 | |
Morgan Stanley Bank of America Merrill Lynch Trust | |
Series 2015-C23, Class D, 4.135%, 7/15/50(11)(12) | | | | | | | 1,500 | | | | 1,211,166 | |
UBS-Citigroup Commercial Mortgage Trust | |
Series 2011-C1, Class D, 6.064%, 1/10/45(11)(12) | | | | | | | 2,000 | | | | 2,204,362 | |
UBS Commercial Mortgage Trust | |
Series 2012-C1, Class D, 5.546%, 5/10/45(11)(12) | | | | | | | 2,000 | | | | 2,044,565 | |
Wells Fargo Commercial Mortgage Trust | |
Series 2010-C1, Class C, 5.612%, 11/15/43(11)(12) | | | | | | | 500 | | | | 545,337 | |
Series 2013-LC12, Class D, 4.297%, 7/15/46(11)(12) | | | | | | | 2,000 | | | | 1,816,343 | |
Series 2015-SG1, Class C, 4.471%, 12/15/47(12) | | | | | | | 1,399 | | | | 1,384,838 | |
WF-RBS Commercial Mortgage Trust | |
Series 2014-LC14, Class D, 4.586%, 3/15/47(11)(12) | | | | | | | 1,150 | | | | 942,390 | |
| | | | | | | | | | | | | |
| |
Total Commercial Mortgage-Backed Securities
(identified cost $20,395,698) | | | $ | 19,992,626 | |
| | | | | | | | | | | | | |
| | | | | | | | | | | | |
| Mortgage Pass-Throughs — 14.4% | |
| | | |
| | | | | | | | | | | | |
| Security | | | | | Principal Amount (000’s omitted) | | | Value | |
| | | | | | | | | | | | |
Federal Home Loan Mortgage Corp.: | |
2.877%, with maturity at 2035(13) | | | | | | $ | 2,233 | | | $ | 2,324,677 | |
6.00%, with various maturities to 2029 | | | | | | | 1,832 | | | | 2,078,240 | |
6.15%, with maturity at 2027 | | | | | | | 574 | | | | 653,838 | |
6.50%, with maturity at 2032 | | | | | | | 1,641 | | | | 1,890,336 | |
7.00%, with various maturities to 2036 | | | | | | | 3,054 | | | | 3,603,143 | |
7.50%, with maturity at 2024 | | | | | | | 886 | | | | 997,016 | |
8.00%, with maturity at 2034 | | | | | | | 1,271 | | | | 1,513,583 | |
8.50%, with maturity at 2031 | | | | | | | 1,057 | | | | 1,247,508 | |
9.00%, with maturity at 2031 | | | | | | | 148 | | | | 177,347 | |
9.50%, with maturity at 2022 | | | | | | | 31 | | | | 33,710 | |
| | | | | | | | | | | | | |
| | | | | | | | | | $ | 14,519,398 | |
| | | | | | | | | | | | | |
Federal National Mortgage Association: | |
2.464%, with maturity at 2037(13) | | | | | | $ | 663 | | | $ | 689,037 | |
5.00%, with various maturities to 2040 | | | | | | | 2,933 | | | | 3,272,942 | |
5.50%, with various maturities to 2033 | | | | | | | 2,028 | | | | 2,314,052 | |
6.00%, with maturity at 2023 | | | | | | | 1,151 | | | | 1,264,833 | |
6.318%, with maturity at 2032(13) | | | | | | | 898 | | | | 989,113 | |
6.50%, with various maturities to 2036 | | | | | | | 4,184 | | | | 4,806,898 | |
7.00%, with various maturities to 2037 | | | | | | | 2,016 | | | | 2,311,538 | |
7.50%, with maturity at 2035 | | | | | | | 3,144 | | | | 3,692,632 | |
8.00%, with various maturities to 2034 | | | | | | | 794 | | | | 925,289 | |
10.00%, with various maturities to 2031 | | | | | | | 175 | | | | 191,991 | |
| | | | | | | | | | | | | |
| | | | | | | | | | $ | 20,458,325 | |
| | | | | | | | | | | | | |
Government National Mortgage Association: | |
7.50%, with maturity at 2025 | | | | | | $ | 1,360 | | | $ | 1,533,501 | |
8.00%, with maturity at 2034 | | | | | | | 1,765 | | | | 2,091,831 | |
9.50%, with maturity at 2025 | | | | | | | 80 | | | | 88,970 | |
11.00%, with maturity at 2018 | | | | | | | 13 | | | | 13,890 | |
| | | | | | | | | | | | | |
| | | | | | | | | | $ | 3,728,192 | |
| | | | | | | | | | | | | |
| |
Total Mortgage Pass-Throughs
(identified cost $36,967,214) | | | $ | 38,705,915 | |
| | | | | | | | | | | | | |
|
| Asset-Backed Securities — 1.0% | |
| | | |
| | | | | | | | | | | | |
| Security | | | | | Principal Amount (000’s omitted) | | | Value | |
American Homes 4 Rent | |
Series 2014-SFR1, Class C, 2.285%, 6/17/31(10)(11) | | | | | | $ | 200 | | | $ | 199,122 | |
Series 2014-SFR1, Class D, 2.635%, 6/17/31(10)(11) | | | | | | | 825 | | | | 824,668 | |
| | | | |
| | 17 | | See Notes to Financial Statements. |
Eaton Vance
Short Duration Diversified Income Fund
October 31, 2016
Portfolio of Investments — continued
| | | | | | | | | | | | |
| Security | | | | | Principal Amount (000’s omitted) | | | Value | |
| | | | | | | | | | | | |
Colony American Homes | |
Series 2014-1A, Class C, 2.385%, 5/17/31(10)(11) | | | | | | $ | 760 | | | $ | 760,586 | |
Ford Credit Auto Owner Trust | |
Series 2014-1, Class B, 2.41%, 11/15/25(11) | | | | | | | 100 | | | | 100,968 | |
Invitation Homes Trust | |
Series 2013-SFR1, Class D, 2.674%, 12/17/30(10)(11) | | | | | | | 550 | | | | 550,395 | |
Sierra Receivables Funding Co., LLC | |
Series 2014-1A, Class B, 2.42%, 3/20/30(11) | | | | | | | 150 | | | | 149,648 | |
Series 2015-1A, Class B, 3.05%, 3/22/32(11) | | | | | | | 201 | | | | 202,956 | |
| | | | | | | | | | | | | |
| |
Total Asset-Backed Securities
(identified cost $2,777,601) | | | $ | 2,788,343 | |
| | | | | | | | | | | | | |
|
| U.S. Government Agency Obligations — 0.6% | |
| | | |
| | | | | | | | | | | | |
| Security | | | | | Principal Amount (000’s omitted) | | | Value | |
Federal Farm Credit Bank: | |
3.25%, 7/1/30 | | | | | | $ | 1,500 | | | $ | 1,604,670 | |
| | | | | | | | | | | | | |
| |
Total U.S. Government Agency Obligations
(identified cost $1,470,822) | | | $ | 1,604,670 | |
| | | | | | | | | | | | | |
|
| Corporate Bonds & Notes — 13.7% | |
| | | |
| | | | | | | | | | | | |
| Security | | | | | Principal Amount* (000’s omitted) | | | Value | |
|
Aerospace and Defense — 0.6% | |
CBC Ammo, LLC/CBC FinCo, Inc. | |
7.25%, 11/15/21(11) | | | | | | | 500 | | | $ | 488,750 | |
TransDigm, Inc. | |
6.375%, 6/15/26(11) | | | | | | | 1,000 | | | | 1,029,380 | |
| | | | | | | | | | | | | |
| | | | | | | | | | $ | 1,518,130 | |
| | | | | | | | | | | | | |
|
Automotive — 0.4% | |
Deck Chassis Acquisition, Inc. | |
10.00%, 6/15/23(11) | | | | | | | 1,000 | | | $ | 1,042,500 | |
| | | | | | | | | | | | | |
| | | | | | | | | | $ | 1,042,500 | |
| | | | | | | | | | | | | |
|
Building and Development — 0.3% | |
Reliance Intermediate Holdings, L.P. | |
6.50%, 4/1/23(11) | | | | | | | 675 | | | $ | 718,875 | |
| | | | | | | | | | | | | |
| | | | | | | | | | $ | 718,875 | |
| | | | | | | | | | | | | |
| | | | | | | | | | | | |
| Security | | | | | Principal Amount* (000’s omitted) | | | Value | |
| | | | | | | | | | | | |
|
Business Equipment and Services — 0.4% | |
ServiceMaster Co., LLC (The) | |
7.45%, 8/15/27 | | | | | | | 1,000 | | | $ | 1,065,000 | |
| | | | | | | | | | | | | |
| | | | | | | | | | $ | 1,065,000 | |
| | | | | | | | | | | | | |
|
Cable and Satellite Television — 0.7% | |
Cablevision Systems Corp. | |
8.00%, 4/15/20 | | | | | | | 1,000 | | | $ | 1,062,500 | |
Cequel Communications Holdings I, LLC/Cequel Capital Corp. | |
5.125%, 12/15/21(11) | | | | | | | 1,000 | | | | 977,500 | |
| | | | | | | | | | | | | |
| | | | | | | | | | $ | 2,040,000 | |
| | | | | | | | | | | | | |
|
Commercial Services — 0.4% | |
CEB, Inc. | |
5.625%, 6/15/23(11) | | | | | | | 1,000 | | | $ | 976,250 | |
| | | | | | | | | | | | | |
| | | | | | | | | | $ | 976,250 | |
| | | | | | | | | | | | | |
|
Containers and Glass Products — 0.4% | |
Reynolds Group Holdings, Inc. | |
7.00%, 7/15/24(11) | | | | | | | 1,000 | | | $ | 1,070,625 | |
| | | | | | | | | | | | | |
| | | | | | | | | | $ | 1,070,625 | |
| | | | | | | | | | | | | |
|
Diversified Financial Services — 0.4% | |
Double Eagle Acquisition Sub, Inc. | |
7.50%, 10/1/24(11) | | | | | | | 1,000 | | | $ | 1,032,500 | |
| | | | | | | | | | | | | |
| | | | | | | | | | $ | 1,032,500 | |
| | | | | | | | | | | | | |
|
Drugs — 0.6% | |
Mallinckrodt International Finance S.A./Mallinckrodt CB, LLC | |
5.50%, 4/15/25(11) | | | | | | | 1,000 | | | $ | 928,750 | |
Valeant Pharmaceuticals International, Inc. | |
5.875%, 5/15/23(11) | | | | | | | 910 | | | | 705,250 | |
| | | | | | | | | | | | | |
| | | | | | | | | | $ | 1,634,000 | |
| | | | | | | | | | | | | |
|
Electric Utilities — 0.3% | |
NRG Yield Operating, LLC | |
5.00%, 9/15/26(11) | | | | | | | 1,000 | | | $ | 972,500 | |
| | | | | | | | | | | | | |
| | | | | | | | | | $ | 972,500 | |
| | | | | | | | | | | | | |
|
Electronics / Electrical — 0.8% | |
Infor (US), Inc. | |
6.50%, 5/15/22 | | | | | | | 1,000 | | | $ | 1,040,000 | |
| | | | |
| | 18 | | See Notes to Financial Statements. |
Eaton Vance
Short Duration Diversified Income Fund
October 31, 2016
Portfolio of Investments — continued
| | | | | | | | | | | | |
| Security | | | | | Principal Amount* (000’s omitted) | | | Value | |
| | | | | | | | | | | | |
|
Electronics / Electrical (continued) | |
Western Digital Corp. | |
10.50%, 4/1/24(11) | | | | | | | 1,000 | | | $ | 1,158,750 | |
| | | | | | | | | | | | | |
| | | | | | | | | | $ | 2,198,750 | |
| | | | | | | | | | | | | |
|
Financial Intermediaries — 0.7% | |
First Data Corp. | |
6.75%, 11/1/20(11) | | | | | | | 163 | | | $ | 169,109 | |
7.00%, 12/1/23(11) | | | | | | | 1,000 | | | | 1,053,750 | |
Icahn Enterprises, L.P./Icahn Enterprises Finance Corp. | |
6.00%, 8/1/20 | | | | | | | 645 | | | | 632,100 | |
| | | | | | | | | | | | | |
| | | | | | | | | | $ | 1,854,959 | |
| | | | | | | | | | | | | |
|
Financial Services — 0.4% | |
Solera, LLC/Solera Finance, Inc. | |
10.50%, 3/1/24(11) | | | | | | | 1,000 | | | $ | 1,122,820 | |
| | | | | | | | | | | | | |
| | | | | | | | | | $ | 1,122,820 | |
| | | | | | | | | | | | | |
|
Food Products — 0.8% | |
Dean Foods Co. | |
6.50%, 3/15/23(11) | | | | | | | 1,000 | | | $ | 1,067,500 | |
Iceland Bondco PLC | |
4.651%, 7/15/20(10)(11) | | | GBP | | | | 250 | | | | 290,700 | |
NBTY, Inc. | |
7.625%, 5/15/21(11) | | | | | | | 730 | | | | 717,225 | |
| | | | | | | | | | | | | |
| | | | | | | | | | $ | 2,075,425 | |
| | | | | | | | | | | | | |
|
Health Care — 1.8% | |
Alere, Inc. | |
6.375%, 7/1/23(11) | | | | | | | 1,000 | | | $ | 1,047,500 | |
CHS/Community Health Systems, Inc. | |
5.125%, 8/15/18 | | | | | | | 425 | | | | 419,730 | |
HCA Holdings, Inc. | |
6.25%, 2/15/21 | | | | | | | 1,000 | | | | 1,081,250 | |
HCA, Inc. | |
4.50%, 2/15/27 | | | | | | | 10 | | | | 9,900 | |
MPH Acquisition Holdings, LLC | |
7.125%, 6/1/24(11) | | | | | | | 1,000 | | | | 1,072,400 | |
Team Health, Inc. | |
7.25%, 12/15/23(11) | | | | | | | 1,000 | | | | 1,132,500 | |
| | | | | | | | | | | | | |
| | | | | | | | | | $ | 4,763,280 | |
| | | | | | | | | | | | | |
| | | | | | | | | | | | |
| Security | | | | | Principal Amount* (000’s omitted) | | | Value | |
| | | | | | | | | | | | |
|
Insurance — 0.4% | |
USI, Inc. | |
7.75%, 1/15/21(11) | | | | | | | 1,000 | | | $ | 1,015,000 | |
| | | | | | | | | | | | | |
| | | | | | | | | | $ | 1,015,000 | |
| | | | | | | | | | | | | |
|
Internet Software & Services — 0.4% | |
Riverbed Technology, Inc. | |
8.875%, 3/1/23(11) | | | | | | | 1,010 | | | $ | 1,080,700 | |
| | | | | | | | | | | | | |
| | | | | | | | | | $ | 1,080,700 | |
| | | | | | | | | | | | | |
|
Lodging and Casinos — 0.1% | |
Caesars Entertainment Operating Co., Inc. | |
8.50%, 2/15/20(3) | | | | | | | 350 | | | $ | 361,375 | |
Hilton Domestic Operating Co., Inc. | |
4.25%, 9/1/24(11) | | | | | | | 55 | | | | 55,413 | |
| | | | | | | | | | | | | |
| | | | | | | | | | $ | 416,788 | |
| | | | | | | | | | | | | |
|
Metals / Mining — 0.4% | |
Teck Resources, Ltd. | |
8.50%, 6/1/24(11) | | | | | | | 1,000 | | | $ | 1,160,000 | |
| | | | | | | | | | | | | |
| | | | | | | | | | $ | 1,160,000 | |
| | | | | | | | | | | | | |
|
Nonferrous Metals / Minerals — 0.6% | |
Eldorado Gold Corp. | |
6.125%, 12/15/20(11) | | | | | | | 1,000 | | | $ | 1,015,000 | |
New Gold, Inc. | |
6.25%, 11/15/22(11) | | | | | | | 500 | | | | 507,500 | |
| | | | | | | | | | | | | |
| | | | | | | | | | $ | 1,522,500 | |
| | | | | | | | | | | | | |
|
Oil and Gas — 0.4% | |
Sabine Pass Liquefaction, LLC | |
5.625%, 3/1/25 | | | | | | | 1,000 | | | $ | 1,061,250 | |
| | | | | | | | | | | | | |
| | | | | | | | | | $ | 1,061,250 | |
| | | | | | | | | | | | | |
|
Packaging & Containers — 0.4% | |
Ardagh Packaging Finance PLC/Ardagh Holdings USA, Inc. | |
7.25%, 5/15/24(11) | | | | | | | 1,000 | | | $ | 1,060,000 | |
| | | | | | | | | | | | | |
| | | | | | | | | | $ | 1,060,000 | |
| | | | | | | | | | | | | |
|
Retailers (Except Food and Drug) — 0.4% | |
PetSmart, Inc. | |
7.125%, 3/15/23(11) | | | | | | | 1,000 | | | $ | 1,048,750 | |
| | | | | | | | | | | | | |
| | | | | | | | | | $ | 1,048,750 | |
| | | | | | | | | | | | | |
| | | | |
| | 19 | | See Notes to Financial Statements. |
Eaton Vance
Short Duration Diversified Income Fund
October 31, 2016
Portfolio of Investments — continued
| | | | | | | | | | | | |
| Security | | | | | Principal Amount* (000’s omitted) | | | Value | |
| | | | | | | | | | | | |
|
Software and Services — 0.3% | |
Cengage Learning, Inc. | |
9.50%, 6/15/24(11) | | | | | | | 1,000 | | | $ | 935,000 | |
| | | | | | | | | | | | | |
| | | | | | | | | | $ | 935,000 | |
| | | | | | | | | | | | | |
|
Technology — 0.4% | |
Diamond 1 Finance Corp./Diamond 2 Finance Corp. | |
7.125%, 6/15/24(11) | | | | | | | 1,000 | | | $ | 1,096,517 | |
| | | | | | | | | | | | | |
| | | | | | | | | | $ | 1,096,517 | |
| | | | | | | | | | | | | |
|
Telecommunications — 0.8% | |
Hughes Satellite Systems Corp. | |
6.625%, 8/1/26(11) | | | | | | | 1,000 | | | $ | 992,500 | |
Sprint Communications, Inc. | |
9.00%, 11/15/18(11) | | | | | | | 1,000 | | | | 1,102,500 | |
| | | | | | | | | | | | | |
| | | | | | | | | | $ | 2,095,000 | |
| | | | | | | | | | | | | |
|
Utilities — 0.1% | |
Calpine Corp. | |
7.875%, 1/15/23(11) | | | | | | | 389 | | | $ | 408,450 | |
| | | | | | | | | | | | | |
| | | | | | | | | | $ | 408,450 | |
| | | | | | | | | | | | | |
| |
Total Corporate Bonds & Notes
(identified cost $37,110,790) | | | $ | 36,985,569 | |
| | | | | | | | | | | | | |
|
| Foreign Government Bonds — 8.6% | |
| | | |
| | | | | | | | | | | | |
| Security | | | | | Principal Amount (000’s omitted) | | | Value | |
|
Bangladesh — 1.1% | |
Bangladesh Treasury Bond, 10.10%, 6/11/19 | | | BDT | | | | 23,600 | | | $ | 334,028 | |
Bangladesh Treasury Bond, 11.50%, 8/8/17 | | | BDT | | | | 107,500 | | | | 1,448,919 | |
Bangladesh Treasury Bond, 11.50%, 11/7/17 | | | BDT | | | | 15,700 | | | | 214,507 | |
Bangladesh Treasury Bond, 11.52%, 12/5/17 | | | BDT | | | | 20,000 | | | | 274,393 | |
Bangladesh Treasury Bond, 11.55%, 10/3/17 | | | BDT | | | | 29,900 | | | | 406,538 | |
Bangladesh Treasury Bond, 11.72%, 2/6/18 | | | BDT | | | | 8,400 | | | | 116,349 | |
Bangladesh Treasury Bond, 11.72%, 7/2/18 | | | BDT | | | | 19,400 | | | | 272,679 | |
| | | | | | | | | | | | | |
Total Bangladesh | | | | | | | | | | $ | 3,067,413 | |
| | | | | | | | | | | | | |
|
Czech Republic — 1.5% | |
Czech Republic Government Bond, 0.00%, 11/9/17(14) | | | CZK | | | | 67,000 | | | $ | 2,761,893 | |
Czech Republic Government Bond, 0.00%, 1/22/18(14) | | | CZK | | | | 28,660 | | | | 1,182,333 | |
| | | | | | | | | | | | | |
Total Czech Republic | | | | | | | | | | $ | 3,944,226 | |
| | | | | | | | | | | | | |
| | | | | | | | | | | | |
| Security | | | | | Principal Amount (000’s omitted) | | | Value | |
| | | | | | | | | | | | |
|
Dominican Republic — 1.9% | |
Dominican Republic, 10.40%, 5/10/19(14) | | | DOP | | | | 54,400 | | | $ | 1,193,028 | |
Dominican Republic, 13.50%, 8/4/17(14) | | | DOP | | | | 2,400 | | | | 53,290 | |
Dominican Republic, 14.00%, 6/8/18(14) | | | DOP | | | | 53,200 | | | | 1,220,851 | |
Dominican Republic, 16.00%, 2/10/17(14) | | | DOP | | | | 124,700 | | | | 2,743,387 | |
| | | | | | | | | | | | | |
Total Dominican Republic | | | | | | | | | | $ | 5,210,556 | |
| | | | | | | | | | | | | |
|
Georgia — 0.3% | |
Georgia Treasury Bond, 10.75%, 7/9/17 | | | GEL | | | | 280 | | | $ | 120,078 | |
Georgia Treasury Bond, 13.375%, 3/10/18 | | | GEL | | | | 1,690 | | | | 764,734 | |
| | | | | | | | | | | | | |
Total Georgia | | | | | | | | | | $ | 884,812 | |
| | | | | | | | | | | | | |
|
Iceland — 2.2% | |
Republic of Iceland, 6.25%, 2/5/20 | | | ISK | | | | 231,085 | | | $ | 1,292,842 | |
Republic of Iceland, 7.25%, 10/26/22 | | | ISK | | | | 427,092 | | | | 2,553,842 | |
Republic of Iceland, 8.75%, 2/26/19 | | | ISK | | | | 329,709 | | | | 1,920,465 | |
| | | | | | | | | | | | | |
Total Iceland | | | | | | | | | | $ | 5,767,149 | |
| | | | | | | | | | | | | |
|
Serbia — 1.3% | |
Serbia Treasury Bond, 10.00%, 4/1/17 | | | RSD | | | | 46,800 | | | $ | 429,631 | |
Serbia Treasury Bond, 10.00%, 5/8/17 | | | RSD | | | | 18,760 | | | | 173,292 | |
Serbia Treasury Bond, 10.00%, 1/24/18 | | | RSD | | | | 279,180 | | | | 2,675,276 | |
Serbia Treasury Bond, 10.00%, 2/5/22 | | | RSD | | | | 20,360 | | | | 218,489 | |
| | | | | | | | | | | | | |
Total Serbia | | | | | | | | | | $ | 3,496,688 | |
| | | | | | | | | | | | | |
|
Vietnam — 0.3% | |
Vietnam Government Bond, 7.20%, 1/15/17 | | | VND | | | | 16,000,000 | | | $ | 722,257 | |
| | | | | | | | | | | | | |
Total Vietnam | | | | | | | | | | $ | 722,257 | |
| | | | | | | | | | | | | |
| |
Total Foreign Government Bonds
(identified cost $24,441,215) | | | $ | 23,093,101 | |
| | | | | | | | | | | | | |
|
| Common Stocks — 0.6% | |
| | | |
| | | | | | | | | | | | |
| Security | | | | | Shares | | | Value | |
Affinity Gaming, LLC(4)(15)(16) | | | | | | | 23,498 | | | $ | 411,217 | |
Dayco Products, LLC(4)(15)(16) | | | | | | | 8,898 | | | | 249,144 | |
Education Management
Corp.(4)(15)(16) | | | | | | | 955,755 | | | | 669 | |
ION Media Networks,
Inc.(4)(15)(16) | | | | | | | 1,357 | | | | 716,822 | |
MediaNews Group, Inc.(4)(15)(16) | | | | | | | 3,023 | | | | 103,115 | |
New Millennium Holdco,
Inc.(15)(16) | | | | | | | 8,641 | | | | 19,442 | |
RCS Capital Corp.(4)(15)(16) | | | | | | | 2,777 | | | | 20,827 | |
| | | | | | | | | | | | | |
| | | |
Total Common Stocks
(identified cost $441,533) | | | | | | | | | | $ | 1,521,236 | |
| | | | | | | | | | | | | |
| | | | |
| | 20 | | See Notes to Financial Statements. |
Eaton Vance
Short Duration Diversified Income Fund
October 31, 2016
Portfolio of Investments — continued
| | | | | | | | | | | | |
| Convertible Preferred Stocks — 0.0%(17) | |
| | | |
| | | | | | | | | | | | |
| Security | | | | | Shares | | | Value | |
| | | | | | | | | | | | |
Education Management Corp., Series A-1, 7.50%(4)(15)(16) | | | | | | | 1,063 | | | $ | 298 | |
| | | | | | | | | | | | | |
| | | |
Total Convertible Preferred Stocks
(identified cost $75,023) | | | | | | | | | | $ | 298 | |
| | | | | | | | | | | | | |
| | | | | | | | | | | | | | | | | | | | |
|
| Currency Options Purchased — 0.0%(17) | |
| | | | | |
| | | | | | | | | | | | | | | | | | | | |
| Description | | Counterparty | | | Principal Amount of Contracts (000’s omitted) | | | Strike Price | | | Expiration Date | | | Value | |
| | | | | | | | | | | | | | | | | | | | |
Call MXN/
Put USD | | | Deutsche Bank AG | | | | USD 1,313 | | | | MXN 18.33 | | | | 1/11/17 | | | $ | 17,578 | |
| | | | | | | | | | | | | | | | | | | | | |
| |
Total Currency Options Purchased
(identified cost $58,665) | | | $ | 17,578 | |
| | | | | | | | | | | | | | | | | | | | | |
| | | | | | | | | | | | |
|
| Short-Term Investments — 11.5% | |
|
| Foreign Government Securities — 5.5% | |
| | | |
| | | | | | | | | | | | |
| Security | | | | | Principal Amount (000’s omitted) | | | Value | |
| | | | | | | | | | | | |
|
Georgia — 1.7% | |
Georgia Treasury Bill, 0.00%, 1/26/17 | | | GEL | | | | 549 | | | $ | 225,720 | |
Georgia Treasury Bill, 0.00%, 6/1/17 | | | GEL | | | | 108 | | | | 43,426 | |
Georgia Treasury Bill, 0.00%, 8/10/17 | | | GEL | | | | 10,500 | | | | 4,218,150 | |
| | | | | | | | | | | | | |
Total Georgia | | | | | | | | | | $ | 4,487,296 | |
| | | | | | | | | | | | | |
|
Iceland — 0.2% | |
Iceland Treasury Bill, 0.00%, 11/15/16 | | | ISK | | | | 65,718 | | | $ | 355,659 | |
Iceland Treasury Bill, 0.00%, 2/15/17 | | | ISK | | | | 12,270 | | | | 66,252 | |
Iceland Treasury Bill, 0.00%, 4/18/17 | | | ISK | | | | 37,770 | | | | 203,777 | |
| | | | | | | | | | | | | |
Total Iceland | | | | | | | | | | $ | 625,688 | |
| | | | | | | | | | | | | |
|
Kazakhstan — 1.0% | |
National Bank of Kazakhstan Note, 0.00%, 1/20/17 | | | KZT | | | | 513,881 | | | $ | 1,490,937 | |
National Bank of Kazakhstan Note, 0.00%, 2/17/17 | | | KZT | | | | 431,712 | | | | 1,241,461 | |
| | | | | | | | | | | | | |
Total Kazakhstan | | | | | | | | | | $ | 2,732,398 | |
| | | | | | | | | | | | | |
|
Sri Lanka — 2.6% | |
Sri Lanka Treasury Bill, 0.00%, 4/7/17 | | | LKR | | | | 395,400 | | | $ | 2,571,511 | |
Sri Lanka Treasury Bill, 0.00%, 4/14/17 | | | LKR | | | | 474,790 | | | | 3,081,734 | |
| | | | | | | | | | | | |
| Security | | | | | Principal Amount (000’s omitted) | | | Value | |
| | | | | | | | | | | | |
|
Sri Lanka (continued) | |
Sri Lanka Treasury Bill, 0.00%, 5/5/17 | | | LKR | | | | 193,630 | | | $ | 1,249,282 | |
| | | | | | | | | | | | | |
Total Sri Lanka | | | | | | | | | | $ | 6,902,527 | |
| | | | | | | | | | | | | |
| |
Total Foreign Government Securities
(identified cost $15,000,476) | | | $ | 14,747,909 | |
| | | | | | | | | | | | | |
|
| U.S. Treasury Obligations — 1.1% | |
| | | |
| | | | | | | | | | | | |
| Security | | | | | Principal Amount (000’s omitted) | | | Value | |
U.S. Treasury Bill, 0.00%, 11/25/16(18) | | | | | | $ | 3,000 | | | $ | 2,999,668 | |
| | | | | | | | | | | | | |
| |
Total U.S. Treasury Obligations
(identified cost $2,999,109) | | | $ | 2,999,668 | |
| | | | | | | | | | | | | |
|
| Other — 4.9% | |
| | | |
| | | | | | | | | | | | |
| Description | | | | | Units | | | Value | |
Eaton Vance Cash Reserves Fund, LLC, 0.68%(19) | | | | | | | 13,261,512 | | | $ | 13,264,165 | |
| | | | | | | | | | | | | |
| |
Total Other
(identified cost $13,262,266) | | | $ | 13,264,165 | |
| | | | | | | | | | | | | |
| |
Total Short-Term Investments
(identified cost $31,261,851) | | | $ | 31,011,742 | |
| | | | | | | | | | | | | |
| |
Total Investments — 137.3%
(identified cost $373,060,480) | | | $ | 369,563,252 | |
| | | | | | | | | | | | | |
| |
Less Unfunded Loan Commitments — (0.0)%(17) | | | $ | (5,043 | ) |
| | | | | | | | | | | | | |
| |
Net Investments — 137.3%
(identified cost $373,055,437) | | | $ | 369,558,209 | |
| | | | | | | | | | | | | |
| | | | | | | | | | | | | | | | | | | | |
|
| Currency Options Written — (0.0)%(17) | |
| | | | | |
| | | | | | | | | | | | | | | | | | | | |
| Description | | Counterparty | | | Principal Amount of Contracts (000’s omitted) | | | Strike Price | | | Expiration Date | | | Value | |
| | | | | | | | | | | | | | | | | | | | |
Call MXN/Put USD | |
| Goldman Sachs
International |
| | | USD 1,313 | | | | MXN 18.33 | | | | 1/11/17 | | | $ | (17,578 | ) |
| | | | | | | | | | | | | | | | | | | | | |
| |
Total Currency Options Written
(premiums received $58,297) | | | $ | (17,578 | ) |
| | | | | | | | | | | | | | | | | | | | | |
| |
Other Assets, Less Liabilities — (37.3)% | | | $ | (100,386,572 | ) |
| | | | | | | | | | | | | | | | | | | | | |
| |
Net Assets — 100.0% | | | $ | 269,154,059 | |
| | | | | | | | | | | | | | | | | | | | | |
| | | | |
| | 21 | | See Notes to Financial Statements. |
Eaton Vance
Short Duration Diversified Income Fund
October 31, 2016
Portfolio of Investments — continued
The percentage shown for each investment category in the Portfolio of Investments is based on net assets.
| | * | In U.S. dollars unless otherwise indicated. |
| | (1) | Senior floating-rate loans (Senior Loans) often require prepayments from excess cash flows or permit the borrowers to repay at their election. The degree to which borrowers repay, whether as a contractual requirement or at their election, cannot be predicted with accuracy. As a result, the actual remaining maturity may be substantially less than the stated maturities shown. However, Senior Loans will typically have an expected average life of approximately two to four years. The stated interest rate represents the weighted average interest rate of all contracts within the senior loan facility and includes commitment fees on unfunded loan commitments, if any. Senior Loans typically have rates of interest which are redetermined either daily, monthly, quarterly or semi-annually by reference to a base lending rate, plus a premium. These base lending rates are primarily the London Interbank Offered Rate (“LIBOR”) and secondarily, the prime rate offered by one or more major United States banks (the “Prime Rate”) and the certificate of deposit (“CD”) rate or other base lending rates used by commercial lenders. |
| | (2) | This Senior Loan will settle after October 31, 2016, at which time the interest rate will be determined. |
| | (3) | Currently the issuer is in default with respect to interest and/or principal payments or has filed for bankruptcy. For a variable rate security, interest rate has been adjusted to reflect non-accrual status. |
| | (4) | For fair value measurement disclosure purposes, security is categorized as Level 3 (see Note 9). |
| | (5) | Unfunded or partially unfunded loan commitments. See Note 1F for description. |
| | (6) | Inverse floating-rate security whose coupon varies inversely with changes in the interest rate index. The stated interest rate represents the coupon rate in effect at October 31, 2016. |
| | (7) | Interest only security that entitles the holder to receive only interest payments on the underlying mortgages. Principal amount shown is the notional amount of the underlying mortgages on which coupon interest is calculated. |
| | (8) | Principal only security that entitles the holder to receive only principal payments on the underlying mortgages. |
| | (9) | When-issued security. |
| (10) | Variable rate security. The stated interest rate represents the rate in effect at October 31, 2016. |
| (11) | Security exempt from registration pursuant to Rule 144A under the Securities Act of 1933, as amended. These securities may be sold in certain transactions in reliance on an exemption from registration (normally to qualified institutional buyers). At October 31, 2016, the aggregate value of these securities is $51,648,595 or 19.2% of the Fund’s net assets. |
| (12) | Weighted average fixed-rate coupon that changes/updates monthly. Rate shown is the rate at October 31, 2016. |
| (13) | Adjustable rate mortgage security. Rate shown is the rate at October 31, 2016. |
| (14) | Security exempt from registration under Regulation S of the Securities Act of 1933, which exempts from registration securities offered and sold outside the United States. Security may not be offered or sold in the United States except pursuant to an exemption from, or in a transaction not subject to, the registration requirements of the Securities Act of 1933. At October 31, 2016, the aggregate value of these securities is $9,154,782 or 3.4% of the Fund’s net assets. |
| (15) | Non-income producing. |
| (16) | Security was acquired in connection with a restructuring of a Senior Loan and may be subject to restrictions on resale. |
| (17) | Amount is less than 0.05% or (0.05)%, as applicable. |
| (18) | Security (or a portion thereof) has been pledged to cover collateral requirements on open derivative contracts. |
| (19) | Affiliated investment company, available to Eaton Vance portfolios and funds, which invests in high quality, U.S. dollar denominated money market instruments. The rate shown is the annualized seven-day yield as of October 31, 2016. |
| | | | | | | | | | | | | | | | | | | | | | | | |
| Forward Foreign Currency Exchange Contracts | |
| Currency Purchased | | | Currency Sold | | | Counterparty | | Settlement Date | | | Unrealized Appreciation | | | Unrealized (Depreciation) | |
| | | | | | | |
| KES | | | 18,997,000 | | | USD | | | 183,192 | | | Citibank, N.A. | | | 11/2/16 | | | $ | 3,694 | | | $ | — | |
| USD | | | 187,078 | | | KES | | | 18,997,000 | | | Citibank, N.A. | | | 11/2/16 | | | | 191 | | | | — | |
| KES | | | 5,584,000 | | | USD | | | 53,874 | | | Standard Chartered Bank | | | 11/3/16 | | | | 1,051 | | | | — | |
| PLN | | | 15,573,911 | | | EUR | | | 3,581,260 | | | Morgan Stanley & Co. International PLC | | | 11/4/16 | | | | 37,913 | | | | — | |
| SEK | | | 56,084,727 | | | EUR | | | 5,856,312 | | | Goldman Sachs International | | | 11/4/16 | | | | — | | | | (219,265 | ) |
| IDR | | | 11,794,105,000 | | | USD | | | 887,910 | | | BNP Paribas | | | 11/14/16 | | | | 14,829 | | | | — | |
| IDR | | | 19,295,154,000 | | | USD | | | 1,455,359 | | | Nomura International PLC | | | 11/14/16 | | | | 21,522 | | | | — | |
| PHP | | | 76,285,297 | | | USD | | | 1,640,121 | | | Bank of America, N.A. | | | 11/15/16 | | | | — | | | | (66,506 | ) |
| PHP | | | 80,645,000 | | | USD | | | 1,734,226 | | | Goldman Sachs International | | | 11/15/16 | | | | — | | | | (70,680 | ) |
| PHP | | | 61,350,000 | | | USD | | | 1,307,266 | | | Nomura International PLC | | | 11/15/16 | | | | — | | | | (41,737 | ) |
| ARS | | | 49,718,000 | | | USD | | | 2,777,542 | | | Citibank, N.A. | | | 11/16/16 | | | | 473,589 | | | | — | |
| MXN | | | 95,126,815 | | | USD | | | 5,197,576 | | | Standard Chartered Bank | | | 11/22/16 | | | | — | | | | (175,374 | ) |
| RSD | | | 358,370,000 | | | EUR | | | 2,900,372 | | | Deutsche Bank AG | | | 11/22/16 | | | | 7,304 | | | | — | |
| RSD | | | 247,818,000 | | | EUR | | | 2,005,487 | | | Deutsche Bank AG | | | 11/22/16 | | | | 5,229 | | | | — | |
| RUB | | | 405,541,922 | | | USD | | | 6,188,362 | | | Deutsche Bank AG | | | 11/23/16 | | | | 174,091 | | | | — | |
| | | | |
| | 22 | | See Notes to Financial Statements. |
Eaton Vance
Short Duration Diversified Income Fund
October 31, 2016
Portfolio of Investments — continued
| | | | | | | | | | | | | | | | | | | | | | | | |
| Forward Foreign Currency Exchange Contracts (continued) | |
| Currency Purchased | | | Currency Sold | | | Counterparty | | Settlement Date | | | Unrealized Appreciation | | | Unrealized (Depreciation) | |
| USD | | | 1,514,492 | | | EUR | | | 1,336,887 | | | State Street Bank and Trust Company | | | 11/30/16 | | | $ | 45,278 | | | $ | — | |
| KES | | | 5,725,000 | | | USD | | | 54,753 | | | JPMorgan Chase Bank, N.A. | | | 12/5/16 | | | | 1,218 | | | | — | |
| IDR | | | 27,007,136,000 | | | USD | | | 2,008,712 | | | JPMorgan Chase Bank, N.A. | | | 12/6/16 | | | | 53,236 | | | | — | |
| IDR | | | 9,660,050,000 | | | USD | | | 738,254 | | | BNP Paribas | | | 12/9/16 | | | | — | | | | (1,058 | ) |
| IDR | | | 11,438,179,000 | | | USD | | | 850,738 | | | Deutsche Bank AG | | | 12/9/16 | | | | 22,153 | | | | — | |
| CAD | | | 2,650,000 | | | USD | | | 2,039,109 | | | JPMorgan Chase Bank, N.A. | | | 12/12/16 | | | | — | | | | (62,830 | ) |
| NOK | | | 38,369,000 | | | EUR | | | 4,124,529 | | | BNP Paribas | | | 12/20/16 | | | | 106,705 | | | | — | |
| USD | | | 696,829 | | | GBP | | | 535,269 | | | Goldman Sachs International | | | 12/30/16 | | | | 40,704 | | | | — | |
| GBP | | | 1,005,000 | | | USD | | | 1,310,943 | | | Australia and New Zealand Banking Group Limited | | | 1/3/17 | | | | — | | | | (78,873 | ) |
| BRL | | | 11,251,000 | | | USD | | | 3,348,014 | | | Citibank, N.A. | | | 1/5/17 | | | | 109,824 | | | | — | |
| BRL | | | 12,700,000 | | | USD | | | 3,367,807 | | | Standard Chartered Bank | | | 1/5/17 | | | | 535,360 | | | | — | |
| USD | | | 3,334,124 | | | BRL | | | 11,251,000 | | | Citibank, N.A. | | | 1/5/17 | | | | — | | | | (123,714 | ) |
| USD | | | 2,793,665 | | | BRL | | | 12,700,000 | | | Standard Chartered Bank | | | 1/5/17 | | | | — | | | | (1,109,502 | ) |
| ILS | | | 15,125,000 | | | USD | | | 4,020,895 | | | Citibank, N.A. | | | 1/6/17 | | | | — | | | | (72,041 | ) |
| MYR | | | 13,331,000 | | | USD | | | 3,200,029 | | | Goldman Sachs International | | | 1/9/17 | | | | — | | | | (31,488 | ) |
| USD | | | 2,019,870 | | | EUR | | | 1,800,000 | | | Standard Chartered Bank | | | 1/9/17 | | | | 37,566 | | | | — | |
| USD | | | 1,200,645 | | | EUR | | | 1,062,424 | | | Standard Chartered Bank | | | 1/9/17 | | | | 30,619 | | | | — | |
| USD | | | 2,712,404 | | | EUR | | | 2,493,935 | | | Standard Chartered Bank | | | 1/9/17 | | | | — | | | | (34,117 | ) |
| USD | | | 1,055,921 | | | EUR | | | 936,391 | | | Goldman Sachs International | | | 1/11/17 | | | | 24,599 | | | | — | |
| USD | | | 6,395,444 | | | EUR | | | 5,670,776 | | | Standard Chartered Bank | | | 1/11/17 | | | | 149,766 | | | | — | |
| COP | | | 12,760,000,000 | | | USD | | | 4,305,720 | | | The Bank of Nova Scotia | | | 1/13/17 | | | | — | | | | (106,436 | ) |
| IDR | | | 5,133,580,000 | | | USD | | | 387,528 | | | Barclays Bank PLC | | | 1/17/17 | | | | 1,913 | | | | — | |
| INR | | | 281,415,000 | | | USD | | | 4,155,874 | | | Standard Chartered Bank | | | 1/19/17 | | | | 18,576 | | | | — | |
| INR | | | 148,421,000 | | | USD | | | 2,192,496 | | | Standard Chartered Bank | | | 1/19/17 | | | | 9,150 | | | | — | |
| EUR | | | 132,100 | | | RON | | | 600,000 | | | BNP Paribas | | | 1/30/17 | | | | — | | | | (828 | ) |
| MXN | | | 18,650,000 | | | USD | | | 986,418 | | | HSBC Bank USA, N.A. | | | 1/30/17 | | | | — | | | | (9,165 | ) |
| RON | | | 14,367,472 | | | EUR | | | 3,192,062 | | | BNP Paribas | | | 1/30/17 | | | | — | | | | (11,937 | ) |
| USD | | | 967,790 | | | EUR | | | 884,392 | | | Goldman Sachs International | | | 1/31/17 | | | | — | | | | (7,146 | ) |
| RON | | | 1,400,000 | | | EUR | | | 310,731 | | | BNP Paribas | | | 2/3/17 | | | | — | | | | (859 | ) |
| KES | | | 96,909,000 | | | USD | | | 915,964 | | | Citibank, N.A. | | | 2/6/17 | | | | 21,283 | | | | — | |
| KES | | | 72,900,000 | | | USD | | | 687,736 | | | JPMorgan Chase Bank, N.A. | | | 2/6/17 | | | | 17,311 | | | | — | |
| USD | | | 3,624,282 | | | EUR | | | 3,314,038 | | | Standard Chartered Bank | | | 2/8/17 | | | | — | | | | (30,386 | ) |
| RON | | | 575,000 | | | EUR | | | 127,128 | | | BNP Paribas | | | 2/28/17 | | | | 88 | | | | — | |
| RON | | | 1,690,245 | | | EUR | | | 374,487 | | | BNP Paribas | | | 2/28/17 | | | | — | | | | (610 | ) |
| RON | | | 1,380,000 | | | EUR | | | 305,344 | | | Deutsche Bank AG | | | 3/2/17 | | | | — | | | | (70 | ) |
| RON | | | 212,000 | | | EUR | | | 47,028 | | | Bank of America, N.A. | | | 3/6/17 | | | | — | | | | (149 | ) |
| RON | | | 1,287,171 | | | EUR | | | 285,670 | | | Bank of America, N.A. | | | 3/6/17 | | | | — | | | | (1,058 | ) |
| RON | | | 1,104,000 | | | EUR | | | 245,061 | | | Deutsche Bank AG | | | 3/7/17 | | | | — | | | | (964 | ) |
| RON | | | 1,576,000 | | | EUR | | | 349,562 | | | Deutsche Bank AG | | | 3/7/17 | | | | — | | | | (1,076 | ) |
| KES | | | 10,412,000 | | | USD | | | 98,832 | | | ICBC Standard Bank plc | | | 3/8/17 | | | | 1,366 | | | | — | |
| RON | | | 2,242,000 | | | EUR | | | 497,062 | | | BNP Paribas | | | 3/8/17 | | | | — | | | | (1,304 | ) |
| KES | | | 9,343,000 | | | USD | | | 88,643 | | | Standard Chartered Bank | | | 3/9/17 | | | | 1,253 | | | | — | |
| KES | | | 15,239,000 | | | USD | | | 144,446 | | | Citibank, N.A. | | | 3/13/17 | | | | 2,083 | | | | — | |
| KES | | | 64,700,000 | | | USD | | | 614,435 | | | Standard Chartered Bank | | | 3/24/17 | | | | 6,547 | | | | — | |
| BRL | | | 1,449,000 | | | USD | | | 420,280 | | | Citibank, N.A. | | | 4/5/17 | | | | 13,977 | | | | — | |
| | | | |
| | 23 | | See Notes to Financial Statements. |
Eaton Vance
Short Duration Diversified Income Fund
October 31, 2016
Portfolio of Investments — continued
| | | | | | | | | | | | | | | | | | | | | | | | |
| Forward Foreign Currency Exchange Contracts (continued) | |
| Currency Purchased | | | Currency Sold | | | Counterparty | | Settlement Date | | | Unrealized Appreciation | | | Unrealized (Depreciation) | |
| USD | | | 407,194 | | | BRL | | | 1,449,000 | | | BNP Paribas | | | 4/5/17 | | | $ | — | | | $ | (27,063 | ) |
| RSD | | | 23,978,900 | | | EUR | | | 191,372 | | | Citibank, N.A. | | | 4/18/17 | | | | — | | | | (1,197 | ) |
| CZK | | | 45,000,000 | | | EUR | | | 1,687,450 | | | Morgan Stanley & Co. International PLC | | | 10/20/17 | | | | — | | | | (2,445 | ) |
| | | | | | | |
| | | | | | | | | | | | | | | | | | | $ | 1,989,988 | | | $ | (2,289,878 | ) |
| | | | | | | | | | | | | | | | | | | | | | | | | | | | |
| Credit Default Swaps — Buy Protection | |
Reference Entity | | Counterparty | | | Notional Amount (000’s omitted) | | | Contract Annual Fixed Rate* | | | Termination Date | | | Market Value | | | Unamortized Upfront Payments Received (Paid) | | | Net Unrealized Depreciation | |
| | | | | | | |
| Lebanon | | | HSBC Bank USA, N.A. | | | $ | 1,250 | | | | 1.00 | %(1) | | | 12/20/17 | | | $ | 27,279 | | | $ | (40,379 | ) | | $ | (13,100 | ) |
| | | | | | | |
| | | | | | | | | | | | | | | | | | | $ | 27,279 | | | $ | (40,379 | ) | | $ | (13,100 | ) |
| * | The contract annual fixed rate represents the fixed rate of interest received by the Fund (as a seller of protection) or paid by the Fund (as a buyer of protection) on the notional amount of the credit default swap contract. |
| (1) | Upfront payment is exchanged with the counterparty as a result of the standardized trading coupon. |
Abbreviations:
| | | | |
| DIP | | – | | Debtor In Possession |
| PIK | | – | | Payment In Kind |
Currency Abbreviations:
| | | | |
| ARS | | – | | Argentine Peso |
| BDT | | – | | Bangladeshi Taka |
| BRL | | – | | Brazilian Real |
| CAD | | – | | Canadian Dollar |
| COP | | – | | Colombian Peso |
| CZK | | – | | Czech Koruna |
| DOP | | – | | Dominican Peso |
| EUR | | – | | Euro |
| GBP | | – | | British Pound Sterling |
| GEL | | – | | Georgian Lari |
| IDR | | – | | Indonesian Rupiah |
| ILS | | – | | Israeli Shekel |
| INR | | – | | Indian Rupee |
| ISK | | – | | Icelandic Krona |
| | | | |
| KES | | – | | Kenyan Shilling |
| KZT | | – | | Kazakhstani Tenge |
| LKR | | – | | Sri Lankan Rupee |
| MXN | | – | | Mexican Peso |
| MYR | | – | | Malaysian Ringgit |
| NOK | | – | | Norwegian Krone |
| PHP | | – | | Philippine Peso |
| PLN | | – | | Polish Zloty |
| RON | | – | | Romanian Leu |
| RSD | | – | | Serbian Dinar |
| RUB | | – | | Russian Ruble |
| SEK | | – | | Swedish Krona |
| USD | | – | | United States Dollar |
| VND | | – | | Vietnamese Dong |
| | | | |
| | 24 | | See Notes to Financial Statements. |
Eaton Vance
Short Duration Diversified Income Fund
October 31, 2016
Statement of Assets and Liabilities
| | | | |
| Assets | | October 31, 2016 | |
Unaffiliated investments, at value (identified cost, $359,793,171) | | $ | 356,294,044 | |
Affiliated investment, at value (identified cost, $13,262,266) | | | 13,264,165 | |
Cash | | | 2,731,062 | |
Restricted cash* | | | 567,373 | |
Foreign currency, at value (identified cost, $2,442,318) | | | 2,440,500 | |
Interest receivable | | | 2,745,391 | |
Receivable for investments sold | | | 346,806 | |
Receivable for open forward foreign currency exchange contracts | | | 1,989,988 | |
Premium paid on open swap contracts | | | 40,379 | |
Tax reclaims receivable | | | 17,675 | |
Prepaid upfront fees on notes payable | | | 26,923 | |
Other assets | | | 5,808 | |
Total assets | | $ | 380,470,114 | |
| |
| Liabilities | | | | |
Notes payable | | $ | 102,000,000 | |
Cash collateral due to broker | | | 567,373 | |
Written options outstanding, at value (premiums received, $58,297) | | | 17,578 | |
Payable for investments purchased | | | 3,626,000 | |
Payable for when-issued securities | | | 1,996,083 | |
Payable for open forward foreign currency exchange contracts | | | 2,289,878 | |
Payable for open swap contracts | | | 13,100 | |
Payable to affiliates: | | | | |
Investment adviser fee | | | 285,876 | |
Trustees’ fees | | | 1,972 | |
Accrued expenses | | | 518,195 | |
Total liabilities | | $ | 111,316,055 | |
Net Assets | | $ | 269,154,059 | |
| |
| Sources of Net Assets | | | | |
Common shares, $0.01 par value, unlimited number of shares authorized, 17,880,596 shares issued and outstanding | | $ | 178,806 | |
Additional paid-in capital | | | 284,078,726 | |
Accumulated net realized loss | | | (12,020,810 | ) |
Accumulated undistributed net investment income | | | 708,271 | |
Net unrealized depreciation | | | (3,790,934 | ) |
Net Assets | | $ | 269,154,059 | |
| |
| Net Asset Value | | | | |
($269,154,059 ÷ 17,880,596 common shares issued and outstanding) | | $ | 15.05 | |
| * | Represents restricted cash on deposit at the custodian for open derivative contracts. |
| | | | |
| | 25 | | See Notes to Financial Statements. |
Eaton Vance
Short Duration Diversified Income Fund
October 31, 2016
Statement of Operations
| | | | |
| Investment Income | | Year Ended October 31, 2016 | |
Interest (net of foreign taxes, $65,426) | | $ | 18,618,522 | |
Interest allocated from/dividends from affiliated investment | | | 53,057 | |
Expenses allocated from affiliated investment | | | (1,363 | ) |
Total investment income | | $ | 18,670,216 | |
| |
| Expenses | | | | |
Investment adviser fee | | $ | 3,357,937 | |
Trustees’ fees and expenses | | | 23,778 | |
Custodian fee | | | 346,610 | |
Transfer and dividend disbursing agent fees | | | 18,034 | |
Legal and accounting services | | | 225,799 | |
Printing and postage | | | 87,848 | |
Interest expense and fees | | | 1,637,159 | |
Miscellaneous | | | 45,780 | |
Total expenses | | $ | 5,742,945 | |
| |
Net investment income | | $ | 12,927,271 | |
| |
| Realized and Unrealized Gain (Loss) | | | | |
Net realized gain (loss) — | | | | |
Investment transactions | | $ | (2,449,832 | ) |
Investment transactions in/allocated from affiliated investment | | | 828 | |
Written options | | | 29,821 | |
Swap contracts | | | 28,292 | |
Foreign currency and forward foreign currency exchange contract transactions | | | 39,889 | |
Net realized loss | | $ | (2,351,002 | ) |
Change in unrealized appreciation (depreciation) — | | | | |
Investments | | $ | 1,719,068 | |
Investments — affiliated investment | | | 1,899 | |
Written options | | | 49,506 | |
Swap contracts | | | (34,650 | ) |
Foreign currency and forward foreign currency exchange contracts | | | 1,185,286 | |
Net change in unrealized appreciation (depreciation) | | $ | 2,921,109 | |
| |
Net realized and unrealized gain | | $ | 570,107 | |
| |
Net increase in net assets from operations | | $ | 13,497,378 | |
| | | | |
| | 26 | | See Notes to Financial Statements. |
Eaton Vance
Short Duration Diversified Income Fund
October 31, 2016
Statements of Changes in Net Assets
| | | | | | | | |
| | | Year Ended October 31, | |
| Increase (Decrease) in Net Assets | | 2016 | | | 2015(1) | |
From operations — | | | | | | | | |
Net investment income | | $ | 12,927,271 | | | $ | 14,160,801 | |
Net realized loss from investment transactions, written options, swap contracts, and foreign currency and forward foreign currency exchange contract transactions | | | (2,351,002 | ) | | | (5,616,121 | ) |
Net change in unrealized appreciation (depreciation) from investments, written options, swap contracts, foreign currency and forward foreign currency exchange contracts | | | 2,921,109 | | | | (10,021,614 | ) |
Net increase (decrease) in net assets from operations | | $ | 13,497,378 | | | $ | (1,476,934 | ) |
Distributions to shareholders — | | | | | | | | |
From net investment income | | $ | (11,355,168 | ) | | $ | (9,324,076 | ) |
Tax return of capital | | | (7,959,521 | ) | | | (10,340,137 | ) |
Total distributions | | $ | (19,314,689 | ) | | $ | (19,664,213 | ) |
Capital share transactions — | | | | | | | | |
Cost of shares repurchased (see Note 5) | | $ | (723,031 | ) | | $ | (9,374,763 | ) |
Net decrease in net assets from capital share transactions | | $ | (723,031 | ) | | $ | (9,374,763 | ) |
| | |
Net decrease in net assets | | $ | (6,540,342 | ) | | $ | (30,515,910 | ) |
| | |
| Net Assets | | | | | | | | |
At beginning of year | | $ | 275,694,401 | | | $ | 306,210,311 | |
At end of year | | $ | 269,154,059 | | | $ | 275,694,401 | |
| | |
Accumulated undistributed (distributions in excess of) net investment income
included in net assets | | | | | | | | |
At end of year | | $ | 708,271 | | | $ | (296,174 | ) |
| (1) | Includes the accounts of the Subsidiary through April 6, 2015, as discussed in Note 1. |
| | | | |
| | 27 | | See Notes to Financial Statements. |
Eaton Vance
Short Duration Diversified Income Fund
October 31, 2016
Statement of Cash Flows
| | | | |
| Cash Flows From Operating Activities | | Year Ended
October 31, 2016 | |
Net increase in net assets from operations | | $ | 13,497,378 | |
Adjustments to reconcile net increase in net assets from operations to net cash provided by operating activities: | | | | |
Investments purchased | | | (173,621,327 | ) |
Investments sold | | | 203,635,671 | |
Increase in short-term investments, net, excluding foreign government securities | | | (9,744,949 | ) |
Net amortization/accretion of premium (discount) | | | 8,116,138 | |
Amortization of prepaid upfront fees on notes payable | | | 53,715 | |
Increase in restricted cash | | | (251,232 | ) |
Decrease in interest receivable | | | 42,400 | |
Decrease in interest receivable from affiliated investment | | | 1,261 | |
Increase in receivable for open forward foreign currency exchange contracts | | | (514,159 | ) |
Decrease in receivable for open swap contracts | | | 379,124 | |
Decrease in premium paid on open swap contracts | | | 188,516 | |
Decrease in tax reclaims receivable | | | 727 | |
Decrease in other assets | | | 6,073 | |
Increase in cash collateral due to broker | | | 291,232 | |
Decrease in written options outstanding, at value | | | (18,592 | ) |
Decrease in payable for open forward foreign currency exchange contracts | | | (686,740 | ) |
Decrease in payable for open swap contracts | | | (344,474 | ) |
Decrease in payable to affiliate for investment adviser fee | | | (8,578 | ) |
Decrease in payable to affiliate for Trustees’ fees | | | (296 | ) |
Increase in accrued expenses | | | 130,369 | |
Decrease in unfunded loan commitments | | | (4,531 | ) |
Net change in unrealized (appreciation) depreciation from investments | | | (1,720,967 | ) |
Net realized loss from investments | | | 2,449,004 | |
Net cash provided by operating activities | | $ | 41,875,763 | |
| |
| Cash Flows From Financing Activities | | | | |
Distributions paid, net of reinvestments | | $ | (19,314,689 | ) |
Repurchase of common shares | | | (723,031 | ) |
Payment of prepaid upfront fees on notes payable | | | (70,000 | ) |
Proceeds from notes payable | | | 49,000,000 | |
Repayment of notes payable | | | (70,000,000 | ) |
Net cash used in financing activities | | $ | (41,107,720 | ) |
| |
Net increase in cash* | | $ | 768,043 | |
| |
Cash at beginning of year(1) | | $ | 4,403,519 | |
| |
Cash at end of year(1) | | $ | 5,171,562 | |
| |
| Supplemental disclosure of cash flow information | | | | |
Cash paid for interest and fees | | $ | 1,638,133 | |
| (1) | Balance includes foreign currency, at value. |
| * | Includes net change in unrealized appreciation (depreciation) on foreign currency of $10,631. |
| | | | |
| | 28 | | See Notes to Financial Statements. |
Eaton Vance
Short Duration Diversified Income Fund
October 31, 2016
Financial Highlights
| | | | | | | | | | | | | | | | | | | | |
| | | Year Ended October 31, | |
| | | 2016 | | | 2015 | | | 2014 | | | 2013 | | | 2012 | |
Net asset value — Beginning of year | | $ | 15.370 | | | $ | 16.460 | | | $ | 16.970 | | | $ | 17.860 | | | $ | 17.800 | |
| | | | | |
| Income (Loss) From Operations | | | | | | | | | | | | | | | | | | | | |
Net investment income(1) | | $ | 0.723 | | | $ | 0.777 | | | $ | 0.804 | | | $ | 0.824 | | | $ | 0.867 | |
Net realized and unrealized gain (loss) | | | 0.030 | | | | (0.860 | ) | | | (0.261 | ) | | | (0.634 | ) | | | 0.273 | |
| | | | | |
Total income (loss) from operations | | $ | 0.753 | | | $ | (0.083 | ) | | $ | 0.543 | | | $ | 0.190 | | | $ | 1.140 | |
| | | | | |
| Less Distributions | | | | | | | | | | | | | | | | | | | | |
From net investment income | | $ | (0.635 | ) | | $ | (0.512 | ) | | $ | (0.759 | ) | | $ | (0.697 | ) | | $ | (0.732 | ) |
Tax return of capital | | | (0.445 | ) | | | (0.568 | ) | | | (0.321 | ) | | | (0.383 | ) | | | (0.348 | ) |
| | | | | |
Total distributions | | $ | (1.080 | ) | | $ | (1.080 | ) | | $ | (1.080 | ) | | $ | (1.080 | ) | | $ | (1.080 | ) |
| | | | | |
Anti-dilutive effect of share repurchase program (see Note 5)(1) | | $ | 0.007 | | | $ | 0.073 | | | $ | 0.027 | | | $ | — | | | $ | — | |
| | | | | |
Net asset value — End of year | | $ | 15.050 | | | $ | 15.370 | | | $ | 16.460 | | | $ | 16.970 | | | $ | 17.860 | |
| | | | | |
Market value — End of year | | $ | 13.360 | | | $ | 13.580 | | | $ | 14.530 | | | $ | 15.290 | | | $ | 17.320 | |
| | | | | |
Total Investment Return on Net Asset Value(2) | | | 6.10 | % | | | 0.84 | % | | | 4.10 | % | | | 1.47 | % | | | 6.92 | % |
| | | | | |
Total Investment Return on Market Value(2) | | | 6.60 | % | | | 0.87 | % | | | 2.05 | % | | | (5.72 | )% | | | 12.87 | % |
| | | | | |
| Ratios/Supplemental Data | | | | | | | | | | | | | | | | | | | | |
Net assets, end of year (000’s omitted) | | $ | 269,154 | | | $ | 275,694 | | | $ | 306,210 | | | $ | 320,514 | | | $ | 337,400 | |
Ratios (as a percentage of average daily net assets): | | | | | | | | | | | | | | | | | | | | |
Expenses excluding interest and fees(3) | | | 1.53 | % | | | 1.51 | % | | | 1.53 | % | | | 1.55 | % | | | 1.47 | % |
Interest and fee expense(4) | | | 0.61 | % | | | 0.48 | % | | | 0.36 | % | | | 0.47 | % | | | 0.55 | % |
Total expenses(3) | | | 2.14 | % | | | 1.99 | % | | | 1.89 | % | | | 2.02 | % | | | 2.02 | % |
Net investment income | | | 4.81 | % | | | 4.84 | % | | | 4.80 | % | | | 4.72 | % | | | 4.87 | % |
Portfolio Turnover | | | 42 | % | | | 34 | % | | | 41 | % | | | 48 | % | | | 42 | % |
Senior Securities: | | | | | | | | | | | | | | | | | | | | |
Total notes payable outstanding (in 000’s) | | $ | 102,000 | | | $ | 123,000 | | | $ | 128,000 | | | $ | 95,000 | | | $ | 115,000 | |
Asset coverage per $1,000 of notes payable(5) | | $ | 3,639 | | | $ | 3,241 | | | $ | 3,392 | | | $ | 4,374 | | | $ | 3,934 | |
| (1) | Computed using average common shares outstanding. |
| (2) | Returns are historical and are calculated by determining the percentage change in net asset value or market value with all distributions reinvested. Distributions are assumed to be reinvested at prices obtained under the Fund’s dividend reinvestment plan. |
| (3) | Excludes the effect of custody fee credits, if any, of less than 0.005%. Effective September 1, 2015, custody fee credits, which were earned on cash deposit balances, were discontinued by the custodian. |
| (4) | Interest and fee expense relates to borrowings for the purpose of financial leverage (see Note 7) and securities sold short. |
| (5) | Calculated by subtracting the Fund’s total liabilities (not including the notes payable) from the Fund’s total assets, and dividing the result by the notes payable balance in thousands. |
| | | | |
| | 29 | | See Notes to Financial Statements. |
Eaton Vance
Short Duration Diversified Income Fund
October 31, 2016
Notes to Financial Statements
1 Significant Accounting Policies
Eaton Vance Short Duration Diversified Income Fund (the Fund) is a Massachusetts business trust registered under the Investment Company Act of 1940, as amended (the 1940 Act), as a diversified, closed-end management investment company. The Fund’s primary investment objective is to provide a high level of current income, with a secondary objective of seeking capital appreciation to the extent consistent with its primary goal.
Prior to April 7, 2015, the Fund sought to gain exposure to the commodity markets, in whole or in part, through investments in Eaton Vance EVG Commodity Subsidiary, Ltd. (the Subsidiary), a wholly-owned subsidiary of the Fund organized under the laws of the Cayman Islands with the same objective and investment policies and restrictions as the Fund. As of the close of business on April 6, 2015, the Fund fully redeemed its investment in the Subsidiary. Net assets of the Subsidiary at such date, consisting primarily of cash and securities, were transferred to the Fund with no gain or loss for financial reporting purposes. As of October 31, 2015, the Subsidiary had been dissolved with the Cayman Islands authorities. The accompanying financial statements include the accounts of the Subsidiary through April 6, 2015. Intercompany balances and transactions were eliminated in consolidation.
The following is a summary of significant accounting policies of the Fund. The policies are in conformity with accounting principles generally accepted in the United States of America (U.S. GAAP). The Fund is an investment company and follows accounting and reporting guidance in the Financial Accounting Standards Board (FASB) Accounting Standards Codification Topic 946.
A Investment Valuation — The following methodologies are used to determine the market value or fair value of investments.
Senior Floating-Rate Loans. Interests in senior floating-rate loans (Senior Loans) for which reliable market quotations are readily available are valued generally at the average mean of bid and ask quotations obtained from a third party pricing service. Other Senior Loans are valued at fair value by the investment adviser under procedures approved by the Trustees. In fair valuing a Senior Loan, the investment adviser utilizes one or more of the valuation techniques described in (i) through (iii) below to assess the likelihood that the borrower will make a full repayment of the loan underlying such Senior Loan relative to yields on other Senior Loans issued by companies of comparable credit quality. If the investment adviser believes that there is a reasonable likelihood of full repayment, the investment adviser will determine fair value using a matrix pricing approach that considers the yield on the Senior Loan. If the investment adviser believes there is not a reasonable likelihood of full repayment, the investment adviser will determine fair value using analyses that include, but are not limited to: (i) a comparison of the value of the borrower’s outstanding equity and debt to that of comparable public companies; (ii) a discounted cash flow analysis; or (iii) when the investment adviser believes it is likely that a borrower will be liquidated or sold, an analysis of the terms of such liquidation or sale. In certain cases, the investment adviser will use a combination of analytical methods to determine fair value, such as when only a portion of a borrower’s assets are likely to be sold. In conducting its assessment and analyses for purposes of determining fair value of a Senior Loan, the investment adviser will use its discretion and judgment in considering and appraising relevant factors. Fair value determinations are made by the portfolio managers of the Fund based on information available to such managers. The portfolio managers of other funds managed by the investment adviser that invest in Senior Loans may not possess the same information about a Senior Loan borrower as the portfolio managers of the Fund. At times, the fair value of a Senior Loan determined by the portfolio managers of other funds managed by the investment adviser that invest in Senior Loans may vary from the fair value of the same Senior Loan determined by the portfolio managers of the Fund. The fair value of each Senior Loan is periodically reviewed and approved by the investment adviser’s Valuation Committee and by the Trustees based upon procedures approved by the Trustees. Junior Loans (i.e., subordinated loans and second lien loans) are valued in the same manner as Senior Loans.
Debt Obligations. Debt obligations (including short-term obligations with a remaining maturity of more than sixty days) are generally valued on the basis of valuations provided by third party pricing services, as derived from such services’ pricing models. Inputs to the models may include, but are not limited to, reported trades, executable bid and asked prices, broker/dealer quotations, prices or yields of securities with similar characteristics, interest rates, anticipated prepayments, benchmark curves or information pertaining to the issuer, as well as industry and economic events. The pricing services may use a matrix approach, which considers information regarding securities with similar characteristics to determine the valuation for a security. Short-term obligations purchased with a remaining maturity of sixty days or less (excluding those that are non-U.S. dollar denominated, which typically are valued by a pricing service or dealer quotes) are generally valued at amortized cost, which approximates market value.
Equity Securities. Equity securities listed on a U.S. securities exchange generally are valued at the last sale or closing price on the day of valuation or, if no sales took place on such date, at the mean between the closing bid and asked prices therefore on the exchange where such securities are principally traded. Equity securities listed on the NASDAQ Global or Global Select Market generally are valued at the NASDAQ official closing price. Unlisted or listed securities for which closing sales prices or closing quotations are not available are valued at the mean between the latest available bid and asked prices.
Derivatives. Exchange-traded options are valued at the mean between the bid and asked prices at valuation time as reported by the Options Price Reporting Authority for U.S. listed options or by the relevant exchange or board of trade for non-U.S. listed options. Over-the-counter options (including options on securities, indices and foreign currencies) are valued by a third party pricing service using techniques that consider factors including the value of the underlying instrument, the volatility of the underlying instrument and the period of time until option expiration. Forward foreign currency exchange contracts are generally valued at the mean of the average bid and average asked prices that are reported by currency dealers to a third party pricing service at the valuation time. Such third party pricing service valuations are supplied for specific settlement periods and the Fund’s forward foreign currency exchange contracts are valued at an interpolated rate between the closest preceding and subsequent settlement period reported by the third party pricing service. Swaps (other than centrally cleared) are normally valued using valuations provided by a third party pricing service. Such pricing service valuations are based on the present value of fixed and projected floating rate cash flows over the term of the swap contract, and in the case of credit default swaps, based on credit spread quotations obtained from broker/dealers and expected default recovery rates determined by the pricing service using proprietary
Eaton Vance
Short Duration Diversified Income Fund
October 31, 2016
Notes to Financial Statements — continued
models. Future cash flows on swaps are discounted to their present value using swap rates provided by electronic data services or by broker/dealers. Centrally cleared swaps are valued at the daily settlement price provided by the central clearing counterparty.
Foreign Securities and Currencies. Foreign securities and currencies are valued in U.S. dollars, based on foreign currency exchange rate quotations supplied by a third party pricing service. The pricing service uses a proprietary model to determine the exchange rate. Inputs to the model include reported trades and implied bid/ask spreads.
Affiliated Fund. The Fund may invest in Eaton Vance Cash Reserves Fund, LLC (Cash Reserves Fund), an affiliated investment company managed by Eaton Vance Management (EVM). While Cash Reserves Fund is not a registered money market mutual fund, it conducts all of its investment activities in accordance with the requirements of Rule 2a-7 under the 1940 Act. Investments in Cash Reserves Fund are valued at the closing net asset value per unit on the valuation day. Cash Reserves Fund generally values its investment securities based on available market quotations provided by a third party pricing service. Prior to Cash Reserves Fund’s issuance of units in October 2016, the value of the Fund’s investment in Cash Reserves Fund reflected the Fund’s proportionate interest in its net assets and the Fund recorded its pro rata share of Cash Reserves Fund’s income, expenses and realized gain or loss.
Fair Valuation. Investments for which valuations or market quotations are not readily available or are deemed unreliable are valued at fair value using methods determined in good faith by or at the direction of the Trustees of the Fund in a manner that fairly reflects the security’s value, or the amount that the Fund might reasonably expect to receive for the security upon its current sale in the ordinary course. Each such determination is based on a consideration of relevant factors, which are likely to vary from one pricing context to another. These factors may include, but are not limited to, the type of security, the existence of any contractual restrictions on the security’s disposition, the price and extent of public trading in similar securities of the issuer or of comparable companies or entities, quotations or relevant information obtained from broker/dealers or other market participants, information obtained from the issuer, analysts, and/or the appropriate stock exchange (for exchange-traded securities), an analysis of the company’s or entity’s financial condition, and an evaluation of the forces that influence the issuer and the market(s) in which the security is purchased and sold.
B Investment Transactions — Investment transactions for financial statement purposes are accounted for on a trade date basis. Realized gains and losses on investments sold are determined on the basis of identified cost.
C Income — Interest income is recorded on the basis of interest accrued, adjusted for amortization of premium or accretion of discount. Dividend income is recorded on the ex-dividend date for dividends received in cash and/or securities. Fees associated with loan amendments are recognized immediately. Inflation adjustments to the principal amount of inflation-adjusted bonds and notes are reflected as interest income. Withholding taxes on foreign interest have been provided for in accordance with the Fund’s understanding of the applicable countries’ tax rules and rates.
D Federal Taxes — The Fund’s policy is to comply with the provisions of the Internal Revenue Code applicable to regulated investment companies and to distribute to shareholders each year substantially all of its net investment income, and all or substantially all of its net realized capital gains. Accordingly, no provision for federal income or excise tax is necessary.
As of October 31, 2016, the Fund had no uncertain tax positions that would require financial statement recognition, de-recognition, or disclosure. The Fund files a U.S. federal income tax return annually after its fiscal year-end, which is subject to examination by the Internal Revenue Service for a period of three years from the date of filing.
E Foreign Currency Translation — Investment valuations, other assets, and liabilities initially expressed in foreign currencies are translated each business day into U.S. dollars based upon current exchange rates. Purchases and sales of foreign investment securities and income and expenses denominated in foreign currencies are translated into U.S. dollars based upon currency exchange rates in effect on the respective dates of such transactions. Recognized gains or losses on investment transactions attributable to changes in foreign currency exchange rates are recorded for financial statement purposes as net realized gains and losses on investments. That portion of unrealized gains and losses on investments that results from fluctuations in foreign currency exchange rates is not separately disclosed.
F Unfunded Loan Commitments — The Fund may enter into certain loan agreements all or a portion of which may be unfunded. The Fund is obligated to fund these commitments at the borrower’s discretion. These commitments, if any, are disclosed in the accompanying Portfolio of Investments. At October 31, 2016, the Fund had sufficient cash and/or securities to cover these commitments.
G Use of Estimates — The preparation of the financial statements in conformity with U.S. GAAP requires management to make estimates and assumptions that affect the reported amounts of assets and liabilities at the date of the financial statements and the reported amounts of income and expense during the reporting period. Actual results could differ from those estimates.
H Indemnifications — Under the Fund’s organizational documents, its officers and Trustees may be indemnified against certain liabilities and expenses arising out of the performance of their duties to the Fund. Under Massachusetts law, if certain conditions prevail, shareholders of a Massachusetts business trust (such as the Fund) could be deemed to have personal liability for the obligations of the Fund. However, the Fund’s Declaration of Trust contains an express disclaimer of liability on the part of Fund shareholders and the By-laws provide that the Fund shall assume the defense on behalf of any Fund shareholders. Moreover, the By-laws also provide for indemnification out of Fund property of any shareholder held personally liable solely by reason of being or having been a shareholder for all loss or expense arising from such liability. Additionally, in the normal course of business, the Fund enters into agreements with service providers that may contain indemnification clauses. The Fund’s maximum exposure under these arrangements is unknown as this would involve future claims that may be made against the Fund that have not yet occurred.
Eaton Vance
Short Duration Diversified Income Fund
October 31, 2016
Notes to Financial Statements — continued
I Forward Foreign Currency Exchange Contracts — The Fund may enter into forward foreign currency exchange contracts for the purchase or sale of a specific foreign currency at a fixed price on a future date. The forward foreign currency exchange contracts are adjusted by the daily exchange rate of the underlying currency and any gains or losses are recorded as unrealized until such time as the contracts have been closed. Risks may arise upon entering these contracts from the potential inability of counterparties to meet the terms of their contracts and from movements in the value of a foreign currency relative to the U.S. dollar.
J Written Options — Upon the writing of a call or a put option, the premium received by the Fund is included in the Statement of Assets and Liabilities as a liability. The amount of the liability is subsequently marked-to-market to reflect the current market value of the option written, in accordance with the Fund’s policies on investment valuations discussed above. Premiums received from writing options which expire are treated as realized gains. Premiums received from writing options which are exercised or are closed are added to or offset against the proceeds or amount paid on the transaction to determine the realized gain or loss. When an index option is exercised, the Fund is required to deliver an amount of cash determined by the excess of the strike price of the option over the value of the index (in the case of a put) or the excess of the value of the index over the strike price of the option (in the case of a call) at contract termination. If a put option on a security is exercised, the premium reduces the cost basis of the securities purchased by the Fund. The Fund, as a writer of an option, may have no control over whether the underlying securities or other assets may be sold (call) or purchased (put) and, as a result, bears the market risk of an unfavorable change in the price of the securities or other assets underlying the written option. The Fund may also bear the risk of not being able to enter into a closing transaction if a liquid secondary market does not exist.
K Purchased Options — Upon the purchase of a call or put option, the premium paid by the Fund is included in the Statement of Assets and Liabilities as an investment. The amount of the investment is subsequently marked-to-market to reflect the current market value of the option purchased, in accordance with the Fund’s policies on investment valuations discussed above. As the purchaser of an index option, the Fund has the right to receive a cash payment equal to any depreciation in the value of the index below the strike price of the option (in the case of a put) or equal to any appreciation in the value of the index over the strike price of the option (in the case of a call) as of the valuation date of the option. If an option which the Fund had purchased expires on the stipulated expiration date, the Fund will realize a loss in the amount of the cost of the option. If the Fund enters into a closing sale transaction, the Fund will realize a gain or loss, depending on whether the sales proceeds from the closing sale transaction are greater or less than the cost of the option. If the Fund exercises a put option on a security, it will realize a gain or loss from the sale of the underlying security, and the proceeds from such sale will be decreased by the premium originally paid. If the Fund exercises a call option on a security, the cost of the security which the Fund purchases upon exercise will be increased by the premium originally paid. The risk associated with purchasing options is limited to the premium originally paid. Purchased options traded over-the-counter involve risk that the issuer or counterparty will fail to perform its contractual obligations.
L Interest Rate Swaps — Swap contracts are privately negotiated agreements between the Fund and a counterparty. Certain swap contracts may be centrally cleared (“centrally cleared swaps”), whereby all payments made or received by the Fund pursuant to the contract are with a central clearing party (CCP) rather than the original counterparty. The CCP guarantees the performance of the original parties to the contract. Upon entering into centrally cleared swaps, the Fund is required to deposit with the CCP, either in cash or securities, an amount of initial margin determined by the CCP, which is subject to adjustment.
Pursuant to interest rate swap agreements, the Fund either makes floating-rate payments to the counterparty (or CCP in the case of centrally cleared swaps) based on a benchmark interest rate in exchange for fixed-rate payments or the Fund makes fixed-rate payments to the counterparty (or CCP in the case of a centrally cleared swap) in exchange for payments on a floating benchmark interest rate. Payments received or made are recorded as realized gains or losses. During the term of the outstanding swap agreement, changes in the underlying value of the swap are recorded as unrealized gains or losses. For centrally cleared swaps, the daily change in valuation is recorded as a receivable or payable for variation margin and settled in cash with the CCP daily. The value of the swap is determined by changes in the relationship between two rates of interest. The Fund is exposed to credit loss in the event of non-performance by the swap counterparty. In the case of centrally cleared swaps, counterparty risk is minimal due to protections provided by the CCP. Risk may also arise from movements in interest rates.
M Credit Default Swaps — When the Fund is the buyer of a credit default swap contract, the Fund is entitled to receive the par (or other agreed-upon) value of a referenced debt obligation (or basket of debt obligations) from the counterparty to the contract if a credit event by a third party, such as a U.S. or foreign corporate issuer or sovereign issuer, on the debt obligation occurs. In return, the Fund pays the counterparty a periodic stream of payments over the term of the contract provided that no credit event has occurred. If no credit event occurs, the Fund would have spent the stream of payments and received no proceeds from the contract. When the Fund is the seller of a credit default swap contract, it receives the stream of payments, but is obligated to pay to the buyer of the protection an amount up to the notional amount of the swap and in certain instances take delivery of securities of the reference entity upon the occurrence of a credit event, as defined under the terms of that particular swap agreement. Credit events are contract specific but may include bankruptcy, failure to pay, restructuring, obligation acceleration and repudiation/moratorium. If the Fund is a seller of protection and a credit event occurs, the maximum potential amount of future payments that the Fund could be required to make would be an amount equal to the notional amount of the agreement. This potential amount would be partially offset by any recovery value of the respective referenced obligation, or net amount received from the settlement of a buy protection credit default swap agreement entered into by the Fund for the same referenced obligation. As the seller, the Fund may create economic leverage to its portfolio because, in addition to its total net assets, the Fund is subject to investment exposure on the notional amount of the swap. The interest fee paid or received on the swap contract, which is based on a specified interest rate on a fixed notional amount, is accrued daily as a component of unrealized appreciation (depreciation) and is recorded as realized gain upon receipt or realized loss upon payment. The Fund also records an increase or decrease to unrealized appreciation (depreciation) in an amount equal to the daily valuation. Upfront payments or receipts, if any, are recorded as other assets or other liabilities, respectively, and amortized over the life of the swap contract as realized gains or losses. For financial reporting
Eaton Vance
Short Duration Diversified Income Fund
October 31, 2016
Notes to Financial Statements — continued
purposes, unamortized upfront payments, if any, are netted with unrealized appreciation or depreciation on swap contracts to determine the market value of swaps as presented in Notes 6 and 9. The Fund segregates assets in the form of cash or liquid securities in an amount equal to the notional amount of the credit default swaps of which it is the seller. The Fund segregates assets in the form of cash or liquid securities in an amount equal to any unrealized depreciation of the credit default swaps of which it is the buyer, marked-to-market on a daily basis. These transactions involve certain risks, including the risk that the seller may be unable to fulfill the transaction.
N Stripped Mortgage-Backed Securities — The Fund may invest in Interest Only (IO) and Principal Only (PO) securities, a form of stripped mortgage-backed securities, whereby the IO security receives all the interest and the PO security receives all the principal on a pool of mortgage assets. The yield to maturity on an IO security is extremely sensitive to the rate of principal payments (including prepayments) on the related underlying mortgage assets, and a rapid rate of principal payments may have a material adverse effect on the yield to maturity from these securities. If the underlying mortgages experience greater than anticipated prepayments of principal, the Fund may fail to recoup its initial investment in an IO security. The market value of IO and PO securities can be unusually volatile due to changes in interest rates.
O When-Issued Securities and Delayed Delivery Transactions — The Fund may purchase securities on a delayed delivery or when-issued basis. Payment and delivery may take place after the customary settlement period for that security. At the time the transaction is negotiated, the price of the security that will be delivered is fixed. The Fund maintains cash and/or security positions for these commitments such that sufficient liquid assets will be available to make payments upon settlement. Securities purchased on a delayed delivery or when-issued basis are marked-to-market daily and begin earning interest on settlement date. Losses may arise due to changes in the market value of the underlying securities or if the counterparty does not perform under the contract.
P Statement of Cash Flows — The cash amount shown in the Statement of Cash Flows of the Fund is the amount included in the Fund’s Statement of Assets and Liabilities and represents the unrestricted cash on hand at its custodian and does not include any short-term investments.
2 Distributions to Shareholders and Income Tax Information
Subject to its Managed Distribution Plan, the Fund intends to make monthly distributions to shareholders and to distribute all or substantially all of its net realized capital gains (reduced by available capital loss carryforwards from prior years). In its distributions, the Fund intends to include amounts attributable to the imputed interest on foreign currency exposures through long and short positions in forward currency exchange contracts (represented by the difference between the foreign currency spot rate and the foreign currency forward rate) and the imputed interest derived from certain other derivative positions. Distributions are recorded on the ex-dividend date. Distributions to shareholders are determined in accordance with income tax regulations, which may differ from U.S. GAAP. As required by U.S. GAAP, only distributions in excess of tax basis earnings and profits are reported in the financial statements as a return of capital. Permanent differences between book and tax accounting relating to distributions are reclassified to paid-in capital. For tax purposes, distributions from short-term capital gains are considered to be from ordinary income. In certain circumstances, a portion of distributions to shareholders may include a return of capital component.
The tax character of distributions declared for the years ended October 31, 2016 and October 31, 2015 was as follows:
| | | | | | | | |
| | | Year Ended October 31, | |
| | | 2016 | | | 2015 | |
| | |
Distributions declared from: | | | | | | | | |
Ordinary income | | $ | 11,355,168 | | | $ | 9,324,076 | |
Tax return of capital | | $ | 7,959,521 | | | $ | 10,340,137 | |
During the year ended October 31, 2016, accumulated net realized loss was decreased by $14,309,878, accumulated undistributed net investment income was decreased by $567,658 and paid-in capital was decreased by $13,742,220 due to expired capital loss carryforwards and differences between book and tax accounting, primarily for foreign currency gain (loss), paydown gain (loss), swap contracts, tax straddle transactions, premium amortization and accretion of market discount. These reclassifications had no effect on the net assets or net asset value per share of the Fund.
As of October 31, 2016, the components of distributable earnings (accumulated losses) on a tax basis were as follows:
| | | | |
Capital loss carryforwards and deferred capital losses | | $ | (10,252,523 | ) |
Net unrealized depreciation | | $ | (4,850,950 | ) |
The differences between components of distributable earnings (accumulated losses) on a tax basis and the amounts reflected in the Statement of Assets and Liabilities are primarily due to wash sales, foreign currency transactions, swap contracts, premium amortization and accretion of market discount.
Eaton Vance
Short Duration Diversified Income Fund
October 31, 2016
Notes to Financial Statements — continued
At October 31, 2016, the Fund, for federal income tax purposes, had capital loss carryforwards of $7,475,955 and deferred capital losses of $2,776,568 which would reduce its taxable income arising from future net realized gains on investment transactions, if any, to the extent permitted by the Internal Revenue Code, and thus would reduce the amount of distributions to shareholders, which would otherwise be necessary to relieve the Fund of any liability for federal income or excise tax. Such capital loss carryforwards will expire on October 31, 2017 ($738,126), October 31, 2018 ($5,165,932) and October 31, 2019 ($1,571,897), and their character is short-term. Under tax regulations, capital losses incurred in taxable years beginning after December 2010 are considered deferred capital losses and are treated as arising on the first day of the Fund’s next taxable year, retaining the same short-term or long-term character as when originally deferred. Deferred capital losses are required to be used prior to capital loss carryforwards, which carry an expiration date. As a result of this ordering rule, capital loss carryforwards may be more likely to expire unused. Of the deferred capital losses at October 31, 2016, $139,390 are short-term and $2,637,178 are long-term.
The cost and unrealized appreciation (depreciation) of investments of the Fund at October 31, 2016, as determined on a federal income tax basis, were as follows:
| | | | |
| |
Aggregate cost | | $ | 374,823,723 | |
| |
Gross unrealized appreciation | | $ | 8,281,594 | |
Gross unrealized depreciation | | | (13,547,108 | ) |
| |
Net unrealized depreciation | | $ | (5,265,514 | ) |
3 Investment Adviser Fee and Other Transactions with Affiliates
The investment adviser fee is earned by EVM as compensation for investment advisory services rendered to the Fund. Pursuant to the investment advisory agreement and subsequent fee reduction agreement between the Fund and EVM, the fee is computed at an annual rate of 0.75% of the Fund’s average daily total leveraged assets, subject to the limitation described below, and is payable monthly. Total leveraged assets as referred to herein represent net assets plus liabilities or obligations attributable to investment leverage and the notional value of long and short forward currency contracts, futures contracts and swaps held by the Fund. The notional value of a contract for purposes of calculating total leveraged assets is the stated dollar value of the underlying reference instrument at the time the derivative position is entered into and remains constant throughout the life of the derivative contract. However, the derivative contracts are marked-to-market daily and any unrealized appreciation or depreciation is reflected in the Fund’s net assets. When the Fund holds both long and short forward currency contracts in the same foreign currency, the offsetting positions are netted for purposes of determining total leveraged assets. When the Fund holds other long and short positions in foreign obligations denominated in the same currency, total leveraged assets are calculated by excluding the smaller of the long or short position.
The advisory agreements provide that if investment leverage exceeds 40% of the Fund’s total leveraged assets, EVM will not receive a management fee on total leveraged assets in excess of this amount. As of October 31, 2016, the Fund’s investment leverage was 46% of its total leveraged assets. For the year ended October 31, 2016, the Fund’s investment adviser fee amounted to $3,357,937 or 0.69% of the Fund’s average daily total leveraged assets and 1.25% of the Fund’s average daily net assets. The Fund invests its cash in Cash Reserves Fund. EVM does not currently receive a fee for advisory services provided to Cash Reserves Fund. EVM also serves as administrator of the Fund, but receives no compensation.
Trustees and officers of the Fund who are members of EVM’s organization receive remuneration for their services to the Fund out of the investment adviser fee. Trustees of the Fund who are not affiliated with EVM may elect to defer receipt of all or a percentage of their annual fees in accordance with the terms of the Trustees Deferred Compensation Plan. For the year ended October 31, 2016, no significant amounts have been deferred. Certain officers and Trustees of the Fund are officers of EVM.
4 Purchases and Sales of Investments
Purchases and sales of investments, other than short-term obligations and including maturities, paydowns and principal repayments on Senior Loans, for the year ended October 31, 2016 were as follows:
| | | | | | | | |
| | | Purchases | | | Sales | |
| | |
Investments (non-U.S. Government) | | $ | 99,569,030 | | | $ | 106,870,906 | |
U.S. Government and Agency Securities | | | 47,943,247 | | | | 63,898,848 | |
| | |
| | | $ | 147,512,277 | | | $ | 170,769,754 | |
Eaton Vance
Short Duration Diversified Income Fund
October 31, 2016
Notes to Financial Statements — continued
5 Common Shares of Beneficial Interest
The Fund may issue common shares pursuant to its dividend reinvestment plan. There were no common shares issued by the Fund for the years ended October 31, 2016 and October 31, 2015.
On November 11, 2013, the Board of Trustees of the Fund authorized the repurchase by the Fund of up to 10% of its then currently outstanding common shares in open-market transactions at a discount to net asset value (NAV). The repurchase program does not obligate the Fund to purchase a specific amount of shares. During the years ended October 31, 2016 and October 31, 2015, the Fund repurchased 55,500 and 666,400, respectively, of its common shares under the share repurchase program at a cost, including brokerage commissions, of $723,031 and $9,374,763, respectively, and an average price per share of $13.03 and $14.07, respectively. The weighted average discount per share to NAV on these repurchases amounted to 14.41% and 12.39% for the years ended October 31, 2016 and October 31, 2015, respectively.
6 Financial Instruments
The Fund may trade in financial instruments with off-balance sheet risk in the normal course of its investing activities. These financial instruments may include written options, forward foreign currency exchange contracts and swap contracts and may involve, to a varying degree, elements of risk in excess of the amounts recognized for financial statement purposes. The notional or contractual amounts of these instruments represent the investment the Fund has in particular classes of financial instruments and do not necessarily represent the amounts potentially subject to risk. The measurement of the risks associated with these instruments is meaningful only when all related and offsetting transactions are considered. A summary of obligations under these financial instruments at October 31, 2016 is included in the Portfolio of Investments. At October 31, 2016, the Fund had sufficient cash and/or securities to cover commitments under these contracts.
Written options activity for the year ended October 31, 2016 was as follows:
| | | | | | | | | | | | |
| | | Principal Amount of Contracts (000’s omitted) | | | Premiums Received | |
| Currency | | USD | | | EUR | | | USD | |
| | | |
Outstanding, beginning of year | | | 1,485 | | | | — | | | | 27,383 | |
Options written | | | 4,013 | | | | 1,221 | | | | 97,568 | |
Options exercised | | | (4,185 | ) | | | — | | | | (36,833 | ) |
Options expired | | | — | | | | (1,221 | ) | | | (29,821 | ) |
| | | |
Outstanding, end of year | | | 1,313 | | | | — | | | | 58,297 | |
| | | | |
| EUR | | – | | Euro |
| USD | | – | | United States Dollar |
In the normal course of pursuing its investment objectives, the Fund is subject to the following risks:
Credit Risk: The Fund enters into credit default swap contracts to manage certain investment risks and/or to enhance total return.
Foreign Exchange Risk: The Fund engages in forward foreign currency exchange contracts and currency options to enhance total return, to seek to hedge against fluctuations in currency exchange rates and/or as a substitute for the purchase or sale of securities or currencies.
Interest Rate Risk: During the year ended October 31, 2016, the Fund utilized interest rate swaps to enhance total return and to seek to hedge against fluctuations in interest rates.
The Fund enters into over-the-counter (OTC) derivatives that may contain provisions whereby the counterparty may terminate the contract under certain conditions, including but not limited to a decline in the Fund’s net assets below a certain level over a certain period of time, which would trigger a payment by the Fund for those derivatives in a liability position. At October 31, 2016, the fair value of derivatives with credit-related contingent features in a net liability position was $2,307,456. The aggregate fair value of assets pledged as collateral by the Fund for such liability was $381,958 at October 31, 2016.
The OTC derivatives in which the Fund invests (except for written options as the Fund, not the counterparty, is obligated to perform) are subject to the risk that the counterparty to the contract fails to perform its obligations under the contract. To mitigate this risk, the Fund has entered into an International Swaps and Derivatives Association, Inc. Master Agreement (“ISDA Master Agreement”) or similar agreement with substantially all its derivative counterparties. An ISDA Master Agreement is a bilateral agreement between the Fund and a counterparty that governs certain OTC derivatives and typically
Eaton Vance
Short Duration Diversified Income Fund
October 31, 2016
Notes to Financial Statements — continued
contains, among other things, set-off provisions in the event of a default and/or termination event as defined under the relevant ISDA Master Agreement. Under an ISDA Master Agreement, the Fund may, under certain circumstances, offset with the counterparty certain derivative financial instruments’ payables and/or receivables with collateral held and/or posted and create one single net payment. The provisions of the ISDA Master Agreement typically permit a single net payment in the event of default including the bankruptcy or insolvency of the counterparty. However, bankruptcy or insolvency laws of a particular jurisdiction may impose restrictions on or prohibitions against the right of offset in bankruptcy or insolvency. Certain ISDA Master Agreements allow counterparties to OTC derivatives to terminate derivative contracts prior to maturity in the event the Fund’s net assets decline by a stated percentage or the Fund fails to meet the terms of its ISDA Master Agreements, which would cause the counterparty to accelerate payment by the Fund of any net liability owed to it.
The collateral requirements for derivatives traded under an ISDA Master Agreement are governed by a Credit Support Annex to the ISDA Master Agreement. Collateral requirements are determined at the close of business each day and are typically based on changes in market values for each transaction under an ISDA Master Agreement and netted into one amount for such agreement. Generally, the amount of collateral due from or to a counterparty is subject to a minimum transfer threshold amount before a transfer is required, which may vary by counterparty. Collateral pledged for the benefit of the Fund and/or counterparty is held in segregated accounts by the Fund’s custodian and cannot be sold, re-pledged, assigned or otherwise used while pledged. The portion of such collateral representing cash, if any, is reflected as restricted cash and, in the case of cash pledged by a counterparty for the benefit of the Fund, a corresponding liability on the Statement of Assets and Liabilities. Securities pledged by the Fund as collateral, if any, are identified as such in the Portfolio of Investments. The carrying amount of the liability for cash collateral due to broker at October 31, 2016 approximated its fair value. If measured at fair value, such liability would have been considered as Level 2 in the fair value hierarchy (see Note 9) at October 31, 2016.
The fair value of open derivative instruments (not considered to be hedging instruments for accounting disclosure purposes) by risk exposure at October 31, 2016 was as follows:
| | | | | | | | | | | | |
| | | Fair Value | |
| Statement of Assets and Liabilities Caption | | Credit | | | Foreign Exchange | | | Total | |
| | | |
Unaffiliated investments, at value | | $ | — | | | $ | 17,578 | | | $ | 17,578 | |
Receivable for open forward foreign currency exchange contracts | | | — | | | | 1,989,988 | | | | 1,989,988 | |
Payable for open swap contracts; Premium paid on open swap contracts | | | 27,279 | | | | — | | | | 27,279 | |
| | | |
Total Asset Derivatives subject to master netting or similar agreements | | $ | 27,279 | | | $ | 2,007,566 | | | $ | 2,034,845 | |
| | | |
| | | | | | | | | | | | |
| | | Credit | | | Foreign Exchange | | | Total | |
| | | |
Written options outstanding, at value | | $ | — | | | $ | (17,578 | ) | | $ | (17,578 | ) |
Payable for open forward foreign currency exchange contracts | | | — | | | | (2,289,878 | ) | | | (2,289,878 | ) |
| | | |
Total Liability Derivatives subject to master netting or similar agreements | | $ | — | | | $ | (2,307,456 | ) | | $ | (2,307,456 | ) |
Eaton Vance
Short Duration Diversified Income Fund
October 31, 2016
Notes to Financial Statements — continued
The Fund’s derivative assets and liabilities at fair value by risk, which are reported gross in the Statement of Assets and Liabilities, are presented in the table above. The following tables present the Fund’s derivative assets and liabilities by counterparty, net of amounts available for offset under a master netting agreement and net of the related collateral received by the Fund for such assets and pledged by the Fund for such liabilities as of October 31, 2016.
| | | | | | | | | | | | | | | | | | | | |
| Counterparty | | Derivative Assets Subject to Master Netting Agreement | | | Derivatives Available for Offset | | | Non-cash Collateral Received(a) | | | Cash Collateral Received(a) | | | Net Amount of Derivative Assets(b) | |
| | | | | |
Barclays Bank PLC | | $ | 1,913 | | | $ | — | | | $ | — | | | $ | — | | | $ | 1,913 | |
BNP Paribas | | | 121,622 | | | | (43,659 | ) | | | (77,963 | ) | | | — | | | | — | |
Citibank, N.A. | | | 624,641 | | | | (196,952 | ) | | | — | | | | (427,689 | ) | | | — | |
Deutsche Bank AG | | | 226,355 | | | | (2,110 | ) | | | — | | | | — | | | | 224,245 | |
Goldman Sachs International | | | 65,303 | | | | (65,303 | ) | | | — | | | | — | | | | — | |
HSBC Bank USA, N.A. | | | 27,279 | | | | (9,165 | ) | | | — | | | | — | | | | 18,114 | |
ICBC Standard Bank plc | | | 1,366 | | | | — | | | | — | | | | — | | | | 1,366 | |
JPMorgan Chase Bank, N.A. | | | 71,765 | | | | (62,830 | ) | | | — | | | | — | | | | 8,935 | |
Morgan Stanley & Co. International PLC | | | 37,913 | | | | (2,445 | ) | | | — | | | | — | | | | 35,468 | |
Nomura International PLC | | | 21,522 | | | | (21,522 | ) | | | — | | | | — | | | | — | |
Standard Chartered Bank | | | 789,888 | | | | (789,888 | ) | | | — | | | | — | | | | — | |
State Street Bank and Trust Company | | | 45,278 | | | | — | | | | — | | | | — | | | | 45,278 | |
| | | | | |
| | | $ | 2,034,845 | | | $ | (1,193,874 | ) | | $ | (77,963 | ) | | $ | (427,689 | ) | | $ | 335,319 | |
| | | | | |
| | | | | | | | | | | | | | | | | | | | |
| Counterparty | | Derivative Liabilities Subject to Master Netting Agreement | | | Derivatives Available for Offset | | | Non-cash Collateral Pledged(a) | | | Cash Collateral Pledged(a) | | | Net Amount of Derivative Liabilities(c) | |
| | | | | |
Australia and New Zealand Banking Group Limited | | $ | (78,873 | ) | | $ | — | | | $ | — | | | $ | — | | | $ | (78,873 | ) |
Bank of America, N.A. | | | (67,713 | ) | | | — | | | | — | | | | — | | | | (67,713 | ) |
BNP Paribas | | | (43,659 | ) | | | 43,659 | | | | — | | | | — | | | | — | |
Citibank, N.A. | | | (196,952 | ) | | | 196,952 | | | | — | | | | — | | | | — | |
Deutsche Bank AG | | | (2,110 | ) | | | 2,110 | | | | — | | | | — | | | | — | |
Goldman Sachs International | | | (346,157 | ) | | | 65,303 | | | | — | | | | — | | | | (280,854 | ) |
HSBC Bank USA, N.A. | | | (9,165 | ) | | | 9,165 | | | | — | | | | — | | | | — | |
JPMorgan Chase Bank, N.A. | | | (62,830 | ) | | | 62,830 | | | | — | | | | — | | | | — | |
Morgan Stanley & Co. International PLC | | | (2,445 | ) | | | 2,445 | | | | — | | | | — | | | | — | |
Nomura International PLC | | | (41,737 | ) | | | 21,522 | | | | — | | | | — | | | | (20,215 | ) |
Standard Chartered Bank | | | (1,349,379 | ) | | | 789,888 | | | | 381,958 | | | | — | | | | (177,533 | ) |
The Bank of Nova Scotia | | | (106,436 | ) | | | — | | | | — | | | | — | | | | (106,436 | ) |
| | | | | |
| | | $ | (2,307,456 | ) | | $ | 1,193,874 | | | $ | 381,958 | | | $ | — | | | $ | (731,624 | ) |
| (a) | In some instances, the actual collateral received and/or pledged may be more than the amount shown due to overcollateralization. |
| (b) | Net amount represents the net amount due from the counterparty in the event of default. |
| (c) | Net amount represents the net amount payable to the counterparty in the event of default. |
Eaton Vance
Short Duration Diversified Income Fund
October 31, 2016
Notes to Financial Statements — continued
The effect of derivative instruments (not considered to be hedging instruments for accounting disclosure purposes) on the Statement of Operations by risk exposure for the year ended October 31, 2016 was as follows:
| | | | | | | | | | | | |
| Statement of Operations Caption | | Credit | | | Foreign Exchange | | | Interest Rate | |
| | | |
Net realized gain (loss) — | | | | | | | | | | | | |
Investment transactions | | $ | — | | | $ | (40,791 | ) | | $ | — | |
Written options | | | — | | | | 29,821 | | | | — | |
Swap contracts | | | (10,644 | ) | | | — | | | | 38,936 | |
Foreign currency and forward foreign currency exchange contract transactions | | | — | | | | 299,673 | | | | — | |
| | | |
Total | | $ | (10,644 | ) | | $ | 288,703 | | | $ | 38,936 | |
| | | |
Change in unrealized appreciation (depreciation) — | | | | | | | | | | | | |
Investments | | $ | — | | | $ | (18,307 | ) | | $ | — | |
Written options | | | — | | | | 49,506 | | | | — | |
Swap contracts | | | 5,124 | | | | — | | | | (39,774 | ) |
Foreign currency and forward foreign currency exchange contracts | | | — | | | | 1,200,899 | | | | — | |
| | | |
Total | | $ | 5,124 | | | $ | 1,232,098 | | | $ | (39,774 | ) |
The average notional amounts of derivative contracts outstanding during the year ended October 31, 2016, which are indicative of the volume of these derivative types, were as follows:
| | | | | | |
Forward Foreign Currency Exchange Contracts | | �� | Swap Contracts | |
| |
| | $114,690,000 | | | $ | 4,512,000 | |
The average principal amount of purchased currency options contracts outstanding during the year ended October 31, 2016, which is indicative of the volume of this derivative type, was approximately $3,285,000.
7 Credit Agreement
The Fund has entered into a Credit Agreement (the Agreement) with a bank to borrow up to a limit of $140 million ($150 million prior to March 22, 2016) pursuant to a 364-day revolving line of credit. Borrowings under the Agreement are secured by the assets of the Fund. Interest is charged at a rate above the London Interbank Offered Rate (LIBOR) and is payable monthly. Under the terms of the Agreement, in effect through March 21, 2017, the Fund pays a commitment fee of 0.15% on the borrowing limit. In connection with the renewal of the Agreement on March 22, 2016, the Fund paid an upfront fee of $70,000, which is being amortized to interest expense through March 21, 2017. The unamortized balance at October 31, 2016 is approximately $27,000 and is included in prepaid upfront fees on notes payable on the Statement of Assets and Liabilities. Also included in interest expense is $10,638 of amortization of previously paid upfront fees related to the period from November 1, 2015 through March 22, 2016 when the Agreement was renewed. The Fund is required to maintain certain net asset levels during the term of the Agreement. At October 31, 2016, the Fund had borrowings outstanding under the Agreement of $102,000,000 at an interest rate of 1.31%. Based on the short-term nature of the borrowings under the Agreement and the variable interest rate, the carrying amount of the borrowings at October 31, 2016 approximated its fair value. If measured at fair value, borrowings under the Agreement would have been considered as Level 2 in the fair value hierarchy (see Note 9) at October 31, 2016. For the year ended October 31, 2016, the average borrowings under the Agreement and the average interest rate (excluding fees) were $110,021,858 and 1.23%, respectively.
8 Risks Associated with Foreign Investments
The Fund’s investments in foreign instruments can be adversely affected by changes in currency exchange rates and political, economic and market developments abroad. In emerging or less developed countries, these risks can be more significant. Investment markets in emerging market countries are typically substantially smaller, less liquid and more volatile than the major markets in developed countries. Emerging market countries may have relatively unstable governments and economies. Emerging market investments often are subject to speculative trading, which typically contributes to volatility.
Eaton Vance
Short Duration Diversified Income Fund
October 31, 2016
Notes to Financial Statements — continued
The Fund may have difficulties enforcing its legal or contractual rights in a foreign country. Economic data as reported by foreign governments and other issuers may be delayed, inaccurate or fraudulent. In the event of a default by a sovereign entity, there are typically no assets to be seized or cash flows to be attached. Furthermore, the willingness or ability of a foreign government to renegotiate defaulted debt may be limited.
9 Fair Value Measurements
Under generally accepted accounting principles for fair value measurements, a three-tier hierarchy to prioritize the assumptions, referred to as inputs, is used in valuation techniques to measure fair value. The three-tier hierarchy of inputs is summarized in the three broad levels listed below.
| • | | Level 1 – quoted prices in active markets for identical investments |
| • | | Level 2 – other significant observable inputs (including quoted prices for similar investments, interest rates, prepayment speeds, credit risk, etc.) |
| • | | Level 3 – significant unobservable inputs (including a fund’s own assumptions in determining the fair value of investments) |
In cases where the inputs used to measure fair value fall in different levels of the fair value hierarchy, the level disclosed is determined based on the lowest level input that is significant to the fair value measurement in its entirety. The inputs or methodology used for valuing securities are not necessarily an indication of the risk associated with investing in those securities.
At October 31, 2016, the hierarchy of inputs used in valuing the Fund’s investments and open derivative instruments, which are carried at value, were as follows:
| | | | | | | | | | | | | | | | |
| Asset Description | | Level 1 | | | Level 2 | | | Level 3* | | | Total | |
| | | | |
Senior Floating-Rate Loans (Less Unfunded Loan Commitments) | | $ | — | | | $ | 142,731,920 | | | $ | 75,462 | | | $ | 142,807,382 | |
Collateralized Mortgage Obligations | | | — | | | | 71,029,749 | | | | — | | | | 71,029,749 | |
Commercial Mortgage-Backed Securities | | | — | | | | 19,992,626 | | | | — | | | | 19,992,626 | |
Mortgage Pass-Throughs | | | — | | | | 38,705,915 | | | | — | | | | 38,705,915 | |
Asset-Backed Securities | | | — | | | | 2,788,343 | | | | — | | | | 2,788,343 | |
U.S. Government Agency Obligations | | | — | | | | 1,604,670 | | | | — | | | | 1,604,670 | |
Corporate Bonds & Notes | | | — | | | | 36,985,569 | | | | — | | | | 36,985,569 | |
Foreign Government Bonds | | | — | | | | 23,093,101 | | | | — | | | | 23,093,101 | |
Common Stocks | | | — | | | | 19,442 | | | | 1,501,794 | | | | 1,521,236 | |
Convertible Preferred Stocks | | | — | | | | — | | | | 298 | | | | 298 | |
Currency Options Purchased | | | — | | | | 17,578 | | | | — | | | | 17,578 | |
Short-Term Investments — | | | | | | | | | | | | | | | | |
Foreign Government Securities | | | — | | | | 14,747,909 | | | | — | | | | 14,747,909 | |
U.S. Treasury Obligations | | | — | | | | 2,999,668 | | | | — | | | | 2,999,668 | |
Other | | | — | | | | 13,264,165 | | | | — | | | | 13,264,165 | |
| | | | |
Total Investments | | $ | — | | | $ | 367,980,655 | | | $ | 1,577,554 | | | $ | 369,558,209 | |
| | | | |
Forward Foreign Currency Exchange Contracts | | $ | — | | | $ | 1,989,988 | | | $ | — | | | $ | 1,989,988 | |
Swap Contracts | | | — | | | | 27,279 | | | | — | | | | 27,279 | |
| | | | |
Total | | $ | — | | | $ | 369,997,922 | | | $ | 1,577,554 | | | $ | 371,575,476 | |
| | | | |
Liability Description | | | | | | | | | | | | | | | | |
| | | | |
Currency Options Written | | $ | — | | | $ | (17,578 | ) | | $ | — | | | $ | (17,578 | ) |
Forward Foreign Currency Exchange Contracts | | | — | | | | (2,289,878 | ) | | | — | | | | (2,289,878 | ) |
| | | | |
Total | | $ | — | | | $ | (2,307,456 | ) | | $ | — | | | $ | (2,307,456 | ) |
| * | None of the unobservable inputs for Level 3 assets, individually or collectively, had a material impact on the Fund. |
Level 3 investments at the beginning and/or end of the period in relation to net assets were not significant and accordingly, a reconciliation of Level 3 assets for the year ended October 31, 2016 is not presented. At October 31, 2016, there were no investments transferred between Level 1 and Level 2 during the year then ended.
Eaton Vance
Short Duration Diversified Income Fund
October 31, 2016
Notes to Financial Statements — continued
10 Legal Proceedings
In May 2015, the Fund was served with an amended complaint filed in an adversary proceeding in the United States Bankruptcy Court for the Southern District of New York. The adversary proceeding was filed by the Motors Liquidation Company Avoidance Action Trust (“AAT”) against the former holders of a $1.5 billion term loan issued by General Motors Corp. (“GM”) in 2006 (the “Term Loan Lenders”) who received a full repayment of the term loan pursuant to a court order in the GM bankruptcy proceeding. The court order was made with the understanding that the term loan was fully secured at the time of GM’s bankruptcy filing in June 2009. The AAT is seeking (1) a determination from the Bankruptcy Court that the security interest held by the Term Loan Lenders was not perfected at the time GM filed for Chapter 11 Bankruptcy protection and thus the Term Loan Lenders should have been treated in the same manner as GM’s unsecured creditors, (2) disgorgement of any interest payments made to the Term Loan Lenders within ninety days of GM’s filing for Chapter 11 Bankruptcy protection, and (3) disgorgement of the $1.5 billion term loan repayment that was made to the Term Loan Lenders. The value of the payment received under the term loan agreement by the Fund is approximately $932,000 (equal to 0.35% of net assets at October 31, 2016). The Fund cannot predict the outcome of these proceedings or the effect, if any, on the Fund’s net asset value. The attorneys’ fees and costs related to these actions are expensed by the Fund as incurred.
Eaton Vance
Short Duration Diversified Income Fund
October 31, 2016
Report of Independent Registered Public Accounting Firm
To the Trustees and Shareholders of Eaton Vance Short Duration Diversified Income Fund:
We have audited the accompanying statement of assets and liabilities of Eaton Vance Short Duration Diversified Income Fund (the “Fund”), including the portfolio of investments, as of October 31, 2016, and the related statements of operations and cash flows for the year then ended, the statements of changes in net assets for each of the two years in the period then ended, and the financial highlights for each of the five years in the period then ended. These financial statements and financial highlights are the responsibility of the Fund’s management. Our responsibility is to express an opinion on these financial statements and financial highlights based on our audits.
We conducted our audits in accordance with the standards of the Public Company Accounting Oversight Board (United States). Those standards require that we plan and perform the audit to obtain reasonable assurance about whether the financial statements and financial highlights are free of material misstatement. The Fund is not required to have, nor were we engaged to perform, an audit of its internal control over financial reporting. Our audits included consideration of internal control over financial reporting as a basis for designing audit procedures that are appropriate in the circumstances, but not for the purpose of expressing an opinion on the effectiveness of the Fund’s internal control over financial reporting. Accordingly, we express no such opinion. An audit also includes examining, on a test basis, evidence supporting the amounts and disclosures in the financial statements, assessing the accounting principles used and significant estimates made by management, as well as evaluating the overall financial statement presentation. Our procedures included confirmation of securities and senior loans owned as of October 31, 2016, by correspondence with the custodian, brokers and selling or agent banks; where replies were not received from brokers and selling or agent banks, we performed other auditing procedures. We believe that our audits provide a reasonable basis for our opinion.
In our opinion, such financial statements and financial highlights referred to above present fairly, in all material respects, the financial position of Eaton Vance Short Duration Diversified Income Fund as of October 31, 2016, the results of its operations and its cash flows for the year then ended, the changes in its net assets for each of the two years in the period then ended, and the financial highlights for each of the five years in the period then ended, in conformity with accounting principles generally accepted in the United States of America.
DELOITTE & TOUCHE LLP
Boston, Massachusetts
December 16, 2016
Eaton Vance
Short Duration Diversified Income Fund
October 31, 2016
Federal Tax Information (Unaudited)
The Form 1099-DIV you receive in February 2017 will show the tax status of all distributions paid to your account in calendar year 2016. Shareholders are advised to consult their own tax adviser with respect to the tax consequences of their investment in the Fund.
Eaton Vance
Short Duration Diversified Income Fund
October 31, 2016
Notice to Shareholders (Unaudited)
The Fund invests at least 25% of its net assets in each of the following three investment categories:
| • | | senior, secured floating rate loans made to corporate and other business entities, which are typically rated below investment grade (“Senior Loans”); |
| • | | bank deposits denominated in foreign currencies, debt obligations of foreign governmental and corporate issuers, including emerging market issuers, which are denominated in foreign currencies or U.S. dollars, and positions in foreign currencies (“Foreign Obligations”); and |
| • | | mortgage-backed securities that are issued, backed or otherwise guaranteed by the U.S. Government or its agencies or instrumentalities or that are issued by private issuers. |
The Fund is required to maintain (i) a weighted average portfolio credit quality of investment grade, which is at least BBB- as determined by Standard & Poor’s Ratings Services or Fitch Ratings Inc., or Baa3 as determined by Moody’s Investors Service, Inc. or, if unrated, determined to be of comparable quality by the adviser (“Average Investment Grade Policy”) and (ii) a duration of no more than three years, including the effect of leverage (“Duration Policy”).
The Fund has modified its investment policy to allow for investment within its Senior Loans’ category in U.S. corporate debt obligations rated below investment grade (“U.S. High Yield Bonds”), commonly referred to as “junk” bonds. The ability to invest in U.S. High Yield Bonds provides the Fund with additional flexibility in seeking its objective. There will be no change to either the Fund’s Average Investment Grade Policy or its Duration Policy.
The Fund may obtain investment exposures through long or short positions in derivative instruments, including derivatives with U.S. High Yield Bonds as reference instruments (such as credit default swap indices), and through investment in other investment companies. At least 80% of the Fund’s total leveraged assets will continue to be invested in its three principal investment categories as modified collectively, including through the use of derivatives; and the Fund’s exposure to each of these categories will equal at least 25% of the Fund’s net assets, including through the use of derivatives. Outside of the three investment categories, the Fund may invest in investment grade bonds, including corporate bonds, asset-backed securities and commercial mortgage-backed securities, and other permitted investments.
Eaton Vance
Short Duration Diversified Income Fund
October 31, 2016
Dividend Reinvestment Plan
The Fund offers a dividend reinvestment plan (Plan) pursuant to which shareholders may elect to have distributions automatically reinvested in common shares (Shares) of the Fund. You may elect to participate in the Plan by completing the Dividend Reinvestment Plan Application Form. If you do not participate, you will receive all distributions in cash paid by check mailed directly to you by American Stock Transfer & Trust Company, LLC (AST) as dividend paying agent. On the distribution payment date, if the NAV per Share is equal to or less than the market price per Share plus estimated brokerage commissions, then new Shares will be issued. The number of Shares shall be determined by the greater of the NAV per Share or 95% of the market price. Otherwise, Shares generally will be purchased on the open market by AST, the Plan agent (Agent). Distributions subject to income tax (if any) are taxable whether or not Shares are reinvested.
If your Shares are in the name of a brokerage firm, bank, or other nominee, you can ask the firm or nominee to participate in the Plan on your behalf. If the nominee does not offer the Plan, you will need to request that the Fund’s transfer agent re-register your Shares in your name or you will not be able to participate.
The Agent’s service fee for handling distributions will be paid by the Fund. Plan participants will be charged their pro rata share of brokerage commissions on all open-market purchases.
Plan participants may withdraw from the Plan at any time by writing to the Agent at the address noted on the following page. If you withdraw, you will receive Shares in your name for all Shares credited to your account under the Plan. If a participant elects by written notice to the Agent to sell part or all of his or her Shares and remit the proceeds, the Agent is authorized to deduct a $5.00 fee plus brokerage commissions from the proceeds.
If you wish to participate in the Plan and your Shares are held in your own name, you may complete the form on the following page and deliver it to the Agent. Any inquiries regarding the Plan can be directed to the Agent at 1-866-439-6787.
Eaton Vance
Short Duration Diversified Income Fund
October 31, 2016
Application for Participation in Dividend Reinvestment Plan
This form is for shareholders who hold their common shares in their own names. If your common shares are held in the name of a brokerage firm, bank, or other nominee, you should contact your nominee to see if it will participate in the Plan on your behalf. If you wish to participate in the Plan, but your brokerage firm, bank, or nominee is unable to participate on your behalf, you should request that your common shares be re-registered in your own name which will enable your participation in the Plan.
The following authorization and appointment is given with the understanding that I may terminate it at any time by terminating my participation in the Plan as provided in the terms and conditions of the Plan.
Please print exact name on account
Shareholder signature Date
Shareholder signature Date
Please sign exactly as your common shares are registered. All persons whose names appear on the share certificate must sign.
YOU SHOULD NOT RETURN THIS FORM IF YOU WISH TO RECEIVE YOUR DISTRIBUTIONS IN CASH. THIS IS NOT A PROXY.
This authorization form, when signed, should be mailed to the following address:
Eaton Vance Short Duration Diversified Income Fund
c/o American Stock Transfer & Trust Company, LLC
P.O. Box 922
Wall Street Station
New York, NY 10269-0560
Number of Employees
The Fund is organized as a Massachusetts business trust and is registered under the Investment Company Act of 1940, as amended, as a closed-end management investment company and has no employees.
Number of Shareholders
As of October 31, 2016, Fund records indicate that there are 8 registered shareholders and approximately 8,722 shareholders owning the Fund shares in street name, such as through brokers, banks, and financial intermediaries.
If you are a street name shareholder and wish to receive Fund reports directly, which contain important information about the Fund, please write or call:
Eaton Vance Distributors, Inc.
Two International Place
Boston, MA 02110
1-800-262-1122
New York Stock Exchange symbol
The New York Stock Exchange symbol is EVG.
Eaton Vance
Short Duration Diversified Income Fund
October 31, 2016
Management and Organization
Fund Management. The Trustees of Eaton Vance Short Duration Diversified Income Fund (the Fund) are responsible for the overall management and supervision of the Fund’s affairs. The Trustees and officers of the Fund are listed below. Except as indicated, each individual has held the office shown or other offices in the same company for the last five years. The “Noninterested Trustees” consist of those Trustees who are not “interested persons” of the Fund, as that term is defined under the 1940 Act. The business address of each Trustee and officer is Two International Place, Boston, Massachusetts 02110. As used below, “EVC” refers to Eaton Vance Corp., “EV” refers to Eaton Vance, Inc., “EVM” refers to Eaton Vance Management, “BMR” refers to Boston Management and Research, “EVMI” refers to Eaton Vance Management (International) Limited and “EVD” refers to Eaton Vance Distributors, Inc. EVC and EV are the corporate parent and trustee, respectively, of EVM and BMR. EVMI is an indirect, wholly-owned subsidiary of EVC. EVD is a wholly-owned subsidiary of EVC. Each officer affiliated with Eaton Vance may hold a position with other Eaton Vance affiliates that is comparable to his or her position with EVM listed below. Each Trustee oversees 176 portfolios in the Eaton Vance Complex (including all master and feeder funds in a master feeder structure). Each officer serves as an officer of certain other Eaton Vance funds. Each Trustee serves for a three year term. Each officer serves until his or her successor is elected.
| | | | | | |
| Name and Year of Birth | | Position(s) with the Fund | | Term Expiring; Trustee Since(1) | | Principal Occupation(s) and Directorships During Past Five Years and Other Relevant Experience |
Interested Trustee | | | | | | |
| | | |
Thomas E. Faust Jr. 1958 | | Class I Trustee | | Until 2018. Trustee since 2007. | | Chairman, Chief Executive Officer and President of EVC, Director and President of EV, Chief Executive Officer and President of EVM and BMR, and Director of EVD and EVMI. Trustee and/or officer of 176 registered investment companies. Mr. Faust is an interested person because of his positions with EVM, BMR, EVD, EVMI, EVC and EV, which are affiliates of the Fund. Directorships in the Last Five Years.(2) Director of EVC and Hexavest Inc. (investment management firm). |
| | | |
| | | | | | |
Noninterested Trustees |
| | | |
Scott E. Eston 1956 | | Class I Trustee | | Until 2018. Trustee since 2011. | | Private investor. Formerly held various positions at Grantham, Mayo, Van Otterloo and Co., LLC (investment management firm) (1997-2009), including Chief Operating Officer (2002-2009), Chief Financial Officer (1997-2009) and Chairman of the Executive Committee (2002-2008); President and Principal Executive Officer, GMO Trust (open-end registered investment company) (2006-2009). Former Partner, Coopers and Lybrand LLP (now PricewaterhouseCoopers) (a registered public accounting firm) (1987-1997). Mr. Eston has apprised the Board of Trustees that he intends to retire as a Trustee of all Eaton Vance funds effective September 30, 2017. Directorships in the Last Five Years.(2) None. |
| | | |
Mark R. Fetting(3) 1954 | | Class III Trustee | | Until 2017. Trustee since 2016. | | Private investor. Formerly held various positions at Legg Mason, Inc. (investment management firm) (2000-2012), including President, Chief Executive Officer, Director and Chairman (2008-2012), Senior Executive Vice President (2004-2008) and Executive Vice President (2001-2004). Formerly, President of Legg Mason family of funds (2001-2008). Formerly, Division President and Senior Officer of Prudential Financial Group, Inc. and related companies (investment management firm) (1991-2000). Directorships in the Last Five Years. Formerly, Director and Chairman of Legg Mason, Inc. (2008-2012); Director/Trustee and Chairman of Legg Mason family of funds (14 funds) (2008-2012); and Director/Trustee of the Royce family of funds (35 funds) (2001-2012). |
| | | |
Cynthia E. Frost 1961 | | Class I Trustee | | Until 2018. Trustee since 2014. | | Private investor. Formerly, Chief Investment Officer of Brown University (university endowment) (2000-2012); Portfolio Strategist for Duke Management Company (university endowment manager) (1995-2000); Managing Director, Cambridge Associates (investment consulting company) (1989-1995); Consultant, Bain and Company (management consulting firm) (1987-1989); Senior Equity Analyst, BA Investment Management Company (1983-1985). Directorships in the Last Five Years. None. |
| | | |
George J. Gorman 1952 | | Class II Trustee | | Until 2019. Trustee since 2014. | | Principal at George J. Gorman LLC (consulting firm). Formerly, Senior Partner at Ernst & Young LLP (a registered public accounting firm) (1974-2009). Directorships in the Last Five Years. Formerly, Trustee of the BofA Funds Series Trust (11 funds) (2011-2014) and of the Ashmore Funds (9 funds) (2010-2014). |
Eaton Vance
Short Duration Diversified Income Fund
October 31, 2016
Management and Organization — continued
| | | | | | |
| Name and Year of Birth | | Position(s) with the Fund | | Term Expiring; Trustee Since(1) | | Principal Occupation(s) and Directorships During Past Five Years and Other Relevant Experience |
Noninterested Trustees (continued) | | |
| | | |
Valerie A. Mosley 1960 | | Class III Trustee | | Until 2017. Trustee since 2014. | | Chairwoman and Chief Executive Officer of Valmo Ventures (a consulting and investment firm). Former Partner and Senior Vice President, Portfolio Manager and Investment Strategist at Wellington Management Company, LLP (investment management firm) (1992-2012). Former Chief Investment Officer, PG Corbin Asset Management (1990-1992). Formerly worked in institutional corporate bond sales at Kidder Peabody (1986-1990). Directorships in the Last Five Years.(2) Director of Dynex Capital, Inc. (mortgage REIT) (since 2013). |
| | | |
William H. Park 1947 | | Chairperson of the Board and Class II Trustee | | Until 2019. Chairperson of the Board since 2016 and Trustee since 2003. | | Private investor. Formerly, Consultant (management and transactional) (2012-2014). Formerly, Chief Financial Officer, Aveon Group L.P. (investment management firm) (2010-2011). Formerly, Vice Chairman, Commercial Industrial Finance Corp. (specialty finance company) (2006-2010). Formerly, President and Chief Executive Officer, Prizm Capital Management, LLC (investment management firm) (2002-2005). Formerly, Executive Vice President and Chief Financial Officer, United Asset Management Corporation (investment management firm) (1982-2001). Formerly, Senior Manager, Price Waterhouse (now PricewaterhouseCoopers) (a registered public accounting firm) (1972-1981). Directorships in the Last Five Years.(2) None. |
| | | |
Helen Frame Peters 1948 | | Class III Trustee | | Until 2017. Trustee since 2008. | | Professor of Finance, Carroll School of Management, Boston College. Formerly, Dean, Carroll School of Management, Boston College (2000-2002). Formerly, Chief Investment Officer, Fixed Income, Scudder Kemper Investments (investment management firm) (1998-1999). Formerly, Chief Investment Officer, Equity and Fixed Income, Colonial Management Associates (investment management firm) (1991-1998). Directorships in the Last Five Years.(2) Formerly, Director of BJ’s Wholesale Club, Inc. (wholesale club retailer) (2004-2011). Formerly, Trustee of SPDR Index Shares Funds and SPDR Series Trust (exchange traded funds) (2000-2009). Formerly, Director of Federal Home Loan Bank of Boston (a bank for banks) (2007-2009). |
| | | |
Susan J. Sutherland 1957 | | Class II Trustee | | Until 2019. Trustee since 2015. | | Private investor. Formerly, Associate, Counsel and Partner at Skadden, Arps, Slate, Meagher & Flom LLP (law firm) (1982-2013). Directorships in the Last Five Years. Formerly, Director of Montpelier Re Holdings Ltd. (global provider of customized insurance and reinsurance products) (2013-2015). |
| | | |
Harriett Tee Taggart 1948 | | Class II Trustee | | Until 2019. Trustee since 2011. | | Managing Director, Taggart Associates (a professional practice firm). Formerly, Partner and Senior Vice President, Wellington Management Company, LLP (investment management firm) (1983-2006). Directorships in the Last Five Years.(2) Director of Albemarle Corporation (chemicals manufacturer) (since 2007) and The Hanover Group (specialty property and casualty insurance company) (since 2009). Formerly, Director of Lubrizol Corporation (specialty chemicals) (2007-2011). |
| | | |
Ralph F. Verni 1943 | | Class III Trustee | | Until 2017. Trustee since 2005. | | Consultant and private investor. Formerly, Chief Investment Officer (1982-1992), Chief Financial Officer (1988-1990) and Director (1982-1992), New England Life. Formerly, Chairperson, New England Mutual Funds (1982-1992). Formerly, President and Chief Executive Officer, State Street Management & Research (1992-2000). Formerly, Chairperson, State Street Research Mutual Funds (1992-2000). Formerly, Director, W.P. Carey, LLC (1998-2004) and First Pioneer Farm Credit Corp. (financial services cooperative) (2002-2006). Consistent with the Trustee retirement policy, Mr. Verni is currently expected to retire as a Trustee of all Eaton Vance funds effective July 1, 2017. Directorships in the Last Five Years.(2) None. |
Eaton Vance
Short Duration Diversified Income Fund
October 31, 2016
Management and Organization — continued
| | | | | | |
| Name and Year of Birth | | Position(s) with the Fund | | Term Expiring; Trustee Since(1) | | Principal Occupation(s) and Directorships During Past Five Years and Other Relevant Experience |
Noninterested Trustees (continued) | | |
| | | |
Scott E. Wennerholm(3) 1959 | | Class I Trustee | | Until 2018. Trustee since 2016. | | Consultant at GF Parish Group (executive recruiting firm). Trustee at Wheelock College (postsecondary institution) (since 2012). Formerly, Chief Operating Officer and Executive Vice President at BNY Mellon Asset Management (investment management firm) (2005-2011). Formerly, Chief Operating Officer and Chief Financial Officer at Natixis Global Asset Management (investment management firm) (1997-2004). Formerly, Vice President at Fidelity Investments Institutional Services (investment management firm) (1994-1997). Directorships in the Last Five Years. None. |
| | | |
| | | | | | |
Principal Officers who are not Trustees |
| Name and Year of Birth | | Position(s) with the Fund | | Officer Since(4) | | Principal Occupation(s) During Past Five Years |
| | | |
Payson F. Swaffield 1956 | | President | | 2003 | | Vice President and Chief Income Investment Officer of EVM and BMR. |
| | | |
Maureen A. Gemma 1960 | | Vice President, Secretary and Chief Legal Officer | | 2005 | | Vice President of EVM and BMR. |
| | | |
James F. Kirchner 1967 | | Treasurer | | 2007 | | Vice President of EVM and BMR. |
| | | |
Paul M. O’Neil 1953 | | Chief Compliance Officer | | 2004 | | Vice President of EVM and BMR. |
| (1) | Year first appointed to serve as Trustee for a fund in the Eaton Vance family of funds. Each Trustee has served continuously since appointment unless indicated otherwise. Each Trustee holds office until the annual meeting for the year in which his or her term expires and until his or her successor is elected and qualified, subject to a prior death, resignation, retirement, disqualification or removal. |
| (2) | During their respective tenures, the Trustees (except for Mmes. Frost and Sutherland and Messrs. Fetting, Gorman and Wennerholm) also served as Board members of one or more of the following funds (which operated in the years noted): eUnitsTM 2 Year U.S. Market Participation Trust: Upside to Cap / Buffered Downside (launched in 2012 and terminated in 2014); eUnitsTM 2 Year U.S. Market Participation Trust II: Upside to Cap / Buffered Downside (launched in 2012 and terminated in 2014); and Eaton Vance National Municipal Income Trust (launched in 1998 and terminated in 2009). However, Ms. Mosley did not serve as a Board member of eUnitsTM 2 Year U.S. Market Participation Trust: Upside to Cap / Buffered Downside (launched in 2012 and terminated in 2014). |
| (3) | Messrs. Fetting and Wennerholm began serving as Trustees effective September 1, 2016. |
| (4) | Year first elected to serve as officer of a fund in the Eaton Vance family of funds when the officer has served continuously. Otherwise, year of most recent election as an officer of a fund in the Eaton Vance family of funds. Titles may have changed since initial election. |
Eaton Vance Funds
IMPORTANT NOTICES
Privacy. The Eaton Vance organization is committed to ensuring your financial privacy. Each of the financial institutions identified below has in effect the following policy (“Privacy Policy”) with respect to nonpublic personal information about its customers:
| • | | Only such information received from you, through application forms or otherwise, and information about your Eaton Vance fund transactions will be collected. This may include information such as name, address, social security number, tax status, account balances and transactions. |
| • | | None of such information about you (or former customers) will be disclosed to anyone, except as permitted by law (which includes disclosure to employees necessary to service your account). In the normal course of servicing a customer’s account, Eaton Vance may share information with unaffiliated third parties that perform various required services such as transfer agents, custodians and broker-dealers. |
| • | | Policies and procedures (including physical, electronic and procedural safeguards) are in place that are designed to protect the confidentiality of such information. |
| • | | We reserve the right to change our Privacy Policy at any time upon proper notification to you. Customers may want to review our Privacy Policy periodically for changes by accessing the link on our homepage: www.eatonvance.com. |
Our pledge of privacy applies to the following entities within the Eaton Vance organization: the Eaton Vance Family of Funds, Eaton Vance Management, Eaton Vance Investment Counsel, Eaton Vance Distributors, Inc., Eaton Vance Trust Company, Eaton Vance Management (International) Limited, Eaton Vance Management’s Real Estate Investment Group and Boston Management and Research. In addition, our Privacy Policy applies only to those Eaton Vance customers who are individuals and who have a direct relationship with us. If a customer’s account (i.e., fund shares) is held in the name of a third-party financial advisor/broker-dealer, it is likely that only such advisor’s privacy policies apply to the customer. This notice supersedes all previously issued privacy disclosures. For more information about Eaton Vance’s Privacy Policy, please call 1-800-262-1122.
Delivery of Shareholder Documents. The Securities and Exchange Commission (SEC) permits funds to deliver only one copy of shareholder documents, including prospectuses, proxy statements and shareholder reports, to fund investors with multiple accounts at the same residential or post office box address. This practice is often called “householding” and it helps eliminate duplicate mailings to shareholders. American Stock Transfer and Trust Company, LLC (“AST”), the closed-end funds transfer agent, or your financial advisor, may household the mailing of your documents indefinitely unless you instruct AST, or your financial advisor, otherwise. If you would prefer that your Eaton Vance documents not be householded, please contact AST or your financial advisor. Your instructions that householding not apply to delivery of your Eaton Vance documents will typically be effective within 30 days of receipt by AST or your financial advisor.
Portfolio Holdings. Each Eaton Vance Fund and its underlying Portfolio(s) (if applicable) will file a schedule of portfolio holdings on Form N-Q with the SEC for the first and third quarters of each fiscal year. The Form N-Q will be available on the Eaton Vance website at www.eatonvance.com, by calling Eaton Vance at 1-800-262-1122 or in the EDGAR database on the SEC’s website at www.sec.gov. Form N-Q may also be reviewed and copied at the SEC’s public reference room in Washington, D.C. (call 1-800-732-0330 for information on the operation of the public reference room).
Proxy Voting. From time to time, funds are required to vote proxies related to the securities held by the funds. The Eaton Vance Funds or their underlying Portfolios (if applicable) vote proxies according to a set of policies and procedures approved by the Funds’ and Portfolios’ Boards. You may obtain a description of these policies and procedures and information on how the Funds or Portfolios voted proxies relating to portfolio securities during the most recent 12-month period ended June 30, without charge, upon request, by calling 1-800-262-1122 and by accessing the SEC’s website at www.sec.gov.
Share Repurchase Program. The Fund’s Board of Trustees has approved a share repurchase program authorizing the Fund to repurchase up to 10% of its outstanding common shares as of the approved date in open-market transactions at a discount to net asset value. The repurchase program does not obligate the Fund to purchase a specific amount of shares. The Fund’s repurchase activity, including the number of shares purchased, average price and average discount to net asset value, is disclosed in the Fund’s annual and semi-annual reports to shareholders.
Additional Notice to Shareholders. If applicable, a Fund may also redeem or purchase its outstanding preferred shares in order to maintain compliance with regulatory requirements, borrowing or rating agency requirements or for other purposes as it deems appropriate or necessary.
Closed-End Fund Information. Eaton Vance closed-end funds make fund performance data and certain information about portfolio characteristics available on the Eaton Vance website shortly after the end of each month. Other information about the funds is available on the website. The funds’ net asset value per share is readily accessible on the Eaton Vance website. Portfolio holdings for the most recent month-end are also posted to the website approximately 30 days following the end of the month. This information is available at www.eatonvance.com on the fund information pages under “Individual Investors — Closed-End Funds”.
This Page Intentionally Left Blank
This Page Intentionally Left Blank
This Page Intentionally Left Blank
Investment Adviser and Administrator
Eaton Vance Management
Two International Place
Boston, MA 02110
Custodian
State Street Bank and Trust Company
State Street Financial Center, One Lincoln Street
Boston, MA 02111
Transfer Agent
American Stock Transfer & Trust Company, LLC
6201 15th Avenue
Brooklyn, NY 11219
Independent Registered Public Accounting Firm
Deloitte & Touche LLP
200 Berkeley Street
Boston, MA 02116-5022
Fund Offices
Two International Place
Boston, MA 02110
2319 10.31.16
Item 2. Code of Ethics
The registrant has adopted a code of ethics applicable to its Principal Executive Officer, Principal Financial Officer and Principal Accounting Officer. The registrant undertakes to provide a copy of such code of ethics to any person upon request, without charge, by calling 1-800-262-1122. The registrant has not amended the code of ethics as described in Form N-CSR during the period covered by this report. The registrant has not granted any waiver, including an implicit waiver, from a provision of the code of ethics as described in Form N-CSR during the period covered by this report.
Item 3. Audit Committee Financial Expert
The registrant’s Board has designated William H. Park, an independent trustee, as its audit committee financial expert. Mr. Park is a certified public accountant who is a private investor. Previously, he served as a consultant, as the Chief Financial Officer of Aveon Group, L.P. (an investment management firm), as the Vice Chairman of Commercial Industrial Finance Corp. (specialty finance company), as President and Chief Executive Officer of Prizm Capital Management, LLC (investment management firm), as Executive Vice President and Chief Financial Officer of United Asset Management Corporation (an institutional investment management firm) and as a Senior Manager at Price Waterhouse (now PricewaterhouseCoopers) (an independent registered public accounting firm).
Item 4. Principal Accountant Fees and Services
Rule 2-01(c)(1)(ii)(A) of Regulation S-X (the “Loan Rule”) prohibits an accounting firm, such as the Fund’s principal accountant, Deloitte & Touche LLP (“D&T”), from having certain financial relationships with their audit clients and affiliated entities. Specifically, the Loan Rule provides, in relevant part, that an accounting firm generally would not be independent if it receives a loan from a lender that is a “record or beneficial owner of more than ten percent of the audit client’s equity securities.” Based on information provided to the Audit Committee of the Board of Trustees (the “Audit Committee”) of the Eaton Vance family of funds by D&T, certain relationships between D&T and its affiliates (“Deloitte Entities”) and its lenders who are record owners of shares of one or more funds within the Eaton Vance family of funds (the “Funds”) implicate the Loan Rule, calling into question D&T’s independence with respect to the Funds. The Funds are providing this disclosure to explain the facts and circumstances as well as D&T’s conclusions concerning D&T’s objectivity and impartiality with respect to the audits of the Funds.
D&T advised the Audit Committee of its conclusion that, in light of the facts surrounding its lending relationships, D&T’s objectivity and impartiality in the planning and conduct of the audits of the Funds financial statements will not be compromised, D&T is in a position to continue as the auditor for the Funds and no actions need to be taken with respect to previously issued reports by D&T. D&T has advised the Audit Committee that these conclusions were based in part on the following considerations: (1) Deloitte Entity personnel responsible for managing the lending relationships have had no interactions with the audit engagement team; (2) the lending relationships are in good standing and the principal and interest payments are up-to-date; (3) the lending relationships are not significant to the Deloitte Entities or to D&T.
On June 20, 2016, the U.S. Securities and Exchange Commission (the “SEC”) issued no-action relief to another mutual fund complex (see Fidelity Management & Research Company et al., No-Action Letter (June 20, 2016) (the “No-Action Letter”)) related to the auditor independence issue described above. In the No-Action Letter, the SEC indicated that it would not recommend enforcement action against the fund group if the auditor is not in compliance with the Loan Rule provided that: (1) the auditor has complied with PCAOB Rule 3526(b)(1) and 3526(b)(2); (2) the auditor’s non-compliance under the Loan Rule is with respect to certain lending relationships; and (3) notwithstanding such non-compliance, the auditor has concluded that it is objective and impartial with respect to the issues encompassed within its engagement as auditor of the funds. Based on information provided by D&T, the requirements of the No-Action Letter appear to be met with respect to D&T’s lending relationships described above. After giving consideration to the guidance provided in the No-Action Letter, D&T affirmed to the Audit Committee that D&T is an independent accountant with respect to the Funds within the meaning of the rules and standards of the PCAOB and the securities laws and regulations administered by the SEC. The SEC has indicated that the no-action relief will expire 18 months from its issuance.
(a) –(d)
The following table presents the aggregate fees billed to the registrant for the registrant’s fiscal years ended October 31, 2015 and October 31, 2016 by D&T for professional services rendered for the audit of the registrant’s annual financial statements and fees billed for other services rendered by D&T during such periods.
| | | | | | | | |
Fiscal Years Ended | | 10/31/15 | | | 10/31/16 | |
Audit Fees | | $ | 111,874 | | | $ | 104,350 | |
Audit-Related Fees(1) | | $ | 0 | | | $ | 0 | |
Tax Fees(2) | | $ | 34,799 | | | $ | 33,715 | |
All Other Fees(3) | | $ | 0 | | | $ | 0 | |
| | | | | | | | |
Total | | $ | 146,673 | | | $ | 138,065 | |
| | | | | | | | |
| (1) | Audit-related fees consist of the aggregate fees billed for assurance and related services that are reasonably related to the performance of the audit of the registrant’s financial statements and are not reported under the category of audit fees. |
| (2) | Tax fees consist of the aggregate fees billed for professional services rendered by the principal accountant relating to tax compliance, tax advice, and tax planning and specifically include fees for tax return preparation and other related tax compliance/planning matters. |
| (3) | All other fees consist of the aggregate fees billed for products and services provided by the principal accountant other than audit, audit-related, and tax services. |
(e)(1) The registrant’s audit committee has adopted policies and procedures relating to the pre-approval of services provided by the registrant’s principal accountant (the “Pre-Approval Policies”). The Pre-Approval Policies establish a framework intended to assist the audit committee in the proper discharge of its pre-approval responsibilities. As a general matter, the Pre-Approval Policies (i) specify certain types of audit, audit-related, tax, and other services determined to be pre-approved by the audit committee; and (ii) delineate specific procedures governing the mechanics of the pre-approval process, including the approval and monitoring of audit and non-audit service fees. Unless a service is specifically pre-approved under the Pre-Approval Policies, it must be separately pre-approved by the audit committee.
The Pre-Approval Policies and the types of audit and non-audit services pre-approved therein must be reviewed and ratified by the registrant’s audit committee at least annually. The registrant’s audit committee maintains full responsibility for the appointment, compensation, and oversight of the work of the registrant’s principal accountant.
(e)(2) No services described in paragraphs (b)-(d) above were approved by the registrant’s audit committee pursuant to the “de minimis exception” set forth in Rule 2-01 (c)(7)(i)(C) of Regulation S-X.
(f) Not applicable.
(g) The following table presents (i) the aggregate non-audit fees (i.e., fees for audit-related, tax, and other services) billed to the registrant by D&T for the registrant’s fiscal years ended October 31, 2015 and October 31, 2016; and (ii) the aggregate non-audit fees (i.e., fees for audit-related, tax, and other services) billed to the Eaton Vance organization by D&T for the same time periods.
| | | | | | | | |
Fiscal Years Ended | | 10/31/15 | | | 10/31/16 | |
Registrant | | $ | 34,799 | | | $ | 33,715 | |
Eaton Vance(1) | | $ | 46,000 | | | $ | 56,434 | |
| (1) | The investment adviser to the registrant, as well as any of its affiliates that provide ongoing services to the registrant, are subsidiaries of Eaton Vance Corp. |
(h) The registrant’s audit committee has considered whether the provision by the registrant’s principal accountant of non-audit services to the registrant’s investment adviser and any entity controlling, controlled by,
or under common control with the adviser that provides ongoing services to the registrant that were not pre-approved pursuant to Rule 2-01(c)(7)(ii) of Regulation S-X is compatible with maintaining the principal accountant’s independence.
Item 5. Audit Committee of Listed Registrants
The registrant has a separately-designated standing audit committee established in accordance with Section 3(a)(58)(A) of the Securities and Exchange Act of 1934, as amended. Ralph F. Verni (Chair), Scott E. Eston, George J. Gorman, William H. Park and Scott E. Wennerholm are the members of the registrant’s audit committee.
Item 6. Schedule of Investments
Please see schedule of investments contained in the Report to Stockholders included under Item 1 of this Form N-CSR.
Item 7. Disclosure of Proxy Voting Policies and Procedures for Closed-End Management Investment Companies
The Board of Trustees of the Trust has adopted a proxy voting policy and procedure (the “Fund Policy”), pursuant to which the Trustees have delegated proxy voting responsibility to the Fund’s investment adviser and adopted the investment adviser’s proxy voting policies and procedures (the “Policies”) which are described below. The Trustees will review the Fund’s proxy voting records from time to time and will annually consider approving the Policies for the upcoming year. In the event that a conflict of interest arises between the Fund’s shareholders and the investment adviser, the administrator, or any of their affiliates or any affiliate of the Fund, the investment adviser will generally refrain from voting the proxies related to the companies giving rise to such conflict until it consults with the Board’s Special Committee except as contemplated under the Fund Policy. The Board’s Special Committee will instruct the investment adviser on the appropriate course of action.
The Policies are designed to promote accountability of a company’s management to its shareholders and to align the interests of management with those shareholders. An independent proxy voting service (“Agent”), currently Institutional Shareholder Services, Inc., has been retained to assist in the voting of proxies through the provision of vote analysis, implementation and recordkeeping and disclosure services. The investment adviser will generally vote proxies through the Agent. The Agent is required to vote all proxies and/or refer them back to the investment adviser pursuant to the Policies. It is generally the policy of the investment adviser to vote in accordance with the recommendation of the Agent. The Agent shall refer to the investment adviser proxies relating to mergers and restructurings, and the disposition of assets, termination, liquidation and mergers contained in mutual fund proxies. The investment adviser will normally vote against anti-takeover measures and other proposals designed to limit the ability of shareholders to act on possible transactions, except in the case of closed-end management investment companies. The investment adviser generally supports management on social and environmental proposals. The investment adviser may abstain from voting from time to time where it determines that the costs associated with voting a proxy outweighs the benefits derived from exercising the right to vote or the economic effect on shareholders interests or the value of the portfolio holding is indeterminable or insignificant.
In addition, the investment adviser will monitor situations that may result in a conflict of interest between the Fund’s shareholders and the investment adviser, the administrator, or any of their affiliates or any affiliate of the Fund by maintaining a list of significant existing and prospective corporate clients. The investment adviser’s personnel responsible for reviewing and voting proxies on behalf of the Fund will report any proxy received or expected to be received from a company included on that list to the personnel of the investment adviser identified in the Policies. If such personnel expects to instruct the Agent to vote such proxies in a manner inconsistent with the guidelines of the Policies or the recommendation of the Agent, the personnel will consult
with members of senior management of the investment adviser to determine if a material conflict of interests exists. If it is determined that a material conflict does exist, the investment adviser will seek instruction on how to vote from the Special Committee.
Information on how the Fund voted proxies relating to portfolio securities during the most recent 12 month period ended June 30 is available (1) without charge, upon request, by calling 1-800-262-1122, and (2) on the Securities and Exchange Commission’s website at http://www.sec.gov.
Item 8. Portfolio Managers of Closed-End Management Investment Companies
Eaton Vance Management (“EVM” of “Eaton Vance”) is the investment adviser of the Fund. Catherine M. McDermott, Scott H. Page, Eric A. Stein, Payson F. Swaffield and Andrew Szczurowski comprise the investment team responsible for the overall and day-to-day management of the Fund’s investments.
Ms. McDermott is a Vice President of EVM and has been a portfolio manager of the Fund since January 2008. Mr. Page is a Vice President of EVM, has been a portfolio manager of the Fund since February 2005 and is Co-Director of EVM’s Floating-Rate Loan Group. Mr. Stein is a Vice President of EVM, has been a portfolio manager of the Fund since December 2012 and is Co-Director of EVM’s Global Income Group. Mr. Swaffield is a Vice President and Chief Income Investment Officer of EVM and has been a portfolio manager of the Fund since February 2005. Mr. Szczurowski is a Vice President of EVM and has been a portfolio manager of the Fund since November 2011. Ms. McDermott and Messrs. Page, Stein, Swaffield and Szczurowski have managed other Eaton Vance portfolios for more than five years. This information is provided as of the date of filing this report.
The following table shows, as of the Fund’s most recent fiscal year end, the number of accounts each portfolio manager managed in each of the listed categories and the total assets (in millions of dollars), in the accounts managed within each category. The table also shows the number of accounts with respect to which the advisory fee is based on the performance of the account, if any, and the total assets (in millions of dollars) in those accounts.
| | | | | | | | | | | | | | | | |
| | | Number of
All Accounts | | | Total Assets of
All Accounts | | | Number of
Accounts
Paying a
Performance
Fee | | | Total Assets of
Accounts Paying
a Performance
Fee | |
Catherine C. McDermott | | | | | | | | | | | | | | | | |
Registered Investment Companies | | | 2 | | | $ | 3,191.4 | | | | 0 | | | $ | 0 | |
Other Pooled Investment Vehicles | | | 0 | | | $ | 0 | | | | 0 | | | $ | 0 | |
Other Accounts | | | 0 | | | $ | 0 | | | | 0 | | | $ | 0 | |
| | | | |
Scott H. Page | | | | | | | | | | | | | | | | |
Registered Investment Companies | | | 13 | | | $ | 22,030.4 | | | | 0 | | | $ | 0 | |
Other Pooled Investment Vehicles | | | 12 | | | $ | 8,685.4 | | | | 1 | | | $ | 2.4 | |
Other Accounts | | | 8 | | | $ | 4,702.1 | | | | 0 | | | $ | 0 | |
| | | | | | | | | | | | | | | | |
Eric A. Stein(1) | | | | | | | | | | | | | | | | |
Registered Investment Companies | | | 15 | | | $ | 22,031.3 | | | | 0 | | | $ | 0 | |
Other Pooled Investment Vehicles | | | 3 | | | $ | 323.8 | | | | 1 | | | $ | 15.1 | |
Other Accounts | | | 0 | | | $ | 0 | | | | 0 | | | $ | 0 | |
| | | | |
Payson F. Swaffield | | | | | | | | | | | | | | | | |
Registered Investment Companies | | | 2 | | | $ | 3,191.4 | | | | 0 | | | $ | 0 | |
Other Pooled Investment Vehicles | | | 0 | | | $ | 0 | | | | 0 | | | $ | 0 | |
Other Accounts | | | 0 | | | $ | 0 | | | | 0 | | | $ | 0 | |
| | | | |
Andrew Szczurowski(1) | | | | | | | | | | | | | | | | |
Registered Investment Companies | | | 6 | | | $ | 6,747.2 | | | | 0 | | | $ | 0 | |
Other Pooled Investment Vehicles | | | 1 | | | $ | 251.1 | | | | 0 | | | $ | 0 | |
Other Accounts | | | 0 | | | $ | 0 | | | | 0 | | | $ | 0 | |
| (1) | This portfolio manager serves as portfolio manager of one or more registered investment companies and pooled investment vehicles that invest or may invest in one or more underlying registered investment companies in the Eaton Vance family of funds. The underlying investment companies may be managed by this portfolio manager or another portfolio manager. |
The following table shows the dollar range of Fund shares beneficially owned by each portfolio manager as of the Fund’s most recent fiscal year end.
| | |
Portfolio Manager | | Dollar Range of
Equity Securities
Beneficially
Owned in the Fund |
Catherine C. McDermott | | None |
Scott H. Page | | None |
Eric A. Stein | | $1 - $10,000 |
Payson F. Swaffield | | None |
Andrew Szczurowski | | None |
Potential for Conflicts of Interest. It is possible that conflicts of interest may arise in connection with a portfolio manager’s management of the Fund’s investments on the one hand and investments of other accounts for which a portfolio manager is responsible on the other. For example, a portfolio manager may have conflicts of interest in allocating management time, resources and investment opportunities among the Fund and other accounts he or she advises. In addition, due to differences in the investment strategies or restrictions between the Fund and the other accounts, the portfolio manager may take action with respect to another account that differs from the action taken with respect to the Fund. In some cases, another account managed by a portfolio
manager may compensate the investment adviser based on the performance of the securities held by that account. The existence of such a performance based fee may create additional conflicts of interest for the portfolio manager in the allocation of management time, resources and investment opportunities. Whenever conflicts of interest arise, the portfolio manager will endeavor to exercise his or her discretion in a manner that he or she believes is equitable to all interested persons. EVM has adopted several policies and procedures designed to address these potential conflicts including a code of ethics and policies that govern the investment adviser’s trading practices, including among other things the aggregation and allocation of trades among clients, brokerage allocations, cross trades and best execution.
Compensation Structure for EVM
Compensation of EVM’s portfolio managers and other investment professionals has three primary components: (1) a base salary, (2) an annual cash bonus, and (3) annual stock-based compensation consisting of options to purchase shares of Eaton Vance Corp.’s (“EVC’s”) nonvoting common stock and restricted shares of EVC’s nonvoting common stock. EVM’s investment professionals also receive certain retirement, insurance and other benefits that are broadly available to EVM’s employees. Compensation of EVM’s investment professionals is reviewed primarily on an annual basis. Cash bonuses, stock-based compensation awards, and adjustments in base salary are typically paid or put into effect at or shortly after the October 31st fiscal year end of EVC.
Method to Determine Compensation. EVM compensates its portfolio managers based primarily on the scale and complexity of their portfolio responsibilities and the total return performance of managed funds and accounts versus the benchmark(s) stated in the prospectus, as well as an appropriate peer group (as described below). In addition to rankings within peer groups of funds on the basis of absolute performance, consideration may also be given to relative risk-adjusted performance. Risk-adjusted performance measures include, but are not limited to, the Sharpe ratio (Sharpe ratio uses standard deviation and excess return to determine reward per unit of risk). Performance is normally based on periods ending on the September 30th preceding fiscal year end. Fund performance is normally evaluated primarily versus peer groups of funds as determined by Lipper Inc. and/or Morningstar, Inc. When a fund’s peer group as determined by Lipper or Morningstar is deemed by EVM’s management not to provide a fair comparison, performance may instead be evaluated primarily against a custom peer group or market index. In evaluating the performance of a fund and its manager, primary emphasis is normally placed on three-year performance, with secondary consideration of performance over longer and shorter periods. A portion of the compensation payable to equity portfolio managers and investment professionals will be determined based on the ability of one or more accounts managed by such manager to achieve a specified target average annual gross return over a three year period in excess of the account benchmark. The cash bonus to be payable at the end of the three year term will be established at the inception of the term and will be adjusted positively or negatively to the extent that the average annual gross return varies from the specified target return. For funds that are tax-managed or otherwise have an objective of after-tax returns, performance is measured net of taxes. For other funds, performance is evaluated on a pre-tax basis. For funds with an investment objective other than total return (such as current income), consideration will also be given to the fund’s success in achieving its objective. For managers responsible for multiple funds and accounts, investment performance is evaluated on an aggregate basis, based on averages or weighted averages among managed funds and accounts. Funds and accounts that have performance-based advisory fees are not accorded disproportionate weightings in measuring aggregate portfolio manager performance.
The compensation of portfolio managers with other job responsibilities (such as heading an investment group or providing analytical support to other portfolios) will include consideration of the scope of such responsibilities and the managers’ performance in meeting them.
EVM seeks to compensate portfolio managers commensurate with their responsibilities and performance, and competitive with other firms within the investment management industry. EVM participates in investment-industry compensation surveys and utilizes survey data as a factor in determining salary, bonus and stock-based compensation levels for portfolio managers and other investment professionals. Salaries, bonuses and
stock-based compensation are also influenced by the operating performance of EVM and its parent company. The overall annual cash bonus pool is generally based on a substantially fixed percentage of pre-bonus adjusted operating income. While the salaries of EVM’s portfolio managers are comparatively fixed, cash bonuses and stock-based compensation may fluctuate significantly from year to year, based on changes in manager performance and other factors as described herein. For a high performing portfolio manager, cash bonuses and stock-based compensation may represent a substantial portion of total compensation.
Item 9. Purchases of Equity Securities by Closed-End Management Investment Company and Affiliated Purchasers
REGISTRANT PURCHASES OF EQUITY SECURITIES
| | | | | | | | | | | | | | | | |
Period* | | Total Number of
Shares Purchased | | | Average Price
Paid per Share | | | Total Number of
Shares Purchased
as Part of Publicly
Announced
Programs | | | Maximum
Number of
Shares that May
Yet Be
Purchased Under
the Programs | |
November 2015 | | | 18,000 | | | $ | 13.14 | | | | 18,000 | | | | 920,160 | |
December 2015 | | | 37,500 | | | $ | 12.97 | | | | 37,500 | | | | 882,660 | |
January 2016 | | | — | | | | — | | | | — | | | | 882,660 | |
February 2016 | | | — | | | | — | | | | — | | | | 882,660 | |
March 2016 | | | — | | | | — | | | | — | | | | 882,660 | |
April 2016 | | | — | | | | — | | | | — | | | | 882,660 | |
May 2016 | | | — | | | | — | | | | — | | | | 882,660 | |
June 2016 | | | — | | | | — | | | | — | | | | 882,660 | |
July 2016 | | | — | | | | — | | | | — | | | | 882,660 | |
August 2016 | | | — | | | | — | | | | — | | | | 882,660 | |
September 2016 | | | — | | | | — | | | | — | | | | 882,660 | |
October 2016 | | | — | | | | — | | | | — | | | | 882,660 | |
Total | | | 55,500 | | | $ | 13.03 | | | | 55,500 | | | | | |
| * | On November 11, 2013, the Fund’s Board of Trustees approved a share repurchase program authorizing the Fund to repurchase up to 10% of its then currently outstanding common shares in open-market transactions at a discount to net asset value. The repurchase program was announced on November 15, 2013. |
Item 10. Submission of Matters to a Vote of Security Holders
No Material Changes.
Item 11. Controls and Procedures
(a) It is the conclusion of the registrant’s principal executive officer and principal financial officer that the effectiveness of the registrant’s current disclosure controls and procedures (such disclosure controls and procedures having been evaluated within 90 days of the date of this filing) provide reasonable assurance that the information required to be disclosed by the registrant has been recorded, processed, summarized and reported within the time period specified in the Commission’s rules and forms and that the information required to be disclosed by the registrant has been accumulated and communicated to the registrant’s principal executive officer and principal financial officer in order to allow timely decisions regarding required disclosure.
(b) There have been no changes in the registrant’s internal controls over financial reporting during the second fiscal quarter of the period covered by this report that has materially affected, or is reasonably likely to materially affect, the registrant’s internal control over financial reporting.
Item 12. Exhibits
| (a)(1) | Registrant’s Code of Ethics – Not applicable (please see Item 2). |
| (a)(2)(i) | Treasurer’s Section 302 certification. |
| (a)(2)(ii) | President’s Section 302 certification. |
| (b) | Combined Section 906 certification. |
| (c) | Registrant’s notices to shareholders pursuant to Registrant’s exemptive order granting an exemption from Section 19(b) of the 1940 Act and Rule 19b-1 thereunder regarding distributions paid pursuant to the Registrant’s Managed Distribution Plan. |
Signatures
Pursuant to the requirements of the Securities Exchange Act of 1934 and the Investment Company Act of 1940, the registrant has duly caused this report to be signed on its behalf by the undersigned, thereunto duly authorized.
Eaton Vance Short Duration Diversified Income Fund
| | |
| By: | | /s/ Payson F. Swaffield |
| | Payson F. Swaffield |
| | President |
Date: December 16, 2016
Pursuant to the requirements of the Securities Exchange Act of 1934 and the Investment Company Act of 1940, this report has been signed below by the following persons on behalf of the registrant and in the capacities and on the dates indicated.
| | |
| By: | | /s/ James F. Kirchner |
| | James F. Kirchner |
| | Treasurer |
Date: December 16, 2016
| | |
| By: | | /s/ Payson F. Swaffield |
| | Payson F. Swaffield |
| | President |
Date: December 16, 2016