UNITED STATES
SECURITIES AND EXCHANGE COMMISSION
Washington, D.C. 20549
Form N-CSR
CERTIFIED SHAREHOLDER REPORT OF REGISTERED
MANAGEMENT INVESTMENT COMPANIES
Investment Company Act File Number: 811-21563
Eaton Vance Short Duration Diversified Income Fund
(Exact Name of Registrant as Specified in Charter)
Two International Place, Boston, Massachusetts 02110
(Address of Principal Executive Offices)
Deidre E. Walsh
Two International Place, Boston, Massachusetts 02110
(Name and Address of Agent for Services)
(617) 482-8260
(Registrant’s Telephone Number)
October 31
Date of Fiscal Year End
October 31, 2023
Date of Reporting Period
Item 1. Reports to Stockholders


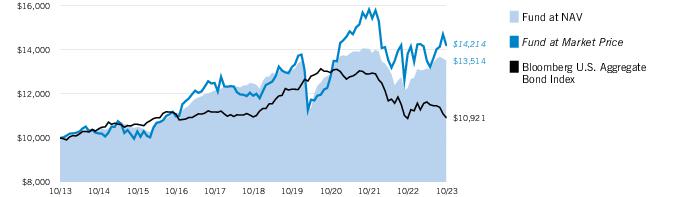
| % Average Annual Total Returns1,2 | Inception Date | One Year | Five Years | Ten Years |
| Fund at NAV | 02/28/2005 | 10.20% | 1.62% | 3.06% |
| Fund at Market Price | — | 2.86 | 3.59 | 3.58 |
| Bloomberg U.S. Aggregate Bond Index | — | 0.36% | (0.06)% | 0.88% |
| Blended Index | — | 7.08 | 1.48 | — |
| % Premium/Discount to NAV3 | |
| As of period end | (5.24)% |
| Distributions 4 | |
| Total Distributions per share for the period | $0.978 |
| Distribution Rate at NAV | 8.62% |
| Distribution Rate at Market Price | 9.09 |
| % Total Leverage5 | |
| Borrowings | 12.30% |
| Derivatives | 19.72 |
| Asset Allocation (% of total investments)1 |
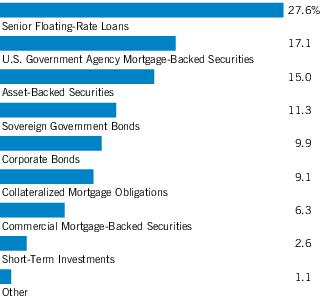
| 1 | Including the Fund’s use of leverage, Asset Allocation as a percentage of the Fund’s net assets amounted to 128.7%. |
| † | The views expressed in this report are those of the portfolio manager(s) and are current only through the date stated at the top of this page. These views are subject to change at any time based upon market or other conditions, and Eaton Vance and the Fund(s) disclaim any responsibility to update such views. These views may not be relied upon as investment advice and, because investment decisions are based on many factors, may not be relied upon as an indication of trading intent on behalf of any Eaton Vance fund. This commentary may contain statements that are not historical facts, referred to as “forward-looking statements.” The Fund’s actual future results may differ significantly from those stated in any forward-looking statement, depending on factors such as changes in securities or financial markets or general economic conditions, the volume of sales and purchases of Fund shares, the continuation of investment advisory, administrative and service contracts, and other risks discussed from time to time in the Fund’s filings with the Securities and Exchange Commission. |
| ‡ | The information contained herein is provided for informational purposes only and does not constitute a solicitation of an offer to buy or sell Fund shares. Common shares of the Fund are available for purchase and sale only at current market prices in secondary market trading. |
| 1 | Bloomberg U.S. Aggregate Bond Index is an unmanaged index of domestic investment-grade bonds, including corporate, government and mortgage-backed securities. Morningstar® LSTA® US Leveraged Loan IndexSM is an unmanaged index of the institutional leveraged loan market. Morningstar® LSTA® Leveraged Loan indices are a product of Morningstar, Inc. (“Morningstar”) and have been licensed for use. Morningstar® is a registered trademark of Morningstar licensed for certain use. Loan Syndications and Trading Association® and LSTA® are trademarks of the LSTA licensed for certain use by Morningstar, and further sublicensed by Morningstar for certain use. Neither Morningstar nor LSTA guarantees the accuracy and/or completeness of the Morningstar® LSTA® US Leveraged Loan IndexSM or any data included therein, and shall have no liability for any errors, omissions, or interruptions therein. ICE BofA U.S. Mortgage-Backed Securities Index is an unmanaged index of fixed rate residential mortgage pass-through securities issued by U.S. agencies. ICE® BofA® indices are not for redistribution or other uses; provided “as is”, without warranties, and with no liability. Eaton Vance has prepared this report and ICE Data Indices, LLC does not endorse it, or guarantee, review, or endorse Eaton Vance’s products. BofA® is a licensed registered trademark of Bank of America Corporation in the United States and other countries. The J.P. Morgan Emerging Market Bond Index (EMBI) Global Diversified Spread Index is the spread component of the J.P. Morgan EMBI Global Diversified. J.P. Morgan EMBI Global Diversified is a market-cap weighted index that measures USD-denominated Brady Bonds, Eurobonds, and traded loans issued by sovereign entities. The J.P. Morgan EMBI Global Diversified Spread Index commenced on July 27, 2016; accordingly the Ten Years return is not available. Information has been obtained from sources believed to be reliable but J.P. Morgan does not warrant its completeness or accuracy. The Index is used with permission. The Index may not be copied, used, or distributed without J.P. Morgan’s prior written approval. Copyright 2021, J.P. Morgan Chase & Co. All rights reserved. The Blended Index consists of 33.33% Morningstar® LSTA® |
| US Leveraged Loan IndexSM, 33.33% ICE BofA U.S. Mortgage-Backed Securities Index and 33.34% J.P. Morgan EMBI Global Diversified Spread Index, rebalanced monthly. Unless otherwise stated, index returns do not reflect the effect of any applicable sales charges, commissions, expenses, taxes or leverage, as applicable. It is not possible to invest directly in an index. | |
| 2 | Performance results reflect the effects of leverage. Absent an expense waiver by the investment adviser, if applicable, the returns would be lower. |
| 3 | The shares of the Fund often trade at a discount or premium to their net asset value. The discount or premium may vary over time and may be higher or lower than what is quoted in this report. For up-to-date premium/discount information, please refer to https://funds.eatonvance.com/closed-end-fund-prices.php. |
| 4 | The Distribution Rate is based on the Fund’s last regular distribution per share in the period (annualized) divided by the Fund’s NAV or market price at the end of the period. The Fund’s distributions may be comprised of amounts characterized for federal income tax purposes as qualified and non-qualified ordinary dividends, capital gains and nondividend distributions, also known as return of capital. For additional information about nondividend distributions, please refer to Eaton Vance Closed-End Fund Distribution Notices (19a) posted on our website, eatonvance.com. The Fund will determine the federal income tax character of distributions paid to a shareholder after the end of the calendar year. This is reported on the IRS form 1099-DIV and provided to the shareholder shortly after each year-end. For information about the tax character of distributions made in prior calendar years, please refer to Performance-Tax Character of Distributions on the Fund’s webpage available at eatonvance.com. The Fund’s distributions are determined by the investment adviser. Fund distributions may be affected by numerous factors including changes in Fund performance, the cost of financing for leverage, portfolio holdings, realized and projected returns, and other factors. As portfolio and market conditions change, the rate of distributions paid by the Fund could change. |
| 5 | The Fund employs leverage through derivatives and borrowings. Total leverage is shown as a percentage of the Fund’s aggregate net assets plus the absolute notional value of long and short derivatives and borrowings outstanding. Use of leverage creates an opportunity for income, but creates risks including greater price volatility. The cost of borrowings rises and falls with changes in short-term interest rates. The Fund may be required to maintain prescribed asset coverage for its leverage and may be required to reduce its leverage at an inopportune time. |
| Fund profile subject to change due to active management. |
| Additional Information | |
| Bloomberg U.S. Treasury Index measures the performance of U.S. Treasuries with a maturity of one year or more. Bloomberg U.S. Corporate Bond Index measures the performance of investment-grade U.S. corporate securities with a maturity of one year or more. Bloomberg U.S. Corporate High Yield Index measures USD-denominated, non-investment grade corporate securities. Bloomberg U.S. Mortgage-Backed Securities Index measures agency mortgage-backed pass-through securities issued by Ginnie Mae (GNMA), Fannie Mae (FNMA), and Freddie Mac (FHLMC). Bloomberg U.S. Asset-Backed Securities Index tracks the performance of U.S. dollar denominated investment grade, fixed rate asset-backed securities publicly issued in the U.S. domestic market. | |
| Duration is a measure of the expected change in price of a bond — in percentage terms — given a one percent change in interest rates, all else being constant. Securities with lower durations tend to be less sensitive to interest rate changes. |
| Asset-Backed Securities — 19.3% |
| Security | Principal Amount (000's omitted) | Value | |
| AMMC CLO 15, Ltd., Series 2014-15A, Class ERR, 12.566%, (3 mo. SOFR + 7.172%), 1/15/32(1)(2) | $ | 2,000 | $ 1,757,694 |
| AMMC CLO XII, Ltd., Series 2013-12A, Class ER, 11.807%, (3 mo. SOFR + 6.442%), 11/10/30(1)(2) | 1,000 | 853,784 | |
| Ares XXXIIR CLO, Ltd., Series 2014-32RA, Class D, 11.476%, (3 mo. SOFR + 6.111%), 5/15/30(1)(2) | 1,000 | 856,831 | |
| Carlyle Global Market Strategies CLO, Ltd.: | |||
| Series 2012-3A, Class DR2, 12.156%, (3 mo. SOFR + 6.761%), 1/14/32(1)(2) | 2,000 | 1,668,694 | |
| Series 2014-4RA, Class D, 11.306%, (3 mo. SOFR + 5.912%), 7/15/30(1)(2) | 1,000 | 804,328 | |
| Series 2015-5A, Class DR, 12.377%, (3 mo. SOFR + 6.961%), 1/20/32(1)(2) | 1,000 | 817,725 | |
| Carlyle US CLO, Ltd., Series 2022-6A, Class DR, 10.13%, (3 mo. SOFR + 4.75%), 10/25/36(1)(2) | 1,000 | 1,003,401 | |
| Galaxy XV CLO, Ltd., Series 2013-15A, Class ER, 12.301%, (3 mo. SOFR + 6.906%), 10/15/30(1)(2) | 1,440 | 1,293,682 | |
| Galaxy XXI CLO, Ltd., Series 2015-21A, Class ER, 10.927%, (3 mo. SOFR + 5.511%), 4/20/31(1)(2) | 1,000 | 902,158 | |
| Galaxy XXV CLO, Ltd., Series 2018-25A, Class E, 11.59%, (3 mo. SOFR + 6.211%), 10/25/31(1)(2) | 1,250 | 1,106,564 | |
| Golub Capital Partners CLO 22B, Ltd., Series 2015-22A, Class ER, 11.677%, (3 mo. SOFR + 6.262%), 1/20/31(1)(2) | 2,000 | 1,872,446 | |
| Golub Capital Partners CLO 23M, Ltd., Series 2015-23A, Class ER, 11.427%, (3 mo. SOFR + 6.011%), 1/20/31(1)(2) | 2,000 | 1,853,692 | |
| Madison Park Funding XXV, Ltd., Series 2017-25A, Class D, 11.74%, (3 mo. SOFR + 6.362%), 4/25/29(1)(2) | 3,000 | 2,798,727 | |
| Neuberger Berman CLO XVIII, Ltd., Series 2014-18A, Class DR2, 11.594%, (3 mo. SOFR + 6.182%), 10/21/30(1)(2) | 3,000 | 2,786,799 | |
| NRZ Excess Spread-Collateralized Notes, Series 2021-GNT1, Class A, 3.474%, 11/25/26(1) | 637 | 574,273 | |
| Octagon 68, Ltd., Series 2023-1A, Class D, 10/20/36(1)(3) | 1,000 | 1,000,000 | |
| Palmer Square CLO, Ltd., Series 2013-2A, Class DRR, 11.514%, (3 mo. SOFR + 6.111%), 10/17/31(1)(2) | 2,000 | 1,873,650 | |
| Regatta IX Funding, Ltd., Series 2017-1A, Class E, 11.664%, (3 mo. SOFR + 6.262%), 4/17/30(1)(2) | 2,000 | 1,854,610 | |
| Voya CLO, Ltd., Series 2015-3A, Class DR, 11.877%, (3 mo. SOFR + 6.462%), 10/20/31(1)(2) | 2,000 | 1,601,934 | |
| Total Asset-Backed Securities (identified cost $29,893,316) | $ 27,280,992 | ||
| Collateralized Mortgage Obligations — 11.7% |
| Security | Principal Amount (000's omitted) | Value | |
| Cascade MH Asset Trust, Series 2022-MH1, Class A, 4.25% to 10/1/27, 8/25/54(1)(4) | $ | 471 | $ 412,386 |
| Federal Home Loan Mortgage Corp.: | |||
| Series 2113, Class QG, 6.00%, 1/15/29 | 133 | 131,510 | |
| Series 2167, Class BZ, 7.00%, 6/15/29 | 124 | 123,945 | |
| Series 2182, Class ZB, 8.00%, 9/15/29 | 197 | 200,402 | |
| Series 4273, Class PU, 4.00%, 11/15/43 | 420 | 357,972 | |
| Series 5035, Class AZ, 2.00%, 11/25/50 | 553 | 223,381 | |
| Series 5327, Class B, 6.00%, 8/25/53 | 1,000 | 954,179 | |
| Interest Only:(5) | |||
| Series 362, Class C7, 3.50%, 9/15/47 | 1,011 | 185,916 | |
| Series 2631, Class DS, 1.665%, (6.986% - 30-day average SOFR), 6/15/33(6) | 162 | 3,310 | |
| Series 2770, Class SH, 1.665%, (6.986% - 30-day average SOFR), 3/15/34(6) | 495 | 45,358 | |
| Series 2981, Class CS, 1.285%, (6.606% - 30-day average SOFR), 5/15/35(6) | 255 | 13,096 | |
| Series 3114, Class TS, 1.215%, (6.536% - 30-day average SOFR), 9/15/30(6) | 436 | 13,401 | |
| Series 3339, Class JI, 1.155%, (6.476% - 30-day average SOFR), 7/15/37(6) | 828 | 62,870 | |
| Series 4109, Class ES, 0.715%, (6.036% - 30-day average SOFR), 12/15/41(6) | 31 | 2,417 | |
| Series 4163, Class GS, 0.765%, (6.086% - 30-day average SOFR), 11/15/32(6) | 1,256 | 58,402 | |
| Series 4169, Class AS, 0.815%, (6.136% - 30-day average SOFR), 2/15/33(6) | 678 | 29,748 | |
| Series 4203, Class QS, 0.815%, (6.136% - 30-day average SOFR), 5/15/43(6) | 654 | 32,342 | |
| Series 4370, Class IO, 3.50%, 9/15/41 | 74 | 1,992 | |
| Series 4497, Class CS, 0.765%, (6.086% - 30-day average SOFR), 9/15/44(6) | 171 | 2,348 | |
| Series 4507, Class EI, 4.00%, 8/15/44 | 796 | 104,890 | |
| Series 4629, Class QI, 3.50%, 11/15/46 | 509 | 104,283 | |
| Series 4644, Class TI, 3.50%, 1/15/45 | 412 | 61,965 | |
| Series 4744, Class IO, 4.00%, 11/15/47 | 489 | 97,350 | |
| Series 4749, Class IL, 4.00%, 12/15/47 | 382 | 76,337 | |
| Series 4768, Class IO, 4.00%, 3/15/48 | 451 | 90,405 | |
| Series 4772, Class PI, 4.00%, 1/15/48 | 327 | 65,480 | |
| Series 4966, Class SY, 0.615%, (5.936% - 30-day average SOFR), 4/25/50(6) | 1,790 | 166,720 | |
| Principal Only:(7) | |||
| Series 3309, Class DO, 0.00%, 4/15/37 | 406 | 303,400 | |
| Series 4478, Class PO, 0.00%, 5/15/45 | 170 | 115,414 | |
| Federal National Mortgage Association: | |||
| Series 1994-42, Class K, 6.50%, 4/25/24 | 4 | 3,902 | |
| Series 1997-38, Class N, 8.00%, 5/20/27 | 57 | 58,169 | |
| Series 2007-74, Class AC, 5.00%, 8/25/37 | 462 | 450,269 | |
| Security | Principal Amount (000's omitted) | Value | |
| Federal National Mortgage Association: (continued) | |||
| Series 2011-49, Class NT, 6.00%, (64.855% - 30-day average SOFR x 10.00, Cap 6.00%), 6/25/41(6) | $ | 127 | $ 115,523 |
| Series 2012-134, Class ZT, 2.00%, 12/25/42 | 491 | 373,090 | |
| Series 2013-6, Class TA, 1.50%, 1/25/43 | 278 | 232,473 | |
| Series 2015-74, Class SL, 0.00%, (2.282% - 30-day average SOFR x 0.587, Floor 0.00%), 10/25/45(6) | 867 | 433,943 | |
| Series 2017-15, Class LE, 3.00%, 6/25/46 | 45 | 43,578 | |
| Interest Only:(5) | |||
| Series 2004-46, Class SI, 0.565%, (5.886% - 30-day average SOFR), 5/25/34(6) | 291 | 7,870 | |
| Series 2005-17, Class SA, 1.265%, (6.586% - 30-day average SOFR), 3/25/35(6) | 438 | 31,171 | |
| Series 2006-42, Class PI, 1.155%, (6.476% - 30-day Average SOFR), 6/25/36(6) | 599 | 43,594 | |
| Series 2006-44, Class IS, 1.165%, (6.486% - 30-day average SOFR), 6/25/36(6) | 540 | 36,065 | |
| Series 2007-50, Class LS, 1.015%, (6.336% - 30-day average SOFR), 6/25/37(6) | 446 | 30,216 | |
| Series 2008-26, Class SA, 0.765%, (6.086% - 30-day average SOFR), 4/25/38(6) | 563 | 41,616 | |
| Series 2008-61, Class S, 0.665%, (5.986% - 30-day average SOFR), 7/25/38(6) | 879 | 43,387 | |
| Series 2010-109, Class PS, 1.165%, (6.486% - 30-day average SOFR), 10/25/40(6) | 893 | 55,135 | |
| Series 2010-147, Class KS, 0.515%, (5.836% - 30-day Average SOFR), 1/25/41(6) | 1,070 | 31,038 | |
| Series 2012-52, Class AI, 3.50%, 8/25/26 | 87 | 2,166 | |
| Series 2012-118, Class IN, 3.50%, 11/25/42 | 1,166 | 230,245 | |
| Series 2012-150, Class PS, 0.715%, (6.036% - 30-day average SOFR), 1/25/43(6) | 1,822 | 136,022 | |
| Series 2012-150, Class SK, 0.715%, (6.036% - 30-day average SOFR), 1/25/43(6) | 768 | 60,149 | |
| Series 2013-23, Class CS, 0.815%, (6.136% - 30-day average SOFR), 3/25/33(6) | 689 | 29,931 | |
| Series 2014-32, Class EI, 4.00%, 6/25/44 | 187 | 33,229 | |
| Series 2014-55, Class IN, 3.50%, 7/25/44 | 428 | 87,074 | |
| Series 2014-80, Class BI, 3.00%, 12/25/44 | 1,001 | 177,513 | |
| Series 2014-89, Class IO, 3.50%, 1/25/45 | 354 | 75,581 | |
| Series 2015-14, Class KI, 3.00%, 3/25/45 | 782 | 128,617 | |
| Series 2015-52, Class MI, 3.50%, 7/25/45 | 416 | 83,510 | |
| Series 2015-57, Class IO, 3.00%, 8/25/45 | 1,824 | 320,999 | |
| Series 2015-93, Class BS, 0.715%, (6.036% - 30-day average SOFR), 8/25/45(6) | 450 | 18,010 | |
| Series 2018-21, Class IO, 3.00%, 4/25/48 | 792 | 140,872 | |
| Series 2020-23, Class SP, 0.615%, (5.936% - 30-day average SOFR), 2/25/50(6) | 1,411 | 132,952 | |
| Series 2020-45, Class IJ, 2.50%, 7/25/50 | 1,984 | 274,218 | |
| Principal Only:(7) Series 2006-8, Class WQ, 0.00%, 3/25/36 | 389 | 306,774 | |
| Security | Principal Amount (000's omitted) | Value | |
| Federal National Mortgage Association Multifamily Connecticut Avenue Securities Trust, Series 2020-01, Class M10, 9.185%, (30-day average SOFR + 3.864%), 3/25/50(1)(2) | $ | 998 | $ 958,647 |
| Government National Mortgage Association: | |||
| Series 2021-160, Class NZ, 3.00%, 9/20/51 | 304 | 147,138 | |
| Series 2022-189, Class US, 3.222%, (22.733% - 30-day average SOFR x 3.667), 11/20/52(6) | 280 | 253,598 | |
| Series 2023-56, Class ZE, 6.00%, 4/20/53 | 1,030 | 919,335 | |
| Series 2023-96, Class BL, 6.00%, 7/20/53 | 1,000 | 951,076 | |
| Series 2023-97, Class CB, 6.00%, 7/20/53 | 1,000 | 966,960 | |
| Series 2023-115, Class AL, 6.00%, 8/20/53 | 500 | 476,246 | |
| Series 2023-149, Class S, 5.505%, (21.45% - 30-day average SOFR x 3.00%), 10/20/53(6) | 1,000 | 969,327 | |
| Interest Only:(5) | |||
| Series 2017-121, Class DS, 0.00%, (4.386% - 1 mo. SOFR, Floor 0.00%), 8/20/47(6) | 809 | 22,894 | |
| Series 2020-146, Class IQ, 2.00%, 10/20/50 | 5,546 | 615,966 | |
| Series 2021-131, Class QI, 3.00%, 7/20/51 | 3,301 | 418,177 | |
| Series 2021-193, Class IU, 3.00%, 11/20/49 | 6,298 | 857,457 | |
| Series 2021-209, Class IW, 3.00%, 11/20/51 | 4,804 | 630,777 | |
| Total Collateralized Mortgage Obligations (identified cost $27,454,913) | $ 16,497,718 | ||
| Commercial Mortgage-Backed Securities — 8.1% |
| Security | Principal Amount (000's omitted) | Value | |
| BAMLL Commercial Mortgage Securities Trust: | |||
| Series 2019-BPR, Class ENM, 3.719%, 11/5/32(1)(8) | $ | 795 | $ 269,794 |
| Series 2019-BPR, Class FNM, 3.719%, 11/5/32(1)(8) | 1,605 | 369,682 | |
| BBCMS Mortgage Trust, Series 2017-C1, Class D, 3.541%, 2/15/50(1)(8) | 700 | 462,400 | |
| COMM Mortgage Trust, Series 2013-CR11, Class D, 4.54%, 8/10/50(1)(8) | 2,696 | 2,417,328 | |
| CSMC Trust, Series 2020-TMIC, Class A, 8.95%, (1 mo. SOFR + 3.614%), 12/15/35(1)(2) | 1,000 | 998,979 | |
| JPMBB Commercial Mortgage Securities Trust: | |||
| Series 2014-C22, Class D, 4.559%, 9/15/47(1)(8) | 1,850 | 1,211,602 | |
| Series 2014-C25, Class D, 3.933%, 11/15/47(1)(8) | 360 | 152,825 | |
| Morgan Stanley Bank of America Merrill Lynch Trust: | |||
| Series 2014-C16, Class B, 4.281%, 6/15/47(8)(9) | 240 | 219,763 | |
| Series 2016-C29, Class D, 3.00%, 5/15/49(1)(9) | 1,000 | 724,848 | |
| Series 2016-C32, Class D, 3.396%, 12/15/49(1)(8)(9) | 250 | 165,101 | |
| Morgan Stanley Capital I Trust, Series 2016-UBS12, Class D, 3.312%, 12/15/49(1)(9) | 1,000 | 523,854 | |
| UBS-Barclays Commercial Mortgage Trust, Series 2013-C6, Class D, 3.97%, 4/10/46(1)(8) | 988 | 819,152 | |
| Security | Principal Amount (000's omitted) | Value | |
| VMC Finance, LLC, Series 2021-HT1, Class B, 9.949%, (1 mo. SOFR + 4.614%), 1/18/37(1)(2) | $ | 1,000 | $ 950,022 |
| Wells Fargo Commercial Mortgage Trust: | |||
| Series 2013-LC12, Class D, 3.955%, 7/15/46(1)(8) | 2,000 | 395,794 | |
| Series 2015-C31, Class D, 3.852%, 11/15/48 | 922 | 701,242 | |
| Series 2016-C35, Class D, 3.142%, 7/15/48(1) | 1,000 | 710,071 | |
| Series 2016-C36, Class D, 2.942%, 11/15/59(1) | 500 | 290,646 | |
| Total Commercial Mortgage-Backed Securities (identified cost $15,456,506) | $ 11,383,103 | ||
| Common Stocks — 0.3% |
| Security | Shares | Value | |
| Commercial Services & Supplies — 0.1% | |||
| Monitronics International, Inc.(10)(11) | 2,596 | $ 54,516 | |
| Phoenix Services International, LLC(10)(11) | 2,365 | 22,467 | |
| Phoenix Services International, LLC(10)(11) | 216 | 2,052 | |
| $ 79,035 | |||
| Electronics/Electrical — 0.0%(12) | |||
| Skillsoft Corp.(10)(11) | 585 | $ 10,998 | |
| $ 10,998 | |||
| Entertainment — 0.0%(12) | |||
| New Cineworld, Ltd.(10)(11) | 2,436 | $ 52,070 | |
| $ 52,070 | |||
| Health Care — 0.0% | |||
| Akorn Holding Company, LLC, Class A(10)(11)(13) | 6,053 | $ 0 | |
| $ 0 | |||
| Household Durables — 0.2% | |||
| Serta Simmons Bedding, Inc.(10)(11) | 17,110 | $ 239,540 | |
| Serta SSB Equipment Co.(10)(11)(13) | 17,110 | 0 | |
| $ 239,540 | |||
| Investment Companies — 0.0% | |||
| Jubilee Topco, Ltd., Class A(10)(11)(13) | 79,130 | $ 0 | |
| $ 0 | |||
| Nonferrous Metals/Minerals — 0.0%(12) | |||
| ACNR Holdings, Inc., Class A(10)(11) | 587 | $ 50,189 | |
| $ 50,189 | |||
| Security | Shares | Value | |
| Oil and Gas — 0.0%(12) | |||
| AFG Holdings, Inc.(10)(11)(13) | 3,122 | $ 6,181 | |
| McDermott International, Ltd.(10)(11) | 12,407 | 3,350 | |
| $ 9,531 | |||
| Pharmaceuticals — 0.0%(12) | |||
| Covis Midco 1 S.a.r.l., Class A(10)(11) | 88 | $ 44 | |
| Covis Midco 1 S.a.r.l., Class B(10)(11) | 88 | 45 | |
| Covis Midco 1 S.a.r.l., Class C(10)(11) | 88 | 45 | |
| Covis Midco 1 S.a.r.l., Class D(10)(11) | 88 | 45 | |
| Covis Midco 1 S.a.r.l., Class E(10)(11) | 88 | 45 | |
| $ 224 | |||
| Telecommunications — 0.0% | |||
| Global Eagle Entertainment(10)(11)(13) | 3,588 | $ 0 | |
| $ 0 | |||
| Total Common Stocks (identified cost $796,849) | $ 441,587 | ||
| Corporate Bonds — 12.8% |
| Security | Principal Amount (000's omitted) | Value | |
| Aerospace and Defense — 0.5% | |||
| Bombardier, Inc., 7.875%, 4/15/27(1) | $ | 136 | $ 131,015 |
| Rolls-Royce PLC, 5.75%, 10/15/27(1) | 200 | 189,762 | |
| TransDigm, Inc.: | |||
| 4.625%, 1/15/29 | 100 | 86,337 | |
| 4.875%, 5/1/29 | 150 | 130,146 | |
| 6.25%, 3/15/26(1) | 179 | 175,045 | |
| $ 712,305 | |||
| Automotive — 0.6% | |||
| Clarios Global, L.P./Clarios US Finance Co.: | |||
| 6.25%, 5/15/26(1) | $ | 116 | $ 113,520 |
| 8.50%, 5/15/27(1) | 642 | 633,301 | |
| Ford Motor Co., 4.75%, 1/15/43 | 224 | 155,881 | |
| $ 902,702 | |||
| Building and Development — 0.4% | |||
| Builders FirstSource, Inc., 4.25%, 2/1/32(1) | $ | 500 | $ 398,526 |
| Smyrna Ready Mix Concrete, LLC, 6.00%, 11/1/28(1) | 192 | 177,701 | |
| $ 576,227 | |||
| Security | Principal Amount (000's omitted) | Value | |
| Business Equipment and Services — 0.6% | |||
| Adtalem Global Education, Inc., 5.50%, 3/1/28(1) | $ | 250 | $ 227,930 |
| Allied Universal Holdco, LLC/Allied Universal Finance Corp., 9.75%, 7/15/27(1) | 185 | 160,907 | |
| GEMS MENASA Cayman, Ltd./GEMS Education Delaware, LLC, 7.125%, 7/31/26(1) | 460 | 443,265 | |
| $ 832,102 | |||
| Cable and Satellite Television — 0.4% | |||
| CCO Holdings, LLC/CCO Holdings Capital Corp.: | |||
| 4.75%, 3/1/30(1) | $ | 75 | $ 61,976 |
| 5.50%, 5/1/26(1) | 500 | 477,331 | |
| $ 539,307 | |||
| Chemicals — 0.1% | |||
| W.R. Grace Holdings, LLC, 5.625%, 8/15/29(1) | $ | 100 | $ 77,596 |
| $ 77,596 | |||
| Commercial Services — 0.2% | |||
| APi Group DE, Inc., 4.75%, 10/15/29(1) | $ | 300 | $ 257,199 |
| $ 257,199 | |||
| Computers — 0.4% | |||
| McAfee Corp., 7.375%, 2/15/30(1) | $ | 200 | $ 160,174 |
| Presidio Holdings, Inc., 8.25%, 2/1/28(1) | 362 | 342,922 | |
| $ 503,096 | |||
| Distribution & Wholesale — 0.1% | |||
| Performance Food Group, Inc., 5.50%, 10/15/27(1) | $ | 172 | $ 161,013 |
| $ 161,013 | |||
| Diversified Financial Services — 0.2% | |||
| VistaJet Malta Finance PLC/Vista Management Holding, Inc., 7.875%, 5/1/27(1) | $ | 400 | $ 308,066 |
| $ 308,066 | |||
| Drugs — 0.2% | |||
| Endo DAC/Endo Finance, LLC/Endo Finco, Inc., 5.875%, 10/15/24(1)(14) | $ | 500 | $ 336,250 |
| $ 336,250 | |||
| Ecological Services and Equipment — 0.3% | |||
| Covanta Holding Corp., 5.00%, 9/1/30 | $ | 200 | $ 155,137 |
| GFL Environmental, Inc., 4.75%, 6/15/29(1) | 238 | 208,586 | |
| $ 363,723 | |||
| Security | Principal Amount (000's omitted) | Value | |
| Electronics/Electrical — 0.3% | |||
| Imola Merger Corp., 4.75%, 5/15/29(1) | $ | 291 | $ 253,943 |
| Sensata Technologies, Inc., 4.375%, 2/15/30(1) | 189 | 159,958 | |
| $ 413,901 | |||
| Engineering & Construction — 0.2% | |||
| VM Consolidated, Inc., 5.50%, 4/15/29(1) | $ | 370 | $ 328,018 |
| $ 328,018 | |||
| Entertainment — 0.5% | |||
| Allwyn Entertainment Financing UK PLC, 7.875%, 4/30/29(1) | $ | 200 | $ 198,192 |
| Caesars Entertainment, Inc., 8.125%, 7/1/27(1) | 325 | 322,296 | |
| CDI Escrow Issuer, Inc., 5.75%, 4/1/30(1) | 100 | 89,444 | |
| Jacobs Entertainment, Inc., 6.75%, 2/15/29(1) | 150 | 127,631 | |
| $ 737,563 | |||
| Financial Intermediaries — 0.3% | |||
| Ford Motor Credit Co., LLC: | |||
| 3.625%, 6/17/31 | $ | 206 | $ 162,956 |
| 4.125%, 8/17/27 | 300 | 272,691 | |
| $ 435,647 | |||
| Financial Services — 0.6% | |||
| Vietnam Debt and Asset Trading Corp., 1.00%, 10/10/25(15) | $ | 1,060 | $ 901,000 |
| $ 901,000 | |||
| Health Care — 1.2% | |||
| Fortrea Holdings, Inc., 7.50%, 7/1/30(1) | $ | 170 | $ 164,263 |
| LifePoint Health, Inc., 5.375%, 1/15/29(1) | 547 | 331,938 | |
| Medline Borrower, L.P., 5.25%, 10/1/29(1) | 500 | 426,103 | |
| Molina Healthcare, Inc., 3.875%, 11/15/30(1) | 296 | 241,771 | |
| Option Care Health, Inc., 4.375%, 10/31/29(1) | 400 | 334,751 | |
| US Acute Care Solutions, LLC, 6.375%, 3/1/26(1) | 150 | 127,762 | |
| $ 1,626,588 | |||
| Insurance — 0.7% | |||
| HUB International, Ltd., 7.00%, 5/1/26(1) | $ | 948 | $ 923,671 |
| $ 923,671 | |||
| Internet Software & Services — 0.2% | |||
| Arches Buyer, Inc., 4.25%, 6/1/28(1) | $ | 400 | $ 331,732 |
| $ 331,732 | |||
| Security | Principal Amount (000's omitted) | Value | |
| Leisure Goods/Activities/Movies — 0.7% | |||
| Lindblad Expeditions, LLC, 6.75%, 2/15/27(1) | $ | 200 | $ 182,436 |
| NCL Corp., Ltd., 5.875%, 2/15/27(1) | 375 | 345,553 | |
| Viking Cruises, Ltd., 5.875%, 9/15/27(1) | 540 | 486,974 | |
| $ 1,014,963 | |||
| Media — 0.0%(12) | |||
| iHeartCommunications, Inc.: | |||
| 6.375%, 5/1/26 | $ | 27 | $ 22,112 |
| 8.375%, 5/1/27 | 49 | 30,152 | |
| $ 52,264 | |||
| Metals/Mining — 0.3% | |||
| Cleveland-Cliffs, Inc., 6.75%, 3/15/26(1) | $ | 112 | $ 111,482 |
| Compass Minerals International, Inc., 6.75%, 12/1/27(1) | 200 | 188,580 | |
| Hudbay Minerals, Inc., 4.50%, 4/1/26(1) | 150 | 139,762 | |
| $ 439,824 | |||
| Nonferrous Metals/Minerals — 0.4% | |||
| First Quantum Minerals, Ltd., 7.50%, 4/1/25(1) | $ | 200 | $ 187,908 |
| New Gold, Inc., 7.50%, 7/15/27(1) | 381 | 357,875 | |
| $ 545,783 | |||
| Oil and Gas — 1.1% | |||
| Archrock Partners, L.P./Archrock Partners Finance Corp., 6.875%, 4/1/27(1) | $ | 250 | $ 240,584 |
| Permian Resources Operating, LLC, 7.75%, 2/15/26(1) | 750 | 750,137 | |
| Petroleos Mexicanos: | |||
| 5.35%, 2/12/28 | 30 | 24,234 | |
| 6.35%, 2/12/48 | 71 | 39,199 | |
| 6.50%, 3/13/27 | 101 | 89,180 | |
| 6.875%, 8/4/26 | 367 | 339,095 | |
| $ 1,482,429 | |||
| Pipelines — 0.2% | |||
| Antero Midstream Partners, L.P./Antero Midstream Finance Corp., 5.75%, 3/1/27(1) | $ | 100 | $ 95,673 |
| Cheniere Energy Partners, L.P., 4.50%, 10/1/29 | 71 | 63,628 | |
| Venture Global LNG, Inc., 8.125%, 6/1/28(1) | 150 | 145,738 | |
| $ 305,039 | |||
| Publishing — 0.1% | |||
| McGraw-Hill Education, Inc., 5.75%, 8/1/28(1) | $ | 134 | $ 113,083 |
| $ 113,083 | |||
| Security | Principal Amount (000's omitted) | Value | |
| Radio and Television — 0.1% | |||
| Outfront Media Capital, LLC/Outfront Media Capital Corp., 5.00%, 8/15/27(1) | $ | 150 | $ 133,371 |
| $ 133,371 | |||
| Real Estate Investment Trusts (REITs) — 0.0%(12) | |||
| VICI Properties, L.P./VICI Note Co., Inc., 5.75%, 2/1/27(1) | $ | 44 | $ 42,152 |
| $ 42,152 | |||
| Retail — 0.3% | |||
| Evergreen AcqCo 1, L.P./TVI, Inc., 9.75%, 4/26/28(1) | $ | 44 | $ 44,439 |
| Group 1 Automotive, Inc., 4.00%, 8/15/28(1) | 400 | 344,727 | |
| Kohl's Corp., 4.625%, 5/1/31 | 108 | 73,969 | |
| $ 463,135 | |||
| Retailers (Except Food and Drug) — 0.3% | |||
| PetSmart, Inc./PetSmart Finance Corp., 7.75%, 2/15/29(1) | $ | 500 | $ 460,804 |
| $ 460,804 | |||
| Software and Services — 0.2% | |||
| Fair Isaac Corp., 4.00%, 6/15/28(1) | $ | 250 | $ 222,905 |
| $ 222,905 | |||
| Technology — 0.1% | |||
| athenahealth Group, Inc., 6.50%, 2/15/30(1) | $ | 160 | $ 130,891 |
| $ 130,891 | |||
| Telecommunications — 0.5% | |||
| Ciena Corp., 4.00%, 1/31/30(1) | $ | 100 | $ 83,437 |
| Connect Finco S.a.r.l./Connect US Finco, LLC, 6.75%, 10/1/26(1) | 200 | 186,657 | |
| LCPR Senior Secured Financing DAC, 6.75%, 10/15/27(1) | 200 | 181,204 | |
| Sprint Capital Corp., 6.875%, 11/15/28 | 191 | 196,159 | |
| Viasat, Inc., 5.625%, 4/15/27(1) | 42 | 36,704 | |
| $ 684,161 | |||
| Utilities — 0.5% | |||
| Calpine Corp.: | |||
| 4.50%, 2/15/28(1) | $ | 250 | $ 225,657 |
| 4.625%, 2/1/29(1) | 250 | 211,359 | |
| 5.25%, 6/1/26(1) | 25 | 23,950 | |
| Security | Principal Amount (000's omitted) | Value | |
| Utilities (continued) | |||
| NRG Energy, Inc., 3.375%, 2/15/29(1) | $ | 200 | $ 163,015 |
| TerraForm Power Operating, LLC, 5.00%, 1/31/28(1) | 70 | 64,197 | |
| $ 688,178 | |||
| Total Corporate Bonds (identified cost $18,880,862) | $ 18,046,688 | ||
| Preferred Stocks — 0.1% |
| Security | Shares | Value | |
| Nonferrous Metals/Minerals — 0.1% | |||
| ACNR Holdings, Inc., 15.00% (PIK)(10)(11) | 277 | $ 142,470 | |
| Total Preferred Stocks (identified cost $0) | $ 142,470 | ||
| Senior Floating-Rate Loans — 35.5%(16) |
| Borrower/Description | Principal Amount* (000's omitted) | Value | |
| Aerospace and Defense — 0.2% | |||
| Dynasty Acquisition Co., Inc.: | |||
| Term Loan, 9.324%, (SOFR + 4.00%), 8/24/28 | 154 | $ 152,361 | |
| Term Loan, 9.324%, (SOFR + 4.00%), 8/24/28 | 66 | 65,297 | |
| $ 217,658 | |||
| Airlines — 0.2% | |||
| Mileage Plus Holdings, LLC, Term Loan, 10.798%, (SOFR + 5.25%), 6/21/27 | 94 | $ 96,719 | |
| SkyMiles IP, Ltd., Term Loan, 9.166%, (SOFR + 3.75%), 10/20/27 | 240 | 246,075 | |
| $ 342,794 | |||
| Auto Components — 0.9% | |||
| Adient US, LLC, Term Loan, 8.689%, (SOFR + 3.25%), 4/10/28 | 79 | $ 79,467 | |
| Autokiniton US Holdings, Inc., Term Loan, 9.939%, (SOFR + 4.50%), 4/6/28 | 171 | 167,997 | |
| Clarios Global, L.P., Term Loan, 9.074%, (SOFR + 3.75%), 5/6/30 | 325 | 324,899 | |
| DexKo Global, Inc., Term Loan, 9.402%, (SOFR + 3.75%), 10/4/28 | 123 | 118,181 | |
| Garrett LX I S.a.r.l., Term Loan, 8.895%, (SOFR + 3.25%), 4/30/28 | 98 | 97,347 | |
| Borrower/Description | Principal Amount* (000's omitted) | Value | |
| Auto Components (continued) | |||
| Garrett Motion, Inc., Term Loan, 9.883%, (SOFR + 4.50%), 4/30/28 | 107 | $ 107,411 | |
| LTI Holdings, Inc., Term Loan, 10.189%, (SOFR + 4.75%), 7/24/26 | 24 | 23,020 | |
| RealTruck Group, Inc.: | |||
| Term Loan, 9.189%, (SOFR + 3.75%), 1/31/28 | 195 | 186,332 | |
| Term Loan, 10.406%, (SOFR + 5.00%), 1/31/28 | 100 | 95,906 | |
| TI Group Automotive Systems, LLC, Term Loan, 8.689%, (SOFR + 3.25%), 12/16/26 | 62 | 61,679 | |
| $ 1,262,239 | |||
| Automobiles — 0.8% | |||
| Bombardier Recreational Products, Inc., Term Loan, 7.424%, (SOFR + 2.00%), 5/24/27 | 770 | $ 764,646 | |
| MajorDrive Holdings IV, LLC: | |||
| Term Loan, 9.652%, (SOFR + 4.00%), 6/1/28 | 73 | 71,418 | |
| Term Loan, 11.04%, (SOFR + 5.50%), 6/1/29 | 222 | 219,686 | |
| Thor Industries, Inc., Term Loan, 8.439%, (SOFR + 3.00%), 2/1/26 | 41 | 40,939 | |
| $ 1,096,689 | |||
| Beverages — 0.1% | |||
| Arterra Wines Canada, Inc., Term Loan, 9.152%, (SOFR + 3.50%), 11/24/27 | 146 | $ 138,085 | |
| City Brewing Company, LLC, Term Loan, 9.164%, (SOFR + 3.50%), 4/5/28 | 98 | 72,576 | |
| $ 210,661 | |||
| Biotechnology — 0.0%(12) | |||
| Alkermes, Inc., Term Loan, 7.949%, (SOFR + 2.50%), 3/12/26 | 68 | $ 67,043 | |
| $ 67,043 | |||
| Building Products — 0.4% | |||
| Gardner Denver, Inc., Term Loan, 7.174%, (SOFR + 1.75%), 3/1/27 | 163 | $ 163,870 | |
| Ingersoll-Rand Services Company, Term Loan, 7.174%, (SOFR + 1.75%), 3/1/27 | 37 | 37,225 | |
| LHS Borrower, LLC, Term Loan, 10.174%, (SOFR + 4.75%), 2/16/29 | 122 | 107,379 | |
| Oscar AcquisitionCo, LLC, Term Loan, 9.99%, (SOFR + 4.50%), 4/29/29 | 124 | 120,733 | |
| Standard Industries, Inc., Term Loan, 7.953%, (SOFR + 2.50%), 9/22/28 | 156 | 156,106 | |
| $ 585,313 | |||
| Borrower/Description | Principal Amount* (000's omitted) | Value | |
| Capital Markets — 1.1% | |||
| Advisor Group, Inc., Term Loan, 9.824%, (SOFR + 4.50%), 8/17/28 | 169 | $ 168,432 | |
| Aretec Group, Inc.: | |||
| Term Loan, 9.674%, (SOFR + 4.25%), 10/1/25 | 191 | 190,664 | |
| Term Loan, 9.924%, (SOFR + 4.50%), 8/9/30 | 100 | 97,131 | |
| Brookfield Property REIT, Inc., Term Loan, 7.924%, (SOFR + 2.50%), 8/27/25 | 104 | 102,985 | |
| EIG Management Company, LLC, Term Loan, 9.177%, (SOFR + 3.75%), 2/22/25 | 47 | 47,250 | |
| FinCo I, LLC, Term Loan, 8.383%, (SOFR + 3.00%), 6/27/29 | 175 | 174,650 | |
| Franklin Square Holdings, L.P., Term Loan, 7.674%, (SOFR + 2.25%), 8/1/25 | 71 | 71,339 | |
| Hudson River Trading, LLC, Term Loan, 8.439%, (SOFR + 3.00%), 3/20/28 | 342 | 337,215 | |
| LPL Holdings, Inc., Term Loan, 7.165%, (SOFR + 1.75%), 11/12/26 | 193 | 192,941 | |
| Victory Capital Holdings, Inc., Term Loan, 7.772%, (SOFR + 2.25%), 7/1/26 | 123 | 122,831 | |
| $ 1,505,438 | |||
| Chemicals — 1.8% | |||
| Aruba Investments, Inc., Term Loan, 9.424%, (SOFR + 4.00%), 11/24/27 | 98 | $ 96,017 | |
| CPC Acquisition Corp., Term Loan, 9.402%, (SOFR + 3.75%), 12/29/27 | 109 | 86,019 | |
| Gemini HDPE, LLC, Term Loan, 8.645%, (SOFR + 3.00%), 12/31/27 | 111 | 110,349 | |
| INEOS Enterprises Holdings II Limited, Term Loan, 7.783%, (3 mo. EURIBOR + 4.00%), 7/7/30 | EUR | 25 | 25,684 |
| INEOS Styrolution US Holding, LLC, Term Loan, 8.189%, (SOFR + 2.75%), 1/29/26 | 391 | 384,809 | |
| INEOS US Finance, LLC: | |||
| Term Loan, 8.924%, (SOFR + 3.50%), 2/18/30 | 125 | 122,623 | |
| Term Loan, 9.174%, (SOFR + 3.75%), 11/8/27 | 498 | 492,172 | |
| Lonza Group AG, Term Loan, 9.415%, (SOFR + 3.93%), 7/3/28 | 269 | 228,705 | |
| Momentive Performance Materials, Inc., Term Loan, 9.824%, (SOFR + 4.50%), 3/29/28 | 124 | 118,778 | |
| Nouryon Finance B.V., Term Loan, 9.434%, (SOFR + 4.00%), 4/3/28 | 164 | 160,109 | |
| Olympus Water US Holding Corporation, Term Loan, 10.39%, (SOFR + 5.00%), 11/9/28 | 350 | 348,163 | |
| Tronox Finance, LLC, Term Loan, 8.116%, (SOFR + 2.50%), 3/10/28(17) | 208 | 204,511 | |
| W.R. Grace & Co.-Conn., Term Loan, 9.402%, (SOFR + 3.75%), 9/22/28 | 147 | 145,095 | |
| $ 2,523,034 | |||
| Borrower/Description | Principal Amount* (000's omitted) | Value | |
| Commercial Services & Supplies — 1.0% | |||
| Allied Universal Holdco, LLC, Term Loan, 9.174%, (SOFR + 3.75%), 5/12/28 | 460 | $ 437,219 | |
| EnergySolutions, LLC, Term Loan, 9.382%, (SOFR + 4.00%), 9/20/30 | 147 | 146,317 | |
| Garda World Security Corporation, Term Loan, 9.746%, (SOFR + 4.25%), 10/30/26 | 170 | 169,970 | |
| GFL Environmental, Inc., Term Loan, 7.912%, (SOFR + 2.50%), 5/31/27 | 111 | 111,528 | |
| LABL, Inc., Term Loan, 10.424%, (SOFR + 5.00%), 10/29/28 | 98 | 92,828 | |
| Monitronics International, Inc., Term Loan, 13.145%, (SOFR + 7.50%), 6/30/28 | 143 | 144,739 | |
| Phoenix Services International, LLC, Term Loan, 11.427%, (SOFR + 6.10%), 6/30/28 | 28 | 26,513 | |
| Tempo Acquisition, LLC, Term Loan, 8.074%, (SOFR + 2.75%), 8/31/28 | 124 | 123,994 | |
| TruGreen Limited Partnership, Term Loan, 9.424%, (SOFR + 4.00%), 11/2/27 | 97 | 91,463 | |
| $ 1,344,571 | |||
| Communications Equipment — 0.2% | |||
| CommScope, Inc., Term Loan, 8.689%, (SOFR + 3.25%), 4/6/26 | 264 | $ 228,617 | |
| $ 228,617 | |||
| Consumer Staples Distribution & Retail — 0.1% | |||
| Peer Holding III B.V., Term Loan, 10/19/30(18) | 150 | $ 149,437 | |
| $ 149,437 | |||
| Containers & Packaging — 0.7% | |||
| Berlin Packaging, LLC, Term Loan, 9.189%, (SOFR + 3.75%), 3/11/28(17) | 172 | $ 167,840 | |
| Clydesdale Acquisition Holdings, Inc., Term Loan, 9.599%, (SOFR + 4.18%), 4/13/29 | 74 | 71,775 | |
| Pregis TopCo Corporation, Term Loan, 9.074%, (SOFR + 3.75%), 7/31/26 | 96 | 95,446 | |
| Pretium Packaging, LLC, Term Loan - Second Lien, 9.995%, (SOFR + 4.60%), 10/2/28 | 92 | 70,121 | |
| Proampac PG Borrower, LLC, Term Loan, 10.585%, (SOFR + 4.50%), 9/15/28 | 175 | 173,177 | |
| Reynolds Group Holdings, Inc.: | |||
| Term Loan, 8.689%, (SOFR + 3.25%), 2/5/26 | 128 | 127,762 | |
| Term Loan, 8.689%, (SOFR + 3.25%), 9/24/28 | 147 | 146,483 | |
| Trident TPI Holdings, Inc., Term Loan, 9.652%, (SOFR + 4.00%), 9/15/28 | 123 | 121,250 | |
| $ 973,854 | |||
| Borrower/Description | Principal Amount* (000's omitted) | Value | |
| Diversified Consumer Services — 0.2% | |||
| Belron Finance US, LLC, Term Loan, 8.057%, (SOFR + 2.43%), 4/13/28 | 122 | $ 122,012 | |
| KUEHG Corp., Term Loan, 10.39%, (SOFR + 5.00%), 6/12/30 | 200 | 200,089 | |
| $ 322,101 | |||
| Diversified Telecommunication Services — 0.3% | |||
| Altice France S.A., Term Loan, 10.894%, (SOFR + 5.50%), 8/15/28 | 205 | $ 182,764 | |
| GEE Holdings 2, LLC: | |||
| Term Loan, 13.50%, (SOFR + 8.00%), 3/24/25 | 32 | 28,816 | |
| Term Loan - Second Lien, 13.75%, (SOFR + 8.25%), 7.00% cash, 6.75% PIK, 3/23/26 | 71 | 42,821 | |
| Virgin Media Bristol, LLC, Term Loan, 8.699%, (SOFR + 3.25%), 1/31/29 | 175 | 171,924 | |
| $ 426,325 | |||
| Electrical Equipment — 0.2% | |||
| Brookfield WEC Holdings, Inc., Term Loan, 8.189%, (SOFR + 2.75%), 8/1/25 | 310 | $ 309,653 | |
| $ 309,653 | |||
| Electronic Equipment, Instruments & Components — 0.6% | |||
| Chamberlain Group, Inc., Term Loan, 8.674%, (SOFR + 3.25%), 11/3/28 | 221 | $ 215,052 | |
| Creation Technologies, Inc., Term Loan, 11.176%, (SOFR + 5.50%), 10/5/28 | 148 | 139,993 | |
| II-VI Incorporated, Term Loan, 8.189%, (SOFR + 2.75%), 7/2/29 | 137 | 137,016 | |
| Mirion Technologies, Inc., Term Loan, 8.402%, (SOFR + 2.75%), 10/20/28 | 84 | 83,556 | |
| Robertshaw US Holding Corp.: | |||
| Term Loan, 13.49%, (SOFR + 8.00%), 8.49% cash, 5.00% PIK, 2/28/27 | 34 | 33,909 | |
| Term Loan - Second Lien, 12.49%, (SOFR + 7.00%), 2/28/27 | 142 | 119,810 | |
| Verifone Systems, Inc., Term Loan, 9.653%, (SOFR + 4.00%), 8/20/25 | 166 | 155,117 | |
| $ 884,453 | |||
| Energy Equipment & Services — 0.1% | |||
| Ameriforge Group, Inc.: | |||
| Term Loan, 16.731%, (SOFR + 13.00%), 12/29/23(13)(19) | 11 | $ 9,159 | |
| Term Loan, 18.456%, (SOFR + 13.00%), 13.456% cash, 5.00% PIK, 12/29/23(13)(17) | 90 | 71,903 | |
| Borrower/Description | Principal Amount* (000's omitted) | Value | |
| Energy Equipment & Services (continued) | |||
| Lealand Finance Company B.V., Term Loan, 12.439%, (SOFR + 7.00%), 9.439% cash, 3.00% PIK, 6/30/25 | 31 | $ 17,180 | |
| $ 98,242 | |||
| Engineering & Construction — 0.4% | |||
| Aegion Corporation, Term Loan, 10.395%, (SOFR + 4.75%), 5/17/28 | 74 | $ 73,108 | |
| American Residential Services, LLC, Term Loan, 9.152%, (SOFR + 3.50%), 10/15/27 | 97 | 97,128 | |
| Northstar Group Services, Inc., Term Loan, 10.939%, (SOFR + 5.50%), 11/12/26 | 186 | 186,121 | |
| USIC Holdings, Inc., Term Loan, 8.939%, (SOFR + 3.50%), 5/12/28 | 166 | 160,998 | |
| $ 517,355 | |||
| Entertainment — 0.2% | |||
| Crown Finance US, Inc., Term Loan, 7.381%, (SOFR + 1.50%), 7/31/28 | 52 | $ 53,396 | |
| Renaissance Holding Corp., Term Loan, 10.074%, (SOFR + 4.75%), 4/5/30 | 150 | 148,156 | |
| Vue International Bidco PLC: | |||
| Term Loan, 12.13%, (6 mo. EURIBOR + 8.00%), 6/30/27 | EUR | 12 | 12,283 |
| Term Loan, 12.63%, (6 mo. EURIBOR + 8.50%), 6.13% cash, 6.50% PIK, 12/31/27 | EUR | 83 | 39,086 |
| $ 252,921 | |||
| Equity Real Estate Investment Trusts (REITs) — 0.1% | |||
| Iron Mountain, Inc., Term Loan, 7.189%, (1 mo. USD LIBOR + 1.75%), 1/2/26 | 118 | $ 118,014 | |
| $ 118,014 | |||
| Financial Services — 0.5% | |||
| Ditech Holding Corporation, Term Loan, 0.00%, 3/28/24(14) | 254 | $ 27,945 | |
| GTCR W Merger Sub, LLC, Term Loan, 9/20/30(18) | 425 | 422,420 | |
| NCR Atleos, LLC, Term Loan, 10.176%, (SOFR + 4.75%), 3/27/29 | 200 | 192,041 | |
| $ 642,406 | |||
| Food & Staples Retailing — 0.1% | |||
| US Foods, Inc., Term Loan, 7.439%, (SOFR + 2.00%), 9/13/26 | 187 | $ 186,875 | |
| $ 186,875 | |||
| Borrower/Description | Principal Amount* (000's omitted) | Value | |
| Food Products — 0.2% | |||
| Froneri International, Ltd., Term Loan, 7.674%, (SOFR + 2.25%), 1/29/27 | 290 | $ 288,648 | |
| $ 288,648 | |||
| Health Care Equipment & Supplies — 0.3% | |||
| Bayou Intermediate II, LLC, Term Loan, 10.128%, (SOFR + 4.50%), 8/2/28 | 123 | $ 117,900 | |
| Gloves Buyer, Inc., Term Loan, 10.439%, (SOFR + 5.00%), 12/29/27 | 100 | 96,259 | |
| Journey Personal Care Corp., Term Loan, 9.981%, (6 mo. USD LIBOR + 4.25%), 3/1/28 | 171 | 164,487 | |
| $ 378,646 | |||
| Health Care Providers & Services — 1.9% | |||
| AEA International Holdings (Lux) S.a.r.l., Term Loan, 9.402%, (SOFR + 3.75%), 9/7/28 | 147 | $ 147,006 | |
| BW NHHC Holdco, Inc., Term Loan - Second Lien, 13.39%, (SOFR + 8.00%), 1/15/26 | 145 | 124,050 | |
| Cano Health, LLC, Term Loan, 9.533%, (SOFR + 4.00%), 11/23/27(17) | 76 | 44,586 | |
| CHG Healthcare Services, Inc., Term Loan, 8.689%, (SOFR + 3.25%), 9/29/28 | 147 | 145,599 | |
| CNT Holdings I Corp., Term Loan, 8.926%, (SOFR + 3.50%), 11/8/27 | 98 | 97,134 | |
| Covis Finco S.a.r.l., Term Loan, 12.04%, (SOFR + 6.50%), 2/18/27 | 109 | 78,389 | |
| Electron BidCo, Inc., Term Loan, 8.439%, (SOFR + 3.00%), 11/1/28 | 123 | 122,038 | |
| Ensemble RCM, LLC, Term Loan, 9.233%, (SOFR + 3.75%), 8/3/26 | 243 | 243,450 | |
| Envision Healthcare Corporation: | |||
| Term Loan, 0.00%, 3/31/27(14) | 76 | 90,102 | |
| Term Loan - Second Lien, 0.00%, 3/31/27(14) | 534 | 93,527 | |
| Medical Solutions Holdings, Inc., Term Loan, 8.773%, (SOFR + 3.25%), 11/1/28 | 197 | 184,261 | |
| National Mentor Holdings, Inc.: | |||
| Term Loan, 9.187%, (SOFR + 3.75%), 3/2/28(17) | 319 | 279,078 | |
| Term Loan, 9.24%, (SOFR + 3.75%), 3/2/28 | 9 | 8,299 | |
| Phoenix Guarantor, Inc., Term Loan, 8.689%, (SOFR + 3.25%), 3/5/26 | 263 | 261,101 | |
| Radnet Management, Inc., Term Loan, 8.498%, (SOFR + 3.00%), 4/21/28 | 140 | 140,122 | |
| Select Medical Corporation, Term Loan, 8.324%, (SOFR + 3.00%), 3/6/27 | 373 | 372,048 | |
| Surgery Center Holdings, Inc., Term Loan, 9.203%, (SOFR + 3.75%), 8/31/26 | 195 | 195,212 | |
| $ 2,626,002 | |||
| Borrower/Description | Principal Amount* (000's omitted) | Value | |
| Health Care Technology — 0.9% | |||
| Imprivata, Inc., Term Loan, 9.189%, (SOFR + 3.75%), 12/1/27 | 171 | $ 170,198 | |
| MedAssets Software Intermediate Holdings, Inc., Term Loan, 9.439%, (SOFR + 4.00%), 12/18/28 | 148 | 117,276 | |
| Navicure, Inc., Term Loan, 9.439%, (SOFR + 4.00%), 10/22/26 | 242 | 242,132 | |
| PointClickCare Technologies, Inc., Term Loan, 8.765%, (SOFR + 3.00%), 12/29/27 | 98 | 97,378 | |
| Project Ruby Ultimate Parent Corp., Term Loan, 8.689%, (SOFR + 3.25%), 3/10/28 | 171 | 167,550 | |
| Symplr Software, Inc., Term Loan, 9.983%, (SOFR + 4.50%), 12/22/27 | 146 | 128,771 | |
| Verscend Holding Corp., Term Loan, 9.439%, (SOFR + 4.00%), 8/27/25 | 312 | 312,381 | |
| $ 1,235,686 | |||
| Hotels, Restaurants & Leisure — 1.8% | |||
| 1011778 B.C. Unlimited Liability Company, Term Loan, 7.574%, (SOFR + 2.25%), 9/20/30 | 844 | $ 839,520 | |
| Carnival Corporation, Term Loan, 8.689%, (SOFR + 3.25%), 10/18/28 | 368 | 362,296 | |
| ClubCorp Holdings, Inc., Term Loan, 8.181%, (1 mo. USD LIBOR + 2.75%), 9/18/26 | 247 | 241,812 | |
| Fertitta Entertainment, LLC, Term Loan, 9.324%, (SOFR + 4.00%), 1/27/29 | 226 | 221,111 | |
| IRB Holding Corp., Term Loan, 8.424%, (SOFR + 3.00%), 12/15/27 | 244 | 241,453 | |
| Playa Resorts Holding B.V., Term Loan, 9.585%, (SOFR + 4.25%), 1/5/29 | 199 | 198,128 | |
| SeaWorld Parks & Entertainment, Inc., Term Loan, 8.439%, (SOFR + 3.00%), 8/25/28 | 123 | 122,449 | |
| Stars Group Holdings B.V. (The), Term Loan, 7.902%, (SOFR + 2.25%), 7/21/26 | 343 | 343,195 | |
| $ 2,569,964 | |||
| Household Durables — 0.3% | |||
| ACProducts, Inc., Term Loan, 9.902%, (SOFR + 4.25%), 5/17/28 | 269 | $ 214,378 | |
| Serta Simmons Bedding, LLC, Term Loan, 12.90%, (SOFR + 7.50%), 6/29/28 | 252 | 249,662 | |
| $ 464,040 | |||
| Household Products — 0.1% | |||
| Kronos Acquisition Holdings, Inc., Term Loan, 9.402%, (SOFR + 3.75%), 12/22/26 | 195 | $ 190,961 | |
| $ 190,961 | |||
| Borrower/Description | Principal Amount* (000's omitted) | Value | |
| Independent Power and Renewable Electricity Producers — 0.1% | |||
| Calpine Construction Finance Company L.P., Term Loan, 7.574%, (SOFR + 2.25%), 7/31/30 | 160 | $ 158,598 | |
| $ 158,598 | |||
| Insurance — 1.4% | |||
| Alliant Holdings Intermediate, LLC, Term Loan, 8.835%, (SOFR + 3.50%), 11/5/27 | 149 | $ 148,433 | |
| AmWINS Group, Inc., Term Loan, 7.689%, (SOFR + 2.25%), 2/19/28 | 608 | 603,452 | |
| AssuredPartners, Inc., Term Loan, 8.939%, (SOFR + 3.50%), 2/12/27 | 24 | 23,895 | |
| HUB International Limited, Term Loan, 9.662%, (SOFR + 4.25%), 6/20/30 | 546 | 546,660 | |
| NFP Corp., Term Loan, 8.689%, (SOFR + 3.25%), 2/16/27 | 48 | 46,809 | |
| Ryan Specialty Group, LLC, Term Loan, 8.424%, (SOFR + 3.00%), 9/1/27 | 267 | 267,000 | |
| USI, Inc., Term Loan, 9.14%, (SOFR + 3.75%), 11/22/29 | 376 | 376,112 | |
| $ 2,012,361 | |||
| Interactive Media & Services — 0.1% | |||
| Getty Images, Inc., Term Loan, 9.99%, (SOFR + 4.50%), 2/19/26 | 92 | $ 92,567 | |
| Match Group, Inc., Term Loan, 7.298%, (SOFR + 1.75%), 2/13/27 | 100 | 99,719 | |
| $ 192,286 | |||
| IT Services — 2.4% | |||
| Asurion, LLC: | |||
| Term Loan, 8.689%, (SOFR + 3.25%), 12/23/26 | 486 | $ 470,675 | |
| Term Loan, 8.689%, (SOFR + 3.25%), 7/31/27 | 39 | 37,294 | |
| Term Loan, 9.424%, (SOFR + 4.00%), 8/19/28 | 220 | 210,553 | |
| Term Loan - Second Lien, 10.689%, (SOFR + 5.25%), 1/31/28 | 50 | 43,646 | |
| Endure Digital, Inc., Term Loan, 9.422%, (SOFR + 3.50%), 2/10/28 | 440 | 409,427 | |
| Gainwell Acquisition Corp., Term Loan, 9.49%, (SOFR + 4.00%), 10/1/27 | 828 | 793,175 | |
| Go Daddy Operating Company, LLC, Term Loan, 7.824%, (SOFR + 2.50%), 11/9/29 | 578 | 579,416 | |
| Informatica, LLC, Term Loan, 8.189%, (SOFR + 2.75%), 10/27/28 | 369 | 369,086 | |
| Rackspace Technology Global, Inc., Term Loan, 8.206%, (SOFR + 2.75%), 2/15/28 | 219 | 98,883 | |
| Borrower/Description | Principal Amount* (000's omitted) | Value | |
| IT Services (continued) | |||
| Sedgwick Claims Management Services, Inc., Term Loan, 9.074%, (SOFR + 3.75%), 2/24/28 | 167 | $ 166,799 | |
| Skopima Merger Sub, Inc., Term Loan, 9.439%, (SOFR + 4.00%), 5/12/28 | 221 | 213,924 | |
| $ 3,392,878 | |||
| Leisure Products — 0.2% | |||
| Amer Sports Oyj, Term Loan, 7.948%, (3 mo. EURIBOR + 4.00%), 3/30/26 | EUR | 263 | $ 275,842 |
| $ 275,842 | |||
| Life Sciences Tools & Services — 0.5% | |||
| Catalent Pharma Solutions, Inc., Term Loan, 7.453%, (SOFR + 2.00%), 2/22/28 | 144 | $ 140,514 | |
| Packaging Coordinators Midco, Inc., Term Loan, 9.152%, (SOFR + 3.50%), 11/30/27 | 220 | 217,378 | |
| Sotera Health Holdings, LLC, Term Loan, 8.395%, (SOFR + 2.75%), 12/11/26 | 100 | 99,600 | |
| Star Parent, Inc., Term Loan, 9.386%, (3 mo. USD LIBOR + 4.00%), 9/27/30 | 200 | 191,396 | |
| $ 648,888 | |||
| Machinery — 1.7% | |||
| Albion Financing 3 S.a.r.l., Term Loan, 10.924%, (SOFR + 5.25%), 8/17/26 | 221 | $ 221,062 | |
| Alliance Laundry Systems, LLC, Term Loan, 8.932%, (SOFR + 3.50%), 10/8/27 | 162 | 161,972 | |
| American Trailer World Corp., Term Loan, 9.174%, (SOFR + 3.75%), 3/3/28 | 34 | 32,089 | |
| Apex Tool Group, LLC, Term Loan, 10.689%, (SOFR + 5.25%), 2/8/29 | 264 | 225,264 | |
| Conair Holdings, LLC, Term Loan, 9.189%, (SOFR + 3.75%), 5/17/28 | 221 | 204,927 | |
| CPM Holdings, Inc., Term Loan, 9.827%, (SOFR + 4.50%), 9/28/28 | 47 | 46,561 | |
| EMRLD Borrower, L.P., Term Loan, 8.38%, (SOFR + 3.00%), 5/31/30 | 175 | 174,891 | |
| Filtration Group Corporation, Term Loan, 8.939%, (SOFR + 3.50%), 10/21/28 | 98 | 97,388 | |
| Gates Global, LLC, Term Loan, 7.924%, (SOFR + 2.50%), 3/31/27 | 287 | 287,296 | |
| Icebox Holdco III, Inc., Term Loan, 9.402%, (SOFR + 3.75%), 12/22/28 | 123 | 120,870 | |
| SPX Flow, Inc., Term Loan, 9.924%, (SOFR + 4.50%), 4/5/29 | 174 | 173,003 | |
| Borrower/Description | Principal Amount* (000's omitted) | Value | |
| Machinery (continued) | |||
| Titan Acquisition Limited, Term Loan, 8.731%, (3 mo. USD LIBOR + 3.00%), 3/28/25 | 402 | $ 395,979 | |
| Vertical US Newco, Inc., Term Loan, 9.381%, (SOFR + 3.50%), 7/30/27 | 194 | 193,017 | |
| $ 2,334,319 | |||
| Media — 0.8% | |||
| CSC Holdings, LLC: | |||
| Term Loan, 7.699%, (1 mo. USD LIBOR + 2.25%), 7/17/25 | 430 | $ 417,994 | |
| Term Loan, 7.699%, (1 mo. USD LIBOR + 2.25%), 1/15/26 | 143 | 137,803 | |
| Gray Television, Inc.: | |||
| Term Loan, 7.929%, (SOFR + 2.50%), 1/2/26 | 85 | 84,849 | |
| Term Loan, 8.429%, (SOFR + 3.00%), 12/1/28 | 147 | 141,736 | |
| Hubbard Radio, LLC, Term Loan, 9.69%, (1 mo. USD LIBOR + 4.25%), 3/28/25 | 72 | 60,756 | |
| iHeartCommunications, Inc., Term Loan, 8.439%, (SOFR + 3.00%), 5/1/26 | 67 | 56,987 | |
| Magnite, Inc., Term Loan, 10.538%, (SOFR + 5.00%), 4/28/28(17) | 98 | 98,300 | |
| Sinclair Television Group, Inc., Term Loan, 7.939%, (SOFR + 2.50%), 9/30/26 | 96 | 81,055 | |
| $ 1,079,480 | |||
| Metals/Mining — 0.2% | |||
| PMHC II, Inc., Term Loan, 9.807%, (SOFR + 4.25%), 4/23/29 | 199 | $ 181,536 | |
| Zekelman Industries, Inc., Term Loan, 7.449%, (SOFR + 2.00%), 1/24/27 | 119 | 119,387 | |
| $ 300,923 | |||
| Oil, Gas & Consumable Fuels — 0.5% | |||
| Freeport LNG Investments, LLP, Term Loan, 9.177%, (SOFR + 3.50%), 12/21/28 | 98 | $ 95,964 | |
| Matador Bidco S.a.r.l., Term Loan, 9.924%, (SOFR + 4.50%), 10/15/26 | 131 | 131,338 | |
| Oryx Midstream Services Permian Basin, LLC, Term Loan, 8.692%, (SOFR + 3.25%), 10/5/28 | 146 | 146,454 | |
| QuarterNorth Energy Holding, Inc., Term Loan - Second Lien, 13.439%, (SOFR + 8.00%), 8/27/26 | 55 | 55,160 | |
| UGI Energy Services, LLC, Term Loan, 8.674%, (SOFR + 3.25%), 2/22/30 | 218 | 218,221 | |
| $ 647,137 | |||
| Borrower/Description | Principal Amount* (000's omitted) | Value | |
| Personal Products — 0.2% | |||
| HLF Financing S.a.r.l., Term Loan, 7.939%, (SOFR + 2.50%), 8/18/25 | 131 | $ 129,456 | |
| Sunshine Luxembourg VII S.a.r.l., Term Loan, 9.24%, (SOFR + 3.75%), 10/1/26 | 146 | 146,240 | |
| $ 275,696 | |||
| Pharmaceuticals — 1.1% | |||
| Bausch Health Companies, Inc., Term Loan, 10.689%, (SOFR + 5.25%), 2/1/27 | 394 | $ 309,036 | |
| Elanco Animal Health Incorporated, Term Loan, 7.165%, (SOFR + 1.75%), 8/1/27 | 270 | 264,162 | |
| Jazz Financing Lux S.a.r.l., Term Loan, 8.939%, (SOFR + 3.50%), 5/5/28 | 220 | 220,426 | |
| Mallinckrodt International Finance S.A.: | |||
| DIP Loan, 13.439%, (SOFR + 8.00%), 8/28/24 | 30 | 30,769 | |
| DIP Loan, 13.451%, (SOFR + 8.00%), 8/28/24 | 56 | 58,315 | |
| Term Loan, 12.703%, (SOFR + 7.25%), 9/30/27 | 625 | 476,101 | |
| Term Loan, 12.953%, (SOFR + 7.50%), 9/30/27 | 209 | 159,405 | |
| $ 1,518,214 | |||
| Professional Services — 1.2% | |||
| AlixPartners, LLP, Term Loan, 8.189%, (SOFR + 2.75%), 2/4/28 | 219 | $ 219,390 | |
| Camelot U.S. Acquisition, LLC: | |||
| Term Loan, 8.439%, (SOFR + 3.00%), 10/30/26 | 224 | 224,440 | |
| Term Loan, 8.439%, (SOFR + 3.00%), 10/30/26 | 144 | 144,251 | |
| CoreLogic, Inc., Term Loan, 8.939%, (SOFR + 3.50%), 6/2/28 | 390 | 355,903 | |
| Deerfield Dakota Holding, LLC, Term Loan, 9.14%, (SOFR + 3.75%), 4/9/27 | 314 | 304,297 | |
| Employbridge Holding Company, Term Loan, 10.407%, (SOFR + 4.75%), 7/19/28 | 221 | 192,317 | |
| Techem Verwaltungsgesellschaft 675 mbH, Term Loan, 6.275%, (6 mo. EURIBOR + 2.38%), 7/15/25 | EUR | 111 | 116,916 |
| Trans Union, LLC, Term Loan, 7.689%, (SOFR + 2.25%), 12/1/28 | 186 | 185,834 | |
| $ 1,743,348 | |||
| Real Estate Management & Development — 0.4% | |||
| Cushman & Wakefield U.S. Borrower, LLC: | |||
| Term Loan, 8.189%, (SOFR + 2.75%), 8/21/25 | 19 | $ 19,213 | |
| Term Loan, 8.674%, (SOFR + 3.25%), 1/31/30 | 406 | 389,104 | |
| Term Loan, 9.324%, (SOFR + 4.00%), 1/31/30 | 167 | 159,586 | |
| $ 567,903 | |||
| Borrower/Description | Principal Amount* (000's omitted) | Value | |
| Road & Rail — 0.4% | |||
| Grab Holdings, Inc., Term Loan, 9.939%, (SOFR + 4.50%), 1/29/26 | 154 | $ 154,794 | |
| Kenan Advantage Group, Inc., Term Loan, 9.477%, (SOFR + 3.75%), 3/24/26 | 340 | 339,879 | |
| Uber Technologies, Inc., Term Loan, 8.159%, (SOFR + 2.75%), 3/3/30 | 110 | 110,322 | |
| $ 604,995 | |||
| Semiconductors & Semiconductor Equipment — 0.2% | |||
| Altar Bidco, Inc., Term Loan, 8.142%, (SOFR + 3.10%), 2/1/29(17) | 173 | $ 171,501 | |
| Ultra Clean Holdings, Inc., Term Loan, 9.191%, (SOFR + 3.75%), 8/27/25 | 152 | 152,366 | |
| $ 323,867 | |||
| Software — 6.3% | |||
| Applied Systems, Inc., Term Loan, 9.89%, (SOFR + 4.50%), 9/18/26 | 674 | $ 676,616 | |
| AppLovin Corporation, Term Loan, 8.424%, (SOFR + 3.10%), 8/16/30 | 208 | 207,538 | |
| AQA Acquisition Holding, Inc., Term Loan, 9.895%, (SOFR + 4.25%), 3/3/28 | 122 | 121,386 | |
| Astra Acquisition Corp.: | |||
| Term Loan, 10.902%, (SOFR + 5.25%), 10/25/28 | 148 | 101,808 | |
| Term Loan - Second Lien, 14.527%, (SOFR + 8.88%), 10/25/29 | 250 | 131,218 | |
| Banff Merger Sub, Inc.: | |||
| Term Loan, 9.189%, (SOFR + 3.75%), 10/2/25 | 342 | 341,704 | |
| Term Loan - Second Lien, 10.939%, (SOFR + 5.50%), 2/27/26 | 125 | 124,505 | |
| Central Parent, Inc., Term Loan, 9.406%, (SOFR + 4.00%), 7/6/29 | 323 | 321,225 | |
| CentralSquare Technologies, LLC, Term Loan, 9.29%, (SOFR + 3.75%), 8/29/25 | 194 | 183,419 | |
| Ceridian HCM Holding, Inc., Term Loan, 7.939%, (SOFR + 2.50%), 4/30/25 | 214 | 214,106 | |
| Cloud Software Group, Inc., Term Loan, 9.99%, (SOFR + 4.50%), 3/30/29(17) | 224 | 213,157 | |
| Cloudera, Inc., Term Loan, 9.174%, (SOFR + 3.75%), 10/8/28 | 393 | 379,081 | |
| Constant Contact, Inc., Term Loan, 9.687%, (SOFR + 4.00%), 2/10/28 | 270 | 251,158 | |
| Cornerstone OnDemand, Inc., Term Loan, 9.189%, (SOFR + 3.75%), 10/16/28 | 197 | 186,473 | |
| Delta TopCo, Inc.: | |||
| Term Loan, 9.069%, (SOFR + 3.75%), 12/1/27 | 219 | 216,301 | |
| Term Loan - Second Lien, 12.569%, (SOFR + 7.25%), 12/1/28 | 300 | 297,750 | |
| Borrower/Description | Principal Amount* (000's omitted) | Value | |
| Software (continued) | |||
| E2open, LLC, Term Loan, 8.939%, (SOFR + 3.50%), 2/4/28 | 122 | $ 120,739 | |
| ECI Macola Max Holding, LLC, Term Loan, 9.402%, (SOFR + 3.75%), 11/9/27 | 195 | 193,923 | |
| Epicor Software Corporation: | |||
| Term Loan, 8.689%, (SOFR + 3.25%), 7/30/27 | 96 | 96,018 | |
| Term Loan, 9.074%, (SOFR + 3.75%), 7/30/27 | 125 | 125,359 | |
| GoTo Group, Inc., Term Loan, 10.283%, (SOFR + 4.75%), 8/31/27 | 267 | 169,321 | |
| Greeneden U.S. Holdings II, LLC, Term Loan, 9.403%, (SOFR + 4.00%), 12/1/27 | 122 | 121,629 | |
| Imperva, Inc., Term Loan, 9.627%, (SOFR + 4.00%), 1/12/26 | 97 | 97,144 | |
| Ivanti Software, Inc., Term Loan, 9.907%, (SOFR + 4.25%), 12/1/27 | 214 | 190,638 | |
| Magenta Buyer, LLC: | |||
| Term Loan, 10.645%, (SOFR + 5.00%), 7/27/28 | 289 | 202,045 | |
| Term Loan - Second Lien, 13.895%, (SOFR + 8.25%), 7/27/29 | 75 | 32,475 | |
| Maverick Bidco, Inc., Term Loan, 9.283%, (SOFR + 3.75%), 5/18/28 | 123 | 119,930 | |
| McAfee, LLC, Term Loan, 9.165%, (SOFR + 3.75%), 3/1/29 | 395 | 378,295 | |
| Open Text Corporation, Term Loan, 8.174%, (SOFR + 2.75%), 1/31/30 | 194 | 194,524 | |
| Polaris Newco, LLC, Term Loan, 9.439%, (SOFR + 4.00%), 6/2/28 | 368 | 347,885 | |
| Proofpoint, Inc., Term Loan, 8.689%, (SOFR + 3.25%), 8/31/28 | 368 | 362,809 | |
| RealPage, Inc., Term Loan, 8.439%, (SOFR + 3.00%), 4/24/28 | 392 | 383,403 | |
| Sabre GLBL, Inc., Term Loan, 9.674%, (SOFR + 4.25%), 6/30/28 | 175 | 149,917 | |
| SolarWinds Holdings, Inc., Term Loan, 9.074%, (SOFR + 3.75%), 2/5/27 | 249 | 248,983 | |
| SS&C European Holdings S.a.r.l., Term Loan, 7.189%, (SOFR + 1.75%), 4/16/25 | 121 | 121,416 | |
| SS&C Technologies, Inc., Term Loan, 7.189%, (SOFR + 1.75%), 4/16/25 | 128 | 128,581 | |
| Ultimate Software Group, Inc. (The): | |||
| Term Loan, 8.764%, (SOFR + 3.25%), 5/4/26 | 608 | 605,539 | |
| Term Loan, 9.233%, (SOFR + 3.75%), 5/4/26 | 240 | 239,719 | |
| Veritas US, Inc., Term Loan, 10.439%, (SOFR + 5.11%), 9/1/25 | 388 | 329,459 | |
| $ 8,927,196 | |||
| Borrower/Description | Principal Amount* (000's omitted) | Value | |
| Specialty Retail — 0.9% | |||
| Great Outdoors Group, LLC, Term Loan, 9.402%, (SOFR + 3.75%), 3/6/28 | 389 | $ 386,750 | |
| Hoya Midco, LLC, Term Loan, 8.633%, (SOFR + 3.25%), 2/3/29 | 74 | 73,953 | |
| Les Schwab Tire Centers, Term Loan, 8.692%, (SOFR + 3.25%), 11/2/27 | 438 | 437,203 | |
| Mattress Firm, Inc., Term Loan, 9.95%, (6 mo. USD LIBOR + 4.25%), 9/25/28 | 165 | 163,576 | |
| PetSmart, Inc., Term Loan, 9.174%, (SOFR + 3.75%), 2/11/28 | 220 | 217,758 | |
| $ 1,279,240 | |||
| Trading Companies & Distributors — 1.0% | |||
| Electro Rent Corporation, Term Loan, 11.002%, (SOFR + 5.50%), 11/1/24 | 258 | $ 242,407 | |
| Park River Holdings, Inc., Term Loan, 8.907%, (SOFR + 3.25%), 12/28/27 | 97 | 92,415 | |
| Spin Holdco, Inc., Term Loan, 9.664%, (SOFR + 4.00%), 3/4/28 | 585 | 502,871 | |
| SRS Distribution, Inc., Term Loan, 8.939%, (SOFR + 3.50%), 6/2/28 | 147 | 143,564 | |
| White Cap Buyer, LLC, Term Loan, 9.074%, (SOFR + 3.75%), 10/19/27 | 315 | 313,619 | |
| Windsor Holdings III, LLC, Term Loan, 9.815%, (SOFR + 4.50%), 8/1/30 | 150 | 149,725 | |
| $ 1,444,601 | |||
| Transportation Infrastructure — 0.1% | |||
| Brown Group Holding, LLC, Term Loan, 8.174%, (SOFR + 2.75%), 6/7/28 | 184 | $ 181,402 | |
| $ 181,402 | |||
| Wireless Telecommunication Services — 0.1% | |||
| Digicel International Finance Limited, Term Loan, 8.902%, (3 mo. USD LIBOR + 3.25%), 5/28/24 | 118 | $ 108,199 | |
| $ 108,199 | |||
| Total Senior Floating-Rate Loans (identified cost $52,345,551) | $ 50,037,013 | ||
| Sovereign Government Bonds — 14.6% |
| Security | Principal Amount* (000's omitted) | Value | |
| Albania — 0.3% | |||
| Albania Government International Bond, 5.90%, 6/9/28(15) | EUR | 427 | $ 437,515 |
| $ 437,515 | |||
| Angola — 0.1% | |||
| Republic of Angola, 8.75%, 4/14/32(15) | 230 | $ 179,625 | |
| $ 179,625 | |||
| Argentina — 0.4% | |||
| Republic of Argentina: | |||
| 0.75% to 7/9/27, 7/9/30(4) | 194 | $ 54,467 | |
| 1.00%, 7/9/29 | 248 | 67,117 | |
| 3.50% to 7/9/29, 7/9/41(4) | 410 | 108,420 | |
| 3.625% to 7/9/24, 7/9/35(4) | 450 | 112,315 | |
| 4.25% to 7/9/24, 1/9/38(4) | 770 | 234,515 | |
| $ 576,834 | |||
| Bahrain — 0.5% | |||
| Kingdom of Bahrain: | |||
| 5.625%, 9/30/31(15) | 350 | $ 306,066 | |
| 6.75%, 9/20/29(15) | 200 | 193,535 | |
| 7.375%, 5/14/30(15) | 200 | 198,228 | |
| $ 697,829 | |||
| Barbados — 0.3% | |||
| Government of Barbados, 6.50%, 10/1/29(1) | 385 | $ 363,240 | |
| $ 363,240 | |||
| Benin — 0.4% | |||
| Benin Government International Bond: | |||
| 4.875%, 1/19/32(15) | EUR | 241 | $ 191,321 |
| 4.95%, 1/22/35(15) | EUR | 100 | 72,009 |
| 6.875%, 1/19/52(15) | EUR | 445 | 309,530 |
| $ 572,860 | |||
| Chile — 0.6% | |||
| Chile Government International Bond: | |||
| 2.45%, 1/31/31 | 200 | $ 161,637 | |
| 2.55%, 7/27/33 | 550 | 413,388 | |
| Security | Principal Amount* (000's omitted) | Value | |
| Chile (continued) | |||
| Chile Government International Bond: (continued) | |||
| 3.50%, 4/15/53 | 340 | $ 212,592 | |
| $ 787,617 | |||
| Costa Rica — 0.1% | |||
| Costa Rica Government International Bond, 6.55%, 4/3/34(15) | 200 | $ 190,833 | |
| $ 190,833 | |||
| Croatia — 0.1% | |||
| Croatia Government International Bond, 1.75%, 3/4/41(15) | EUR | 100 | $ 71,563 |
| $ 71,563 | |||
| Dominican Republic — 0.4% | |||
| Dominican Republic: | |||
| 5.875%, 1/30/60(15) | 191 | $ 136,372 | |
| 6.00%, 7/19/28(15) | 200 | 190,320 | |
| 6.40%, 6/5/49(15) | 160 | 126,142 | |
| 6.85%, 1/27/45(15) | 150 | 125,573 | |
| $ 578,407 | |||
| Ecuador — 0.2% | |||
| Republic of Ecuador, 2.50%, 7/31/40(15) | 1,260 | $ 311,865 | |
| $ 311,865 | |||
| Egypt — 0.3% | |||
| Arab Republic of Egypt: | |||
| 8.50%, 1/31/47(15) | 318 | $ 166,139 | |
| 8.70%, 3/1/49(15) | 200 | 106,000 | |
| 8.875%, 5/29/50(15) | 200 | 106,852 | |
| $ 378,991 | |||
| El Salvador — 0.3% | |||
| Republic of El Salvador: | |||
| 5.875%, 1/30/25(15) | 26 | $ 23,953 | |
| 6.375%, 1/18/27(15) | 173 | 142,314 | |
| 7.65%, 6/15/35(15) | 10 | 7,049 | |
| 8.25%, 4/10/32(15) | 242 | 191,110 | |
| $ 364,426 | |||
| Security | Principal Amount* (000's omitted) | Value | |
| Ethiopia — 0.2% | |||
| Ethiopia Government International Bond, 6.625%, 12/11/24(15) | 400 | $ 253,915 | |
| $ 253,915 | |||
| Ghana — 0.3% | |||
| Ghana Government International Bond: | |||
| 7.625%, 5/16/29(14)(15) | 200 | $ 85,706 | |
| 7.75%, 4/7/29(14)(15) | 290 | 124,726 | |
| 8.125%, 3/26/32(14)(15) | 290 | 122,986 | |
| 8.627%, 6/16/49(14)(15) | 320 | 134,024 | |
| $ 467,442 | |||
| Guatemala — 0.1% | |||
| Guatemala Government International Bond, 5.375%, 4/24/32(15) | 200 | $ 178,339 | |
| $ 178,339 | |||
| Hungary — 0.4% | |||
| Hungary Government International Bond: | |||
| 2.125%, 9/22/31(15) | 310 | $ 224,089 | |
| 6.25%, 9/22/32(1)(15) | 400 | 385,526 | |
| $ 609,615 | |||
| India — 0.2% | |||
| Export-Import Bank of India, 2.25%, 1/13/31(15) | 368 | $ 282,813 | |
| $ 282,813 | |||
| Indonesia — 0.9% | |||
| Indonesia Government International Bond: | |||
| 3.55%, 3/31/32 | 554 | $ 468,364 | |
| 4.65%, 9/20/32 | 400 | 367,212 | |
| 4.85%, 1/11/33 | 400 | 374,400 | |
| $ 1,209,976 | |||
| Ivory Coast — 0.4% | |||
| Ivory Coast Government International Bond: | |||
| 6.625%, 3/22/48(15) | EUR | 325 | $ 231,691 |
| 6.875%, 10/17/40(15) | EUR | 512 | 393,768 |
| $ 625,459 | |||
| Jordan — 0.1% | |||
| Kingdom of Jordan, 7.375%, 10/10/47(15) | 200 | $ 151,828 | |
| $ 151,828 | |||
| Security | Principal Amount* (000's omitted) | Value | |
| Kazakhstan — 0.2% | |||
| Kazakhstan Government International Bond, 6.50%, 7/21/45(15) | 210 | $ 206,816 | |
| $ 206,816 | |||
| Kenya — 0.1% | |||
| Government of Kenya, 7.25%, 2/28/28(15) | 200 | $ 162,910 | |
| $ 162,910 | |||
| Lebanon — 0.0%(12) | |||
| Lebanese Republic: | |||
| 5.80%, 4/14/20(14)(15) | 20 | $ 1,287 | |
| 6.10%, 10/4/22(14)(15) | 337 | 20,999 | |
| 6.15%, 6/19/20(14) | 26 | 1,673 | |
| 6.375%, 3/9/20(14) | 385 | 24,768 | |
| 6.40%, 5/26/23(14) | 6 | 375 | |
| 6.65%, 11/3/28(14)(15) | 65 | 4,274 | |
| 6.85%, 5/25/29(14) | 2 | 128 | |
| 8.20%, 5/17/33(14) | 70 | 4,548 | |
| 8.25%, 5/17/34(14) | 58 | 3,868 | |
| $ 61,920 | |||
| Mexico — 0.8% | |||
| Mexico Government International Bond: | |||
| 4.875%, 5/19/33 | 451 | $ 396,329 | |
| 5.00%, 4/27/51 | 400 | 296,495 | |
| 5.40%, 2/9/28 | 415 | 408,113 | |
| $ 1,100,937 | |||
| Nigeria — 0.5% | |||
| Republic of Nigeria: | |||
| 7.375%, 9/28/33(15) | 440 | $ 332,182 | |
| 7.625%, 11/28/47(15) | 200 | 135,546 | |
| 7.696%, 2/23/38(15) | 403 | 288,385 | |
| $ 756,113 | |||
| North Macedonia — 0.5% | |||
| North Macedonia Government International Bond: | |||
| 1.625%, 3/10/28(15) | EUR | 370 | $ 319,202 |
| 6.96%, 3/13/27(15) | EUR | 345 | 370,406 |
| $ 689,608 | |||
| Oman — 0.5% | |||
| Oman Government International Bond: | |||
| 5.375%, 3/8/27(15) | 200 | $ 193,921 | |
| Security | Principal Amount* (000's omitted) | Value | |
| Oman (continued) | |||
| Oman Government International Bond: (continued) | |||
| 6.25%, 1/25/31(15) | 200 | $ 194,719 | |
| 7.375%, 10/28/32(15) | 351 | 365,324 | |
| $ 753,964 | |||
| Panama — 0.4% | |||
| Panama Bonos del Tesoro, 6.375%, 7/25/33(1)(15) | 20 | $ 18,286 | |
| Panama Government International Bond, 6.70%, 1/26/36 | 622 | 584,868 | |
| $ 603,154 | |||
| Paraguay — 0.2% | |||
| Republic of Paraguay, 4.95%, 4/28/31(15) | 259 | $ 236,117 | |
| $ 236,117 | |||
| Peru — 0.4% | |||
| Peruvian Government International Bond: | |||
| 2.783%, 1/23/31 | 150 | $ 120,456 | |
| 3.00%, 1/15/34 | 360 | 273,455 | |
| 3.30%, 3/11/41 | 170 | 113,066 | |
| $ 506,977 | |||
| Romania — 0.9% | |||
| Romania Government International Bond: | |||
| 1.75%, 7/13/30(15) | EUR | 192 | $ 155,117 |
| 2.00%, 1/28/32(15) | EUR | 4 | 3,054 |
| 2.00%, 4/14/33(15) | EUR | 198 | 144,464 |
| 2.124%, 7/16/31(15) | EUR | 7 | 5,510 |
| 2.75%, 2/26/26(15) | EUR | 84 | 85,210 |
| 2.75%, 4/14/41(15) | EUR | 122 | 76,483 |
| 3.375%, 1/28/50(15) | EUR | 258 | 162,050 |
| 3.624%, 5/26/30(15) | EUR | 2 | 1,833 |
| 3.75%, 2/7/34(15) | EUR | 14 | 11,730 |
| 4.625%, 4/3/49(15) | EUR | 435 | 341,489 |
| 6.625%, 9/27/29(15) | EUR | 235 | 256,385 |
| $ 1,243,325 | |||
| Serbia — 0.3% | |||
| Serbia Government International Bond, 2.125%, 12/1/30(15) | 605 | $ 445,736 | |
| $ 445,736 | |||
| Sri Lanka — 0.5% | |||
| Sri Lanka Government International Bond: | |||
| 5.75%, 4/18/23(14)(15) | 370 | $ 194,216 | |
| Security | Principal Amount* (000's omitted) | Value | |
| Sri Lanka (continued) | |||
| Sri Lanka Government International Bond: (continued) | |||
| 6.20%, 5/11/27(14)(15) | 650 | $ 327,242 | |
| 6.85%, 11/3/25(14)(15) | 410 | 214,207 | |
| $ 735,665 | |||
| Suriname — 1.1% | |||
| Republic of Suriname, 9.25%, 10/26/26(14)(15) | 1,737 | $ 1,585,013 | |
| $ 1,585,013 | |||
| Ukraine — 0.2% | |||
| Ukraine Government International Bond: | |||
| 0.00%, GDP-Linked, 8/1/41(14)(15)(20) | 83 | $ 34,806 | |
| 7.75%, 9/1/24(14)(15) | 376 | 121,362 | |
| 7.75%, 9/1/25(14)(15) | 100 | 30,969 | |
| 7.75%, 9/1/28(14)(15) | 200 | 57,070 | |
| $ 244,207 | |||
| United Arab Emirates — 0.7% | |||
| Finance Department Government of Sharjah: | |||
| 4.375%, 3/10/51(15) | 670 | $ 408,238 | |
| 6.50%, 11/23/32(1)(15) | 540 | 524,323 | |
| $ 932,561 | |||
| Uruguay — 0.3% | |||
| Uruguay Government Bond: | |||
| 4.375%, 1/23/31 | 150 | $ 142,066 | |
| 5.10%, 6/18/50 | 210 | 182,463 | |
| 5.75%, 10/28/34 | 140 | 140,446 | |
| $ 464,975 | |||
| Uzbekistan — 0.3% | |||
| Republic of Uzbekistan: | |||
| 4.75%, 2/20/24(15) | 240 | $ 238,463 | |
| 5.375%, 2/20/29(15) | 200 | 178,254 | |
| $ 416,717 | |||
| Zambia — 0.1% | |||
| Zambia Government International Bond, 5.375%, 9/20/22(14)(15) | 200 | $ 110,011 | |
| $ 110,011 | |||
| Total Sovereign Government Bonds (identified cost $23,428,587) | $ 20,547,718 | ||
| Sovereign Loans — 0.9% |
| Borrower/Description | Principal Amount (000's omitted) | Value | |
| Tanzania — 0.9% | |||
| Government of the United Republic of Tanzania, Term Loan, 12.174%, (6 mo. USD LIBOR + 6.30%), 4/28/31(2) | $ | 1,288 | $ 1,257,494 |
| Total Sovereign Loans (identified cost $1,288,235) | $ 1,257,494 | ||
| U.S. Government Agency Mortgage-Backed Securities — 22.0% |
| Security | Principal Amount (000's omitted) | Value | |
| Federal Home Loan Mortgage Corp.: | |||
| 4.196%, (COF + 1.254%), 1/1/35(21) | $ | 189 | $ 184,714 |
| 5.00%, 8/1/52 | 2,446 | 2,258,491 | |
| 6.00%, 3/1/29 | 421 | 420,732 | |
| 6.15%, 7/20/27 | 43 | 42,483 | |
| 6.50%, 7/1/32 | 278 | 281,518 | |
| 7.00%, 4/1/36 | 322 | 331,013 | |
| 7.50%, 11/17/24 | 6 | 6,521 | |
| 9.00%, 3/1/31 | 3 | 2,891 | |
| Federal National Mortgage Association: | |||
| 4.44%, (6 mo. RFUCCT + 1.54%), 9/1/37(21) | 120 | 119,768 | |
| 5.00%, with various maturities to 2040 | 595 | 575,974 | |
| 5.50%, 30-Year, TBA(22) | 300 | 284,777 | |
| 5.50%, with various maturities to 2033 | 430 | 424,934 | |
| 6.00%, 11/1/23 | 1 | 1,039 | |
| 6.334%, (COF + 2.004%), 7/1/32(21) | 84 | 85,284 | |
| 6.50%, with various maturities to 2036 | 685 | 693,829 | |
| 7.00%, with various maturities to 2037 | 274 | 280,053 | |
| Government National Mortgage Association: | |||
| 4.50%, 10/15/47 | 117 | 106,897 | |
| 5.00%, 6/20/52 | 1,941 | 1,803,264 | |
| 5.50%, 30-Year, TBA(22) | 10,700 | 10,235,007 | |
| 5.50%, with various maturities to 2062 | 936 | 895,365 | |
| 6.00%, 30-Year, TBA(22) | 11,000 | 10,779,453 | |
| 6.00%, 7/20/53 | 249 | 245,531 | |
| 6.50%, 30-Year, TBA(22) | 800 | 798,516 | |
| 7.50%, 8/15/25 | 14 | 13,937 | |
| 8.00%, 3/15/34 | 215 | 219,391 | |
| 9.50%, 7/15/25 | 0 (23) | 56 | |
| Total U.S. Government Agency Mortgage-Backed Securities (identified cost $31,833,661) | $ 31,091,438 | ||
| Short-Term Investments — 3.4% |
| Affiliated Fund — 3.0% |
| Security | Shares | Value | |
| Morgan Stanley Institutional Liquidity Funds - Government Portfolio, Institutional Class, 5.25%(24) | 4,286,237 | $ 4,286,237 | |
| Total Affiliated Fund (identified cost $4,286,237) | $ 4,286,237 | ||
| U.S. Treasury Obligations — 0.4% |
| Security | Principal Amount (000's omitted) | Value | |
| U.S. Treasury Bills, 0.00%, 11/30/23(25) | $ | 500 | $ 497,872 |
| Total U.S. Treasury Obligations (identified cost $497,855) | $ 497,872 | ||
| Total Short-Term Investments (identified cost $4,784,092) | $ 4,784,109 | ||
| Total Investments — 128.7% (identified cost $206,162,572) | $181,510,330 | ||
| Less Unfunded Loan Commitments — (0.0)%(12) | $ (1,073) | ||
| Net Investments — 128.7% (identified cost $206,161,499) | $181,509,257 | ||
| Other Assets, Less Liabilities — (28.7)% | $ (40,467,506) | ||
| Net Assets — 100.0% | $141,041,751 | ||
| The percentage shown for each investment category in the Portfolio of Investments is based on net assets. | |
| * | In U.S. dollars unless otherwise indicated. |
| (1) | Security exempt from registration under Rule 144A of the Securities Act of 1933, as amended. These securities may be sold in certain transactions in reliance on an exemption from registration (normally to qualified institutional buyers). At October 31, 2023, the aggregate value of these securities is $55,323,353 or 39.2% of the Fund's net assets. |
| (2) | Variable rate security. The stated interest rate represents the rate in effect at October 31, 2023. |
| (3) | When-issued, variable rate security whose interest rate will be determined after October 31, 2023 |
| (4) | Step coupon security. Interest rate represents the rate in effect at October 31, 2023. |
| (5) | Interest only security that entitles the holder to receive only interest payments on the underlying mortgages. Principal amount shown is the notional amount of the underlying mortgages on which coupon interest is calculated. |
| (6) | Inverse floating-rate security whose coupon varies inversely with changes in the interest rate index. The stated interest rate represents the coupon rate in effect at October 31, 2023. |
| (7) | Principal only security that entitles the holder to receive only principal payments on the underlying mortgages. |
| (8) | Weighted average fixed-rate coupon that changes/updates monthly. Rate shown is the rate at October 31, 2023. |
| (9) | Represents an investment in an issuer that may be deemed to be an affiliate (see Note 8). |
| (10) | Non-income producing security. |
| (11) | Security was acquired in connection with a restructuring of a Senior Loan and may be subject to restrictions on resale. |
| (12) | Amount is less than 0.05% or (0.05)%, as applicable. |
| (13) | For fair value measurement disclosure purposes, security is categorized as Level 3 (see Note 9). |
| (14) | Issuer is in default with respect to interest and/or principal payments or has declared bankruptcy. For a variable rate security, interest rate has been adjusted to reflect non-accrual status. |
| (15) | Security exempt from registration under Regulation S of the Securities Act of 1933, as amended, which exempts from registration securities offered and sold outside the United States. Security may not be offered or sold in the United States except pursuant to an exemption from, or in a transaction not subject to, the registration requirements of the Securities Act of 1933, as amended. At October 31, 2023, the aggregate value of these securities is $15,295,042 or 10.8% of the Fund's net assets. |
| (16) | Senior floating-rate loans (Senior Loans) often require prepayments from excess cash flows or permit the borrowers to repay at their election. The degree to which borrowers repay, whether as a contractual requirement or at their election, cannot be predicted with accuracy. As a result, the actual remaining maturity may be substantially less than the stated maturities shown. However, Senior Loans will typically have an expected average life of approximately two to four years. Senior Loans typically have rates of interest which are redetermined periodically by reference to a base lending rate, plus a spread. These base lending rates are primarily the Secured Overnight Financing Rate (“SOFR”) (or the London Interbank Offered Rate (“LIBOR”) for those loans whose rates reset prior to the discontinuance of LIBOR on June 30, 2023) and secondarily, the prime rate offered by one or more major United States banks (the “Prime Rate”). Base lending rates may be subject to a floor, or minimum rate. Rates for SOFR are generally 1 or 3-month tenors and may also be subject to a credit spread adjustment. Senior Loans are generally subject to contractual restrictions that must be satisfied before they can be bought or sold. |
| (17) | The stated interest rate represents the weighted average interest rate at October 31, 2023 of contracts within the senior loan facility. Interest rates on contracts are primarily redetermined either monthly or quarterly by reference to the indicated base lending rate and spread and the reset period. |
| (18) | This Senior Loan will settle after October 31, 2023, at which time the interest rate will be determined. |
| (19) | Unfunded or partially unfunded loan commitments. The stated interest rate reflects the weighted average of the reference rate and spread for the funded portion, if any, and the commitment fees on the portion of the loan that is unfunded. At October 31, 2023, the total value of unfunded loan commitments is $856. See Note 1F for description. |
| (20) | Amounts payable in respect of the security are contingent upon and determined by reference to Ukraine’s GDP and Real GDP Growth Rate. Principal amount represents the notional amount used to calculate payments due to the security holder and does not represent an entitlement for payment. |
| (21) | Adjustable rate mortgage security whose interest rate generally adjusts monthly based on a weighted average of interest rates on the underlying mortgages. The coupon rate may not reflect the applicable index value as interest rates on the underlying mortgages may adjust on various dates and at various intervals and may be subject to lifetime ceilings and lifetime floors and lookback periods. Rate shown is the coupon rate at October 31, 2023. |
| (22) | TBA (To Be Announced) securities are purchased on a forward commitment basis with an approximate principal amount and maturity date. The actual principal amount and maturity date are determined upon settlement. |
| (23) | Principal amount is less than $500. |
| (24) | May be deemed to be an affiliated investment company. The rate shown is the annualized seven-day yield as of October 31, 2023. |
| (25) | Security (or a portion thereof) has been pledged to cover collateral requirements on open derivative contracts. |
| Forward Foreign Currency Exchange Contracts (Centrally Cleared) | |||||
| Currency Purchased | Currency Sold | Settlement Date | Value/Unrealized Appreciation (Depreciation) | ||
| EUR | 78,028 | USD | 83,554 | 12/20/23 | $ (808) |
| USD | 1,764,056 | EUR | 1,647,388 | 12/20/23 | 17,069 |
| USD | 671,662 | EUR | 627,241 | 12/20/23 | 6,499 |
| USD | 636,654 | EUR | 594,548 | 12/20/23 | 6,160 |
| USD | 607,426 | EUR | 567,253 | 12/20/23 | 5,878 |
| USD | 452,919 | EUR | 422,965 | 12/20/23 | 4,382 |
| USD | 118,847 | EUR | 112,618 | 12/20/23 | (579) |
| USD | 184,916 | EUR | 175,224 | 12/20/23 | (902) |
| USD | 279,871 | EUR | 265,202 | 12/20/23 | (1,365) |
| $36,334 | |||||
| Forward Foreign Currency Exchange Contracts (OTC) | |||||||
| Currency Purchased | Currency Sold | Counterparty | Settlement Date | Unrealized Appreciation | Unrealized (Depreciation) | ||
| USD | 1,444,534 | EUR | 1,362,717 | Standard Chartered Bank | 11/2/23 | $ 2,644 | $ — |
| EUR | 262,792 | USD | 276,822 | Citibank, N.A. | 11/3/23 | 1,249 | — |
| USD | 1,442,209 | EUR | 1,362,716 | Standard Chartered Bank | 12/4/23 | — | (1,528) |
| $3,893 | $(1,528) | ||||||
| Futures Contracts | |||||
| Description | Number of Contracts | Position | Expiration Date | Notional Amount | Value/Unrealized Appreciation (Depreciation) |
| Interest Rate Futures | |||||
| U.S. 5-Year Treasury Note | 26 | Long | 12/29/23 | $ 2,716,391 | $ (20,332) |
| U.S. Ultra 10-Year Treasury Note | 14 | Long | 12/19/23 | 1,523,594 | (49,500) |
| Euro-Bobl | (12) | Short | 12/7/23 | (1,476,558) | 8,507 |
| Euro-Bund | (6) | Short | 12/7/23 | (818,906) | 7,888 |
| Futures Contracts (continued) | |||||
| Description | Number of Contracts | Position | Expiration Date | Notional Amount | Value/Unrealized Appreciation (Depreciation) |
| Interest Rate Futures (continued) | |||||
| Euro-Buxl | (5) | Short | 12/7/23 | $ (637,082) | $ 53,434 |
| U.S. 2-Year Treasury Note | (4) | Short | 12/29/23 | (809,688) | 1,312 |
| U.S. 5-Year Treasury Note | (33) | Short | 12/29/23 | (3,447,727) | 26,625 |
| U.S. 10-Year Treasury Note | (20) | Short | 12/19/23 | (2,123,437) | 71,618 |
| U.S. Long Treasury Bond | (7) | Short | 12/19/23 | (766,063) | 40,201 |
| U.S. Ultra-Long Treasury Bond | (15) | Short | 12/19/23 | (1,688,438) | 196,556 |
| $336,309 | |||||
| Credit Default Swaps - Sell Protection (Centrally Cleared) | |||||||
| Reference Entity | Notional Amount* (000's omitted) | Contract Annual Fixed Rate** | Current Market Annual Fixed Rate*** | Termination Date | Value | Unamortized Upfront Receipts (Payments) | Unrealized Appreciation (Depreciation) |
| Brazil | $ 2,518 | 1.00% (pays quarterly)(1) | 1.81% | 12/20/28 | $ (87,743) | $ 91,037 | $ 3,294 |
| Colombia | 5,000 | 1.00% (pays quarterly)(1) | 2.20 | 12/20/28 | (257,566) | 279,820 | 22,254 |
| Croatia | 5,000 | 1.00% (pays quarterly)(1) | 0.86 | 12/20/28 | 36,485 | (45,014) | (8,529) |
| Hungary | 2,200 | 1.00% (pays quarterly)(1) | 1.59 | 12/20/28 | (55,127) | 48,366 | (6,761) |
| Indonesia | 3,000 | 1.00% (pays quarterly)(1) | 0.98 | 12/20/28 | 5,974 | (18,500) | (12,526) |
| Mexico | 2,500 | 1.00% (pays quarterly)(1) | 1.21 | 12/20/28 | (20,783) | 21,873 | 1,090 |
| Peru | 2,000 | 1.00% (pays quarterly)(1) | 1.00 | 12/20/28 | 2,436 | (16,903) | (14,467) |
| Total | $22,218 | $ (376,324) | $360,679 | $ (15,645) | |||
| Credit Default Swaps - Sell Protection (OTC) | ||||||||
| Reference Entity | Counterparty | Notional Amount* (000's omitted) | Contract Annual Fixed Rate** | Current Market Annual Fixed Rate*** | Termination Date | Value | Unamortized Upfront Receipts (Payments) | Unrealized Appreciation (Depreciation) |
| Brazil | Citibank, N.A. | $ 1,050 | 1.00% (pays quarterly)(1) | 2.57% | 12/20/31 | $ (101,516) | $ 123,815 | $ 22,299 |
| Mexico | Citibank, N.A. | 688 | 1.00% (pays quarterly)(1) | 1.74 | 12/20/31 | (31,788) | 25,018 | (6,770) |
| Romania | Barclays Bank PLC | 4,000 | 1.00% (pays quarterly)(1) | 1.59 | 6/20/28 | (90,624) | 197,251 | 106,627 |
| Total | $5,738 | $(223,928) | $346,084 | $122,156 | ||||
| * | If the Fund is the seller of credit protection, the notional amount is the maximum potential amount of future payments the Fund could be required to make if a credit event, as defined in the credit default swap agreement, were to occur. At October 31, 2023, such maximum potential amount for all open credit default swaps in which the Fund is the seller was $27,956,000. |
| ** | The contract annual fixed rate represents the fixed rate of interest received by the Fund (as a seller of protection) on the notional amount of the credit default swap contract. |
| *** | Current market annual fixed rates, utilized in determining the net unrealized appreciation or depreciation as of period end, serve as an indicator of the market’s perception of the current status of the payment/performance risk associated with the credit derivative. The current market annual fixed rate of a particular reference entity reflects the cost, as quoted by the pricing vendor, of selling protection against default of that entity as of period end and may include upfront payments required to be made to enter into the agreement. The higher the fixed rate, the greater the market perceived risk of a credit event involving the reference entity. A rate identified as “Defaulted” indicates a credit event has occurred for the reference entity. |
| (1) | Upfront payment is exchanged with the counterparty as a result of the standardized trading coupon. |
| Abbreviations: | |
| COF | – Cost of Funds 11th District |
| DIP | – Debtor In Possession |
| EURIBOR | – Euro Interbank Offered Rate |
| GDP | – Gross Domestic Product |
| LIBOR | – London Interbank Offered Rate |
| OTC | – Over-the-counter |
| PIK | – Payment In Kind |
| RFUCCT | – Refinitiv USD IBOR Consumer Cash Fallbacks Term |
| SOFR | – Secured Overnight Financing Rate |
| TBA | – To Be Announced |
| Currency Abbreviations: | |
| EUR | – Euro |
| USD | – United States Dollar |
| October 31, 2023 | |
| Assets | |
| Unaffiliated investments, at value (identified cost $199,793,581) | $ 175,589,454 |
| Affiliated investments, at value (identified cost $6,367,918) | 5,919,803 |
| Cash | 1,646,359 |
| Deposits for derivatives collateral: | |
| Futures contracts | 231,708 |
| Centrally cleared derivatives | 4,530,091 |
| OTC derivatives - swap contracts | 146,000 |
| Foreign currency, at value (identified cost $1,183,186) | 1,193,224 |
| Interest receivable | 1,447,103 |
| Interest and dividends receivable from affiliated investments | 30,579 |
| Receivable for investments sold | 853,691 |
| Receivable for variation margin on open centrally cleared derivatives | 36,355 |
| Receivable for open forward foreign currency exchange contracts | 3,893 |
| Receivable for open swap contracts | 128,926 |
| Tax reclaims receivable | 115 |
| Prepaid upfront fees on notes payable | 15,254 |
| Trustees' deferred compensation plan | 76,520 |
| Prepaid expenses | 4,021 |
| Total assets | $191,853,096 |
| Liabilities | |
| Notes payable | $ 25,500,000 |
| Payable for investments purchased | 974,338 |
| Payable for when-issued/delayed delivery/forward commitment securities | 23,044,339 |
| Payable for variation margin on open futures contracts | 8,765 |
| Payable for open forward foreign currency exchange contracts | 1,528 |
| Payable for open swap contracts | 6,770 |
| Upfront receipts on open non-centrally cleared swap contracts | 346,084 |
| Payable to affiliates: | |
| Investment adviser fee | 142,223 |
| Trustees' fees | 935 |
| Trustees' deferred compensation plan | 76,520 |
| Accrued expenses | 709,843 |
| Total liabilities | $ 50,811,345 |
| Net Assets | $141,041,751 |
| Sources of Net Assets | |
| Common shares, $0.01 par value, unlimited number of shares authorized | $ 134,427 |
| Additional paid-in capital | 192,943,893 |
| Accumulated loss | (52,036,569) |
| Net Assets | $141,041,751 |
| Common Shares Issued and Outstanding | 13,442,697 |
| Net Asset Value Per Common Share | |
| Net assets ÷ common shares issued and outstanding | $ 10.49 |
| Year Ended | |
| October 31, 2023 | |
| Investment Income | |
| Dividend income | $ 5,848 |
| Dividend income from affiliated investments | 316,330 |
| Interest and other income | 13,764,831 |
| Interest income from affiliated investments | 94,415 |
| Total investment income | $14,181,424 |
| Expenses | |
| Investment adviser fee | $ 1,559,452 |
| Trustees’ fees and expenses | 11,136 |
| Custodian fee | 210,216 |
| Transfer and dividend disbursing agent fees | 18,705 |
| Legal and accounting services | 150,910 |
| Printing and postage | 103,939 |
| Interest expense and fees | 1,791,493 |
| Miscellaneous | 38,464 |
| Total expenses | $ 3,884,315 |
| Deduct: | |
| Waiver and/or reimbursement of expenses by affiliates | $ 10,425 |
| Total expense reductions | $ 10,425 |
| Net expenses | $ 3,873,890 |
| Net investment income | $10,307,534 |
| Realized and Unrealized Gain (Loss) | |
| Net realized gain (loss): | |
| Investment transactions | $ (5,537,289) |
| Futures contracts | 1,293,147 |
| Swap contracts | 1,521,416 |
| Foreign currency transactions | (70,708) |
| Forward foreign currency exchange contracts | (29,413) |
| Net realized loss | $ (2,822,847) |
| Change in unrealized appreciation (depreciation): | |
| Investments | $ 6,167,062 |
| Investments - affiliated investments | (66,902) |
| Futures contracts | (653,352) |
| Swap contracts | 245,648 |
| Foreign currency | 74,354 |
| Forward foreign currency exchange contracts | 17,745 |
| Net change in unrealized appreciation (depreciation) | $ 5,784,555 |
| Net realized and unrealized gain | $ 2,961,708 |
| Net increase in net assets from operations | $13,269,242 |
| Year Ended October 31, | ||
| 2023 | 2022 | |
| Increase (Decrease) in Net Assets | ||
| From operations: | ||
| Net investment income | $ 10,307,534 | $ 7,502,830 |
| Net realized loss | (2,822,847) | (10,891,448) |
| Net change in unrealized appreciation (depreciation) | 5,784,555 | (18,552,322) |
| Net increase (decrease) in net assets from operations | $ 13,269,242 | $ (21,940,940) |
| Distributions to shareholders | $ (11,686,317) | $ (8,946,641) |
| Tax return of capital to shareholders | $ (1,463,018) | $ (7,133,373) |
| Capital share transactions: | ||
| Reinvestment of distributions | $ 38,345 | $ 253,334 |
| Net increase in net assets from capital share transactions | $ 38,345 | $ 253,334 |
| Net increase (decrease) in net assets | $ 158,252 | $ (37,767,620) |
| Net Assets | ||
| At beginning of year | $ 140,883,499 | $ 178,651,119 |
| At end of year | $141,041,751 | $140,883,499 |
| Year Ended | |
| October 31, 2023 | |
| Cash Flows From Operating Activities | |
| Net increase in net assets from operations | $ 13,269,242 |
| Adjustments to reconcile net increase in net assets from operations to net cash provided by operating activities: | |
| Investments purchased | (413,443,226) |
| Investments sold and principal repayments | 418,888,343 |
| Decrease in short-term investments, net | 1,722,463 |
| Net amortization/accretion of premium (discount) | 219,194 |
| Amortization of prepaid upfront fees on notes payable | 37,719 |
| Increase in interest receivable | (60,746) |
| Increase in interest and dividends receivable from affiliated investments | (5,918) |
| Decrease in receivable for variation margin on open futures contracts | 74,179 |
| Increase in receivable for variation margin on open centrally cleared derivatives | (36,355) |
| Increase in receivable for open swap contracts | (81,718) |
| Decrease in receivable for closed swap contracts | 100,384 |
| Decrease in receivable from the transfer agent | 37,822 |
| Increase in tax reclaims receivable | (115) |
| Increase in Trustees’ deferred compensation plan | (76,520) |
| Increase in prepaid expenses | (153) |
| Decrease in payable for variation margin on open centrally cleared derivatives | (38,094) |
| Increase in payable for variation margin on open futures contracts | 8,765 |
| Decrease in payable for open swap contracts | (54,612) |
| Decrease in upfront receipts on open non-centrally cleared swap contracts | (307,975) |
| Decrease in payable to affiliate for investment adviser fee | (1,051) |
| Decrease in payable to affiliate for Trustees' fees | (463) |
| Increase in payable to affiliate for Trustees' deferred compensation plan | 76,520 |
| Increase in accrued expenses | 342,091 |
| Decrease in unfunded loan commitments | (61,226) |
| Net change in unrealized (appreciation) depreciation from investments | (6,100,160) |
| Net change in unrealized (appreciation) depreciation from forward foreign currency exchange contracts (OTC) | (12,475) |
| Net realized loss from investments | 5,537,289 |
| Net cash provided by operating activities | $ 20,033,204 |
| Cash Flows From Financing Activities | |
| Cash distributions paid | $ (13,110,990) |
| Proceeds from notes payable | 3,000,000 |
| Repayments of notes payable | (9,500,000) |
| Payment of upfront fees on notes payable | (37,500) |
| Net cash used in financing activities | $ (19,648,490) |
| Net increase in cash and restricted cash* | $ 384,714 |
| Cash and restricted cash at beginning of year (including foreign currency) | $ 7,362,668 |
| Cash and restricted cash at end of year (including foreign currency) | $ 7,747,382 |
| Supplemental disclosure of cash flow information: | |
| Noncash financing activities not included herein consist of: | |
| Reinvestment of dividends and distributions | $ 38,345 |
| Cash paid for interest and fees on borrowings | 1,481,730 |
| * | Includes net change in unrealized (appreciation) depreciation on foreign currency of $(15,837). |
| October 31, 2023 | |
| Cash | $ 1,646,359 |
| Deposits for derivatives collateral: | |
| Futures contracts | 231,708 |
| Centrally cleared derivatives | 4,530,091 |
| OTC derivatives - swap contracts | 146,000 |
| Foreign currency | 1,193,224 |
| Total cash and restricted cash as shown on the Statement of Cash Flows | $7,747,382 |
| Year Ended October 31, | |||||
| 2023 | 2022 | 2021 | 2020 | 2019 | |
| Net asset value — Beginning of year | $ 10.480 | $ 13.310 | $ 13.230 | $ 14.520 | $ 14.750 |
| Income (Loss) From Operations | |||||
| Net investment income(1) | $ 0.767 | $ 0.559 | $ 0.708 | $ 0.486 | $ 0.731 |
| Net realized and unrealized gain (loss) | 0.221 | (2.191) | 0.428 | (0.871) | (0.121) |
| Total income (loss) from operations | $ 0.988 | $ (1.632) | $ 1.136 | $ (0.385) | $ 0.610 |
| Less Distributions | |||||
| From net investment income | $ (0.869) | $ (0.667) | $ (0.602) | $ (0.764) | $ (0.840) |
| Tax return of capital | (0.109) | (0.531) | (0.490) | (0.141) | — |
| Total distributions | $ (0.978) | $ (1.198) | $ (1.092) | $ (0.905) | $ (0.840) |
| Discount on tender offer(1) | $ — | $ — | $ 0.036 | $ — | $ — |
| Net asset value — End of year | $ 10.490 | $ 10.480 | $ 13.310 | $ 13.230 | $ 14.520 |
| Market value — End of year | $ 9.950 | $ 10.640 | $ 13.530 | $ 11.850 | $ 13.210 |
| Total Investment Return on Net Asset Value(2) | 10.20% | (12.67)% | 9.29% | (1.80)% | 4.93% |
| Total Investment Return on Market Value(2) | 2.86% | (12.71)% | 23.94% | (3.32)% | 10.87% |
| Ratios/Supplemental Data | |||||
| Net assets, end of year (000’s omitted) | $141,042 | $140,883 | $178,651 | $236,628 | $259,649 |
| Ratios (as a percentage of average daily net assets): | |||||
| Expenses excluding interest and fees | 1.44% (3) | 1.47% (3) | 1.35% | 1.48% | 1.41% |
| Interest and fee expense(4) | 1.24% | 0.75% | 0.28% | 0.57% | 1.14% |
| Total expenses | 2.68% (3) | 2.22% (3) | 1.63% | 2.05% | 2.55% |
| Net investment income | 7.14% | 4.70% | 5.16% | 3.59% | 4.97% |
| Portfolio Turnover | 231% (5) | 182% (5) | 76% (5) | 47% | 46% |
| Senior Securities: | |||||
| Total notes payable outstanding (in 000’s) | $ 25,500 | $ 32,000 | $ 43,000 | $ 55,000 | $ 85,000 |
| Asset coverage per $1,000 of notes payable(6) | $ 6,531 | $ 5,403 | $ 5,155 | $ 5,302 | $ 4,055 |
| (1) | Computed using average common shares outstanding. |
| (2) | Returns are historical and are calculated by determining the percentage change in net asset value or market value with all distributions reinvested. Distributions are assumed to be reinvested at prices obtained under the Fund's dividend reinvestment plan. |
| (3) | Includes a reduction by the investment adviser of a portion of its adviser fee due to the Fund's investment in the Liquidity Fund (equal to less than 0.01% and less than 0.005% of average daily net assets for the years ended October 31, 2023 and 2022, respectively). |
| (4) | Interest and fee expense relates to borrowings for the purpose of financial leverage (see Note 7). |
| (5) | Includes the effect of To Be Announced (TBA) transactions. |
| (6) | Calculated by subtracting the Fund’s total liabilities (not including the notes payable) from the Fund’s total assets, and dividing the result by the notes payable balance in thousands. |
| Year Ended October 31, | ||
| 2023 | 2022 | |
| Ordinary income | $11,686,317 | $8,946,641 |
| Tax return of capital | $ 1,463,018 | $7,133,373 |
| Deferred capital losses | $ (26,675,706) |
| Net unrealized depreciation | (25,360,863) |
| Accumulated loss | $(52,036,569) |
| Aggregate cost | $ 206,928,992 |
| Gross unrealized appreciation | $ 2,704,316 |
| Gross unrealized depreciation | (28,091,477) |
| Net unrealized depreciation | $ (25,387,161) |
| Purchases | Sales | |
| Investments (non-U.S. Government) | $ 37,714,599 | $ 43,993,671 |
| U.S. Government and Agency Securities | 376,693,276 | 374,412,998 |
| $414,407,875 | $418,406,669 |
3,567 and 21,555, respectively.
| Fair Value | ||||
| Statement of Assets and Liabilities Caption | Credit | Foreign Exchange | Interest Rate | Total |
| Accumulated loss | $ 44,895* | $ 39,988* | $ 406,141* | $ 491,024 |
| Receivable for open forward foreign currency exchange contracts | — | 3,893 | — | 3,893 |
| Total Asset Derivatives | $ 44,895 | $43,881 | $406,141 | $ 494,917 |
| Derivatives not subject to master netting or similar agreements | $ 44,895 | $39,988 | $406,141 | $ 491,024 |
| Total Asset Derivatives subject to master netting or similar agreements | $ — | $ 3,893 | $ — | $ 3,893 |
| Accumulated loss | $ (421,219)* | $ (3,654)* | $ (69,832)* | $ (494,705) |
| Payable for open forward foreign currency exchange contracts | — | (1,528) | — | (1,528) |
| Payable/Receivable for open swap contracts; Upfront payments/receipts on open non-centrally cleared swap contracts | (223,928) | — | — | (223,928) |
| Total Liability Derivatives | $(645,147) | $ (5,182) | $ (69,832) | $(720,161) |
| Derivatives not subject to master netting or similar agreements | $(421,219) | $ (3,654) | $ (69,832) | $(494,705) |
| Total Liability Derivatives subject to master netting or similar agreements | $(223,928) | $ (1,528) | $ — | $(225,456) |
| * | For futures contracts and centrally cleared derivatives, amount represents value as shown in the Portfolio of Investments. Only the current day’s variation margin on open futures contracts and centrally cleared derivatives is reported within the Statement of Assets and Liabilities as Receivable or Payable for variation margin on open futures contracts and centrally cleared derivatives, as applicable. |
| Counterparty | Derivative Assets Subject to Master Netting Agreement | Derivatives Available for Offset | Non-cash Collateral Received(a) | Cash Collateral Received(a) | Net Amount of Derivative Assets(b) |
| Citibank, N.A. | $ 1,249 | $ (1,249) | $ — | $ — | $ — |
| Standard Chartered Bank | 2,644 | (1,528) | — | — | 1,116 |
| $3,893 | $(2,777) | $ — | $ — | $1,116 |
| Counterparty | Derivative Liabilities Subject to Master Netting Agreement | Derivatives Available for Offset | Non-cash Collateral Pledged(a) | Cash Collateral Pledged(a) | Net Amount of Derivative Liabilities(c) |
| Barclays Bank PLC | $ (90,624) | $ — | $ 27,881 | $ 62,743 | $ — |
| Citibank, N.A. | (133,304) | 1,249 | 132,055 | — | — |
| Standard Chartered Bank | (1,528) | 1,528 | — | — | — |
| $(225,456) | $2,777 | $159,936 | $62,743 | $ — |
| (a) | In some instances, the total collateral received and/or pledged may be more than the amount shown due to overcollateralization. |
| (b) | Net amount represents the net amount due from the counterparty in the event of default. |
| (c) | Net amount represents the net amount payable to the counterparty in the event of default. |
| Statement of Operations Caption | Credit | Foreign Exchange | Interest Rate | Total |
| Net realized gain (loss): | ||||
| Futures contracts | $ — | $ — | $ 1,293,147 | $ 1,293,147 |
| Swap contracts | 1,521,416 | — | — | 1,521,416 |
| Forward foreign currency exchange contracts | — | (29,413) | — | (29,413) |
| Total | $1,521,416 | $(29,413) | $1,293,147 | $2,785,150 |
| Change in unrealized appreciation (depreciation): | ||||
| Futures contracts | $ — | $ — | $ (653,352) | $ (653,352) |
| Swap contracts | 245,648 | — | — | 245,648 |
| Forward foreign currency exchange contracts | — | 17,745 | — | 17,745 |
| Total | $ 245,648 | $ 17,745 | $ (653,352) | $ (389,959) |
| Futures Contracts — Long | Futures Contracts — Short | Forward Foreign Currency Exchange Contracts* | Swap Contracts |
| $639,000 | $11,648,000 | $6,444,000 | $31,862,000 |
| * | The average notional amount for forward foreign currency exchange contracts is based on the absolute value of notional amounts of currency purchased and currency sold. |
| Name | Value, beginning of period | Purchases | Sales proceeds | Net realized gain (loss) | Change in unrealized appreciation (depreciation) | Value, end of period | Interest/ Dividend income | Principal amount/ Shares, end of period |
| Commercial Mortgage-Backed Securities | ||||||||
| Morgan Stanley Bank of America Merrill Lynch Trust: | ||||||||
| Series 2014-C16, Class B, 4.281%, 6/15/47 | $ — | $ 218,550 | $ — | $ — | $ 604 | $ 219,763 | $ 7,851 | $ 240,000 |
| Series 2016-C29, Class D, 3.00%, 5/15/49 | 755,772 | — | — | — | (36,719) | 724,848 | 35,795 | 1,000,000 |
| Series 2016-C32, Class D, 3.396%, 12/15/49 | 181,046 | — | — | — | (17,539) | 165,101 | 10,084 | 250,000 |
| Morgan Stanley Capital I Trust, Series 2016-UBS12, Class D, 3.312%, 12/15/49 | 529,537 | — | — | — | (13,248) | 523,854 | 40,685 | 1,000,000 |
| Short-Term Investments | ||||||||
| Liquidity Fund | 5,734,874 | 64,105,847 | (65,554,484) | — | — | 4,286,237 | 316,330 | 4,286,237 |
| Total | $ — | $(66,902) | $5,919,803 | $410,745 | ||||
| • | Level 1 – quoted prices in active markets for identical investments |
| • | Level 2 – other significant observable inputs (including quoted prices for similar investments, interest rates, prepayment speeds, credit risk, etc.) |
| • | Level 3 – significant unobservable inputs (including a fund's own assumptions in determining the fair value of investments) |
| Asset Description | Level 1 | Level 2 | Level 3* | Total |
| Asset-Backed Securities | $ — | $ 27,280,992 | $ — | $ 27,280,992 |
| Collateralized Mortgage Obligations | — | 16,497,718 | — | 16,497,718 |
| Commercial Mortgage-Backed Securities | — | 11,383,103 | — | 11,383,103 |
| Common Stocks | 10,998 | 424,408 | 6,181 | 441,587 |
| Corporate Bonds | — | 18,046,688 | — | 18,046,688 |
| Preferred Stocks | — | 142,470 | — | 142,470 |
| Senior Floating-Rate Loans (Less Unfunded Loan Commitments) | — | 49,954,878 | 81,062 | 50,035,940 |
| Sovereign Government Bonds | — | 20,547,718 | — | 20,547,718 |
| Sovereign Loans | — | 1,257,494 | — | 1,257,494 |
| U.S. Government Agency Mortgage-Backed Securities | — | 31,091,438 | — | 31,091,438 |
| Short-Term Investments: | ||||
| Affiliated Fund | 4,286,237 | — | — | 4,286,237 |
| U.S. Treasury Obligations | — | 497,872 | — | 497,872 |
| Total Investments | $ 4,297,235 | $ 177,124,779 | $ 87,243 | $ 181,509,257 |
| Forward Foreign Currency Exchange Contracts | $ — | $ 43,881 | $ — | $ 43,881 |
| Futures Contracts | 406,141 | — | — | 406,141 |
| Swap Contracts | — | 44,895 | — | 44,895 |
| Total | $ 4,703,376 | $ 177,213,555 | $ 87,243 | $ 182,004,174 |
| Liability Description | ||||
| Forward Foreign Currency Exchange Contracts | $ — | $ (5,182) | $ — | $ (5,182) |
| Futures Contracts | (69,832) | — | — | (69,832) |
| Swap Contracts | — | (645,147) | — | (645,147) |
| Total | $ (69,832) | $ (650,329) | $ — | $ (720,161) |
| * | None of the unobservable inputs for Level 3 assets, individually or collectively, had a material impact on the Fund. |
Boston, Massachusetts
December 19, 2023
| Please print exact name on account | |
| Shareholder signature | Date |
| Shareholder signature | Date |
| Please sign exactly as your common shares are registered. All persons whose names appear on the share certificate must sign. | |
c/o Equiniti Trust Company, LLC
P.O. Box 922
Wall Street Station
New York, NY 10269-0560
| Name and Year of Birth | Fund Position(s) | Length of Service | Principal Occupation(s) and Other Directorships During Past Five Years and Other Relevant Experience |
| Interested Trustee | |||
| Anchal Pachnanda(1) 1980 | Class I Trustee | Until 2024. 3 years. Since 2023. | Co-Head of Strategy of MSIM (since 2019). Formerly, Head of Strategy of MSIM (2017-2019). Ms. Pachnanda is an interested person because of her position with MSIM, which is an affiliate of the Fund. Other Directorships. None. |
| Noninterested Trustees | |||
| Alan C. Bowser(2) 1962 | Class II Trustee | Until 2025. 3 years. Since 2023. | Private investor. Formerly, Chief Diversity Officer, Partner and a member of the Operating Committee, and formerly served as Senior Advisor on Diversity and Inclusion for the firm’s chief executive officer, Co-Head of the Americas Region, and Senior Client Advisor of Bridgewater Associates, an asset management firm (2011- 2023). Other Directorships. Independent Director of Stout Risius Ross (a middle market professional services advisory firm) (since 2021). |
| Mark R. Fetting 1954 | Class III Trustee | Until 2026. 3 years. Since 2016. | Private investor. Formerly held various positions at Legg Mason, Inc. (investment management firm) (2000-2012), including President, Chief Executive Officer, Director and Chairman (2008-2012), Senior Executive Vice President (2004-2008) and Executive Vice President (2001-2004). Formerly, President of Legg Mason family of funds (2001-2008). Formerly, Division President and Senior Officer of Prudential Financial Group, Inc. and related companies (investment management firm) (1991-2000). Other Directorships. None. |
| Cynthia E. Frost 1961 | Class I Trustee | Until 2024. 3 years. Since 2014. | Private investor. Formerly, Chief Investment Officer of Brown University (university endowment) (2000-2012). Formerly, Portfolio Strategist for Duke Management Company (university endowment manager) (1995-2000). Formerly, Managing Director, Cambridge Associates (investment consulting company) (1989-1995). Formerly, Consultant, Bain and Company (management consulting firm) (1987-1989). Formerly, Senior Equity Analyst, BA Investment Management Company (1983-1985). Other Directorships. None. |
| George J. Gorman 1952 | Chairperson of the Board and Class II Trustee | Until 2025. 3 years. Chairperson of the Board since 2021 and Trustee since 2014. | Principal at George J. Gorman LLC (consulting firm). Formerly, Senior Partner at Ernst & Young LLP (a registered public accounting firm) (1974-2009). Other Directorships. None. |
| Name and Year of Birth | Fund Position(s) | Length of Service | Principal Occupation(s) and Other Directorships During Past Five Years and Other Relevant Experience |
| Noninterested Trustees (continued) | |||
| Valerie A. Mosley 1960 | Class III Trustee | Until 2026. 3 years. Since 2014. | Chairwoman and Chief Executive Officer of Valmo Ventures (a consulting and investment firm). Founder of Upward Wealth, Inc., dba BrightUp, a fintech platform. Formerly, Partner and Senior Vice President, Portfolio Manager and Investment Strategist at Wellington Management Company, LLP (investment management firm) (1992-2012). Formerly, Chief Investment Officer, PG Corbin Asset Management (1990-1992). Formerly worked in institutional corporate bond sales at Kidder Peabody (1986-1990). Other Directorships. Director of DraftKings, Inc. (digital sports entertainment and gaming company) (since September 2020). Director of Envestnet, Inc. (provider of intelligent systems for wealth management and financial wellness) (since 2018). Formerly, Director of Dynex Capital, Inc. (mortgage REIT) (2013-2020) and Director of Groupon, Inc. (e-commerce provider) (2020-2022). |
| Keith Quinton 1958 | Class II Trustee | Until 2025. 3 years. Since 2018. | Private investor, researcher and lecturer. Formerly, Independent Investment Committee Member at New Hampshire Retirement System (2017-2021). Formerly, Portfolio Manager and Senior Quantitative Analyst at Fidelity Investments (investment management firm) (2001-2014). Other Directorships. Formerly, Director (2016-2021) and Chairman (2019-2021) of New Hampshire Municipal Bond Bank. |
| Marcus L. Smith 1966 | Class III Trustee | Until 2026. 3 years. Since 2018. | Private investor and independent corporate director. Formerly, Chief Investment Officer, Canada (2012-2017), Chief Investment Officer, Asia (2010-2012), Director of Asian Research (2004-2010) and portfolio manager (2001-2017) at MFS Investment Management (investment management firm). Other Directorships. Director of First Industrial Realty Trust, Inc. (an industrial REIT) (since 2021). Director of MSCI Inc. (global provider of investment decision support tools) (since 2017). Formerly, Director of DCT Industrial Trust Inc. (logistics real estate company) (2017-2018). |
| Susan J. Sutherland 1957 | Class II Trustee | Until 2025. 3 years. Since 2015. | Private investor. Director of Ascot Group Limited and certain of its subsidiaries (insurance and reinsurance) (since 2017). Formerly, Director of Hagerty Holding Corp. (insurance) (2015-2018) and Montpelier Re Holdings Ltd. (insurance and reinsurance) (2013-2015). Formerly, Associate, Counsel and Partner at Skadden, Arps, Slate, Meagher & Flom LLP (law firm) (1982-2013). Other Directorships. Director of Kairos Acquisition Corp. (insurance/InsurTech acquisition company) (2021-2023). |
| Scott E. Wennerholm 1959 | Class I Trustee | Until 2024. 3 years. Since 2016. | Private Investor. Formerly, Trustee at Wheelock College (postsecondary institution) (2012-2018). Formerly, Consultant at GF Parish Group (executive recruiting firm) (2016-2017). Formerly, Chief Operating Officer and Executive Vice President at BNY Mellon Asset Management (investment management firm) (2005-2011). Formerly, Chief Operating Officer and Chief Financial Officer at Natixis Global Asset Management (investment management firm) (1997-2004). Formerly, Vice President at Fidelity Investments Institutional Services (investment management firm) (1994-1997). Other Directorships. None. |
| Nancy A. Wiser 1967 | Class III Trustee | Until 2026. 3 years. Since 2022. | Formerly, Executive Vice President and the Global Head of Operations at Wells Fargo Asset Management (2011-2021). Other Directorships. None. |
| Name and Year of Birth | Fund Position(s) | Length of Service | Principal Occupation(s) During Past Five Years |
| Principal Officers who are not Trustees | |||
| Kenneth A. Topping 1966 | President | Since 2023 | Vice President and Chief Administrative Officer of EVM and BMR and Chief Operating Officer for Public Markets at MSIM. Also Vice President of Calvert Research and Management (“CRM”) since 2021. Formerly, Chief Operating Officer for Goldman Sachs Asset Management 'Classic’ (2009-2020). |
| Deidre E. Walsh 1971 | Vice President and Chief Legal Officer | Since 2009 | Vice President of EVM and BMR. Also Vice President of CRM. |
| James F. Kirchner 1967 | Treasurer | Since 2007 | Vice President of EVM and BMR. Also Vice President of CRM. |
| Name and Year of Birth | Fund Position(s) | Length of Service | Principal Occupation(s) During Past Five Years |
| Principal Officers who are not Trustees (continued) | |||
| Nicholas S. Di Lorenzo 1987 | Secretary | Since 2022 | Formerly, associate (2012-2021) and counsel (2022) at Dechert LLP. |
| Richard F. Froio 1968 | Chief Compliance Officer | Since 2017 | Vice President of EVM and BMR since 2017. Formerly, Deputy Chief Compliance Officer (Adviser/Funds) and Chief Compliance Officer (Distribution) at PIMCO (2012-2017) and Managing Director at BlackRock/Barclays Global Investors (2009-2012). |
| Privacy Notice | April 2021 |
| FACTS | WHAT DOES EATON VANCE DO WITH YOUR PERSONAL INFORMATION? |
| Why? | Financial companies choose how they share your personal information. Federal law gives consumers the right to limit some but not all sharing. Federal law also requires us to tell you how we collect, share, and protect your personal information. Please read this notice carefully to understand what we do. |
| What? | The types of personal information we collect and share depend on the product or service you have with us. This information can include:■ Social Security number and income ■ investment experience and risk tolerance ■ checking account number and wire transfer instructions |
| How? | All financial companies need to share customers’ personal information to run their everyday business. In the section below, we list the reasons financial companies can share their customers’ personal information; the reasons Eaton Vance chooses to share; and whether you can limit this sharing. |
| Reasons we can share your personal information | Does Eaton Vance share? | Can you limit this sharing? |
| For our everyday business purposes — such as to process your transactions, maintain your account(s), respond to court orders and legal investigations, or report to credit bureaus | Yes | No |
| For our marketing purposes — to offer our products and services to you | Yes | No |
| For joint marketing with other financial companies | No | We don’t share |
| For our investment management affiliates’ everyday business purposes — information about your transactions, experiences, and creditworthiness | Yes | Yes |
| For our affiliates’ everyday business purposes — information about your transactions and experiences | Yes | No |
| For our affiliates’ everyday business purposes — information about your creditworthiness | No | We don’t share |
| For our investment management affiliates to market to you | Yes | Yes |
| For our affiliates to market to you | No | We don’t share |
| For nonaffiliates to market to you | No | We don’t share |
| To limit our sharing | Call toll-free 1-800-262-1122 or email: EVPrivacy@eatonvance.comPlease note:If you are a new customer, we can begin sharing your information 30 days from the date we sent this notice. When you are no longer our customer, we continue to share your information as described in this notice. However, you can contact us at any time to limit our sharing. |
| Questions? | Call toll-free 1-800-262-1122 or email: EVPrivacy@eatonvance.com |
| Privacy Notice — continued | April 2021 |
| Who we are | |
| Who is providing this notice? | Eaton Vance Management, Eaton Vance Distributors, Inc., Eaton Vance Trust Company, Eaton Vance Management (International) Limited, Eaton Vance Advisers International Ltd., Eaton Vance Global Advisors Limited, Eaton Vance Management’s Real Estate Investment Group, Boston Management and Research, Calvert Research and Management, Eaton Vance and Calvert Fund Families and our investment advisory affiliates (“Eaton Vance”) (see Investment Management Affiliates definition below) |
| What we do | |
| How does Eaton Vance protect my personal information? | To protect your personal information from unauthorized access and use, we use security measures that comply with federal law. These measures include computer safeguards and secured files and buildings. We have policies governing the proper handling of customer information by personnel and requiring third parties that provide support to adhere to appropriate security standards with respect to such information. |
| How does Eaton Vance collect my personal information? | We collect your personal information, for example, when you■ open an account or make deposits or withdrawals from your account ■ buy securities from us or make a wire transfer ■ give us your contact informationWe also collect your personal information from others, such as credit bureaus, affiliates, or other companies. |
| Why can’t I limit all sharing? | Federal law gives you the right to limit only■ sharing for affiliates’ everyday business purposes — information about your creditworthiness ■ affiliates from using your information to market to you ■ sharing for nonaffiliates to market to youState laws and individual companies may give you additional rights to limit sharing. See below for more on your rights under state law. |
| Definitions | |
| Investment Management Affiliates | Eaton Vance Investment Management Affiliates include registered investment advisers, registered broker- dealers, and registered and unregistered funds. Investment Management Affiliates does not include entities associated with Morgan Stanley Wealth Management, such as Morgan Stanley Smith Barney LLC and Morgan Stanley & Co. |
| Affiliates | Companies related by common ownership or control. They can be financial and nonfinancial companies.■ Our affiliates include companies with a Morgan Stanley name and financial companies such as Morgan Stanley Smith Barney LLC and Morgan Stanley & Co. |
| Nonaffiliates | Companies not related by common ownership or control. They can be financial and nonfinancial companies.■ Eaton Vance does not share with nonaffiliates so they can market to you. |
| Joint marketing | A formal agreement between nonaffiliated financial companies that together market financial products or services to you.■ Eaton Vance doesn’t jointly market. |
| Other important information | |
| Vermont: Except as permitted by law, we will not share personal information we collect about Vermont residents with Nonaffiliates unless you provide us with your written consent to share such information.California: Except as permitted by law, we will not share personal information we collect about California residents with Nonaffiliates and we will limit sharing such personal information with our Affiliates to comply with California privacy laws that apply to us. | |
Two International Place
Boston, MA 02110
One Congress Street, Suite 1
Boston, MA 02114-2016
6201 15th Avenue
Brooklyn, NY 11219
200 Berkeley Street
Boston, MA 02116-5022
Boston, MA 02110
Item 2. Code of Ethics
The registrant (sometimes referred to as the “Fund”) has adopted a code of ethics applicable to its Principal Executive Officer, Principal Financial Officer and Principal Accounting Officer. The registrant undertakes to provide a copy of such code of ethics to any person upon request, without charge, by calling 1-800-262-1122. The registrant has not amended the code of ethics as described in Form N-CSR during the period covered by this report. The registrant has not granted any waiver, including an implicit waiver, from a provision of the code of ethics as described in Form N-CSR during the period covered by this report.
Item 3. Audit Committee Financial Expert
The registrant’s Board of Trustees (the “Board”) has designated George J. Gorman and Scott E. Wennerholm, each an independent trustee, as audit committee financial experts. Mr. Gorman is a certified public accountant who is the Principal at George J. Gorman LLC (a consulting firm). Previously, Mr. Gorman served in various capacities at Ernst & Young LLP (a registered public accounting firm), including as Senior Partner. Mr.
Gorman also has experience serving as an independent trustee and audit committee financial expert of other mutual fund complexes. Mr. Wennerholm is a private investor. Previously, Mr. Wennerholm served as a Trustee at Wheelock College (postsecondary institution), as a Consultant at GF Parish Group (executive recruiting firm), Chief Operating Officer and Executive Vice President at BNY Mellon Asset Management (investment management firm), Chief Operating Officer and Chief Financial Officer at Natixis Global Asset Management (investment management firm), and Vice President at Fidelity Investments Institutional Services (investment management firm).
Item 4. Principal Accountant Fees and Services
(a) –(d)
The following table presents the aggregate fees billed to the registrant for the registrant’s fiscal years ended October 31, 2022 and October 31, 2023 by the registrant’s principal accountant, Deloitte & Touche LLP (“D&T”), for professional services rendered for the audit of the registrant’s annual financial statements and fees billed for other services rendered by D&T during such periods.
Fiscal Years Ended | 10/31/22 | 10/31/23 | ||||||
Audit Fees | $ | 102,933 | $ | 92,600 | ||||
Audit-Related Fees(1) | $ | 0 | $ | 0 | ||||
Tax Fees(2) | $ | 350 | $ | 0 | ||||
All Other Fees(3) | $ | 0 | $ | 0 | ||||
|
|
|
| |||||
Total | $ | 103,283 | $ | 92,600 | ||||
|
|
|
| |||||
| (1) | Audit-related fees consist of the aggregate fees billed for assurance and related services that are reasonably related to the performance of the audit of the registrant’s financial statements and are not reported under the category of audit fees. |
| (2) | Tax fees consist of the aggregate fees billed for professional services rendered by the principal accountant relating to tax compliance, tax advice, and tax planning and specifically include fees for tax return preparation and other related tax compliance/planning matters. |
| (3) | All other fees consist of the aggregate fees billed for products and services provided by the principal accountant other than audit, audit-related, and tax services. |
(e)(1) The registrant’s audit committee has adopted policies and procedures relating to the pre-approval of services provided by the registrant’s principal accountant (the “Pre-Approval Policies”). The Pre-Approval Policies establish a framework intended to assist the audit committee in the proper discharge of its pre-approval responsibilities. As a general matter, the Pre-Approval Policies (i) specify certain types of audit, audit-related, tax, and other services determined to be pre-approved by the audit committee; and (ii) delineate specific procedures governing the mechanics of the pre-approval process, including the approval and monitoring of audit and non-audit service fees. Unless a service is specifically pre-approved under the Pre-Approval Policies, it must be separately pre-approved by the audit committee.
The Pre-Approval Policies and the types of audit and non-audit services pre-approved therein must be reviewed and ratified by the registrant’s audit committee at least annually. The registrant’s audit committee maintains full responsibility for the appointment, compensation, and oversight of the work of the registrant’s principal accountant.
(e)(2) No services described in paragraphs (b)-(d) above were approved by the registrant’s audit committee pursuant to the “de minimis exception” set forth in Rule 2-01 (c)(7)(i)(C) of Regulation S-X.
(f) Not applicable.
(g) The following table presents (i) the aggregate non-audit fees (i.e., fees for audit-related, tax, and other services) billed to the registrant by D&T for the registrant’s fiscal years ended October 31, 2022 and October 31, 2023; and (ii) the aggregate non-audit fees (i.e., fees for audit-related, tax, and other services) billed to the Eaton Vance organization by D&T for the same time periods.
Fiscal Years Ended | 10/31/22 | 10/31/23 | ||||||
Registrant | $ | 350 | $ | 0 | ||||
Eaton Vance(1) | $ | 52,836 | $ | 0 | ||||
| (1) | The investment adviser to the registrant, as well as any of its affiliates that provide ongoing services to the registrant, are subsidiaries of Morgan Stanley. |
(h) The registrant’s audit committee has considered whether the provision by the registrant’s principal accountant of non-audit services to the registrant’s investment adviser and any entity controlling, controlled by, or under common control with the adviser that provides ongoing services to the registrant that were not pre-approved pursuant to Rule 2-01(c)(7)(ii) of Regulation S-X is compatible with maintaining the principal accountant’s independence.
(i) Not applicable.
(j) Not applicable.
Item 5. Audit Committee of Listed Registrants
The registrant has a separately-designated standing audit committee established in accordance with Section 3(a)(58)(A) of the Securities and Exchange Act of 1934, as amended. George J. Gorman, Keith Quinton, Scott E. Wennerholm (Chair), and Nancy A. Wiser are the members of the registrant’s audit committee.
Item 6. Schedule of Investments
Please see schedule of investments contained in the Report to Stockholders included under Item 1 of this Form N-CSR.
Item 7. Disclosure of Proxy Voting Policies and Procedures for Closed-End Management Investment Companies
The Board of the Fund has adopted a proxy voting policy and procedure (the “Fund Policy”), pursuant to which the trustees have delegated proxy voting responsibility to the Fund’s investment adviser and adopted the investment adviser’s proxy voting policies and procedures (the “Policies”) which are described below. The trustees will review the Policies annually. In the event that a conflict of interest arises between the Fund’s shareholders and the investment adviser, the administrator, or any of their affiliates or any affiliate of the Fund, the investment adviser will generally refrain from voting the proxies related to the companies giving rise to such conflict until it consults with the Board, or any committee, sub-committee or group of independent trustees identified by the Board, which will instruct the investment adviser on the appropriate course of action. If the Board Members are unable to meet and the failure to vote a proxy would have a material adverse impact on the Fund, the investment adviser may vote such proxy, provided that it discloses the existence of the material conflict to the Chairperson of the Fund’s Board as soon as practicable and to the Board at its next meeting.
The Policies are designed to promote accountability of a company’s management to its shareholders and to align the interests of management with those shareholders. An independent proxy voting service (“Agent”), currently Institutional Shareholder Services, Inc., has been retained to assist in the voting of proxies through the provision of vote analysis, implementation and recordkeeping and disclosure services. The investment adviser will generally vote proxies through the Agent. The Agent is required to vote all proxies in accordance with customized proxy voting guidelines (the “Guidelines”) and/or refer them back to the investment adviser pursuant to the Policies.
The Agent is required to establish and maintain adequate internal controls and policies in connection with the provision of proxy voting services, including methods to reasonably ensure that its analysis and recommendations are not influenced by a conflict of interest. The Guidelines include voting guidelines for matters relating to, among other things, the election of directors, approval of independent auditors, executive compensation, corporate structure and anti-takeover defenses. The investment adviser may cause the Fund to abstain from voting from time to time where it determines that the costs associated with voting a proxy outweigh the benefits derived from exercising the right to vote or it is unable to access or access timely ballots or other proxy information, among other stated reasons. The Agent will refer Fund proxies to the investment adviser for instructions under circumstances where, among others: (1) the application of the Guidelines is unclear; (2) a particular proxy question is not covered by the Guidelines; or (3) the Guidelines require input from the investment adviser. When a proxy voting issue has been referred to the investment adviser, the analyst (or portfolio manager if applicable) covering the company subject to the proxy proposal determines the final vote (or decision not to vote) and the investment adviser’s Proxy Administrator (described below) instructs the Agent to vote accordingly for securities held by the Fund. Where more than one analyst covers a particular company and the recommendations of such analysts voting a proposal conflict, the investment adviser’s Global Proxy Group (described below) will review such recommendations and any other available information related to the proposal and determine the manner in which it should be voted, which may result in different recommendations for the Fund that may differ from other clients of the investment adviser.
The investment adviser has appointed a Proxy Administrator to assist in the coordination of the voting of client proxies (including the Fund’s) in accordance with the Guidelines and the Policies. The investment adviser and its affiliates have also established a Global Proxy Group. The Global Proxy Group develops the investment adviser’s positions on all major corporate issues, creates the Guidelines and oversees the proxy voting process. The Proxy Administrator maintains a record of all proxy questions that have been referred by the Agent, all applicable recommendations, analysis and research received and any resolution of the matter. Before instructing the Agent to vote contrary to the Guidelines or the recommendation of the Agent, the Proxy Administrator will provide the Global Proxy Group with the Agent’s recommendation for the proposal along with any other relevant materials, including the basis for the analyst’s recommendation. The Proxy Administrator will then instruct the Agent to vote the proxy in the manner determined by the Global Proxy Group. A similar process will be followed if the Agent has a conflict of interest with respect to a proxy. The investment adviser will report to the Fund’s Board any votes cast contrary to the Guidelines or Agent recommendations, as applicable, no less than annually.
The investment adviser’s Global Proxy Group is responsible for monitoring and resolving possible material conflicts with respect to proxy voting. Because the Guidelines are predetermined and designed to be in the best interests of shareholders, application of the Guidelines to vote client proxies should, in most cases, adequately address any possible conflict of interest. The investment adviser will monitor situations that may result in a conflict of interest between any of its clients and the investment adviser or any of its affiliates by maintaining a list of significant existing and prospective corporate clients. The Proxy Administrator will compare such list
with the names of companies of which he or she has been referred a proxy statement (the “Proxy Companies”). If a company on the list is also a Proxy Company, the Proxy Administrator will report that fact to the Global Proxy Group. If the Proxy Administrator intends to instruct the Agent to vote in a manner inconsistent with the Guidelines, the Global Proxy Group will first determine, in consultation with legal counsel if necessary, whether a material conflict exists. If it is determined that a material conflict exists, the investment adviser will seek instruction on how the proxy should be voted from the Fund’s Board, or any committee or subcommittee identified by the Board. If a matter is referred to the Global Proxy Group, the decision made and basis for the decision will be documented by the Proxy Administrator and/or Global Proxy Group.
Information on how the Fund voted proxies relating to portfolio securities during the most recent 12 month period ended June 30 is available (1) without charge, upon request, by calling 1-800-262-1122, and (2) on the Securities and Exchange Commission’s website at http://www.sec.gov.
Item 8. Portfolio Managers of Closed-End Management Investment Companies
Eaton Vance Management (“EVM” of “Eaton Vance”) is the investment adviser of the Fund. Akbar A. Causer, Catherine M. McDermott, Federico Sequeda, and Andrew Szczurowski comprise the investment team responsible for the overall and day-to-day management of the Fund’s investments.
Mr. Causer is a Vice President of EVM, has been a portfolio manager of the Fund since September 2021 and has been employed by EVM since 2017. Ms. McDermott is a Vice President of EVM and has been a portfolio manager of the Fund since January 2008. Mr. Sequeda is a Vice President of EVM, has been a portfolio manager of the Fund since September 2021 and has been employed by EVM for more than five years. Mr. Szczurowski is a Vice President of EVM and has been a portfolio manager of the Fund since November 2011. Ms. McDermott and Mr. Szczurowski have managed other Eaton Vance portfolios for more than five years. This information is provided as of the date of filing this report.
The following table shows, as of the Fund’s most recent fiscal year end, the number of accounts each portfolio manager managed in each of the listed categories and the total assets (in millions of dollars), in the accounts managed within each category. The table also shows the number of accounts with respect to which the advisory fee is based on the performance of the account, if any, and the total assets (in millions of dollars) in those accounts.
| Number of All Accounts | Total Assets of All Accounts | Number of Accounts Paying a Performance Fee | Total Assets of Accounts Paying a Performance Fee | |||||||||||||
Akbar A. Causer | ||||||||||||||||
Registered Investment Companies | 2 | $ | 1,878.9 | 0 | $ | 0 | ||||||||||
Other Pooled Investment Vehicles | 8 | $ | 2,438.8 | 0 | $ | 0 | ||||||||||
Other Accounts | 2 | $ | 155.2 | 0 | $ | 0 | ||||||||||
Catherine C. McDermott | ||||||||||||||||
Registered Investment Companies | 6 | $ | 3,688.3 | 0 | $ | 0 | ||||||||||
Other Pooled Investment Vehicles | 0 | $ | 0 | 0 | $ | 0 | ||||||||||
Other Accounts | 0 | $ | 0 | 0 | $ | 0 | ||||||||||
Federico Sequeda, CFA | ||||||||||||||||
Registered Investment Companies | 5 | $ | 9,462.2 | 0 | $ | 0 | ||||||||||
Other Pooled Investment Vehicles | 2 | $ | 261.2 | 0 | $ | 0 | ||||||||||
Other Accounts | 1 | $ | 137.6 | 0 | $ | 0 | ||||||||||
Andrew Szczurowski(1) | ||||||||||||||||
Registered Investment Companies | 6 | $ | 11,795.5 | 0 | $ | 0 | ||||||||||
Other Pooled Investment Vehicles | 2 | $ | 83.7 | 0 | $ | 0 | ||||||||||
Other Accounts | 0 | $ | 0 | 0 | $ | 0 | ||||||||||
| (1) | This portfolio manager serves as portfolio manager of one or more registered investment companies and/or pooled investment vehicles that invest or may invest in one or more underlying registered investment companies and/or separate pooled investment vehicles in the Eaton Vance family of funds. The underlying investment companies may be managed by this portfolio manager or another portfolio manager. |
The following table shows the dollar range of Fund shares beneficially owned by each portfolio manager as of the Fund’s most recent fiscal year end.
Portfolio Manager | Dollar Range of Equity Securities Beneficially Owned in the Fund | |
Akbar A. Causer | None | |
Catherine C. McDermott | None | |
Federico Sequeda, CFA | None | |
Andrew Szczurowski | None |
Potential for Conflicts of Interest. It is possible that conflicts of interest may arise in connection with a portfolio manager’s management of the Fund’s investments on the one hand and the investments of other accounts for which a portfolio manager is responsible on the other. For example, a portfolio manager may have conflicts of interest in allocating management time, resources and investment opportunities among the Fund and other accounts he or she advises. In addition, due to differences in the investment strategies or restrictions between the Fund and the other accounts, the portfolio manager may take action with respect to another account that differs from the action taken with respect to the Fund. In some cases, another account managed by a portfolio manager may compensate the investment adviser based on the performance of the securities held by that account. The existence of such a performance based fee may create additional conflicts of interest for the portfolio manager in the allocation of management time, resources and investment opportunities. Whenever conflicts of interest arise, the portfolio manager will endeavor to exercise his or her discretion in a manner that he or she believes is equitable to all interested persons. EVM has adopted several policies and procedures designed to address these potential conflicts including a code of ethics and policies that govern the investment adviser’s trading practices, including among other things the aggregation and allocation of trades among clients, brokerage allocations, cross trades and best execution.
Compensation Structure for EVM
The compensation structure of Eaton Vance and its affiliates that are investment advisers (for purposes of this section “Eaton Vance”) is based on a total reward system of base salary and incentive compensation, which is paid either in the form of cash bonus, or for employees meeting the specified deferred compensation eligibility threshold, partially as a cash bonus and partially as mandatory deferred compensation. Deferred compensation granted to Eaton Vance employees is generally granted as a mix of deferred cash awards under the Investment Management Alignment Plan (IMAP) and equity-based awards in the form of stock units. The portion of incentive compensation granted in the form of a deferred compensation award and the terms of such awards are determined annually by the Compensation, Management Development and Succession Committee of Morgan Stanley.
Base salary compensation. Generally, portfolio managers receive base salary compensation based on the level of their position with the adviser.
Incentive compensation. In addition to base compensation, portfolio managers may receive discretionary year-end compensation. Incentive compensation may include:
| • | Cash bonus |
| • | Deferred compensation: |
| • | A mandatory program that defers a portion of incentive compensation into restricted stock units or other awards based on Morgan Stanley common stock or other plans that are subject to vesting and other conditions. |
| • | IMAP is a cash-based deferred compensation plan designed to increase the alignment of participants’ interests with the interests of clients. For eligible employees, a portion of their deferred compensation is mandatorily deferred into IMAP on an annual basis. Awards granted under IMAP are notionally invested in referenced funds available pursuant to the plan, which are funds advised by MSIM and its affiliates that are investment advisers. Portfolio managers are required to notionally invest a minimum of 40% of their account balance in the designated funds that they manage and are included in the IMAP notional investment fund menu. |
| • | Deferred compensation awards are typically subject to vesting over a multi-year period and are subject to cancellation through the payment date for competition, cause (i.e., any act or omission that constitutes a breach of obligation to the Funds, including failure to comply with internal compliance, ethics or risk management standards, and failure or refusal to perform duties satisfactorily, including supervisory and management duties), disclosure of proprietary information, and solicitation of employees or clients. Awards are also subject to clawback through the payment date if an employee’s act or omission (including with respect to direct supervisory responsibilities) causes a restatement of the firm’s consolidated financial results, constitutes a violation of the firm’s global risk management principles, policies and standards, or causes a loss of revenue associated with a position on which the employee was paid and the employee operated outside of internal control policies. |
Eaton Vance compensates employees based on principles of pay-for-performance, market competitiveness and risk management. Eligibility for, and the amount of any, discretionary compensation is subject to a multi-dimensional process. Specifically, consideration is given to one or more of the following factors, which can vary by portfolio management team and circumstances:
| • | Revenue and profitability of the business and/or each fund/account managed by the portfolio manager |
| • | Revenue and profitability of the Firm |
| • | Return on equity and risk factors of both the business units and Morgan Stanley |
| • | Assets managed by the portfolio manager |
| • | External market conditions |
| • | New business development and business sustainability |
| • | Contribution to client objectives |
| • | Team, product and/or MSIM and its affiliates that are investment advisers (including Eaton Vance) performance |
| • | The pre-tax investment performance of the funds/accounts managed by the portfolio manager (which may, in certain cases, be measured against the applicable benchmark(s) and/or peer group(s) over one, three and five-year periods) |
| • | Individual contribution and performance |
Further, the firm’s Global Incentive Compensation Discretion Policy requires compensation managers to consider Further the only legitimate, business related factors when exercising discretion in determining variable incentive compensation, including adherence to Morgan Stanley’s core values, conduct, disciplinary actions in the current performance year, risk management and risk outcomes.
Item 9. Purchases of Equity Securities by Closed-End Management Investment Company and Affiliated Purchasers
No such purchases this period.
Item 10. Submission of Matters to a Vote of Security Holders
No material changes.
Item 11. Controls and Procedures
(a) It is the conclusion of the registrant’s principal executive officer and principal financial officer that the effectiveness of the registrant’s current disclosure controls and procedures (such disclosure controls and procedures having been evaluated within 90 days of the date of this filing) provide reasonable assurance that the information required to be disclosed by the registrant has been recorded, processed, summarized and reported within the time period specified in the Commission’s rules and forms and that the information required to be disclosed by the registrant has been accumulated and communicated to the registrant’s principal executive officer and principal financial officer in order to allow timely decisions regarding required disclosure.
(b) There have been no changes in the registrant’s internal controls over financial reporting during the period covered by this report that has materially affected, or is reasonably likely to materially affect, the registrant’s internal control over financial reporting.
Item 12. Disclosure of Securities Lending Activities for Closed-End Management Investment Companies
No activity to report for the registrant’s most recent fiscal year end.
Item 13. Exhibits
| (a)(1) | Registrant’s Code of Ethics – Not applicable (please see Item 2). | |
| (a)(2)(i) | Treasurer’s Section 302 certification. | |
| (a)(2)(ii) | President’s Section 302 certification. | |
| (b) | Combined Section 906 certification. |
Signatures
Pursuant to the requirements of the Securities Exchange Act of 1934 and the Investment Company Act of 1940, the registrant has duly caused this report to be signed on its behalf by the undersigned, thereunto duly authorized.
Eaton Vance Short Duration Diversified Income Fund
| By: | /s/ Kenneth A. Topping | |
| Kenneth A. Topping | ||
| President | ||
| Date: | December 22, 2023 | |
Pursuant to the requirements of the Securities Exchange Act of 1934 and the Investment Company Act of 1940, this report has been signed below by the following persons on behalf of the registrant and in the capacities and on the dates indicated.
| By: | /s/ James F. Kirchner | |
| James F. Kirchner | ||
| Treasurer | ||
| Date: | December 22, 2023 | |
| By: | /s/ Kenneth A. Topping | |
| Kenneth A. Topping | ||
| President | ||
| Date: | December 22, 2023 | |