Exhibit 99.2

Supplemental Data
September 30, 2008

| Table of Contents |
Q3 2008 Supplemental |
| PAGE |
| |
About Gramercy Capital Corp. | 3 |
Consolidated Financial Information | |
Comparative Balance Sheets | 5, 6 |
Reconciliation of Discontinued Operations | 7, 8 |
Comparative Statements of Operations | 9 |
Comparative Computation of FFO | 10 |
Condensed Consolidated Statement of Stockholders’ Equity | 11 |
Capitalization Analysis | 12 |
Debt Data | |
Consolidated Debt Summary Schedule | 14 |
Debt Amortization Schedule by Years | 15 |
Gramercy Finance | |
Finance Portfolio Summary | 17 |
Loan and Bond Type | 18 |
Loan Maturity Schedule | 19 |
Loan Region and Property Type | 20 |
Credit Ratings of CMBS Investments | 21 |
Real Estate Securities Region and Property Type | 22 |
Gramercy Realty | |
Realty Comparative Balance Sheets | 24, 25 |
Realty Comparative Statements of Operations | 26 |
Realty Portfolio Summary | 27, 28 |
Portfolio Vacancies | 29, 30 |
Lease Expiration | 31, 32 |
Top Ten | 33 - 35 |
Dispositions | 36 |
Glossary | 37 |
Corporate and Investor Information | 38, 39 |
2
| About Gramercy Capital Corp. |
Q3 2008 Supplemental |
About Gramercy Capital Corp.
Gramercy Capital Corp. is an integrated commercial real estate specialty finance and property investment company operating in two complementary areas: Gramercy Finance, which focuses on the direct origination and acquisition of whole loans, subordinate interests in whole loans, mezzanine loans, preferred equity, CMBS and other real estate securities; and Gramercy Realty, which focuses on the acquisition and management of commercial properties leased primarily to financial institutions and affiliated users throughout the United States. Neither Gramercy Finance nor Gramercy Realty is a separate legal entity but are divisions of the Company through which the Compamy’s commercial real estate finance and property investment businesses are conducted.
Gramercy is externally-managed by GKK Manager LLC, which is a majority-owned subsidiary of SL Green Realty Corp. (NYSE: SLG). Gramercy is headquartered in New York City, and has regional investment and portfolio management offices in Los Angeles, California, Jenkintown, Pennsylvania, and Charlotte, North Carolina.
For more information on Gramercy Capital Corp., visit the Gramercy Capital Corp. website at http://www.gramercycapitalcorp.com.
Forward-Looking Information
This supplemental data contains “forward looking statements” within the meaning of Section 27A of the Securities Act of 1933, as amended, and Section 21E of the Securities Exchange Act of 1934, as amended. All statements, other than statements of historical facts, included in this report that address activities, events or developments that the Company expects, believes or anticipates will or may occur in the future, including such matters as the strength of the commercial finance and real estate property markets, and the banking industry specifically, competitive market conditions, unanticipated administrative costs, general and local economic conditions, interest rates, capital and credit market conditions, bankruptcies and defaults of borrowers or tenants in our properties or properties securing the Company’s debt investments, difficulties encountered in integrating American Financial Realty Trust into the Company, compliance with financial covenants, management changes, and other such matters are forward-looking statements. These statements are based on certain assumptions and analyses made by the Company in light of its experience and its perception of historical trends, current conditions, expected future developments and other factors it believes are appropriate. Such statements are subject to a number of assumptions, risks and uncertainties, general economic and business conditions, the business opportunities that may be presented to and pursued by the Company, changes in laws or regulations and other factors, many of which are beyond the control of the Company. Any such statements are not guarantees of future performance, and actual results or developments may differ materially from those anticipated in the forward-looking statements.
3

Consolidated
Financial Information

| Comparative Balance Sheets - Assets |
Q3 2008 Supplemental |
(Unaudited - - in thousands)
| | September 30, 2008 | | June 30, 2008 | | March 31, 2008 | | December 31, 2007 | |
| | | | | | | | | |
Assets | | | | | | | | | |
Real estate investments, at cost: | | | | | | | | | |
Land | | $ | 739,278 | | $ | 741,619 | | $ | 89,896 | | $ | 88,720 | |
Building and improvements | | 2,631,386 | | 2,642,437 | | 81,376 | | 79,549 | |
Less: accumulated depreciation | | (36,356 | ) | (19,170 | ) | (2,573 | ) | (2,015 | ) |
Total real estate investments, net | | 3,334,308 | | 3,364,886 | | 168,699 | | 166,254 | |
| | | | | | | | | |
Cash and cash equivalents | | 95,195 | | 55,201 | | 307,647 | | 293,126 | |
Restricted cash | | 263,340 | | 229,119 | | 75,547 | | 135,957 | |
Pledged government securities, net | | 102,607 | | 103,527 | | — | | — | |
Loans and other lending investments, net | | 2,230,770 | | 2,179,311 | | 2,358,732 | | 2,441,747 | |
Commercial mortgage backed securities | | 857,402 | | 855,815 | | 835,922 | | 791,983 | |
Investment in joint ventures | | 93,087 | | 68,799 | | 53,066 | | 49,440 | |
Assets held for sale, net | | 204,314 | | 397,030 | | 195,178 | | 194,998 | |
Tenant and other receivables, net | | 52,276 | | 52,565 | | — | | — | |
Derivative instruments, at fair value | | 437 | | 786 | | — | | — | |
Accrued interest | | 22,027 | | 33,040 | | 30,911 | | 32,587 | |
Acquired lease assets, net | | 399,903 | | 412,634 | | — | | — | |
Deferred costs, net | | 74,256 | | 78,441 | | 53,310 | | 56,109 | |
Other assets | | 63,262 | | 51,705 | | 50,709 | | 42,877 | |
Total assets | | $ | 7,793,184 | | $ | 7,882,859 | | $ | 4,129,721 | | $ | 4,205,078 | |
5
| Comparative Balance Sheets – Liabilities & Equity |
Q3 2008 Supplemental |
(Unaudited - - in thousands)
| | September 30, 2008 | | June 30, 2008 | | March 31, 2008 | | December 31, 2007 | |
| | | | | | | | | |
Liabilities | | | | | | | | | |
Mortgage notes payable | | $ | 2,545,773 | | $ | 2,557,181 | | $ | 153,624 | | $ | 153,624 | |
Credit facilities | | 172,301 | | 168,917 | | 50,000 | | — | |
Repurchase agreements | | 107,994 | | 94,915 | | 166,777 | | 200,197 | |
Collaterized debt obligations | | 2,662,955 | | 2,683,955 | | 2,721,700 | | 2,735,145 | |
Total secured and other debt | | 5,489,023 | | 5,504,968 | | 3,092,101 | | 3,088,966 | |
| | | | | | | | | |
Accounts payable and accrued expenses | | 110,679 | | 117,299 | | 21,921 | | 35,188 | |
Management and incentive fees payable | | 5,089 | | 6,065 | | 5,735 | | 5,617 | |
Dividends payable | | 2,341 | | 34,675 | | 24,280 | | 93,992 | |
Accrued interest payable | | 10,806 | | 12,677 | | — | | — | |
Deferred revenue | | 86,017 | | 83,622 | | — | | — | |
Below market lease liabilities, net | | 708,186 | | 746,146 | | — | | — | |
Leasehold interests, net | | 21,759 | | 21,895 | | — | | — | |
Liabilities related to assets held for sale | | 9,626 | | 7,274 | | — | | — | |
Derivative instruments, at fair value | | 83,718 | | 63,902 | | 116,148 | | 72,495 | |
Other liabilities | | 12,376 | | 14,995 | | 12,432 | | 10,085 | |
Junior subordinated deferrable interest debentures held by trusts that issued trust preferred securities | | 150,000 | | 150,000 | | 150,000 | | 150,000 | |
Total liabilities | | 6,689,620 | | 6,763,518 | | 3,422,617 | | 3,456,343 | |
| | | | | | | | | |
Minority interest | | 2,463 | | 2,386 | | — | | — | |
| | | | | | | | | |
Stockholders’ equity: | | | | | | | | | |
Common stock | | 51 | | 51 | | 34 | | 34 | |
Series A cumulative redeemable preferred stock | | 111,205 | | 111,205 | | 111,205 | | 111,205 | |
Additional paid-in-capital | | 1,081,055 | | 1,079,851 | | 687,426 | | 685,958 | |
Accumulated other comprehensive income | | (82,991 | ) | (58,627 | ) | (108,859 | ) | (65,658 | ) |
(Accumulated Deficit) retained earnings | | (8,219 | ) | (15,525 | ) | 17,298 | | 17,196 | |
Total stockholders’ equity | | 1,101,101 | | 1,116,955 | | 707,104 | | 748,735 | |
| | | | | | | | | |
Total liabilities and stockholders’ equity | | $ | 7,793,184 | | $ | 7,882,859 | | $ | 4,129,721 | | $ | 4,205,078 | |
6
| Reconciliation of Discontinued Operations |
Q3 2008 Supplemental |
(Unaudited - - in thousands)
| | Quarter Ended | |
| | September 30, 2008 | | September 30, 2008 | | September 30, 2008 | |
| | Pre-DISCO | | DISCO | | Post-DISCO | |
| | | | | | | |
Revenues: | | | | | | | |
Investment income | | $ | 60,552 | | $ | — | | $ | 60,552 | |
Rental revenue | | 83,103 | | 2,506 | | 80,597 | |
Gain on sales and other income | | 5,646 | | 205 | | 5,441 | |
Operating expense reimbursements | | 35,699 | | 2,257 | | 33,442 | |
Total revenues | | 185,000 | | 4,968 | | 180,032 | |
| | | | | | | |
Operating expenses: | | | | | | | |
Ground rent and leasehold obligations | | 5,049 | | 185 | | 4,864 | |
Real estate taxes | | 10,942 | | 1,050 | | 9,892 | |
Utilities | | 12,935 | | 1,143 | | 11,792 | |
Other property operating expenses | | 23,331 | | 3,290 | | 20,041 | |
Direct billable expenses | | 3,336 | | 42 | | 3,294 | |
Total operating expenses | | 55,593 | | 5,710 | | 49,883 | |
Net operating income | | 129,407 | | (742 | ) | 130,149 | |
| | | | | | | |
Other income (expenses): | | | | | | | |
Gain on extinguishment of debt | | 11,681 | | — | | 11,681 | |
Management fees | | (8,025 | ) | — | | (8,025 | ) |
Incentive fee | | — | | — | | — | |
Marketing, general and administrative | | (5,100 | ) | — | | (5,100 | ) |
Provision for loan loss | | (18,875 | ) | — | | (18,875 | ) |
Total other income (expenses) | | (20,319 | ) | — | | (20,319 | ) |
| | | | | | | |
EBITDA | | 109,088 | | (742 | ) | 109,830 | |
| | | | | | | |
Interest expense | | 78,504 | | (82 | ) | 78,586 | |
Depreciation and amortization | | 22,337 | | 2 | | 22,335 | |
Income before minority interest | | 8,247 | | (662 | ) | 8,909 | |
| | | | | | | |
Equity in net income from unconsolidated joint ventures | | 1,416 | | — | | 1,416 | |
| | | | | | | |
Provision for taxes | | (36 | ) | — | | (36 | ) |
Minority interest | | 32 | | 8 | | 24 | |
| | | | | | | |
Net income from continuing operations | | $ | 9,659 | | $ | (654 | ) | $ | 10,313 | |
| | | | | | | |
Net loss from discontinued operations | | — | | 654 | | (654 | ) |
| | | | | | | |
Net income | | $ | 9,659 | | $ | — | | $ | 9,659 | |
7
| Reconciliation of Discontinued Operations |
Q3 2008 Supplemental |
(Unaudited - - in thousands)
| | Year to Date Ended | |
| | September 30, 2008 | | September 30, 2008 | | September 30, 2008 | |
| | Pre-DISCO | | DISCO | | Post-DISCO | |
| | | | | | | |
Revenues: | | | | | | | |
Investment income | | $ | 197,882 | | $ | — | | $ | 197,882 | |
Rental revenue | | 168,955 | | 5,605 | | 163,350 | |
Gain on sales and other income | | 15,121 | | 570 | | 14,551 | |
Operating expense reimbursements | | 69,841 | | 4,848 | | 64,993 | |
Total revenues | | 451,799 | | 11,023 | | 440,776 | |
| | | | | | | |
Operating expenses: | | | | | | | |
Ground rent and leasehold obligations | | 9,341 | | 385 | | 8,956 | |
Real estate taxes | | 22,166 | | 2,360 | | 19,806 | |
Utilities | | 23,769 | | 2,312 | | 21,457 | |
Other property operating expenses | | 46,787 | | 6,666 | | 40,121 | |
Direct billable expenses | | 5,096 | | 57 | | 5,039 | |
Total operating expenses | | 107,159 | | 11,780 | | 95,379 | |
Net operating income | | 344,641 | | (757 | ) | 345,397 | |
| | | | | | | |
Other income (expenses): | | | | | | | |
Gain on extinguishment of debt | | 33,378 | | — | | 33,378 | |
Management fees | | (24,275 | ) | — | | (24,275 | ) |
Incentive fee | | (5,100 | ) | — | | (5,100 | ) |
Marketing, general and administrative | | (11,989 | ) | — | | (11,989 | ) |
Provision for loan loss | | (50,089 | ) | — | | (50,089 | ) |
Total other income (expenses) | | (58,075 | ) | — | | (58,075 | ) |
| | | | | | | |
EBITDA | | 286,566 | | (757 | ) | 287,322 | |
| | | | | | | |
Interest expense | | 198,264 | | 479 | | 197,785 | |
Depreciation and amortization | | 46,627 | | 2 | | 46,625 | |
Income before minority interest | | 41,675 | | (1,237 | ) | 42,912 | |
| | | | | | | |
Equity in net income from unconsolidated joint ventures | | 6,117 | | — | | 6,117 | |
| | | | | | | |
Provision for taxes | | (47 | ) | — | | (47 | ) |
Minority interest | | (219 | ) | (2 | ) | (217 | ) |
| | | | | | | |
Net income from continuing operations | | $ | 47,526 | | $ | (1,239 | ) | $ | 48,765 | |
| | | | | | | |
Net loss from discontinued operations, net of minority interest | | $ | — | | $ | 1,795 | | $ | (1,795 | ) |
Yield Maintenance | | — | | (556 | ) | 556 | |
| | | | | | | |
Net loss from discontinued operations | | — | | 1,239 | | (1,239 | ) |
| | | | | | | |
Net income | | $ | 47,526 | | $ | — | | $ | 47,526 | |
8
| Comparative Statements of Operations |
Q3 2008 Supplemental |
(Unaudited - - in thousands, except per share data)
| | Quarter Ended | | Quarter Ended | | Year to Date Ended | |
| | September 30, 2008 | | September 30, 2007 | | June 30, 2008 | | June 30, 2007 | | September 30, 2008 | | September 30, 2007 | |
| | | | | | | | | | | | | |
Revenues: | | | | | | | | | | | | | |
Investment income | | $ | 60,552 | | $ | 85,796 | | $ | 63,003 | | $ | 72,828 | | $ | 197,882 | | $ | 218,593 | |
Rental revenue | | 80,597 | | 2,523 | | 79,580 | | 1,850 | | 163,350 | | 6,109 | |
Operating expense reimbursements | | 33,442 | | — | | 32,014 | | — | | 64,993 | | — | |
Gain on sales and other income | | 5,441 | | 1,895 | | 4,558 | | 3,625 | | 14,551 | | 11,949 | |
Total revenues | | 180,032 | | 90,214 | | 179,155 | | 78,303 | | 440,776 | | 236,651 | |
| | | | | | | | | | | | | |
Operating expenses: | | | | | | | | | | | | | |
Other property operating expenses | | 20,041 | | — | | 20,293 | | — | | 40,121 | | — | |
Real estate taxes | | 9,892 | | — | | 10,265 | | — | | 19,806 | | — | |
Ground rent and leasehold obligations | | 4,864 | | — | | 4,094 | | — | | 8,956 | | — | |
Utilities | | 11,792 | | — | | 9,903 | | — | | 21,457 | | — | |
Direct billable expenses | | 3,294 | | — | | 1,747 | | — | | 5,039 | | — | |
Total operating expenses | | 49,883 | | — | | 46,302 | | — | | 95,379 | | — | |
Net operating income | | 130,149 | | 90,214 | | 132,853 | | 78,303 | | 345,397 | | 236,651 | |
| | | | | | | | | | | | | |
Other income (expenses): | | | | | | | | | | | | | |
Gain on extinguishment of debt | | 11,681 | | — | | 18,198 | | — | | 33,378 | | — | |
Management fees | | (8,025 | ) | (5,923 | ) | (9,106 | ) | (5,414 | ) | (24,275 | ) | (16,176 | ) |
Incentive fee | | — | | (22,868 | ) | (2,604 | ) | (3,784 | ) | (5,100 | ) | (29,469 | ) |
Marketing, general and administrative | | (5,100 | ) | (3,145 | ) | (4,067 | ) | (4,103 | ) | (11,989 | ) | (11,068 | ) |
Provision for loan loss | | (18,875 | ) | (2,500 | ) | (23,214 | ) | (2,900 | ) | (50,089 | ) | (6,648 | ) |
Total other income (expenses) | | (20,319 | ) | (34,436 | ) | (20,793 | ) | (16,201 | ) | (58,075 | ) | (63,361 | ) |
| | | | | | | | | | | | | |
EBITDA | | 109,830 | | 55,778 | | 112,060 | | 62,102 | | 287,322 | | 173,290 | |
| | | | | | | | | | | | | |
Interest expense | | 78,586 | | 50,601 | | 77,678 | | 39,209 | | 197,785 | | 126,271 | |
Depreciation and amortization | | 22,335 | | 1,188 | | 22,232 | | 1,088 | | 46,625 | | 2,947 | |
Income before minority interest | | 8,909 | | 3,989 | | 12,150 | | 21,805 | | 42,912 | | 44,072 | |
| | | | | | | | | | | | | |
Equity in net income from unconsolidated joint ventures | | 1,416 | | 1,264 | | 1,591 | | 484 | | 6,117 | | 1,053 | |
| | | | | | | | | | | | | |
Gain from sale of unconsolidated joint venture interest | | — | | 92,235 | | — | | — | | — | | 92,235 | |
Provision for taxes | | (36 | ) | (338 | ) | — | | (429 | ) | (47 | ) | (1,301 | ) |
Minority interest | | 24 | | — | | (241 | ) | — | | (217 | ) | — | |
| | | | | | | | | | | | | |
Net income from continuing operations | | 10,313 | | 97,150 | | 13,500 | | 21,860 | | 48,765 | | 136,059 | |
| | | | | | | | | | | | | |
Net loss from discontinued operations, net of minority interest | | (654 | ) | — | | (1,104 | ) | — | | (1,795 | ) | — | |
Yield maintenance | | — | | — | | — | | — | | 556 | | — | |
Net loss from discontinued operations | | (654 | ) | — | | (1,104 | ) | — | | (1,239 | ) | — | |
| | | | | | | | | | | | | |
Net income | | 9,659 | | 97,150 | | 12,396 | | 21,860 | | 47,526 | | 136,059 | |
Preferred stock dividends | | (2,336 | ) | (2,336 | ) | (2,336 | ) | (1,895 | ) | (7,008 | ) | (4,231 | ) |
Net income available to common stockholders | | $ | 7,323 | | $ | 94,814 | | 10,060 | | $ | 19,965 | | $ | 40,518 | | $ | 131,828 | |
| | | | | | | | | | | | | |
Basic earnings per share: | | | | | | | | | | | | | |
Net income available to common stockholders | | $ | 0.14 | | $ | 3.60 | | $ | 0.20 | | $ | 0.77 | | $ | 0.89 | | $ | 5.04 | |
Diluted earnings per share: | | | | | | | | | | | | | |
Net income available to common stockholders | | $ | 0.14 | | $ | 3.43 | | $ | 0.20 | | $ | 0.73 | | $ | 0.88 | | $ | 4.79 | |
| | | | | | | | | | | | | |
Dividends per common share | | — | | $ | 0.63 | | $ | 0.63 | | $ | 0.63 | | $ | 1.26 | | $ | 1.82 | |
| | | | | | | | | | | | | |
Basic weighted average common shares outstanding | | 51,307 | | 26,339 | | 51,166 | | 26,049 | | 45,736 | | 26,139 | |
| | | | | | | | | | | | | |
Diluted weighted average common shares and common share equivalents outstanding | | 51,356 | | 27,638 | | 51,291 | | 27,462 | | 45,814 | | 27,527 | |
9

| Comparative Computation of FFO |
Q3 2008 Supplemental |
(Unaudited - in thousands, except per share data)
| | Quarter Ended | | Year to Date Ended | | Quarter Ended | |
| | September 30, 2008 | | September 30, 2007 | | September 30, 2008 | | September 30, 2007 | | June 30, 2008 | | June 30, 2007 | |
| | | | | | | | | | | | | |
Net income available to common stockholders | | $ | 7,323 | | $ | 21,573 | | $ | 40,518 | | $ | 58,587 | | $ | 10,060 | | $ | 19,965 | |
Add: | | | | | | | | | | | | | |
Depreciation and amortization | | 25,677 | | 3,149 | | 55,988 | | 8,742 | | 25,721 | | 3,174 | |
FFO adjustment for unconsolidated joint ventures | | 104 | | 753 | | 469 | | 4,646 | | 179 | | 1,946 | |
Less: | | | | | | | | | | | | | |
Non-real estate depreciation and amortization | | (2,489 | ) | (2,538 | ) | (9,402 | ) | (6,966 | ) | (3,036 | ) | (2,592 | ) |
Funds from operations | | $ | 30,615 | | $ | 22,937 | | $ | 87,573 | | $ | 65,009 | | $ | 32,924 | | $ | 22,493 | |
| | | | | | | | | | | | | |
Funds from operations per share - basic | | $ | 0.60 | | $ | 0.87 | | $ | 1.92 | | $ | 2.49 | | $ | 0.64 | | $ | 0.86 | |
| | | | | | | | | | | | | |
Funds from operations per share - diluted | | $ | 0.60 | | $ | 0.83 | | $ | 1.91 | | $ | 2.36 | | $ | 0.64 | | $ | 0.82 | |
10
| Consolidated Statement of Stockholders’ Equity |
Q3 2008 Supplemental |
(Unaudited - in thousands)
| | | | | | Series A | | Additional | | Accumulated
Other | | (Accumulated
Deficit) / | | | | | |
| | | | | | Preferred | | Paid- | | Comprehensive | | Retained | | | | Comprehensive | |
| | Shares | | Par Value | | Stock | | In-Capital | | Income (Loss) | | Earnings | | Total | | Income | |
Balance at December 31, 2007 | | | 34,850 | | $ | 34 | | $ | 111,205 | | $ | 685,958 | | $ | (65,658 | ) | $ | 17,196 | | $ | 748,735 | | | |
Net income | | — | | — | | — | | — | | — | | 47,526 | | 47,526 | | $ | 47,526 | |
Change in net unrealized gain (loss) on derivative instruments | | — | | — | | — | | — | | (10,652 | ) | — | | (10,652 | ) | (10,652 | ) |
Reclassification adjustments from cash flow hedges included in net income | | — | | — | | — | | — | | (6,789 | ) | — | | (6,789 | ) | (6,789 | ) |
Change in net unrealized gain (loss) on commercial mortgage-backed securities previously available for sale | | — | | — | | — | | — | | 108 | | — | | 108 | | 108 | |
Issuance of common stock in connection with American Financial Realty Trust acquisition | | 16,280 | | 16 | | — | | 389,793 | | — | | — | | 389,809 | | — | |
Amortization of restricted stock awards | | — | | — | | — | | 957 | | — | | — | | 957 | | — | |
Issuance of stock - stock purchase plan | | 5 | | — | | — | | 46 | | — | | 46 | | 46 | | | |
Proceeds from stock option exercises | | 86 | | 1 | | — | | 1,305 | | — | | — | | 1,306 | | — | |
Stock based compensation - fair value | | — | | — | | — | | 2,071 | | — | | — | | 2,071 | | — | |
Deferred compensation plan, net | | 95 | | — | | — | | 925 | | — | | — | | 925 | | — | |
Dividends declared on common stock | | — | | — | | — | | — | | — | | (65,933 | ) | (65,933 | ) | — | |
Dividends declared on preferred stock | | — | | — | | — | | — | | — | | (7,008 | ) | (7,008 | ) | — | |
Balance at September 30, 2008 | | | 51,316 | | $ | 51 | | $ | 111,205 | | $ | 1,081,055 | | $ | (82,991 | ) | $ | (8,219 | ) | $ | 1,101,101 | | $ | 30,193 | |
11
| Capitalization Analysis |
Q3 2008 Supplemental |
(Unaudited - in thousands, except per share data)
| | September 30, 2008 | | June 30, 2008 | | March 31, 2008 | | December 31, 2007 | |
| | | | | | | | | |
Market Capitalization | | | | | | | | | |
| | | | | | | | | |
Common stock: | | | | | | | | | |
Common shares outstanding | | 51,316,586 | | 51,295,294 | | 34,853,911 | | 34,850,577 | |
Share price (end of period) | | $ | 2.59 | | $ | 11.59 | | $ | 20.93 | | $ | 24.31 | |
| | | | | | | | | |
Preferred Stock: | | | | | | | | | |
Outstanding Shares | | | 4,600,000 | | | 4,600,000 | | | 4,600,000 | | | 4,600,000 | |
Liquidation preference per share | | $ | 25.00 | | $ | 25.00 | | $ | 25.00 | | $ | 25.00 | |
| | | | | | | | | |
Equity market capitalization | | $ | 247,910 | | $ | 709,512 | | $ | 844,492 | | $ | 962,218 | |
| | | | | | | | | |
Secured and Other Debt | | | | | | | | | |
| | | | | | | | | |
Mortgage notes payable | | $ | 2,545,773 | | $ | 2,557,181 | | $ | 153,624 | | $ | 153,624 | |
| | | | | | | | | |
Secured credit facility CDO’s | | 2,662,955 | | 2,683,955 | | 2,721,700 | | 2,735,145 | |
Total secured debt | | 5,208,728 | | 5,241,136 | | 2,875,324 | | 2,888,769 | |
| | | | | | | | | |
Reverse Repurchase Agreements | | 107,994 | | 94,915 | | 166,777 | | 200,197 | |
Unsecured credit facility | | 172,301 | | 168,917 | | 50,000 | | — | |
Trust Preferred | | 150,000 | | 150,000 | | 150,000 | | 150,000 | |
Total unsecured debt | | 430,295 | | 413,832 | | 366,777 | | 350,197 | |
| | | | | | | | | |
Total debt | | $ | 5,639,023 | | $ | 5,654,968 | | $ | 3,242,101 | | $ | 3,238,966 | |
| | | | | | | | | |
Total enterprise value (debt and equity market capitalization) | | $ | 5,886,933 | | $ | 6,364,480 | | $ | 4,086,593 | | $ | 4,201,184 | |
| | | | | | | | | |
Available under Lines of Credit and Facilities | | | | | | | | | |
| | | | | | | | | |
Secured line commitment | | $ | 412,100 | | $ | 900,000 | | $ | 900,000 | | $ | 900,000 | |
Maximum available based on collateral pool | | 147,078 | | 150,727 | | 228,761 | | 257,383 | |
Balance outstanding | | 107,994 | | 111,355 | | 176,678 | | 198,316 | |
Availability | | 39,084 | | 39,372 | | 52,083 | | 59,067 | |
Mark To Market Adjustment | | 3,123 | | 1,785 | | 13,443 | | 5,224 | |
Restricted Liquidity | | 35,961 | | 37,125 | | 38,289 | | 39,396 | |
Net Available Liquidity | | — | | 462 | | 351 | | 14,447 | |
| | | | | | | | | |
Unfunded Commitments | | 16,869 | | 16,340 | | 19,967 | | 22,716 | |
Available Pledge Capacity | | 248,153 | | 732,933 | | 651,272 | | 619,901 | |
| | | | | | | | | |
Unsecured line commitment | | 175,000 | | 175,000 | | 175,000 | | 175,000 | |
Balance outstanding | | 172,301 | | 168,917 | | 50,000 | | — | |
Availability | | 2,699 | | 6,083 | | 125,000 | | 175,000 | |
| | | | | | | | | |
Total availability | | $ | 250,852 | | $ | 739,478 | | $ | 776,623 | | $ | 809,348 | |
| | | | | | | | | |
Common Stock Price | | | | | | | | | |
| | | | | | | | | |
High | | $ | 11.89 | | $ | 22.36 | | $ | 24.00 | | $ | 28.51 | |
| | | | | | | | | |
Low | | $ | 2.48 | | $ | 11.59 | | $ | 15.54 | | $ | 21.10 | |
| | | | | | | | | |
Current (as of September 30, 2008) | | $ | 2.59 | | | | | | | |
| | | | | | | | | | | | | | | | | |
12

Debt Data
13
| Debt Summary Schedule |
Q3 2008 Supplemental |
(dollars in millions)
| | | | | | | | | | Remaining | | | |
| | | | As of | | Coupon | | | | 2008 | | | |
| | Number of | | 9/30/2008 | | Interest | | Remaining | | Principal | | Maturity | |
Mortgage/Borrowing | | Properties | | Balance (1) | | Rate (2) | | Term (Yrs) | | Repayment | | Date | |
Secured Fixed-Rate Debt: | | | | | | | | | | | | | |
Bank of America - BBD1 | | 116 | | $ | 363.7 | | 5.47 | % | 5.2 | | $ | 2.7 | | Dec-2013 | |
Bank of America - BBD2 | | 139 | | $ | 220.5 | | 5.96 | % | 10.9 | | $ | 0.9 | | Sep-2019 | |
Dana - Bank of America | | 15 | | $ | 180.0 | | 5.61 | % | 9.3 | | $ | 0.0 | | Jan-2018 | |
55 Corporate (49.75%) | | 1 | | $ | 94.5 | | 5.75 | % | 7.9 | | $ | 0.0 | | Jun-2016 | |
101 Independence | | 1 | | $ | 75.5 | | 5.53 | % | 8.0 | | $ | 0.3 | | Oct-2016 | |
292 Madison (100%) | | 1 | | $ | 59.1 | | 6.17 | % | 9.0 | | $ | 0.0 | | Jul-2017 | |
BOA Plaza - St Louis | | 1 | | $ | 54.3 | | 4.55 | % | 0.8 | | $ | 0.6 | | Jul-2009 | |
Pitney Bowes - Bank of America | | 71 | | $ | 51.3 | | 5.33 | % | 14.0 | | $ | 2.0 | | Oct-2022 | |
One Citizens Plaza | | 1 | | $ | 43.5 | | 5.70 | % | 3.3 | | $ | 0.0 | | Jan-2012 | |
801 Market Street | | 1 | | $ | 40.9 | | 6.17 | % | 4.3 | | $ | 0.2 | | Feb-2013 | |
Beaver Valley | | 1 | | $ | 40.3 | | 5.06 | % | 6.3 | | $ | 0.2 | | Jan-2015 | |
FSI 6000D | | 16 | | $ | 31.3 | | 5.80 | % | 8.7 | | $ | 0.0 | | Jun-2017 | |
FSI 6000B | | 16 | | $ | 30.0 | | 5.80 | % | 8.7 | | $ | 0.0 | | Jun-2017 | |
FSI 6000A | | 15 | | $ | 26.4 | | 6.80 | % | 9.0 | | $ | 0.0 | | Oct-2017 | |
Pitney Bowes - Wachovia A | | 23 | | $ | 22.8 | | 5.50 | % | 14.7 | | $ | 0.3 | | Jun-2023 | |
FSI 6000C | | 15 | | $ | 22.7 | | 6.80 | % | 9.0 | | $ | 0.0 | | Oct-2017 | |
Sterling Bank | | 14 | | $ | 19.9 | | 5.57 | % | 8.3 | | $ | 0.0 | | Jan-2017 | |
Jenkins Court | | 1 | | $ | 14.4 | | 8.29 | % | 1.9 | | $ | 0.1 | | Aug-2010 | |
Charleston | | 1 | | $ | 9.2 | | 7.44 | % | 2.3 | | $ | 0.0 | | Jan-2011 | |
Debt With Principal Balance < $3 Million | | 30 | | $ | 40.6 | | 5.90 | % | 4.9 | | $ | 0.4 | | n/a | |
Total Secured Fixed-Rate Debt | | 479 | | $ | 1,441.0 | | 5.70 | % | 7.6 | | $ | 7.6 | | n/a | |
Unsecured Fixed-Rate Debt(3): | | | | | | | | | | | | | |
Trust Preferred Securities I | | n/a | | $ | 50.0 | | 7.57 | % | 26.9 | | $ | 0.0 | | May-2035 | |
Trust Preferred Securities II | | n/a | | $ | 50.0 | | 7.75 | % | 27.1 | | $ | 0.0 | | Aug-2035 | |
Trust Preferred Securities III | | n/a | | $ | 50.0 | | 7.65 | % | 27.5 | | $ | 0.0 | | Jan-2036 | |
Total Unsecured Fixed-Rate Debt | | n/a | | $ | 150.0 | | 7.66 | % | 27.2 | | $ | 0.0 | | n/a | |
| | | | | | | | | | | | | |
Total Fixed-Rate Debt | | 479 | | $ | 1,591.0 | | 5.89 | % | 9.4 | | $ | 7.6 | | n/a | |
| | | | | | | | | | | | | |
Secured Floating-Rate Debt: | | | | | | | | | | | | | |
CDO 2007-1 | | n/a | | $ | 1,016.2 | | 3m L+0.460 | % | 9.3 | | $ | 0.0 | | Sep-2017 | |
CDO 2006-1 | | n/a | | $ | 862.0 | | 3m L+0.370 | % | 6.3 | | $ | 0.0 | | Sep-2014 | |
CDO 2005-1 | | n/a | | $ | 784.7 | | 3m L+0.490 | % | 5.3 | | $ | 0.0 | | Sep-2013 | |
KBS/Goldman/Citigroup/SL Green Mezzanine | | 0 | | $ | 598.1 | | 1m L+4.350 | % | 1.4 | | $ | 0.0 | | Mar-2010 | |
Goldman/Citigroup/SL Green Mortgage | | 201 | | $ | 244.1 | | 1m L+4.350 | % | 1.4 | | $ | 0.0 | | Mar-2010 | |
PB Capital | | 48 | | $ | 240.0 | | 1m L+1.650 | % | 4.5 | | $ | 0.0 | | Apr-2013 | |
Wachovia Repurchase Facility | | n/a | | $ | 76.1 | | 1m L+2.425 | % | 2.1 | | $ | 0.0 | | Jul-2010 | |
Goldman Repurchase Facility | | n/a | | $ | 31.9 | | 1m L+1.500 | % | 1.2 | | $ | 0.0 | | Sep-2009 | |
Total Secured Floating-Rate Debt | | 249 | | $ | 3,853.1 | | | | 5.6 | | $ | 0.0 | | n/a | |
| | | | | | | | | | | | | |
Unsecured Floating-Rate Debt: | | | | | | | | | | | | | |
Key Bank Unsecured Facility | | n/a | | $ | 172.3 | | 1m L+1.650 | % | 1.8 | | $ | 0.0 | | May-2010 | |
Total Unsecured Floating-Rate Debt | | n/a | | $ | 172.3 | | | | 1.8 | | $ | 0.0 | | n/a | |
| | | | | | | | | | | | | |
Total Floating-Rate Debt | | 249 | | $ | 4,025.4 | | | | 5.4 | | $ | 0.0 | | n/a | |
| | | | | | | | | | | | | |
Total Debt | | 728 | | $ | 5,616.3 | | | | 6.5 | | $ | 7.6 | | n/a | |
| | | | | | | | | | | | | |
% Secured Debt Balance to Total Debt | | | | | | | 94.3 | % |
% Fixed-Rate Debt Balance to Total Debt (including the effect of Interest Rate SWAPS) | | | 48.8 | % |
(1) Current Principal Balance shown does not include GAAP FMV adjustments or discount/premium amounts
(2) Coupon Interest Rate is the stated coupon and is not adjusted for our hedging activity
(3) Fixed rate for the first ten years and floating rate thereafter
14

| Debt Amortization Schedule by Years |
Q3 2008 Supplemental |
(dollars in millions)
Debt Summary | | Remaining Debt Amortization | |
| | | | Current | | Coupon | | | | | | | | | | | | | | 2013 | | 2018 | | | |
| | Number of | | Principal | | Interest | | Remaining | | | | | | | | | | | | Through | | Through | | | |
Mortgage/Borrowing | | Properties | | Balance (7) | | Rate (8) | | Term (Yrs) | | 2008 | | 2009 | | 2010 | | 2011 | | 2012 | | 2017 | | 2022 | | > 2022 | |
CDO 2007-1 | (1) | n/a | | $ | 1,016.2 | | 3m L+0.460% | | 9.3 | | 0.0 | | 0.0 | | 0.0 | | 0.0 | | 0.0 | | 1,016.2 | | 0.0 | | 0.0 | |
CDO 2006-1 | (1) | n/a | | $ | 862.0 | | 3m L+0.370% | | 6.3 | | 0.0 | | 0.0 | | 0.0 | | 0.0 | | 0.0 | | 862.0 | | 0.0 | | 0.0 | |
CDO 2005-1 | (1) | n/a | | $ | 784.7 | | 3m L+0.490% | | 5.3 | | 0.0 | | 0.0 | | 0.0 | | 0.0 | | 0.0 | | 784.7 | | 0.0 | | 0.0 | |
Goldman Mezzanine | (2) | 0 | | $ | 598.1 | | 1m L+4.350% | | 1.4 | | 0.0 | | 0.0 | | 598.1 | | 0.0 | | 0.0 | | 0.0 | | 0.0 | | 0.0 | |
Bank of America - BBD1 | (3) | 116 | | $ | 363.7 | | 5.467% | | 5.2 | | 2.7 | | 11.2 | | 11.9 | | 12.6 | | 13.2 | | 312.1 | | 0.0 | | 0.0 | |
Goldman Mortgage | (4) | 201 | | $ | 244.1 | | 1m L+4.350% | | 1.4 | | 0.0 | | 0.0 | | 244.1 | | 0.0 | | 0.0 | | 0.0 | | 0.0 | | 0.0 | |
PB Capital | (5) | 48 | | $ | 240.0 | | 1m L+1.650% | | 4.5 | | 0.0 | | 0.0 | | 0.0 | | 0.0 | | 0.0 | | 240.0 | | 0.0 | | 0.0 | |
Bank of America - BBD2 | | 139 | | $ | 220.5 | | 5.963% | | 10.9 | | 0.9 | | 3.6 | | 3.8 | | 4.0 | | 4.2 | | 25.6 | | 178.5 | | 0.0 | |
Dana - Bank of America | | 15 | | $ | 180.0 | | 5.610% | | 9.3 | | 0.0 | | 0.0 | | 0.0 | | 0.0 | | 0.0 | | 4.9 | | 175.1 | | 0.0 | |
Key Bank Unsecured Facility | | n/a | | $ | 172.3 | | 1m L+1.650% | | 1.8 | | 0.0 | | 0.0 | | 172.3 | | 0.0 | | 0.0 | | 0.0 | | 0.0 | | 0.0 | |
55 Corporate (49.75%) | | 1 | | $ | 94.5 | | 5.750% | | 7.9 | | 0.0 | | 0.0 | | 0.0 | | 0.0 | | 0.0 | | 94.5 | | 0.0 | | 0.0 | |
Wachovia Repurchase Facility | (9) | n/a | | $ | 76.1 | | 1m L+2.425% | | 2.1 | | 0.0 | | 0.0 | | 76.1 | | 0.0 | | 0.0 | | 0.0 | | 0.0 | | 0.0 | |
101 Independence | | 1 | | $ | 75.5 | | 5.527% | | 8.0 | | 0.3 | | 1.3 | | 1.4 | | 1.5 | | 1.6 | | 69.4 | | 0.0 | | 0.0 | |
292 Madison (100%) | | 1 | | $ | 59.1 | | 6.170% | | 9.0 | | 0.0 | | 0.0 | | 0.0 | | 0.0 | | 0.0 | | 59.1 | | 0.0 | | 0.0 | |
BOA Plaza - St Louis | | 1 | | $ | 54.3 | | 4.546% | | 0.8 | | 0.6 | | 53.7 | | 0.0 | | 0.0 | | 0.0 | | 0.0 | | 0.0 | | 0.0 | |
Pitney Bowes - Bank of America | | 71 | | $ | 51.3 | | 5.328% | | 14.0 | | 2.0 | | 1.6 | | 1.6 | | 1.7 | | 1.8 | | 10.7 | | 32.0 | | 0.0 | |
Trust Preferred Securities I | | n/a | | $ | 50.0 | | 7.570% | | 26.9 | | 0.0 | | 0.0 | | 0.0 | | 0.0 | | 0.0 | | 0.0 | | 0.0 | | 50.0 | |
Trust Preferred Securities II | | n/a | | $ | 50.0 | | 7.750% | | 27.1 | | 0.0 | | 0.0 | | 0.0 | | 0.0 | | 0.0 | | 0.0 | | 0.0 | | 50.0 | |
Trust Preferred Securities III | | n/a | | $ | 50.0 | | 7.650% | | 27.5 | | 0.0 | | 0.0 | | 0.0 | | 0.0 | | 0.0 | | 0.0 | | 0.0 | | 50.0 | |
One Citizens Plaza | | 1 | | $ | 43.5 | | 5.703% | | 3.3 | | 0.0 | | 0.0 | | 0.0 | | 0.0 | | 43.5 | | 0.0 | | 0.0 | | 0.0 | |
801 Market Street | | 1 | | $ | 40.9 | | 6.170% | | 4.3 | | 0.2 | | 0.7 | | 0.7 | | 0.8 | | 0.8 | | 37.6 | | 0.0 | | 0.0 | |
Beaver Valley | | 1 | | $ | 40.3 | | 5.055% | | 6.3 | | 0.2 | | 0.7 | | 0.8 | | 0.8 | | 0.9 | | 36.9 | | 0.0 | | 0.0 | |
FSI 6000D | | 16 | | $ | 31.3 | | 5.800% | | 8.7 | | 0.0 | | 0.0 | | 0.2 | | 0.4 | | 0.4 | | 30.3 | | 0.0 | | 0.0 | |
FSI 6000B | | 16 | | $ | 30.0 | | 5.800% | | 8.7 | | 0.0 | | 0.0 | | 0.2 | | 0.4 | | 0.4 | | 29.1 | | 0.0 | | 0.0 | |
FSI 6000A | | 15 | | $ | 26.4 | | 6.800% | | 9.0 | | 0.0 | | 0.0 | | 0.0 | | 0.0 | | 0.0 | | 26.4 | | 0.0 | | 0.0 | |
Pitney Bowes - Wachovia A | | 23 | | $ | 22.8 | | 5.496% | | 14.7 | | 0.3 | | 1.0 | | 1.1 | | 1.2 | | 1.2 | | 7.3 | | 9.6 | | 1.1 | |
FSI 6000C | | 15 | | $ | 22.7 | | 6.800% | | 9.0 | | 0.0 | | 0.0 | | 0.0 | | 0.0 | | 0.0 | | 22.7 | | 0.0 | | 0.0 | |
Sterling Bank | | 14 | | $ | 19.9 | | 5.565% | | 8.3 | | 0.0 | | 0.0 | | 0.0 | | 0.0 | | 0.0 | | 19.9 | | 0.0 | | 0.0 | |
Goldman Repurchase Facility | (10) | n/a | | $ | 31.9 | | 1m L+1.500% | | 1.2 | | 0.0 | | 31.9 | | 0.0 | | 0.0 | | 0.0 | | 0.0 | | 0.0 | | 0.0 | |
Jenkins Court | | 1 | | $ | 14.4 | | 8.290% | | 1.9 | | 0.1 | | 0.2 | | 14.1 | | 0.0 | | 0.0 | | 0.0 | | 0.0 | | 0.0 | |
Charleston | | 1 | | $ | 9.2 | | 7.438% | | 2.3 | | 0.0 | | 0.2 | | 0.2 | | 8.7 | | 0.0 | | 0.0 | | 0.0 | | 0.0 | |
| | | | | | | | | | | | | | | | | | | | | | | | | |
Debt With Principal Balance >=$1 Million & <$3 Million | (6) | 18 | | $ | 32.7 | | 5.82% | | 4.5 | | 0.3 | | 1.3 | | 1.4 | | 1.4 | | 8.1 | | 20.2 | | 0.0 | | 0.0 | |
| | | | | | | | | | | | | | | | | | | | | | | | | |
Debt With Principal Balance < $1 Million* | | 12 | | $ | 7.9 | | 6.21% | | 6.9 | | 0.1 | | 0.3 | | 0.3 | | 0.4 | | 4.1 | | 1.8 | | 0.8 | | 0.2 | |
| | | | | | | | | | | | | | | | | | | | | | | | | |
Total / Weighted Avg | | 728 | | $ | 5,616.3 | | | | | | $ | 7.6 | | $ | 107.8 | | $ | 1,128.3 | | $ | 33.8 | | $ | 80.3 | | $ | 1,048.4 | | $ | 395.9 | | $ | 151.3 | |
| | | | | | | | | | | | | | | | | | | | | | | | | | | | | | | | | | |
(1) Stated Coupon is the combined weighted average of all classes of securities. Maturity dates listed are weight average remaining life.
(2) GS Mezzanine Loan collateralized by Equity Interest in Gramercy Realty properties - Maturity date is 3/9/2010 with option to extend to 3/9/2011 - 1M LIBOR cap of 5.25%
(3) $85.7mm is collateralized by defeasance securities
(4) GS Mortgage Loan floating rate based on LIBOR + 435pbs - Maturity date is 3/9/2010 with option to extend to 3/9/2011
(5) PB Capital Loan floating rate based on LIBOR + 165pbs
(6) $3.5mm is collateralized by defeasance securities (3 Loans)
(7) Current Principal Balance shown does not include GAAP FMV adjustments or discount/premium amounts
(8) Schedule does not include any impact as a result of our hedging activity
(9) Extendable to July 2011
(10) Extendable to December 2010
15

Gramercy Finance

| Gramercy Finance – Portfolio Summary
Q3 2008 Supplemental |
(dollars in thousands)
Loan Portfolio and Commercial Real Estate Securities - 9/30/08
| | Debt | | | | Fixed Rate: | | Floating Rate: | |
Type | | Investments | | Percentage | | Effective Yield | | Effective Spread | |
Whole Loans - Floating Rate | | $ | 1,245,982 | | 55.9 | % | | | 372 | bps |
Whole Loans - Fixed Rate | | 164,618 | | 7.4 | % | 7.10 | % | | |
Subordinate Mortgage - Floating Rate | | 101,179 | | 4.5 | % | | | 401 | bps |
Subordinate Mortgage - Fixed Rate | | 62,832 | | 2.8 | % | 9.26 | % | | |
Mezzanine Loans - Floating Rate | | 432,117 | | 19.4 | % | | | 670 | bps |
Mezzanine Loans - Fixed Rate | | 212,052 | | 9.5 | % | 9.49 | % | | |
Preferred Equity - Fixed Rate | | 11,990 | | 0.5 | % | 10.22 | % | | |
Subtotal (1) | | $ | 2,230,770 | | 100.0 | % | 8.61 | % | 446 | bps |
| | | | | | | | | |
Real Estate Securities - Floating Rate | | $ | 69,460 | | 8.1 | % | | | 687 | bps |
Real Estate Securities - Fixed Rate | | 787,942 | | 91.9 | % | 6.22 | % | | |
Subtotal | | $ | 857,402 | | 100.0 | % | 6.22 | % | 687 | bps |
| | | | | | | | | |
Total / Average | | $ | 3,088,172 | | | | 7.09 | % | 455 | bps |
(1) Weighted Average Effective Yield and Weighted Average Effective Spread calculations include loans classified as
Non-Performing. The schedule includes Non-Performing loans classified as Whole Loans - Floating Rate of approximately $100.1 million with effective spread of 500 basis points, and Non-Performing loans classified as Subordinate - Floating Rate of approximately $18.9 million with an effective spread of 311 basis points, and Non-Performing loans classified as Whole Loans - Fixed Rate of approximately $69.8 million with an effective yield of 7.67%.
17
| Gramercy Finance – Loan and Bond Type
Q3 2008 Supplemental |
(dollars in thousands)
Loan Portfolio by Type - 9/30/08
Type | | No. | | Principal | | Percentage | |
Floating | | 56 | | $ | 1,779,278 | | 79.8 | % |
Fixed | | 16 | | 451,492 | | 20.2 | % |
Total | | 72 | | $ | 2,230,770 | | 100.0 | % |
Real Estate Securities by Type - 9/30/08
Type | | No. | | Principal | | Percentage | |
Floating | | 8 | | $ | 69,460 | | 8.1 | % |
Fixed | | 63 | | 787,942 | | 91.9 | % |
Total | | 71 | | $ | 857,402 | | 100.0 | % |
18
| Gramercy Finance – Loan Maturity Schedule
Q3 2008 Supplemental |
(dollars in thousands)
Loan Portfolio by Current Maturity - 9/30/08
Year | | No. | | Principal | | Percentage | |
2008 | | 7 | | $ | 232,009 | | 10.4 | % |
2009 | | 38 | | 1,208,962 | | 54.2 | % |
2010 | | 13 | | 390,473 | | 17.5 | % |
2011 | | 2 | | 30,890 | | 1.4 | % |
2012 | | 2 | | 63,086 | | 2.8 | % |
Thereafter | | 10 | | 305,350 | | 13.7 | % |
Total | | 72 | | $ | 2,230,770 | | 100.0 | % |
Note: Current Maturity may not reflect extension options available to Borrower.
19
| Gramercy Finance – Loan Region and Property Type
Q3 2008 Supplemental |
(dollars in thousands)
Loan Portfolio by Region - 9/30/08
Region | | No. (1) | | Principal | | Percentage | |
Northeast | | 32 | | $ | 1,156,707 | | 51.9 | % |
West | | 14 | | 551,344 | | 24.7 | % |
Various | | 9 | | 231,276 | | 10.4 | % |
Southwest | | 4 | | 81,329 | | 3.6 | % |
Mid-Atlantic | | 4 | | 74,586 | | 3.3 | % |
Southeast | | 2 | | 69,755 | | 3.1 | % |
Midwest | | 2 | | 40,608 | | 1.8 | % |
South | | 2 | | 21,417 | | 1.0 | % |
Other | | 3 | | 3,747 | | 0.2 | % |
Total | | 72 | | $ | 2,230,770 | | 100.0 | % |
Loan Portfolio by Property Type - 9/30/08
Property Type | | No. (1) | | Principal | | Percentage | |
Office - CBD | | 18 | | $ | 639,849 | | 28.7 | % |
Hotel | | 11 | | 348,354 | | 15.6 | % |
Multifamily | | 10 | | 325,711 | | 14.6 | % |
Retail | | 8 | | 254,337 | | 11.4 | % |
Office - Suburban | | 8 | | 232,318 | | 10.4 | % |
Land - Commercial | | 5 | | 208,053 | | 9.3 | % |
Land - Residential | | 3 | | 82,775 | | 3.7 | % |
Condo | | 3 | | 59,556 | | 2.7 | % |
Industrial | | 2 | | 53,258 | | 2.4 | % |
Mixed-Use | | 1 | | 22,813 | | 1.0 | % |
Other | | 3 | | 3,747 | | 0.2 | % |
Total | | 72 | | $ | 2,230,770 | | 100.0 | % |
(1) Represents the number of Assets owned, not the property count of the underlying collateral.
20

| Gramercy Finance – Credit Ratings of CMBS Investments |
Q3 2008 Supplemental |
|
|
Real Estate Securities by Rating - 9/30/08
Rating | | Balance | | Percentage | |
AAA | | $ | 788,597 | | 92.0 | % |
AA | | 29,580 | | 3.4 | % |
BBB- | | 11,856 | | 1.4 | % |
BB+ | | 7,432 | | 0.9 | % |
BB | | 4,815 | | 0.6 | % |
B+ | | 4,652 | | 0.5 | % |
B | | 4,226 | | 0.5 | % |
B- | | 5,216 | | 0.6 | % |
Not Rated | | 1,030 | | 0.1 | % |
Total | | $ | 857,402 | | 100.0 | % |
21
| Gramercy Finance – Real Estate Securities Region and Property Type |
Q3 2008 Supplemental |
|
|
(dollars in thousands)
Real Estate Securities Portfolio by Region - - 9/30/08
Region | | Balance | | Percentage | |
Northeast | | $ | 199,603 | | 23.4 | % |
West | | 170,053 | | 19.9 | % |
South | | 143,637 | | 16.8 | % |
Southwest | | 116,661 | | 13.6 | % |
Midwest | | 113,010 | | 13.2 | % |
Mid-Atlantic | | 109,286 | | 12.8 | % |
Other (1) | | 1,490 | | 0.2 | % |
US Territories (2) | | 585 | | 0.1 | % |
Various | | 354 | | 0.04 | % |
Total (3) | | $ | 854,681 | | 100.0 | % |
Real Estate Securities Portfolio by Property Type - 9/30/08
Property Type | | Balance | | Percentage | |
Office | | $ | 291,254 | | 34.1 | % |
Retail | | 207,816 | | 24.3 | % |
Multifamily (4) | | 158,048 | | 18.5 | % |
Hotel | | 88,618 | | 10.4 | % |
Industrial | | 50,897 | | 6.0 | % |
Mixed-Use | | 34,248 | | 4.0 | % |
Self Storage | | 11,624 | | 1.4 | % |
Other | | 11,485 | | 1.3 | % |
Condo | | 691 | | 0.1 | % |
Total (3) | | $ | 854,681 | | 100.0 | % |
(1) Includes seven properties located outside of the US and US Territories.
(2) Includes properties located in Puerto Rico and Guam.
(3) Does not include $2.7 million of REIT debt that also serves as collateral for one bond.
(4) Includes Multifamily and Manufactured Housing.
22

Gramercy Realty
| Gramercy Realty – Comparative Balance Sheets - Assets |
Q3 2008 Supplemental |
|
|
(unaudited - in thousands)
| | September 30, 2008 | | June 30, 2008 | |
Assets | | | | | |
| | | | | |
Real estate investments, at cost: | | | | | |
Land | | $ | 647,123 | | $ | 650,594 | |
Building and improvements | | 2,550,010 | | 2,561,050 | |
Acquired lease assets | | 415,633 | | 420,493 | |
Assets held for sale | | 190,845 | | 218,927 | |
| | 3,803,611 | | 3,851,064 | |
Less: accumulated depreciation | | (48,334 | ) | (24,018 | ) |
Total real estate investment directly owned | | 3,755,277 | | 3,827,046 | |
| | | | | |
Investment in joint venture | | 12,122 | | 12,795 | |
| | | | | |
Total real estate portfolio combined | | 3,767,399 | | 3,839,841 | |
| | | | | |
Cash and cash equivalents | | 25,890 | | 36,206 | |
Restricted cash | | 94,579 | | 89,980 | |
Pledged government securities, net | | 102,607 | | 103,527 | |
Other assets held for sale, net | | 2,699 | | 2,336 | |
Tenant and other receivables | | 52,276 | | 55,298 | |
Deferred costs, net | | 24,589 | | 28,024 | |
Other assets | | 19,214 | | 16,518 | |
| | | | | |
Total assets | | $ | 4,089,253 | | $ | 4,171,730 | |
24
| Gramercy Realty – Comparative Balance Sheets – Liabilities & Equity |
Q3 2008 Supplemental |
(unaudited - in thousands)
| | September 30, 2008 | | June 30, 2008 | |
Liabilities and Stockholders’ Equity | | | | | |
| | | | | |
Liabilities: | | | | | |
Credit facilities | | $ | — | | $ | 93,917 | |
Mortgage notes payable | | 2,540,743 | | 2,473,676 | |
Total debt | | 2,540,743 | | 2,567,593 | |
| | | | | |
Accrued interest | | 10,806 | | 10,200 | |
Accounts payable and accrued expenses | | 76,277 | | 91,673 | |
Deferred revenue | | 86,017 | | 83,622 | |
Below market lease liabilities, net | | 708,186 | | 746,146 | |
Leasehold interests liabilities, net | | 21,759 | | 21,895 | |
Liabilities related to assets held for sale | | 9,626 | | 7,274 | |
| | | | | |
Total liabilities | | 3,453,414 | | 3,528,403 | |
| | | | | |
Minority interest | | 2,463 | | 2,386 | |
| | | | | |
Stockholders’ equity: | | | | | |
Investment by Gramercy Capital Corp | | 805,200 | | 805,200 | |
Due to Gramercy Capital Corp | | (169,805 | ) | (162,872 | ) |
Retained earnings | | (2,019 | ) | (1,387 | ) |
Total stockholders’ equity | | 633,376 | | 640,941 | |
| | | | | |
Total liabilities and stockholders’ equity | | $ | 4,089,253 | | $ | 4,171,730 | |
25
| Gramercy Realty – Comparative Statements of Operations |
Q3 2008 Supplemental |
|
|
(unaudited - in thousands)
| | Quarter Ended | | Year to Date Ended | |
| | September 30, 2008 | | June 30, 2008 | | September 30, 2008 | |
Revenues: | | | | | | | |
Rental revenue | | $ | 77,006 | | $ | 75,586 | | $ | 152,592 | |
Operating expense reimbursements | | 33,442 | | 31,551 | | 64,993 | |
Interest and other income | | 1,218 | | 1,091 | | 2,309 | |
Total revenues | | 111,666 | | 108,228 | | 219,894 | |
| | | | | | | |
Operating expenses: | | | | | | | |
Ground rents and leasehold obligations | | 4,864 | | 4,092 | | 8,956 | |
Real estate taxes | | 9,892 | | 9,914 | | 19,806 | |
Utilities | | 11,792 | | 9,665 | | 21,457 | |
Other property operating expenses | | 20,041 | | 20,080 | | 40,121 | |
Direct billable expenses | | 3,294 | | 1,745 | | 5,039 | |
Total operating expenses | | 49,883 | | 45,496 | | 95,379 | |
Net operating income | | 61,783 | | 62,732 | | 124,515 | |
| | | | | | | |
Other expenses: | | | | | | | |
Marketing, general and administrative | | 825 | | 870 | | 1,695 | |
Total other expenses | | 825 | | 870 | | 1,695 | |
| | | | | | | |
EBITDA | | 60,958 | | 61,862 | | 122,820 | |
| | | | | | | |
Interest expense | | 39,824 | | 40,434 | | 80,258 | |
Depreciation and amortization | | 21,436 | | 20,914 | | 42,350 | |
Income (loss) before minority interest and equity in loss from unconsolidated joint venture | | (302 | ) | 514 | | 212 | |
| | | | | | | |
Equity in net loss from unconsolidated joint venture | | (674 | ) | (728 | ) | (1,402 | ) |
| | | | | | | |
Minority interest | | 24 | | (241 | ) | (217 | ) |
| | | | | | | |
Net income (loss) from continuing operations | | $ | (952 | ) | $ | (455 | ) | $ | (1,407 | ) |
| | | | | | | |
Net income (loss) from discontinued operations, net of minority interest | | $ | 321 | | $ | (1,489 | ) | $ | (1,168 | ) |
Yield maintenance fees | | — | | 556 | | 556 | |
| | | | | | | |
Net income (loss) from discontinued operations | | 321 | | (933 | ) | (612 | ) |
| | | | | | | |
Net loss | | $ | (631 | ) | $ | (1,388 | ) | $ | (2,019 | ) |
26
 | | Gramercy Realty – Portfolio Summary |
| Q3 2008 Supplemental |
| |
| |
Gramercy Realty Portfolio
| | Gramercy
Realty Portfolio,
as of
June 30, 2008(1) | | Dispositions(2) | | New
Leasing | | Lease
Terminations /
Expirations | | Remeasure /
Adjustments | | Gramercy
Realty Portfolio,
as of
Sept. 30, 2008 | |
Number of Properties | | 1,032 | | (17 | ) | | | | | | | 1,015 | |
Branches | | 673 | | (13 | ) | | | | | | | 660 | |
Office Buildings | | 348 | | (4 | ) | | | | | | | 344 | |
Land | | 11 | | — | | | | | | | | 11 | |
| | | | | | | | | | | | | |
Rentable Sq. Ft. | | 28,052,554 | | (228,266 | ) | | | | | (1 | ) | 27,824,287 | |
Branches | | 4,367,552 | | (99,067 | ) | | | | | 1 | | 4,268,486 | |
Office Buildings | | 23,685,002 | | (129,199 | ) | | | | | (2 | ) | 23,555,801 | |
| | | | | | | | | | | | | |
Occupied Sq. Ft. | | 24,583,739 | | (142,160 | ) | 57,567 | | (99,534 | ) | 139 | | 24,399,751 | |
Branches | | 3,554,829 | | (44,676 | ) | 9,321 | | (22,802 | ) | 551 | | 3,497,223 | |
Office Buildings | | 21,028,910 | | (97,484 | ) | 48,246 | | (76,732 | ) | (412 | ) | 20,902,528 | |
| | | | | | | | | | | | | |
Occupancy | | 87.6 | % | | | | | | | | | 87.7 | % |
| | | | | | | | | | | | | |
% of Base Revenue from: | | | | | | | | | | | | | |
Financial Institutions | | 81.1 | % | | | | | | | | | 80.9 | % |
“A” Rated Tenants | | 75.0 | % | | | | | | | | | 74.7 | % |
Net Leases | | 80.6 | % | | | | | | | | | 80.4 | % |
| | | | | | | | | | | | | |
Lease Expiration (% of Base Revenue within Next Twelve Months) | | 2.2 | % | | | | | | | | | 1.7 | % |
| | | | | | | | | | | | | |
Weighted Average Remaining Lease Term (years) | | 10.8 | | | | | | | | | | 10.6 | |
(1) Adjusted to include one leasehold interest (4,166 sq. ft.) that was acquired in a prior quarter, but was not previously reported.
(2) Includes one leasehold termination.
27
| | Gramercy Realty – Portfolio Summary – Core, Value-Add and Held for Sale |
| Q3 2008 Supplemental |
| |
| |
Core
| | Gramercy
Realty
Core Assets,
as of
June 30, 2008 | | Dispositions | | Reclass | | New
Leasing | | Lease
Terminations /
Expirations | | Remeasure /
Adjustments | | Gramercy
Realty
Core Assets,
as of
Sept. 30, 2008 | |
| | | | | | | | | | | | | | | |
Number of Properties | | 652 | | (2 | ) | (3 | ) | | | | | | | 647 | |
Branches | | 452 | | (1 | ) | (3 | ) | | | | | | | 448 | |
Office Buildings | | 200 | | (1 | ) | — | | | | | | | | 199 | |
Land | | — | | — | | — | | | | | | | | — | |
| | | | | | | | | | | | | | | |
Rentable Sq. Ft. | | 20,910,046 | | (53,282 | ) | (25,864 | ) | | | | | — | | 20,830,900 | |
Branches | | 2,836,800 | | (1,872 | ) | (25,864 | ) | | | | | 1 | | 2,809,065 | |
Office Buildings | | 18,073,246 | | (51,410 | ) | — | | | | | | (1 | ) | 18,021,835 | |
| | | | | | | | | | | | | | | |
Occupied Sq. Ft. | | 20,132,952 | | (53,282 | ) | (16,204 | ) | 33,013 | | (69,661 | ) | 100 | | 20,026,918 | |
Branches | | 2,777,571 | | (1,872 | ) | (16,204 | ) | 6,021 | | (10,560 | ) | 551 | | 2,755,507 | |
Office Buildings | | 17,355,381 | | (51,410 | ) | — | | 26,992 | | (59,101 | ) | (451 | ) | 17,271,411 | |
| | | | | | | | | | | | | | | |
Occupancy | | 96.3 | % | | | | | | | | | | | 96.1 | % |
| | | | | | | | | | | | | | | |
% of Base Revenue from: | | | | | | | | | | | | | | | |
Financial Institutions | | 83.4 | % | | | | | | | | | | | 83.2 | % |
“A” Rated Tenants | | 77.7 | % | | | | | | | | | | | 77.9 | % |
Net Leases | | 83.1 | % | | | | | | | | | | | 82.9 | % |
| | | | | | | | | | | | | | | |
Lease Expiration (% of Base Revenue within Next Twelve Months) | | 1.9 | % | | | | | | | | | | | 1.5 | % |
| | | | | | | | | | | | | | | |
Weighted Average Remaining Lease Term (years) | | 11.0 | | | | | | | | | | | | 10.8 | |
Value-Add
| | Gramercy
Realty
Value-Add
Assets, as of
June 30, 2008(1) | | Dispositions(2) | | Reclass | | New
Leasing | | Lease
Terminations /
Expirations | | Remeasure /
Adjustments | | Gramercy
Realty
Value-Add
Assets, as of
Sept. 30, 2008 | |
| | | | | | | | | | | | | | | |
Number of Properties | | 296 | | (3 | ) | (68 | ) | | | | | | | 225 | |
Branches | | 178 | | (3 | ) | (57 | ) | | | | | | | 118 | |
Office Buildings | | 115 | | — | | (9 | ) | | | | | | | 106 | |
Land | | 3 | | — | | (2 | ) | | | | | | | 1 | |
| | | | | | | | | | | | | | | |
Rentable Sq. Ft. | | 5,227,759 | | (21,003 | ) | (457,406 | ) | | | | | (1 | ) | 4,749,349 | |
Branches | | 1,115,328 | | (21,003 | ) | (255,636 | ) | | | | | — | | 838,689 | |
Office Buildings | | 4,112,431 | | — | | (201,770 | ) | | | | | (1 | ) | 3,910,660 | |
| | | | | | | | | | | | | | | |
Occupied Sq. Ft. | | 3,432,395 | | — | | (138,428 | ) | 21,254 | | (14,487 | ) | 39 | | 3,300,773 | |
Branches | | 569,451 | | — | | (15,312 | ) | — | | (1,410 | ) | — | | 552,729 | |
Office Buildings | | 2,862,944 | | — | | (123,116 | ) | 21,254 | | (13,077 | ) | 39 | | 2,748,044 | |
| | | | | | | | | | | | | | | |
Occupancy | | 65.7 | % | | | | | | | | | | | 69.5 | % |
| | | | | | | | | | | | | | | |
% of Base Revenue from: | | | | | | | | | | | | | | | |
Financial Institutions | | 68.7 | % | | | | | | | | | | | 68.1 | % |
“A” Rated Tenants | | 59.2 | % | | | | | | | | | | | 55.5 | % |
Net Leases | | 67.5 | % | | | | | | | | | | | 66.9 | % |
| | | | | | | | | | | | | | | |
Lease Expiration (% of Base Revenue within Next Twelve Months) | | 2.8 | % | | | | | | | | | | | 2.8 | % |
| | | | | | | | | | | | | | | |
Weighted Average Remaining Lease Term (years) | | 10.1 | | | | | | | | | | | | 9.8 | |
Held for Sale
| | Gramercy
Realty
HFS Assets,
as of
June 30, 2008 | | Dispositions | | Reclass | | New
Leasing | | Lease
Terminations /
Expirations | | Remeasure /
Adjustments | | Gramercy
Realty
HFS Assets,
as of
Sept. 30, 2008 | |
| | | | | | | | | | | | | | | |
Number of Properties | | 84 | | (12 | ) | 71 | | | | | | | | 143 | |
Branches | | 43 | | (9 | ) | 60 | | | | | | | | 94 | |
Office Buildings | | 33 | | (3 | ) | 9 | | | | | | | | 39 | |
Land | | 8 | | — | | 2 | | | | | | | | 10 | |
| | | | | | | | | | | | | | | |
Rentable Sq. Ft. | | 1,914,749 | | (153,981 | ) | 483,270 | | | | | | | | 2,244,038 | |
Branches | | 415,424 | | (76,192 | ) | 281,500 | | | | | | | | 620,732 | |
Office Buildings | | 1,499,325 | | (77,789 | ) | 201,770 | | | | | | | | 1,623,306 | |
| | | | | | | | | | | | | | | |
Occupied Sq. Ft. | | 1,018,392 | | (88,878 | ) | 154,632 | | 3,300 | | (15,386 | ) | — | | 1,072,060 | |
Branches | | 207,807 | | (42,804 | ) | 31,516 | | 3,300 | | (10,832 | ) | — | | 188,987 | |
Office Buildings | | 810,585 | | (46,074 | ) | 123,116 | | — | | (4,554 | ) | — | | 883,073 | |
| | | | | | | | | | | | | | | |
Occupancy | | 53.2 | % | | | | | | | | | | | 47.8 | % |
| | | | | | | | | | | | | | | |
% of Base Revenue from: | | | | | | | | | | | | | | | |
Financial Institutions | | 75.8 | % | | | | | | | | | | | 76.6 | % |
“A” Rated Tenants | | 72.7 | % | | | | | | | | | | | 74.8 | % |
Net Leases | | 72.1 | % | | | | | | | | | | | 73.0 | % |
| | | | | | | | | | | | | | | |
Lease Expiration (% of Base Revenue within Next Twelve Months) | | 5.9 | % | | | | | | | | | | | 3.8 | % |
| | | | | | | | | | | | | | | |
Weighted Average Remaining Lease Term (years) | | 11.0 | | | | | | | | | | | | 10.9 | |
(1) Adjusted to include one leasehold interest (4,166 sq. ft.) that was acquired in a prior quarter, but was not previously reported.
(2) Includes one leasehold termination.
28
| | Gramercy Realty – Portfolio Vacancies |
| Q3 2008 Supplemental |
| |
Gramercy Realty Portfolio
Top Ten Vacancies by State
| | Number of | | Rentable | | Leased | | Vacant | | % | |
| | Properties | | Sq. Ft. | | Sq. Ft. | | Sq. Ft. | | Vacant | |
| | | | | | | | | | | |
Florida | | 161 | | 3,373,614 | | 2,924,131 | | 449,483 | | 13.3 | % |
Illinois | | 14 | | 1,432,194 | | 1,120,122 | | 312,072 | | 21.8 | % |
Virginia | | 52 | | 2,804,352 | | 2,498,358 | | 305,994 | | 10.9 | % |
North Carolina | | 185 | | 4,824,895 | | 4,597,242 | | 227,653 | | 4.7 | % |
New Jersey | | 69 | | 1,335,091 | | 1,109,172 | | 225,919 | | 16.9 | % |
Texas | | 50 | | 741,389 | | 528,282 | | 213,107 | | 28.7 | % |
Missouri | | 21 | | 1,415,104 | | 1,225,587 | | 189,517 | | 13.4 | % |
Tennessee | | 19 | | 402,880 | | 225,494 | | 177,386 | | 44.0 | % |
Georgia | | 74 | | 1,536,107 | | 1,378,524 | | 157,583 | | 10.3 | % |
Pennsylvania | | 57 | | 1,521,216 | | 1,375,424 | | 145,792 | | 9.6 | % |
| | 702 | | 19,386,842 | | 16,982,336 | | 2,404,506 | | | |
Vacancy by Building Size
| | Number of | | Rentable | | Leased | | Vacant | | % | |
| | Properties | | Sq. Ft. | | Sq. Ft. | | Sq. Ft. | | Vacant | |
| | | | | | | | | | | |
Over 100,000 SF | | 55 | | 15,658,158 | | 14,687,766 | | 970,392 | | 6.2 | % |
50,000 to 99,999 SF | | 31 | | 2,248,029 | | 1,816,119 | | 431,910 | | 19.2 | % |
20,000 to 49,999 SF | | 138 | | 3,956,468 | | 3,071,829 | | 884,639 | | 22.4 | % |
10,000 to 19,999 SF | | 258 | | 3,601,090 | | 2,909,889 | | 691,201 | | 19.2 | % |
Under 10,000 SF | | 522 | | 2,360,542 | | 1,914,148 | | 446,394 | | 18.9 | % |
Portfolio Total | | 1,004 | | 27,824,287 | | 24,399,751 | | 3,424,536 | | 12.3 | % |
Top Ten Office Vacancies
| | Rentable | | Leased | | Vacant | | % | |
Property Name | | Sq. Ft. | | Sq. Ft. | | Sq. Ft. | | Vacant | |
| | | | | | | | | |
Nations Bank Center - Richmond | | 540,229 | | 355,859 | | 184,370 | | 34.1 | % |
Bank of America Center - Chicago | | 983,778 | | 817,087 | | 166,691 | | 16.9 | % |
Wachovia Center Tower - Winston Salem | | 546,020 | | 409,703 | | 136,317 | | 25.0 | % |
Downtown St. Petersburg | | 87,755 | | — | | 87,755 | | 100.0 | % |
Bank of America Plaza - St. Louis | | 750,000 | | 676,278 | | 73,722 | | 9.8 | % |
Peoria Main | | 243,611 | | 177,039 | | 66,572 | | 27.3 | % |
Harborside - Jersey City | | 292,019 | | 229,902 | | 62,117 | | 21.3 | % |
State Street - Albany | | 167,195 | | 109,705 | | 57,490 | | 34.4 | % |
Fort Sam Houston | | 58,649 | | 10,045 | | 48,604 | | 82.9 | % |
Vincennes | | 63,540 | | 21,069 | | 42,471 | | 66.8 | % |
| | 3,732,796 | | 2,806,687 | | 926,109 | | | |
13.4% of portfolio sq. ft. | | 27.0% of portfolio vacancy |
15.8% of office sq. ft. | | 34.9% of office vacancy |
Portfolio by Percent Vacant
| | Number of | | Rentable | | Leased | | Vacant | |
| | Properties | | Sq. Ft. | | Sq. Ft. | | Sq. Ft. | |
| | | | | | | | | |
Vacant | | 94 | | 564,243 | | — | | 564,243 | |
90-99% Vacant | | — | | — | | — | | — | |
80-89% Vacant | | 2 | | 78,667 | | 13,710 | | 64,957 | |
70-79% Vacant | | 9 | | 226,637 | | 62,476 | | 164,161 | |
60-69% Vacant | | 14 | | 283,905 | | 101,518 | | 182,387 | |
50-59% Vacant | | 27 | | 545,750 | | 247,723 | | 298,027 | |
40-49% Vacant | | 51 | | 860,516 | | 476,812 | | 383,704 | |
30-39% Vacant | | 50 | | 1,927,618 | | 1,251,018 | | 676,600 | |
20-29% Vacant | | 51 | | 2,269,507 | | 1,707,774 | | 561,733 | |
10-19% Vacant | | 35 | | 2,033,340 | | 1,717,740 | | 315,600 | |
1-9% Vacant | | 38 | | 5,074,221 | | 4,861,097 | | 213,124 | |
No Vacancy | | 633 | | 13,959,883 | | 13,959,883 | | — | |
Portfolio Total | | 1,004 | | 27,824,287 | | 24,399,751 | | 3,424,536 | |
Land parcels are excluded from property totals.
29

| Gramercy Realty – Portfolio Vacancies – Core, Value-Add and HFS
Q3 2008 Supplemental |
Core
Top Ten Vacancies by State
| | Number of | | Rentable | | Leased | | Vacant | | % | |
| | Properties | | Sq. Ft. | | Sq. Ft. | | Sq. Ft. | | Vacant | |
| | | | | | | | | | | |
Illinois | | 4 | | 1,245,533 | | 1,010,259 | | 235,274 | | 18.9 | % |
Virginia | | 31 | | 2,586,044 | | 2,385,426 | | 200,618 | | 7.8 | % |
Missouri | | 7 | | 858,060 | | 783,162 | | 74,898 | | 8.7 | % |
Texas | | 31 | | 409,621 | | 356,690 | | 52,931 | | 12.9 | % |
Florida | | 103 | | 2,507,686 | | 2,461,259 | | 46,427 | | 1.9 | % |
Pennsylvania | | 27 | | 1,340,228 | | 1,307,740 | | 32,488 | | 2.4 | % |
New Jersey | | 41 | | 550,403 | | 521,074 | | 29,329 | | 5.3 | % |
Maryland | | 7 | | 1,008,233 | | 982,535 | | 25,698 | | 2.5 | % |
California | | 81 | | 1,230,455 | | 1,206,016 | | 24,439 | | 2.0 | % |
North Carolina | | 169 | | 4,120,254 | | 4,098,837 | | 21,417 | | 0.5 | % |
| | 501 | | 15,856,517 | | 15,112,998 | | 743,519 | | | |
Top Ten Office Vacancies
| | Rentable | | Leased | | Vacant | | % | |
Property Name | | Sq. Ft. | | Sq. Ft. | | Sq. Ft. | | Vacant | |
| | | | | | | | | |
Nations Bank Center - Richmond | | 540,229 | | 355,859 | | 184,370 | | 34.3 | % |
Bank of America Center - Chicago | | 983,778 | | 817,087 | | 166,691 | | 16.9 | % |
Bank of America Plaza - St. Louis | | 750,000 | | 676,278 | | 73,722 | | 12.4 | % |
Peoria Main | | 243,611 | | 177,039 | | 66,572 | | 27.1 | % |
Fort Sam Houston - San Antonio | | 58,649 | | 10,045 | | 48,604 | | 4.5 | % |
Charles Street - Baltimore | | 517,942 | | 494,698 | | 23,244 | | 3.8 | % |
Bridgewater | | 95,620 | | 76,602 | | 19,018 | | 19.9 | % |
101 Independence - Charlotte | | 564,724 | | 548,489 | | 16,235 | | 2.5 | % |
Plaza - Philadelphia | | 481,958 | | 469,793 | | 12,165 | | 41.3 | % |
Redding Main Branch | | 29,113 | | 17,095 | | 12,018 | | 6.9 | % |
| | 3,725,395 | | 3,287,126 | | 438,269 | | | |
17.9% of core sq. ft. | | 54.5% of core vacancy |
20.7% of core office sq. ft. | | 58.4% of core office vacancy |
Vacancy by Building Size
| | Number of | | Rentable | | Leased | | Vacant | | % | |
| | Properties | | Sq. Ft. | | Sq. Ft. | | Sq. Ft. | | Vacant | |
| | | | | | | | | | | |
Over 100,000 SF | | 48 | | 13,813,203 | | 13,245,679 | | 567,524 | | 4.1 | % |
50,000 to 99,999 SF | | 19 | | 1,396,685 | | 1,304,327 | | 92,358 | | 6.6 | % |
20,000 to 49,999 SF | | 72 | | 2,019,608 | | 1,962,513 | | 57,095 | | 2.8 | % |
10,000 to 19,999 SF | | 141 | | 1,952,550 | | 1,881,822 | | 70,728 | | 3.6 | % |
Under 10,000 SF | | 367 | | 1,648,854 | | 1,632,577 | | 16,277 | | 1.0 | % |
Core Total | | 647 | | 20,830,900 | | 20,026,918 | | 803,982 | | 3.9 | % |
| | | | | | | | | | | |
Portfolio by Percent Vacant | | | | | | | | | | | |
| | | | | | | | | | | |
| | Number of | | Rentable | | Leased | | Vacant | | | | |
| | Properties | | Sq. Ft. | | Sq. Ft. | | Sq. Ft. | | | | |
| | | | | | | | | | | | |
Vacant | | 1 | | 2,185 | | — | | 2,185 | | | | |
90-99% Vacant | | — | | — | | — | | — | | | | |
80-89% Vacant | | 1 | | 58,649 | | 10,045 | | 48,604 | | | | |
70-79% Vacant | | — | | — | | — | | — | | | | |
60-69% Vacant | | — | | — | | — | | — | | | | |
50-59% Vacant | | — | | — | | — | | — | | | | |
40-49% Vacant | | 5 | | 64,409 | | 36,380 | | 28,029 | | | | |
30-39% Vacant | | 5 | | 604,402 | | 397,667 | | 206,735 | | | | |
20-29% Vacant | | 8 | | 359,123 | | 263,670 | | 95,453 | | | | |
10-19% Vacant | | 23 | | 1,575,277 | | 1,325,275 | | 250,002 | | | | |
1-9% Vacant | | 32 | | 4,636,955 | | 4,463,981 | | 172,974 | | | | |
No Vacancy | | 572 | | 13,529,900 | | 13,529,900 | | — | | | | |
Core Total | | 647 | | 20,830,900 | | 20,026,918 | | 803,982 | | | | |
Value-Add
Top Ten Vacancies by State
| | Number of | | Rentable | | Leased | | Vacant | | % | |
| | Properties | | Sq. Ft. | | Sq. Ft. | | Sq. Ft. | | Vacant | |
| | | | | | | | | | | |
New Jersey | | 19 | | 677,294 | | 522,998 | | 154,296 | | 22.8 | % |
Florida | | 31 | | 403,759 | | 277,109 | | 126,650 | | 31.4 | % |
New York | | 4 | | 308,771 | | 195,341 | | 113,430 | | 36.7 | % |
Tennessee | | 14 | | 289,735 | | 182,349 | | 107,386 | | 37.1 | % |
Missouri | | 12 | | 520,934 | | 426,224 | | 94,710 | | 18.2 | % |
Texas | | 10 | | 171,881 | | 94,752 | | 77,129 | | 44.9 | % |
Georgia | | 18 | | 191,008 | | 118,629 | | 72,379 | | 37.9 | % |
Arkansas | | 6 | | 231,303 | | 164,043 | | 67,260 | | 29.1 | % |
North Carolina | | 11 | | 131,854 | | 71,507 | | 60,347 | | 45.8 | % |
California | | 14 | | 281,566 | | 224,573 | | 56,993 | | 20.2 | % |
| | 139 | | 3,208,105 | | 2,277,525 | | 930,580 | | | |
| | | | | | | | | | | |
Top Ten Office Vacancies | | | | | | | | | | | |
| | | | | | | | | | | |
| | | | Rentable | | Leased | | Vacant | | % | |
Property Name | | Sq. Ft. | | Sq. Ft. | | Sq. Ft. | | Vacant | |
| | | | | | | | | | | |
Schwab - Harborside | | | | 292,019 | | 229,902 | | 62,117 | | 24.7 | % |
State Street - Albany | | | | 167,195 | | 109,705 | | 57,490 | | 34.4 | % |
Arcadia - Kalamazoo | | | | 112,988 | | 71,130 | | 41,858 | | 37.0 | % |
Las Veg Ops Ctr | | | | 148,070 | | 107,179 | | 40,891 | | 27.6 | % |
One East Ave - Rochester | | | | 99,921 | | 61,152 | | 38,769 | | 38.8 | % |
Asheville Main | | | | 92,601 | | 55,790 | | 36,811 | | 39.8 | % |
NBOC Op Center - N Brunswick | | | | 260,931 | | 227,849 | | 33,082 | | 12.7 | % |
Kansas City Ops Cntr | | | | 317,732 | | 286,619 | | 31,113 | | 9.8 | % |
Quintard Ave - Anniston | | | | 28,671 | | — | | 28,671 | | 95.8 | % |
NBOC Operations - N Brunswick | | | | 26,118 | | — | | 26,118 | | 26.8 | % |
| | | | 1,254,227 | | 919,424 | | 334,803 | | | |
| | | | | | | | | | | |
26.4% of value-add sq. ft. | | 23.1% of value-add vacancy | | | | |
32.1% of value-add office sq. ft. | | 28.8% of value-add office vacancy | | | | |
| | | | | | | | | | | |
Vacancy by Building Size | | | | | | | | | | | |
| | | | | | | | | | | |
| | Number of | | Rentable | | Leased | | Vacant | | % | |
| | Properties | | Sq. Ft. | | Sq. Ft. | | Sq. Ft. | | Vacant | |
| | | | | | | | | | | |
Over 100,000 SF | | 6 | | 1,298,935 | | 1,032,384 | | 266,551 | | 20.5 | % |
50,000 to 99,999 SF | | 8 | | 579,456 | | 414,675 | | 164,781 | | 28.4 | % |
20,000 to 49,999 SF | | 45 | | 1,329,685 | | 839,895 | | 489,790 | | 36.8 | % |
10,000 to 19,999 SF | | 83 | | 1,185,112 | | 787,028 | | 398,084 | | 33.6 | % |
Under 10,000 SF | | 82 | | 356,161 | | 226,791 | | 129,370 | | 36.3 | % |
Value-Add Total | | 224 | | 4,749,349 | | 3,300,773 | | 1,448,576 | | 30.5 | % |
| | | | | | | | | | | |
Portfolio by Percent Vacant | | | | | | | | | | | |
| | | | | | | | | | | |
| | Number of | | Rentable | | Leased | | Vacant | | | | |
| | Properties | | Sq. Ft. | | Sq. Ft. | | Sq. Ft. | | | | |
| | | | | | | | | | | | |
Vacant | | 27 | | 170,300 | | — | | 170,300 | | | | |
90-99% Vacant | | — | | — | | — | | — | | | | |
80-89% Vacant | | — | | — | | — | | — | | | | |
70-79% Vacant | | 2 | | 31,174 | | 8,892 | | 22,282 | | | | |
60-69% Vacant | | 4 | | 74,533 | | 25,748 | | 48,785 | | | | |
50-59% Vacant | | 14 | | 244,295 | | 113,159 | | 131,136 | | | | |
40-49% Vacant | | 32 | | 588,429 | | 325,979 | | 262,450 | | | | |
30-39% Vacant | | 35 | | 1,179,944 | | 762,240 | | 417,704 | | | | |
20-29% Vacant | | 36 | | 1,227,430 | | 930,345 | | 297,085 | | | | |
10-19% Vacant | | 11 | | 440,655 | | 378,469 | | 62,186 | | | | |
1-9% Vacant | | 5 | | 399,296 | | 362,648 | | 36,648 | | | | |
No Vacancy | | 58 | | 393,293 | | 393,293 | | — | | | | |
Value-Add Total | | 224 | | 4,749,349 | | 3,300,773 | | 1,448,576 | | | | |
Held for Sale
Top Ten Vacancies by State
| | Number of | | Rentable | | Leased | | Vacant | | % | |
| | Properties | | Sq. Ft. | | Sq. Ft. | | Sq. Ft. | | Vacant | |
| | | | | | | | | | | |
Florida | | 27 | | 462,169 | | 185,763 | | 276,406 | | 59.8 | % |
North Carolina | | 5 | | 572,787 | | 426,898 | | 145,889 | | 25.5 | % |
Indiana | | 4 | | 175,237 | | 58,595 | | 116,642 | | 66.6 | % |
Pennsylvania | | 16 | | 98,842 | | 10,560 | | 88,282 | | 89.3 | % |
Texas | | 9 | | 159,887 | | 76,840 | | 83,047 | | 51.9 | % |
Georgia | | 13 | | 102,982 | | 23,364 | | 79,618 | | 77.3 | % |
Tennessee | | 4 | | 110,901 | | 40,901 | | 70,000 | | 63.1 | % |
Virginia | | 9 | | 64,262 | | 14,859 | | 49,403 | | 76.9 | % |
Mississippi | | 4 | | 72,498 | | 29,487 | | 43,011 | | 59.3 | % |
New Jersey | | 9 | | 107,394 | | 65,100 | | 42,294 | | 39.4 | % |
| | 100 | | 1,926,959 | | 932,367 | | 994,592 | | | |
| | | | | | | | | | | |
Top Ten Office Vacancies | | | | | | | | | | | |
| | | | | | | | | | | |
| | | | Rentable | | Leased | | Vacant | | % | |
Property Name | | | | Sq. Ft. | | Sq. Ft. | | Sq. Ft. | | Vacant | |
| | | | | | | | | | | |
Wachovia Ctr Tower - Winston Salem | | | | 546,020 | | 409,703 | | 136,317 | | 25.0 | % |
Downtown St. Petersburg | | | | 87,755 | | — | | 87,755 | | 100 | % |
Vincennes | | | | 63,540 | | 21,069 | | 42,471 | | 66.8 | % |
Logansport | | | | 49,045 | | 11,707 | | 37,338 | | 76.1 | % |
Memphis | | | | 56,552 | | 26,178 | | 30,374 | | 53.7 | % |
Greenville | | | | 37,143 | | 9,991 | | 27,152 | | 73.1 | % |
North Liberty | | | | 37,269 | | 10,730 | | 26,539 | | 71.2 | % |
Washington St | | | | 37,188 | | 14,986 | | 22,202 | | 59.4 | % |
Cocoa Village | | | | 35,487 | | 14,410 | | 21,077 | | 47.9 | % |
Jasmine Lakes - Port Richey | | | | 27,606 | | 10,829 | | 16,777 | | 47.5 | % |
| | | | 990,342 | | 544,346 | | 445,996 | | | |
44.1% of HFS sq. ft. | | 38.1% of HFS vacancy | | | |
61.0% of HFS office sq. ft. | | 60.3% of HFS office vacancy | | | |
| | | | | | | | | | | |
Vacancy by Building Size | | | | | | | | | | | |
| | | | | | | | | | | |
| | Number of | | Rentable | | Leased | | Vacant | | % | |
| | Properties | | Sq. Ft. | | Sq. Ft. | | Sq. Ft. | | Vacant | |
| | | | | | | | | | | |
Over 100,000 SF | | 1 | | 546,020 | | 409,703 | | 136,317 | | 25.0 | % |
50,000 to 99,999 SF | | 4 | | 271,888 | | 97,117 | | 174,771 | | 64.3 | % |
20,000 to 49,999 SF | | 21 | | 607,175 | | 269,421 | | 337,754 | | 55.6 | % |
10,000 to 19,999 SF | | 34 | | 463,428 | | 241,039 | | 222,389 | | 48.0 | % |
Under 10,000 SF | | 73 | | 355,527 | | 54,780 | | 300,747 | | 84.6 | % |
HFS Total | | 133 | | 2,244,038 | | 1,072,060 | | 1,171,978 | | 52.2 | % |
| | | | | | | | | | | |
Portfolio by Percent Vacant | | | | | | | | | | | |
| | | | | | | | | | | |
| | Number of | | Rentable | | Leased | | Vacant | | | |
| | Properties | | Sq. Ft. | | Sq. Ft. | | Sq. Ft. | | | |
| | | | | | | | | | | |
Vacant | | 66 | | 391,758 | | — | | 391,758 | | | | |
90-99% Vacant | | — | | — | | — | | — | | | | |
80-89% Vacant | | 1 | | 20,018 | | 3,665 | | 16,353 | | | | |
70-79% Vacant | | 7 | | 195,463 | | 53,584 | | 141,879 | | | | |
60-69% Vacant | | 10 | | 209,372 | | 75,770 | | 133,602 | | | | |
50-59% Vacant | | 13 | | 301,455 | | 134,564 | | 166,891 | | | | |
40-49% Vacant | | 14 | | 207,678 | | 114,453 | | 93,225 | | | | |
30-39% Vacant | | 10 | | 143,272 | | 91,111 | | 52,161 | | | | |
20-29% Vacant | | 7 | | 682,954 | | 513,759 | | 169,195 | | | | |
10-19% Vacant | | 1 | | 17,408 | | 13,996 | | 3,412 | | | | |
1-9% Vacant | | 1 | | 37,970 | | 34,468 | | 3,502 | | | | |
No Vacancy | | 3 | | 36,690 | | 36,690 | | — | | | | |
HFS Total | | 133 | | 2,244,038 | | 1,072,060 | | 1,171,978 | | | | |
Land parcels are excluded from property totals.
30
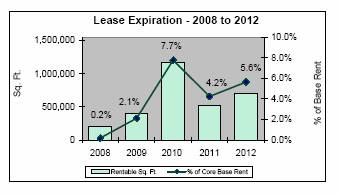
| Gramercy Realty – Lease Expiration
Q3 2008 Supplemental |
Gramercy Realty Portfolio

Month-to-Month leases are included in 2008 expirations.
Leases for parking, signs, antennae, etc. are excluded.
Lease Expirations within Next 12 Months
Expiring | | Number of
Tenant
Leases | | Leased
Sq. Ft. | | % of Portfolio
Rentable Sq. Ft. | | % of Portfolio
Base Rent | |
Monthly | | 76 | | 222,938 | | 0.8 | % | 0.0 | % |
Q4 2008 | | 58 | | 144,209 | | 0.5 | % | 0.2 | % |
Q1 2009 | | 61 | | 191,298 | | 0.7 | % | 0.5 | % |
Q2 2009 | | 55 | | 189,401 | | 0.7 | % | 0.6 | % |
Q3 2009 | | 32 | | 101,892 | | 0.4 | % | 0.4 | % |
31

| Gramercy Realty – Lease Expiration – Core, Value-Add and HFS |
Q3 2008 Supplemental |
Core
Lease Expirations within Next 12 Months
Expiring | | Number
of
Tenant
Leases | | Leased
Sq. Ft. | | % of
Core
Rentable
Sq. Ft. | | % of
Core
Base
Rent | |
Monthly | | 28 | | 118,009 | | 0.6 | % | 0.0 | % |
Q4 2008 | | 31 | | 86,862 | | 0.4 | % | 0.2 | % |
Q1 2009 | | 31 | | 123,571 | | 0.6 | % | 0.5 | % |
Q2 2009 | | 25 | | 101,059 | | 0.5 | % | 0.5 | % |
Q3 2009 | | 19 | | 77,202 | | 0.4 | % | 0.3 | % |
Value-Add
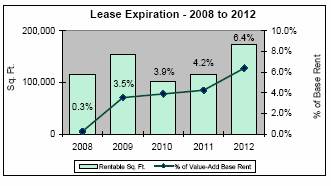
Lease Expirations within Next 12 Months
Expiring | | Number
of
Tenant
Leases | | Leased
Sq. Ft. | | % of
Value-Add
Rentable
Sq. Ft. | | % of
Value-Add
Base
Rent | |
Monthly | | 35 | | 75,218 | | 1.6 | % | 0.1 | % |
Q4 2008 | | 22 | | 39,380 | | 0.8 | % | 0.2 | % |
Q1 2009 | | 24 | | 45,357 | | 1.0 | % | 0.5 | % |
Q2 2009 | | 25 | | 57,050 | | 1.2 | % | 1.0 | % |
Q3 2009 | | 12 | | 23,271 | | 0.5 | % | 1.0 | % |
Held for Sale
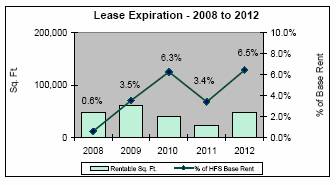
Lease Expirations within Next 12 Months
Expiring | | Number
of
Tenant
Leases | | Leased
Sq. Ft. | | % of
HFS
Rentable
Sq. Ft. | | % of
HFS
Base
Rent | |
Monthly | | 13 | | 29,711 | | 1.3 | % | 0.1 | % |
Q4 2008 | | 5 | | 17,967 | | 0.8 | % | 0.5 | % |
Q1 2009 | | 6 | | 22,370 | | 1.0 | % | 0.4 | % |
Q2 2009 | | 5 | | 31,292 | | 1.4 | % | 2.7 | % |
Q3 2009 | | 1 | | 1,419 | | 0.1 | % | 0.1 | % |
Month-to-Month leases are included in 2008 expirations. |
Leases for parking, signs, antennae, etc. are excluded. |
32
| Gramercy Realty – Top Ten |
Q3 2008 Supplemental |
Gramercy Realty Portfolio
Top Ten Tenants by Percent of Base Rent
Tenants/Financial Institutions | | Credit
Rating* | | Number of
Locations | | Rentable
Sq. Ft. | | % of Portfolio
Rentable
Sq. Ft. | | % of Portfolio
Base
Rent | |
| | | | | | | | | | | |
1 Bank of America, N.A. | | A+ | | 380 | | 12,562,516 | | 45.1 | % | 45.0 | % |
2 Wachovia Bank, National Association | | A+ | | 159 | | 5,309,579 | | 19.1 | % | 14.2 | % |
3 Regions Financial Corporation | | A+ | | 83 | | 744,696 | | 2.7 | % | 4.3 | % |
4 Citizens Financial Group | | AA- | | 9 | | 267,585 | | 1.0 | % | 2.4 | % |
5 General Services Administration (GSA) | | AAA | | 6 | | 228,776 | | 0.8 | % | 1.9 | % |
6 American International Insurance Company (AIG) | | AA- | | 1 | | 263,058 | | 0.9 | % | 1.9 | % |
7 Branch Banking & Trust Co. (BB&T) | | AA- | | 22 | | 395,589 | | 1.4 | % | 1.6 | % |
8 Key Bank | | A | | 32 | | 159,076 | | 0.6 | % | 1.3 | % |
9 Citco Fund Services (USA, Inc) | | N/A | | 1 | | 104,343 | | 0.4 | % | 0.9 | % |
10 Fifth Third Bank | | A+ | | 17 | | 62,949 | | 0.2 | % | 0.8 | % |
| | | | 710 | | 20,098,167 | | 72.2 | % | 74.3 | % |
* Ratings by Fitch. Individual lease agreements may be with unrated subsidiaries of named entities. |
Top Ten States by Percent of Portfolio NOI
States | | Number of
Properties | | Rentable
Sq. Ft. | | % of Portfolio
Rentable
Sq. Ft. | | %
Occupancy | | % of Portfolio
NOI | |
| | | | | | | | | | | |
1 North Carolina | | 185 | | 4,824,895 | | 17.3 | % | 95.3 | % | 22.4 | % |
2 Florida | | 161 | | 3,373,614 | | 12.1 | % | 86.7 | % | 13.5 | % |
3 Virginia | | 52 | | 2,804,352 | | 10.1 | % | 89.1 | % | 10.9 | % |
4 Georgia | | 74 | | 1,536,107 | | 5.5 | % | 89.7 | % | 6.2 | % |
5 Maryland | | 7 | | 1,008,233 | | 3.6 | % | 97.5 | % | 5.6 | % |
6 California | | 95 | | 1,512,021 | | 5.4 | % | 94.6 | % | 5.5 | % |
7 Pennsylvania | | 57 | | 1,521,216 | | 5.5 | % | 90.4 | % | 5.4 | % |
8 Missouri | | 21 | | 1,415,104 | | 5.1 | % | 86.6 | % | 4.6 | % |
9 Illinois | | 14 | | 1,432,194 | | 5.1 | % | 78.2 | % | 3.4 | % |
10 Delaware | | 2 | | 378,723 | | 1.4 | % | 100.0 | % | 2.6 | % |
| | 668 | | 19,806,459 | | 71.2 | % | 90.4 | % | 80.2 | % |
Land parcels are excluded from property totals.
33
| Gramercy Realty – Top Ten – Core, Value-Add and HFS |
Q3 2008 Supplemental |
Top Ten Tenants by Percent of Base Rent
Core
Tenants | | Credit
Rating* | | Number of
Locations | | Rentable
Sq. Ft. | | % of Core
Rentable
Sq. Ft. | | % of Portfolio
Rentable
Sq. Ft. | | % of Core
Base
Rent | | % of Portfolio
Base
Rent | |
| | | | | | | | | | | | | | | |
1 Bank of America, N.A. | | A+ | | 284 | | 11,122,796 | | 53.4 | % | 40.0 | % | 49.5 | % | 41.1 | % |
2 Wachovia Bank, National Association | | A+ | | 121 | | 4,454,592 | | 21.4 | % | 16.0 | % | 14.9 | % | 12.4 | % |
3 Citizens Financial Group | | AA- | | 3 | | 223,307 | | 1.1 | % | 0.8 | % | 2.5 | % | 2.1 | % |
4 American International Insurance Company (AIG) | | AA- | | 1 | | 263,058 | | 1.3 | % | 0.9 | % | 2.2 | % | 1.9 | % |
5 Branch Banking & Trust Co. (BB&T) | | AA- | | 22 | | 395,589 | | 1.9 | % | 1.4 | % | 1.9 | % | 1.6 | % |
6 General Services Administration (GSA) | | AAA | | 2 | | 173,185 | | 0.8 | % | 0.6 | % | 1.8 | % | 1.5 | % |
7 Key Bank | | A | | 31 | | 155,448 | | 0.7 | % | 0.6 | % | 1.6 | % | 1.3 | % |
8 Sun Bank | | A+ | | 15 | | 73,994 | | 0.4 | % | 0.3 | % | 1.0 | % | 0.8 | % |
9 Regions Financial Corporation | | A+ | | 14 | | 55,331 | | 0.3 | % | 0.2 | % | 0.9 | % | 0.7 | % |
10 Robinson, Bradshaw & Hinson PA | | N/A | | 1 | | 117,107 | | 0.6 | % | 0.4 | % | 0.9 | % | 0.7 | % |
| | | | 494 | | 17,034,407 | | 81.8 | % | 61.2 | % | 77.3 | % | 64.2 | % |
Value-Add
Tenants | | Credit
Rating* | | Number of
Locations | | Rentable
Sq. Ft. | | % of Value-Add
Rentable
Sq. Ft. | | % of Portfolio
Rentable
Sq. Ft. | | % of Value-Add
Base
Rent | | % of Portfolio
Base
Rent | |
| | | | | | | | | | | | | | | |
1 Bank of America, N.A. | | A+ | | 75 | | 1,285,300 | | 27.1 | % | 4.6 | % | 24.8 | % | 3.4 | % |
2 Regions Financial Corporation | | A+ | | 49 | | 509,434 | | 10.7 | % | 1.8 | % | 19.7 | % | 2.7 | % |
3 Citco Fund Services | | N/A | | 1 | | 104,343 | | 2.2 | % | 0.4 | % | 6.7 | % | 0.9 | % |
4 Wachovia Bank, National Association | | A+ | | 16 | | 371,955 | | 7.8 | % | 1.3 | % | 5.8 | % | 0.8 | % |
5 National City Bank | | BBB+ | | 4 | | 54,778 | | 1.2 | % | 0.2 | % | 2.2 | % | 0.3 | % |
6 Citizens Financial Group | | AA- | | 6 | | 44,278 | | 0.9 | % | 0.2 | % | 2.1 | % | 0.3 | % |
7 General Services Administration (GSA) | | AAA | | 3 | | 48,443 | | 1.0 | % | 0.2 | % | 2.1 | % | 0.3 | % |
8 Northern Trust Co. | | N/A | | 1 | | 26,570 | | 0.6 | % | 0.1 | % | 1.7 | % | 0.2 | % |
9 Fifth Third Bank | | A+ | | 2 | | 10,500 | | 0.2 | % | 0.0 | % | 1.6 | % | 0.2 | % |
10 Sovereign Bank | | BBB | | 2 | | 15,000 | | 0.3 | % | 0.1 | % | 1.4 | % | 0.2 | % |
| | | | 159 | | 2,470,601 | | 52.0 | % | 8.9 | % | 68.1 | % | 9.3 | % |
Held for Sale
Tenants | | Credit
Rating* | | Number of
Locations | | Rentable
Sq. Ft. | | % of HFS
Rentable
Sq. Ft. | | % of Portfolio
Rentable
Sq. Ft. | | % of HFS
Base
Rent | | % of Portfolio
Base
Rent | |
| | | | | | | | | | | | | | | |
1 Wachovia Bank, National Association | | A+ | | 22 | | 483,032 | | 21.5 | % | 1.7 | % | 31.8 | % | 1.0 | % |
2 Regions Financial Corporation | | A+ | | 20 | | 179,931 | | 8.0 | % | 0.6 | % | 27.0 | % | 0.9 | % |
3 Bank of America, N.A. | | A+ | | 21 | | 154,420 | | 6.9 | % | 0.6 | % | 12.8 | % | 0.4 | % |
4 Schroeder Measurement Technologies, Inc. | | N/A | | 1 | | 20,913 | | 0.9 | % | 0.1 | % | 3.0 | % | 0.1 | % |
5 Citibank | | AA- | | 1 | | 14,504 | | 0.6 | % | 0.1 | % | 2.9 | % | 0.1 | % |
6 General Services Administration (GSA) | | AAA | | 1 | | 7,148 | | 0.3 | % | 0.0 | % | 2.4 | % | 0.1 | % |
7 Wake Forest University Health Services | | N/A | | 1 | | 24,734 | | 1.1 | % | 0.1 | % | 2.2 | % | 0.1 | % |
8 Deutsche Bank Securities, Inc. | | AA- | | 1 | | 10,924 | | 0.5 | % | 0.0 | % | 1.9 | % | 0.1 | % |
9 Noregon Systems, Inc. | | N/A | | 1 | | 9,975 | | 0.4 | % | 0.0 | % | 1.8 | % | 0.1 | % |
10 National City Bank | | BBB+ | | 1 | | 10,319 | | 0.5 | % | 0.0 | % | 1.7 | % | 0.1 | % |
| | | | 70 | | 915,900 | | 40.8 | % | 3.3 | % | 87.6 | % | 2.8 | % |
* Ratings by Fitch. Individual lease agreements may be with unrated subsidiaries of named entities. |
34

|
Gramercy Realty – Top Ten – Core, Value-Add and HFS
Q3 2008 Supplemental
|
Top Ten States by Percent of NOI
| | Core | | | | | | | | | | | | | | | |
| | | | | | | | | | | | | | | | | |
States | | Number of
Properties | | Rentable
Sq. Ft. | | %
Occupancy | | % of Core
Rentable
Sq. Ft. | | % of Portfolio
Rentable
Sq. Ft. | | % of Core
NOI | | % of Portfolio
NOI | |
1 | | North Carolina | | 169 | | 4,120,254 | | 99.5 | % | 19.8 | % | 14.8 | % | 22.3 | % | 21.4 | % |
2 | | Florida | | 103 | | 2,507,686 | | 98.1 | % | 12.0 | % | 9.0 | % | 14.0 | % | 13.4 | % |
3 | | Virginia | | 31 | | 2,586,044 | | 92.2 | % | 12.4 | % | 9.3 | % | 11.4 | % | 10.9 | % |
4 | | Georgia | | 43 | | 1,242,117 | | 99.6 | % | 6.0 | % | 4.5 | % | 6.2 | % | 6.0 | % |
5 | | Maryland | | 7 | | 1,008,233 | | 97.5 | % | 4.8 | % | 3.6 | % | 5.8 | % | 5.6 | % |
6 | | Pennsylvania | | 27 | | 1,340,228 | | 97.6 | % | 6.4 | % | 4.8 | % | 5.5 | % | 5.3 | % |
7 | | California | | 81 | | 1,230,455 | | 98.0 | % | 5.9 | % | 4.4 | % | 5.1 | % | 4.9 | % |
8 | | Missouri | | 7 | | 858,060 | | 91.3 | % | 4.1 | % | 3.1 | % | 3.6 | % | 3.4 | % |
9 | | Illinois | | 4 | | 1,245,533 | | 81.1 | % | 6.0 | % | 4.5 | % | 3.2 | % | 3.1 | % |
10 | | Delaware | | 2 | | 378,723 | | 100.0 | % | 1.8 | % | 1.4 | % | 2.7 | % | 2.6 | % |
| | | | 474 | | 16,517,333 | | 96.0 | % | 79.3 | % | 58.9 | % | 80.5 | % | 76.7 | % |
| | Value-Add | | | | | | | | | | | | | | | |
| | | | | | | | | | | | | | | | | |
States | | Number of
Properties | | Rentable
Sq. Ft. | | %
Occupancy | | % of Value-Add
Rentable
Sq. Ft. | | % of Portfolio
Rentable
Sq. Ft. | | % of Value-Add
NOI | | % of Portfolio
NOI | |
1 | | Missouri | | 12 | | 520,934 | | 81.8 | % | 11.0 | % | 1.9 | % | 33.7 | % | 1.2 | % |
2 | | California | | 14 | | 281,566 | | 79.8 | % | 5.9 | % | 1.0 | % | 16.6 | % | 0.6 | % |
3 | | Tennessee | | 14 | | 289,735 | | 62.9 | % | 6.1 | % | 1.0 | % | 14.4 | % | 0.5 | % |
4 | | Arkansas | | 6 | | 231,303 | | 70.9 | % | 4.9 | % | 0.8 | % | 13.5 | % | 0.5 | % |
5 | | Florida | | 31 | | 403,759 | | 68.6 | % | 8.5 | % | 1.5 | % | 12.1 | % | 0.4 | % |
6 | | Texas | | 10 | | 171,881 | | 55.1 | % | 3.6 | % | 0.6 | % | 10.6 | % | 0.4 | % |
7 | | Georgia | | 18 | | 191,008 | | 62.1 | % | 4.0 | % | 0.7 | % | 10.5 | % | 0.4 | % |
8 | | Pennsylvania | | 14 | | 82,146 | | 69.5 | % | 1.7 | % | 0.3 | % | 8.9 | % | 0.3 | % |
9 | | Nevada | | 1 | | 148,070 | | 72.4 | % | 3.1 | % | 0.5 | % | 8.1 | % | 0.3 | % |
10 | | Alabama | | 8 | | 112,073 | | 60.1 | % | 2.4 | % | 0.4 | % | 8.1 | % | 0.3 | % |
| | | | 128 | | 2,432,475 | | 70.7 | % | 51.2 | % | 8.7 | % | 143.1 | % | 4.8 | % |
| | Held for Sale | | | | | | | | | | | | | | | |
| | | | | | | | | | | | | | | | | |
States | | Number of
Properties | | Rentable
Sq. Ft. | | %
Occupancy | | % of HFS
Rentable
Sq. Ft. | | % of Portfolio
Rentable
Sq. Ft. | | % of HFS
NOI | | % of Portfolio
NOI | |
1 | | North Carolina | | 5 | | 572,787 | | 74.5 | % | 25.5 | % | 2.1 | % | 232.9 | % | 1.1 | % |
2 | | Illinois | | 5 | | 81,579 | | 55.8 | % | 3.6 | % | 0.3 | % | 25.7 | % | 0.1 | % |
3 | | Mississippi | | 4 | | 72,498 | | 40.7 | % | 3.2 | % | 0.3 | % | 19.7 | % | 0.1 | % |
4 | | Texas | | 9 | | 159,887 | | 48.1 | % | 7.1 | % | 0.6 | % | 18.7 | % | 0.1 | % |
5 | | Indiana | | 4 | | 175,237 | | 33.4 | % | 7.8 | % | 0.6 | % | 10.8 | % | 0.1 | % |
6 | | Arkansas | | 2 | | 26,833 | | 69.6 | % | 1.2 | % | 0.1 | % | 5.8 | % | 0.0 | % |
7 | | South Carolina | | 5 | | 42,160 | | 63.4 | % | 1.9 | % | 0.2 | % | 1.6 | % | 0.0 | % |
8 | | Louisiana | | 1 | | 5,591 | | 0.0 | % | 0.2 | % | 0.0 | % | (2.1 | )% | 0.0 | % |
9 | | Colorado | | 1 | | 4,315 | | 0.0 | % | 0.2 | % | 0.0 | % | (2.3 | )% | 0.0 | % |
10 | | Connecticut | | 1 | | 6,759 | | 0.0 | % | 0.3 | % | 0.0 | % | (2.5 | )% | 0.0 | % |
| | | | 37 | | 1,147,646 | | 59.5 | % | 51.1 | % | 4.1 | % | 362.8 | % | 1.5 | % |
Land parcels are excluded from property totals.
35
|
Gramercy Realty – Dispositions – Q3
Q3 2008 Supplemental
|
Gramercy Realty
Dispositions Report
Date of Inventory 9/30/2008
For Dispositions between 7/1/2008 and 9/30/2008
| | | | Property | | Own. | | | | | | | | Zip | | Disposition | | Rentable | | Occupied | | | |
Property | | Property Name | | Type | | Code | | Address | | City | | State | | Code | | Date | | SF | | SF | | Occup % | |
| | | | | | | | | | | | | | | | | | | | | | | |
234 | | 234 - Lawrenceville | | BRH | | Leased | | 160 Lawrenceville Penning Road | | Lawrenceville | | NJ | | 8648 | | 7/1/2008 | | 2,362 | | 0 | | — | |
575 | | 0075 – Ventnor | | BRH | | Owned | | Surrey & Atlantic | | Ventnor | | NJ | | 8406 | | 8/15/2008 | | 1,872 | | 1,872 | | 100.0 | % |
3382 | | 3382 - Washington Off | | BRH | | Owned | | 2 W Washington Ave | | Washington | | NJ | | 7882 | | 7/28/2008 | | 16,650 | | 5,412 | | 32.5 | % |
3394 | | 3394 - Milford | | BRH | | Owned | | 224 Broad St | | Milford | | PA | | 18337 | | 8/6/2008 | | 6,403 | | 4,210 | | 65.8 | % |
3396 | | 3396 - Mt. Penn Bldg | | BRH | | Owned | | 23rd & Perkiomen Avenues | | Mt. Penn | | PA | | 19606 | | 8/6/2008 | | 8,707 | | 6,242 | | 71.7 | % |
3398 | | 3398 - Phoenixvill Off | | BRH | | Owned | | 101 S Main Street | | Pheonixville | | PA | | 19460 | | 8/6/2008 | | 13,693 | | 8,788 | | 64.2 | % |
3399 | | 3399 - Pittston | | BRH | | Owned | | 1 S Main St Pittston Bypass | | Pittston | | PA | | 18640 | | 8/27/2008 | | 8,113 | | 4,447 | | 54.8 | % |
3402 | | 3402 - Pottstown | | BRH | | Owned | | 401 E High St | | Pottstown | | PA | | 19464 | | 8/6/2008 | | 6,232 | | 4,485 | | 72.0 | % |
3407 | | 3407 - Wind Gap Office | | BRH | | Owned | | 1 N Broadwy St(ATM) Rt 512&33 | | Wind Gap | | PA | | 18091 | | 7/14/2008 | | 7,907 | | 2,725 | | 34.5 | % |
3694 | | 3694 - Alpharetta Highway | | BRH | | Owned | | 11180 Alpharetta Highway | | Roswell | | GA | | 30076 | | 8/8/2008 | | 14,242 | | 0 | | — | |
3698 | | 3698 - Jones Road | | BRH | | Owned | | 9211 Jones Road | | Houston | | TX | | 77065 | | 9/2/2008 | | 4,399 | | 0 | | — | |
3721 | | 93721 - East Atanta | | BRH | | Owned | | 1246 Glenwood Avenue S.E. | | Atlanta | | GA | | 30316 | | 7/25/2008 | | 1,992 | | 0 | | — | |
4028 | | 4028C - East Point | | BRH | | Owned | | 2791 EAST POINT STREET SW | | EAST POINT | | GA | | 30344 | | 9/24/2008 | | 6,495 | | 6,495 | | 100.0 | % |
| | | | | | | | | | | | | | | | | | | | | | | |
| | Total Number of Properties for Branch | | 13 | | | | | | | | | | 99,067 | | 44,676 | | 45.1 | % |
| | | | | | | | | | | | | | | | | | | | | | | |
3424 | | 3424 - Charlottesville | | OFF | | Owned | | 123 E Main St | | Charlottesville | | VA | | 22902 | | 9/30/2008 | | 51,410 | | 51,410 | | 100.0 | % |
5278 | | 5278 - Inverness-Mn Bldng | | OFF | | Owned | | 1007 US Hwy 41 North | | Inverness | | FL | | 34450 | | 7/14/2008 | | 17,543 | | 11,111 | | 63.3 | % |
5403 | | 5403 - Founders-Mn Bldng | | OFF | | Owned | | 5613 N. May Ave. | | Oklahoma City | | OK | | 73112 | | 8/4/2008 | | 19,903 | | 13,945 | | 70.1 | % |
5370 | | 5370 - Reno Operations Cntr | | OPS | | Owned | | 895 S. 21st St. | | Sparks | | NV | | 89431 | | 9/16/2008 | | 40,343 | | 21,018 | | 52.1 | % |
| | | | | | | | | | | | | | | | | | | | | | | |
| | Total Number of Properties for Office | | 4 | | | | | | | | | | 129,199 | | 97,484 | | 75.5 | % |
| | | | | | | | | | | | | | | | | | | | | | | |
| | Total Number of Properties | | 17 | | | | | | | | | | 228,266 | | 142,160 | | 62.3 | % |
36

| Glossary Q3 2008 Supplemental |
Term | | Definition |
| | |
Annualized Base Rent | | The base rent, excluding Reimbursable Expenses and without Straightlining, required to be paid by a tenant under a lease during the most recently completed calendar quarter multiplied by four. Annualized Base Rent is computed without regard for scheduled rental increases, decreases or lease expirations, but does not include any amounts attributable to periods after a property is sold. For gross leases, Annualized Base Rent includes the entire amount paid by the tenant, including any portion that may be applied by the landlord to the payment of operating expenses. |
| | |
EBITDA | | Earnings before Interest, Taxes, Depreciation and Amortization equals Total Revenues (calculated on a GAAP basis, inclusive of the impact of straightlining of rents) less Operating Expenses. |
| | |
Funds From Operations (FFO) | | The revised White Paper on FFO approved by the Board of Governors of the National Association of Real Estate Investment Trusts, or NAREIT, in April 2002 defines FFO as net income (loss) (computed in accordance with GAAP, inclusive of the impact of straight line rents), excluding gains (or losses) from items which are not a recurring part of our business, such as debt restructurings, and sales of properties, plus real estate-related depreciation and amortization and after adjustments for unconsolidated partnerships and joint ventures. We consider gains and losses on the sales of debt investments to be a normal part of our recurring operations and therefore include such gains and losses when arriving at FFO. |
| | |
GAAP | | Generally accepted accounting principles. |
| | |
Gross Revenue | | Annualized Base Rent, excluding Straightlining plus Reimbursable Expenses. |
| | |
LIBOR | | London Interbank Offered Rate. |
| | |
REIT | | Real estate investment trust. |
| | |
Reimbursable Expenses | | The amount of operating expenses, real estate taxes and other charges incurred by the landlord that are required to be reimbursed by tenants under Base Year Leases and Triple Net Leases that do not require direct payment thereof by the tenants. Reimbursable Expenses do not include operating expenses, real estate taxes or other charges directly incurred and paid by tenants under Bond Net Leases or Triple Net Leases that require direct payments by the tenant. |
| | |
Straightlining | | Recognition of income or expense on a consistent basis throughout the term of the lease, regardless of when payments are actually due. |
37
| Investor Information Q3 2008 Supplemental |
RESEARCH COVERAGE - EQUITY
Douglas Harter | | Credit Suisse | | (212) 538-5983 |
| | | | |
Stephen Laws | | Deutsche Bank Securities, Inc. | | (212) 250-6219 |
| | | | |
Andrew Wessel | | JP Morgan | | (212) 622-8051 |
| | | | |
David Fick | | Stifel Nicolaus & Company, Inc. | | (443) 224-1308 |
| | | | |
Omotayo Okusanya | | UBS Securities, LLC. | | (212) 713-1864 |
| | | | |
Jim Shanahan | | Wachovia Capital Markets, LLC. | | (443) 263-6546 |
INVESTOR INFORMATION
Transfer Agent | | Investor Inquiries | | |
The Bank of New York Mellon Corporation 480 Washington Blvd Jersey City, New Jersey 07310 | | Shareholders, prospective investors and analysts seeking information about the Company should direct their inquiries to: Director of Investor Relations Gramercy Capital Corp. 420 Lexington Avenue, Suite 1926 New York, NY 10170 212-297-1000 www.gramercycapitalcorp.com |
| | | | |
This information is provided as a service to interested parties and not as an endorsement of any report, nor representation as to the accuracy of any information contained therein. Opinions, forecasts and other forward-looking statements expressed in analysts’ reports may change without notice. |
38
| Corporate Directory Q3 2008 Supplemental |
Executive Officers
Roger M. Cozzi
President and Chief Executive Officer
Robert R. Foley
Chief Operating Officer
John B. Roche
Chief Financial Officer
Independent Auditors
Ernst & Young LLP
New York, NY
Legal Counsel
Clifford Chance US LLP
New York, NY
Headquarters
420 Lexington Avenue, Suite 1926
New York, NY 10170
(212) 297-1000
(212) 297-1090 fax
www.gramercycapitalcorp.com
Non-Officer Directors
Stephen L. Green
Chairman of the Board
Director; Investment Committee
Allan J. Baum
Director; Audit Committee;
Compensation Committee;
Private Investor
Marc Holliday
Director, Investment Committee
Jeffrey E. Kelter
Director; Compensation Committee;
Nominating and Corporate Governance Committee;
Investment Committee;
Chief Executive Officer, KTR Capital Partners, LLC
Paul J. Konigsberg
Director; Audit Committee;
Nominating and Corporate Governance Committee;
Senior Partner and President, Konigsberg Wolf and Co., P.C.
Charles S. Laven
Director; Audit Committee;
Compensation Committee;
Nominating and Corporate Governance Committee;
President, Forsyth Street Advisors, LLC
39