 Supplemental Data
September 30, 2009
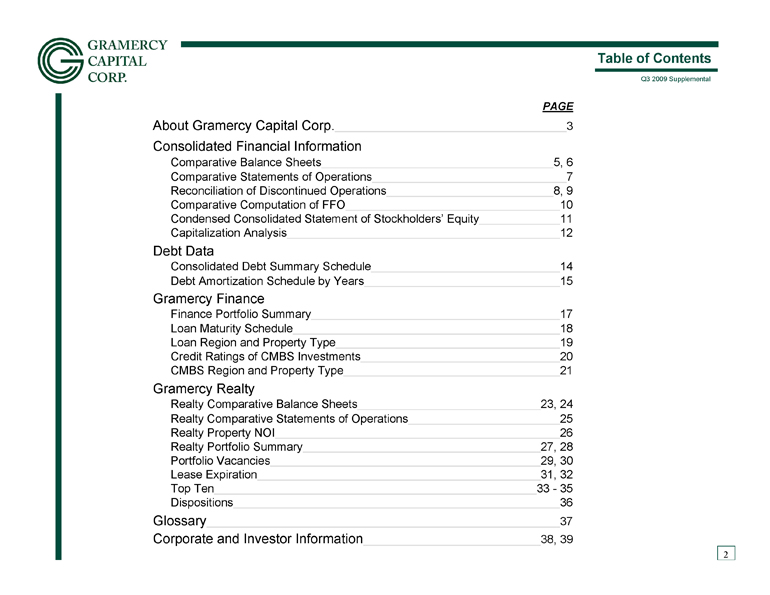 2 Table of Contents PAGE About Gramercy Capital Corp. 3 Consolidated Financial Information Comparative Balance Sheets 5, 6 Comparative Statements of Operations 7 Reconciliation of Discontinued Operations 8, 9 Comparative Computation of FFO 10 Condensed Consolidated Statement of Stockholders’ Equity 11 Capitalization Analysis 12 Debt Data Consolidated Debt Summary Schedule 14 Debt Amortization Schedule by Years 15 Gramercy Finance Finance Portfolio Summary 17 Loan Maturity Schedule 18 Loan Region and Property Type 19 Credit Ratings of CMBS Investments 20 CMBS Region and Property Type 21 Gramercy Realty Realty Comparative Balance Sheets 23, 24 Realty Comparative Statements of Operations 25 Realty Property NOI 26 Realty Portfolio Summary 27, 28 Portfolio Vacancies 29, 30 Lease Expiration 31, 32 Top Ten 33 - 35 Dispositions 36 Glossary 37 Corporate and Investor Information 38, 39
 About Gramercy Capital Corp. 3 About Gramercy Capital Corp. Gramercy Capital Corp. is a self - managed integrated commercial real estate specialty finance and property investment company operating in two complementary areas: Gramercy Finance, which focuses on the direct origination and ac quisition of whole loans, subordinate interests in whole loans, mezzanine loans, preferred equity, commercial mortgage - backed securities and other real estate securities; and Gramercy Realty, which focuses on the acquisition and management of c ommercial pr operties leased primarily to financial institutions and affiliated users throughout the Unit ed States. Neither Gramercy Finance nor Gramercy Realty is a separate legal entity but are divisions of the Company through which the Compan y’s commercial real est ate finance and property investment businesses are conducted. Gramercy is headquartered in New York City, and has regional investment and portfolio management offi ces in Jenkintown, Pennsylvania, and Charlotte, North Carolina. For more information on Grame rcy Capital Corp., visit the Gramercy Capital Corp. website at http://www.gkk.com . Forward - Looking Information This supplemental data contains forward - looking information based upon the Company’s curren t best judgment and expectations. Actual results could vary from those presented herein. The risks and uncertainties associated with forward - looking information in this supplemental data include the success or failure of the Company’s efforts to implement its current business strategy; the strength of the commercial finance and real estate property markets , and th e banking industry specifically; competitive market conditions; una nticipated administrative costs; general and local economic conditions; interes t rates; capit al and credit market conditions; bankruptcies and defaults of borrowers or tenants in the Company’s properties or properties securing the Company's debt investments; difficul ties encountered in integrating the Company’s former external manager into the Company ; the resolution of the Company’s non - perfo rming and sub - performing assets; comp liance with financial covenants; maintenance of liquidity needs; management chan ges; compl iance with over - collateralization and interest cover age tests in the Company’s CDOs; and other factors including those listed in the Company’s Annual Report on Form 10 - K and the Company’s Quarterly Reports on Form 10 - Q , which are beyond the Company’s contr ol . The Company undertakes no obligation to publicly update or revise any of the forward - looking information. For further information, please refer to the Company’s filings with the Securities and Exchange Commission.
 Consolidated
Financial Information
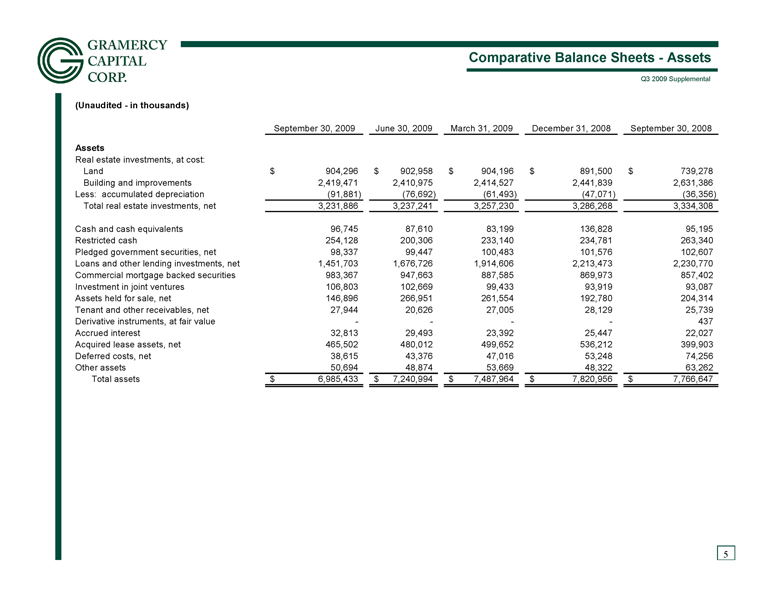 Comparative Balance Sheets - Assets 5 (Unaudited - in thousands) September 30, 2009 June 30, 2009 March 31, 2009 December 31, 2008 September 30, 2008 Assets Real estate investments, at cost: Land 904,296 $ 902,958 $ 904,196 $ 891,500 $ 739,278 $ Building and improvements 2,419,471 2,410,975 2,414,527 2,441,839 2,631,386 Less: accumulated depreciation (91,881) (76,692) (61,493) (47,071) (36,356) Total real estate investments, net 3,231,886 3,237,241 3,257,230 3,286,268 3,334,308 Cash and cash equivalents 96,745 87,610 83,199 136,828 95,195 Restricted cash 254,128 200,306 233,140 234,781 263,340 Pledged government securities, net 98,337 99,447 100,483 101,576 102,607 Loans and other lending investments, net 1,451,703 1,676,726 1,914,606 2,213,473 2,230,770 Commercial mortgage backed securities 983,367 947,663 887,585 869,973 857,402 Investment in joint ventures 106,803 102,669 99,433 93,919 93,087 Assets held for sale, net 146,896 266,951 261,554 192,780 204,314 Tenant and other receivables, net 27,944 20,626 27,005 28,129 25,739 Derivative instruments, at fair value - - - - 437 Accrued interest 32,813 29,493 23,392 25,447 22,027 Acquired lease assets, net 465,502 480,012 499,652 536,212 399,903 Deferred costs, net 38,615 43,376 47,016 53,248 74,256 Other assets 50,694 48,874 53,669 48,322 63,262 Total assets 6,985,433 $ 7,240,994 $ 7,487,964 $ 7,820,956 $ 7,766,647 $
 Comparative Balance Sheets – Liabilities & Equity 6 (Unaudited - in thousands) September 30, 2009 June 30, 2009 March 31, 2009 December 31, 2008 September 30, 2008 Liabilities Mortgage notes payable 1,754,946 $ 1,763,690 $ 1,771,512 $ 1,833,005 $ 1,947,710 $ Mezzanine notes payable 566,442 569,122 573,464 580,462 598,063 Credit facilities - - - 172,301 172,301 Term loan, credit facility and repurchase facility 48,881 64,976 79,601 95,897 107,994 Collateralized debt obligations 2,608,230 2,608,175 2,607,759 2,608,065 2,662,955 Junior subordinated notes 150,000 150,000 150,000 - - Total secured and other debt 5,128,499 5,155,963 5,182,336 5,289,730 5,489,023 Accounts payable and accrued expenses 83,862 79,441 74,378 88,437 110,679 Management and incentive fees payable - - 1,972 979 5,089 Dividends payable 9,317 6,981 4,661 2,325 2,341 Accrued interest payable 8,896 8,217 8,004 8,167 10,806 Deferred revenue 92,352 86,066 99,683 98,693 59,480 Below market lease liabilities, net 795,833 816,012 845,769 846,351 708,186 Leasehold interests, net 18,939 19,556 20,361 21,051 21,759 Liabilities related to assets held for sale 61,001 67,684 60,372 110,543 9,626 Derivative instruments, at fair value 139,421 96,563 206,529 157,776 83,718 Other liabilities 23,993 29,787 27,394 14,471 12,376 Deferrable interest debentures held by trusts that issued trust preferred securities - - - 150,000 150,000 Total liabilities 6,362,113 6,366,270 6,531,459 6,788,523 6,663,083 Stockholders' equity: Common stock 50 50 50 50 51 Series A cumulative redeemable preferred stock 111,205 111,205 111,205 111,205 111,205 Additional paid-in-capital 1,078,828 1,078,526 1,078,109 1,077,983 1,081,055 Accumulated other comprehensive income (142,260) (99,567) (209,522) (160,739) (82,991) (Accumulated deficit) retained earnings (427,327) (224,211) (26,069) 1,222 (8,219) Total Gramercy Capital Corp. stockholders' equity 620,496 866,003 953,773 1,029,721 1,101,101 Non-controlling interest 2,824 8,721 2,732 2,712 2,463 Total stockholders' equity 623,320 874,724 956,505 1,032,433 1,103,564 Total liabilities and stockholders' equity 6,985,433 $ 7,240,994 $ 7,487,964 $ 7,820,956 $ 7,766,647 $
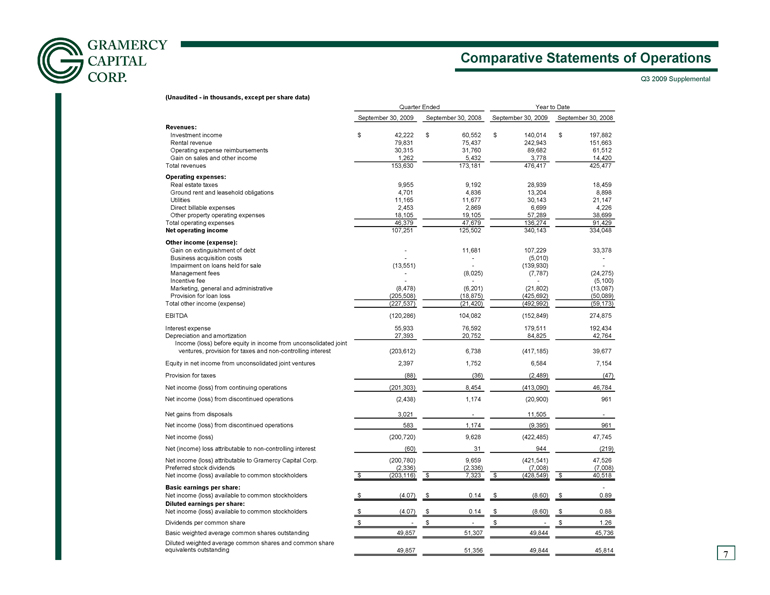 7 Comparative Statements of Operations (Unaudited - in thousands, except per share data) Quarter Ended Year to Date September 30, 2009 September 30, 2008 September 30, 2009 September 30, 2008 Revenues: Investment income 42,222 $ 60,552 $ 140,014 $ 197,882 $ Rental revenue 79,831 75,437 242,943 151,663 Operating expense reimbursements 30,315 31,760 89,682 61,512 Gain on sales and other income 1,262 5,432 3,778 14,420 Total revenues 153,630 173,181 476,417 425,477 Operating expenses: Real estate taxes 9,955 9,192 28,939 18,459 Ground rent and leasehold obligations 4,701 4,836 13,204 8,898 Utilities 11,165 11,677 30,143 21,147 Direct billable expenses 2,453 2,869 6,699 4,226 Other property operating expenses 18,105 19,105 57,289 38,699 Total operating expenses 46,379 47,679 136,274 91,429 Net operating income 107,251 125,502 340,143 334,048 Other income (expense): Gain on extinguishment of debt - 11,681 107,229 33,378 Business acquisition costs - - (5,010) - Impairment on loans held for sale (13,551) - (139,930) - Management fees - (8,025) (7,787) (24,275) Incentive fee - - - (5,100) Marketing, general and administrative (8,478) (6,201) (21,802) (13,087) Provision for loan loss (205,508) (18,875) (425,692) (50,089) Total other income (expense) (227,537) (21,420) (492,992) (59,173) EBITDA (120,286) 104,082 (152,849) 274,875 Interest expense 55,933 76,592 179,511 192,434 Depreciation and amortization 27,393 20,752 84,825 42,764 Income (loss) before equity in income from unconsolidated joint ventures, provision for taxes and non-controlling interest (203,612) 6,738 (417,185) 39,677 Equity in net income from unconsolidated joint ventures 2,397 1,752 6,584 7,154 Provision for taxes (88) (36) (2,489) (47) Net income (loss) from continuing operations (201,303) 8,454 (413,090) 46,784 Net income (loss) from discontinued operations (2,438) 1,174 (20,900) 961 Net gains from disposals 3,021 - 11,505 - Net income (loss) from discontinued operations 583 1,174 (9,395) 961 Net income (loss) (200,720) 9,628 (422,485) 47,745 Net (income) loss attributable to non-controlling interest (60) 31 944 (219) Net income (loss) attributable to Gramercy Capital Corp. (200,780) 9,659 (421,541) 47,526 Preferred stock dividends (2,336) (2,336) (7,008) (7,008) Net income (loss) available to common stockholders (203,116) $ 7,323 $ (428,549) $ 40,518 $ Basic earnings per share: - Net income (loss) available to common stockholders (4.07) $ 0.14 $ (8.60) $ 0.89 $ Diluted earnings per share: Net income (loss) available to common stockholders (4.07) $ 0.14 $ (8.60) $ 0.88 $ Dividends per common share - $ - $ - $ 1.26 $ Basic weighted average common shares outstanding 49,857 51,307 49,844 45,736 Diluted weighted average common shares and common share equivalents outstanding 49,857 51,356 49,844 45,814
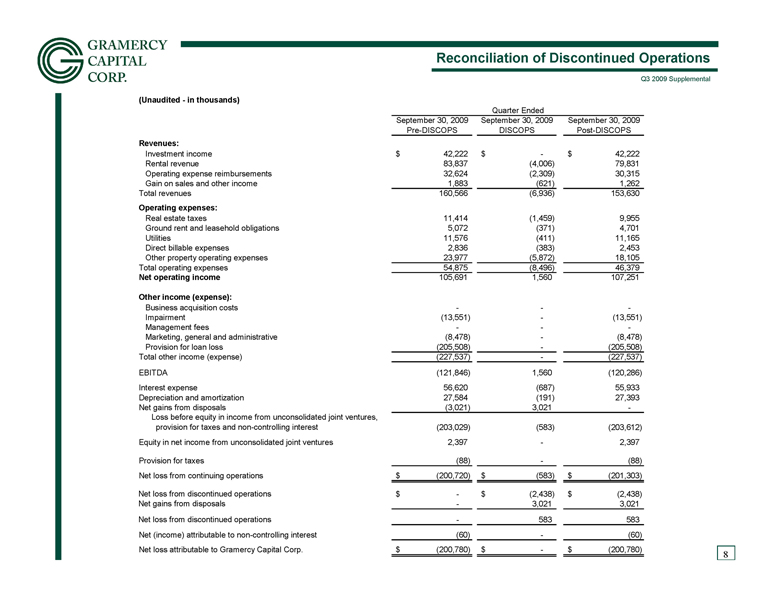 Reconciliation of Discontinued Operations 8 (Unaudited - in thousands) Quarter Ended September 30, 2009 September 30, 2009 September 30, 2009 Pre-DISCOPS DISCOPS Post-DISCOPS Revenues: Investment income 42,222 $ - $ 42,222 $ Rental revenue 83,837 (4,006) 79,831 Operating expense reimbursements 32,624 (2,309) 30,315 Gain on sales and other income 1,883 (621) 1,262 Total revenues 160,566 (6,936) 153,630 Operating expenses: Real estate taxes 11,414 (1,459) 9,955 Ground rent and leasehold obligations 5,072 (371) 4,701 Utilities 11,576 (411) 11,165 Direct billable expenses 2,836 (383) 2,453 Other property operating expenses 23,977 (5,872) 18,105 Total operating expenses 54,875 (8,496) 46,379 Net operating income 105,691 1,560 107,251 Other income (expense): Business acquisition costs - - - Impairment (13,551) - (13,551) Management fees - - - Marketing, general and administrative (8,478) - (8,478) Provision for loan loss (205,508) - (205,508) Total other income (expense) (227,537) - (227,537) EBITDA (121,846) 1,560 (120,286) Interest expense 56,620 (687) 55,933 Depreciation and amortization 27,584 (191) 27,393 Net gains from disposals (3,021) 3,021 - Loss before equity in income from unconsolidated joint ventures, provision for taxes and non-controlling interest (203,029) (583) (203,612) Equity in net income from unconsolidated joint ventures 2,397 - 2,397 Provision for taxes (88) - (88) Net loss from continuing operations (200,720) $ (583) $ (201,303) $ Net loss from discontinued operations - $ (2,438) $ (2,438) $ Net gains from disposals - 3,021 3,021 Net loss from discontinued operations - 583 583 Net (income) attributable to non-controlling interest (60) - (60) Net loss attributable to Gramercy Capital Corp. (200,780) $ - $ (200,780) $
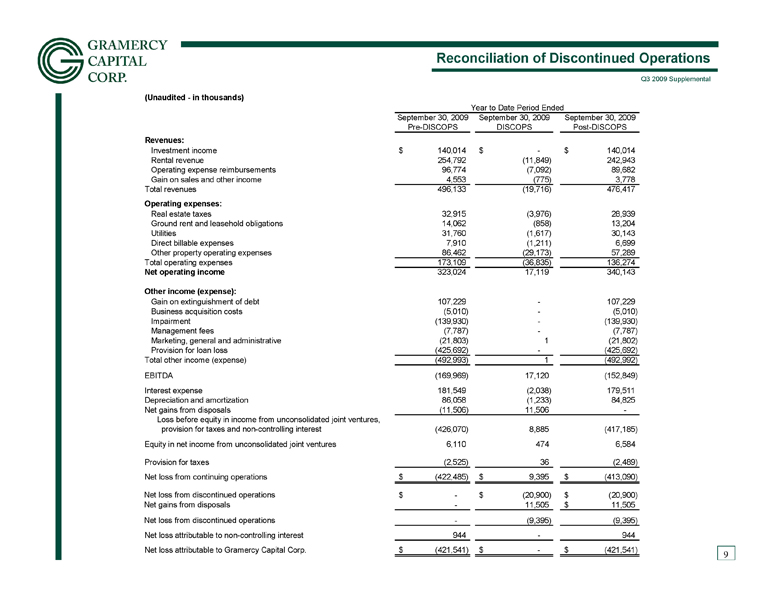 Reconciliation of Discontinued Operations 9 (Unaudited - in thousands) Year to Date Period Ended September 30, 2009 September 30, 2009 September 30, 2009 Pre-DISCOPS DISCOPS Post-DISCOPS Revenues: Investment income 140,014 $ - $ 140,014 $ Rental revenue 254,792 (11,849) 242,943 Operating expense reimbursements 96,774 (7,092) 89,682 Gain on sales and other income 4,553 (775) 3,778 Total revenues 496,133 (19,716) 476,417 Operating expenses: Real estate taxes 32,915 (3,976) 28,939 Ground rent and leasehold obligations 14,062 (858) 13,204 Utilities 31,760 (1,617) 30,143 Direct billable expenses 7,910 (1,211) 6,699 Other property operating expenses 86,462 (29,173) 57,289 Total operating expenses 173,109 (36,835) 136,274 Net operating income 323,024 17,119 340,143 Other income (expense): Gain on extinguishment of debt 107,229 - 107,229 Business acquisition costs (5,010) - (5,010) Impairment (139,930) - (139,930) Management fees (7,787) - (7,787) Marketing, general and administrative (21,803) 1 (21,802) Provision for loan loss (425,692) - (425,692) Total other income (expense) (492,993) 1 (492,992) EBITDA (169,969) 17,120 (152,849) Interest expense 181,549 (2,038) 179,511 Depreciation and amortization 86,058 (1,233) 84,825 Net gains from disposals (11,506) 11,506 - Loss before equity in income from unconsolidated joint ventures, provision for taxes and non-controlling interest (426,070) 8,885 (417,185) Equity in net income from unconsolidated joint ventures 6,110 474 6,584 Provision for taxes (2,525) 36 (2,489) Net loss from continuing operations (422,485) $ 9,395 $ (413,090) $ Net loss from discontinued operations - $ (20,900) $ (20,900) $ Net gains from disposals - 11,505 11,505 $ Net loss from discontinued operations - (9,395) (9,395) Net loss attributable to non-controlling interest 944 - 944 Net loss attributable to Gramercy Capital Corp. (421,541) $ - $ (421,541) $
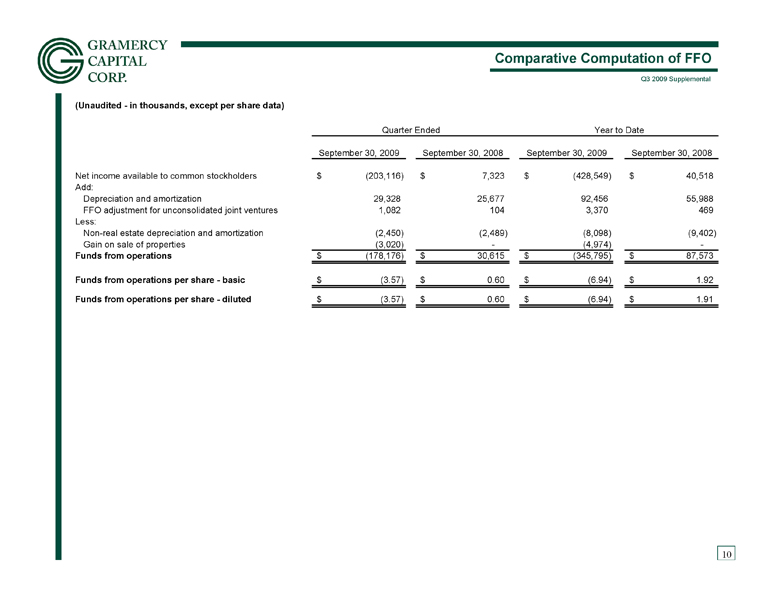 Comparative Computation of FFO 10 (Unaudited - in thousands, except per share data) September 30, 2009 September 30, 2008 September 30, 2009 September 30, 2008 Net income available to common stockholders (203,116) $ 7,323 $ (428,549) $ 40,518 $ Add: Depreciation and amortization 29,328 25,677 92,456 55,988 FFO adjustment for unconsolidated joint ventures 1,082 104 3,370 469 Less: Non-real estate depreciation and amortization (2,450) (2,489) (8,098) (9,402) Gain on sale of properties (3,020) - (4,974) - Funds from operations (178,176) $ 30,615 $ (345,795) $ 87,573 $ Funds from operations per share - basic (3.57) $ 0.60 $ (6.94) $ 1.92 $ Funds from operations per share - diluted (3.57) $ 0.60 $ (6.94) $ 1.91 $ Quarter Ended Year to Date
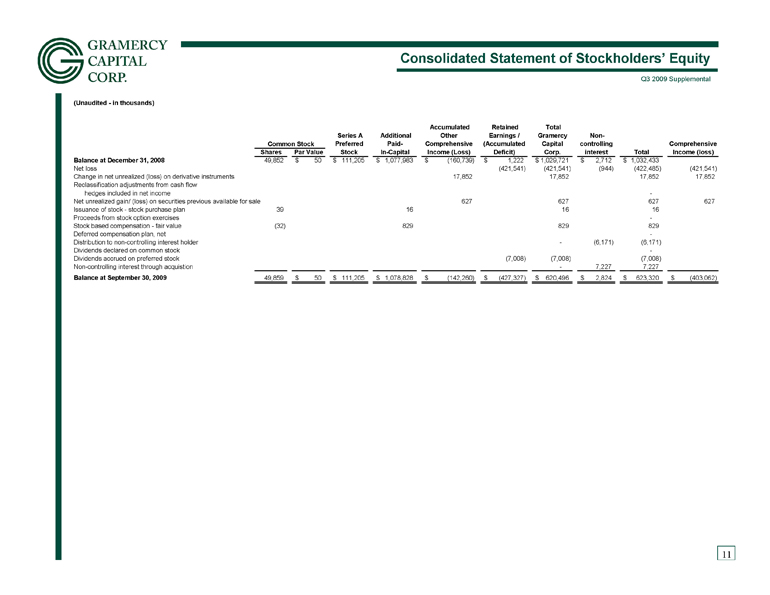 Consolidated Statement of Stockholders’ Equity 11 (Unaudited - in thousands) Series A Preferred Additional Paid- Accumulated Other Comprehensive Retained Earnings / (Accumulated Total Gramercy Capital Non- controlling Comprehensive Shares Par Value Stock In-Capital Income (Loss) Deficit) Corp. interest Total Income (loss) Balance at December 31, 2008 49,852 50 $ 111,205 $ 1,077,983 $ (160,739) $ 1,222 $ 1,029,721 $ 2,712 $ 1,032,433 $ Net loss (421,541) (421,541) (944) (422,485) (421,541) Change in net unrealized (loss) on derivative instruments 17,852 17,852 17,852 17,852 Reclassification adjustments from cash flow hedges included in net income - Net unrealized gain/ (loss) on securities previous available for sale 627 627 627 627 Issuance of stock - stock purchase plan 39 16 16 16 Proceeds from stock option exercises - Stock based compensation - fair value (32) 829 829 829 Deferred compensation plan, net - Distribution to non-controlling interest holder - (6,171) (6,171) Dividends declared on common stock - Dividends accrued on preferred stock (7,008) (7,008) (7,008) Non-controlling interest through acquistion - 7,227 7,227 Balance at September 30, 2009 49,859 50 $ 111,205 $ 1,078,828 $ (142,260) $ (427,327) $ 620,496 $ 2,824 $ 623,320 $ (403,062) $ Common Stock
 Capitalization Analysis 12 (Unaudited - in thousands, except per share data) Market Capitalization September 30, 2009 June 30, 2009 March 31, 2009 December 31, 2008 September 30, 2008 Common stock: Common shares outstanding 49,859,322 49,848,333 49,863,831 49,852,243 51,316,586 Share price (end of period) 2.43 $ 1.61 $ 0.97 $ 1.28 $ 2.59 $ Preferred stock: Outstanding shares 4,600,000 4,600,000 4,600,000 4,600,000 4,600,000 Liquidation preference per share 25 $ 25 $ 25 $ 25 $ 25 $ Equity market capitalization 236,158 $ 195,256 $ 163,368 $ 178,811 $ 247,910 $ Secured and Other Debt Mortgage notes payable 1,754,946 $ 1,763,690 $ 1,771,512 $ 1,833,005 $ 1,947,710 $ Mezzanine loan payable 566,442 569,122 573,464 580,462 598,063 Term loan, credit facility and repurchase facility 48,881 64,976 79,601 95,897 107,994 CDOs 2,608,230 2,608,175 2,607,759 2,608,065 2,662,955 Total secured debt 4,978,499 5,005,963 5,032,336 5,117,429 5,316,722 Credit facilities - - - 172,301 172,301 Junior subordinated notes/Trust preferred securities 150,000 150,000 150,000 150,000 150,000 Total unsecured debt 150,000 150,000 150,000 322,301 322,301 Total debt 5,128,499 $ 5,155,963 $ 5,182,336 $ 5,439,730 $ 5,639,023 $ Total enterprise value (debt and equity market capitalization) 5,364,657 $ 5,351,219 $ 5,345,704 $ 5,618,541 $ 5,886,933 $ Available under Lines of Credit and Facilities Secured line commitment - $ - $ - $ 406,692 $ 412,100 $ Maximum available based on collateral pool - - - 130,335 147,078 Balance outstanding - - - 95,897 107,994 Availability - - - 34,438 39,084 Mark-to-market adjustment - - - - 3,123 Restricted liquidity - - - 34,438 35,961 Net available liquidity - - - - - Unfunded commitments - - - - 16,869 Available pledge capacity - - - 276,357 248,153 Unsecured line commitment - - - 175,000 175,000 Balance outstanding - - - 172,301 172,301 Availability - - - 2,699 2,699 Total availability - $ - $ - $ 279,056 $ 250,852 $ Common Stock Price High 2.97 $ 3.20 $ 1.68 $ 2.66 $ 11.89 $ Low 1.23 $ 0.98 $ 0.43 $ 0.70 $ 2.48 $
 Debt Data
 Debt Summary Schedule 14 (Dollars in millions) Coupon Number of 9/30/2009 Interest Maturity Mortgage/Borrowing Properties Balance (1) Rate (2) Date Secured Fixed-Rate Debt: Bank of America - BBD1 116 $352.7 5.47% Dec-2013 Bank of America - BBD2 138 215.2 5.96% Sep-2019 Dana - Bank of America 15 180.0 5.61% Jan-2018 101 Independence 1 74.2 5.53% Oct-2016 292 Madison (100%) 1 59.1 6.17% Aug-2017 BOA Plaza - St Louis 1 51.8 4.55% Jan-2010 Pitney Bowes - Bank of America 70 48.8 5.33% Oct-2022 One Citizens Plaza 1 43.5 5.70% Jan-2012 801 Market Street 1 40.2 6.17% Feb-2013 Beaver Valley 1 39.6 5.06% Jan-2015 FSI 6000D 16 31.3 5.80% Jun-2017 FSI 6000B 16 30.0 5.80% Jun-2017 FSI 6000A 15 26.4 6.80% Oct-2017 FSI 6000C 15 22.7 6.80% Oct-2017 Pitney Bowes - Wachovia A 23 21.7 5.50% Jun-2023 Sterling Bank 14 19.9 5.57% Jan-2017 Jenkins Court 1 14.2 8.29% Aug-2010 Debt With Principal Balance < $3 Million 30 39.0 5.90% n/a Total Secured Fixed-Rate Debt 475 $1,310.3 5.69% n/a Unsecured Fixed-Rate Debt : Junior Subordinate Notes (3) n/a $150.0 0.50% Jun-2035 Total Unsecured Fixed-Rate Debt $150.0 0.50% n/a Total Fixed-Rate Debt 475 $1,460.3 5.16% n/a Secured Floating-Rate Debt: CDO 2007-1 n/a $981.3 3m L+0.460% Aug-2056 (4) CDO 2006-1 n/a 842.0 3m L+0.370% Jul-2041 (4) CDO 2005-1 n/a 784.7 3m L+0.490% Jul-2035 (4) Goldman/Citigroup/KBS/SL Green Mezzanine n/a 472.6 1m L+5.200% Mar-2010 (5) Goldman/Citigroup/SL Green Mortgage 196 241.3 1m L+1.988% Mar-2010 (5) PB Capital Mortgage 44 238.1 1m L+1.650% Apr-2013 Goldman/Citigroup/KBS/SL Green Mezzanine n/a 93.9 1m L+6.000% Mar-2010 (5) Wachovia Credit Facility n/a 44.5 1m L+1.29% Mar-2011 Goldman Repurchase Facility n/a 4.3 1m L+1.29% Nov-2009 (6) Total Secured Floating-Rate Debt 240 $3,702.7 n/a Unsecured Floating-Rate Debt: Total Unsecured Floating-Rate Debt Total Floating-Rate Debt 240 $3,702.7 n/a Total Debt 715 $5,163.0 n/a % Secured Debt Balance to Total Debt 97.1% % Fixed-Rate Debt Balance to Total Debt (including the effect of Interest Rate SWAPS) 51.0% (1) Current Principal Balance shown does not include GAAP FMV adjustments or discount/premium amounts (2) Coupon Interest Rate is the stated coupon and is not adjusted for our hedging activity (3) Fixed interest rate of 0.5% per annum ending 1/29/12, and a fixed interest rate of 7.5% per annum thereafter through maturity (4) Maturity dates listed are stated final maturities. (5) Maturity date is 3/11/2010 with option to extend to 3/11/2011 (6) Facility paid off on 10/27/2009
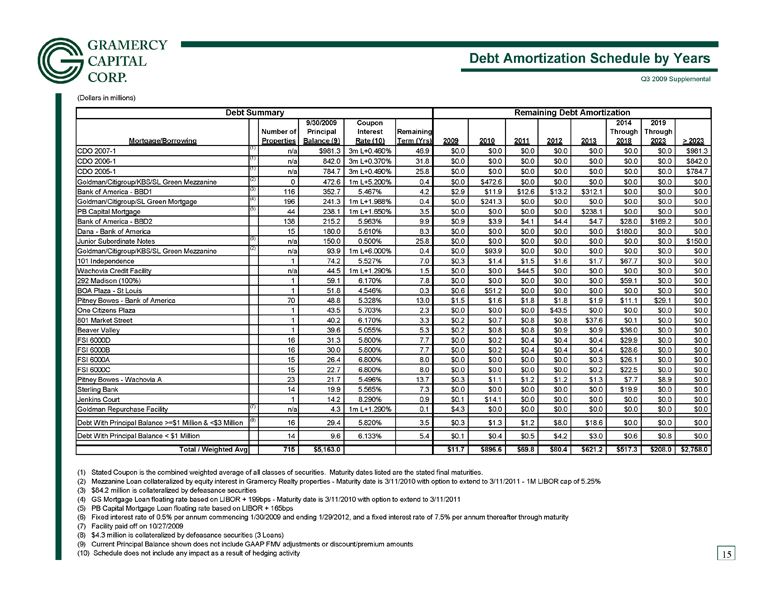 Debt Amortization Schedule by Years 15 (Dollars in millions) 9/30/2009 Coupon 2014 2019 Number of Principal Interest Remaining Through Through Mortgage/Borrowing Properties Balance (9) Rate (10) Term (Yrs) 2009 2010 2011 2012 2013 2018 2023 > 2023 CDO 2007-1 (1) n/a $981.3 3m L+0.460% 46.9 $0.0 $0.0 $0.0 $0.0 $0.0 $0.0 $0.0 $981.3 CDO 2006-1 (1) n/a 842.0 3m L+0.370% 31.8 $0.0 $0.0 $0.0 $0.0 $0.0 $0.0 $0.0 $842.0 CDO 2005-1 (1) n/a 784.7 3m L+0.490% 25.8 $0.0 $0.0 $0.0 $0.0 $0.0 $0.0 $0.0 $784.7 Goldman/Citigroup/KBS/SL Green Mezzanine (2) 0 472.6 1m L+5.200% 0.4 $0.0 $472.6 $0.0 $0.0 $0.0 $0.0 $0.0 $0.0 Bank of America - BBD1 (3) 116 352.7 5.467% 4.2 $2.9 $11.9 $12.6 $13.2 $312.1 $0.0 $0.0 $0.0 Goldman/Citigroup/SL Green Mortgage (4) 196 241.3 1m L+1.988% 0.4 $0.0 $241.3 $0.0 $0.0 $0.0 $0.0 $0.0 $0.0 PB Capital Mortgage (5) 44 238.1 1m L+1.650% 3.5 $0.0 $0.0 $0.0 $0.0 $238.1 $0.0 $0.0 $0.0 Bank of America - BBD2 138 215.2 5.963% 9.9 $0.9 $3.9 $4.1 $4.4 $4.7 $28.0 $169.2 $0.0 Dana - Bank of America 15 180.0 5.610% 8.3 $0.0 $0.0 $0.0 $0.0 $0.0 $180.0 $0.0 $0.0 Junior Subordinate Notes (6) n/a 150.0 0.500% 25.8 $0.0 $0.0 $0.0 $0.0 $0.0 $0.0 $0.0 $150.0 Goldman/Citigroup/KBS/SL Green Mezzanine (2) n/a 93.9 1m L+6.000% 0.4 $0.0 $93.9 $0.0 $0.0 $0.0 $0.0 $0.0 $0.0 101 Independence 1 74.2 5.527% 7.0 $0.3 $1.4 $1.5 $1.6 $1.7 $67.7 $0.0 $0.0 Wachovia Credit Facility n/a 44.5 1m L+1.290% 1.5 $0.0 $0.0 $44.5 $0.0 $0.0 $0.0 $0.0 $0.0 292 Madison (100%) 1 59.1 6.170% 7.8 $0.0 $0.0 $0.0 $0.0 $0.0 $59.1 $0.0 $0.0 BOA Plaza - St Louis 1 51.8 4.546% 0.3 $0.6 $51.2 $0.0 $0.0 $0.0 $0.0 $0.0 $0.0 Pitney Bowes - Bank of America 70 48.8 5.328% 13.0 $1.5 $1.6 $1.8 $1.8 $1.9 $11.1 $29.1 $0.0 One Citizens Plaza 1 43.5 5.703% 2.3 $0.0 $0.0 $0.0 $43.5 $0.0 $0.0 $0.0 $0.0 801 Market Street 1 40.2 6.170% 3.3 $0.2 $0.7 $0.8 $0.8 $37.6 $0.1 $0.0 $0.0 Beaver Valley 1 39.6 5.055% 5.3 $0.2 $0.8 $0.8 $0.9 $0.9 $36.0 $0.0 $0.0 FSI 6000D 16 31.3 5.800% 7.7 $0.0 $0.2 $0.4 $0.4 $0.4 $29.9 $0.0 $0.0 FSI 6000B 16 30.0 5.800% 7.7 $0.0 $0.2 $0.4 $0.4 $0.4 $28.6 $0.0 $0.0 FSI 6000A 15 26.4 6.800% 8.0 $0.0 $0.0 $0.0 $0.0 $0.3 $26.1 $0.0 $0.0 FSI 6000C 15 22.7 6.800% 8.0 $0.0 $0.0 $0.0 $0.0 $0.2 $22.5 $0.0 $0.0 Pitney Bowes - Wachovia A 23 21.7 5.496% 13.7 $0.3 $1.1 $1.2 $1.2 $1.3 $7.7 $8.9 $0.0 Sterling Bank 14 19.9 5.565% 7.3 $0.0 $0.0 $0.0 $0.0 $0.0 $19.9 $0.0 $0.0 Jenkins Court 1 14.2 8.290% 0.9 $0.1 $14.1 $0.0 $0.0 $0.0 $0.0 $0.0 $0.0 Goldman Repurchase Facility (7) n/a 4.3 1m L+1.290% 0.1 $4.3 $0.0 $0.0 $0.0 $0.0 $0.0 $0.0 $0.0 Debt With Principal Balance >=$1 Million & <$3 Million (8) 16 29.4 5.820% 3.5 $0.3 $1.3 $1.2 $8.0 $18.6 $0.0 $0.0 $0.0 Debt With Principal Balance < $1 Million 14 9.6 6.133% 5.4 $0.1 $0.4 $0.5 $4.2 $3.0 $0.6 $0.8 $0.0 Total / Weighted Avg 715 $5,163.0 $11.7 $896.6 $69.8 $80.4 $621.2 $517.3 $208.0 $2,758.0 (1) Stated Coupon is the combined weighted average of all classes of securities. Maturity dates listed are the stated final maturities. (2) Mezzanine Loan collateralized by equity interest in Gramercy Realty properties - Maturity date is 3/11/2010 with option to extend to 3/11/2011 - 1M LIBOR cap of 5.25% (3) $84.2 million is collateralized by defeasance securities (4) GS Mortgage Loan floating rate based on LIBOR + 199bps - Maturity date is 3/11/2010 with option to extend to 3/11/2011 (5) PB Capital Mortgage Loan floating rate based on LIBOR + 165bps (6) Fixed interest rate of 0.5% per annum commencing 1/30/2009 and ending 1/29/2012, and a fixed interest rate of 7.5% per annum thereafter through maturity (7) Facility paid off on 10/27/2009 (8) $4.3 million is collateralized by defeasance securities (3 Loans) (9) Current Principal Balance shown does not include GAAP FMV adjustments or discount/premium amounts (10) Schedule does not include any impact as a result of hedging activity Debt Summary Remaining Debt Amortization
 Gramercy Finance
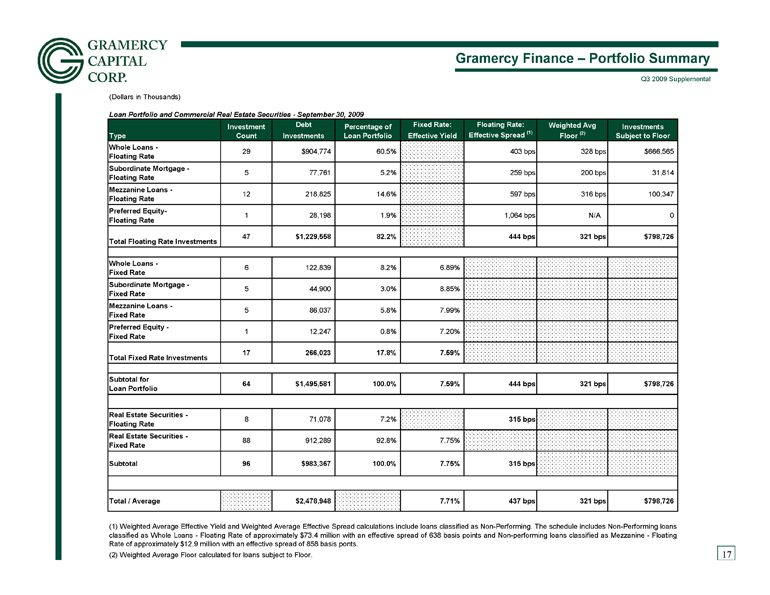 Gramercy Finance – Portfolio Summary 17 (Dollars in Thousands) Loan Portfolio and Commercial Real Estate Securities - September 30, 2009 Debt Fixed Rate: Floating Rate: Type Investments Effective Yield Effective Spread (1) Whole Loans - Floating Rate 29 $904,774 60.5% 403 bps 328 bps $666,565 Subordinate Mortgage - Floating Rate 5 77,761 5.2% 259 bps 200 bps 31,814 Mezzanine Loans - Floating Rate 12 218,825 14.6% 597 bps 316 bps 100,347 Preferred Equity- Floating Rate 1 28,198 1.9% 1,064 bps N/A 0 Total Floating Rate Investments 47 $1,229,558 82.2% 444 bps 321 bps $798,726 Whole Loans - Fixed Rate 6 122,839 8.2% 6.89% Subordinate Mortgage - Fixed Rate 5 44,900 3.0% 8.85% Mezzanine Loans - Fixed Rate 5 86,037 5.8% 7.99% Preferred Equity - Fixed Rate 1 12,247 0.8% 7.20% Total Fixed Rate Investments 17 266,023 17.8% 7.59% Subtotal for Loan Portfolio 64 $1,495,581 100.0% 7.59% 444 bps 321 bps $798,726 Real Estate Securities - Floating Rate 8 71,078 7.2% 315 bps Real Estate Securities - Fixed Rate 88 912,289 92.8% 7.75% Subtotal 96 $983,367 100.0% 7.75% 315 bps Total / Average $2,478,948 7.71% 437 bps 321 bps $798,726 (1) Weighted Average Effective Yield and Weighted Average Effective Spread calculations include loans classified as Non-Performing. The schedule includes Non-Performing loans classified as Whole Loans - Floating Rate of approximately $73.4 million with an effective spread of 638 basis points and Non-performing loans classified as Mezzanine - Floating Rate of approximately $12.9 million with an effective spread of 858 basis ponts. Investment Count Investments Subject to Floor Percentage of Loan Portfolio Weighted Avg Floor (2) (2) Weighted Average Floor calculated for loans subject to Floor.
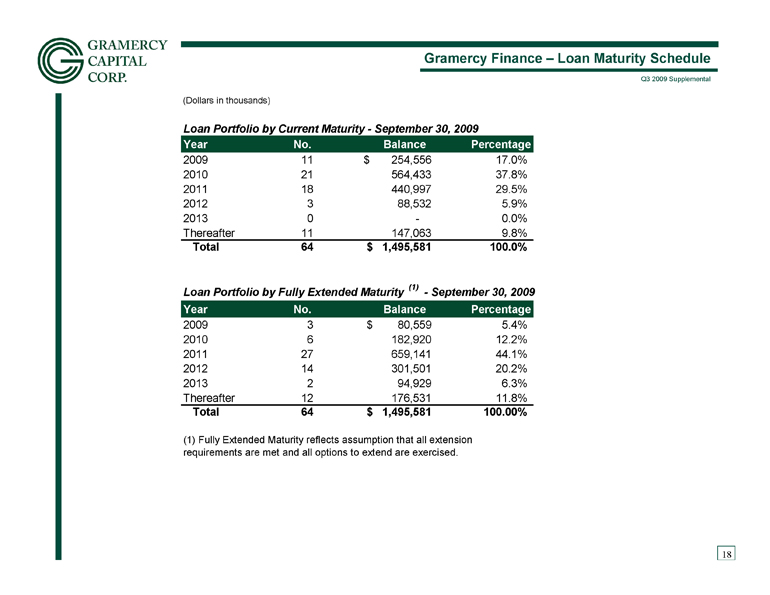 Gramercy Finance – Loan Maturity Schedule 18 (Dollars in thousands) Loan Portfolio by Current Maturity - September 30, 2009 Year No. Balance Percentage 2009 11 $ 254,556 17.0% 2010 21 564,433 37.8% 2011 18 440,997 29.5% 2012 3 88,532 5.9% 2013 0 - 0.0% Thereafter 11 147,063 9.8% Total 64 $ 1,495,581 100.0% Loan Portfolio by Fully Extended Maturity (1) - September 30, 2009 Year No. Balance Percentage 2009 3 $ 80,559 5.4% 2010 6 182,920 12.2% 2011 27 659,141 44.1% 2012 14 301,501 20.2% 2013 2 94,929 6.3% Thereafter 12 176,531 11.8% Total 64 $ 1,495,581 100.00% (1) Fully Extended Maturity reflects assumption that all extension requirements are met and all options to extend are exercised.
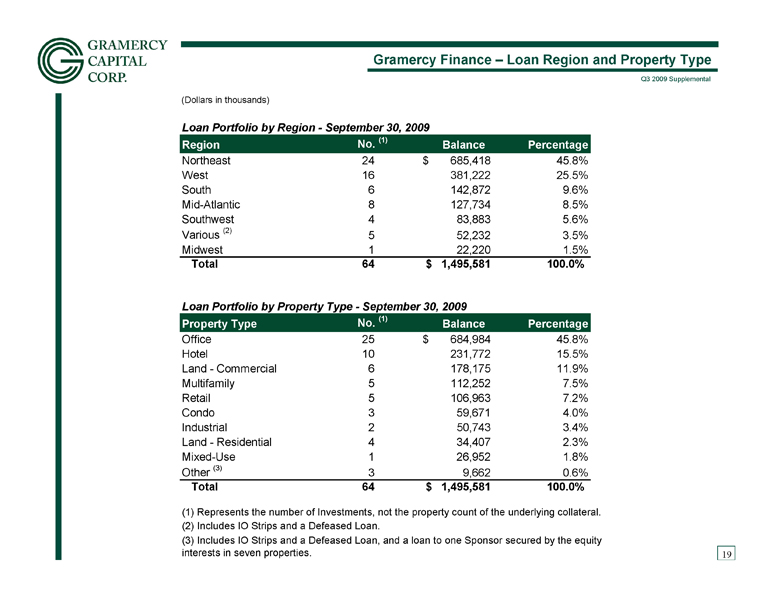 Gramercy Finance – Loan Region and Property Type 19 (Dollars in thousands) Loan Portfolio by Region - September 30, 2009 Region No. (1) Balance Percentage Northeast 24 $ 685,418 45.8% West 16 381,222 25.5% South 6 142,872 9.6% Mid-Atlantic 8 127,734 8.5% Southwest 4 83,883 5.6% Various (2) 5 52,232 3.5% Midwest 1 22,220 1.5% Total 64 $ 1,495,581 100.0% Loan Portfolio by Property Type - September 30, 2009 Property Type No. (1) Balance Percentage Office 25 $ 684,984 45.8% Hotel 10 231,772 15.5% Land - Commercial 6 178,175 11.9% Multifamily 5 112,252 7.5% Retail 5 106,963 7.2% Condo 3 59,671 4.0% Industrial 2 50,743 3.4% Land - Residential 4 34,407 2.3% Mixed-Use 1 26,952 1.8% Other (3) 3 9,662 0.6% Total 64 $ 1,495,581 100.0% (1) Represents the number of Investments, not the property count of the underlying collateral. (2) Includes IO Strips and a Defeased Loan. (3) Includes IO Strips and a Defeased Loan, and a loan to one Sponsor secured by the equity interests in seven properties.
 Gramercy Finance – Credit Ratings of CMBS Investments 20 Includes ratings actions taken
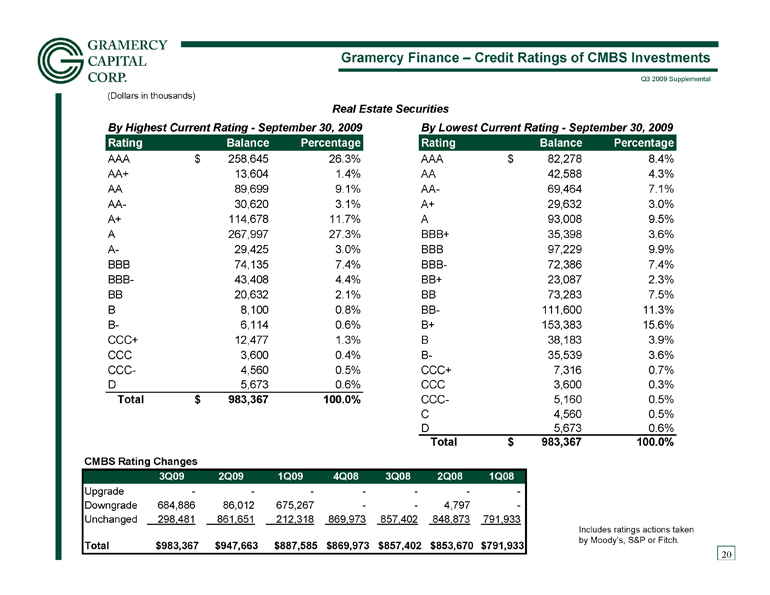
by Moody’s, S&P or Fitch. $791,933 $853,670 $857,402 $869,973 $887,585 $947,663 $983,367 Total 791,933 848,873 857,402 869,973 212,318 861,651 298,481 Unchanged - 4,797 - - 675,267 86,012 684,886 Downgrade - - - - - - - Upgrade 1Q08 2Q08 3Q08 4Q08 1Q09 2Q09 3Q09 CMBS Rating Changes (Dollars in thousands) By Highest Current Rating - September 30, 2009 By Lowest Current Rating - September 30, 2009 Rating Balance Percentage Rating Balance Percentage AAA 258,645 $ 26.3% AAA 82,278 $ 8.4% AA+ 13,604 1.4% AA 42,588 4.3% AA 89,699 9.1% AA- 69,464 7.1% AA- 30,620 3.1% A+ 29,632 3.0% A+ 114,678 11.7% A 93,008 9.5% A 267,997 27.3% BBB+ 35,398 3.6% A- 29,425 3.0% BBB 97,229 9.9% BBB 74,135 7.4% BBB- 72,386 7.4% BBB- 43,408 4.4% BB+ 23,087 2.3% BB 20,632 2.1% BB 73,283 7.5% B 8,100 0.8% BB- 111,600 11.3% B- 6,114 0.6% B+ 153,383 15.6% CCC+ 12,477 1.3% B 38,183 3.9% CCC 3,600 0.4% B- 35,539 3.6% CCC- 4,560 0.5% CCC+ 7,316 0.7% D 5,673 0.6% CCC 3,600 0.3% Total 983,367 $ 100.0% CCC- 5,160 0.5% C 4,560 0.5% D 5,673 0.6% Total 983,367 $ 100.0% Real Estate Securities
 Gramercy Finance – CMBS Region and Property Type 21 (Dollars in thousands) Real Estate Securities Portfolio by Region - September 30, 2009 Region Balance Percentage Northeast 217,854 $ 22.3% West 187,604 19.2% South 169,637 17.4% Southwest 134,696 13.8% Midwest 133,203 13.7% Mid-Atlantic 129,520 13.3% Other (1) 1,481 0.2% US Territories (2) 1,431 0.1% Various 358 0.04% Total (3) 975,784 $ 100.0% Real Estate Securities Portfolio by Property Type - September 30, 2009 Property Type Balance Percentage Office 334,330 $ 34.3% Retail 241,779 24.8% Multifamily (4) 176,810 18.1% Hotel 99,968 10.2% Industrial 59,343 6.1% Mixed-Use 35,954 3.7% Self Storage 13,033 1.3% Other 13,876 1.4% Condo 691 0.1% Total (3) 975,784 $ 100.0% (1) Includes seven properties located outside of the US and US Territories. (2) Includes properties located in Puerto Rico and Guam. (3) Does not include $7.58 million of REIT debt that also serves as collateral for one bond. (4) Includes Multifamily and Manufactured Housing.
 Gramercy Realty
 Gramercy Realty – Comparative Balance Sheets – Assets 23 (Unaudited - in thousands) September 30, 2009 June 30, 2009 March 31, 2009 December 31, 2008 September 30, 2008 Assets Real estate investments, at cost: Land 823,399 $ 824,202 $ 826,570 $ 815,003 $ 647,123 $ Building and improvements 2,415,422 2,410,976 2,414,527 2,441,839 2,550,010 Total real estate investment, cost 3,238,821 3,235,178 3,241,097 3,256,842 3,197,133 Less: accumulated depreciation (91,856) (76,692) (61,493) (78,315) (48,334) Total real estate investment, net 3,146,965 3,158,486 3,179,604 3,178,527 3,148,799 Cash and cash equivalents 64,664 53,461 45,066 91,240 25,890 Restricted cash 83,375 83,294 77,978 78,520 94,579 Pledged government securities, net 98,337 99,447 100,483 101,576 102,607 Investment in joint venture 7,970 8,629 9,311 10,495 12,122 Other assets held for sale, net 94,637 104,897 112,281 81,403 193,544 Tenant and other receivables 27,878 20,625 27,005 28,129 52,276 Acquired lease assets 465,502 480,012 499,652 566,972 415,633 Deferred costs, net 7,524 9,877 12,334 15,534 24,589 Other assets 18,068 14,581 19,792 10,790 19,214 Total assets 4,014,920 $ 4,033,309 $ 4,083,506 $ 4,163,186 $ 4,089,253 $
 Gramercy Realty – Comparative Balance Sheets – Liabilities & Equity 24 (Unaudited - in thousands) September 30, 2009 June 30, 2008 March 31, 2009 December 31, 2008 September 30, 2008 Liabilities and Stockholders' Equity Liabilities: Credit facilities - $ - $ - $ - $ - $ Mortgage notes payable to an affiliate 100,775 104,367 110,898 115,625 148,594 Mortgage notes payable 2,262,289 2,273,713 2,285,877 2,354,368 2,392,149 Total debt 2,363,064 2,378,080 2,396,775 2,469,993 2,540,743 Accrued interest 8,896 8,217 8,004 8,167 10,806 Accounts payable and accrued expenses 62,950 56,720 53,210 62,556 76,277 Deferred revenue 94,373 87,896 99,683 98,693 86,017 Below market lease liabilities, net 795,833 816,012 845,769 846,351 708,186 Leasehold interests liabilities, net 18,880 19,556 20,361 21,051 21,759 Liabilities related to assets held for sale 59,584 61,332 60,372 15,320 9,626 �� Total liabilities 3,403,580 3,427,813 3,484,174 3,522,131 3,453,414 Stockholders' equity: Investment by Gramercy Capital Corp. 805,200 805,200 805,200 805,200 805,200 Due to Gramercy Capital Corp. (196,331) (198,586) (200,365) (162,313) (169,805) Retained earnings (140) (3,691) (8,235) (4,544) (2,019) Total Gramercy Realty equity 608,729 602,923 596,600 638,343 633,376 Non-controlling interest 2,611 2,573 2,732 2,712 2,463 Total stockholders' equity 611,340 605,496 599,332 641,055 635,839 Total liabilities and stockholders' equity 4,014,920 $ 4,033,309 $ 4,083,506 $ 4,163,186 $ 4,089,253 $
 Gramercy Realty – Comparative Statements of Operations 25 (Unaudited - in thousands) September 30, 2009 June 30, 2009 * March 31, 2009 * December 31, 2008 * Revenues: Rental revenue 77,700 $ 81,740 $ 77,889 $ 76,275 $ Operating expense reimbursements 30,315 29,250 30,117 29,811 Interest and other income 804 966 988 928 Total revenues 108,819 111,956 108,994 107,014 Operating expenses: Ground rents and leasehold obligations 4,559 4,068 4,435 3,814 Real estate taxes 9,942 9,417 9,567 9,173 Utilities 11,159 8,933 10,045 9,457 Other property operating expenses 17,913 19,218 19,970 17,209 Direct billable expenses 2,453 2,087 2,158 1,606 Total operating expenses 46,026 43,723 46,175 41,259 Net operating income 62,793 68,233 62,819 65,755 Other expenses: Marketing, general and administrative 1,528 1,800 879 1,396 Total other expenses 1,528 1,800 879 1,396 EBITDA 61,265 66,433 61,940 64,359 Interest expense 31,496 31,531 32,541 39,388 Depreciation and amortization 26,823 29,555 27,106 26,812 Net gains from disposals - - - - Income (loss) before equity in loss from unconsolidated joint venture and non-controlling interest 2,946 5,347 2,293 (1,841) Equity in net income (loss) from unconsolidated joint ventures (659) (675) (641) (690) Net income (loss) from continuing operations 2,287 $ 4,672 $ 1,652 $ (2,531) $ Net income (loss) from discontinued operations (632) $ (1,667) $ (5,681) $ 170 $ Net gains from disposals 1,934 1,595 358 - Net income (loss) from discontinued operations 1,302 (72) (5,323) 170 Net (income) loss attributed to non-controlling interest (38) (55) (20) (165) Net income (loss) 3,551 $ 4,545 $ (3,691) $ (2,526) $ * Reflects properties reclassified during Q3 2009 to Discontinued Operations. Quarter Ended
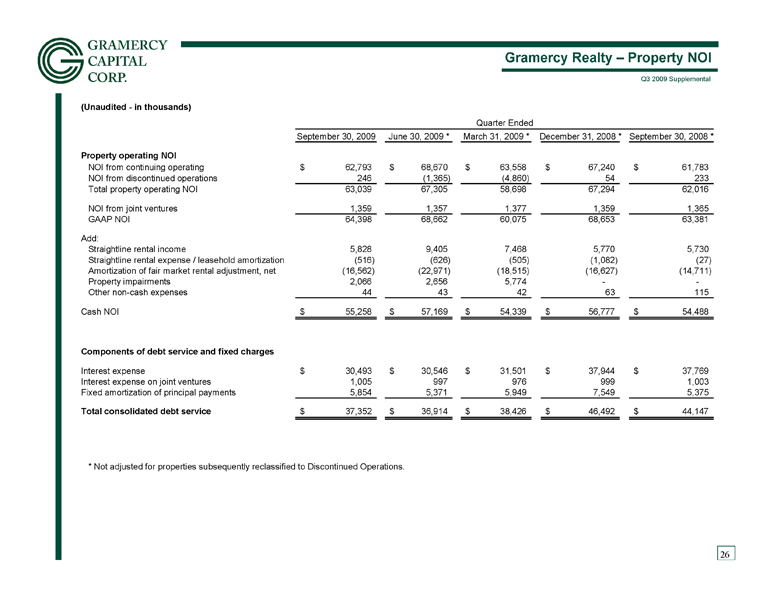 26 Gramercy Realty – Property NOI (Unaudited - in thousands) Quarter Ended September 30, 2009 June 30, 2009 * March 31, 2009 * December 31, 2008 * September 30, 2008 * Property operating NOI NOI from continuing operating 62,793 $ 68,670 $ 63,558 $ 67,240 $ 61,783 $ NOI from discontinued operations 246 (1,365) (4,860) 54 233 Total property operating NOI 63,039 67,305 58,698 67,294 62,016 NOI from joint ventures 1,359 1,357 1,377 1,359 1,365 GAAP NOI 64,398 68,662 60,075 68,653 63,381 Add: Straightline rental income 5,828 9,405 7,468 5,770 5,730 Straightline rental expense / leasehold amortization (516) (626) (505) (1,082) (27) Amortization of fair market rental adjustment, net (16,562) (22,971) (18,515) (16,627) (14,711) Property impairments 2,066 2,656 5,774 - - Other non-cash expenses 44 43 42 63 115 Cash NOI 55,258 $ 57,169 $ 54,339 $ 56,777 $ 54,488 $ Components of debt service and fixed charges Interest expense 30,493 $ 30,546 $ 31,501 $ 37,944 $ 37,769 $ Interest expense on joint ventures 1,005 997 976 999 1,003 Fixed amortization of principal payments 5,854 5,371 5,949 7,549 5,375 Total consolidated debt service 37,352 $ 36,914 $ 38,426 $ 46,492 $ 44,147 $ * Not adjusted for properties subsequently reclassified to Discontinued Operations.
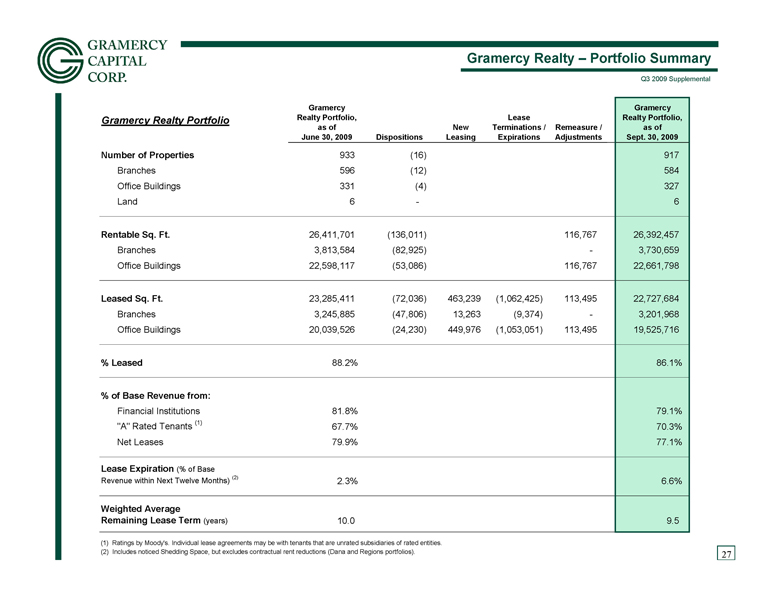 Gramercy Realty – Portfolio Summary 27 Gramercy Realty Portfolio Gramercy Realty Portfolio, as of June 30, 2009 Dispositions New Leasing Lease Terminations / Expirations Remeasure / Adjustments Gramercy Realty Portfolio, as of Sept. 30, 2009 Number of Properties 933 (16) 917 Branches 596 (12) 584 Office Buildings 331 (4) 327 Land 6 - 6 Rentable Sq. Ft. 26,411,701 (136,011) 116,767 26,392,457 Branches 3,813,584 (82,925) - 3,730,659 Office Buildings 22,598,117 (53,086) 116,767 22,661,798 Leased Sq. Ft. 23,285,411 (72,036) 463,239 (1,062,425) 113,495 22,727,684 Branches 3,245,885 (47,806) 13,263 (9,374) - 3,201,968 Office Buildings 20,039,526 (24,230) 449,976 (1,053,051) 113,495 19,525,716 % Leased 88.2% 86.1% % of Base Revenue from: Financial Institutions 81.8% 79.1% "A" Rated Tenants (1) 67.7% 70.3% Net Leases 79.9% 77.1% Lease Expiration (% of Base Revenue within Next Twelve Months) (2) 2.3% 6.6% Weighted Average Remaining Lease Term (years) 10.0 9.5 (1) Ratings by Moody's. Individual lease agreements may be with tenants that are unrated subsidiaries of rated entities. (2) Includes noticed Shedding Space, but excludes contractual rent reductions (Dana and Regions portfolios).
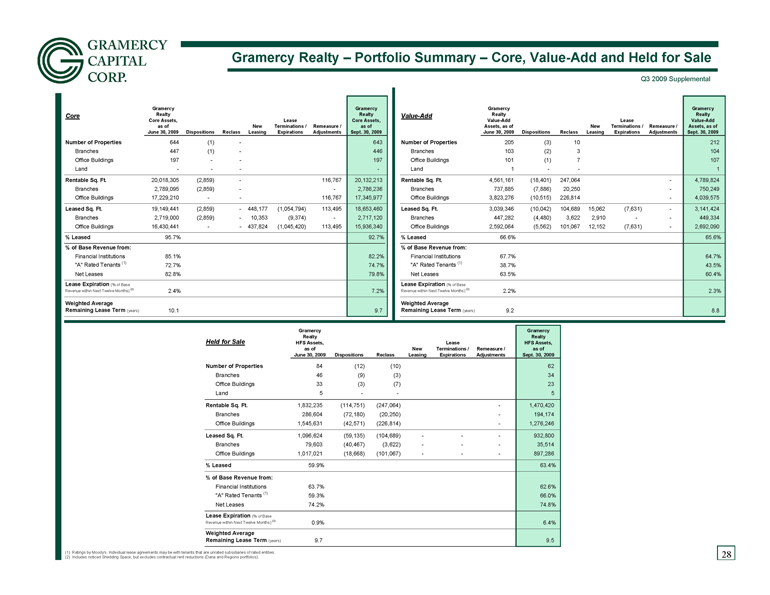 Gramercy Realty – Portfolio Summary – Core, Value-Add and Held for Sale 28 8.8 9.2 (years) Remaining Lease Term Weighted Average 9.7 10.1 (years) Remaining Lease Term Weighted Average 2.3% 2.2% (2) Revenue within Next Twelve Months) (% of Base Lease Expiration 7.2% 2.4% (2) Revenue within Next Twelve Months) (% of Base Lease Expiration 60.4% 63.5% Net Leases 79.8% 82.8% Net Leases 43.5% 38.7% (1) "A" Rated Tenants 74.7% 72.7% (1) "A" Rated Tenants 64.7% 67.7% Financial Institutions 82.2% 85.1% Financial Institutions % of Base Revenue from: % of Base Revenue from: 65.6% 66.6% % Leased 92.7% 95.7% % Leased 2,692,090 - (7,631) 12,152 101,067 (5,562) 2,592,064 Office Buildings 15,936,340 113,495 (1,045,420) 437,824 - - 16,430,441 Office Buildings 449,334 - - 2,910 3,622 (4,480) 447,282 Branches 2,717,120 - (9,374) 10,353 - (2,859) 2,719,000 Branches 3,141,424 - (7,631) 15,062 104,689 (10,042) 3,039,346 Leased Sq. Ft. 18,653,460 113,495 (1,054,794) 448,177 - (2,859) 19,149,441 Leased Sq. Ft. 4,039,575 - 226,814 (10,515) 3,823,276 Office Buildings 17,345,977 116,767 - - 17,229,210 Office Buildings 750,249 - 20,250 (7,886) 737,885 Branches 2,786,236 - - (2,859) 2,789,095 Branches 4,789,824 - 247,064 (18,401) 4,561,161 Rentable Sq. Ft. 20,132,213 116,767 - (2,859) 20,018,305 Rentable Sq. Ft. 1 - - 1 Land - - - - Land 107 7 (1) 101 Office Buildings 197 - - 197 Office Buildings 104 3 (2) 103 Branches 446 - (1) 447 Branches 212 10 (3) 205 Number of Properties 643 - (1) 644 Number of Properties Sept. 30, 2009 Assets, as of Value-Add Realty Gramercy Adjustments Remeasure / Expirations Terminations / Lease Leasing New Reclass Dispositions June 30, 2009 Assets, as of Value-Add Realty Gramercy Value-Add Sept. 30, 2009 as of Core Assets, Realty Gramercy Adjustments Remeasure / Expirations Terminations / Lease Leasing New Reclass Dispositions June 30, 2009 as of Core Assets, Realty Gramercy Core Held for Sale Gramercy Realty HFS Assets, as of June 30, 2009 Dispositions Reclass New Leasing Lease Terminations / Expirations Remeasure / Adjustments Gramercy Realty HFS Assets, as of Sept. 30, 2009 Number of Properties 84 (12) (10) 62 Branches 46 (9) (3) 34 Office Buildings 33 (3) (7) 23 Land 5 - - 5 Rentable Sq. Ft. 1,832,235 (114,751) (247,064) - 1,470,420 Branches 286,604 (72,180) (20,250) - 194,174 Office Buildings 1,545,631 (42,571) (226,814) - 1,276,246 Leased Sq. Ft. 1,096,624 (59,135) (104,689) - - - 932,800 Branches 79,603 (40,467) (3,622) - - - 35,514 Office Buildings 1,017,021 (18,668) (101,067) - - - 897,286 % Leased 59.9% 63.4% % of Base Revenue from: Financial Institutions 63.7% 62.6% "A" Rated Tenants (1) 59.3% 66.0% Net Leases 74.2% 74.8% Lease Expiration (% of Base Revenue within Next Twelve Months) (2) 0.9% 6.4% Weighted Average Remaining Lease Term (years) 9.7 9.5 (1) Ratings by Moody's. Individual lease agreements may be with tenants that are unrated subsidiaries of rated entities. (2) Includes noticed Shedding Space, but excludes contractual rent reductions (Dana and Regions portfolios).
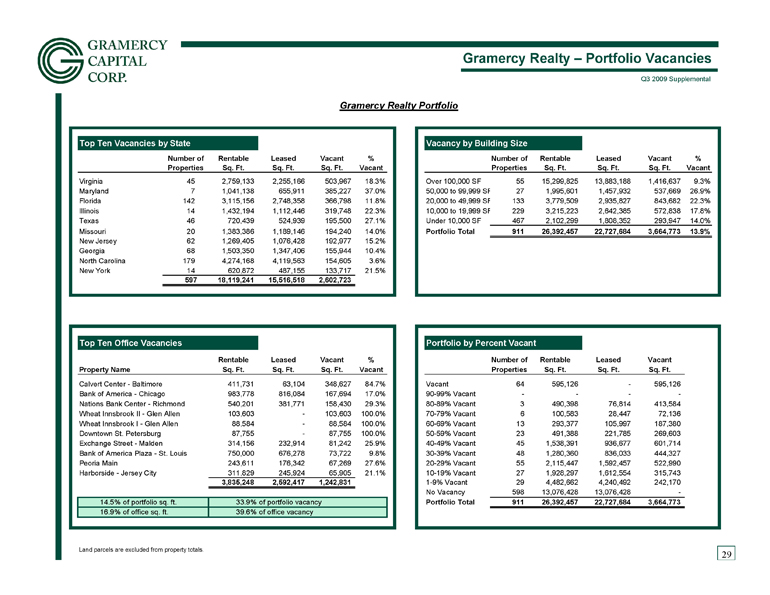 Gramercy Realty – Portfolio Vacancies 29 Top Ten Vacancies by State Vacancy by Building Size Number of Rentable Leased Vacant % Number of Rentable Leased Vacant % Properties Sq. Ft. Sq. Ft. Sq. Ft. Vacant Properties Sq. Ft. Sq. Ft. Sq. Ft. Vacant Virginia 45 2,759,133 2,255,166 503,967 18.3% Over 100,000 SF 55 15,299,825 13,883,188 1,416,637 9.3% Maryland 7 1,041,138 655,911 385,227 37.0% 50,000 to 99,999 SF 27 1,995,601 1,457,932 537,669 26.9% Florida 142 3,115,156 2,748,358 366,798 11.8% 20,000 to 49,999 SF 133 3,779,509 2,935,827 843,682 22.3% Illinois 14 1,432,194 1,112,446 319,748 22.3% 10,000 to 19,999 SF 229 3,215,223 2,642,385 572,838 17.8% Texas 46 720,439 524,939 195,500 27.1% Under 10,000 SF 467 2,102,299 1,808,352 293,947 14.0% Missouri 20 1,383,386 1,189,146 194,240 14.0% Portfolio Total 911 26,392,457 22,727,684 3,664,773 13.9% New Jersey 62 1,269,405 1,076,428 192,977 15.2% Georgia 68 1,503,350 1,347,406 155,944 10.4% North Carolina 179 4,274,168 4,119,563 154,605 3.6% New York 14 620,872 487,155 133,717 21.5% 597 18,119,241 15,516,518 2,602,723 Top Ten Office Vacancies Portfolio by Percent Vacant Rentable Leased Vacant % Number of Rentable Leased Vacant Property Name Sq. Ft. Sq. Ft. Sq. Ft. Vacant Properties Sq. Ft. Sq. Ft. Sq. Ft. Calvert Center - Baltimore 411,731 63,104 348,627 84.7% Vacant 64 595,126 - 595,126 Bank of America - Chicago 983,778 816,084 167,694 17.0% 90-99% Vacant - - - - Nations Bank Center - Richmond 540,201 381,771 158,430 29.3% 80-89% Vacant 3 490,398 76,814 413,584 Wheat Innsbrook II - Glen Allen 103,603 - 103,603 100.0% 70-79% Vacant 6 100,583 28,447 72,136 Wheat Innsbrook I - Glen Allen 88,584 - 88,584 100.0% 60-69% Vacant 13 293,377 105,997 187,380 Downtown St. Petersburg 87,755 - 87,755 100.0% 50-59% Vacant 23 491,388 221,785 269,603 Exchange Street - Malden 314,156 232,914 81,242 25.9% 40-49% Vacant 45 1,538,391 936,677 601,714 Bank of America Plaza - St. Louis 750,000 676,278 73,722 9.8% 30-39% Vacant 48 1,280,360 836,033 444,327 Peoria Main 243,611 176,342 67,269 27.6% 20-29% Vacant 55 2,115,447 1,592,457 522,990 Harborside - Jersey City 311,829 245,924 65,905 21.1% 10-19% Vacant 27 1,928,297 1,612,554 315,743 3,835,248 2,592,417 1,242,831 1-9% Vacant 29 4,482,662 4,240,492 242,170 No Vacancy 598 13,076,428 13,076,428 - 14.5% of portfolio sq. ft. 33.9% of portfolio vacancy Portfolio Total 911 26,392,457 22,727,684 3,664,773 16.9% of office sq. ft. 39.6% of office vacancy Land parcels are excluded from property totals. Gramercy Realty Portfolio
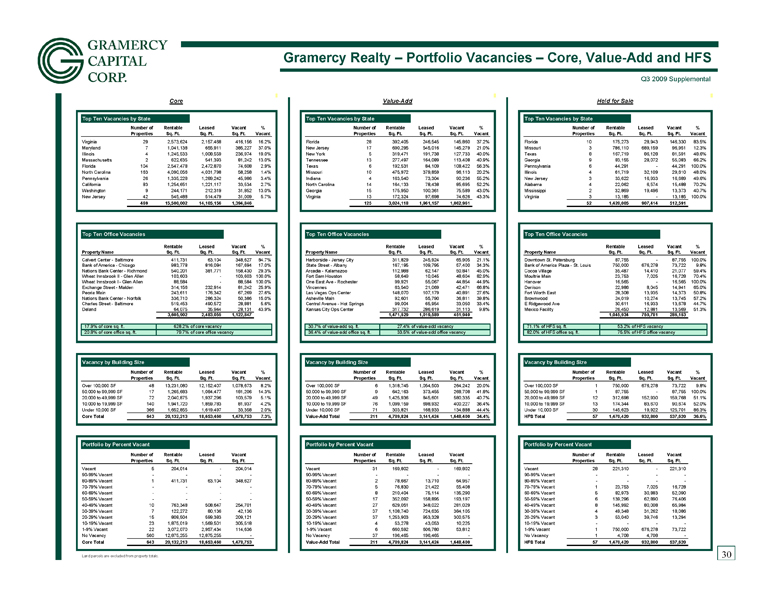 Gramercy Realty – Portfolio Vacancies – Core, Value-Add and HFS 30 Top Ten Vacancies by State Top Ten Vacancies by State Top Ten Vacancies by State Number of Rentable Leased Vacant % Number of Rentable Leased Vacant % Number of Rentable Leased Vacant % Properties Sq. Ft. Sq. Ft. Sq. Ft. Vacant Properties Sq. Ft. Sq. Ft. Sq. Ft. Vacant Properties Sq. Ft. Sq. Ft. Sq. Ft. Vacant Virginia 29 2,573,624 2,157,468 416,156 16.2% Florida 28 392,405 246,545 145,860 37.2% Florida 10 175,273 28,943 146,330 83.5% Maryland 7 1,041,138 655,911 385,227 37.0% New Jersey 17 690,295 545,016 145,279 21.0% Missouri 3 786,110 689,159 96,951 12.3% Illinois 4 1,245,533 1,008,559 236,974 19.0% New York 5 319,471 191,738 127,733 40.0% Texas 8 167,719 86,128 81,591 48.6% Massachusetts 2 622,635 541,393 81,242 13.0% Tennessee 13 277,497 164,089 113,408 40.9% Georgia 9 83,155 28,072 55,083 66.2% Florida 104 2,547,478 2,472,870 74,608 2.9% Texas 6 192,531 84,109 108,422 56.3% Pennsylvania 6 44,291 - 44,291 100.0% North Carolina 163 4,090,056 4,031,798 58,258 1.4% Missouri 10 475,972 379,859 96,113 20.2% Illinois 4 61,719 32,109 29,610 48.0% Pennsylvania 26 1,335,228 1,289,242 45,986 3.4% Indiana 4 163,540 73,304 90,236 55.2% New Jersey 3 33,622 16,933 16,689 49.6% California 83 1,254,651 1,221,117 33,534 2.7% North Carolina 14 164,133 78,438 85,695 52.2% Alabama 4 22,062 6,574 15,488 70.2% Washington 9 244,171 212,319 31,852 13.0% Georgia 15 175,950 100,361 75,589 43.0% Mississippi 2 32,869 19,496 13,373 40.7% New Jersey 42 545,488 514,479 31,009 5.7% Virginia 13 172,324 97,698 74,626 43.3% Virginia 3 13,185 - 13,185 100.0% 469 15,500,002 14,105,156 1,394,846 125 3,024,118 1,961,157 1,062,961 52 1,420,005 907,414 512,591 Top Ten Office Vacancies Top Ten Office Vacancies Top Ten Office Vacancies Rentable Leased Vacant % Rentable Leased Vacant % Rentable Leased Vacant % Property Name Sq. Ft. Sq. Ft. Sq. Ft. Vacant Property Name Sq. Ft. Sq. Ft. Sq. Ft. Vacant Property Name Sq. Ft. Sq. Ft. Sq. Ft. Vacant Calvert Center - Baltimore 411,731 63,104 348,627 84.7% Harborside - Jersey City 311,829 245,924 65,905 21.1% Downtown St. Petersburg 87,755 - 87,755 100.0% Bank of America - Chicago 983,778 816,084 167,694 17.0% State Street - Albany 167,195 109,795 57,400 34.3% Bank of America Plaza - St. Louis 750,000 676,278 73,722 9.8% Nations Bank Center - Richmond 540,201 381,771 158,430 29.3% Arcadia - Kalamazoo 112,988 62,147 50,841 45.0% Cocoa Village 35,487 14,410 21,077 59.4% Wheat Innsbrook II - Glen Allen 103,603 - 103,603 100.0% Fort Sam Houston 58,649 10,045 48,604 82.9% Moultrie Main 23,753 7,025 16,728 70.4% Wheat Innsbrook I - Glen Allen 88,584 - 88,584 100.0% One East Ave - Rochester 99,921 55,067 44,854 44.9% Hanover 16,565 - 16,565 100.0% Exchange Street - Malden 314,156 232,914 81,242 25.9% Vincennes 63,540 21,069 42,471 66.8% Denison 22,986 8,045 �� 14,941 65.0% Peoria Main 243,611 176,342 67,269 27.6% Las Vegas Ops Center 148,070 107,179 40,891 27.6% Fort Worth East 28,308 13,935 14,373 50.8% Nations Bank Center - Norfolk 336,710 286,324 50,386 15.0% Asheville Main 92,601 55,790 36,811 39.8% Brownwood 24,019 10,274 13,745 57.2% Charles Street - Baltimore 519,453 490,572 28,881 5.6% Central Avenue - Hot Springs 99,004 65,954 33,050 33.4% E Ridgewood Ave 30,611 16,933 13,678 44.7% Deland 64,075 35,944 28,131 43.9% Kansas City Ops Center 317,732 286,619 31,113 9.8% Mexico Facility 26,450 12,881 13,569 51.3% 3,605,902 2,483,055 1,122,847 1,471,529 1,019,589 451,940 1,045,934 759,781 286,153 17.9% of core sq. ft. 628.2% of core vacancy 30.7% of value-add sq. ft. 27.4% of value-add vacancy 71.1% of HFS sq. ft. 53.2% of HFS vacancy 20.8% of core office sq. ft. 79.7% of core office vacancy 36.4% of value-add office sq. ft. 33.5% of value-add office vacancy 82.0% of HFS office sq. ft. 75.5% of HFS office vacancy Vacancy by Building Size Vacancy by Building Size Vacancy by Building Size Number of Rentable Leased Vacant % Number of Rentable Leased Vacant % Number of Rentable Leased Vacant % Properties Sq. Ft. Sq. Ft. Sq. Ft. Vacant Properties Sq. Ft. Sq. Ft. Sq. Ft. Vacant Properties Sq. Ft. Sq. Ft. Sq. Ft. Vacant Over 100,000 SF 48 13,231,080 12,152,407 1,078,673 8.2% Over 100,000 SF 6 1,318,745 1,054,503 264,242 20.0% Over 100,000 SF 1 750,000 676,278 73,722 9.8% 50,000 to 99,999 SF 17 1,265,683 1,084,477 181,206 14.3% 50,000 to 99,999 SF 9 642,163 373,455 268,708 41.8% 50,000 to 99,999 SF 1 87,755 - 87,755 100.0% 20,000 to 49,999 SF 72 2,040,875 1,937,296 103,579 5.1% 20,000 to 49,999 SF 49 1,425,936 845,601 580,335 40.7% 20,000 to 49,999 SF 12 312,698 152,930 159,768 51.1% 10,000 to 19,999 SF 140 1,941,720 1,859,783 81,937 4.2% 10,000 to 19,999 SF 76 1,099,159 698,932 400,227 36.4% 10,000 to 19,999 SF 13 174,344 83,670 90,674 52.0% Under 10,000 SF 366 1,652,855 1,619,497 33,358 2.0% Under 10,000 SF 71 303,821 168,933 134,888 44.4% Under 10,000 SF 30 145,623 19,922 125,701 86.3% Core Total 643 20,132,213 18,653,460 1,478,753 7.3% Value-Add Total 211 4,789,824 3,141,424 1,648,400 34.4% HFS Total 57 1,470,420 932,800 537,620 36.6% Portfolio by Percent Vacant Portfolio by Percent Vacant Portfolio by Percent Vacant Number of Rentable Leased Vacant Number of Rentable Leased Vacant Number of Rentable Leased Vacant Properties Sq. Ft. Sq. Ft. Sq. Ft. Properties Sq. Ft. Sq. Ft. Sq. Ft. Properties Sq. Ft. Sq. Ft. Sq. Ft. Vacant 5 204,014 - 204,014 Vacant 31 169,802 - 169,802 Vacant 28 221,310 - 221,310 90-99% Vacant - - - - 90-99% Vacant - - - - 90-99% Vacant - - - - 80-89% Vacant 1 411,731 63,104 348,627 80-89% Vacant 2 78,667 13,710 64,957 80-89% Vacant - - - - 70-79% Vacant - - - - 70-79% Vacant 5 76,830 21,422 55,408 70-79% Vacant 1 23,753 7,025 16,728 60-69% Vacant - - - - 60-69% Vacant 8 210,404 75,114 135,290 60-69% Vacant 5 82,973 30,883 52,090 50-59% Vacant - - - - 50-59% Vacant 17 352,092 158,895 193,197 50-59% Vacant 6 139,296 62,890 76,406 40-49% Vacant 10 763,348 508,647 254,701 40-49% Vacant 27 629,051 348,022 281,029 40-49% Vacant 8 145,992 80,008 65,984 30-39% Vacant 7 122,272 80,136 42,136 30-39% Vacant 37 1,108,740 724,635 384,105 30-39% Vacant 4 49,348 31,262 18,086 20-29% Vacant 15 808,504 599,383 209,121 20-29% Vacant 37 1,253,903 953,328 300,575 20-29% Vacant 3 53,040 39,746 13,294 10-19% Vacant 23 1,875,019 1,569,501 305,518 10-19% Vacant 4 53,278 43,053 10,225 10-19% Vacant - - - - 1-9% Vacant 22 3,072,070 2,957,434 114,636 1-9% Vacant 6 660,592 606,780 53,812 1-9% Vacant 1 750,000 676,278 73,722 No Vacancy 560 12,875,255 12,875,255 - No Vacancy 37 196,465 196,465 - No Vacancy 1 4,708 4,708 - Core Total 643 20,132,213 18,653,460 1,478,753 Value-Add Total 211 4,789,824 3,141,424 1,648,400 HFS Total 57 1,470,420 932,800 537,620 Land parcels are excluded from property totals. Core Held for Sale Value-Add
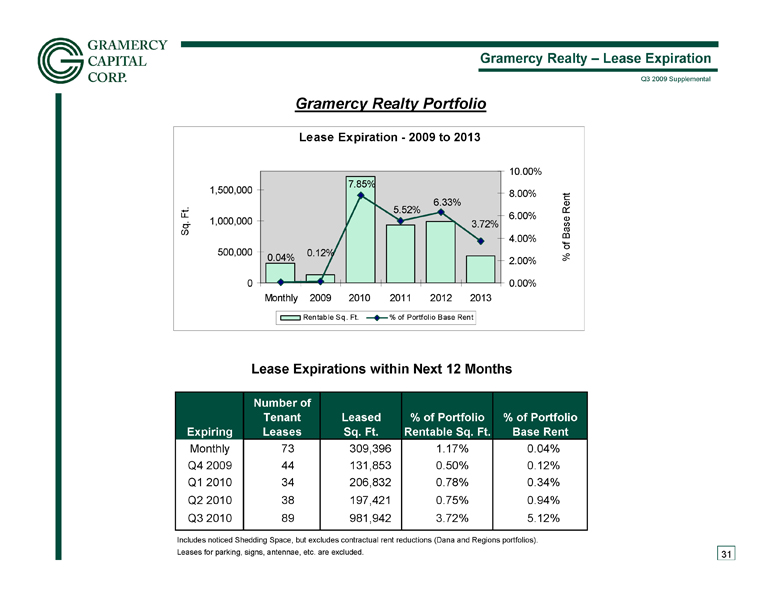 Gramercy Realty – Lease Expiration Gramercy Realty Portfolio 31 Expiring Monthly 73 309,396 1.17% 0.04% Q4 2009 44 131,853 0.50% 0.12% Q1 2010 34 206,832 0.78% 0.34% Q2 2010 38 197,421 0.75% 0.94% Q3 2010 89 981,942 3.72% 5.12% % of Portfolio Rentable Sq. Ft. Number of Tenant Leases Leased Sq. Ft. Leases for parking, signs, antennae, etc. are excluded. Includes noticed Shedding Space, but excludes contractual rent reductions (Dana and Regions portfolios). Lease Expirations within Next 12 Months % of Portfolio Base Rent
 Gramercy Realty – Lease Expiration – Core, Value-Add and HFS 32 Expiring Expiring Expiring Monthly 28 234,256 1.16% 0.03% Monthly 37 58,112 1.21% 0.10% Monthly 8 17,028 1.16% 0.07% Q4 2009 22 75,860 0.38% 0.09% Q4 2009 17 45,252 0.94% 0.28% Q4 2009 5 10,741 0.73% 0.08% Q1 2010 19 171,921 0.85% 0.34% Q1 2010 15 34,911 0.73% 0.48% Q1 2010 0 0 0.00% 0.00% Q2 2010 19 168,351 0.84% 1.04% Q2 2010 15 25,786 0.54% 0.52% Q2 2010 4 3,284 0.22% 0.27% Q3 2010 75 908,528 4.51% 5.72% Q3 2010 12 26,395 0.55% 0.96% Q3 2010 2 47,019 3.20% 6.01% Includes noticed Shedding Space, but excludes contractual rent reductions (Dana and Regions portfolios). Leases for parking, signs, antennae, etc. are excluded. % of Core Base Rent % of Core Rentable Sq. Ft. Number of Tenant Leases Leased Sq. Ft. Core Lease Expirations within Next 12 Months Held for Sale Lease Expirations within Next 12 Months Value-Add Lease Expirations within Next 12 Months % of HFS Base Rent Number of Tenant Leases Leased Sq. Ft. % of Value-Add Rentable Sq. Ft. % of Value-Add Base Rent Number of Tenant Leases Leased Sq. Ft. % of HFS Rentable Sq. Ft. Lease Expiration - 2009 to 2013 3.57% 5.58% 4.66% 8.37% 0.09% 0.03% 0 500,000 1,000,000 1,500,000 Monthly 2009 2010 2011 2012 2013 0.00% 2.00% 4.00% 6.00% 8.00% 10.00% Rentable Sq. Ft. % of Core Base Rent Lease Expiration - 2009 to 2013 1.30% 0.07% 0.08% 6.57% 21.88% 15.34% 0 100,000 200,000 Monthly 2009 2010 2011 2012 2013 0.00% 5.00% 10.00% 15.00% 20.00% 25.00% Rentable Sq. Ft. % of HFS Base Rent Lease Expiration - 2009 to 2013 0.10% 0.28% 4.87% 5.91% 8.37% 5.47% 0 100,000 200,000 Monthly 2009 2010 2011 2012 2013 0.00% 2.00% 4.00% 6.00% 8.00% 10.00% Rentable Sq. Ft. % of Value-Add Base Rent
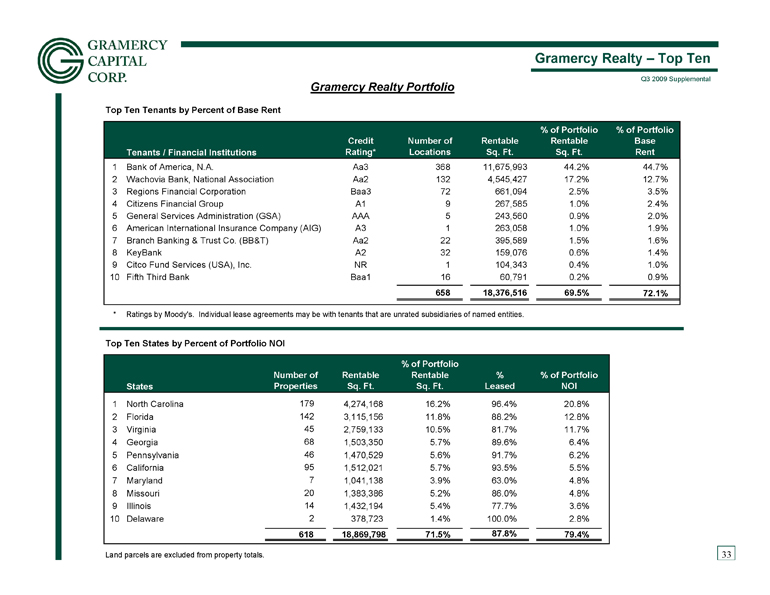 Gramercy Realty – Top Ten Gramercy Realty Portfolio 33 Top Ten Tenants by Percent of Base Rent Tenants / Financial Institutions Credit Rating* Number of Locations Rentable Sq. Ft. % of Portfolio Rentable Sq. Ft. % of Portfolio Base Rent 1 Bank of America, N.A. Aa3 368 11,675,993 44.2% 44.7% 2 Wachovia Bank, National Association Aa2 132 4,545,427 17.2% 12.7% 3 Regions Financial Corporation Baa3 72 661,094 2.5% 3.5% 4 Citizens Financial Group A1 9 267,585 1.0% 2.4% 5 General Services Administration (GSA) AAA 5 243,560 0.9% 2.0% 6 American International Insurance Company (AIG) A3 1 263,058 1.0% 1.9% 7 Branch Banking & Trust Co. (BB&T) Aa2 22 395,589 1.5% 1.6% 8 KeyBank A2 32 159,076 0.6% 1.4% 9 Citco Fund Services (USA), Inc. NR 1 104,343 0.4% 1.0% 10 Fifth Third Bank Baa1 16 60,791 0.2% 0.9% 658 18,376,516 69.5% 72.1% * Ratings by Moody's. Individual lease agreements may be with tenants that are unrated subsidiaries of named entities. Top Ten States by Percent of Portfolio NOI States Number of Properties Rentable Sq. Ft. % of Portfolio Rentable Sq. Ft. % Leased % of Portfolio NOI 1 North Carolina 179 4,274,168 16.2% 96.4% 20.8% 2 Florida 142 3,115,156 11.8% 88.2% 12.8% 3 Virginia 45 2,759,133 10.5% 81.7% 11.7% 4 Georgia 68 1,503,350 5.7% 89.6% 6.4% 5 Pennsylvania 46 1,470,529 5.6% 91.7% 6.2% 6 California 95 1,512,021 5.7% 93.5% 5.5% 7 Maryland 7 1,041,138 3.9% 63.0% 4.8% 8 Missouri 20 1,383,386 5.2% 86.0% 4.8% 9 Illinois 14 1,432,194 5.4% 77.7% 3.6% 10 Delaware 2 378,723 1.4% 100.0% 2.8% 618 18,869,798 71.5% 87.8% 79.4% Land parcels are excluded from property totals. Contractual Rent 1
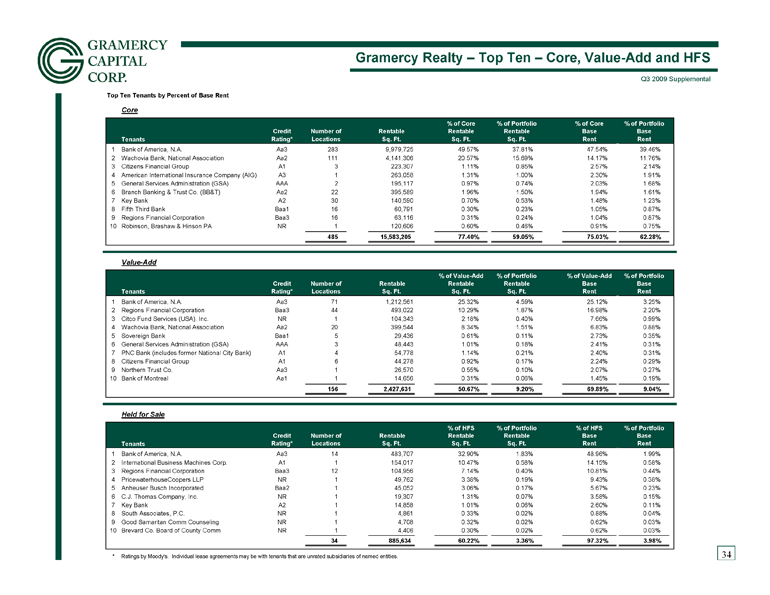 Gramercy Realty – Top Ten – Core, Value-Add and HFS 34 Top Ten Tenants by Percent of Base Rent Core Tenants Credit Rating* Number of Locations Rentable Sq. Ft. % of Core Rentable Sq. Ft. % of Portfolio Rentable Sq. Ft. % of Core Base Rent % of Portfolio Base Rent 1 Bank of America, N.A. Aa3 283 9,979,725 49.57% 37.81% 47.54% 39.46% 2 Wachovia Bank, National Association Aa2 111 4,141,306 20.57% 15.69% 14.17% 11.76% 3 Citizens Financial Group A1 3 223,307 1.11% 0.85% 2.57% 2.14% 4 American International Insurance Company (AIG) A3 1 263,058 1.31% 1.00% 2.30% 1.91% 5 General Services Administration (GSA) AAA 2 195,117 0.97% 0.74% 2.03% 1.68% 6 Branch Banking & Trust Co. (BB&T) Aa2 22 395,589 1.96% 1.50% 1.94% 1.61% 7 Key Bank A2 30 140,590 0.70% 0.53% 1.48% 1.23% 8 Fifth Third Bank Baa1 16 60,791 0.30% 0.23% 1.05% 0.87% 9 Regions Financial Corporation Baa3 16 63,116 0.31% 0.24% 1.04% 0.87% 10 Robinson, Brashaw & Hinson PA NR 1 120,606 0.60% 0.46% 0.91% 0.75% 485 15,583,205 77.40% 59.05% 75.03% 62.28% Value-Add Tenants Credit Rating* Number of Locations Rentable Sq. Ft. % of Value-Add Rentable Sq. Ft. % of Portfolio Rentable Sq. Ft. % of Value-Add Base Rent % of Portfolio Base Rent 1 Bank of America, N.A. Aa3 71 1,212,561 25.32% 4.59% 25.12% 3.25% 2 Regions Financial Corporation Baa3 44 493,022 10.29% 1.87% 16.98% 2.20% 3 Citco Fund Services (USA), Inc. NR 1 104,343 2.18% 0.40% 7.66% 0.99% 4 Wachovia Bank, National Association Aa2 20 399,544 8.34% 1.51% 6.83% 0.88% 5 Sovereign Bank Baa1 5 29,436 0.61% 0.11% 2.73% 0.35% 6 General Services Administration (GSA) AAA 3 48,443 1.01% 0.18% 2.41% 0.31% 7 PNC Bank (includes former National City Bank) A1 4 54,778 1.14% 0.21% 2.40% 0.31% 8 Citizens Financial Group A1 6 44,278 0.92% 0.17% 2.24% 0.29% 9 Northern Trust Co. Aa3 1 26,570 0.55% 0.10% 2.07% 0.27% 10 Bank of Montreal Aa1 1 14,656 0.31% 0.06% 1.45% 0.19% 156 2,427,631 50.67% 9.20% 69.89% 9.04% Held for Sale Tenants Credit Rating* Number of Locations Rentable Sq. Ft. % of HFS Rentable Sq. Ft. % of Portfolio Rentable Sq. Ft. % of HFS Base Rent % of Portfolio Base Rent 1 Bank of America, N.A. Aa3 14 483,707 32.90% 1.83% 48.96% 1.99% 2 International Business Machines Corp. A1 1 154,017 10.47% 0.58% 14.15% 0.58% 3 Regions Financial Corporation Baa3 12 104,956 7.14% 0.40% 10.81% 0.44% 4 PricewaterhouseCoopers LLP NR 1 49,762 3.38% 0.19% 9.43% 0.38% 5 Anheuser Busch Incorporated Baa2 1 45,052 3.06% 0.17% 5.67% 0.23% 6 C.J. Thomas Company, Inc. NR 1 19,307 1.31% 0.07% 3.58% 0.15% 7 Key Bank A2 1 14,858 1.01% 0.06% 2.60% 0.11% 8 South Associates, P.C. NR 1 4,861 0.33% 0.02% 0.88% 0.04% 9 Good Samaritan Comm Counseling NR 1 4,708 0.32% 0.02% 0.62% 0.03% 10 Brevard Co. Board of County Comm NR 1 4,406 0.30% 0.02% 0.62% 0.03% 34 885,634 60.22% 3.36% 97.32% 3.98% * Ratings by Moody's. Individual lease agreements may be with tenants that are unrated subsidiaries of named entities. Contractual Rent 1 Contractual Rent 1
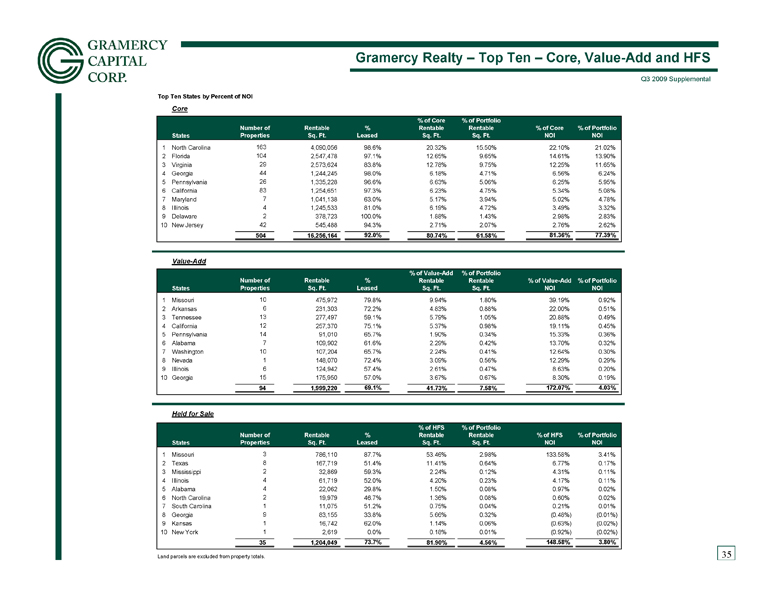 Gramercy Realty – Top Ten – Core, Value-Add and HFS 35 Top Ten States by Percent of NOI Core States Number of Properties Rentable Sq. Ft. % Leased % of Core Rentable Sq. Ft. % of Portfolio Rentable Sq. Ft. % of Core NOI % of Portfolio NOI 1 North Carolina 163 4,090,056 98.6% 20.32% 15.50% 22.10% 21.02% 2 Florida 104 2,547,478 97.1% 12.65% 9.65% 14.61% 13.90% 3 Virginia 29 2,573,624 83.8% 12.78% 9.75% 12.25% 11.65% 4 Georgia 44 1,244,245 98.0% 6.18% 4.71% 6.56% 6.24% 5 Pennsylvania 26 1,335,228 96.6% 6.63% 5.06% 6.25% 5.95% 6 California 83 1,254,651 97.3% 6.23% 4.75% 5.34% 5.08% 7 Maryland 7 1,041,138 63.0% 5.17% 3.94% 5.02% 4.78% 8 Illinois 4 1,245,533 81.0% 6.19% 4.72% 3.49% 3.32% 9 Delaware 2 378,723 100.0% 1.88% 1.43% 2.98% 2.83% 10 New Jersey 42 545,488 94.3% 2.71% 2.07% 2.76% 2.62% 504 16,256,164 92.0% 80.74% 61.58% 81.36% 77.39% Value-Add States Number of Properties Rentable Sq. Ft. % Leased % of Value-Add Rentable Sq. Ft. % of Portfolio Rentable Sq. Ft. % of Value-Add NOI % of Portfolio NOI 1 Missouri 10 475,972 79.8% 9.94% 1.80% 39.19% 0.92% 2 Arkansas 6 231,303 72.2% 4.83% 0.88% 22.00% 0.51% 3 Tennessee 13 277,497 59.1% 5.79% 1.05% 20.88% 0.49% 4 California 12 257,370 75.1% 5.37% 0.98% 19.11% 0.45% 5 Pennsylvania 14 91,010 65.7% 1.90% 0.34% 15.33% 0.36% 6 Alabama 7 109,902 61.6% 2.29% 0.42% 13.70% 0.32% 7 Washington 10 107,204 65.7% 2.24% 0.41% 12.64% 0.30% 8 Nevada 1 148,070 72.4% 3.09% 0.56% 12.29% 0.29% 9 Illinois 6 124,942 57.4% 2.61% 0.47% 8.63% 0.20% 10 Georgia 15 175,950 57.0% 3.67% 0.67% 8.30% 0.19% 94 1,999,220 69.1% 41.73% 7.58% 172.07% 4.03% Held for Sale States Number of Properties Rentable Sq. Ft. % Leased % of HFS Rentable Sq. Ft. % of Portfolio Rentable Sq. Ft. % of HFS NOI % of Portfolio NOI 1 Missouri 3 786,110 87.7% 53.46% 2.98% 133.58% 3.41% 2 Texas 8 167,719 51.4% 11.41% 0.64% 6.77% 0.17% 3 Mississippi 2 32,869 59.3% 2.24% 0.12% 4.31% 0.11% 4 Illinois 4 61,719 52.0% 4.20% 0.23% 4.17% 0.11% 5 Alabama 4 22,062 29.8% 1.50% 0.08% 0.97% 0.02% 6 North Carolina 2 19,979 46.7% 1.36% 0.08% 0.60% 0.02% 7 South Carolina 1 11,075 51.2% 0.75% 0.04% 0.21% 0.01% 8 Georgia 9 83,155 33.8% 5.66% 0.32% (0.48%) (0.01%) 9 Kansas 1 16,742 62.0% 1.14% 0.06% (0.63%) (0.02%) 10 New York 1 2,619 0.0% 0.18% 0.01% (0.92%) (0.02%) 35 1,204,049 73.7% 81.90% 4.56% 148.58% 3.80% Land parcels are excluded from property totals. 1
 Gramercy Realty – Dispositions – Q3 36 Property Own. Zip Disposition Rentable Leased % Property Property Name Type Code Address City State Code Date SF SF Leased 3329 Madison Branch Own 400 W Base St Madison FL 32340 7/1/2009 10,415 10,415 100.0% 4320 Highway 90 West Branch Own 261 Highway 90 West DeFuniak Spring FL 32433 7/8/2009 8,176 8,176 100.0% 3677 Cherry & Mt Galliant Branch Own 2043 Cherry Road Rock Hill SC 29732 7/24/2009 3,190 - 5399 51st St (Western) Branch Own 5051 S. Lewis Tulsa OK 74105 7/27/2009 8,734 4,477 51.3% 3334 Perry Branch Own 200 W Main St Perry FL 32347 7/29/2009 12,860 6,560 51.0% 5347 Cranbury Rd Branch Own 591 Cranbury Road East Brunswick NJ 08816 7/31/2009 11,784 7,755 65.8% 4198 Washington Strt Branch Own 715 Washington Street Eden NC 27288 8/7/2009 4,032 - 3369 Hillside Branch Own 1221 Liberty Ave Hillside NJ 07205 8/18/2009 9,489 3,084 32.5% 3661 Sandy Plains Branch Own 3615 Sandy Plains Marietta GA 30066 9/11/2009 3,406 - 4144 Holly Hill Branch Own 201 Huffman Mill Road Burlington NC 27215 9/16/2009 2,859 2,859 100.0% 3203 Hampton Branch Own 2205 Executive Drive Hampton VA 23666 9/29/2009 3,500 - 2901 Alexander Old Town Branch Leased 325 S. Washington Street Alexandria VA 22314 9/30/2009 4,480 4,480 100.0% Total Number of Properties for Branch 12 82,925 47,806 57.6% 4263 Loop 323 Office Own 1000 WSW Loop 323 Tyler TX 75711 7/8/2009 12,367 6707 54.2% 4222 West 4th Avenue Office Own 2899 West 4th Ave Hialeah FL 33012 8/14/2009 10,515 5562 52.9% 4255 Decatur Office Own 116 N. Main Decatur TN 37322 9/14/2009 13,297 3993 30.0% 5272 Eustis Office Own 100 North Bay Street Eustis FL 32726 9/15/2009 16,907 7968 47.1% Total Number of Properties for Office 4 53,086 24,230 45.6% Total Number of Properties 16 136,011 72,036 53.0% For Dispositions between 7/1/2009 and 9/30/2009 Gramercy Realty Dispositions Report Date of Inventory 9/30/2009
 Glossary 37 Term Definition Annualized Base Rent The base rent , excluding Reimbursable Expenses and without Straightlining, required to be paid by a tenant under a lease during the most recently completed calendar quarter multiplied by four. Annualized Bas e Rent is computed without regard for scheduled rental increases , decreases or lease expirations, but does not include any amounts attributable to periods after a property is sold. For gross leases, Annualized Base Rent includes the entire amount paid by the tenant, including any portion that may be applied by the landlord to the payment of operating expenses. EBITDA Earnings before Interest, Taxes, Depreciation and Amortization equals Total Revenues (calculated on a GAAP basis, inclusive of the impa ct of straightlining of rents) less Operating Expenses. Funds From Operations (FFO) The revised White Paper on FFO approved by the Board of Governors of the National Association of Real Estate Investment Trusts, or NAREIT, in April 2002 defines FF O as net income (loss) (computed in accordance with GAAP, inclusive of the impact of straight line rents), excluding gains (or losses) from items which are not a recurring part of our busine ss, such as sales of properties, plus real estate - related deprecia tion and amortization and after adjustments for unconsolidated partnerships and joint ventures. We consider gains and losses on the sales of debt investments to be a normal part of our recurring operations and therefore include such gains and losses when arriving at FFO. GAAP Generally accepted accounting principles. Gross Revenue Annualized Base Rent p lus Reimbursable Expenses. LIBOR London Interbank Offered Rate. REIT Real estate investment trust. Reimbursable Expenses The am ount of operating expenses, real estate taxes and other charges incurred by the landlord that are required to be reimbursed by tenants under Base Year Leases and Triple Net Leases that do not require direct payment thereof by the tenants. Reimbursable Exp enses do not include operating expenses, real estate taxes or other charges directly incurred and paid by tenants under Bond Net Leases or Triple Net Leases that require direct payments by the tenant. Shedding Space The whole or partial termination of a le ase by a tenant pursuant to a contractual right set forth in the tenant’s lease, which termination typic ally becomes effective after a 6 0 day or longer notice period and often with nominal economic consideration paid to the landlord. Straightlining R ecognition of income or expense on a consistent basis throughout the term of the lease, regardless of when payments are actually due.
 Investor Information 38 RESEARCH COVERAGE - EQUITY Stephen Laws Deutsche Bank Securities, Inc. (212) 250 - 6219 David Fick Stifel Nicolaus & Company, Inc. (443) 224 - 1308 INVESTOR INFORMATION Transfer Agent The Bank of New York Mellon Corporation 480 Washing ton Blvd Jersey City, New Jersey 07310 Investor Inquiries Shareholders, prospective investors and analysts seeking information about the Company should direct their inquiries to: Director of Investor Relations Gramercy Capital Corp. 420 Lexington Avenue , Suite 1926 New York, NY 10170 212 - 297 - 1000 www.g k k .com This information is provided as a service to interested parties and not as an endorsement of any report, nor representati on as to the accuracy of any information contained therein. Opinions, forecasts and other forward - looking statements expressed in analysts’ reports may change without notice.
 Corporate Directory 39 General Counsel Edward J. Matey Jr. Officer Legal ef Chi Michael G. Kavourias Vice Presidents Executive Chief Financial Officer Jon W. Clark Chief Operating Officer Robert R. Foley President Timothy J. O’Connor Director, Investment Committee Chief Executive Officer Cozzi M. Roger Executive Officers New York, NY Clifford Chance US LLP Legal Counsel New York, NY Ernst & Young LLP Independent Auditors Forsyth Street Advisors, LLC President, Nominating and Corporate Governance Committee; Compensation Committee; Director; Audit Committee; Charles S. Laven Senior Partner and President, Konigsberg Wolf and Co., P.C. Nominating and Corporate Governance Committee; ctor; Audit Committee; Dire Paul J. Konigsberg Chief Executive Officer, KTR Capital Partners, LLC Investment Committee; Nominating and Corporate Governance Committee; Director; Compensation Committee; Jeffrey E. Kelter Chief Executive Officer, SL Green Realty Corp. t Committee , Investmen Director Marc Holliday Private Investor Compensation Committee; Director; Audit Committee; Allan J. Baum Officer Directors - Non Headquarters 420 Lexington Avenue, Suite 1926 New York, NY 10170 (212) 297 - 1000 (212) 297 - 1090 fax www.g k k .com