Supplemental First Quarter 2013
Forward - Looking Information/NOI and Cap Rate Disclaimers Cautionary Note Regarding Forward - Looking Information This investment presentation contains "forward - looking statements" based upon the Company's current best judgment and expectations . You can identify forward - looking statements by the use of forward - looking expressions such as “may,” “will,” “should,” “expect,” “believe,” “anticipate,” “estimate,” “intend,” “plan,” “project,” “continue,” or any negative or other variations on such expressions . Forward - looking statements include information concerning possible or assumed future results of the Company's operations, including any forecasts, projections, plans and objectives for future operations . Although the Company believes that its plans, intentions and expectations as reflected in or suggested by those forward - looking statements are reasonable, the Company can give no assurance that the plans, intentions or expectations will be achieved . The Company has listed below some important risks, uncertainties and contingencies which could cause its actual results, performance or achievements to be materially different from the forward - looking statements it makes in this presentation . These risks, uncertainties and contingencies include, but are not limited to, the following : the success or failure of the Company's efforts to implement its Company's current business strategy ; the Company's ability to identify and complete additional property acquisitions and risks of real estate acquisitions ; availability of investment opportunities on real estate assets and real estate - related and other securities ; the performance and financial condition of tenants and corporate customers ; the adequacy of the Company's cash reserves, working capital and other forms of liquidity ; the availability, terms and deployment of short - term and long - term capital ; demand for office and industrial space ; the actions of the Company's competitors and ability to respond to those actions ; the timing of cash flows from the Company's investments ; the cost and availability of the Company's financings, which depends in part on the Company's asset quality, the nature of the Company's relationships with its lenders and other capital providers, the Company's business prospects and outlook and general market conditions ; the continuity of the management agreement for the KBS portfolio ; economic conditions generally and in the real estate markets and the capital markets specifically ; unanticipated increases in financing and other costs, including a rise in interest rates ; the Company's ability to maintain its current relationships with financial institutions and to establish new relationships with additional financial institutions ; the Company's ability to profitably dispose of non - core assets ; availability of, and ability to retain, qualified personnel and directors ; changes to the Company's management and board of directors ; changes in governmental regulations, tax rates and similar matters ; legislative and regulatory changes (including changes to laws governing the taxation of REITs or the exemptions from registration as an investment company) ; environmental and/or safety requirements ; the Company's ability to satisfy complex rules in order for it to qualify as a REIT, for federal income tax purposes, the Company's operating partnership’s ability to satisfy the rules in order for it to qualify as a partnership for federal income tax purposes, and the ability of certain of the Company's subsidiaries to qualify as REITs and certain of the Company's subsidiaries to qualify as TRSs for federal income tax purposes, and the Company's ability and the ability of its subsidiaries to operate effectively within the limitations imposed by these rules ; the continuing threat of terrorist attacks on the national, regional and local economies ; and other factors discussed under Item 1 A, “Risk Factors” of the Company's Annual Report on Form 10 - K for the year ended December 31 , 2012 . The Company assumes no obligation to update publicly any forward - looking statements, whether as a result of new information, future events, or otherwise . In evaluating forward - looking statements, you should consider these risks and uncertainties, together with the other risks described from time - to - time in the Company's reports and documents which are filed with the SEC, and you should not place undue reliance on those statements . The risks included here are not exhaustive . Other sections of this report may include additional factors that could adversely affect the Company's business and financial performance . Moreover, the Company operates in a very competitive and rapidly changing environment . New risk factors emerge from time to time and it is not possible for management to predict all such risk factors, nor can it assess the impact of all such risk factors on the Company's business or the extent to which any factor, or combination of factors, may cause actual results to differ materially from those contained in any forward - looking statements . Given these risks and uncertainties, investors should not place undue reliance on forward - looking statements as a prediction of actual results . NOI Disclaimer Net operating income is a non - GAAP financial measure that represents property revenues on a straight - lined basis minus property expenses before interest and capital reserves/expenditures . The NOI assumption included in this presentation reflects the Company's assumptions and expectations which are not guarantees of its future performance . The Company's actual NOI may vary materially from the assumptions presented in this presentation . The results that an investor in the Company will actually receive will depend, to a significant degree, on the actual performance of the Company's assets, which may be impacted by material economic and market risk factors . Cap Rate Disclaimer A rate of return on a real estate investment property based on the expected, straight - lined income that the property will generate . Capitalization rate is used to estimate the Company’s potential return on its investment . This is done by dividing the income the property will generate (before debt service and depreciation and after fixed costs and variable costs) by the acquisition price of the property . 2
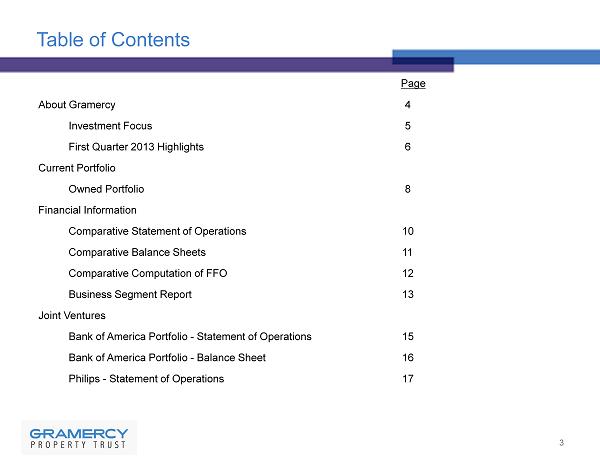
Table of Contents Page About Gramercy 4 Investment Focus 5 First Quarter 2013 Highlights 6 Current Portfolio Owned Portfolio 8 Financial Information Comparative Statement of Operations 10 Comparative Balance Sheets 11 Comparative Computation of FFO 12 Business Segment Report 13 Joint Ventures Bank of America Portfolio - Statement of Operations 15 Bank of America Portfolio - Balance Sheet 16 Philips - Statement of Operations 17 3

Gramercy Property Trust Gramercy Property Trust Inc . (NYSE : GPT) is a self - managed, integrated commercial real estate investment and asset management company . The Company owns, directly or in joint ventures, 108 buildings totaling approximately 4 . 1 million square feet of office and 1 . 5 million square feet of industrial, net leased on a long - term basis to tenants, including Bank of America, Nestlé Waters, Philips Electronics and others . The Company’s property management business, operating under the name Gramercy Asset Management, currently manages for third - parties, approximately $ 1 . 9 billion of commercial properties leased primarily to regulated financial institutions and affiliated users throughout the United States . The Company is headquartered in New York City and has regional offices in Jenkintown, Pennsylvania, and St . Louis, Missouri . In March 2013 , the Company disposed of its Gramercy Finance segment and exited the commercial real estate finance business . The sale was completed pursuant a purchase and sale agreement to transfer the collateral management and sub - special servicing agreements for the Company’s three Collateralized Debt Obligations, or CDOs, to CWCapital Investments LLC for net proceeds of approximately $ 6 . 3 million . In February 2013 , the Company also sold a portfolio of repurchased notes previously issued by two of its three CDOs, generating cash proceeds of approximately $ 34 . 4 million . In addition, the Company expects to receive additional cash proceeds for past servicing advances of approximately $ 14 . 5 million, when specific assets within the CDOs are liquidated . The exit from the commercial real estate finance business achieved a number of important objectives, including, ( i ) maximizing the value of the servicing business through the sale to a large servicing operation ; (ii) simplifying the Company’s going - forward business and significantly reducing its ongoing management, general and administrative expenses through elimination of CDO related personnel costs and servicing advance requirements ; (iii) generating in excess of $ 50 . 0 million in liquidity previously invested in the CDO business ; and (iv) providing for potential future proceeds through Retained CDO Bonds . To review the Company’s latest news releases and other corporate documents, please visit the Company's website at www . gptreit . com or contact Investor Relations at 212 - 297 - 1000 . 4

Investment Focus The Company’s principal business is to acquire and manage industrial and office properties, net leased to high quality tenants in target markets throughout the United States. • Average lease term > 10 years • Properties critical to tenant operations • Top 50 major markets • Focus on contract rent versus market rent • Prudent use of leverage – target leverage of 50% - 55% - With expected current borrowing rates of 3.0% - 4.75% - Stagger maturities • Cap Rates – 7.0% - 9.0% straight - lined 5 *See last page for definition of ROE and certain disclaimers.

First Quarter 2013 Highlights ▪ Completed the sale to transfer the collateral management and sub - special servicing agreements for the Company’s three CDOs, to CWCapital , for approximately $6.3 million in cash, after expenses. ▪ Acquired two industrial buildings and one truck terminal containing approximately 985,000 square feet for a total purchase price of approximately $47.0 million. ▪ Ended the first quarter of 2013 with cash and cash equivalents of $100.5 million as compared to $105.5 million reported at the end of the prior quarter. ▪ First quarter 2013 Acquisitions: ▪ Acquisitions subsequent to March 31, 2013 to date: 6 Number of Buildings Industrial Olive Branch, Mississippi Memphis, TN 3/11/2013 1 605,000 Industrial Garland, Texas Dallas, TX 3/19/2013 1 342,000 Truck Terminal East Brunswick, New Jersey New York , NY 3/28/2013 1 101-door Total 3 947,000 Square FeetProperty Type Location Acquisition Date MSA Number of MSA Buildings Truck Terminal Atlanta, Georgia Atlanta, GA 5/6/2013 1 178-door Square FeetProperty Type Location Acquisition Date
7 Current Portfolio
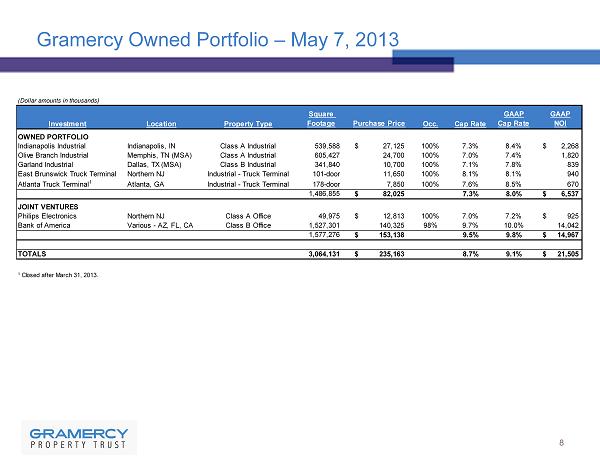
Gramercy Owned Portfolio – May 7, 2013 8 (Dollar amounts in thousands) Investment Location Property Type Square Footage Purchase Price Occ. Cap Rate GAAP Cap Rate GAAP NOI OWNED PORTFOLIO Indianapolis Industrial Indianapolis, IN IN Class A Industrial industrial539,588 27,125$ 100% 7.3% 8.4% 2,268$ Olive Branch Industrial Memphis, TN (MSA) TN Class A Industrial industrial605,427 24,700 100% 7.0% 7.4% 1,820 Garland Industrial Dallas, TX (MSA) TX Class B Industrial industrial341,840 10,700 100% 7.1% 7.8% 839 East Brunswick Truck Terminal Northern NJ NJIndustrial - Truck Terminal truck terminal101-door 11,650 100% 8.1% 8.1% 940 Atlanta Truck Terminal 1 Atlanta, GA PAIndustrial - Truck Terminal industrial178-door 7,850 100% 7.6% 8.5% 670 1,486,855 82,025$ 7.3% 8.0% 6,537$ JOINT VENTURES Philips Electronics Northern NJ NJ Class A Office office 49,975 12,813$ 100% 7.0% 7.2% 925$ Bank of America Various - AZ, FL, CA VariousClass B Office office1,527,301 140,325 98% 9.7% 10.0% 14,042 1,577,276 153,138$ 9.5% 9.8% 14,967$ TOTALS 3,064,131 235,163$ 8.7% 9.1% 21,505$ 1 Closed after March 31, 2013.
9 Financial Information
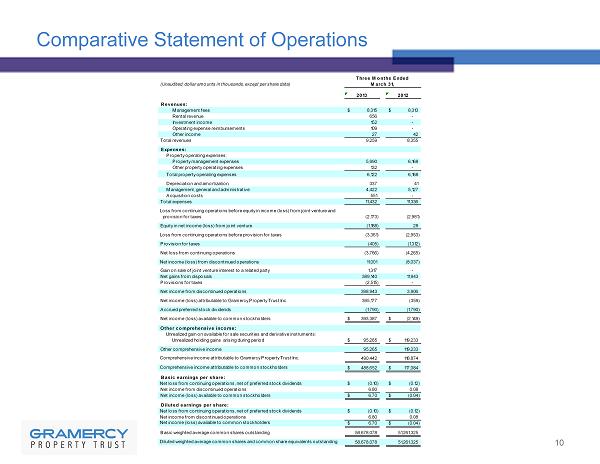
Comparative Statement of Operations 10 (Unaudited, dollar amounts in thousands, except per share data) 2013 2012 Revenues: Management fees 8,315$ 8,313$ Rental revenue 656 - Investment income 152 - Operating expense reimbursements 109 - Other income 27 42 Total revenues 9,259 8,355 Expenses: Property operating expenses: Property management expenses 5,990 6,168 Other property operating expenses 132 - Total property operating expenses 6,122 6,168 Depreciation and amortization 337 41 Management, general and administrative 4,422 5,127 Acquisition costs 551 - Total expenses 11,432 11,336 Loss from continuing operations before equity in income (loss) from joint venture and provision for taxes (2,173) (2,981) Equity in net income (loss) from joint venture (1,188) 28 Loss from continuing operations before provision for taxes (3,361) (2,953) Provision for taxes (405) (1,312) Net loss from continuing operations (3,766) (4,265) Net income (loss) from discontinued operations 11,001 (8,037) Gain on sale of joint venture interest to a related party 1,317 - Net gains from disposals 389,140 11,943 Provisions for taxes (2,515) - Net income from discontinued operations 398,943 3,906 Net income (loss) attributable to Gramercy Property Trust Inc. 395,177 (359) Accrued preferred stock dividends (1,790) (1,790) Net income (loss) available to common stockholders 393,387$ (2,149)$ Other comprehensive income: Unrealized gain on available for sale securities and derivative instruments: Unrealized holding gains arising during period 95,265$ 119,233$ Other comprehensive income 95,265 119,233 Comprehensive income attributable to Gramercy Property Trust Inc. 490,442 118,874 Comprehensive income attributable to common stockholders 488,652$ 117,084$ Basic earnings per share: Net loss from continuing operations, net of preferred stock dividends (0.10)$ (0.12)$ Net income from discontinued operations 6.80 0.08 Net income (loss) available to common stockholders 6.70$ (0.04)$ Diluted earnings per share: Net loss from continuing operations, net of preferred stock dividends (0.10)$ (0.12)$ Net income from discontinued operations 6.80 0.08 Net income (loss) available to common stockholders 6.70$ (0.04)$ Basic weighted average common shares outstanding 58,678,078 51,261,325 Diluted weighted average common shares and common share equivalents outstanding 58,678,078 51,261,325 Three Months Ended March 31,
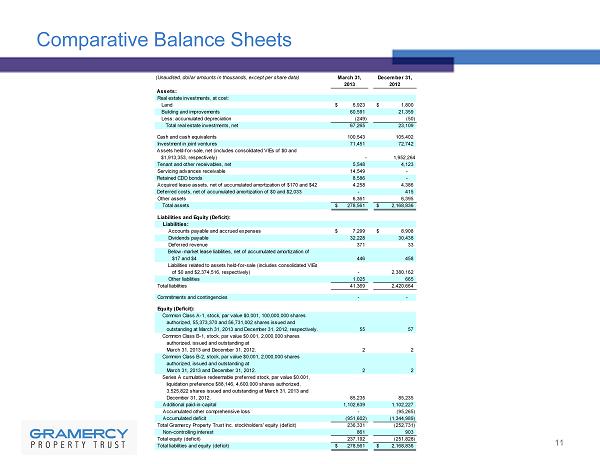
Comparative Balance Sheets 11 (Unaudited, dollar amounts in thousands, except per share data) March 31, December 31, 2013 2012 Assets: Real estate investments, at cost: Land 6,923$ 1,800$ Building and improvements 60,591 21,359 Less: accumulated depreciation (249) (50) Total real estate investments, net 67,265 23,109 Cash and cash equivalents 100,543 105,402 Investment in joint ventures 71,451 72,742 Assets held-for-sale, net (includes consolidated VIEs of $0 and $1,913,353, respectively) - 1,952,264 Tenant and other receivables, net 5,548 4,123 Servicing advances receivable 14,549 - Retained CDO bonds 8,586 - Acquired lease assets, net of accumulated amortization of $170 and $42 4,258 4,386 Deferred costs, net of accumulated amortization of $0 and $2,033 - 415 Other assets 6,361 6,395 Total assets 278,561$ 2,168,836$ Liabilities and Equity (Deficit): Liabilities: Accounts payable and accrued expenses 7,299$ 8,908$ Dividends payable 32,228 30,438 Deferred revenue 371 33 Below-market lease liabilities, net of accumulated amortization of $17 and $4 446 458 Liabilities related to assets held-for-sale (includes consolidated VIEs of $0 and $2,374,516, respectively) - 2,380,162 Other liabilities 1,025 665 Total liabilities 41,369 2,420,664 Commitments and contingencies - - Equity (Deficit): Common Class A-1, stock, par value $0.001, 100,000,000 shares authorized, 55,373,370 and 56,731,002 shares issued and outstanding at March 31, 2013 and December 31, 2012, respectively. 55 57 Common Class B-1, stock, par value $0.001, 2,000,000 shares authorized, issued and outstanding at March 31, 2013 and December 31, 2012. 2 2 Common Class B-2, stock, par value $0.001, 2,000,000 shares authorized, issued and outstanding at March 31, 2013 and December 31, 2012. 2 2 Series A cumulative redeemable preferred stock, par value $0.001, liquidation preference $88,146, 4,600,000 shares authorized, 3,525,822 shares issued and outstanding at March 31, 2013 and December 31, 2012. 85,235 85,235 Additional paid-in-capital 1,102,639 1,102,227 Accumulated other comprehensive loss - (95,265) Accumulated deficit (951,602) (1,344,989) Total Gramercy Property Trust Inc. stockholders' equity (deficit) 236,331 (252,731) Non-controlling interest 861 903 Total equity (deficit) 237,192 (251,828) Total liabilities and equity (deficit) 278,561$ 2,168,836$
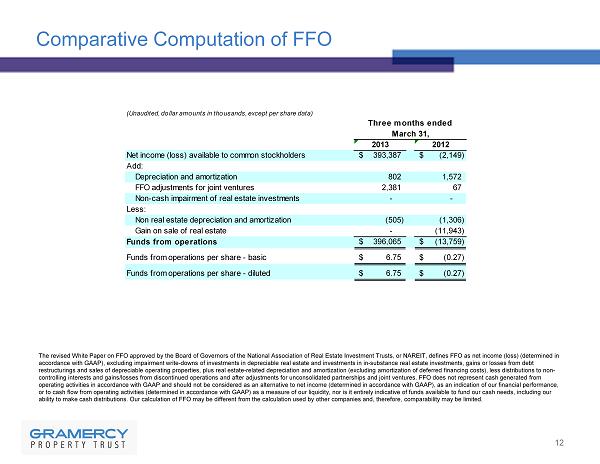
Comparative Computation of FFO 12 (Unaudited, dollar amounts in thousands, except per share data) Three months ended March 31, 2013 2012 Net income (loss) available to common stockholders 393,387$ (2,149)$ Add: Depreciation and amortization 802 1,572 FFO adjustments for joint ventures 2,381 67 Non-cash impairment of real estate investments - - Less: Non real estate depreciation and amortization (505) (1,306) Gain on sale of real estate - (11,943) Funds from operations 396,065$ (13,759)$ Funds from operations per share - basic 6.75$ (0.27)$ Funds from operations per share - diluted 6.75$ (0.27)$ The revised White Paper on FFO approved by the Board of Governors of the National Association of Real Estate Investment Trust s, or NAREIT, defines FFO as net income (loss) (determined in accordance with GAAP), excluding impairment write - downs of investments in depreciable real estate and investments in in - substanc e real estate investments, gains or losses from debt restructurings and sales of depreciable operating properties, plus real estate - related depreciation and amortization (excluding amortization of deferred financing costs), less distributions to non - controlling interests and gains/losses from discontinued operations and after adjustments for unconsolidated partnerships and jo int ventures. FFO does not represent cash generated from operating activities in accordance with GAAP and should not be considered as an alternative to net income (determined in acco rda nce with GAAP), as an indication of our financial performance, or to cash flow from operating activities (determined in accordance with GAAP) as a measure of our liquidity, nor is it entir ely indicative of funds available to fund our cash needs, including our ability to make cash distributions. Our calculation of FFO may be different from the calculation used by other companies and, th erefore, comparability may be limited .
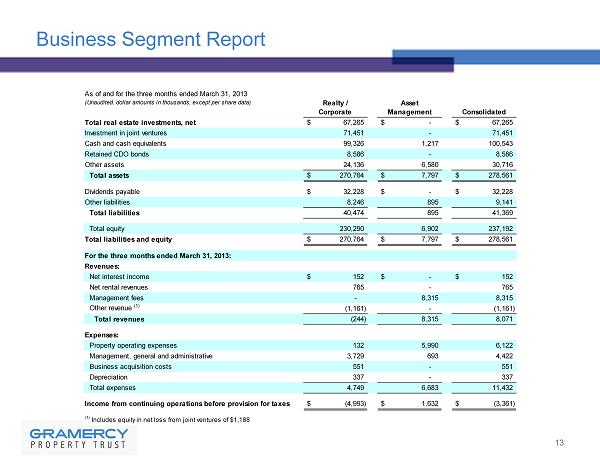
Business Segment Report 13 As of and for the three months ended March 31, 2013 (Unaudited, dollar amounts in thousands, except per share data) Total real estate investments, net $ 67,265 $ - $ 67,265 Investment in joint ventures 71,451 - 71,451 Cash and cash equivalents 99,326 1,217 100,543 Retained CDO bonds 8,586 - 8,586 Other assets 24,136 6,580 30,716 Total assets $ 270,764 $ 7,797 $ 278,561 Dividends payable $ 32,228 $ - $ 32,228 Other liabilities 8,246 895 9,141 Total liabilities 40,474 895 41,369 Total equity 230,290 6,902 237,192 Total liabilities and equity $ 270,764 $ 7,797 $ 278,561 For the three months ended March 31, 2013: Revenues: Net interest income $ 152 $ - $ 152 Net rental revenues 765 - 765 Management fees - 8,315 8,315 Other revenue (1) (1,161) - (1,161) Total revenues (244) 8,315 8,071 Expenses: Property operating expenses 132 5,990 6,122 Management, general and administrative 3,729 693 4,422 Business acquisition costs 551 - 551 Depreciation 337 - 337 Total expenses 4,749 6,683 11,432 Income from continuing operations before provision for taxes $ (4,993) $ 1,632 $ (3,361) (1) Includes equity in net loss from joint ventures of $1,188 Realty / Corporate Asset Management Consolidated
14 Joint Ventures
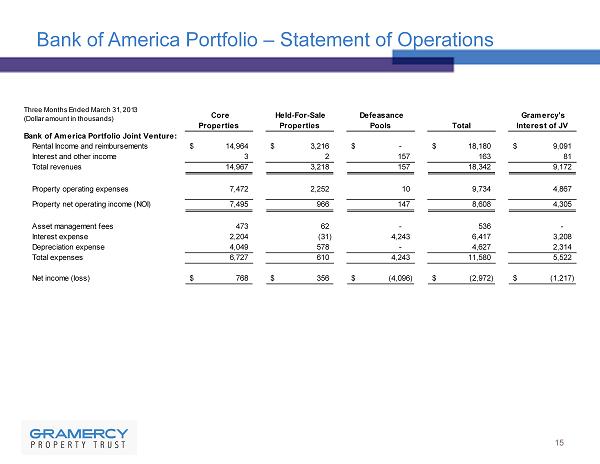
Bank of America Portfolio – Statement of Operations 15 Three Months Ended March 31, 2013 (Dollar amount in thousands) Bank of America Portfolio Joint Venture: Rental Income and reimbursements $ 14,964 $ 3,216 $ - $ 18,180 $ 9,091 Interest and other income 3 2 157 163 81 Total revenues 14,967 3,218 157 18,342 9,172 Property operating expenses 7,472 2,252 10 9,734 4,867 Property net operating income (NOI) 7,495 966 147 8,608 4,305 Asset management fees 473 62 - 536 - Interest expense 2,204 (31) 4,243 6,417 3,208 Depreciation expense 4,049 578 - 4,627 2,314 Total expenses 6,727 610 4,243 11,580 5,522 Net income (loss) $ 768 $ 356 $ (4,096) $ (2,972) $ (1,217) Core Properties Held-For-Sale Properties Defeasance Pools Total Gramercy's Interest of JV

Bank of America Portfolio - Balance Sheet 16 March 31, 2013 (Unaudited, dollar amounts in thousands) Assets Real estate investments, at cost: Land $ 62,974 $ 12,547 $ - $ 75,521 Building and improvements 197,010 37,448 - 234,458 Less: accumulated depreciation (3,659) (341) - (4,000) Total real estate investments, net 256,325 49,654 - 305,979 Cash and cash equivalents 17,088 2,406 6,809 26,303 Restricted cash 4,725 362 764 5,850 Pledged government securities - - 314,168 314,168 Tenant and other receivables, net 3,155 862 - 4,018 Acquired lease assets, net of accumulated amortization 52,335 9,417 - 61,752 Deferred costs, net of accumulated amortization 1,943 8 24 1,974 Other assets 8,156 2,997 213 11,366 Total assets $ 343,726 $ 65,706 $ 321,978 $ 731,410 Liabilities and Equity: Liabilities: Mortgage notes payable $ 200,000 - 308,650 508,650 Accounts payable and accrued expenses 10,310 4,452 83 14,845 Accrued interest payable 411 - 1,453 1,864 Deferred revenue 6,356 1,329 - 7,685 Below market lease liabilities, net of accumulated amortization 47,164 9,681 - 56,845 Derivative instruments, at fair value 51 - - 51 Total liabilities 264,293 15,462 310,186 589,941 Equity: Equity - Gramercy Property Trust 40,488 25,122 5,896 71,506 Equity - Garrison 38,988 25,122 5,896 70,006 Accumulated other comprehensive loss (43) - - (43) Total equity 79,433 50,244 11,792 141,469 Total liabilities and equity $ 343,726 $ 65,706 $ 321,978 $ 731,410 Core Properties Held-For-Sale Properties Defeasance Pools Total $ $ $

Philips – Statement of Operations 17 Three Months Ended March 31, 2013 (Unaudited, dollar amounst in thousands) Philips Building Joint Venture: Rental Income and reimbursements $ 914 $ 229 Interest and other income - - Total revenues 914 229 Property operating expenses 1 - Property net operating income (NOI) 913 229 Asset management fees - - Interest expense 522 130 Depreciation expense 270 68 Total expenses 792 198 Net income (loss) $ 121 $ 31 Total Gramercy's Interest of JV