Annual Shareholder Meeting June 25, 2013
Forward - Looking Information/NOI and Cap Rate Disclaimers Cautionary Note Regarding Forward - Looking Information This investment presentation contains "forward - looking statements" based upon the Company's current best judgment and expectations . You can identify forward - looking statements by the use of forward - looking expressions such as “may,” “will,” “should,” “expect,” “believe,” “anticipate,” “estimate,” “intend,” “plan,” “project,” “continue,” or any negative or other variations on such expressions . Forward - looking statements include information concerning possible or assumed future results of the Company's operations, including any forecasts, projections, plans and objectives for future operations . Although the Company believes that its plans, intentions and expectations as reflected in or suggested by those forward - looking statements are reasonable, the Company can give no assurance that the plans, intentions or expectations will be achieved . The Company has listed below some important risks, uncertainties and contingencies which could cause its actual results, performance or achievements to be materially different from the forward - looking statements it makes in this presentation . These risks, uncertainties and contingencies include, but are not limited to, the following : the success or failure of the Company's efforts to implement its Company's current business strategy ; the Company's ability to identify and complete additional property acquisitions and risks of real estate acquisitions ; availability of investment opportunities on real estate assets and real estate - related and other securities ; the performance and financial condition of tenants and corporate customers ; the adequacy of the Company's cash reserves, working capital and other forms of liquidity ; the availability, terms and deployment of short - term and long - term capital ; demand for office and industrial space ; the actions of the Company's competitors and ability to respond to those actions ; the timing of cash flows from the Company's investments ; the cost and availability of the Company's financings, which depends in part on the Company's asset quality, the nature of the Company's relationships with its lenders and other capital providers, the Company's business prospects and outlook and general market conditions ; the continuity of the management agreement for the KBS portfolio ; economic conditions generally and in the real estate markets and the capital markets specifically ; unanticipated increases in financing and other costs, including a rise in interest rates ; the Company's ability to maintain its current relationships with financial institutions and to establish new relationships with additional financial institutions ; the Company's ability to profitably dispose of non - core assets ; availability of, and ability to retain, qualified personnel and directors ; changes to the Company's management and board of directors ; changes in governmental regulations, tax rates and similar matters ; legislative and regulatory changes (including changes to laws governing the taxation of REITs or the exemptions from registration as an investment company) ; environmental and/or safety requirements ; the Company's ability to satisfy complex rules in order for it to qualify as a REIT, for federal income tax purposes, the Company's operating partnership’s ability to satisfy the rules in order for it to qualify as a partnership for federal income tax purposes, and the ability of certain of the Company's subsidiaries to qualify as REITs and certain of the Company's subsidiaries to qualify as TRSs for federal income tax purposes, and the Company's ability and the ability of its subsidiaries to operate effectively within the limitations imposed by these rules ; the continuing threat of terrorist attacks on the national, regional and local economies ; and other factors discussed under Item 1 A, “Risk Factors” of the Company's Annual Report on Form 10 - K for the year ended December 31 , 2012 . The Company assumes no obligation to update publicly any forward - looking statements, whether as a result of new information, future events, or otherwise . In evaluating forward - looking statements, you should consider these risks and uncertainties, together with the other risks described from time - to - time in the Company's reports and documents which are filed with the SEC, and you should not place undue reliance on those statements . The risks included here are not exhaustive . Other sections of this report may include additional factors that could adversely affect the Company's business and financial performance . Moreover, the Company operates in a very competitive and rapidly changing environment . New risk factors emerge from time to time and it is not possible for management to predict all such risk factors, nor can it assess the impact of all such risk factors on the Company's business or the extent to which any factor, or combination of factors, may cause actual results to differ materially from those contained in any forward - looking statements . Given these risks and uncertainties, investors should not place undue reliance on forward - looking statements as a prediction of actual results . NOI Disclaimer Net operating income is a non - GAAP financial measure that represents property revenues on a straight - lined basis minus property expenses before interest and capital reserves/expenditures . The NOI assumption included in this presentation reflects the Company's assumptions and expectations which are not guarantees of its future performance . The Company's actual NOI may vary materially from the assumptions presented in this presentation . The results that an investor in the Company will actually receive will depend, to a significant degree, on the actual performance of the Company's assets, which may be impacted by material economic and market risk factors . Cap Rate Disclaimer A rate of return on a real estate investment property based on the expected, straight - lined income that the property will generate . Capitalization rate is used to estimate the Company’s potential return on its investment . This is done by dividing the income the property will generate (before debt service and depreciation and after fixed costs and variable costs) by the acquisition price of the property . 2
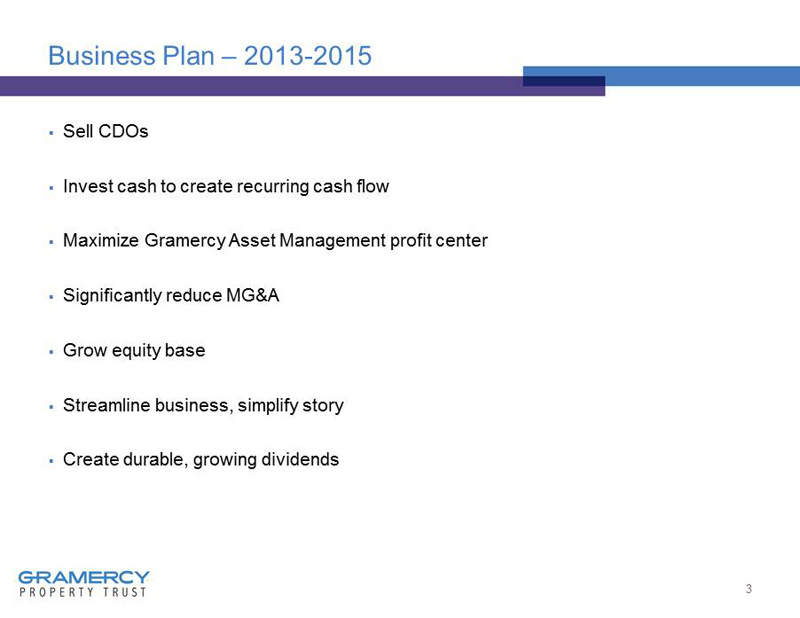
Business Plan – 2013 - 2015 ▪ Sell CDOs ▪ Invest cash to create recurring cash flow ▪ Maximize Gramercy Asset Management profit center ▪ Significantly reduce MG&A ▪ Grow equity base ▪ Streamline business, simplify story ▪ Create durable, growing dividends 3
Gramercy Property Trust ▪ March 2013 – CDOs sold ▪ April 15, 2013 ▪ Changed name to reflect business as pure play equity REIT ▪ Changed NYSE ticker to “GPT” from “GKK” 4
5 Investment Update

Target Markets Acquire primarily office and industrial properties in “Target Markets” with strong demographic, economic growth and high quality infrastructure 6 Investment Update Target Markets • Atlanta • Austin • Baltimore/DC • Central PA • Charlotte • Chicago • Cincinnati • Dallas • Denver • Houston • Indianapolis • Jacksonville • Kansas City • LA/Inland Empire • Memphis • Miami • Nashville • New York/ Northern New Jersey • Philadelphia • Phoenix • Salt Lake City • Savannah • Seattle • S.F./Bay Area • Tampa/Orlando
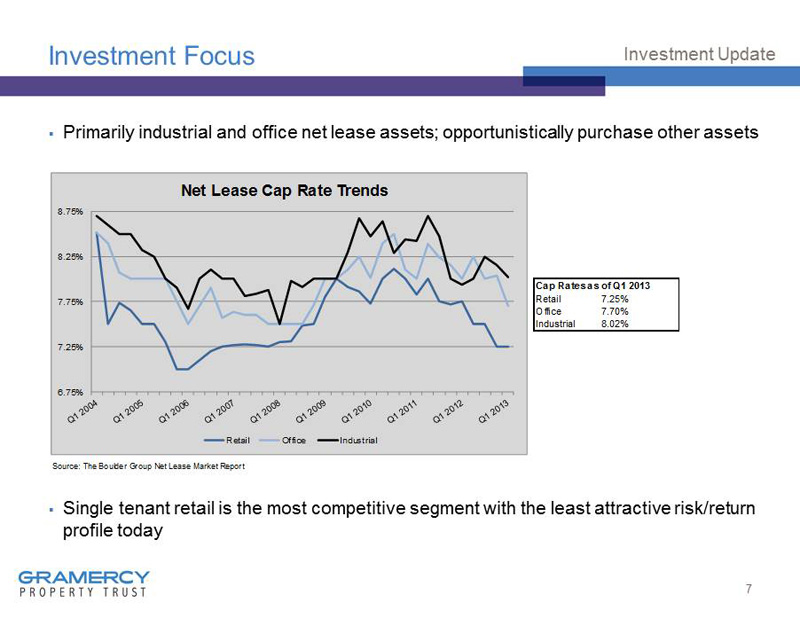
Investment Focus ▪ Primarily industrial and office net lease assets; opportunistically purchase other assets ▪ Single tenant retail is the most competitive segment with the least attractive risk/return profile today 7 Investment Update Cap Rates as of Q1 2013 Retail 7.25% Office 7.70% Industrial 8.02% Source: The Boulder Group Net Lease Market Report 6.75% 7.25% 7.75% 8.25% 8.75% Net Lease Cap Rate Trends Retail Office Industrial
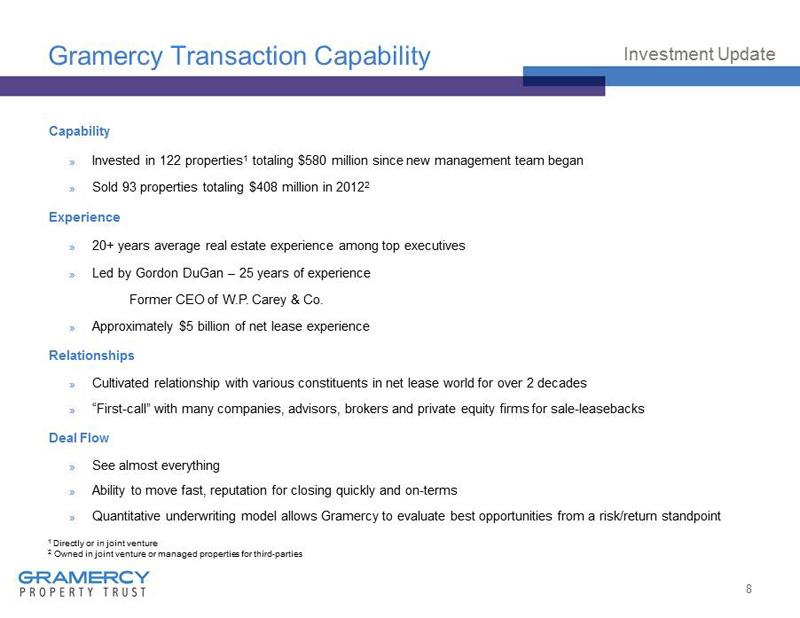
Gramercy Transaction Capability Capability » Invested in 122 properties 1 totaling $ 580 million since new management team began » Sold 93 properties totaling $408 million in 2012 2 Experience » 20+ years average real estate experience among top executives » Led by Gordon DuGan – 25 years of experience Former CEO of W.P. Carey & Co. » Approximately $5 billion of net lease experience Relationships » Cultivated relationship with various constituents in net lease world for over 2 decades » “First - call” with many companies, advisors, brokers and private equity firms for sale - leasebacks Deal Flow » See almost everything » Ability to move fast, reputation for closing quickly and on - terms » Quantitative underwriting model allows Gramercy to evaluate best opportunities from a risk/return standpoint 8 Investment Update 1 Directly or in joint venture 2 Owned in joint venture or managed properties for third - parties
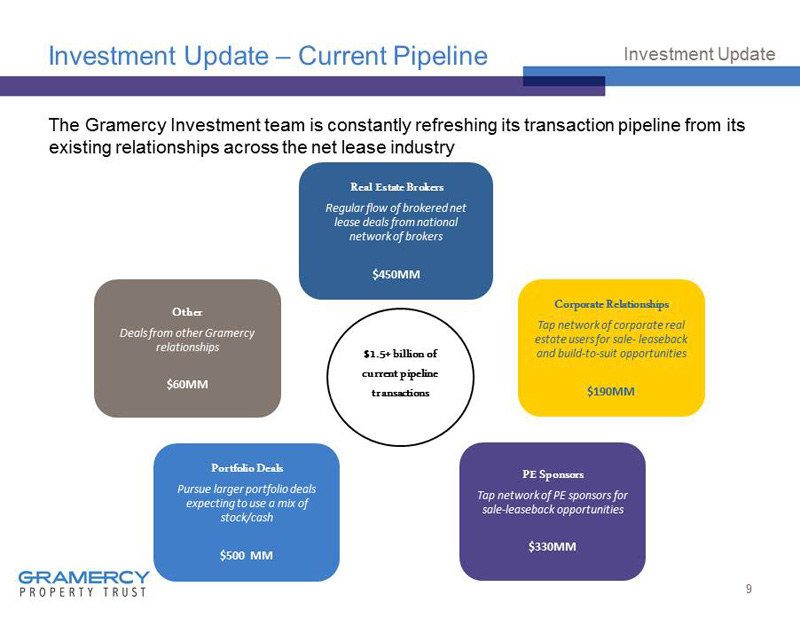
Investment Update – Current Pipeline The Gramercy Investment team is constantly refreshing its transaction pipeline from its existing relationships across the net lease industry 9 Investment Update Real Estate Brokers Regular flow of brokered net lease deals from national network of brokers $450MM Corporate Relationships Tap network of corporate real estate users for sale - leaseback and build - to - suit opportunities $190MM Other Deals from other Gramercy relationships $60MM Portfolio Deals Pursue larger portfolio deals expecting to use a mix of stock/cash $500 MM PE Sponsors Tap network of PE sponsors for sale - leaseback opportunities $330MM $1.5+ billion of current pipeline transactions
Gramercy Disciplined Underwriting » Reviewed > $5 billion » Activity > $2 billion, >100 transactions » Closed * - 7 transactions, 122 properties, $580 million > 50% of investment volume was sourced “off - market” 10 Investment Update * Closed as of May 6, 2013.
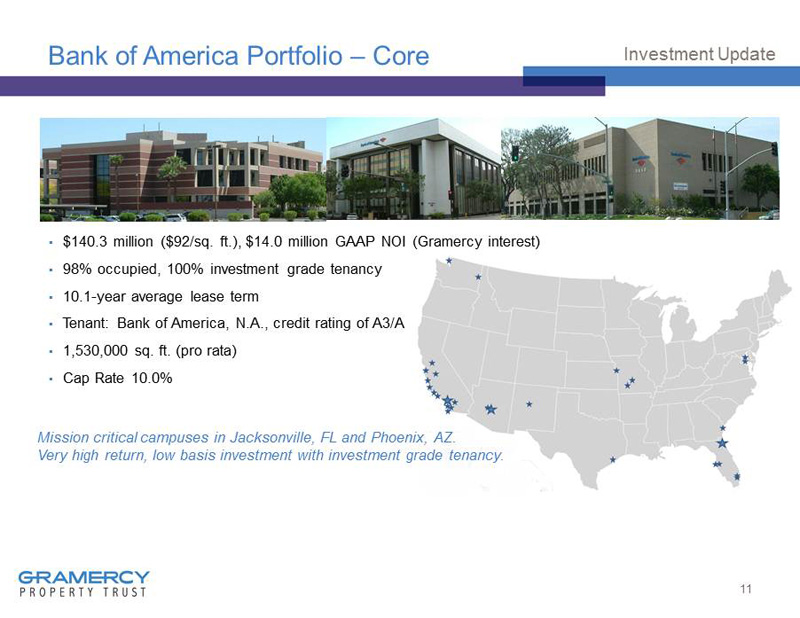
Bank of America Portfolio – Core ▪ $140.3 million ($92/sq. ft.), $14.0 million GAAP NOI (Gramercy interest) ▪ 98% occupied, 100% investment grade tenancy ▪ 10.1 - year average lease term ▪ Tenant: Bank of America, N.A., credit rating of A 3/A ▪ 1,530,000 sq. ft. (pro rata) ▪ Cap Rate 10.0% 11 Investment Update Mission critical campuses in Jacksonville, FL and Phoenix, AZ . Very high return, low basis investment with investment grade tenancy .
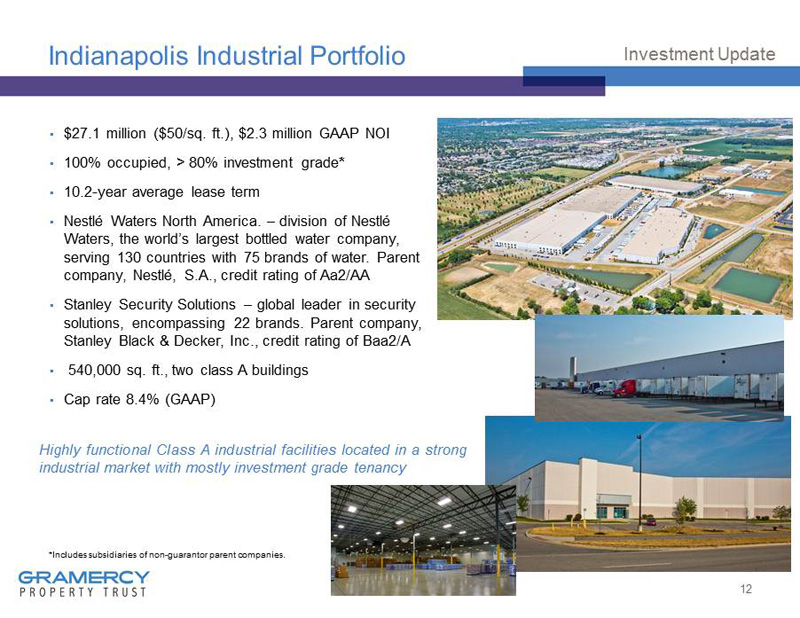
Indianapolis Industrial Portfolio ▪ $27.1 million ($50/sq. ft.), $2.3 million GAAP NOI ▪ 100 % occupied, > 80% investment grade * ▪ 10.2 - year average lease term ▪ Nestlé Waters North America. – division of Nestlé Waters, the world’s largest bottled water company, serving 130 countries with 75 brands of water. Parent company, Nestlé, S.A., credit rating of Aa2/AA ▪ Stanley Security Solutions – global leader in security solutions, encompassing 22 brands. Parent company, Stanley Black & Decker, Inc., credit rating of Baa2/A ▪ 540,000 sq. ft., two class A buildings ▪ Cap rate 8.4% (GAAP) 12 Investment Update *Includes subsidiaries of non - guarantor parent companies . Highly functional Class A industrial facilities located in a strong industrial market with mostly investment grade tenancy
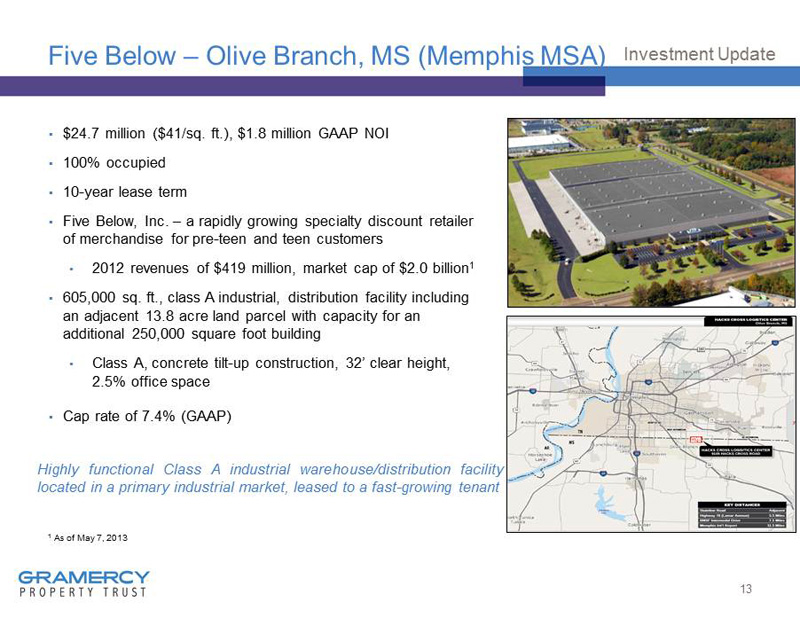
Five Below – Olive Branch, MS (Memphis MSA) ▪ $24.7 million ($ 41/sq . ft .), $1.8 million GAAP NOI ▪ 100 % occupied ▪ 10 - year lease term ▪ Five Below, Inc. – a rapidly growing specialty discount retailer of merchandise for pre - teen and teen customers • 2012 revenues of $419 million, market cap of $2.0 billion 1 ▪ 605,000 sq. ft., class A industrial, distribution facility including an adjacent 13.8 acre land parcel with capacity for an additional 250,000 square foot building • Class A, concrete tilt - up construction, 32’ clear height, 2.5% office space ▪ Cap rate of 7.4% (GAAP) 13 Investment Update Highly functional Class A industrial warehouse/distribution facility located in a primary industrial market, leased to a fast - growing tenant 1 As of May 7, 2013
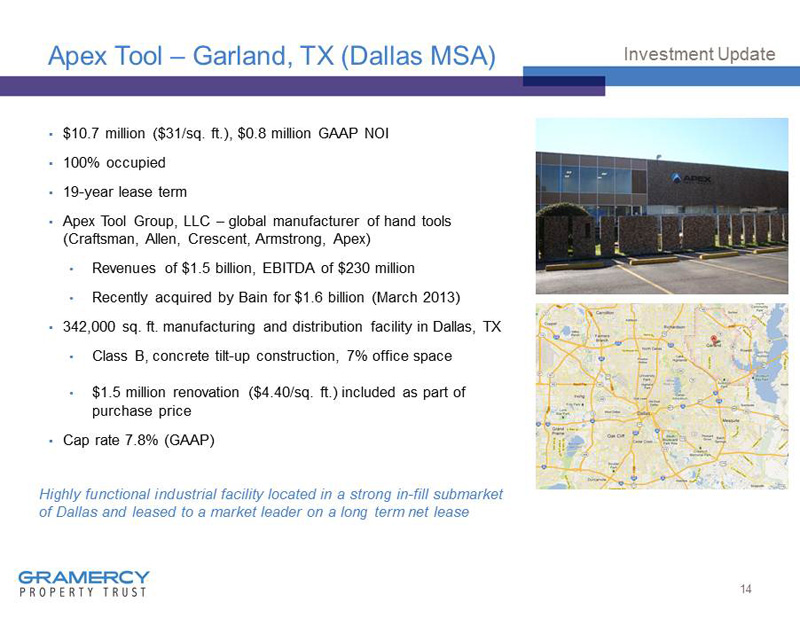
Apex Tool – Garland, TX (Dallas MSA) ▪ $10.7 million ($31/sq. ft.), $0.8 million GAAP NOI ▪ 100% occupied ▪ 19 - year lease term ▪ Apex Tool Group, LLC – global manufacturer of hand tools (Craftsman, Allen, Crescent, Armstrong, Apex) • Revenues of $1.5 billion, EBITDA of $230 million • Recently acquired by Bain for $1.6 billion (March 2013) ▪ 342,000 sq. ft. manufacturing and distribution facility in Dallas, TX • Class B, concrete tilt - up construction, 7% office space • $1.5 million renovation ($4.40/sq. ft.) included as part of purchase price ▪ Cap rate 7.8% (GAAP) 14 Investment Update Highly functional industrial facility located in a strong in - fill submarket of Dallas and leased to a market leader on a long term net lease
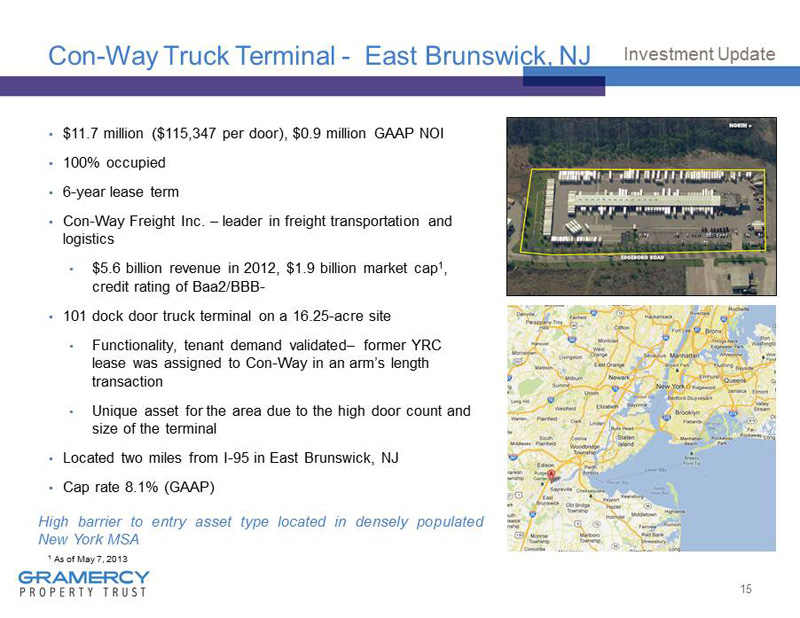
Con - Way Truck Terminal - East Brunswick, NJ ▪ $11.7 million ($115,347 per door), $0.9 million GAAP NOI ▪ 100% occupied ▪ 6 - year lease term ▪ Con - Way Freight Inc. – leader in freight transportation and logistics • $5.6 billion revenue in 2012, $1.9 billion market cap 1 , credit rating of Baa2/BBB - ▪ 101 dock door truck terminal on a 16.25 - acre site • Functionality, tenant demand validated – former YRC lease was assigned to Con - Way in an arm’s length transaction • Unique asset for the area due to the high door count and size of the terminal ▪ Located two miles from I - 95 in East Brunswick, NJ ▪ Cap rate 8.1% (GAAP) 15 Investment Update High barrier to entry asset type located in densely populated New York MSA 1 As of May 7, 2013
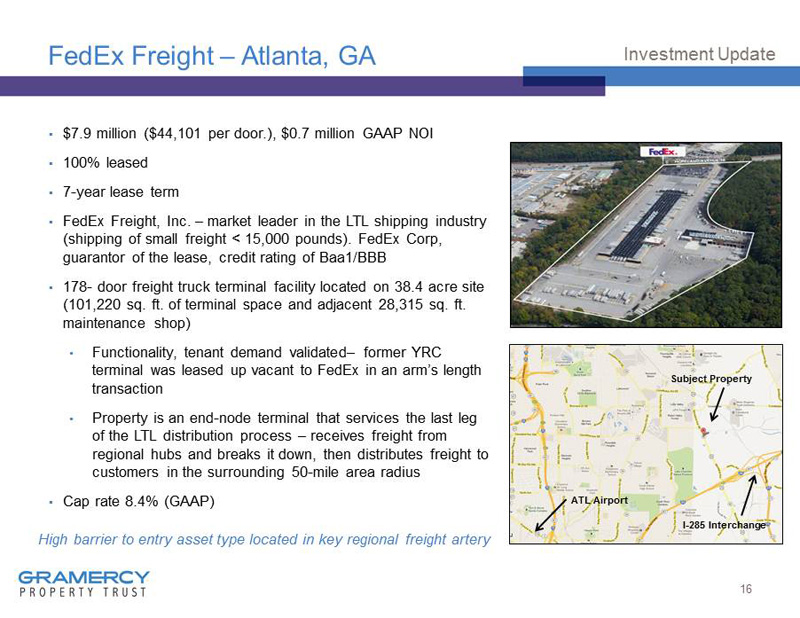
FedEx Freight – Atlanta, GA ▪ $7.9 million ($44,101 per door.), $0.7 million GAAP NOI ▪ 100% leased ▪ 7 - year lease term ▪ FedEx Freight, Inc. – market leader in the LTL shipping industry (shipping of small freight < 15,000 pounds). FedEx Corp, guarantor of the lease, credit rating of Baa1/BBB ▪ 178 - door freight truck terminal facility located on 38.4 acre site (101,220 sq. ft. of terminal space and adjacent 28,315 sq. ft. maintenance shop) • Functionality, tenant demand validated – former YRC terminal was leased up vacant to FedEx in an arm’s length transaction • Property is an end - node terminal that services the last leg of the LTL distribution process – receives freight from regional hubs and breaks it down, then distributes freight to customers in the surrounding 50 - mile area radius ▪ Cap rate 8.4% (GAAP) 16 Investment Update High barrier to entry asset type located in key regional freight artery ATL Airport I - 285 Interchange Subject Property
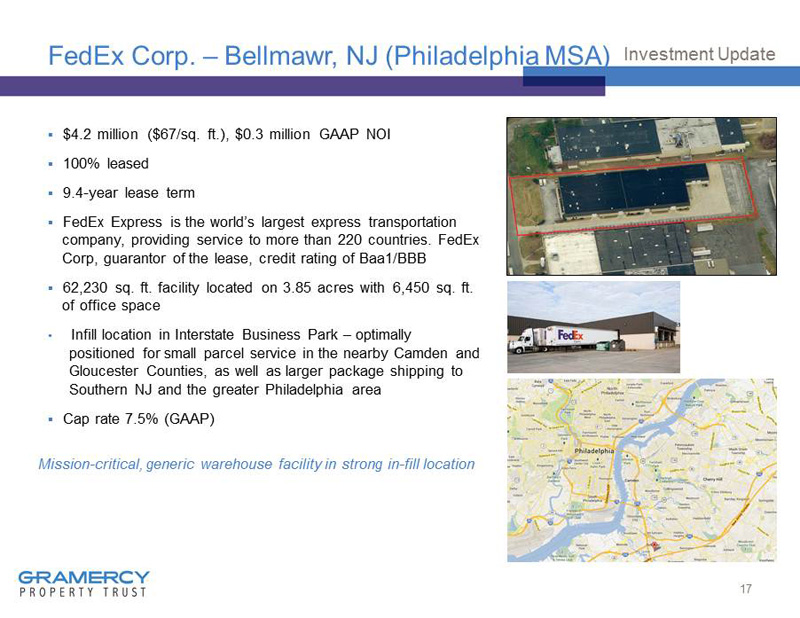
FedEx Corp. – Bellmawr, NJ (Philadelphia MSA) 17 Investment Update ▪ $4.2 million ($67/sq. ft.), $0.3 million GAAP NOI ▪ 100 % leased ▪ 9.4 - year lease term ▪ FedEx Express is the world’s largest express transportation company, providing service to more than 220 countries. FedEx Corp, guarantor of the lease, credit rating of Baa1/BBB ▪ 62,230 sq. ft. facility located on 3.85 acres with 6,450 sq. ft. of office space • Infill location in Interstate Business Park – optimally positioned for small parcel service in the nearby Camden and Gloucester Counties, as well as larger package shipping to Southern NJ and the greater Philadelphia area ▪ Cap rate 7.5% (GAAP) Mission - critical, generic warehouse facility in strong in - fill location
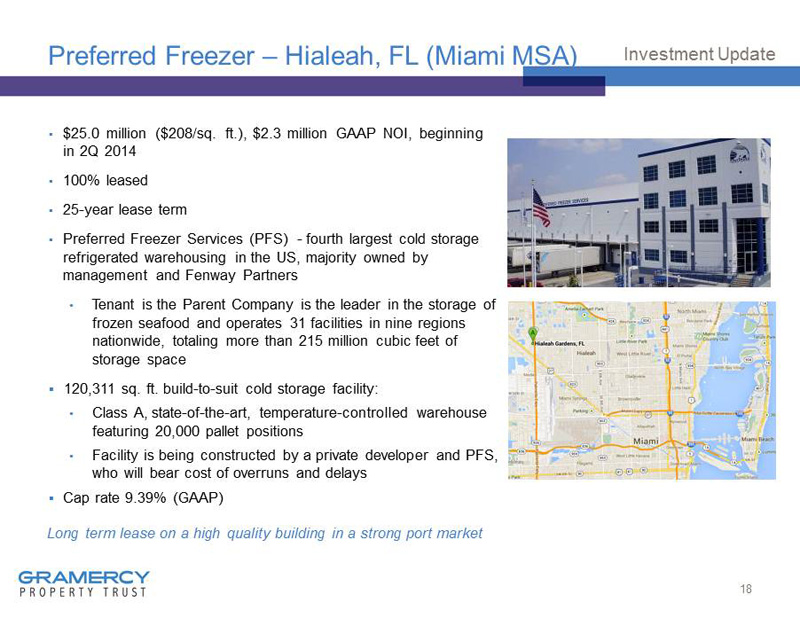
Preferred Freezer – Hialeah, FL (Miami MSA) ▪ $ 25.0 million ($ 208/sq. ft.), $2.3 million GAAP NOI, beginning in 2Q 2014 ▪ 100% leased ▪ 25 - year lease term ▪ Preferred Freezer Services (PFS) - fourth largest cold storage refrigerated warehousing in the US, majority owned by management and Fenway Partners • Tenant is the Parent Company is the leader in the storage of frozen seafood and operates 31 facilities in nine regions nationwide, totaling more than 215 million cubic feet of storage space ▪ 120,311 sq. ft. b uild - to - suit cold storage facility: • Class A, state - of - the - art, temperature - controlled warehouse featuring 20,000 pallet positions • Facility is being constructed by a private developer and PFS, who will bear cost of overruns and delays ▪ Cap rate 9.39% (GAAP) 18 Investment Update Long term lease on a high quality building in a strong port market
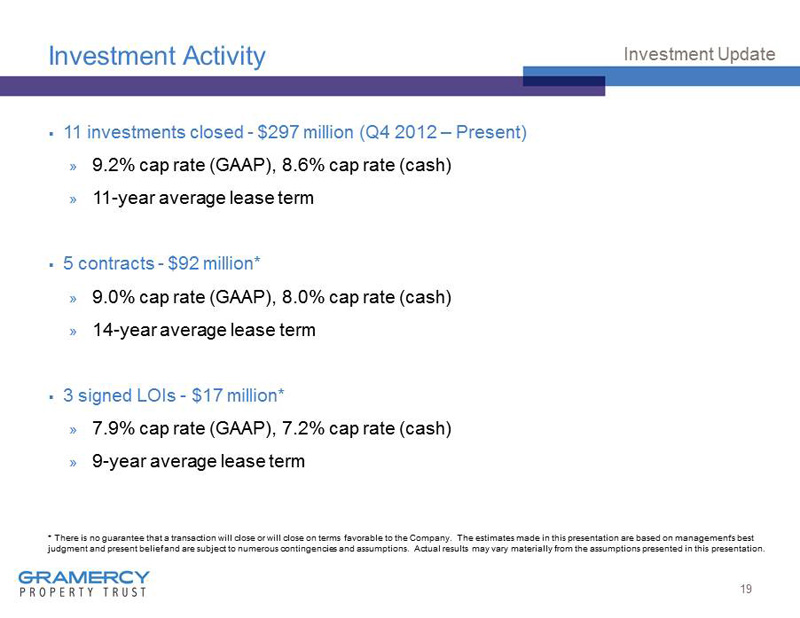
Investment Activity 19 Investment Update ▪ 11 investments closed - $297 million (Q4 2012 – Present) » 9.2% cap rate (GAAP), 8.6% cap rate (cash) » 11 - year average lease term ▪ 5 contracts - $92 million* » 9.0% cap rate (GAAP), 8.0% cap rate (cash) » 14 - year average lease term ▪ 3 signed LOIs - $17 million* » 7.9% cap rate (GAAP), 7.2% cap rate (cash) » 9 - year average lease term * There is no guarantee that a transaction will close or will close on terms favorable to the Company. The estimates made in this presentation are based on management's best judgment and present belief and are subject to numerous contingencies and assumptions. Actual results may vary materially from the assumptions presented in this presentation.
20 Maximize Asset Management Profit Center
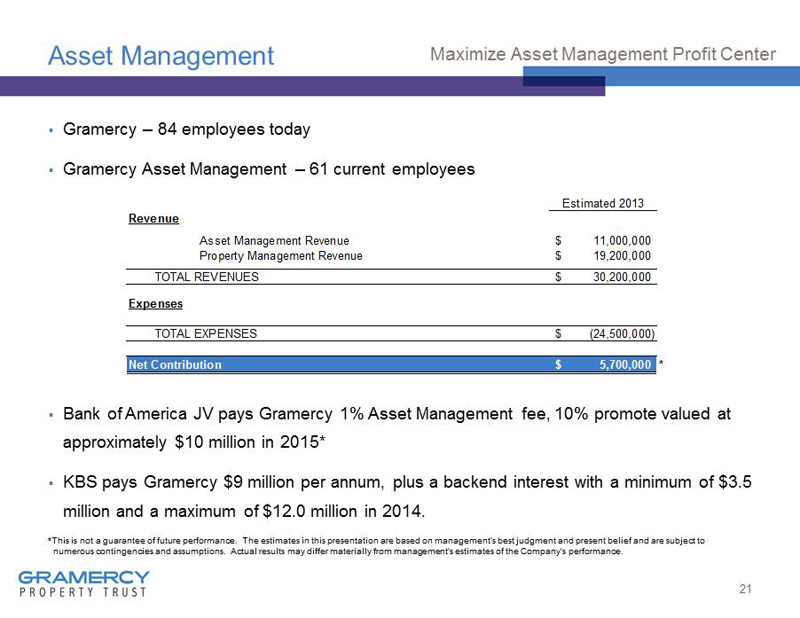
Asset Management ▪ Gramercy – 84 employees today ▪ Gramercy Asset Management – 61 current employees ▪ Bank of America JV pays Gramercy 1% Asset Management fee, 10% promote valued at approximately $10 million in 2015* ▪ KBS pays Gramercy $9 million per annum, plus a backend interest with a minimum of $ 3.5 million and a maximum of $ 12.0 million in 2014. 21 * This is not a guarantee of future performance. The estimates in this presentation are based on management’s best judgment an d p resent belief and are subject to numerous contingencies and assumptions. Actual results may differ materially from management's estimates of the Company's pe rf ormance. Maximize Asset Management Profit Center Estimated 2013 Revenue Asset Management Revenue 11,000,000$ Property Management Revenue 19,200,000$ TOTAL REVENUES 30,200,000$ Expenses TOTAL EXPENSES (24,500,000)$ Net Contribution 5,700,000$ *
Asset Management ▪ Asset Management subsidizes Gramercy MG&A while net lease portfolio is acquired ▪ Asset Management source of Gramercy’s capability to close many transactions quickly ▪ Asset Management source of investment opportunities » Bank of America Portfolio » Wells Fargo Portfolio – An option on 5 assets totaling approximately $30 million 22 Maximize Asset Management Profit Center
23 Significantly Reduce Management, General & Administrative (MG&A)
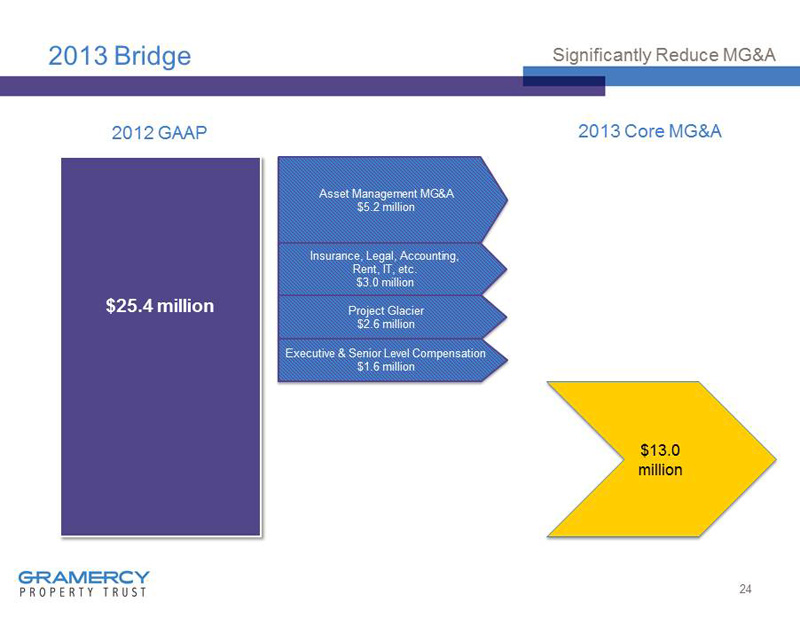
2013 Bridge 24 Significantly Reduce MG&A $25.4 million 2012 GAAP 2013 Core MG&A $13.0 million Asset Management MG&A $5.2 million Insurance, Legal, Accounting, Rent, IT, etc. $3.0 million Project Glacier $2.6 million Executive & Senior Level Compensation $1.6 million
2014 ▪ Existing Core MG&A will provide a platform for growth of business in 2014 and beyond ▪ In the absence of any growth opportunities, Gramercy Core MG&A could be reduced to approximately $10 - $11 million for 2014 primarily through: » $2.5 million personnel reduction » $0.5 million professional fees/information technology (IT) reduction 25 Significantly Reduce MG&A

26 Net Lease Industry Update
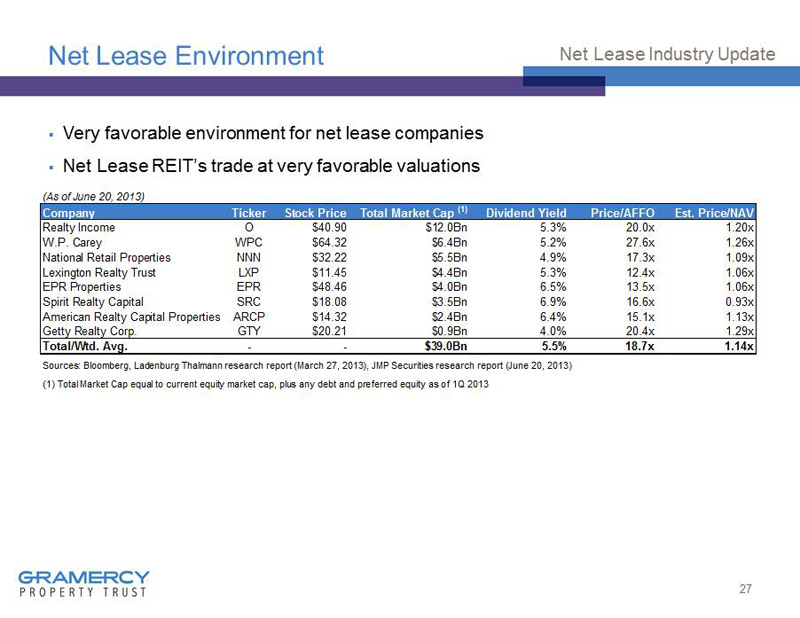
Net Lease Environment ▪ Very favorable environment for net lease companies ▪ Net Lease REIT’s trade at very favorable valuations 27 Net Lease Industry Update (As of June 20, 2013) Company Ticker Stock Price Total Market Cap (1) Dividend Yield Price/AFFO Est. Price/NAV Realty Income O $40.90 $12.0Bn 5.3% 20.0x 1.20x W.P. Carey WPC $64.32 $6.4Bn 5.2% 27.6x 1.26x National Retail Properties NNN $32.22 $5.5Bn 4.9% 17.3x 1.09x Lexington Realty Trust LXP $11.45 $4.4Bn 5.3% 12.4x 1.06x EPR Properties EPR $48.46 $4.0Bn 6.5% 13.5x 1.06x Spirit Realty Capital SRC $18.08 $3.5Bn 6.9% 16.6x 0.93x American Realty Capital Properties ARCP $14.32 $2.4Bn 6.4% 15.1x 1.13x Getty Realty Corp. GTY $20.21 $0.9Bn 4.0% 20.4x 1.29x Total/Wtd. Avg. - - $39.0Bn 5.5% 18.7x 1.14x Sources: Bloomberg, Ladenburg Thalmann research report (March 27, 2013), JMP Securities research report (June 20, 2013) (1) Total Market Cap equal to current equity market cap, plus any debt and preferred equity as of 1Q 2013
28 Capital Markets Review
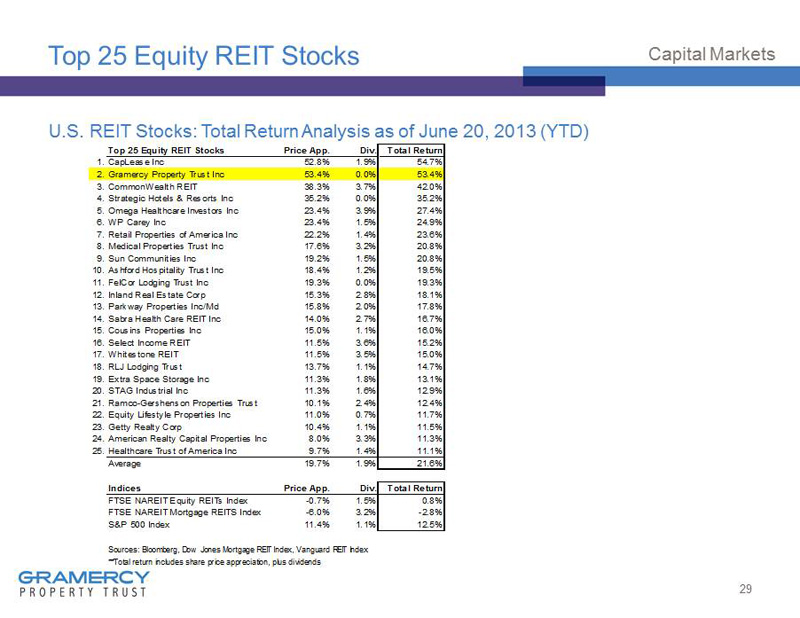
Top 25 Equity REIT Stocks U.S . REIT Stocks: Total Return Analysis as of June 20, 2013 (YTD) 29 Capital Markets Top 25 Equity REIT Stocks Price App. Div. Total Return 1.CapLease Inc 52.8% 1.9% 54.7% 2.Gramercy Property Trust Inc 53.4% 0.0% 53.4% 3.CommonWealth REIT 38.3% 3.7% 42.0% 4.Strategic Hotels & Resorts Inc 35.2% 0.0% 35.2% 5.Omega Healthcare Investors Inc 23.4% 3.9% 27.4% 6.WP Carey Inc 23.4% 1.5% 24.9% 7.Retail Properties of America Inc 22.2% 1.4% 23.6% 8.Medical Properties Trust Inc 17.6% 3.2% 20.8% 9.Sun Communities Inc 19.2% 1.5% 20.8% 10.Ashford Hospitality Trust Inc 18.4% 1.2% 19.5% 11.FelCor Lodging Trust Inc 19.3% 0.0% 19.3% 12.Inland Real Estate Corp 15.3% 2.8% 18.1% 13.Parkway Properties Inc/Md 15.8% 2.0% 17.8% 14.Sabra Health Care REIT Inc 14.0% 2.7% 16.7% 15.Cousins Properties Inc 15.0% 1.1% 16.0% 16.Select Income REIT 11.5% 3.6% 15.2% 17.Whitestone REIT 11.5% 3.5% 15.0% 18.RLJ Lodging Trust 13.7% 1.1% 14.7% 19.Extra Space Storage Inc 11.3% 1.8% 13.1% 20.STAG Industrial Inc 11.3% 1.6% 12.9% 21.Ramco-Gershenson Properties Trust 10.1% 2.4% 12.4% 22.Equity Lifestyle Properties Inc 11.0% 0.7% 11.7% 23.Getty Realty Corp 10.4% 1.1% 11.5% 24.American Realty Capital Properties Inc 8.0% 3.3% 11.3% 25.Healthcare Trust of America Inc 9.7% 1.4% 11.1% Average 19.7% 1.9% 21.6% Indices Price App. Div. Total Return FTSE NAREIT Equity REITs Index -0.7% 1.5% 0.8% FTSE NAREIT Mortgage REITS Index -6.0% 3.2% -2.8% S&P 500 Index 11.4% 1.1% 12.5% Sources: Bloomberg, Dow Jones Mortgage REIT Index, Vanguard REIT Index **Total return includes share price appreciation, plus dividends
Gramercy Access to Capital Rally in smaller, less institutional REITs allows Gramercy access to capital » Credit facility - Targeting the end of Q2 2013/early Q3 2013 » Preferred - “Carrying cost” roughly 6% at the moment » Common 30 Capital Markets
31 Goal: Create Durable, Growing Dividends
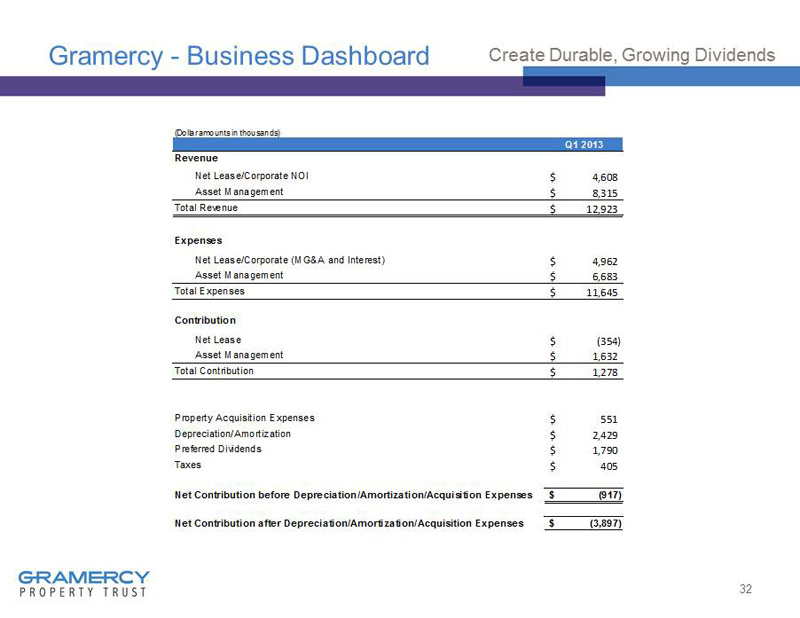
Gramercy - Business Dashboard 32 Create Durable, Growing Dividends (Dollar amounts in thousands) Q1 2013 Revenue Net Lease/Corporate NOI 4,608$ Asset Management 8,315$ Total Revenue 12,923$ Expenses Net Lease/Corporate (MG&A and Interest) 4,962$ Asset Management 6,683$ Total Expenses 11,645$ Contribution Net Lease (354)$ Asset Management 1,632$ Total Contribution 1,278$ Property Acquisition Expenses 551$ Depreciation/Amortization 2,429$ Preferred Dividends 1,790$ Taxes 405$ Net Contribution before Depreciation/Amortization/Acquisition Expenses (917)$ Net Contribution after Depreciation/Amortization/Acquisition Expenses (3,897)$
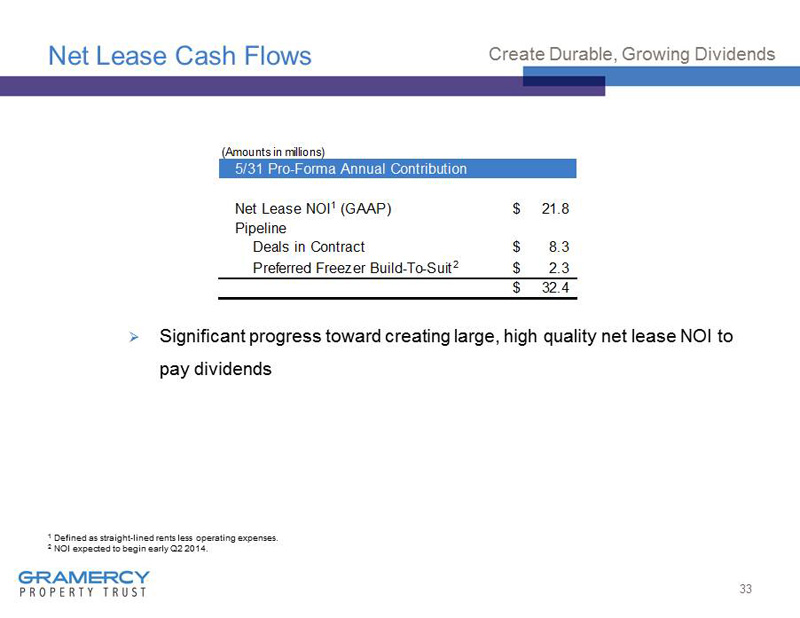
Net Lease Cash Flows » Significant progress toward creating large, high quality net lease NOI to pay dividends 33 Create Durable, Growing Dividends 1 Defined as straight - lined rents less operating expenses. 2 NOI expected to begin early Q2 2014. (Amounts in millions) 5/31 Pro-Forma Annual Contribution Net Lease NOI 1 (GAAP) 21.8$ Pipeline Deals in Contract 8.3$ Preferred Freezer Build-To-Suit 2 2.3$ 32.4$
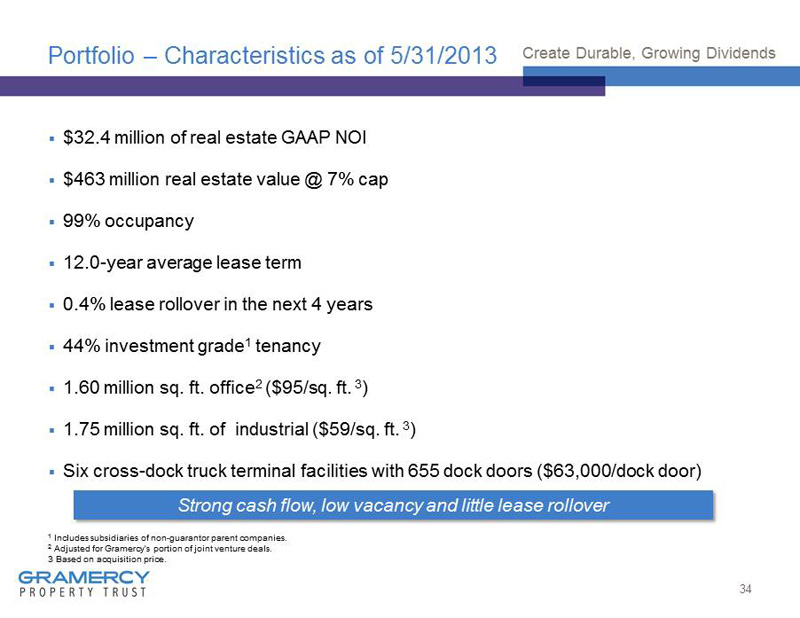
Portfolio – Characteristics as of 5/31/2013 ▪ $32.4 million of real estate GAAP NOI ▪ $463 million real estate value @ 7% cap ▪ 99% occupancy ▪ 12.0 - year average lease term ▪ 0.4% lease rollover in the next 4 years ▪ 44% investment grade 1 tenancy ▪ 1.60 million sq. ft. office 2 ($95/sq. ft. 3 ) ▪ 1.75 million sq. ft. of industrial ($59/sq. ft. 3 ) ▪ Six cross - dock truck terminal facilities with 655 dock doors ($63,000/dock door) d 34 Create Durable, Growing Dividends 1 Includes subsidiaries of non - guarantor parent companies. 2 Adjusted for Gramercy’s portion of joint venture deals. 3 Based on acquisition price. Strong cash flow, low vacancy and little lease rollover
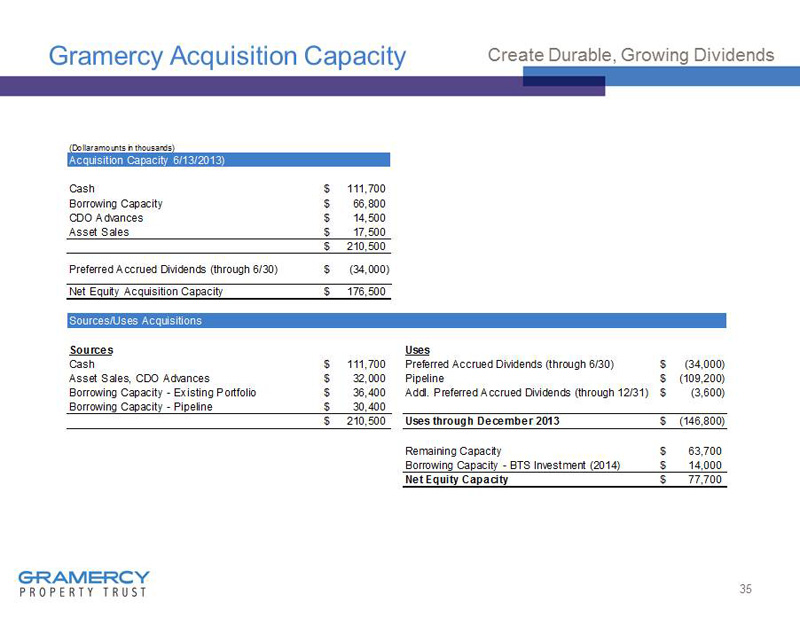
Gramercy Acquisition Capacity 35 Create Durable, Growing Dividends (Dollar amounts in thousands) Acquisition Capacity 6/13/2013) Cash 111,700$ Borrowing Capacity 66,800$ CDO Advances 14,500$ Asset Sales 17,500$ 210,500$ Preferred Accrued Dividends (through 6/30) (34,000)$ Net Equity Acquisition Capacity 176,500$ Sources/Uses Acquisitions Sources Uses Cash 111,700$ Preferred Accrued Dividends (through 6/30) (34,000)$ Asset Sales, CDO Advances 32,000$ Pipeline (109,200)$ Borrowing Capacity - Existing Portfolio 36,400$ Addl. Preferred Accrued Dividends (through 12/31) (3,600)$ Borrowing Capacity - Pipeline 30,400$ 210,500$ Uses through December 2013 (146,800)$ Remaining Capacity 63,700$ Borrowing Capacity - BTS Investment (2014) 14,000$ Net Equity Capacity 77,700$