Business Plan Update October 7, 2013
Forward - Looking Information/NOI and Cap Rate Disclaimers Cautionary Note Regarding Forward - Looking Information This investment presentation contains "forward - looking statements" based upon the Company's current best judgment and expectations . You can identify forward - looking statements by the use of forward - looking expressions such as “may,” “will,” “should,” “expect,” “believe,” “anticipate,” “estimate,” “intend,” “plan,” “project,” “continue,” or any negative or other variations on such expressions . Forward - looking statements include information concerning possible or assumed future results of the Company's operations, including any forecasts, projections, plans and objectives for future operations . Although the Company believes that its plans, intentions and expectations as reflected in or suggested by those forward - looking statements are reasonable, the Company can give no assurance that the plans, intentions or expectations will be achieved . The Company has listed below some important risks, uncertainties and contingencies which could cause its actual results, performance or achievements to be materially different from the forward - looking statements it makes in this presentation . These risks, uncertainties and contingencies include, but are not limited to, the following : the success or failure of the Company's efforts to implement its Company's current business strategy ; the Company's ability to identify and complete additional property acquisitions and risks of real estate acquisitions ; availability of investment opportunities on real estate assets ; the performance and financial condition of tenants and corporate customers ; the adequacy of the Company's cash reserves, working capital and other forms of liquidity ; the availability, terms and deployment of short - term and long - term capital ; demand for office and industrial space ; the actions of the Company's competitors and ability to respond to those actions ; the timing of cash flows from the Company's investments ; the cost and availability of the Company's financings, which depends in part on the Company's asset quality, the nature of the Company's relationships with its lenders and other capital providers, the Company's business prospects and outlook and general market conditions ; the continuity of the management agreement for the KBS portfolio ; economic conditions generally and in the real estate markets and the capital markets specifically ; unanticipated increases in financing and other costs, including a rise in interest rates ; the Company's ability to profitably dispose of non - core assets ; availability of, and ability to retain, qualified personnel and directors ; changes to the Company's management and board of directors ; changes in governmental regulations, tax rates and similar matters ; legislative and regulatory changes (including changes to laws governing the taxation of REITs or the exemptions from registration as an investment company) ; environmental and/or safety requirements ; the Company's ability to satisfy complex rules in order for it to qualify as a REIT for federal income tax purposes, the Company's operating partnership’s ability to satisfy the rules in order for it to qualify as a partnership for federal income tax purposes, and the ability of certain of the Company's subsidiaries to qualify as REITs and certain of the Company's subsidiaries to qualify as TRSs for federal income tax purposes, and the Company's ability and the ability of its subsidiaries to operate effectively within the limitations imposed by these rules ; the continuing threat of terrorist attacks on the national, regional and local economies ; and other factors discussed under Item 1 A, “Risk Factors” of the Company's Annual Report on Form 10 - K for the year ended December 31 , 2012 . The Company assumes no obligation to update any forward - looking statements, whether as a result of new information, future events, or otherwise . In evaluating forward - looking statements, you should consider these risks and uncertainties, together with the other risks described from time - to - time in the Company's reports and documents which are filed with the SEC, and you should not place undue reliance on those statements . The risks included here are not exhaustive . Other sections of this report may include additional factors that could adversely affect the Company's business and financial performance . Moreover, the Company operates in a very competitive and rapidly changing environment . New risk factors emerge from time to time and it is not possible for management to predict all such risk factors, nor can it assess the impact of all such risk factors on the Company's business or the extent to which any factor, or combination of factors, may cause actual results to differ materially from those contained in any forward - looking statements . Given these risks and uncertainties, investors should not place undue reliance on forward - looking statements as a prediction of actual results . NOI and Cap Rate Disclaimer Net operating income is a non - GAAP financial measure that represents property revenues on a straight - lined basis minus property expenses before interest and capital reserves/expenditures . Year - one NOI approximates the “as - purchased” cap rate and is calculated for the initial 12 months of ownership . For build to suit projects, year one - NOI is calculated for the initial 12 months following the final completion of the project and the initial commencement of rent . A capitalization rate is the rate of return on a real estate investment property based on the expected, straight - lined income that the property will generate . Capitalization rate is used to estimate the Company’s potential return on its investment . This is done by dividing the income the property will generate (before debt service and depreciation and after fixed costs and variable costs) by the acquisition price of the property . The NOI assumption included in this presentation reflects the Company's assumptions and expectations which are not guarantees of its future performance . The Company's actual NOI may vary materially from the assumptions presented in this presentation . The results that an investor in the Company will actually receive will depend, to a significant degree, on the actual performance of the Company's assets, which may be impacted by material economic and market risk factors . 2

3 Introduction
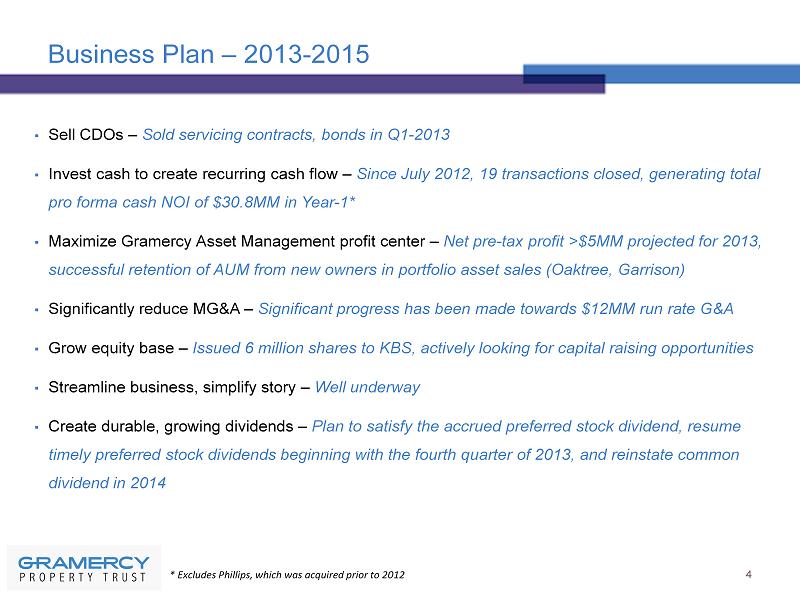
Business Plan – 2013 - 2015 ▪ Sell CDOs – Sold servicing contracts, bonds in Q1 - 2013 ▪ Invest cash to create recurring cash flow – S ince July 2012, 19 transactions closed, generating total pro forma cash NOI of $ 30.8MM in Year - 1* ▪ Maximize Gramercy Asset Management profit center – N et pre - tax profit >$5MM projected for 2013, successful retention of AUM from new owners in portfolio asset sales (Oaktree, Garrison) ▪ Significantly reduce MG&A – S ignificant progress has been made towards $12MM run rate G&A ▪ Grow equity base – Issued 6 million shares to KBS, actively looking for capital raising opportunities ▪ Streamline business, simplify story – Well underway ▪ Create durable, growing dividends – Plan to satisfy the accrued preferred stock dividend, resume timely preferred stock dividends beginning with the fourth quarter of 2013, and reinstate common dividend in 2014 4 * Excludes Phillips, which was acquired prior to 2012
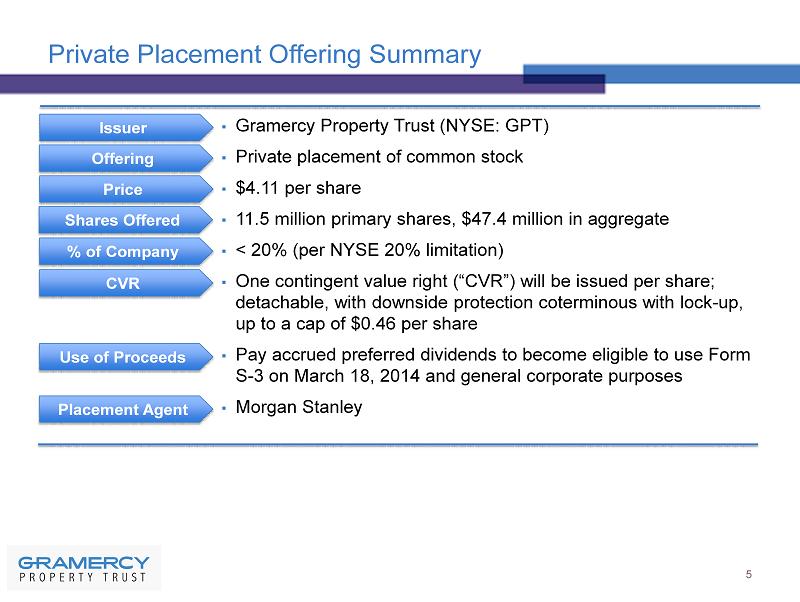
Private Placement Offering Summary ▪ Gramercy Property Trust (NYSE: GPT ) ▪ Private placement of common stock ▪ $4.11 per share ▪ 11.5 million primary shares , $47.4 million in aggregate ▪ < 20% (per NYSE 20% limitation ) ▪ One contingent value right (“CVR”) will be issued per share; detachable, with downside protection coterminous with lock - up , up to a cap of $0.46 per share ▪ Pay accrued preferred dividends to become eligible to use Form S - 3 on March 18, 2014 and general corporate purposes ▪ Morgan Stanley 5 Issuer Offering Price Shares Offered % of Company CVR Use of Proceeds Placement Agent
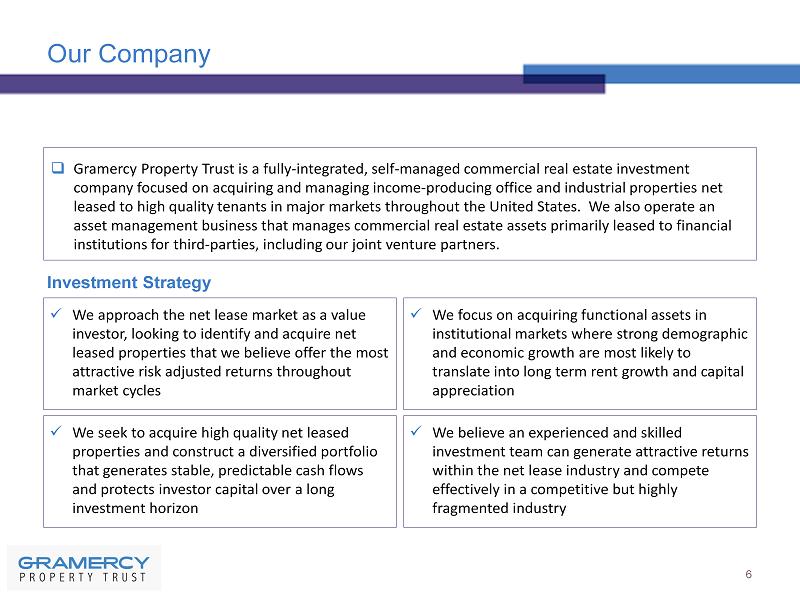
□ Gramercy Property Trust is a fully - integrated, self - managed commercial real estate investment company focused on acquiring and managing income - producing office and industrial properties net leased to high quality tenants in major markets throughout the United States. We also operate an asset management business that manages commercial real estate assets primarily leased to financial institutions for third - parties, including our joint venture partners. 6 Our Company x We seek to acquire high quality net leased properties and construct a diversified portfolio that generates stable, predictable cash flows and protects investor capital over a long investment horizon Investment Strategy x We focus on acquiring functional assets in institutional markets where strong demographic and economic growth are most likely to translate into long term rent growth and capital appreciation x We approach the net lease market as a value investor, looking to identify and acquire net leased properties that we believe offer the most attractive risk adjusted returns throughout market cycles x We believe an experienced and skilled investment team can generate attractive returns within the net lease industry and compete effectively in a competitive but highly fragmented industry
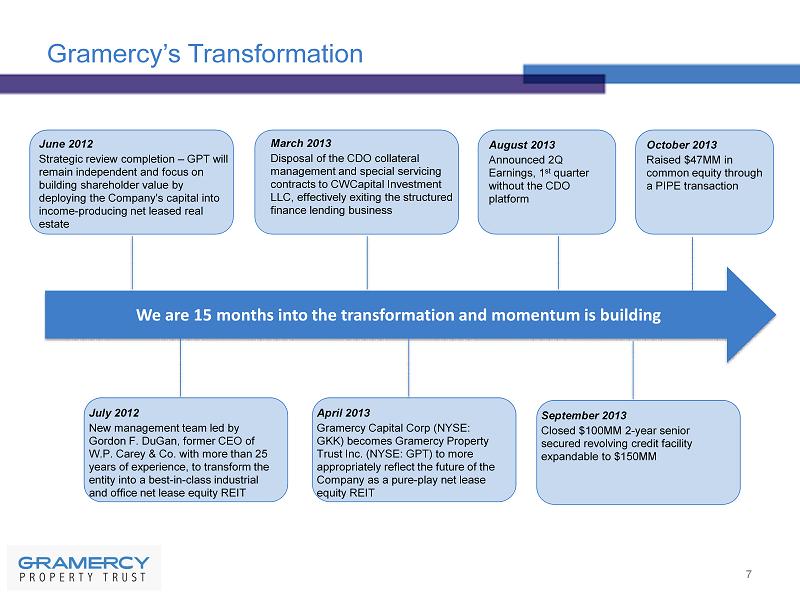
7 Gramercy’s Transformation We are 15 months into the transformation and momentum is building June 2012 Strategic review completion – GPT will remain independent and focus on building shareholder value by deploying the Company's capital into income - producing net leased real estate March 2013 Disposal of the CDO collateral management and special servicing contracts to CWCapital Investment LLC, effectively exiting the structured finance lending business August 2013 Announced 2Q Earnings, 1 st quarter without the CDO platform April 2013 Gramercy Capital Corp (NYSE: GKK) becomes Gramercy Property Trust Inc. (NYSE: GPT) to more appropriately reflect the future of the Company as a pure - play net lease equity REIT July 2012 New management team led by Gordon F. DuGan, former CEO of W.P. Carey & Co. with more than 25 years of experience, to transform the entity into a best - in - class industrial and office net lease equity REIT September 2013 Closed $100MM 2 - year senior secured revolving credit facility expandable to $150MM October 2013 Raised $47MM in common equity through a PIPE transaction
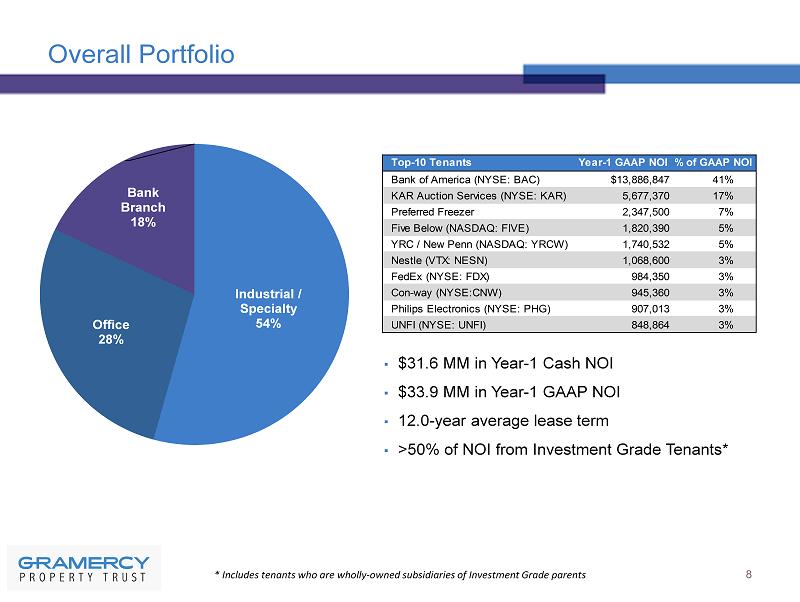
Top-10 Tenants Year-1 GAAP NOI % of GAAP NOI Bank of America (NYSE: BAC) $13,886,847 41% KAR Auction Services (NYSE: KAR) 5,677,370 17% Preferred Freezer 2,347,500 7% Five Below (NASDAQ: FIVE) 1,820,390 5% YRC / New Penn (NASDAQ: YRCW) 1,740,532 5% Nestle (VTX: NESN) 1,068,600 3% FedEx (NYSE: FDX) 984,350 3% Con-way (NYSE:CNW) 945,360 3% Philips Electronics (NYSE: PHG) 907,013 3% UNFI (NYSE: UNFI) 848,864 3% Overall Portfolio 8 Industrial / Specialty 54% Office 28% Bank Branch 18% 0% * Includes tenants who are wholly - owned subsidiaries of Investment G rade parents ▪ $31.6 MM in Year - 1 Cash NOI ▪ $33.9 MM in Year - 1 GAAP NOI ▪ 12.0 - year average lease term ▪ >50% of NOI from Investment Grade Tenants*
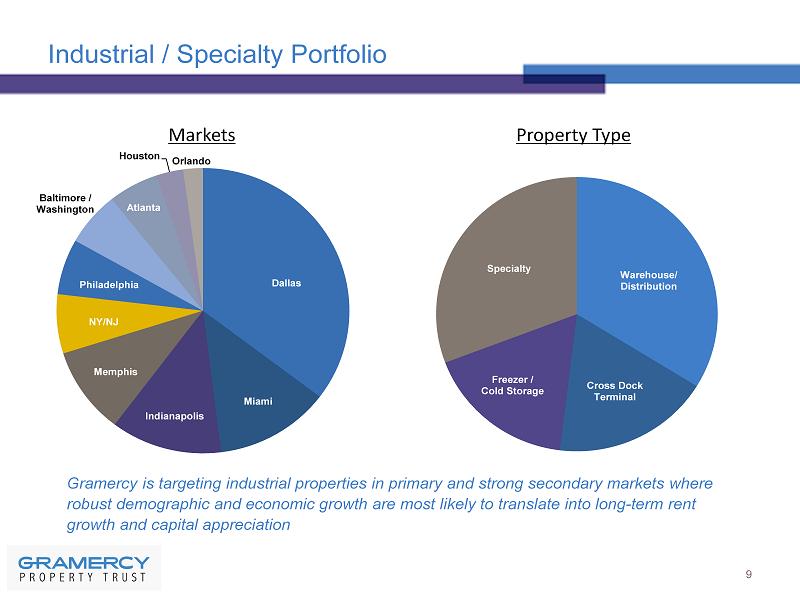
Industrial / Specialty Portfolio 9 Dallas Miami Indianapolis Memphis NY/NJ Philadelphia Baltimore / Washington Atlanta Houston Orlando Warehouse/ Distribution Cross Dock Terminal Freezer / Cold Storage Specialty Markets Property Type Gramercy is targeting industrial properties in primary and strong secondary markets where robust demographic and economic growth are most likely to translate into long - term rent growth and capital appreciation
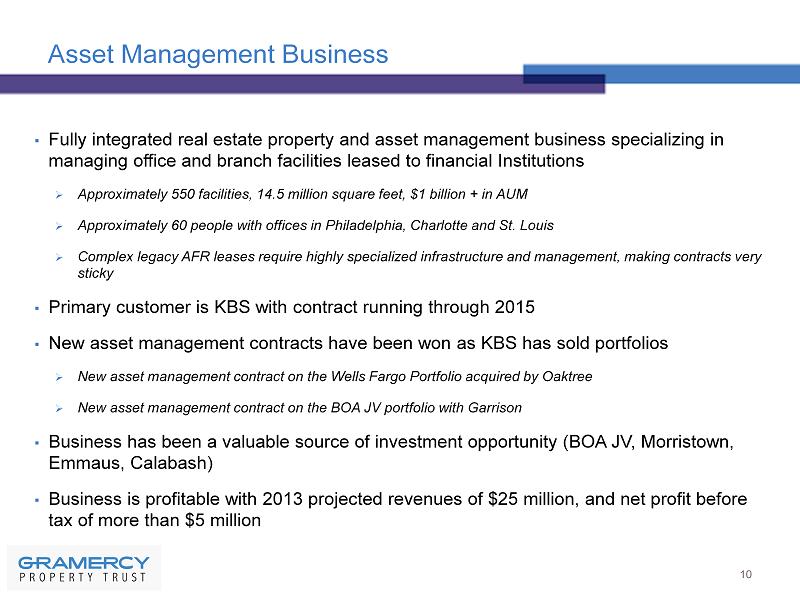
Asset Management Business ▪ Fully integrated real estate property and asset management business specializing in managing office and branch facilities leased to financial Institutions » A pproximately 550 facilities, 14.5 million square feet, $1 billion + in AUM » Approximately 60 people with offices in Philadelphia, Charlotte and St. Louis » Complex legacy AFR leases require highly specialized infrastructure and management, making contracts very sticky ▪ Primary customer is KBS with contract running through 2015 ▪ New asset management contracts have been won as KBS has sold portfolios » New asset management contract on the Wells Fargo Portfolio acquired by Oaktree » New asset management contract on the BOA JV portfolio with Garrison ▪ Business has been a valuable source of investment opportunity ( BOA JV, Morristown, Emmaus , Calabash) ▪ Business is profitable with 2013 projected revenues of $25 million, and net profit before tax of more than $5 million 10
11 Investment Update
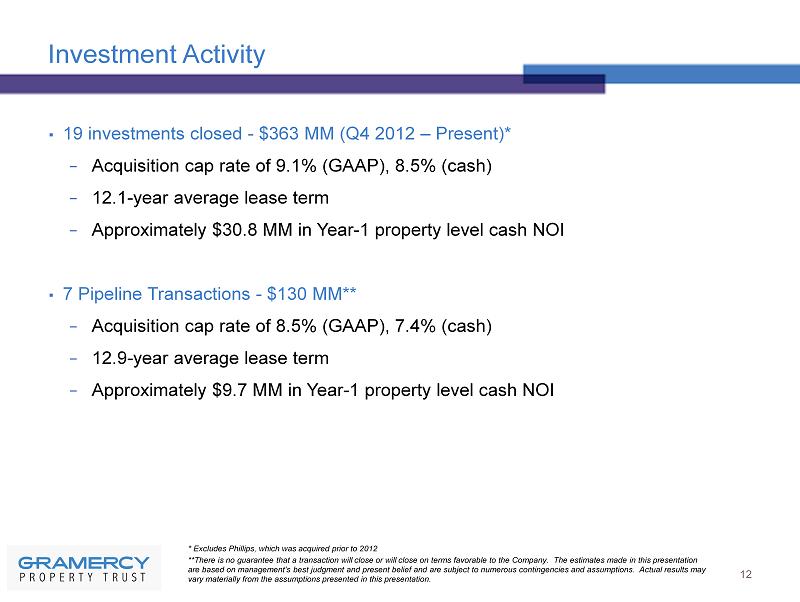
Investment Activity 12 ▪ 19 investments closed - $363 MM (Q4 2012 – Present )* − Acquisition cap rate of 9.1% ( GAAP), 8.5% ( cash) − 12.1 - year average lease term − Approximately $30.8 MM in Year - 1 property level cash NOI ▪ 7 Pipeline Transactions - $130 MM** − Acquisition cap rate of 8.5% ( GAAP), 7.4% ( cash) − 12.9 - year average lease term − Approximately $9.7 MM in Year - 1 property level cash NOI **There is no guarantee that a transaction will close or will close on terms favorable to the Company. The estimates made in th is presentation are based on management's best judgment and present belief and are subject to numerous contingencies and assumptions. Actual re sults may vary materially from the assumptions presented in this presentation. * Excludes Phillips, which was acquired prior to 2012

Current Liquidity Position (as of 9/12/2013) ▪ Unrestricted cash balance of $40.0 MM* ▪ Additional Sources of Cash totaling $103.5 MM: $9.9MM from asset sales $10.7MM from servicer advance reimbursements $63.8MM from revolver availability from existing borrowing base + $19.1MM capacity for pipeline The revolving credit facility is a $100 MM 2 - yr facility, expandable to $150 MM** ▪ Accrued preferred dividend balance of $37.6 MM***, $20.2 MM in build - to - suit commitments ▪ Pipeline transactions of $130 MM, $73.9 MM in equity ▪ In place net cash flow exceeds entity’s fixed costs & preferred dividend on a going - forward basis 13 GPT has sufficient liquidity to fund current pipeline, true up accrued preferred dividends, fund existing build to suits and start a common dividend – this equity raise will allow the company to further build our portfolio and accelerate growth * Includes GPT’s prorata share of unrestricted cash in the BOA JV of approximately $4.0 million ** DB - Joint Lead Arranger, Sole Book Runner and Administrative Agent; Syndicates: BAML - Joint Lead Arranger and Co - Syndication Agent, RBC - Documentation Agent *** As of 12/31/2013
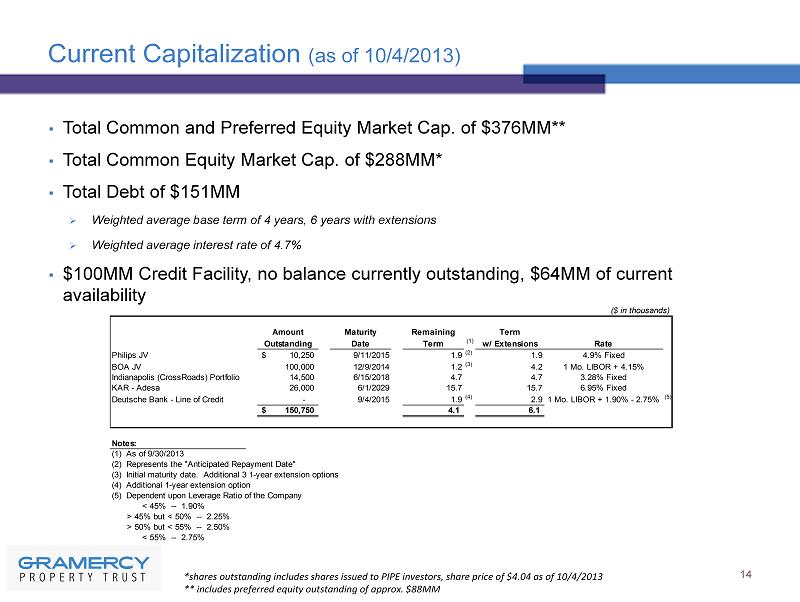
Current Capitalization (as of 10/4/2013 ) 14 *shares outstanding includes shares issued to PIPE investors, share price of $4.04 as of 10/4/2013 ** includes preferred equity outstanding of approx. $88MM ▪ Total Common and Preferred Equity Market Cap. of $376MM ** ▪ Total Common Equity Market Cap. of $288MM* ▪ Total Debt of $151MM » Weighted average base term of 4 years, 6 years with extensions » Weighted average interest rate of 4.7% ▪ $100MM Credit Facility, no balance currently outstanding, $64MM of current availability ($ in thousands) Amount Maturity Remaining Term Outstanding Date Term (1) w/ Extensions Rate Philips JV 10,250$ 9/11/2015 1.9 (2) 1.9 4.9% Fixed BOA JV 100,000 12/9/2014 1.2 (3) 4.2 1 Mo. LIBOR + 4.15% Indianapolis (CrossRoads) Portfolio 14,500 6/15/2018 4.7 4.7 3.28% Fixed KAR - Adesa 26,000 6/1/2029 15.7 15.7 6.95% Fixed Deutsche Bank - Line of Credit - 9/4/2015 1.9 (4) 2.9 1 Mo. LIBOR + 1.90% - 2.75% (5) 150,750$ 4.1 6.1 Notes: (1) As of 9/30/2013 (2) Represents the "Anticipated Repayment Date" (3) Initial maturity date. Additional 3 1-year extension options (4) Additional 1-year extension option (5) Dependent upon Leverage Ratio of the Company < 45% -- 1.90% > 45% but < 50% -- 2.25% > 50% but < 55% -- 2.50% < 55% -- 2.75%
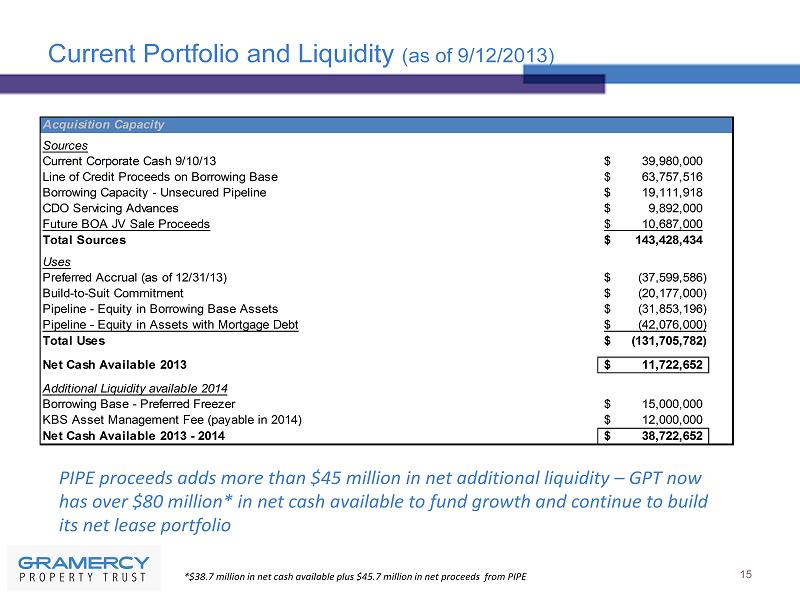
Current Portfolio and Liquidity (as of 9/12/2013 ) 15 Acquisition Capacity Sources Current Corporate Cash 9/10/13 39,980,000$ Line of Credit Proceeds on Borrowing Base 63,757,516$ Borrowing Capacity - Unsecured Pipeline 19,111,918$ CDO Servicing Advances 9,892,000$ Future BOA JV Sale Proceeds 10,687,000$ Total Sources 143,428,434$ Uses Preferred Accrual (as of 12/31/13) (37,599,586)$ Build-to-Suit Commitment (20,177,000)$ Pipeline - Equity in Borrowing Base Assets (31,853,196)$ Pipeline - Equity in Assets with Mortgage Debt (42,076,000)$ Total Uses (131,705,782)$ Net Cash Available 2013 11,722,652$ Additional Liquidity available 2014 Borrowing Base - Preferred Freezer 15,000,000$ KBS Asset Management Fee (payable in 2014) 12,000,000$ Net Cash Available 2013 - 2014 38,722,652$ PIPE proceeds adds more than $45 million in net additional liquidity – GPT now has over $80 million* in net cash available to fund growth and continue to build its net lease portfolio *$38.7 million in net cash available plus $45.7 million in net proceeds from PIPE
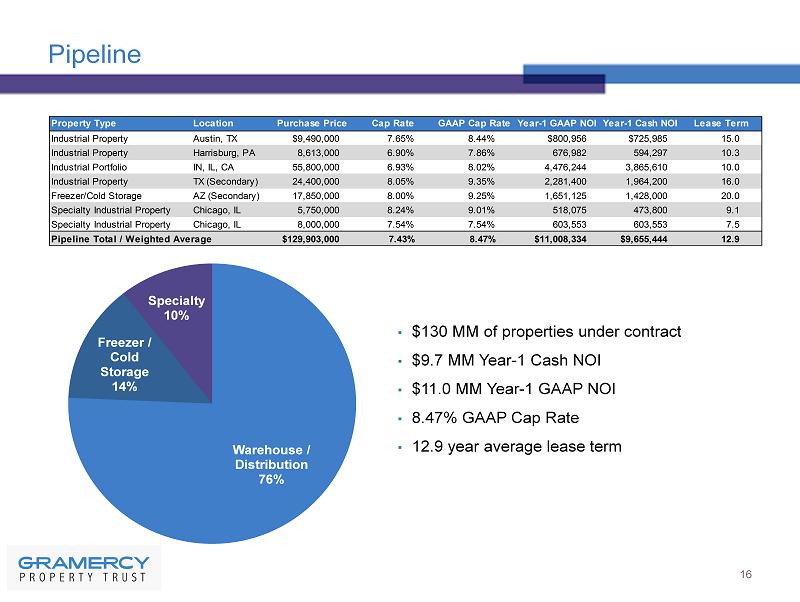
Property Type Location Purchase Price Cap Rate GAAP Cap Rate Year-1 GAAP NOI Year-1 Cash NOI Lease Term Industrial Property Austin, TX $9,490,000 7.65% 8.44% $800,956 $725,985 15.0 Industrial Property Harrisburg, PA 8,613,000 6.90% 7.86% 676,982 594,297 10.3 Industrial Portfolio IN, IL, CA 55,800,000 6.93% 8.02% 4,476,244 3,865,610 10.0 Industrial Property TX (Secondary) 24,400,000 8.05% 9.35% 2,281,400 1,964,200 16.0 Freezer/Cold Storage AZ (Secondary) 17,850,000 8.00% 9.25% 1,651,125 1,428,000 20.0 Specialty Industrial Property Chicago, IL 5,750,000 8.24% 9.01% 518,075 473,800 9.1 Specialty Industrial Property Chicago, IL 8,000,000 7.54% 7.54% 603,553 603,553 7.5 Pipeline Total / Weighted Average $129,903,000 7.43% 8.47% $11,008,334 $9,655,444 12.9 Pipeline 16 ▪ $130 MM of properties under contract ▪ $9.7 MM Year - 1 Cash NOI ▪ $11.0 MM Year - 1 GAAP NOI ▪ 8.47% GAAP Cap Rate ▪ 12.9 year average lease term Warehouse / Distribution 76% Freezer / Cold Storage 14% Specialty 10%
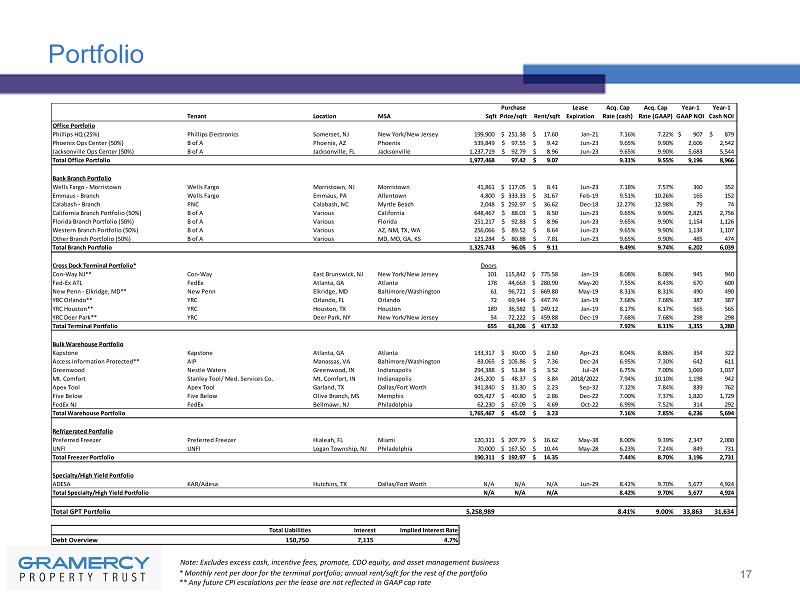
Tenant Location MSA Sqft Purchase Price/sqft Rent/sqft Lease Expiration Acq. Cap Rate (cash) Acq. Cap Rate (GAAP) Year-1 GAAP NOI Year-1 Cash NOI Office Portfolio Phillips HQ (25%) Phillips Electronics Somerset, NJ New York/New Jersey 199,900 251.38$ 17.60$ Jan-21 7.16% 7.22% 907$ 879$ Phoenix Ops Center (50%) B of A Phoenix, AZ Phoenix 539,849 97.55$ 9.42$ Jun-23 9.65% 9.90% 2,606 2,542 Jacksonville Ops Center (50%) B of A Jacksonville, FL Jacksonville 1,237,719 92.79$ 8.96$ Jun-23 9.65% 9.90% 5,683 5,544 Total Office Portfolio 1,977,468 97.42 9.07$ 9.31% 9.55% 9,196 8,966 Bank Branch Portfolio Wells Fargo - Morristown Wells Fargo Morristown, NJ Morristown 41,861 117.05$ 8.41$ Jun-23 7.18% 7.57% 360 352 Emmaus - Branch Wells Fargo Emmaus, PA Allentown 4,800 333.33$ 31.67$ Feb-19 9.51% 10.26% 165 152 Calabash - Branch PNC Calabash, NC Myrtle Beach 2,048 292.97$ 36.62$ Dec-18 12.27% 12.98% 79 74 California Branch Portfolio (50%) B of A Various California 648,467 88.03$ 8.50$ Jun-23 9.65% 9.90% 2,825 2,756 Florida Branch Portfolio (50%) B of A Various Florida 251,217 92.83$ 8.96$ Jun-23 9.65% 9.90% 1,154 1,126 Western Branch Portfolio (50%) B of A Various AZ, NM, TX, WA 256,066 89.52$ 8.64$ Jun-23 9.65% 9.90% 1,134 1,107 Other Branch Portfolio (50%) B of A Various MD, MO, GA, KS 121,284 80.88$ 7.81$ Jun-23 9.65% 9.90% 485 474 Total Branch Portfolio 1,325,743 96.05 9.11$ 9.49% 9.74% 6,202 6,039 Cross Dock Terminal Portfolio* Doors Con-Way NJ** Con-Way East Brunswick, NJ New York/New Jersey 101 115,842 775.58$ Jan-19 8.08% 8.08% 945 940 Fed-Ex ATL FedEx Atlanta, GA Atlanta 178 44,663 280.90$ May-20 7.55% 8.43% 670 600 New Penn - Elkridge, MD** New Penn Elkridge, MD Baltimore/Washington 61 96,721 669.80$ May-19 8.31% 8.31% 490 490 YRC Orlando** YRC Orlando, FL Orlando 72 69,944 447.74$ Jan-19 7.68% 7.68% 387 387 YRC Houston** YRC Houston, TX Houston 189 36,582 249.12$ Jan-19 8.17% 8.17% 565 565 YRC Deer Park** YRC Deer Park, NY New York/New Jersey 54 72,222 459.88$ Dec-19 7.68% 7.68% 298 298 Total Terminal Portfolio 655 63,206 417.32$ 7.92% 8.11% 3,355 3,280 Bulk Warehouse Portfolio Kapstone Kapstone Atlanta, GA Atlanta 133,317 30.00$ 2.60$ Apr-23 8.04% 8.86% 354 322 Access Information Protected** AIP Manassas, VA Baltimore/Washington 83,065 105.86$ 7.36$ Dec-24 6.95% 7.30% 642 611 Greenwood Nestle Waters Greenwood, IN Indianapolis 294,388 51.84$ 3.52$ Jul-24 6.75% 7.00% 1,069 1,037 Mt. Comfort Stanley Tool/ Med. Services Co. Mt. Comfort, IN Indianapolis 245,200 48.37$ 3.84$ 2018/2022 7.94% 10.10% 1,198 942 Apex Tool Apex Tool Garland, TX Dallas/Fort Worth 341,840 31.30$ 2.23$ Sep-32 7.12% 7.84% 839 762 Five Below Five Below Olive Branch, MS Memphis 605,427 40.80$ 2.86$ Dec-22 7.00% 7.37% 1,820 1,729 FedEx NJ FedEx Bellmawr, NJ Philadelphia 62,230 67.09$ 4.69$ Oct-22 6.99% 7.52% 314 292 Total Warehouse Portfolio 1,765,467 45.02$ 3.23$ 7.16% 7.85% 6,236 5,694 Refrigerated Portfolio Preferred Freezer Preferred Freezer Hialeah, FL Miami 120,311 207.79$ 16.62$ May-38 8.00% 9.39% 2,347 2,000 UNFI UNFI Logan Township, NJ Philadelphia 70,000 167.50$ 10.44$ May-28 6.23% 7.24% 849 731 Total Freezer Portfolio 190,311 192.97$ 14.35$ 7.44% 8.70% 3,196 2,731 Specialty/High Yield Portfolio ADESA KAR/Adesa Hutchins, TX Dallas/Fort Worth N/A N/A N/A Jun-29 8.42% 9.70% 5,677 4,924 Total Specialty/High Yield Portfolio N/A N/A N/A 8.42% 9.70% 5,677 4,924 Total GPT Portfolio 5,258,989 8.41% 9.00% 33,863 31,634 Total Liabilities Interest Implied Interest Rate Debt Overview 150,750 7,115 4.7% Portfolio 17 Note: Excludes excess c ash, incentive fees, promote, CDO equity, and asset management business * Monthly rent per door for the terminal portfolio; annual rent/sqft for the rest of the portfolio ** Any future CPI escalations per the lease are not reflected in GAAP cap rate
18 Appendix A
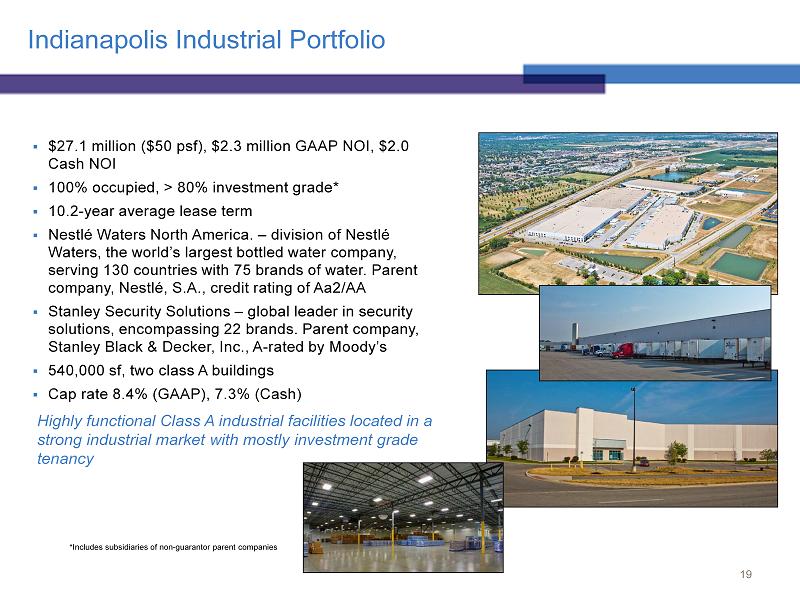
Indianapolis Industrial Portfolio ▪ $27.1 million ($ 50 psf), $2.3 million GAAP NOI, $2.0 Cash NOI ▪ 100% occupied, > 80% investment grade * ▪ 10.2 - year average lease term ▪ Nestlé Waters North America. – division of Nestlé Waters , the world’s largest bottled water company, serving 130 countries with 75 brands of water. Parent company , Nestlé, S.A., credit rating of Aa2/AA ▪ Stanley Security Solutions – global leader in security solutions , encompassing 22 brands. Parent company, Stanley Black & Decker, Inc., A - rated by Moody’s ▪ 540,000 sf, two class A buildings ▪ Cap rate 8.4% (GAAP ), 7.3% (Cash) 19 Highly functional Class A industrial facilities located in a strong industrial market with mostly investment grade tenancy *Includes subsidiaries of non - guarantor parent companies
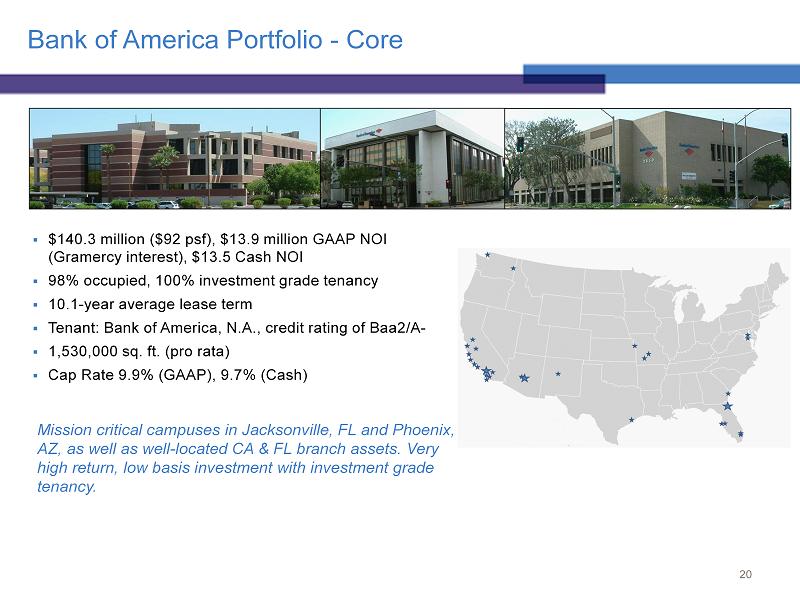
Bank of America Portfolio - Core ▪ $ 140.3 million ($ 92 psf), $ 13.9 million GAAP NOI (Gramercy interest ), $13.5 Cash NOI ▪ 98% occupied, 100% investment grade tenancy ▪ 10.1 - year average lease term ▪ Tenant: Bank of America, N.A., credit rating of Baa2/A - ▪ 1,530,000 sq. ft. (pro rata ) ▪ Cap Rate 9.9% (GAAP), 9.7% (Cash) 20 Mission critical campuses in Jacksonville, FL and Phoenix, AZ, as well as well - located CA & FL branch assets. Very high return, low basis investment with investment grade tenancy.
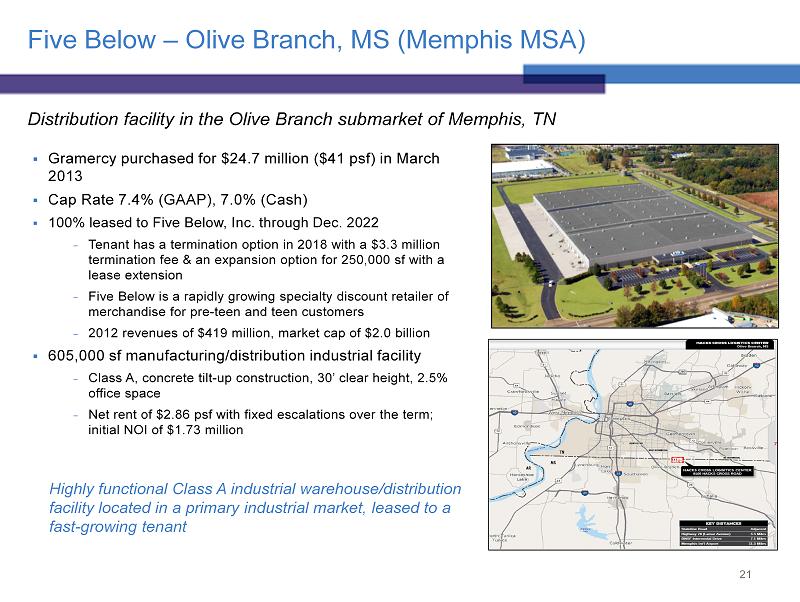
Five Below – Olive Branch, MS (Memphis MSA) Distribution facility in the Olive Branch submarket of Memphis, TN ▪ Gramercy purchased for $24.7 million ($41 psf) in March 2013 ▪ Cap Rate 7.4% (GAAP), 7.0% (Cash) ▪ 100% leased to Five Below, Inc. through Dec. 2022 − Tenant has a termination option in 2018 with a $3.3 million termination fee & an expansion option for 250,000 sf with a lease extension − Five Below is a rapidly growing specialty discount retailer of merchandise for pre - teen and teen customers − 2012 revenues of $419 million, market cap of $2.0 billion ▪ 605,000 sf manufacturing/distribution industrial facility − Class A, concrete tilt - up construction, 30’ clear height, 2.5% office space − Net rent of $ 2.86 psf with fixed escalations over the term; initial NOI of $1.73 million 21 Highly functional Class A industrial warehouse/distribution facility located in a primary industrial market, leased to a fast - growing tenant
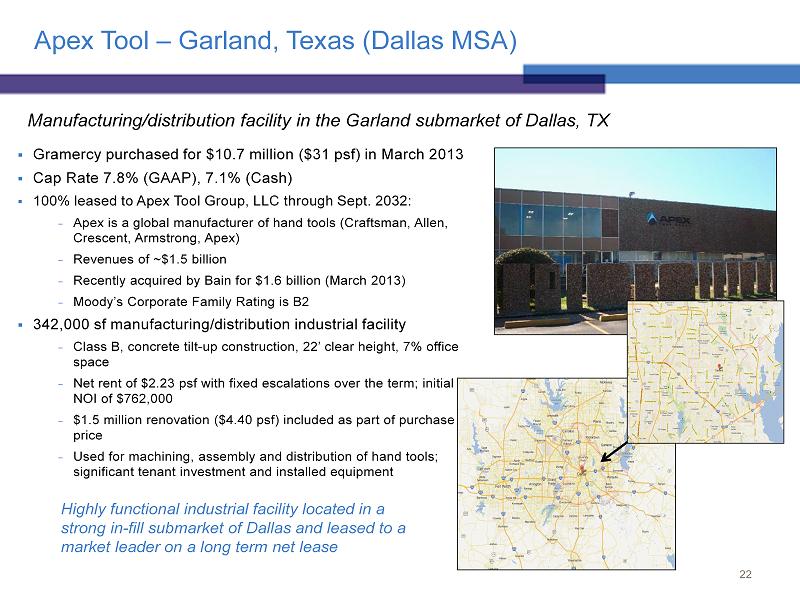
Apex Tool – Garland, Texas (Dallas MSA) Manufacturing/distribution facility in the Garland submarket of Dallas, TX ▪ Gramercy purchased for $10.7 million ($31 psf) in March 2013 ▪ Cap Rate 7.8% (GAAP), 7.1% (Cash) ▪ 100% leased to Apex Tool Group, LLC through Sept. 2032 : − Apex is a global manufacturer of hand tools (Craftsman, Allen, Crescent, Armstrong, Apex) − Revenues of ~$ 1.5 billion − Recently acquired by Bain for $1.6 billion (March 2013) − Moody’s Corporate Family Rating is B2 ▪ 342,000 sf manufacturing/distribution industrial facility − Class B, concrete tilt - up construction, 22’ clear height, 7% office space − Net rent of $ 2.23 psf with fixed escalations over the term; initial NOI of $762,000 − $1.5 million renovation ($4.40 psf) included as part of purchase price − Used for machining, assembly and distribution of hand tools; significant tenant investment and installed equipment 22 Highly functional industrial facility located in a strong in - fill submarket of Dallas and leased to a market leader on a long term net lease

Con - way Truck Terminal – East Brunswick, NJ ▪ Gramercy purchased for $11.7 million ($115,842/door) in March 2013 ▪ Cap Rate 8.1% (GAAP, Cash), CPI escalations ▪ 100 % leased to Con - way Freight Inc. through Jan. 2019 with three 10 - year renewal options: − Con - Way: $5.6 billion revenue in 2012, ~$2.4 billion market cap , credit rating of Baa3/BBB - − Con - way Freight constitutes ~60% of total company revenue and 63% of total company operating income ▪ 101 - door Freight Truck Terminal facility located on 16 acres − Built in 1975, 50 - foot cross - dock terminal with clear heights of 13’ - 16 ’, 38 ,046 sf of terminal space (including 10,000 sf of office space), and a fueling station − A nnual net rent of $940,000 ($776 monthly rent per door) increasing annually with CPI each October − YRC permanently assigned the lease to Conway in April 2012, validating the contractual in - place rent − Unique asset for the area due the high door count and size of the terminal 23 Critical asset located in an infill location with high barriers to entry Truck Terminal located in Northern NJ, less than two miles from I - 95 Subject Property
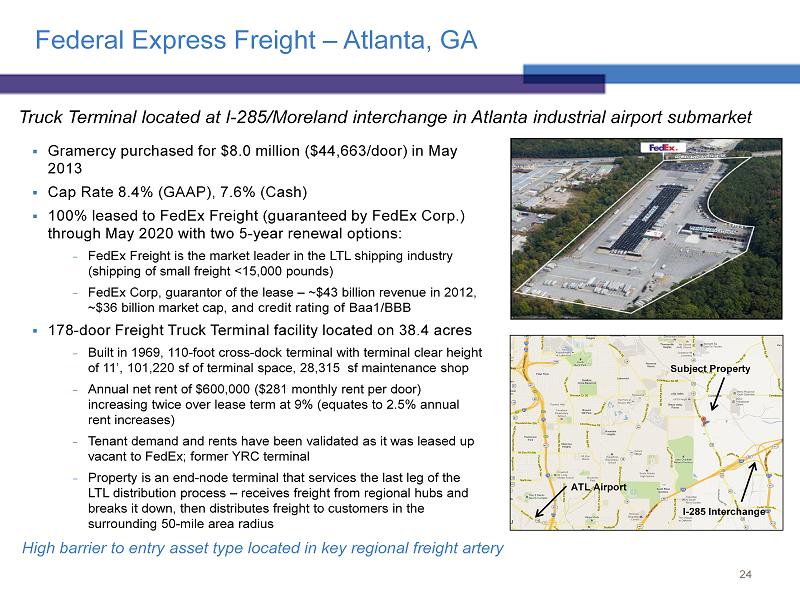
Federal Express Freight – Atlanta, GA ▪ Gramercy purchased for $8.0 million ($44,663/door) in May 2013 ▪ Cap Rate 8.4% (GAAP), 7.6% (Cash) ▪ 100 % leased to FedEx Freight (guaranteed by FedEx Corp.) through May 2020 with two 5 - year renewal options: − FedEx Freight is the market leader in the LTL shipping industry (shipping of small freight <15,000 pounds) − FedEx Corp, guarantor of the lease – ~$43 billion revenue in 2012, ~$36 billion market cap , and credit rating of Baa1/BBB ▪ 178 - door Freight Truck Terminal facility located on 38.4 acres − Built in 1969, 110 - foot cross - dock terminal with terminal clear height of 11 ’, 101,220 sf of terminal space, 28,315 sf maintenance shop − A nnual net rent of $ 600,000 ($281 monthly rent per door) increasing twice over lease term at 9% (equates to 2.5 % annual rent increases) − T enant demand and rents have been validated as it was leased up vacant to FedEx; former YRC terminal − Property is an end - node terminal that services the last leg of the LTL distribution process – receives freight from regional hubs and breaks it down, then distributes freight to customers in the surrounding 50 - mile area radius 24 High barrier to entry asset type located in key regional freight artery Truck Terminal located at I - 285/Moreland interchange in Atlanta industrial airport submarket ATL Airport I - 285 Interchange Subject Property

Federal Express Corp. – Bellmawr, NJ (Philadelphia MSA) Shipping Facility serving Southern NJ / Philadelphia MSA ▪ Gramercy purchased for $4.2 million ($67 psf) in April 2013 ▪ Cap Rate 7.5% (GAAP), 7.0% (Cash) ▪ 100 % leased to FedEx Express through Oct. 2022 with two 5 - year renewal options: − FedEx Express is the world’s largest express transportation company, providing service to more than 220 countries − Parent company (FedEx Corp.) – ~$43 billion revenue in 2012, ~$36 billion market cap , and credit rating of Baa1/BBB ▪ 62,230 sf shipping facility located on 3.85 acres − B uilt in 1994 as built - to - suit for FedEx, configured for two - sided loading − Clear heights are 17’ - 18’ , 6,450 sf of office space (10.4% of GLA) − N et rent of $4.69 psf, increasing three times over lease term to $5.55 psf by lease - end (equates to 1.7% annual rent increases ); initial year NOI of $292,000 − Lease was recently renewed (in October 2012) at market rents − Infill location in Interstate Business Park – optimally positioned for small parcel service in the nearby Camden and Gloucester Counties, as well as larger package shipping to Southern NJ and the greater Philadelphia area 25 Mission - critical shipping facility in a strong in - fill location with rents recently marked to market
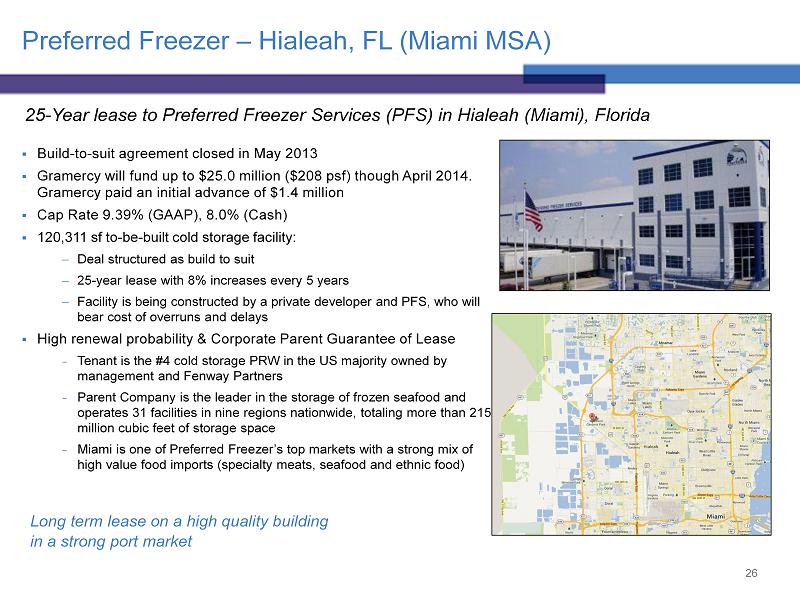
Preferred Freezer – Hialeah, FL (Miami MSA) ▪ Build - to - suit agreement closed in May 2013 ▪ Gramercy will fund up to $25.0 million ($ 208 psf) though April 2014. Gramercy paid an initial advance of $1.4 million ▪ Cap Rate 9.39% (GAAP), 8.0% (Cash) ▪ 120,311 sf to - be - built cold storage facility: Deal structured as build to suit 25 - year lease with 8% increases every 5 years Facility is being constructed by a private developer and PFS, who will bear cost of overruns and delays ▪ High renewal probability & Corporate Parent Guarantee of Lease − Tenant is the #4 cold storage PRW in the US majority owned by management and Fenway Partners − Parent Company is the leader in the storage of frozen seafood and operates 31 facilities in nine regions nationwide, totaling more than 215 million cubic feet of storage space − Miami is one of Preferred Freezer’s top markets with a strong mix of high value food imports (specialty meats, seafood and ethnic food) 26 25 - Year lease to Preferred Freezer Services (PFS) in Hialeah (Miami), Florida Long term lease on a high quality building in a strong port market
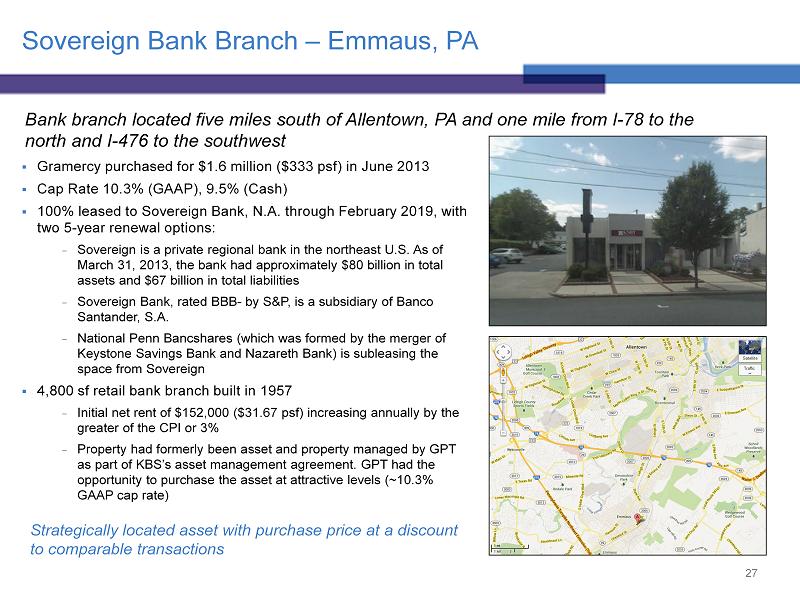
Sovereign Bank Branch – Emmaus, PA ▪ Gramercy purchased for $ 1.6 million ($ 333 psf) in June 2013 ▪ Cap Rate 10.3% (GAAP), 9.5% (Cash) ▪ 100 % leased to Sovereign Bank, N.A. through February 2019, with two 5 - year renewal options: − Sovereign is a private regional bank in the northeast U.S. As of March 31, 2013, the bank had approximately $80 billion in total assets and $67 billion in total liabilities − Sovereign Bank, rated BBB - by S&P, is a subsidiary of Banco Santander, S.A. − National Penn Bancshares (which was formed by the merger of Keystone Savings Bank and Nazareth Bank) is subleasing the space from Sovereign ▪ 4,800 sf retail bank branch built in 1957 − Initial net rent of $ 152,000 ($31.67 psf) increasing annually by the greater of the CPI or 3% − Property had formerly been asset and property managed by GPT as part of KBS’s asset management agreement. GPT had the opportunity to purchase the asset at attractive levels (~10.3% GAAP cap rate) 27 Bank branch located five miles south of Allentown, PA and one mile from I - 78 to the north and I - 476 to the southwest Strategically located asset with purchase price at a discount to comparable transactions
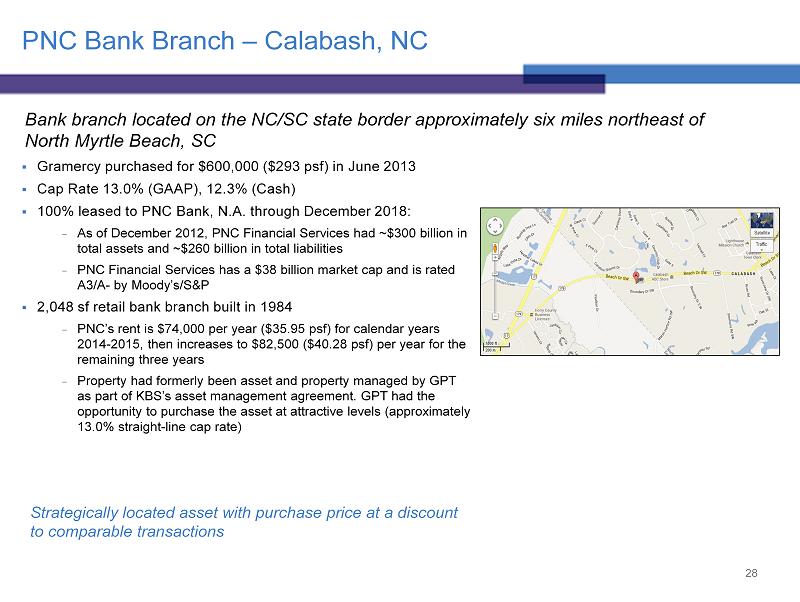
PNC Bank Branch – Calabash, NC ▪ Gramercy purchased for $ 600,000 ($ 293 psf) in June 2013 ▪ Cap Rate 13.0% (GAAP), 12.3% (Cash) ▪ 100% leased to PNC Bank, N.A. through December 2018: − As of December 2012, PNC Financial Services had ~$300 billion in total assets and ~$260 billion in total liabilities − PNC Financial Services has a $38 billion market cap and is rated A3/A - by Moody’s/S&P ▪ 2,048 sf retail bank branch built in 1984 − PNC’s rent is $ 74,000 per year ($ 35.95 psf) for calendar years 2014 - 2015 , then increases to $82,500 ($ 40.28 psf) per year for the remaining three years − Property had formerly been asset and property managed by GPT as part of KBS’s asset management agreement. GPT had the opportunity to purchase the asset at attractive levels (approximately 13.0% straight - line cap rate ) 28 Bank branch located on the NC/SC state border approximately six miles northeast of North Myrtle Beach, SC Strategically located asset with purchase price at a discount to comparable transactions
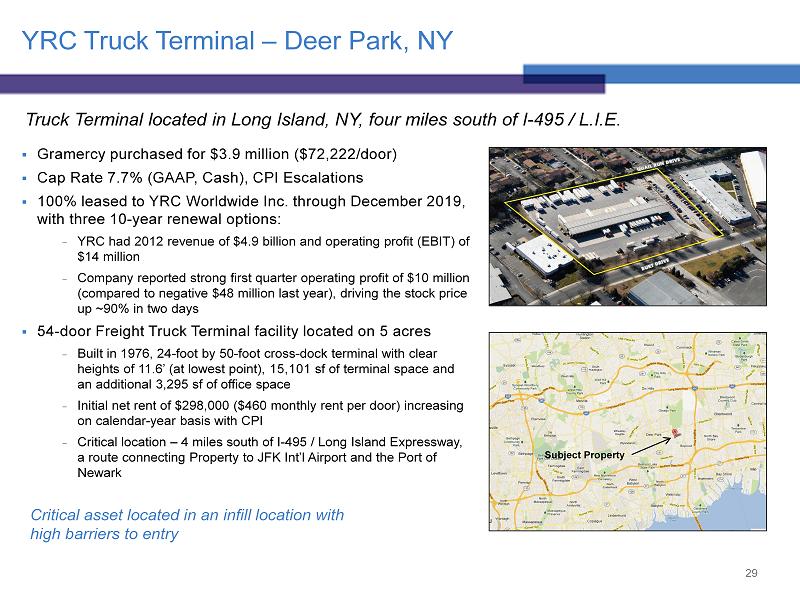
YRC Truck Terminal – Deer Park, NY ▪ Gramercy purchased for $3.9 million ($72,222/door) ▪ Cap Rate 7.7% (GAAP, Cash), CPI Escalations ▪ 100 % leased to YRC Worldwide Inc. through December 2019, with three 10 - year renewal options: − YRC had 2012 revenue of $ 4.9 billion and operating profit (EBIT) of $14 m illion − Company reported strong first quarter operating profit of $10 million (compared to negative $48 million last year), driving the stock price up ~90% in two days ▪ 54 - door Freight Truck Terminal facility located on 5 acres − Built in 1976, 24 - foot by 50 - foot cross - dock terminal with clear heights of 11.6’ (at lowest point) , 15,101 sf of terminal space and an additional 3,295 sf of office space − Initial net rent of $298,000 ($460 monthly rent per door) increasing on calendar - year basis with CPI − Critical location – 4 miles south of I - 495 / Long Island Expressway, a route connecting Property to JFK Int’l Airport and the Port of Newark 29 Truck Terminal located in Long Island, NY, four miles south of I - 495 / L.I.E. Subject Property Critical asset located in an infill location with high barriers to entry
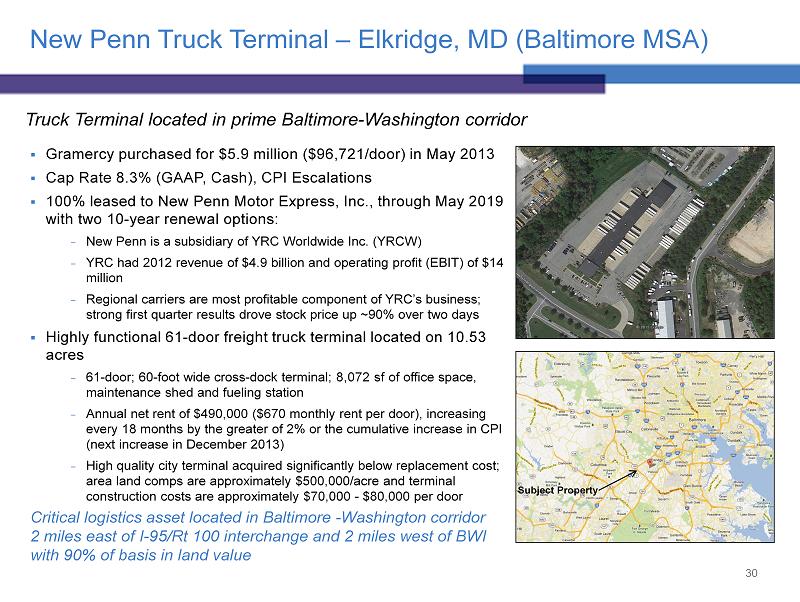
New Penn Truck Terminal – Elkridge, MD (Baltimore MSA) ▪ Gramercy purchased for $5.9 million ($96,721/door) in May 2013 ▪ Cap Rate 8.3% (GAAP, Cash), CPI Escalations ▪ 100 % leased to New Penn Motor Express, Inc., through May 2019 with two 10 - year renewal options: − New Penn is a subsidiary of YRC Worldwide Inc. (YRCW) − YRC had 2012 revenue of $ 4.9 billion and operating profit (EBIT) of $14 million − Regional carriers are most profitable component of YRC’s business; strong first quarter results drove stock price up ~90% over two days ▪ Highly functional 61 - door f reight t ruck t erminal located on 10.53 acres − 61 - door; 60 - foot wide cross - dock terminal ; 8,072 sf of office space, maintenance shed and fueling station − A nnual net rent of $490,000 ($670 monthly rent per door), increasing every 18 months by the greater of 2% or the cumulative increase in CPI (next increase in December 2013) − High quality city terminal acquired significantly below replacement cost; area land comps are approximately $500,000/acre and terminal construction costs are approximately $70,000 - $80,000 per door 30 Critical logistics asset located in Baltimore - W ashington corridor 2 miles east of I - 95/Rt 100 interchange and 2 miles west of BWI with 90% of basis in land value Truck Terminal located in prime Baltimore - Washington corridor Subject Property
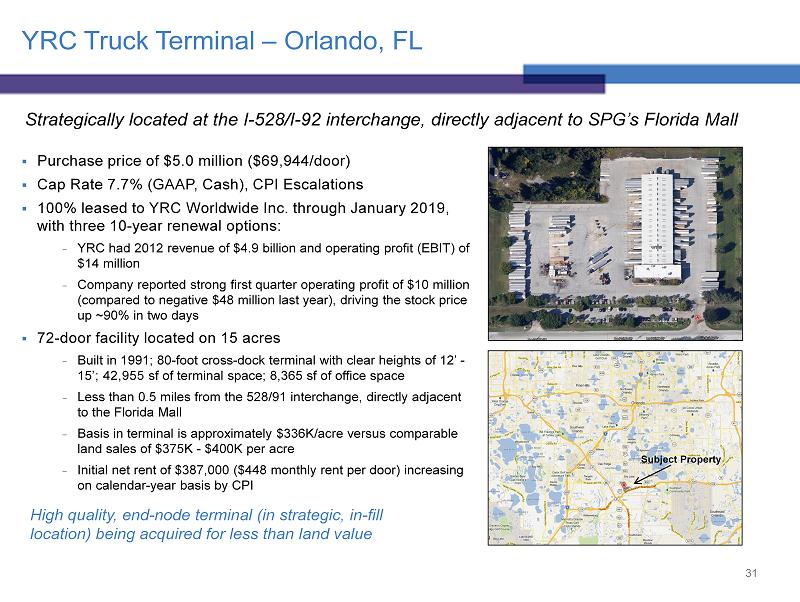
YRC Truck Terminal – Orlando, FL ▪ Purchase price of $5.0 million ($69,944/door) ▪ Cap Rate 7.7% (GAAP, Cash), CPI Escalations ▪ 100 % leased to YRC Worldwide Inc. through January 2019, with three 10 - year renewal options: − YRC had 2012 revenue of $ 4.9 billion and operating profit (EBIT) of $14 million − Company reported strong first quarter operating profit of $10 million (compared to negative $48 million last year), driving the stock price up ~90% in two days ▪ 72 - door facility located on 15 acres − Built in 1991; 80 - foot cross - dock terminal with clear heights of 12’ - 15 ’; 42,955 sf of terminal space; 8,365 sf of office space − Less than 0.5 miles from the 528/91 interchange, directly adjacent to the Florida Mall − Basis in terminal is approximately $336K/acre versus comparable land sales of $375K - $400K per acre − Initial net rent of $387,000 ($448 monthly rent per door) increasing on calendar - year basis by CPI 31 Strategically located at the I - 528/I - 92 interchange, directly adjacent to SPG’s Florida Mall High quality, end - node terminal (in strategic, in - fill location) being acquired for less than land value Subject Property
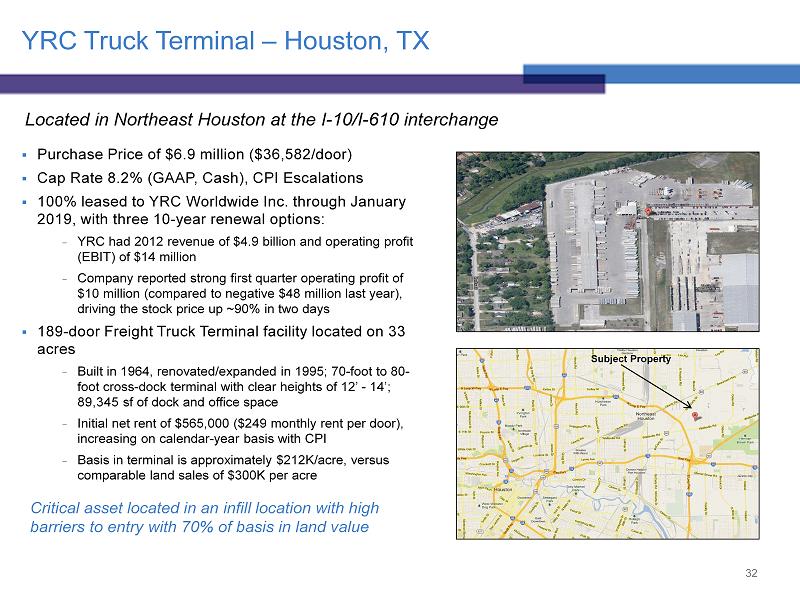
YRC Truck Terminal – Houston, TX ▪ Purchase Price of $6.9 million ($36,582/door) ▪ Cap Rate 8.2% (GAAP, Cash), CPI Escalations ▪ 100 % leased to YRC Worldwide Inc. through January 2019, with three 10 - year renewal options: − YRC had 2012 revenue of $ 4.9 billion and operating profit (EBIT) of $14 million − Company reported strong first quarter operating profit of $10 million (compared to negative $48 million last year), driving the stock price up ~90% in two days ▪ 189 - door Freight Truck Terminal facility located on 33 acres − Built in 1964, renovated/expanded in 1995; 70 - foot to 80 - foot cross - dock terminal with clear heights of 12’ - 14 ’; 89,345 sf of dock and office space − Initial net rent of $565,000 ($249 monthly rent per door), increasing on calendar - year basis with CPI − Basis in terminal is approximately $212K/acre, versus comparable land sales of $ 300K per acre 32 L ocated in Northeast Houston at the I - 10/I - 610 interchange Subject Property Critical asset located in an infill location with high barriers to entry with 70% of basis in land value

KAR Adesa – Automotive Auction Facility (Dallas MSA) ▪ Gramercy purchased a 175 - acre auto auction site (“the Property”) located in Hutchins, TX (Dallas MSA) for $58.5 million ($335,051/acre ) in June 2013. Cap Rate 9.7% (GAAP), 8.4% (Cash) 175 acres (7.6 million sf): 158 - acre paved site and 17 acres of raw undeveloped land State - of - the - art automotive auction facility: Three LEED Silver Certified office buildings: 64,400 sf Arena Building, 4,700 sf Tech Building, and 7 - lane 107,700 sf Reconditioning Facility; 15,000 paved parking spaces; 14 sale lanes ▪ Site is leased to ADESA through June 30, 2029 (16 years remaining) Lease is guaranteed by KAR Auction Services, Inc. (NYSE: KAR), one of the largest wholesale automotive auction companies in North America with $2.0 billion in revenues and $92 million in net income in 2012 Initial NOI is $4.9 million, with 1.75% - 2.00% annual rent increases Long term lease to high quality tenant with high likelihood of lease renewal & downside protection on value of improved land 33 Aerial Photo of the Property ▪ Match - term financed GPT assumed a 16 - year fully - amortizing loan of $26.3 million ($32.2 million net equity), held by Aviva Life and Annuity Company ▪ Site is configured with the necessary infrastructure (access to water, utilities and sewage) such that Property could undergo a future adaptive reuse Gramercy engaged CBRE to prepare a development study that outlined the potential for construction of 2.9 million square feet of industrial space, representing 38% of the total site coverage
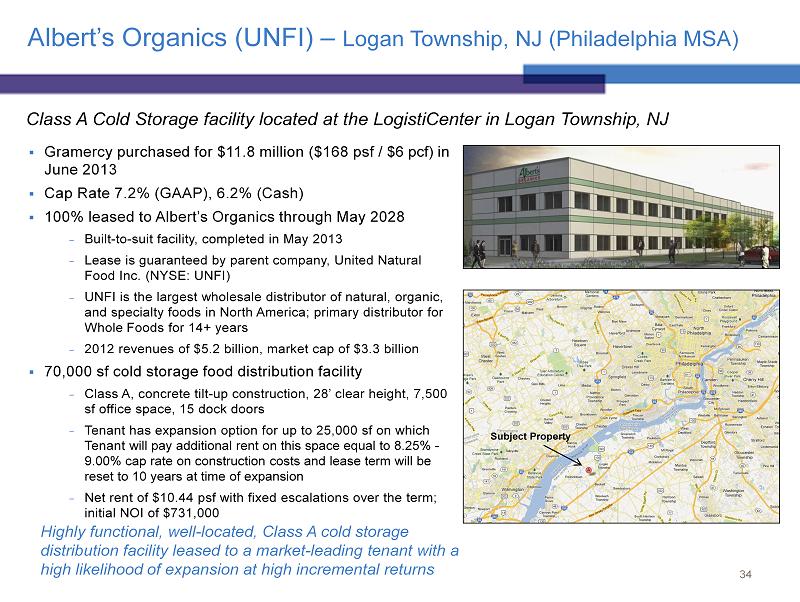
Albert’s Organics (UNFI) – Logan Township, NJ (Philadelphia MSA) Class A Cold S torage facility located at the LogistiCenter in Logan Township, NJ ▪ Gramercy purchased for $11.8 million ($168 psf / $6 pcf) in June 2013 ▪ Cap Rate 7.2% (GAAP), 6.2% (Cash) ▪ 100% leased to Albert’s Organics through May 2028 − Built - to - suit facility, completed in May 2013 − Lease is guaranteed by parent company, United Natural Food Inc. (NYSE: UNFI) − UNFI is the largest wholesale distributor of natural, organic, and specialty foods in North America; primary distributor for Whole Foods for 14+ years − 2012 revenues of $5.2 billion, market cap of $3.3 billion ▪ 70,000 sf cold storage food distribution facility − Class A, concrete tilt - up construction, 28’ clear height, 7,500 sf office space, 15 dock doors − Tenant has expansion option for up to 25,000 sf on which Tenant will pay additional rent on this space equal to 8.25% - 9.00% cap rate on construction costs and lease term will be reset to 10 years at time of expansion − Net rent of $10.44 psf with fixed escalations over the term; initial NOI of $731,000 34 Highly functional, well - located, Class A cold storage distribution facility leased to a market - leading tenant with a high likelihood of expansion at high incremental returns Subject Property
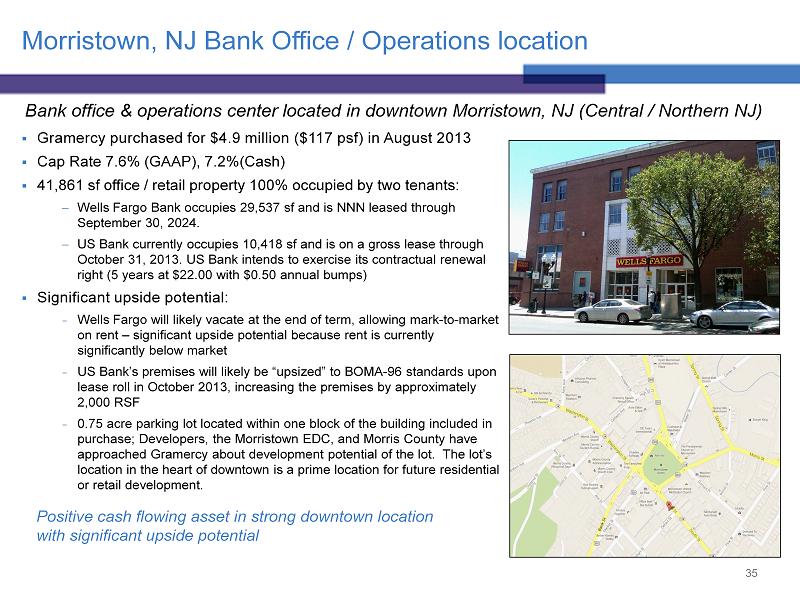
Morristown, NJ Bank Office / Operations location ▪ Gramercy purchased for $ 4.9 million ($ 117 psf) in August 2013 ▪ Cap Rate 7.6% (GAAP), 7.2%( Cash ) ▪ 41,861 sf office / retail property 100% occupied by two tenants: Wells Fargo Bank occupies 29,537 sf and is NNN leased through September 30, 2024. US Bank currently occupies 10,418 sf and is on a gross lease through October 31, 2013. US Bank intends to exercise its contractual renewal right ( 5 years at $ 22.00 with $0.50 annual bumps) ▪ Significant upside potential: − Wells Fargo will likely vacate at the end of term, allowing mark - to - market on rent – significant upside potential because rent is currently significantly below market − US Bank’s premises will likely be “upsized” to BOMA - 96 standards upon lease roll in October 2013, increasing the premises by approximately 2,000 RSF − 0.75 acre parking lot located within one block of the building included in purchase; Developers , the Morristown EDC, and Morris County have approached Gramercy about development potential of the lot. The lot’s location in the heart of downtown is a prime location for future residential or retail development . 35 Bank office & operations center located in downtown Morristown, NJ (Central / Northern NJ) Positive cash flowing asset in strong downtown location with significant upside potential
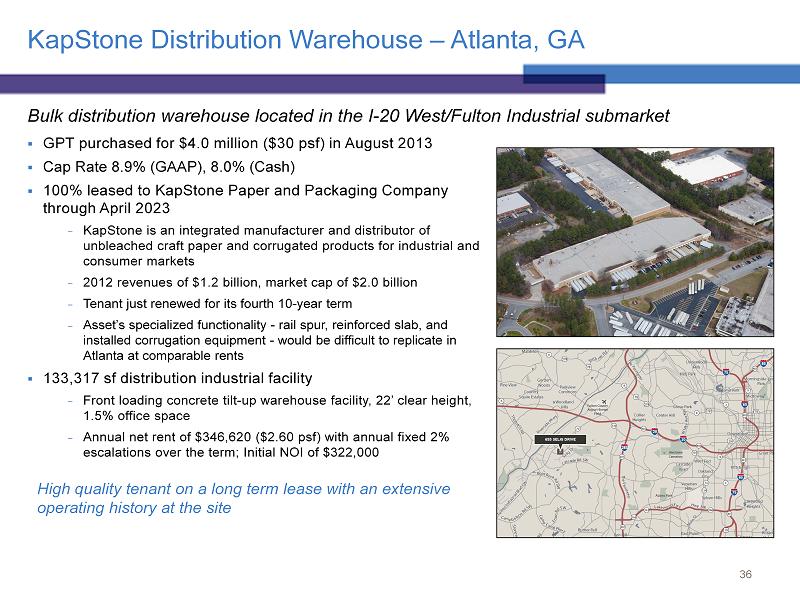
KapStone Distribution Warehouse – Atlanta, GA Bulk distribution warehouse located in the I - 20 West/Fulton Industrial submarket ▪ GPT purchased for $ 4.0 million ($ 30 psf) in August 2013 ▪ Cap Rate 8.9 % (GAAP ), 8.0% (Cash) ▪ 100 % leased to KapStone Paper and Packaging Company through April 2023 − KapStone is an integrated manufacturer and distributor of unbleached c raft paper and corrugated products for industrial and consumer markets − 2012 revenues of $ 1.2 billion, market cap of $2.0 billion − Tenant just renewed for its fourth 10 - year term − A sset’s specialized functionality - rail spur, reinforced slab, and installed corrugation equipment - would be difficult to replicate in Atlanta at comparable rents ▪ 133,317 sf distribution industrial facility − Front loading concrete tilt - up warehouse facility, 22’ clear height, 1.5% office space − Annual net rent of $346,620 ($ 2.60 psf) with annual fixed 2% escalations over the term; Initial NOI of $ 322,000 36 High quality tenant on a long term lease with an extensive operating history at the site
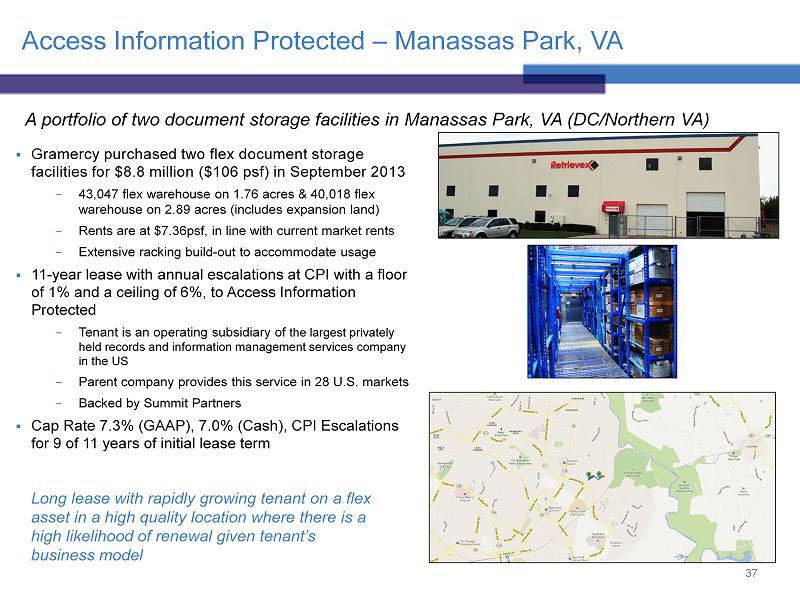
Access Information Protected – Manassas Park, VA ▪ Gramercy purchased two flex document storage facilities for $8.8 million ($106 psf) in September 2013 − 43,047 flex warehouse on 1.76 acres & 40,018 flex warehouse on 2.89 acres (includes expansion land) − Rents are at $7.36psf, in line with current market rents − Extensive racking build - out to accommodate usage ▪ 11 - year lease with annual escalations at CPI with a floor of 1% and a ceiling of 6%, to Access Information Protected − Tenant is an operating subsidiary of the largest privately held records and information management services company in the US − Parent company provides this service in 28 U.S. markets − Backed by Summit Partners ▪ Cap Rate 7.3% (GAAP), 7.0% (Cash), CPI Escalations for 9 of 11 years of initial lease term 37 A portfolio of two document storage facilities in Manassas Park, VA (DC/Northern VA) Long lease with rapidly growing tenant on a flex asset in a high quality location where there is a high likelihood of renewal given tenant’s business model
38 Appendix B
Disclosure of Commitments and Contingencies ▪ In December 2010, the Company sold the Company's 45% joint venture interest in the leased fee of the 2 Herald Square property in New York, New York, for approximately $25.6 million, plus assumed mortgage debt of approximately $86.1 million (the “2 Herald Sale Transaction”). Subsequent to the closing of the transaction, the New York City Department of Finance (“NYC DOF”) and New York State Department of Taxation (“NYS DOT ”) issued notices of determination assessing, in the case of the NYC DOF notice, approximately $2.9 million of real property transfer tax, plus interest, and, in the case of the NYS DOT notice, approximately $684 thousand of real property transfer tax, plus interest (collectively, the “Transfer Tax Assessments”), against the Company in connection with the 2 Herald Sale Transaction. The Company believes that NYC DOF and NYS DOT erred in issuing the Transfer Tax Assessments and intends to vigorously defend against same. In September 2013, the Company filed a petition challenging the NYC DOF Transfer Tax Assessment with the New York City Tax Appeal Tribunal , and the Company intends to timely filing a similar petition challenging the NYS DOF Transfer Tax Assessment . ▪ The Company believes that it has strong defenses against the Transfer Tax Assessments and intends to continue to vigorously assert same. The Company evaluates contingencies based on information currently available , including the advice of counsel. The Company establishes accruals for litigation and claims when a loss contingency is considered probable and the related amount is reasonably estimable. The Company will periodically review these contingences and may adjust the amount of the accrual if circumstances change. The outcome of a contingent matter and the amount or range of potential losses at particular points may be difficult to ascertain. If a range of loss is estimated and an amount within such range appears to be a better estimate than any other amount within that range, then that amount is accrued. As of June 30, 2013, the Company had not established any accrual for the Transfer Tax Assessments. ▪ The Company believes that even an adverse determination of the Transfer Tax Assessments would not have a material adverse effect on the Company’s business, consolidated financial position, results of operations or cash flows , taken as a whole. ▪ Other than as disclosed above, the Company is not presently aware of any litigation, claims or other legal proceeding that it will be required to disclose when it files its Form 10 - Q for the period ended September 30, 2013. 39