UNITED STATES
SECURITIES AND EXCHANGE COMMISSION
Washington, D.C. 20549
FORM 10-K
 | | |
| x | | ANNUAL REPORT PURSUANT TO SECTION 13 OR 15(d)
OF THE SECURITIES EXCHANGE ACT OF 1934 |
For the fiscal year ended December 31, 2013
or
| | |
| o | | TRANSITION REPORT PURSUANT TO SECTION 13 OR 15(d)
OF THE SECURITIES EXCHANGE ACT OF 1934 |
For the transition period from . to .
Commission File No. 1-32248
GRAMERCY PROPERTY TRUST INC.
(Exact name of registrant as specified in its charter)
| | |
| Maryland | | 06-1722127 |
(State or other jurisdiction
incorporation or organization) | | (I.R.S. Employer of
Identification No.) |
521 5th Avenue, 30th Floor, New York, NY 10175
(Address of principal executive offices — zip code)
(212) 297-1000
(Registrant’s telephone number, including area code)
SECURITIES REGISTERED PURSUANT TO SECTION 12(b) OF THE ACT:
| | |
| Title of Each Class | | Name of Each Exchange on Which Registered |
Common Stock, $0.001 Par Value
Series A Cumulative Redeemable
Preferred Stock, $0.001 Par Value | | New York Stock Exchange
New York Stock Exchange |
SECURITIES REGISTERED PURSUANT TO SECTION 12(g) OF THE ACT:None
Indicate by check mark if the registrant is a well-known seasoned issuer, as defined in Rule 405 of the Securities Act.Yeso Nox
Indicate by check mark if the registrant is not required to file reports pursuant to Section 13 or Section 15(d) of the Act.Yeso Nox
Indicate by check mark whether the registrant (1) has filed all reports required to be filed by Section 13 or 15(d) of the Securities Exchange Act of 1934 during the preceding 12 months (or for such shorter period that the registrant was required to file such reports), and (2) has been subject to such filing requirements for the past 90 days.Yesx Noo
Indicate by check mark whether the registrant has submitted electronically and posted on its corporate Website, if any, every Interactive Data File required to be submitted and posted pursuant to Rule 405 of Regulation S-T (Section 232.405 of this chapter) during the preceding 12 months (or for such shorter period that the registrant was required to submit and post such files).Yesx Noo
Indicate by check mark if disclosure of delinquent filers pursuant to Item 405 of Regulation S-K is not contained herein, and will not be contained, to the best of the registrant’s knowledge, in definitive proxy or information statements incorporated by reference in Part III of this Form 10-K or any amendment to this Form 10-K.o
Indicate by check mark whether the registrant is a large accelerated filer, an accelerated filer, a non-accelerated filer or a small reporting company. See the definitions of “large accelerated filer,” “accelerated filer” and “small reporting company” in Rule 12b-2 of the Exchange Act.
| | | | | | |
| Large accelerated filero | | Accelerated filerx | | Non-accelerated filero | | Smaller reporting companyo |
| | | | | (Do not check if a smaller reporting company) |
Indicate by check mark whether the registrant is a shell company (as defined in Rule 12b-2 of the Exchange Act).Yeso Nox
As of March 14, 2014, there were 71,409,485 shares of the Registrant’s common stock outstanding. The aggregate market value of common stock held by non-affiliates of the registrant (55,372,672 shares) at June 30, 2013, was $249,177,024. The aggregate market value was calculated by using the closing price of the common stock as of that date on the New York Stock Exchange, which was $4.50 per share.
DOCUMENTS INCORPORATED BY REFERENCE
Portions of the registrant’s Definitive Proxy Statement for its 2014 Annual Meeting of Stockholders expected to be filed within 120 days after the close of the registrant’s fiscal year are incorporated by reference into Part III of this Annual Report on Form 10-K.
TABLE OF CONTENTS
GRAMERCY PROPERTY TRUST INC.
FORM 10-K
TABLE OF CONTENTS
10-K PART AND ITEM NO.
| | |
| | Page |
PART I
| |
1. Business | | | 1 | |
1A. Risk Factors | | | 15 | |
1B. Unresolved Staff Comments | | | 35 | |
2. Properties | | | 35 | |
3. Legal Proceedings | | | 38 | |
4. Mine Safety Disclosures | | | 39 | |
PART II
| |
5. Market for Registrant’s Common Equity, Related Stockholders Matters and Issuer Purchases of Equity Securities | | | 40 | |
6. Selected Financial Data | | | 43 | |
7. Management’s Discussion and Analysis of Financial Condition and Results of Operations | | | 45 | |
7A. Quantitative and Qualitative Disclosures About Market Risk | | | 70 | |
8. Financial Statements and Supplementary Data | | | 71 | |
9. Changes in and Disagreements with Accountants on Accounting and Financial Disclosure | | | 131 | |
9A. Controls and Procedures | | | 131 | |
9B. Other Information | | | 131 | |
PART III
| |
10. Directors, Executive Officers and Corporate Governance of the Registrant | | | 132 | |
11. Executive Compensation | | | 132 | |
12. Security Ownership of Certain Beneficial Owners and Management and Related Stockholder Matters | | | 132 | |
13. Certain Relationships and Related Transactions and Director Independence | | | 132 | |
14. Principal Accounting Fees and Services | | | 132 | |
PART IV
| |
15. Exhibits, Financial Statements and Schedules | | | 133 | |
| Signatures | | | 139 | |
i
TABLE OF CONTENTS
Part I
General
Gramercy Property Trust Inc., or the “Company” or “Gramercy,” is a fully-integrated, self-managed commercial real estate investment company focused on acquiring and managing income-producing industrial and office properties net leased to high quality tenants in major markets throughout the United States. We also operate an asset management business that manages for third-parties, including our Bank of America Portfolio joint venture, commercial real estate assets.
Gramercy was founded in 2004 as a specialty finance Real Estate Investment Trust, or REIT, focused on originating and acquiring loans and securities related to commercial and multifamily properties. In July 2012, following a strategic review, our board of directors announced a repositioning of Gramercy as an equity REIT focused on acquiring and managing income producing net leased real estate. To reflect this transformation, in April 2013 we changed our name from Gramercy Capital Corp. to Gramercy Property Trust Inc. and changed our ticker symbol to “GPT” on the New York Stock Exchange.
As of December 31, 2013, we owned interests (either directly or through a joint venture) in 107 properties containing an aggregate of approximately 7.8 million rentable square feet.
Company Repositioning Milestones
We have achieved a number of important milestones since our board of directors elected to reposition our company as a REIT focused on acquiring and managing income producing net leased properties, including:
Sold Specialty Finance Business/Assets and Reduced Costs
| • | In March 2013, we sold our collateral management and sub-special servicing contracts for our three Collateralized Debt Obligations, or CDOs, disposed of certain non-core legacy assets and exited the commercial real estate finance business; and, |
| • | We downsized our New York City headquarters office, closed one satellite property management office, reduced employee headcount, rebid our professional consulting and insurance contracts and reduced annual run rate management, general and administrative expenses, or MG&A expenses. |
Raised Capital and Repaid Accrued Preferred Stock Dividends
| • | In September 2013, we entered into a $100.0 million senior secured credit facility which was increased to $150.0 million in February 2014; |
| • | In October 2013, we issued and sold 11.5 million shares of our common stock in a private placement at a price of $4.11 per share, resulting in total net proceeds to us of approximately $45.5 million; and, |
| • | In December 2013, our board of directors declared, and in January 2014 we paid in full, the accrued and unpaid dividends on our Cumulative Redeemable Preferred Stock, or Series A Preferred Stock, and began the timely payment of the quarterly preferred dividends beginning with the dividend due January 15, 2014, positioning us to re-commence dividends on our common stock. |
Assembled a High-Quality Net Leased Portfolio
As of December 31, 2013, we owned, directly or through joint ventures, a portfolio that consists of 107 industrial, office and specialty properties totaling approximately 7.8 million square feet. As of December 31, 2013, our portfolio has the following characteristics:
| • | a weighted average remaining lease term of 11.7 years (based on annualized base rent); |
| • | 53.5% investment grade tenancy (includes subsidiaries of non-guarantor investment grade parent companies) (based on annualized base rent); |
1
TABLE OF CONTENTS
| • | Industrial portfolio comprised of 4.2 million aggregate rentable square feet with an average base rent per square foot of $5.33; |
| • | Office portfolio comprised of 3.4 million aggregate rentable square feet with an average base rent per square foot of $9.53 (including the properties we own through joint ventures); |
| • | Specialty asset portfolio of three improved sites comprised of 186 acres of land and 256 thousand aggregate rentable square feet of building space that we lease to a car auction services company, a bus depot and a rental car company; and |
| • | Top five tenants by annualized base rent include: Bank of America, N.A. or Bank of America, guaranteed by Bank of America Corp. (31%); Adesa Texas, Inc., guaranteed by KAR Holdings, Inc. (11%); EF Transit, Inc., guaranteed by Monarch Beverage Co., Inc. (6%); AMCOR Rigid Plastics USA, Inc., guaranteed by Amcor Limited (6%); and Preferred Freezer Services of Hialeah, LLC, guaranteed by Preferred Freezer Services, LLC (5%). Our lease with Preferred Freezer Services of Hialeah, LLC starts upon completion of construction of the facility currently expected in the second quarter of 2014. |
Optimized Asset Management Business
| • | We executed or extended asset management contracts with third-party property owners, including our joint venture partners, resulting in an aggregate of $1.4 billion in assets under management at December 31, 2013; |
| • | During the year ended December 31, 2013, we generated $40.9 million in asset management revenue, including the collection of a $12.0 million out-performance fee (pre-tax) under our asset management agreement with an affiliate of KBS Real Estate Investment Trust, Inc., or KBS. |
Recent Developments
In January 2014, we paid in full the accrued and unpaid dividends on our Series A Preferred Stock and began the timely payment of the quarterly preferred dividends beginning with the dividend due January 15, 2014.
In February 2014, we acquired a 115 thousand square foot industrial property located in Des Plaines, Illinois, for a purchase price of approximately $6.3 million. The property is leased to one tenant through October 2025. In connection with the acquisition, we assumed a $2.7 million mortgage loan that matures in October 2020 and bears a fixed interest rate of 5.25%.
In February 2014, we exercised and the lenders approved the accordion feature to increase our $100.0 million senior credit facility to $150.0 million.
In March 2014, we announced that we will resume payment of a dividend to our common stockholders after a hiatus of more than five years. Our board of directors declared a quarterly dividend of $0.035 per common share for the first quarter of 2014, payable on April 15, 2014 to holders of record as of the close of business on March 31, 2014. We also announced that our board of directors declared the Series A Preferred Stock quarterly dividend payment in the amount of $0.50781 per share, for the period January 15, 2014, through and including April 14, 2014, payable on April 15, 2014 to holders of record as of the close of business on March 31, 2014.
2
TABLE OF CONTENTS
Corporate Structure
We were formed in April 2004 as a Maryland corporation and we completed our initial public offering in August 2004. We conduct substantially all of our operations through our operating partnership, GPT Property Trust LP, or our Operating Partnership. We are the sole general partner of our Operating Partnership. Our Operating Partnership conducts our commercial real estate investment business through various wholly-owned entities and our third party asset management business primarily through a wholly-owned TRS. The chart below summarizes the organizational structure of our entities as of December 31, 2013:
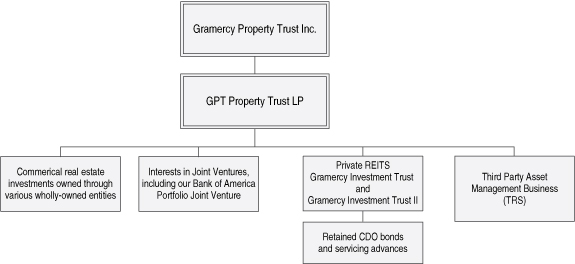
We have elected to be taxed as a REIT under the Internal Revenue Code of 1986, as amended, or the Internal Revenue Code, and generally will not be subject to U.S. federal income taxes to the extent we distribute our taxable income, if any, to our stockholders. We have in the past established, and may in the future establish, TRSs, to effect various taxable transactions. Those TRSs would incur U.S. federal, state and local taxes on the taxable income from their activities.
Unless the context requires otherwise, all references to “Gramercy,” “the Company,” “we,” “our,” and “us” in this Annual Report on Form 10-K mean Gramercy Property Trust Inc., a Maryland corporation, and one or more of its subsidiaries, including our Operating Partnership.
Our Investment Strategy
We seek to acquire and manage a diversified portfolio of high quality net leased properties that generates stable, predictable cash flows and protects investor capital over a long investment horizon. We expect that these properties generally will be leased to a single tenant. Under a net lease, the tenant typically bears the responsibility for all property related expenses such as real estate taxes, insurance, and repair and maintenance costs. We believe this lease structure provides an owner cash flows over the term of the lease that are more stable and predictable than other forms of leases, and minimizes the ongoing capital expenditures often required with other property types.
We approach the net leased market as a value investor, looking to identify and acquire net leased properties that we believe offer attractive risk adjusted returns throughout market cycles. We focus primarily on industrial and office properties, where we believe attractive investment opportunities currently exist. We focus on acquiring assets in major markets where strong demographic and economic growth offer, in our view, a higher probability of producing long term rent growth and/or capital appreciation. Our goal is to grow our existing portfolio and become a pre-eminent owner of net leased commercial industrial and office properties in the United States.
We believe that within the net leased industry, industrial and office investments offer a fundamentally different opportunity from the market for net leased retail assets. Industrial and office assets tend to be heterogeneous, and valuation is frequently influenced by local real estate market conditions and tenant
3
TABLE OF CONTENTS
preferences. In our view, the skillset required to properly underwrite industrial and office assets is specific to those assets and can be used to drive significant investment outperformance. We also believe that well-located industrial and office assets are better positioned to experience rent growth and asset price appreciation than single tenant retail assets in an inflationary environment.
Focus on Industrial Properties
Our strategy is to focus primarily on industrial properties and to pursue office properties on a more opportunistic basis. We believe industrial properties offer the most compelling risk adjusted returns in the net leased marketplace today. In our experience, industrial assets have more stable tenancy and a more direct and critical relationship to the tenant’s underlying operations. Industrial assets also have lower carrying costs when vacant, lower re-leasing costs to replace tenants and lower ongoing capital requirements during the period of ownership.
In our experience, net leased office — and specifically single tenant suburban office properties — can have contract rents that become very difficult to replicate at lease renewal. In addition, single tenant office properties can be difficult and costly to re-tenant and reconfigure as multi-tenant buildings. Office space also tends to be more generic, with weak links to the underlying operations making tenant switching costs very low for the tenants. We intend to pursue opportunistic net leased office transactions where we believe property specific factors and characteristics mitigate the above-referenced risks and the transaction offers compelling returns.
We do not plan to focus on net leased retail assets. We believe that there are many large, well-capitalized net leased REITs that currently focus on retail assets and we believe that the market for these assets is currently the most competitive within the overall net leased marketplace. In addition, retail leases typically have minimal rent increases, and many renewal options at fixed rents, which gives the tenant much of the benefit of any market or rent appreciation through an increase in the leasehold value of the asset. If specific opportunities arise or market conditions warrant, we may revisit this approach to net leased retail assets in the future.
Focus on Real Estate Fundamentals
We have observed that the net leased investing marketplace has evolved from a primarily credit-focused strategy with bond type net leased structures, very long lease terms, and bargain renewal options to one in which net leased investors face many of the same operational and market risks as other real estate investors. For this reason, we believe that real estate underwriting is an important aspect of our investment process. We believe that traditional real estate fundamentals will be the primary driver of investment performance in the net leased market for the foreseeable future, in contrast to the past practices where long lease terms and tenant credit quality were the primary drivers.
Target Industrial and Office Facilities
Target Markets with Attractive Characteristics — We plan to concentrate our investment activity in select target markets with the following characteristics: high quality infrastructure, diversified local economies with multiple economic drivers, strong demographics, pro-business local governments and high quality local labor pools. We believe that these markets offer a higher probability of producing long term rent growth and/or capital appreciation. As of December 31, 2013, approximately 85% of our portfolio (based on purchase price) is located in our target markets (based on purchase price).
Properties with Competitive Rents to Market — We target properties with contract rents that are at or below rents that are available in the market for similar properties as a way to reduce the volatility of cash flows that can occur upon the expiration of a lease. We specifically target properties where rents have been rolled down, post-financial crisis.
Properties with Long Lease Terms — We generally target properties that have between 5 and 20 years of non-cancelable lease terms. We believe that longer lease terms provide more stable cash flows, are less susceptible to changes in market conditions and require less capital expenditure to maintain tenancy.
Core Properties Acquired at Above Market Yields Due to Some Market Inefficiency — We seek opportunities to acquire core properties at attractive prices due to a mispricing of credit or real estate risk, or a misunderstanding of the nature of the investment that may limit the competitive environment.
4
TABLE OF CONTENTS
Complex Legacy Net Leased Portfolios — We seek opportunities to acquire legacy net leased portfolios that through asset sales, lease restructurings and other value-add activities can be transformed into high quality net leased portfolios.
Target Mission Critical Non-Traditional Net Leased Properties
We target specialized properties that fall outside many traditional institutional investor parameters, but offer unique utility to a tenant or an industry and can therefore be acquired at attractive yields relative to the underlying risk. We look for properties that are difficult or costly to replicate due to a specific location, special zoning, unique physical attributes, below market rents or a significant tenant investment in the facility, all of which contribute to a higher probability of tenant renewals. Examples of specialized properties include cross-dock truck terminals, cold storage facilities, parking facilities, air-freight facilities, steel distribution facilities, properties with high parking requirements and other mission critical facilities. We purchase specialized corporate real estate if we believe the property is critical to the ongoing operations of the tenant and the profitable continuation of its business. We believe that the profitability of the operations and the relative difficulty in replicating or moving operations reflect the importance of the property to the tenant’s business.
Target Transactions Where We Have a Competitive Advantage
Individual Properties — We seek to acquire individual properties having a purchase price between $5 million and $30 million. We target properties of this size because we find in the current environment that there is less competition from larger institutions who generally look for larger properties and larger portfolios. We have an asset management team of significant scale that has significant experience negotiating, underwriting and acquiring these types of properties, which we believe gives us a competitive advantage over many local and regional investors that typically compete for these acquisitions.
Sale Leasebacks — We believe our management team is among the most experienced and well known in the sale and leaseback industry, with long-standing contacts and reputations among bankers, advisors and private equity firms. We believe that we can source and effectively compete on sale and leaseback transactions and believe that there will be an increasing number of such opportunities due to still extensive holdings of commercial real estate on corporate balance sheets, financial metrics which discourage such ownership and the relative attractiveness of the capital that we and others in the sale and leaseback industry can offer.
Build-to-Suits — Our management team has extensive experience in build-to-suit transactions whereby we provide construction funding for a property that we ultimately acquire. In a build-to-suit transaction, we generally pre-lease all or substantially all of the property to a single tenant under a long-term lease. We believe there is less competition for such investments due to investors’ relative lack of experience with such investments, the difficulties in obtaining inexpensive asset level financing and a lack of a mandate to make such investments.
Portfolios — We believe there may be opportunities to purchase portfolios of properties from existing owners who are either investor owners or corporations that occupy their properties. We believe that we will have the opportunity to purchase portfolios in exchange for cash, our common stock, units of limited partnership interest in the Operating Partnership or a combination thereof. The market for large portfolios is currently very competitive with many well-capitalized buyers actively bidding for these portfolios and we expect this market to remain competitive for the foreseeable future.
Target Investments that Maximize Growth Potential
Opportunities to Extend Leases through Expansions or Capital Investments — We focus on net leased investment properties where, in our view, there is the potential to invest incremental capital to accommodate a tenant’s business, extend lease terms and increase the value of a property. We believe these opportunities can generate attractive returns due to the nature of the relationship between the landlord and tenant.
Assets with Cycle-Low Rent Levels — We focus on industrial and office properties with rents that we believe are competitive with market rents. These rents have typically resulted in a lease-up of vacant space or a lease renewal completed following the financial crisis. We believe that the net leased marketplace does not properly differentiate and price these properties and that these investment opportunities can generate growth in income and residual value over time as the U.S. economy improves.
5
TABLE OF CONTENTS
Long-term Appreciation Opportunities — We believe there are opportunities to acquire properties with longer term leases that provide current cash flow for the term of the lease and that, if correctly identified, have the potential upon lease expiration for a higher and better use that may provide capital appreciation over the long-run.
Focus on Risk Management
Underwrite and Structure Investments to Protect Downside and Preserve Cash Flows — We seek to invest in properties that have steady, predictable cash flow through: (a) long term, well-structured leases, (b) high leasehold value for tenants and (c) a high likelihood of renewal. We further seek to protect our investment by purchasing properties at prices at or below estimated replacement cost.
Utilize Portfolio Diversification — We seek to diversify our portfolio by property type, tenant credit, geography and tenant industry. As of December 31, 2013, our largest tenant was Bank of America, N.A., which accounted for approximately 31% of our annualized base rent revenue as of December 31, 2013. As we grow, we expect to further diversify our portfolio.
Utilize Moderate Leverage — We will target moderate consolidated leverage across our entire company of debt to market capitalization of approximately 50% to 55% through a combination of mortgage debt and corporate-level debt. We aspire to be an unsecured borrower; however, until we reach sufficient scale to obtain that goal, we will utilize a mix of secured debt and entity level borrowings.
Actively Manage the Portfolio to Maximize Tenant Retention and Minimize Vacancy — We believe there are opportunities within our portfolio to extend lease terms through property expansions or tenant improvement investments funded by us.
Leases
The following provides information regarding the various lease structures (including our lease with Preferred Freezer Services of Hialeah, LLC, which starts upon completion of construction of the facility currently expected in the second quarter of 2014) that we utilize in our operations.
Triple net lease. In our triple net leases, the tenant is responsible for all aspects of and costs related to the property and its operation during the lease term. The landlord may have responsibility under the lease to perform or pay for certain capital repairs or replacements to the roof, structure or certain building systems, such as heating and air conditioning and fire suppression. In some instances the tenant may reimburse the landlord for capital repairs or replacements on an amortized basis. The tenant may have the right to terminate the lease or abate rent due to a major casualty or condemnation affecting a significant portion of the property or due to the landlord’s failure to perform its obligations under the lease. Substantially all of our wholly owned industrial and specialty asset properties are leased pursuant to triple net leases.
Modified gross lease. In our modified gross leases, the landlord is responsible for some property related expenses during the lease term, but the cost of most of the expenses is passed through to the tenant for reimbursement to the landlord. The tenant may have the right to terminate the lease or abate rent due to a major casualty or condemnation affecting a significant portion of the property or due to the landlord’s failure to perform its obligations under the lease. Bank of America leases the Bank of America Portfolio properties pursuant to a modified gross lease.
Gross lease. In our gross leases, the landlord is responsible for all aspects of and costs related to the property and its operation during the lease term. The tenant may have the right to terminate the lease or abate rent due to a major casualty or condemnation affecting a significant portion of the property or due to the landlord’s failure to perform its obligations under the lease. As of December 31, 2013, gross leases in our portfolio represented approximately 1.0% of our total contractual base rent.
Escalations/Renewals. The properties in our wholly owned and joint venture portfolio may be subject to varying provisions regarding rent escalations and renewals. The properties within our Bank of America Portfolio typically have 1.5% rent increases every five years on 10-year lease terms and six tenant renewal options of five years each. Our remaining leases have rent escalation and renewal options that vary in amount and duration.
6
TABLE OF CONTENTS
Our Competitive Strengths
We believe that we distinguish ourselves from other net leased companies through the following competitive strengths:
| • | Management Team with Extensive Specialized Net Lease Expertise |
| º | We are led by Gordon F. DuGan and Benjamin P. Harris, the former Chief Executive Officer and Head of US Investments of W.P. Carey & Co., or W.P. Carey, respectively, with a combined 35 years of real estate experience. |
| º | Our seven senior officers have an average of approximately 20 years of real estate experience. |
| • | Demonstrated Track Record |
| º | During his tenure at W.P. Carey as President from December 1999 to May 2004 and then CEO from May 2004 to July 2010, Mr. DuGan oversaw the growth of W.P. Carey’s assets under management from approximately $2 billion at December 31, 1999, to approximately $10 billion at June 30, 2010. |
| º | For the period July 1, 2012 to December 31, 2013, we have sourced and acquired (directly or in joint ventures) approximately $873 million in net leased investments. |
| º | For the period July 1, 2012 to December 31, 2013, we have marketed and sold for our company and third-parties 322 non-core properties for an aggregate gross sale price of approximately $905 million. |
| • | Focused and Disciplined Investment Strategy |
| º | We are uniquely focused on acquiring well positioned net leased industrial and office properties. |
| º | Our target markets consist of Metropolitan Statistical Areas, or MSA’s, that have strong demographics and business-friendly environments, among other things. |
| º | Our quantitative underwriting model allows us to evaluate opportunities from a risk/return perspective. |
| • | Strong, Long-Standing Industry Relationships |
| º | Members of our management team have cultivated relationships with various constituents in the net leased market for over two decades. |
| º | We believe our management team’s experience in the sale leaseback space may result in our receiving a “first-call” from numerous companies, advisors, brokers and private equity firms interested in possible sale leaseback transactions. |
| • | Full Service Asset Management Platform |
| º | We believe we have the in-house expertise and capability required to perform broad-scope asset management and construction management services for ourselves and for third parties, including our joint venture partners. |
| º | We believe we have established a reputation for closing transactions quickly and efficiently. |
| º | Our due diligence and closing group have extensive experience in closing transactions. |
| • | Stockholder-Aligned Compensation and Corporate Governance |
| º | We use individual and corporate annual performance metrics to measure executive performance when determining annual incentive compensation bonuses. |
| º | We maintain a policy that prohibits directors and officers from hedging, pledging or margining shares of our common stock. |
7
TABLE OF CONTENTS
| º | Our stock ownership guidelines for our chief executive officer are based on a multiple of base salary. |
| º | Pursuant to Mr. DuGan’s employment contract, Mr. DuGan purchased from us 1.0 million shares of our common stock at market prices immediately prior to commencing employment as our Chief Executive Officer on July 1, 2012 using his personal funds without any reimbursement or other financial assistance from us. |
| º | Stock ownership guidelines for our non-employee directors are based on multiples of the annual retainer for our non-employee directors. |
| º | Our directors are elected annually. |
| º | We implemented majority voting in the election of directors. |
Our Investment Process
Sourcing and Initial Review
We utilize relationships with various real estate owners, real estate advisors and intermediaries, developers, investment and commercial banks, private equity sponsors, and other potential deal sources to identify a broad pipeline of investment opportunities. Our investment team actively reviews this pipeline and identifies a subset of properties that meet our investment criteria. Our initial review includes an evaluation of the credit of the tenant, the criticality of the property, an evaluation of the market and submarket where the property is located, the location, age, functionality and marketability of the property, the lease structure and how contract rents relate to rents for similar buildings in the submarket, the replacement cost for a similar asset, the expected returns and pricing, and other factors that go into the overall evaluation of the investment opportunity. Our management team actively looks to source proprietary investment opportunities that are not being generally marketed for sale.
Underwriting and Analysis
As part of a potential property acquisition, we evaluate the creditworthiness of the tenant and the tenant’s ability to generate sufficient cash flow to make payments to us pursuant to the lease. We evaluate each potential tenant for its creditworthiness, considering factors such as the tenant’s rating by a national credit rating agency, if any, management experience, industry position and fundamentals, operating history and capital structure. We may seek tenants who are small to middle-market businesses, many of which do not have publicly rated debt. We may also lease properties to large, publicly traded companies in order to diversify the overall credit quality of our tenant base. The creditworthiness of a tenant is determined on a tenant-by-tenant and case-by-case basis. Therefore, general standards for creditworthiness cannot be applied.
Due Diligence Review
We perform a due diligence review with respect to each potential property acquisition, such as evaluating the physical condition, evaluating compliance with zoning and site requirements, as well as completing an environmental site assessment in an attempt to determine potential environmental liabilities associated with a property prior to its acquisition, although there can be no assurance that hazardous substances or wastes (as defined by present or future federal or state laws or regulations) will not be discovered on the property after we acquire it.
We review the structural soundness of the improvements on the property and may engage a structural engineer to review all aspects of the structures in order to determine the longevity of each building on the property. This review normally also includes the components of each building, such as the roof, the electrical wiring, the heating and air-conditioning system, the plumbing, parking lot and various other aspects such as compliance with federal, state and local building codes.
8
TABLE OF CONTENTS
We physically inspect the real estate and surrounding area as part of our process for determining the value of the real estate. Our due diligence is structured to assist us in determining the value of the property, which is based on, among other things, historical and projected operating results as well as the value of the real estate under the assumption that it was not rented to the current tenant. As part of this process, we may consider one or more of the following items:
| • | the comparable value of similar real estate in the same general area of the prospective property; |
| • | the comparable real estate rental rates for similar properties in the same area of the prospective property; |
| • | alternative property uses that may offer higher value; |
| • | the cost of replacing the property; and |
| • | any barriers to entry to construct competing properties. |
We may supplement our valuation with a real estate appraisal. When appropriate, we may also engage experts to undertake some or all of the due diligence efforts described above.
Credit Underwriting
As part of our investment process, we conduct a review of the tenant’s credit profile which may include a review of any or all of the following:
| • | the tenant’s and/or its affiliates’ historical financials; |
| • | the tenant’s and/or its affiliates’ industry and its competitive position; |
| • | the tenant’s and/or its affiliates’ business plan and financial projections; |
| • | the tenant’s and/or its affiliates’ capital structure; and |
| • | the tenant’ real estate and how a subject property fits into the tenant’s operations. |
We may also conduct interviews with management and owners of the tenant and/or its affiliates as a part of this process.
Investment policy
All real estate investments, dispositions and financings must be approved by a credit committee consisting of our most senior officers, including the affirmative approval of our chief executive officer. Real estate investments and dispositions at a loss (based on book value at the time of sale) having a transaction value greater than $20.0 million must also be approved by the investment committee of our board of directors. Our board of directors must approve all such transactions having a value greater than $50.0 million. Additionally, the investment committee must approve non-recourse financings greater than $20.0 million and our board of directors must approve all recourse financings, regardless of amount, and non-recourse financings greater than $50.0 million. For purposes of approval thresholds, joint ventures are calculated without regard for the joint venture structure and are calculated assuming we are acquiring 100% of the property or borrowing 100% of the financing.
We generally intend to hold the investment properties we acquire for an extended period. However, circumstances might arise which could result in the early sale of some properties. We also may acquire a portfolio of properties with the intention of holding only a core group of properties and disposing of the remainder of the portfolio in single or multiple sales. The determination of whether a particular property should be sold or otherwise disposed of will be made after consideration of all relevant factors, including prevailing economic conditions, with a view to achieving maximum capital appreciation. The selling price of a property will depend on many of the same factors identified above with respect to our investment process for acquisitions.
We may use TRSs to acquire or hold property, including assets that may not be deemed to be REIT-qualified assets. Taxes paid by such entity will reduce the cash available to us to fund our continuing operations and cash available for distributions to our stockholders.
9
TABLE OF CONTENTS
Some of our investments have been made and may continue to be made through joint ventures that permit us to own interests in larger properties or portfolios without restricting the diversity of our portfolio. We will not enter into a joint venture to make an investment that we would not otherwise purchase on our own under our existing investment policies. We currently have investments in two joint ventures. As of December 31, 2013, this included (i) a 50% interest in a 75 property portfolio referred to as the Bank of America Portfolio and (ii) a 25% interest in a fee interest in 200 Franklin Square Drive, Somerset New Jersey which is 100% net leased to Philips Holdings, USA Inc., a wholly-owned subsidiary of Royal Philips Electronics, through December 2021, or Philips HQ JV.
Use of Leverage
In addition to cash on hand and cash from operations, we anticipate using funds from various sources to finance our acquisitions and operations, including public and private equity issuances, bank credit facilities, term loans, property-level mortgage debt, operating partnership units and other sources that may become available from time to time. We believe that moderate leverage is prudent and generally target a debt to market capitalization ratio of 50% – 55% across our entire portfolio. We may encumber certain properties with higher leverage while keeping other properties unencumbered or pledged as part of various corporate level borrowings. We aspire over time to become an investment grade rated, unsecured borrower. However, until we reach sufficient scale to obtain that goal, we will utilize a mix of secured debt and entity level borrowing.
We expect that any property-level mortgage borrowings will be structured as non-recourse to us, with limited exceptions that would trigger recourse to us only upon the occurrence of certain fraud, misconduct, environmental, bankruptcy or similar events.
We have a $150.0 million senior secured revolving credit facility with an initial term expiring September 4, 2015, with an option for a one-year extension. The credit facility included a $50.0 million accordion feature, which we exercised in February 2014, that allowed us to increase borrowing capacity from $100 million when we entered into the agreement in September 2013 to $150.0 million. The credit facility is fully guaranteed by Gramercy and certain subsidiaries and is secured by first priority mortgages on designated properties, or the “Borrowing Base”, as defined under the agreement. Availability under the credit facility is limited to the lesser of $150.0 million or 60% of the value of the Borrowing Base. We intend to use credit facilities and other entity level borrowings in the future as a part of our overall capital structure.
Our organizational documents do not limit the amount or percentage of indebtedness that we may incur. The amount of leverage we will deploy for particular investments will depend on an assessment of a variety of factors, which may include the availability and cost of financing the assets, the creditworthiness of our tenants, the health of the U.S. economy and commercial mortgage markets, our outlook for the level, slope and volatility of interest rates, and the overall quality of the properties that secure the indebtedness. We can provide no assurance that financing will be available on terms acceptable to us or at all.
Asset and Property Management
In addition to net leased investing, we also operate a commercial real estate management business for third-parties. As of December 31, 2013, this business, which operates under the name Gramercy Asset Management, managed approximately $1.4 billion of commercial properties leased primarily to regulated financial institutions and affiliated users throughout the United States. We manage properties for companies including KBS, Garrison Investment Group, L.P., or Garrison, through their investment in the Bank of America Portfolio Joint Venture, and Oak Tree Capital Management, L.P.
We have an integrated asset management platform within Gramercy Asset Management to consolidate responsibility for, and control over, leasing, lease administration, property management, operations, construction management, tenant relationship management and property accounting. To the extent that we provide asset management services for third-party property owners, we provide such services in consultation with and at the direction of such owners.
In December 2013, one of our wholly owned TRSs extended an Amended Restated Asset Management Services Agreement, or Management Agreement, with KBS. As part of the execution of the Management Agreement, KBS made a $12.0 million payment to our TRS in satisfaction of the profit participation provisions under the pre-amended Management Agreement. In addition, the Management Agreement provides
10
TABLE OF CONTENTS
for a base management fee of $7.5 million per year as well as certain other fees as provided therein. The term of the Management Agreement will continue to December 31, 2016 (with a one year extension option exercisable by KBS), unless earlier terminated as therein provided, and also provides incentive fees in the form of profit participation ranging from 10% – 30% of incentive profits earned on sales.
Commercial Real Estate Finance
In March 2013, we disposed of our Gramercy Finance segment, and exited the commercial real estate finance business. Our commercial real estate finance business invested in and managed a diversified portfolio of real estate loans, including whole loans, bridge loans, subordinate interests in whole loans, mezzanine loans, Commercial Mortgage-backed securities, or CMBS, and preferred equity involving commercial properties throughout the United States, and which held interests in real estate properties acquired through foreclosures. The disposal was completed pursuant to a sale and purchase agreement to transfer the collateral management and sub-special servicing agreements for our three CDOs to CWCapital Investments LLC, or CWCapital, for proceeds of $6.3 million in cash, after expenses. We retained our noninvestment grade subordinate bonds, preferred shares and ordinary shares, or the Retained CDO Bonds, in the CDOs, which may allow us to recoup additional proceeds over the remaining life of the CDOs based upon resolution of underlying assets within the CDOs. However, there is no guarantee that we will realize any proceeds from the Retained CDO Bonds or what the timing of these proceeds might be. On March 15, 2013, we deconsolidated the assets and liabilities of Gramercy Finance from our Consolidated Financial Statements and recognized a gain on the disposal of $389.1 million within discontinued operations. The carrying value of the Retained CDO Bonds was $6.8 million as of December 31, 2013.
In addition to our Retained CDO Bonds, we expect to receive additional cash proceeds for past CDO servicing advances when specific assets within the CDOs are liquidated. We received reimbursements of $6.1 million during the year ended December 31, 2013, and the carrying value of the receivable for servicing advance reimbursements as of December 31, 2013 is $8.8 million. We do not anticipate receiving a substantial portion of the remaining CDO servicing advance reimbursements until the second half of 2014.
Hedging Activities
We may use a variety of commonly used derivative instruments that are considered conventional, or “plain vanilla” derivatives, including interest rate swaps, caps, collars and floors, in our risk management strategy to limit the effects of changes in interest rates on our operations. We may from time to time use derivative instruments in connection with the private placement of equity.
Our hedging strategy consists of entering into interest rate swap and interest rate cap contracts. The value of our derivatives may fluctuate over time in response to changing market conditions, and will tend to change inversely with the value of the risk in our liabilities that we intend to hedge. Hedges are sometimes ineffective because the correlation between changes in value of the underlying investment and the derivative instrument is less than was expected when the hedging transaction was undertaken. We continuously monitor the effectiveness of our hedging strategies and we have retained the services of an outside financial services firm with expertise in the use of derivative instruments to advise us on our overall hedging strategy, to effect hedging trades, and to provide the appropriate designation and accounting of all hedging activities from a GAAP and tax accounting and reporting perspective.
These instruments are used to hedge as much of the interest rate risk as we determine is in the best interest of our stockholders, given the cost of such hedges. To the extent that we enter into a hedging contract to reduce interest rate risk on indebtedness incurred to acquire or carry real estate assets, any income that we derive from the contract is not considered income for purposes of the REIT 95% gross income test and is either non-qualifying for the 75% gross income test (hedges entered into prior to August 1, 2008), or is not considered income for purposes of the 75% gross income test (hedges entered into after July 31, 2008). This change in character for the 75% gross income test was included in the Housing and Economic Recovery Act of 2008. We can elect to bear a level of interest rate risk that could otherwise be hedged when we believe, based on all relevant facts, that bearing such risk is advisable.
11
TABLE OF CONTENTS
Equity Capital Policies
Subject to applicable law and our charter, our board of directors has the authority, without further stockholder approval, to issue additional authorized common stock and preferred stock or otherwise raise capital, including through the issuance of senior securities, in any manner and on the terms and for the consideration it deems appropriate.
We may, under certain circumstances, repurchase our common or preferred stock in private transactions with our stockholders if those purchases are approved by our board of directors and are in accordance with our charter. Our board of directors has no present intention of causing us to repurchase any shares, and any action would only be taken in conformity with applicable federal and state laws and the applicable requirements for qualifying as a REIT, for so long as our board of directors concludes that we should remain a qualified REIT.
Future Revisions in Policies and Strategies
If our board of directors determines that additional funding is required, we may raise such funds through additional offerings of equity or debt securities or the retention of cash flow (subject to REIT distribution requirements) or a combination of these methods. In the event that our board of directors decides to raise additional equity capital, it has the authority, without obtaining stockholder approval, to issue additional common stock or preferred stock in any manner and on such terms and for such consideration as it deems appropriate, at any time. Our investment guidelines and our portfolio and leverage are periodically reviewed by our board of directors.
Competition
The market for acquiring well-positioned net leased properties is currently very competitive and likely to remain very competitive for the foreseeable future. We compete for net leased real estate with a variety of other potential purchasers, including other public and private real estate investment companies, some of which have greater financial or other resources than we do. We also compete for tenants with other net leased property owners. Deteriorating investment opportunities in a highly competitive marketplace may negatively impact our pace of acquisitions, the prices we pay for the properties we acquire and our results from operations.
Although we believe that we are positioned to compete effectively in each facet of our business, there is considerable competition in our market sector and there can be no assurance that we will compete effectively or that we will not encounter increased competition in the future that could limit our ability to conduct our business effectively.
Compliance With The Americans With Disabilities Act of 1990
Properties that we acquire, and the properties underlying our investments, are required to meet federal requirements related to access and use by disabled persons as a result of the Americans with Disabilities Act of 1990, or the Americans with Disabilities Act. In addition, a number of additional federal, state and local laws may require modifications to any properties we purchase, or may restrict further renovations of our properties, with respect to access by disabled persons. Noncompliance with these laws or regulations could result in the imposition of fines or an award of damages to private litigants. Additional legislation could impose additional financial obligations or restrictions with respect to access by disabled persons. If required changes involve greater expenditures than we currently anticipate, or if the changes must be made on a more accelerated basis, our ability to make distributions could be adversely affected.
Other Information
Our corporate offices are located in midtown Manhattan at 521 Fifth Avenue, 30th Floor, New York, New York 10175. We also have regional offices in Jenkintown, Pennsylvania, and St. Louis, Missouri. We can be contacted at (212) 297-1000. We maintain a website atwww.gptreit.com. Our reference to our website is intended to be an inactive textual reference only. On our website, you can obtain, free of charge, a copy of our annual report on Form 10-K, quarterly reports on Form 10-Q, current reports on Form 8-K, and amendments to those reports filed or furnished pursuant to Section 13(a) or 15(d) of the Securities Exchange
12
TABLE OF CONTENTS
Act of 1934, as amended, or the Exchange Act, as soon as practicable after we file such material electronically with, or furnish it to, the Securities and Exchange Commission, or the SEC. We have also made available on our website our audit committee charter, compensation committee charter, nominating and corporate governance committee charter, code of business conduct and ethics and corporate governance principles. Information on, or accessible through, our website is not part of, and is not incorporated into, this report. You can also read and copy materials we file with the SEC at its Public Reference Room at 100 F Street, NE, Washington, DC 20549 (1-800-SEC-0330). The SEC maintains an Internet site (www.sec.gov) that contains reports, proxy and information statements, and other information regarding the issuers that file electronically with the SEC.
Industry Segments
As of December 31, 2013, we have two reportable operating segments: Investments/Corporate and Asset Management. The reportable segments were determined based on the management approach, which looks to our internal organizational structure. These two lines of business require different support infrastructures.
The Investments/Corporate segment includes all of our activities related to investment and ownership of commercial properties net leased to high quality tenants throughout the United States. The Investments/Corporate segment generates revenues from rental revenues from properties that we own.
The Asset Management segment includes substantially all of our activities related to third-party asset and property management of commercial. The Asset Management segment generates revenues from fee income related to the Management Agreement with third parties and from our Bank of America Portfolio joint venture.
In March 2013, we disposed of the Finance segment, which was classified as held-for-sale and included in discontinued operations at December 31, 2013. The Finance segment included all of our activities related to origination, acquisition and portfolio management of whole loans, bridge loans, subordinate interests in whole loans, mezzanine loans, preferred equity, CMBS and other real estate related securities.
Segment revenue and profit information is presented in Note 18 to the consolidated financial statements.
Employees
As of December 31, 2013, we had 83 employees. Our employees are not represented by a collective bargaining agreement.
Corporate Governance and Internet Address; Where Readers Can Find Additional Information
We emphasize the importance of professional business conduct and ethics through our corporate governance initiatives. Our board of directors consists of a majority of independent directors; the Audit, Nominating and Corporate Governance, and Compensation Committees of our board of directors are composed exclusively of independent directors. We have adopted corporate governance guidelines and a code of business conduct and ethics.
We file annual, quarterly and current reports, proxy statements and other information required by the Exchange Act with the SEC. Readers may read and copy any document that we file at the SEC’s Public Reference Room located at 100 F Street, N.E., Washington, D.C. 20549, U.S.A. Please call the SEC at 1-800-SEC-0330 for further information on the Public Reference Room. Our SEC filings are also available to the public from the SEC’s internet site atwww.sec.gov. Copies of these reports, proxy statements and other information can also be inspected at the offices of the New York Stock Exchange, Inc., 20 Broad Street, New York, New York 10005.
Our internet site iswww.gptreit.com. Our reference to our website is intended to be an inactive textual reference only. We make available free of charge through our internet site our annual reports on Form 10-K, quarterly reports on Form 10-Q, current reports on Form 8-K, proxy statements and Forms 3, 4 and 5 filed on behalf of directors and executive officers and any amendments to those reports filed or furnished pursuant to the Exchange Act as soon as reasonably practicable after we electronically file such material with, or furnish it to, the SEC. Also posted on our website in the “Investor Relations — Corporate Governance” section are charters for our Audit Committee, Compensation Committee and Nominating and Corporate Governance
13
TABLE OF CONTENTS
Committee as well as our Corporate Governance Guidelines and our Code of Business Conduct and Ethics governing our directors, officers and employees. Information on, or accessible through, our website is not a part of, and is not incorporated into, this report.
Environmental Matters
The properties we own and will acquire are subject to various federal, state and local environmental laws. Under these laws, courts and government agencies have the authority to require us, as owner of a contaminated property, to clean up the property, even if we did not know of or were not responsible for the contamination. These laws also apply to persons who owned a property at the time it became contaminated, and therefore it is possible we could incur these costs even after we sell some of our properties. In addition to the costs of cleanup, environmental contamination can affect the value of a property and, therefore, an owner’s ability to borrow using the property as collateral or to sell the property. Under applicable environmental laws, courts and government agencies also have the authority to require that a person who sent waste to a waste disposal facility, such as a landfill or an incinerator, pay for the clean-up of that facility if it becomes contaminated and threatens human health or the environment.
Furthermore, various court decisions have established that third parties may recover damages for injury caused by property contamination. For instance, a person exposed to asbestos at one of our properties may seek to recover damages if he or she suffers injury from the asbestos. Lastly, some of these environmental laws restrict the use of a property or place conditions on various activities. An example would be laws that require a business using chemicals to manage them carefully and to notify local officials that the chemicals are being used.
We could be responsible for any of the costs discussed above. The costs to clean up a contaminated property, to defend against a claim, or to comply with environmental laws could be material and could adversely affect the funds available for distribution to our stockholders.
We generally obtain “Phase I environmental site assessments,” or “ESAs,” on each property prior to acquiring it. However, these ESAs may not reveal all environmental costs that might have a material adverse effect on our business, assets, results of operations or liquidity and may not identify all potential environmental liabilities. Additionally, our leases generally require our tenants to conduct their operations at our properties in compliance with applicable federal, state and local environmental laws, to promptly notify us of the occurrence of any environmental contaminations or similar issues and to indemnify us against claims resulting from their failure to so act. However, there can be no assurance that our tenants will notify us as required, or further, have funds or assets at the time indemnification is sought that are sufficient to properly indemnify us against any such claims.
While we purchase many of our properties on an “as is” basis, our purchase contracts for such properties contain an environmental contingency clause, which permits us to reject a property because of any environmental hazard at such property. However, we do acquire properties which may have asbestos abatement requirements, for which we set aside appropriate reserves.
We believe that our portfolio is in compliance in all material respects with all federal and state regulations regarding hazardous or toxic substances and other environmental matters.
Insurance
We carry commercial liability and all risk property insurance, including where required, flood, earthquake, wind and terrorism coverage, on substantially all of the properties that we own. For certain net leased properties, however, we rely on our tenant’s insurance and do not maintain separate coverage. We continue to monitor the state of the insurance market and the scope and costs of specialty coverage, including flood, earthquake, wind and terrorism. We cannot anticipate what coverage will be available on commercially reasonable terms in future policy years. We believe that the insured limits are appropriate given the relative risk of loss, the cost of the coverage and industry practice.
14
TABLE OF CONTENTS
Risks Related to Our Business and Investments
Our future growth will depend upon our ability to acquire and lease properties in a competitive real estate business.
Our future growth will depend, in large part, upon our ability to acquire and lease properties. In order to grow we need to continue to acquire and finance investment properties and sell non-core properties. The acquisition and sale of investment properties is subject to competitive pressures from many market participants and we expect strong competition from other REITs, businesses, individuals, fiduciary accounts and plans, as well as other entities engaged in real estate investment and financing. Many of these competitors are larger than we are and have access to greater financial resources. Such competition may limit our ability to acquire properties and grow or may result in a higher cost to us for properties we wish to purchase.
If we cannot obtain additional capital, our ability to make acquisitions and lease properties will be limited. We are subject to risks associated with debt and capital stock issuances, and such issuances may have consequences to holders of our common and preferred stock.
Our ability to make acquisitions and lease properties will depend, in large part, upon our ability to raise additional capital. If we were to raise additional capital through the issuance of equity securities, we could dilute the interests of holders of our common stock. Our Board may authorize the issuance of additional classes or series of preferred stock which may have rights that could dilute, or otherwise adversely affect, the interest of holders of our common stock.
We intend to incur additional indebtedness in the future, which may include an additional corporate credit facility. Such indebtedness could also have other important consequences to holders of the notes and holders of our common and preferred stock, including subjecting us to covenants restricting our operating flexibility, increasing our vulnerability to general adverse economic and industry conditions, limiting our ability to obtain additional financing to fund future working capital, capital expenditures and other general corporate requirements, requiring the use of a portion of our cash flow from operations for the payment of principal and interest on our indebtedness, thereby reducing our ability to use our cash flow to fund working capital, acquisitions, capital expenditures and general corporate requirements, and limiting our flexibility in planning for, or reacting to, changes in our business and our industry.
The competitive pressures we face as a result of operating in a highly competitive market could have a material adverse effect on our business, financial condition, liquidity and results of operations.
We face significant competition with respect to our acquisition and origination of assets from many other companies, including other REITs, insurance companies, private investment funds, hedge funds, specialty finance companies and other investors. Some competitors may have a lower cost of funds and access to funding sources that are not available to us. In addition, some of our competitors may have higher risk tolerances or different risk assessments, which could allow them to consider a wider variety of investments and establish more relationships than us. Furthermore, there is significant competition on a national, regional and local level with respect to property management services and in commercial real estate services generally, and we are subject to competition from large national and multi-national firms as well as local or regional firms that offer similar services to ours. Some of our competitors may have greater financial and operational resources, larger customer bases, and more established relationships with their customers and suppliers than we do. The competitive pressures we face, if not effectively managed, may have a material adverse effect on our business, financial condition, liquidity and results of operations.
Also, as a result of this competition, we may not be able to take advantage of attractive origination and investment opportunities and therefore may not be able to identify and pursue opportunities that are consistent with our objectives. Competition may limit the number of suitable investment opportunities offered to us. It may also result in higher prices, lower yields and a narrower spread of yields over our borrowing costs, making it more difficult for us to acquire new investments on attractive terms. In addition, competition for desirable investments could delay our investment in desirable assets, which may in turn reduce our earnings per share and negatively affect our ability to declare and make distributions to our stockholders.
15
TABLE OF CONTENTS
We are dependent on key personnel whose continued service is not guaranteed.
We rely on a small number of persons who comprise our existing senior management team and our Board to implement our business and investment strategies. While we have entered into employment and/or retention agreements with certain members of our senior management team, they may nevertheless cease to provide services to us at any time.
The loss of services of any of our key management personnel or directors or significant numbers of other employees, or our inability to recruit and retain qualified personnel or directors in the future, could have an adverse effect on our business.
Quarterly results may fluctuate and may not be indicative of future quarterly performance.
Our quarterly operating results could fluctuate; therefore, you should not rely on past quarterly results to be indicative of our performance in future quarters. Factors that could cause quarterly operating results to fluctuate include, among others, variations in our investment origination volume, impairments, the degree to which we encounter competition in our markets, tenant defaults and delinquencies and general economic conditions.
We are required to make a number of judgments in applying accounting policies, and different estimates and assumptions in the application of these policies could result in changes to our reporting of financial condition and results of operations.
Various estimates are used in the preparation of our financial statements, including estimates related to asset and liability valuations (or potential impairments) and various receivables. Often these estimates require the use of market data values which may be difficult to assess, as well as estimates of future performance or receivables collectability which may be difficult to accurately predict. While we have identified those accounting policies that are considered critical and have procedures in place to facilitate the associated judgments, different assumptions in the application of these policies could result in material changes to our financial condition and results of operations.
We utilize, and intend to continue to utilize, leverage which may limit our financial flexibility in the future.
We make acquisitions and operate our business in part through the utilization of leverage pursuant to loan agreements with various financial institutions. These loan agreements contain financial covenants that restrict our operations. These financial covenants, as well as any future financial covenants we may enter into through further loan agreements, could inhibit our financial flexibility in the future and prevent distributions to stockholders.
We may incur losses as a result of ineffective risk management processes and strategies.
We seek to monitor and control our risk exposure through a risk and control framework encompassing a variety of separate but complementary financial, credit, operational, compliance and legal reporting systems, internal controls, management review processes and other mechanisms. While we employ a broad and diversified set of risk monitoring and risk mitigation techniques, those techniques and the judgments that accompany their application cannot anticipate every economic and financial outcome or the specifics and timing of such outcomes. Thus, we may, in the course of our activities, incur losses due to these risks.
We are highly dependent on information systems and third parties, and systems failures could significantly disrupt our business, which may, in turn, negatively affect the market price of our common stock and our ability to make distributions to our stockholders.
Our business is highly dependent on communications and information systems, some of which are provided by third parties. Any failure or interruption of our systems could cause delays or other problems, which could have a material adverse effect on our operating results and negatively affect the market price of our common stock and our ability to make distributions to our stockholders.
Lack of diversification in number of investments increases our dependence on individual investments.
We own a 50% interest in a joint venture with Garrison in which nearly 100% of the properties in the portfolio are leased to Bank of America. The cash flow generated from these properties represents a significant
16
TABLE OF CONTENTS
portion of our rental income. If Bank of America defaults or is otherwise unable to perform under its lease obligations, it would negatively impact our cash flows and overall financial condition. Additionally, because Bank of America operates in the financial services industry, any disruptions in the financial markets or downturns in the financial services industry could cause us to experience higher rates of lease default or terminations than we otherwise would if our tenant base was more diversified.
If we acquire other property interests that are similarly large in relation to our overall size, our portfolio could become even more concentrated, increasing the risk of loss to stockholders if a default or other problem arises. Alternatively, property sales may reduce the aggregate amount of our property investment portfolio in value or number. As a result, our portfolio could become concentrated in larger assets, thereby reducing the benefits of diversification by geography, property type, tenancy or other measures.
We may never reach sufficient size to achieve diversity in our portfolio.
We are presently a comparatively small net leased company with a limited number of warehouse and industrial properties and a proportionally large investment in the Bank of America Portfolio, resulting in a portfolio that lacks geographic and tenant diversity. While we intend to endeavor to grow and diversify our portfolio through additional property acquisitions, we may never reach a significant size to achieve true portfolio diversity.
We expect to lease a significant portion of our real estate to middle-market businesses which may be more susceptible to adverse market conditions.
We expect that a substantial number of our properties will be leased to middle-market businesses that generally have less financial and other resources than larger businesses. Middle-market companies are more likely to be adversely affected by a downturn in their respective businesses or in the regional, national or international economy. As such, negative market conditions affecting existing or potential middle-market tenants, or the industries in which they operate, could materially adversely affect our financial condition and results of operations.
We may be adversely affected by unfavorable economic changes in geographic areas where our properties are concentrated.
Adverse conditions in the areas where our properties are located (including business layoffs or downsizing, industry slowdowns, changing demographics and other factors) and local real estate conditions (such as oversupply of, or reduced demand for, office, industrial or retail properties) may have an adverse effect on the value of our properties. A material decline in the demand or the ability of tenants to pay rent for office, industrial or retail space in these geographic areas may result in a material decline in our cash available for distribution to our stockholders.
We may not be able to relet or renew leases at the properties held by us on terms favorable to us or at all.
We are subject to risks that upon expiration or earlier termination of the leases for space located at our properties the space may not be relet or, if relet, the terms of the renewal or reletting (including the costs of required renovations or concessions to tenants) may be less favorable than current lease terms. Any of these situations may result in extended periods where there is a significant decline in revenues or no revenues generated by a property. If we are unable to relet or renew leases for all or substantially all of the spaces at these properties, if the rental rates upon such renewal or reletting are significantly lower than expected, if our reserves for these purposes prove inadequate, or if we are required to make significant renovations or concessions to tenants as part of the renewal or reletting process, we will experience a reduction in net income and may be required to reduce or eliminate distributions to our stockholders.
The bankruptcy, insolvency or diminished creditworthiness of our tenants under their leases or delays by our tenants in making rental payments could seriously harm our operating results and financial condition.
We lease our properties to tenants, and we receive rents from our tenants during the terms of their respective leases. A tenant’s ability to pay rent is often initially determined by the creditworthiness of the tenant. However, if a tenant’s credit deteriorates, the tenant may default on its obligations under its lease and
17
TABLE OF CONTENTS
the tenant may also become bankrupt. The bankruptcy or insolvency of our tenants or other failure to pay is likely to adversely affect the income produced by our real estate investments. Any bankruptcy filings by or relating to one of our tenants could bar us from collecting pre-bankruptcy debts from that tenant or its property, unless we receive an order permitting us to do so from the bankruptcy court. A tenant bankruptcy could delay our efforts to collect past due balances under the relevant leases, and could ultimately preclude full collection of these sums. If a tenant files for bankruptcy, we may not be able to evict the tenant solely because of such bankruptcy or failure to pay. A court, however, may authorize a tenant to reject and terminate its lease with us. In such a case, our claim against the tenant for unpaid, future rent would be subject to a statutory cap that might be substantially less than the remaining rent owed under the lease. In addition, certain amounts paid to us within 90 days prior to the tenant’s bankruptcy filing could be required to be returned to the tenant’s bankruptcy estate. In any event, it is highly unlikely that a bankrupt or insolvent tenant would pay in full amounts it owes us under its lease. In other circumstances, where a tenant’s financial condition has become impaired, we may agree to partially or wholly terminate the lease in advance of the termination date in consideration for a lease termination fee that is likely less than the agreed rental amount. If a lease is rejected by a tenant in bankruptcy, we would have only a general unsecured claim for damages. Any unsecured claim we hold against a bankrupt entity may be paid only to the extent that funds are available and only in the same percentage as is paid to all other holders of unsecured claims. We may recover substantially less than the full value of any unsecured claims, which would harm our financial condition.
Certain of our properties, including a substantial majority of those in our Bank of America Portfolio joint venture, are leased to banks that are not eligible to be debtors under the federal bankruptcy code, but would be subject to the liquidation and insolvency provisions of applicable banking laws and regulations. If the Federal Deposit Insurance Corporation were appointed as receiver of a banking tenant because of a tenant’s insolvency, we would become an unsecured creditor of the tenant and be entitled to share with the other unsecured non-depositor creditors in the tenant’s assets on an equal basis after payment to the depositors of their claims. In this event, we may recover substantially less than the full value of any unsecured claims, which could have a material adverse effect on our operating results and financial condition, as well as our ability to make distributions to our stockholders at historical levels or at all.
If a sale leaseback transaction is re-characterized in a tenant’s bankruptcy proceeding, our financial condition could be adversely affected.
We may enter into sale leaseback transactions, whereby we would purchase and then lease a property back to the seller. In the event of the bankruptcy of a tenant, a transaction structured as a sale leaseback may be re-characterized as either a financing or a joint venture, either of which outcomes could adversely affect our financial condition and cash flow.
If the sale leaseback were re-characterized as a financing, we might not be considered the owner of the property, and as a result would have the status of a creditor in relation to the tenant. In that event, we would no longer have the right to sell or encumber our ownership interest in the property. Instead, we would have a claim against the tenant for the amounts owed under the lease, with the claim arguably secured by the property. The tenant/debtor might have the ability to propose a plan restructuring the term, interest rate and amortization schedule of its outstanding balance. If confirmed by the bankruptcy court, we could be bound by the new terms, and prevented from foreclosing our lien on the property. If the sale leaseback were re-characterized as a joint venture, our tenants and we could be treated as co-venturers with regard to the property. As a result, we could be held liable, under some circumstances, for debts incurred by the tenants relating to the property.
Lease defaults or terminations or landlord-tenant disputes may adversely reduce our income from our leased property portfolio.
Lease defaults or terminations by one or more of our significant tenants may reduce our revenues unless a default is cured or a suitable replacement tenant is found promptly. In addition, disputes may arise between the landlord and tenant that result in the tenant withholding rent payments, possibly for an extended period. These disputes may lead to litigation or other legal procedures to secure payment of the rent withheld or to evict the tenant. In other circumstances, a tenant may have a contractual right to abate or suspend rent payments. Even without such right, a tenant might determine to do so. Any of these situations may result in
18
TABLE OF CONTENTS
extended periods during which there is a significant decline in revenues or no revenues generated by the property. If this were to occur, it could adversely affect our results of operations.
We could be adversely affected by various facts and events related to our properties over which we have limited or no control.
We could be adversely affected by various facts and events over which we have limited or no control, such as (i) oversupply of space and changes in market rental rates; (ii) economic or physical decline of the areas where the properties are located; and (iii) deterioration of the physical condition of our properties. Negative market conditions or adverse events affecting our existing or potential tenants, or the industries in which they operate, could have an adverse impact on our ability to attract new tenants, re-lease space, collect rent or renew leases, any of which could adversely affect our financial condition.
Inflation may adversely affect our financial condition and results of operations.
Although inflation has not materially impacted our results of operations in the recent past, increased inflation could have a more pronounced negative impact on any variable rate debt we incur in the future and on our results of operations. During times when inflation is greater than increases in rent, the contracted rent increases called for under our leases may be unable to keep pace with the rate of inflation. Likewise, even though our triple-net leases generally reduce our exposure to rising property expenses resulting from inflation, substantial inflationary pressures and increased costs may have an adverse impact on our tenants, which may adversely affect the tenants’ ability to pay rent.
Our net leases may require us to pay property-related expenses that are not the obligations of our tenants.
Under the terms of the majority of our net leases, in addition to satisfying their rent obligations, our tenants are responsible for the payment of real estate taxes, insurance and ordinary maintenance and repairs. However, pursuant to certain of our current leases and leases we may assume or enter into in the future, we may be required to pay certain expenses, such as the costs of environmental liabilities, roof and structural repairs, insurance, certain non-structural repairs and maintenance and other costs and expenses for which insurance proceeds or other means of recovery are not available. If one or more of our properties incur significant expenses under the terms of the leases, such property, our business, financial condition and results of operations will be adversely affected and the amount of cash available to meet expenses and to make distributions to our stockholders may be reduced.
We may be required to reimburse tenants for overpayments of estimated operating expenses.
Under certain of our leases, including the lease for the Bank of American Portfolio, tenants pay us as additional rent their proportionate share of the costs we incur to manage, operate and maintain the buildings and properties where they rent space. These leases often limit the types and amounts of expenses we can pass through to our tenants and allow the tenants to audit and contest our determination of the operating expenses they are required to pay. Given the complexity of certain additional rent calculations, tenant audit rights under large portfolio leases can remain unresolved for several years. The tenant under the Bank of America Portfolio lease, for example, is still auditing certain categories of operating expenses for the 2007 and subsequent lease years. If as a result of a tenant audit it is determined that we have collected more additional rent than we are permitted to collect under a lease, we must refund the excess amount back to the tenant and, sometimes, also reimburse the tenant for its audit costs. Such unexpected reimbursement payments could materially adversely affect our financial condition and results of operations.
Net leases may not result in fair market lease rates over time, which could negatively impact our income and reduce the amount of funds available to make distributions to our stockholders.
The vast majority of our rental income comes from net leases, which generally provide the tenant greater discretion in using the leased property than ordinary property leases, such as the right to freely sublease the property, to make alterations in the leased premises and to terminate the lease prior to its expiration under specified circumstances. Furthermore, net leases typically have longer lease terms and, thus, there is an increased risk that contractual rental increases in future years will fail to result in fair market rental rates during those years. As a result, our income and distributions to our stockholders could be lower than they would otherwise be if we did not engage in net leases.
19
TABLE OF CONTENTS
Real estate investments are not as liquid as other types of assets, which may reduce economic returns to investors.
Real estate investments are not as liquid as other types of investments. In addition, the instruments that we purchase in connection with privately negotiated transactions are not registered under the relevant securities laws, resulting in a prohibition against their transfer, sale, pledge or other disposition except in a transaction that is exempt from the registration requirements of, or is otherwise in accordance with, those laws. As a result, our ability to sell under-performing assets in our portfolio or respond to changes in economic and other conditions may be relatively limited.
Actions of our joint venture partners could negatively impact our performance.
We may, from time to time and as we have done in the past, co-invest with third parties through various arrangements, including, but not limited to, partnerships, joint ventures, co-tenancies or other entities, or acquire non-controlling interests in, or share responsibility for managing the affairs of, a property, partnership, joint venture, co-tenancy or other entity. With such investments, we may not be in a position to exercise sole decision-making authority regarding that property, partnership, joint venture or other entity. Investments in partnerships, joint ventures, or other entities may involve risks not present were a third party not involved, including the possibility that our partners, co-tenants or co-venturers might become bankrupt or otherwise fail to fund their share of required capital contributions. Additionally, our partners or co-venturers might at any time have economic or other business interests or goals which are inconsistent with our business interests or goals. These investments may also have the potential risk of impasses on decisions such as a sale, because neither we nor the partner, co-tenant or co-venturer would have full control over the partnership or joint venture. Consequently, actions by such partner, co-tenant or co-venturer might result in subjecting properties owned by the partnership or joint venture to additional risk. In addition, we may in specific circumstances be liable for the actions of our third-party partners, co-tenants or co-venturers.
We may continue to acquire and/or redevelop properties through joint ventures, limited liability companies, partnerships or other entities with other persons or entities when warranted by the circumstances. Such partners may share certain approval rights over major decisions. Such investments may involve risks not otherwise present with other methods of investment in real estate. We generally will seek to maintain sufficient control of our partnerships, limited liability companies, joint ventures or other entities to permit us to achieve our business objectives; however, we may not be able to do so, and the occurrence of one or more of the events described above could adversely affect our financial condition, results of operations, cash flows and ability to pay distributions on, and the market price of, our securities.
An uninsured loss or a loss that exceeds the policies on our properties could subject us to lost capital or revenue on those properties.
Under the terms and conditions of the leases currently in force on our properties, tenants generally are required to indemnify and hold us harmless from liabilities resulting from injury to persons, air, water, land or property, on or off the premises, due to activities conducted on the properties, except for claims arising from the negligence or intentional misconduct of us or our agents. Additionally, tenants are generally required, at the tenants’ expense, to obtain and keep in full force during the term of the lease, liability and property damage insurance policies issued by companies holding general policyholder ratings of at least “A” as set forth in the most current issue of Best’s Insurance Guide. Insurance policies for property damage are generally in amounts not less than the full replacement cost of the improvements less slab, foundations, supports and other customarily excluded improvements and insure against all perils of fire, extended coverage, vandalism, malicious mischief and special extended perils (“all risk,” as that term is used in the insurance industry). Insurance policies are generally obtained by the tenant providing general liability coverage varying between $1.0 million and $10.0 million depending on the facts and circumstances surrounding the tenant and the industry in which it operates. These policies include liability coverage for bodily injury and property damage arising out of the ownership, use, occupancy or maintenance of the properties and all of their appurtenant areas. To the extent that losses are uninsured or underinsured, we could be subject to lost capital and revenue on those properties.
20
TABLE OF CONTENTS
Early termination of our asset management agreement could result in certain unexpected costs.
We have entered into a Management Agreement with KBS to manage a portfolio of properties through December 31, 2016. The Management Agreement may be terminated early by KBS following the occurrence of certain events as defined in the Management Agreement. There can be no assurance a termination will not occur notwithstanding our efforts. Early termination of the Management Agreement would result in unexpected expenses, including severance fees, and the management fees and payments to be received would cease, thereby reducing our expected revenues, which could harm our business and results of operations.
We are subject to risks and uncertainties associated with operating our asset management business.
We will encounter risks and difficulties as we operate our asset management business. In order to achieve our goals as an asset manager, we must:
| • | actively manage the assets in such portfolios in order to realize targeted performance; and |
| • | create incentives for our management and professional staff to develop and operate the asset management business. |
If we do not successfully operate our asset management business to achieve the investment returns that we or the market anticipates, our operations may be adversely impacted.
We are exposed to litigation risks in our role as asset manager.
Our role as asset manager for a portfolio of properties for KBS exposes us to litigation risks. In this role, we make asset management and other decisions which could result in adverse financial impacts to third parties. These parties may pursue legal action against us as a result of these decisions, the outcomes of which cannot be certain and may materially adversely impact our financial condition and results of operations.
We may enter into derivative or hedging contracts that could expose us to contingent liabilities and certain risks and costs in the future.
Part of our investment strategy may involve entering into derivative or hedging contracts that could require us to fund cash payments in the future under certain circumstances, such as the early termination of the derivative agreement caused by an event of default or other early termination event, or the decision by a counterparty to request margin securities it is contractually owed under the terms of the derivative contract. The amount due would be equal to the unrealized loss of the open swap positions with the respective counterparty and could also include other fees and charges. These economic losses would be reflected in our financial results of operations, and our ability to fund these obligations will depend on the liquidity of our assets and access to capital at the time, and the need to fund these obligations could adversely impact our financial condition and results of operations.
Further, the cost of using derivative or hedging instruments increases as the period covered by the instrument increases and during periods of rising and volatile interest rates. We may increase our derivative or hedging activity and thus increase our related costs during periods when interest rates are volatile or rising and hedging costs have increased.
In addition, hedging instruments involve risk since they often are not traded on regulated exchanges, guaranteed by an exchange or its clearing house, or regulated by any U.S. or foreign governmental authorities. Consequently, in many cases, there are no requirements with respect to record keeping, financial responsibility or segregation of customer funds and positions. Furthermore, the enforceability of agreements underlying derivative transactions may depend on compliance with applicable statutory and commodity and other regulatory requirements and, depending on the identity of the counterparty, applicable international requirements. The business failure of a hedging counterparty with whom we enter into a hedging transaction will most likely result in a default. Default by a party with whom we enter into a hedging transaction may result in the loss of unrealized profits and force us to cover our resale commitments, if any, at the then current market price. Although generally we will seek to reserve the right to terminate our hedging positions, it may not always be possible to dispose of or close out a hedging position without the consent of the hedging counterparty, and we may not be able to enter into an offsetting contract in order to cover our risk. We cannot
21
TABLE OF CONTENTS
be assured that a liquid secondary market will exist for hedging instruments purchased or sold, and we may be required to maintain a position until exercise or expiration, which could result in losses.
Compliance with changing regulation of corporate governance and public disclosure may result in additional expenses.
Changing laws, regulations and standards relating to corporate governance and public disclosure, including the Sarbanes-Oxley Act of 2002, or the “Sarbanes Oxley Act”, the Dodd-Frank Wall Street Reform and Consumer Protection Act, new Securities and Exchange Commission regulations and NYSE rules, are creating uncertainty for companies such as ours. These new or changed laws, regulations, and standards are subject to varying interpretations, in many cases due to their lack of specificity. As a result, their application in practice may evolve over time as new guidance is provided by regulatory and governing bodies, which could result in continuing uncertainty regarding compliance matters and higher costs necessitated by ongoing revisions to disclosure and governance practices. We are committed to maintaining high standards of corporate governance and public disclosure. As a result, our efforts to comply with evolving laws, regulations, and standards have resulted in, and are likely to continue to result in, increased general and administrative expenses and a diversion of management time and attention from revenue-generating activities to compliance activities.
We will face particular challenges in maintaining and reporting on our internal controls over financial reporting.
Section 404 of the Sarbanes-Oxley Act requires that we evaluate and report on our system of internal controls and requires that we have our system of internal controls audited. If we fail to maintain adequate internal controls, we could be subject to regulatory scrutiny, civil or criminal penalties and/or stockholder litigation. Any inability to provide reliable financial reports could harm our business and the trading price of our common stock. Section 404 of the Sarbanes-Oxley Act also requires that our independent registered public accounting firm report on the effectiveness of the Company’s internal control over financial reporting. In addition, acquisition targets may not be in compliance with the provisions of the Sarbanes-Oxley Act regarding adequacy of their internal controls. The development of the internal controls of any such entity to achieve compliance with the Sarbanes-Oxley Act may increase the time and costs necessary to complete any such acquisition.
If we identify any material weaknesses or significant deficiencies in our internal controls over financial reporting, we may need to take costly steps to implement improved controls and may be subject to sanctions for failure to comply with the requirements of the Sarbanes-Oxley Act. Such remedial costs or sanctions could have a material adverse effect on our results of operations and financial condition. Further, we would be required to disclose any material weakness in internal controls over financial reporting, and we would receive an adverse opinion on our internal controls over financial reporting from our independent auditors. These factors could cause investors to lose confidence in our reported financial information and could have a negative effect on the trading price of our stock.
Risks Related to Our Legacy Businesses
Our financial information reflects discontinued operations, in addition to our current business operations, and does not provide a meaningful comparison for period over period results.
As a result of our disposition and deconsolidation in 2013 of certain legacy business operations, our financial results for the year do not just report the results of our ongoing net lease and asset management operations, but also reflect revenues and expenses from discontinued operations. Our business and operations have changed substantially over the past two years, and you should not rely on period over period comparisons of our company, or revenues from discontinued operations, as an indication of future results.
We are exposed to litigation and other risks from our prior roles as collateral manager and sub-special servicer for our 2005, 2006 and 2007 collateralized debt obligations.
Prior to March 2013, certain of our affiliates acted as collateral manager and sub-special servicer for our 2005, 2006 and 2007 collateralized debt obligations (“CDOs” and, collectively, the “Gramercy CDOs”). In these roles, we made investment, loan work-out and other decisions which could result in adverse financial
22
TABLE OF CONTENTS
impacts to third-parties. In particular, the discretion that we exercised in managing the collateral for the Gramercy CDOs could result in a liability due to inherent uncertainties surrounding the course of action that will result in the best long term results with respect to such collateral and investments. This risk could be increased due to the affiliated nature of our roles. In such roles, we could be subject to legal action as a result of these decisions, the outcomes of which cannot be certain and may materially adversely impact our financial condition and results of operations. If we were found liable for our actions as collateral manager or sub-special servicer and we were required to pay significant damages, our financial condition and results of operations could be materially adversely affected.
Claims may arise under an indemnification provided by us to the trustee of our 2005 CDO and 2006 CDO in connection with note cancellations.
Our subsidiary that acted as collateral manager for the Gramercy CDOs provided separate limited indemnities to the trustee of our 2005 CDO and 2006 CDO in connection with CDO note cancellations we undertook in 2011 in accordance with the operative documents of each CDO. These cancellations were undertaken to reduce the total debt owed by our 2005 CDO and our 2006 CDO and improve their compliance with certain overcollateralization tests. Payments made by us in the future, if any, under these indemnities would reduce our liquidity available for general corporate purposes and investments.
Our retained interests in our CDOs are highly speculative; as a result, there will be uncertainty as to the value of these investments.
We retain interests in certain subordinate bonds, preferred shares and ordinary shares in the Gramercy CDOs. These retained interests, or the Retained CDO Bonds, are highly speculative and subject to high fluctuations in purported value. The fair value of the Retained CDO Bonds, which are not publicly traded, may not be readily determinable. We value the Retained CDO Bonds quarterly. Because such valuations are inherently uncertain, may fluctuate over short periods of time and may be based on estimates, our determinations of fair value may differ materially from the values that would have been used if a ready market for the Retained CDO Bonds existed. There is no guarantee that we will realize any proceeds from our Retained CDO Bonds, or what the timing of those proceeds might be, and the value of our common stock could be adversely affected if our determinations regarding the fair value of the Retained CDO Bonds were materially higher than the values that we ultimately realize upon their disposal.
Our Retained CDO Bonds could generate “phantom” income.
Following the sale of the collateral manager agreements in March 2013, we continue to own the Retained CDO Bonds, which could continue to generate taxable income for us despite the fact that we will not receive cash distributions on our equity and subordinated note holdings from the Retained CDO Bonds until overcollateralization tests are met, if at all. Additionally, following the sale of the collateral manager agreements, we do not control or have influence over the factors that most directly affect the overcollateralization and interest coverage tests of the respective Retained CDO Bonds. Should these Retained CDO Bonds continue to generate taxable income with no corresponding receipt of cash flow, our taxable income would continue to be recognized on each underlying investment in the relevant CDO. We would continue to be required to distribute 90% of our REIT taxable income (determined without regard to the dividends paid deduction and excluding net capital gain) from these transactions to continue to qualify as a REIT, despite the fact that we may not receive cash distributions on our equity and subordinated note holdings from the Retained CDO Bonds.
Risks Related to the Real Estate Industry
Our real estate investments are subject to risks particular to real property.
Real estate investments are subject to risks particular to real property, including:
| • | acts of God, including earthquakes floods and other natural disasters, which may result in uninsured losses; |
| • | acts of war or terrorism, including the consequences of terrorist attacks; |
23
TABLE OF CONTENTS
| • | adverse changes in national and local economic and market conditions, including the credit and securitization markets; |
| • | changes in governmental laws and regulations, fiscal policies and zoning ordinances and the related costs of compliance with laws and regulations, fiscal policies and ordinances; |
| • | takings by condemnation or eminent domain; |
| • | real estate conditions, such as an oversupply of or a reduction in demand for real estate space in the area; |
| • | the perceptions of tenants and prospective tenants of the convenience, attractiveness and safety of our properties; |
| • | competition from comparable properties; |
| • | the occupancy rate of our properties; |
| • | the ability to collect on a timely basis all rent from tenants; |
| • | the effects of any bankruptcies or insolvencies of major tenants; |
| • | the expense of re-leasing space; |
| • | changes in interest rates and in the availability, cost and terms of mortgage funding; |
| • | the impact of present or future environmental legislation and compliance with environmental laws; and |
| • | cost of compliance with the Americans with Disabilities Act. |
If any of these or similar events occur, it may reduce our return from an affected property or investment and reduce or eliminate our ability to make distributions to stockholders.
Terrorist attacks and other acts of violence or war may affect the market for our securities, the industry in which we conduct our operations and our profitability.
Terrorist attacks may harm our results of operations and the stockholders’ investment. We cannot assure the stockholders that there will not be further terrorist attacks against the U.S. or U.S. businesses. These attacks or armed conflicts may directly impact the property underlying our asset-based securities or the securities markets in general. Losses resulting from these types of events are uninsurable.
More generally, any of these events could cause consumer confidence and spending to decrease or result in increased volatility in the U.S. and worldwide financial markets and economy. Adverse economic conditions could harm the value of our properties, or the securities markets in general which could harm our operating results and revenues and may result in increased volatility of the value of our securities.
Liability relating to environmental matters may impact the value of the properties that we may acquire or underlying our investments.
Under various U.S. federal, state and local laws, an owner or operator of real property may become liable for the costs of removal of certain hazardous substances released on its property. These laws often impose liability without regard to whether the owner or operator knew of, or was responsible for, the release of such hazardous substances. If we fail to disclose environmental issues, we could also be liable to a buyer or lessee of a property.
There may be environmental problems associated with our properties which we were unaware of at the time of acquisition. The presence of hazardous substances may adversely affect our ability to sell real estate, including the affected property, or borrow using real estate as collateral. The presence of hazardous substances, if any, on our properties may cause us to incur substantial remediation costs, thus harming our financial condition. In addition, although our leases will generally require our tenants to operate in compliance with all applicable laws and to indemnify us against any environmental liabilities arising from a tenant’s activities on the property, we nonetheless would be subject to strict liability by virtue of our ownership
24
TABLE OF CONTENTS
interest for environmental liabilities created by such tenants, and we cannot ensure the stockholders that any tenants we might have would satisfy their indemnification obligations under the applicable sales agreement or lease. The discovery of material environmental liabilities attached to such properties could have a material adverse effect on our results of operations and financial condition and our ability to make distributions to our stockholders.
Discovery of previously undetected environmentally hazardous conditions, including mold or asbestos, may lead to liability for adverse health effects and costs of remediating the problem could adversely affect our operating results.
Under various U.S. federal, state and local environmental laws, ordinances and regulations, a current or previous owner or operator of real property may be liable for the cost of removal or remediation of hazardous or toxic substances on, under or in such property. The costs of removal or remediation could be substantial. Such laws often impose liability whether or not the owner or operator knew of, or was responsible for, the presence of such hazardous or toxic substances. Environmental laws also may impose restrictions on the manner in which property may be used or businesses may be operated, and these restrictions may require substantial expenditures. Environmental laws provide for sanctions in the event of noncompliance and may be enforced by governmental agencies or, in certain circumstances, by private parties. Certain environmental laws and common law principles could be used to impose liability for release of and exposure to hazardous substances, including asbestos-containing materials into the air, and third parties may seek recovery from owners or operators of real properties for personal injury or property damage associated with exposure to released hazardous substances. The cost of defending against claims of liability, of compliance with environmental regulatory requirements, of remediating any contaminated property, or of paying personal injury claims related to any contaminated property could materially adversely affect our business, assets or results of operations and, consequently, amounts available for distribution to our security holders.
We may incur significant costs in complying with various federal, state and local laws, regulations and covenants that are applicable to our properties and, in particular, costs associated with complying with regulations such as the Americans with Disabilities Act of 1990 may result in unanticipated expenses.
The properties in our portfolio are subject to various covenants and U.S. federal, state and local laws and regulatory requirements, including permitting and licensing requirements. Local regulations, including municipal or local ordinances, zoning restrictions and restrictive covenants imposed by community developers may restrict our use of our properties and may require us to obtain approval from local officials or community standards organizations at any time with respect to our properties, including prior to acquiring a property or when undertaking renovations of any of our existing properties. Among other things, these restrictions may relate to fire and safety, seismic or hazardous material abatement requirements. There can be no assurance that existing laws and regulatory policies will not adversely affect us or the timing or cost of any future acquisitions or renovations, or that additional regulations will not be adopted that increase such delays or result in additional costs. Our growth strategy may be affected by our ability to obtain permits, licenses and zoning relief. Our failure to obtain such permits, licenses and zoning relief or to comply with applicable laws could have an adverse effect on our financial condition, results of operations and cash flow.
In addition, under the Americans with Disabilities Act of 1990, or ADA, all places of public accommodation are required to meet certain U.S. federal requirements related to access and use by disabled persons. These requirements became effective in 1992. A number of additional U.S. federal, state and local laws may also require modifications to our properties, or restrict further renovations of the properties, with respect to access thereto by disabled persons. Noncompliance with the ADA or other legislation could result in an order to correct any non-complying feature, which could result in substantial capital expenditures. We do not conduct audits or investigations of all of these properties to determine their compliance and we cannot predict the ultimate cost of compliance with the ADA or other legislation. If one or more of our properties is not in compliance with the ADA or other legislation, then we could be required to incur additional costs to bring the property into compliance. If we incur substantial costs to comply with the ADA or other legislation, our financial condition, results of operations, cash flow, ability to satisfy debt service obligations and our ability to make distributions to our security holders could be adversely affected.
25
TABLE OF CONTENTS
Risks Related to Our Taxation as a REIT
Our failure to qualify as a REIT would result in higher taxes and reduced cash available for stockholders.
We intend to continue to operate in a manner so as to qualify as a REIT for U.S. federal income tax purposes. Our continued qualification as a REIT depends on our satisfaction of certain asset, income, organizational, distribution and stockholder ownership requirements on a continuing basis. Our ability to satisfy some of the asset tests depends upon the fair market values of our assets, some of which are not able to be precisely determined and for which we will not obtain independent appraisals. Additionally, if either of our private REITs failed to qualify as a REIT, we would likely fail to qualify as a REIT. If we were to fail to qualify as a REIT in any taxable year, and certain statutory relief provisions were not available, we would be subject to U.S. federal income tax, including any applicable alternative minimum tax, on our taxable income at regular corporate rates, and distributions to stockholders would not be deductible by us in computing our taxable income. Any such corporate tax liability could be substantial and would reduce the amount of cash available for distribution. Unless entitled to relief under certain Internal Revenue Code provisions, we also would be disqualified from taxation as a REIT for the four taxable years following the year during which we ceased to qualify as a REIT. In addition, if we fail to qualify as a REIT, we will no longer be required to make distributions. As a result of all these factors, our failure to qualify as a REIT could impair our ability to expand our business and raise capital, and it would adversely affect the value of our common stock. Even if we qualify as a REIT, we may be may be subject to the corporate alternative minimum tax on our items of tax preference if our alternative minimum taxable income exceeds our taxable income.
REIT distribution requirements could adversely affect our liquidity.
In order to maintain our REIT status and to meet the REIT distribution requirements, we may need to borrow funds on a short-term basis or sell assets, even if the then-prevailing market conditions are not favorable for these borrowings or sales. To qualify as a REIT, we generally must distribute to our stockholders at least 90% of our net taxable income each year, excluding capital gains. In addition, we will be subject to corporate income tax to the extent we distribute less than 100% of our net taxable income including any net capital gain. We intend to make distributions to our stockholders to comply with the requirements of the Code for REITs and to minimize or eliminate our corporate income tax obligation to the extent consistent with our business objectives. Our cash flows from operations may be insufficient to fund required distributions as a result of differences in timing between the actual receipt of income and the recognition of income for federal income tax purposes (including, without limitation, taxable income from our Retained CDO Bonds that do not currently produce cash distributions), or the effect of non-deductible capital expenditures, the creation of reserves or required debt service or amortization payments. The insufficiency of our cash flows to cover our distribution requirements could have an adverse impact on our ability to raise short- and long-term debt or sell equity securities in order to fund distributions required to maintain our REIT status. In addition, we will be subject to a 4% nondeductible excise tax on the amount, if any, by which distributions paid by us in any calendar year are less than the sum of 85% of our ordinary income, 95% of our capital gain net income and 100% of our undistributed income from prior years.
Further, amounts distributed will not be available to fund investment activities. We expect to fund our investments by raising equity capital and through borrowings from financial institutions and the debt capital markets. If we fail to obtain debt or equity capital in the future, it could limit our ability to grow, which could have a material adverse effect on the value of our common stock.
In January 2011, an “ownership change” for purposes of Section 382 of the Code occurred, which limits our ability to utilize our net operating losses and net capital losses against future taxable income, increasing our dividend distribution requirement which could adversely affect our liquidity.
We have substantial net operating and net capital loss carry forwards which we have used to offset our tax and/or distribution requirements. In January 2011, an “ownership change” for purposes of Section 382 of the Code occurred, which limits our ability to use these losses. In general, an “ownership change” occurs if there is a change in ownership of more than 50% of our common stock during any cumulative three year period. For this purpose, determinations of ownership changes are generally limited to shareholders deemed to own 5% or more of our common stock. Such a change in ownership may be triggered by regular trading
26
TABLE OF CONTENTS
activity in our common stock, which is generally beyond our control. While we believe we have not had an “ownership change” since January 2011, as a result of our January 2011 “ownership change,” sections 382 and 383 impose an annual limit on the amount of net operating loss and net capital loss carryforward that can be used by us to offset future ordinary taxable income and capital gains, beginning with our 2011 taxable year. Such limitations may increase our dividend distribution requirement, which could adversely affect our liquidity.
Complying with REIT requirements may limit our ability to hedge effectively.
The existing REIT provisions of the Code may limit our ability to hedge our operations. Except to the extent provided by Treasury regulations, any income from a hedging transaction where the instrument hedges interest rate risk on liabilities used to carry or acquire real estate or hedges risk of currency fluctuations with respect to any item of income or gain that would be qualifying income under the 75% or 95% gross income tests will be excluded from gross income for purposes of the 75% and 95% gross income tests. To qualify the preceding sentence, the hedging transaction must be clearly identified as specified in Treasury regulations before the close of the day on which it was acquired, originated or entered into. To the extent that we enter into other types of hedging transactions, the income from those transactions is likely to be treated as non-qualifying income for purposes of both of the gross income tests. In addition, we must limit our aggregate income from non-qualified hedging transactions, from our provision of services and from other non-qualifying sources, to less than 5% of our annual gross income (determined without regard to gross income from qualified hedging transactions). As a result, we may have to limit our use of certain hedging techniques or implement those hedges through taxable REIT subsidiaries (“TRSs”). This could result in greater risks associated with changes in interest rates than we would otherwise want to incur or could increase the cost of our hedging activities. If we fail to satisfy the 75% or 95% limitations, we could lose our REIT qualification for U.S. federal income tax purposes, unless our failure was due to reasonable cause and not due to willful neglect, and we meet certain other technical requirements. Even if our failure was due to reasonable cause, we might incur a penalty tax.
The stock ownership limit imposed by the Code for REITs and our charter may inhibit market activity in our stock and may restrict our business combination opportunities.
In order for us to maintain our qualification as a REIT under the Code, not more than 50% in value of our outstanding stock may be owned, directly or indirectly, by five or fewer individuals (as defined in the Code to include certain entities) at any time during the last half of each taxable year. Additionally, at least 100 persons must beneficially own our capital stock during at least 335 days of a taxable year for each taxable year. Our charter, with certain exceptions, authorizes our directors to take such actions as are necessary and desirable to preserve our qualification as a REIT. Unless exempted by the Board, no person may own more than 9.8% of the aggregate value of the outstanding shares of our stock or more than 9.8% in value or in number of shares, whichever is more restrictive, of the outstanding shares of our common stock. The Board may not grant such an exemption to any proposed transferee whose ownership of in excess of 9.8% of the value of our outstanding shares or more than 9.8% in value or in number of shares, whichever is more restrictive, of the outstanding shares of our common stock, would result in the termination of our status as a REIT. These ownership limits could delay or prevent a transaction or a change in our control that might be in the best interest of our stockholders.
Dividends payable by REITs do not qualify for the reduced tax rates available for some dividends.
The maximum tax rate applicable to “qualified dividend income” payable to U.S. stockholders that are taxed at individual rates is 20%. Dividends payable by REITs, however, generally are not eligible for the reduced rates on qualified dividend income. The more favorable rates applicable to regular corporate qualified dividends could cause investors who taxed at individual rates to perceive investments in REITs to be relatively less attractive than investments in the stocks of non-REIT corporations that pay dividends, which could adversely affect the value of the shares of REITs, including our common stock.
27
TABLE OF CONTENTS
The tax on prohibited transactions will limit our ability to engage in transactions, including certain methods of securitizing loans and selling our loans and real estate properties, that may be treated as sales for U.S. federal income tax purposes.
A REIT’s gain from prohibited transactions is subject to a 100% tax. In general, prohibited transactions are sales or other dispositions of property, other than foreclosure property, but including mortgage loans and real estate, held primarily for sale to customers in the ordinary course of business.
We might be subject to this tax if we were to sell or securitize loans or dispose of loans or real estate in a manner that was treated as a sale of the loans or real estate for U.S. federal income tax purposes. Therefore, in order to avoid the prohibited transactions tax, we may choose not to engage in certain sales of loans or real estate and may limit the structures we utilize for our securitization transactions even though such sales or structures might otherwise be beneficial to us. It may be possible to reduce the impact of the prohibited transaction tax by engaging in securitization transactions treated as sales and loan and real estate dispositions through one or more of our TRSs, subject to certain limitations. Generally, to the extent that we engage in securitizations treated as sales or dispose of loans or real estate through one or more TRSs, the income associated with such activities would be subject to full corporate income tax at standard rates.
We may be unable to generate sufficient revenue from operations, operating cash flow or portfolio income to pay our operating expenses, and our operating expenses could rise, diminishing our ability and to pay distributions to our stockholders.
As a REIT, we are generally required to distribute at least 90% of our REIT taxable income, determined without regard to the dividends paid deduction and not including net capital gains, each year to our stockholders. To qualify for the tax benefits accorded to REITs, we have and intend to continue to make distributions to our stockholders in amounts such that we distribute all or substantially all our net taxable income each year, subject to certain adjustments. However, our ability to make distributions may be adversely affected by the risk factors described herein. Our ability to make and sustain cash distributions is based on many factors, including the return on our investments, the size of our investment portfolio, operating expense levels, and certain restrictions imposed by Maryland law. Some of the factors are beyond our control and a change in any such factor could affect our ability to pay future dividends. No assurance can be given as to our ability to pay distributions to our stockholders. In the event of a downturn in our operating results and financial performance or unanticipated declines in the value of our asset portfolio, we may be unable to declare or pay quarterly distributions or make distributions to our stockholders. The timing and amount of distributions are in the sole discretion of our Board, which considers, among other factors, our earnings, financial condition, debt service obligations and applicable debt covenants, REIT qualification requirements and other tax considerations and capital expenditure requirements as our Board may deem relevant from time to time.
Although our use of TRSs may be able to partially mitigate the impact of meeting the requirements necessary to maintain our qualification as a REIT, our ownership of and relationship with our TRSs will be limited, and a failure to comply with the limits would jeopardize our REIT qualification and may result in the application of a 100% excise tax.
A REIT may own up to 100% of the stock of one or more TRSs. A TRS generally may hold assets and earn income that would not be qualifying assets or income if held or earned directly by a REIT. Both the subsidiary and the REIT must jointly elect to treat the subsidiary as a TRS. A corporation of which a TRS directly or indirectly owns more than 35% of the voting power or value of the stock will automatically be treated as a TRS. Overall, no more than 25% of the value of a REIT’s assets may consist of stock or securities of one or more TRSs. In addition, the TRS rules limit the deductibility of interest paid or accrued by a TRS to its parent REIT to assure that the TRS is subject to an appropriate level of corporate taxation. The rules also impose a 100% excise tax on certain transactions between a TRS and its parent REIT that are not conducted on an arm’s-length basis.
Our TRSs, including GKK Management Co. LLC, GKK Trading Corp., GIT Trading Corp., Whiteface Holdings, LLC, GWF II SPE, LLC, Gramercy Loan Services LLC, GKK Manager LLC and GKK Liquidity LLC, will pay U.S. federal, state and local income tax on their taxable income, and their after-tax net income
28
TABLE OF CONTENTS
will be available for distribution to us but will not be required to be distributed to us. We anticipate that the aggregate value of TRS securities owned by us will be less than 25% of the value of our total assets (including such TRS securities). Furthermore, we will monitor the value of our respective investments in our TRSs for the purpose of ensuring compliance with the rule that no more than 25% of the value of a REIT’s assets may consist of TRS securities (which is applied at the end of each calendar quarter). In addition, we will scrutinize all of our transactions with our TRSs for the purpose of ensuring that they are entered into on arm’s-length terms in order to avoid incurring the 100% excise tax described above. The value of the securities that we hold in our TRSs may not be subject to precise valuation. Accordingly, there can be no complete assurance that we will be able to comply with the 25%, limitation discussed above or avoid application of the 100% excise tax discussed above.
We may be subject to adverse legislative or regulatory tax changes that could reduce the market price of our common stock.
At any time, the U.S. federal income tax laws governing REITs or the administrative interpretations of those laws may be amended. We cannot predict when or if any new U.S. federal income tax law, regulation or administrative interpretation, or any amendment to any existing U.S. federal income tax law, regulation or administrative interpretation, will be adopted, promulgated or become effective and any such law, regulation, or interpretation may take effect retroactively. We and our stockholders could be adversely affected by any such change in the U.S. federal income tax laws, regulations or administrative interpretations.
If the Operating Partnership failed to qualify as a partnership for federal income tax purposes, we would cease to qualify as a REIT and suffer other adverse consequences.
We believe that the Operating Partnership will be treated as a partnership for federal income tax purposes. As a partnership, the Operating Partnership will not be subject to federal income tax on its income. Instead, each of its partners, including us, will be allocated, and may be required to pay tax with respect to, its share of the Operating Partnership’s income. We cannot assure you, however, that the IRS will not challenge the status of the Operating Partnership or any other subsidiary partnership in which we own an interest as a partnership for federal income tax purposes, or that a court would not sustain such a challenge. If the IRS were successful in treating the Operating Partnership or any such other subsidiary partnership as an entity taxable as a corporation for federal income tax purposes, we would fail to meet the gross income tests and certain of the asset tests applicable to REITs and, accordingly, we would likely cease to qualify as a REIT. Also, the failure of the Operating Partnership or any subsidiary partnerships to qualify as a partnership could cause it to become subject to federal and state corporate income tax, which would reduce significantly the amount of cash available for debt service and for distribution to its partners, including us.
Risks Related to Our Organization and Structure
Maryland takeover statutes may prevent a change of control of our company, which could depress our stock price.
Under Maryland law, certain “business combinations” between a Maryland corporation and an interested stockholder or an affiliate of an interested stockholder are prohibited for five years after the most recent date on which the interested stockholder becomes an interested stockholder. These business combinations include a merger, consolidation, share exchange or, in circumstances specified in the statute, asset transfers or issuance or reclassification of equity securities. An interested stockholder is defined as:
| • | any person who beneficially owns 10% or more of the voting power of the corporation’s outstanding voting stock; or |
| • | an affiliate or associate of the corporation who, at any time within the two-year period prior to the date in question, was the beneficial owner of 10% or more of the voting power of the then outstanding stock of the corporation. |
| • | A person is not an interested stockholder under the statute if our Board approves in advance the transaction by which he otherwise would have become an interested stockholder. However, in approving a transaction, the board of directors may provide that its approval is subject to compliance, at or after the time of approval, with any terms and conditions determined by the board. |
29
TABLE OF CONTENTS
| • | After the five-year prohibition, any business combination between the Maryland corporation and an interested stockholder generally must be recommended by our Board approved by the affirmative vote of at least: |
| • | 80% of the votes entitled to be cast by holders of outstanding shares of voting stock of the corporation; and |
| • | two-thirds of the votes entitled to be cast by holders of voting stock of the corporation other than shares held by the interested stockholder with whom or with whose affiliate the business combination is to be effected or by the interested stockholder’s affiliates or associates, voting together as a single group. |
The business combination statute may discourage others from trying to acquire control of us and increase the difficulty of consummating any offer, including potential acquisitions that might involve a premium price for our common stock or otherwise be in the best interest of our stockholders.
In addition, Maryland law provides that “control shares” of a corporation (defined as shares which, when aggregated with other shares controlled by the stockholder (except solely by virtue of a revocable proxy), entitle the stockholder to exercise one of three increasing ranges of voting power in electing directors) acquired in a “control share acquisition” (defined as the direct or indirect acquisition of ownership or control of issued and outstanding “control shares”) have no voting rights except to the extent approved by the corporation’s stockholders by the affirmative vote of at least two-thirds of all the votes entitled to be cast on the matter, excluding all interested shares.
We have opted out of these provisions of the Maryland General Corporation Law (the “MGCL”), with respect to its business combination provisions and its control share provisions by resolution of the Board and a provision in our bylaws, respectively. However, in the future the Board may reverse its decision by resolution and elect to opt in to the MGCL’s business combination provisions, or amend our bylaws and elect to opt in to the MGCL’s control share provisions.
Additionally, Title 8, Subtitle 3 of the MGCL permits the Board, without stockholder approval and regardless of what is provided in our charter or bylaws, to implement takeover defenses, some of which we do not have. These provisions may have the effect of inhibiting a third-party from making us an acquisition proposal or of delaying, deferring or preventing a change in our control under circumstances that otherwise could provide the stockholders with an opportunity to realize a premium over the then-current market price.
We may change our investment and operational policies without stockholder consent.
We may change our investment and operational policies, including our policies with respect to investments, acquisitions, growth, operations, indebtedness, capitalization and distributions, at any time without the consent of our stockholders, which could result in our making investments that are different from, and possibly riskier than, the types of investments described in this filing. A change in our investment strategy may increase our exposure to interest rate risk, default risk and real estate market fluctuations, all of which could adversely affect our ability to make distributions.
Our authorized but unissued preferred stock may prevent a change in our control which could be in the stockholders’ best interests.
Our charter authorizes us to issue additional authorized but unissued shares of our common stock or preferred stock. Any such issuance could dilute our existing stockholders’ interests. In addition, the Board may classify or reclassify any unissued shares of common or preferred stock into other classes or series of stock and may set the preferences, rights and other terms of the classified or reclassified shares. As a result, the Board may establish a class or series of preferred stock that could delay or prevent a transaction or a change in control that might be in the best interest of our stockholders.
We may in the future choose to pay dividends in our own stock, in which case you may be required to pay income taxes in excess of the cash dividends you receive.
We may in the future distribute taxable dividends that are payable in cash and shares of our common stock at the election of each stockholder. Taxable stockholders receiving such dividends will be required to
30
TABLE OF CONTENTS
include the full amount of the dividend as ordinary income to the extent of our current and accumulated earnings and profits for United States federal income tax purposes. As a result, a U.S. stockholder may be required to pay income taxes with respect to such dividends in excess of the cash dividends received. If a U.S. stockholder sells the stock it receives as a dividend in order to pay this tax, the sales proceeds may be less than the amount included in income with respect to the dividend, depending on the market price of our stock at the time of the sale. Furthermore, with respect to non-U.S. stockholders, we may be required to withhold U.S. tax with respect to such dividends, including in respect of all or a portion of such dividend that is payable in stock. In addition, if a significant number of our stockholders determine to sell shares of our common stock in order to pay taxes owed on dividends, it may put downward pressure on the trading price of our common stock.
Risks Related to Ownership of Common Stock
Future sales of common stock in the public market or the issuance of other equity may adversely affect the market price of our common stock.
Sales of a substantial number of shares of common stock or other equity-related securities in the public market could depress the market price of our common stock, and impair our ability to raise capital through the sale of additional equity securities. We cannot predict the effect that future sales of common stock or other equity-related securities would have on the market price of our common stock.
The price of our common stock may fluctuate significantly.
The trading price of our common stock may fluctuate significantly in response to many factors, including:
| • | actual or anticipated variations in our operating results, funds from operations, or FFO, cash flows, liquidity or distributions; |
| • | changes in our earnings estimates or those of analysts; |
| • | publication of research reports about it or the real estate industry or sector in which we operate; |
| • | increases in market interest rates that lead purchasers of our shares to demand a higher dividend yield; |
| • | changes in market valuations of companies similar to us; |
| • | adverse market reaction to any securities we may issue or additional debt it incurs in the future; |
| • | additions or departures of key management personnel; |
| • | actions by institutional stockholders; |
| • | speculation in the press or investment community; |
| • | continuing high levels of volatility in the credit markets; |
| • | the realization of any of the other risk factors included herein; and |
| • | general market and economic conditions. |
The availability and timing of cash distributions is uncertain.
We are generally required to distribute to its stockholders at least 90% of its REIT taxable income, determined without regard to the dividends paid deduction and excluding any net capital gain, each year in order for us to qualify as a REIT under the Code, which we intend to satisfy through quarterly cash distributions of all or substantially all of our REIT taxable income in such year, subject to certain adjustments. From January 2009 to January 2014 we were prevented from paying dividends to holders of our common stock because we were in arrears in the payment of dividends on our 8.125% Series A cumulative redeemable preferred stock, or Series A Preferred Stock. Although such arrearages have been paid in full recently and we recently reinstituted the payment of a quarterly dividend on our common stock, we have not established a minimum distribution payment level, and our ability to make distributions may be adversely affected by a number of factors.
31
TABLE OF CONTENTS
Our Board will determine the amount and timing of any distributions. In making such determinations, our directors will consider all relevant factors, including the amount of cash available for distribution, capital expenditures, general operational requirements and applicable law. We intend over time to make regular quarterly distributions to holders of our common stock. However, we bear all expenses incurred by our operations, and the funds generated by operations, after deducting these expenses, may not be sufficient to cover desired levels of distributions to stockholders. In addition, our Board, in its discretion, may retain any portion of such cash in excess of our REIT taxable income for working capital. We cannot predict the amount of distributions we may make, maintain or increase over time.
There are many factors that can affect the availability and timing of cash distributions to stockholders. Because we may receive rents and income from our properties at various times during our fiscal year, distributions paid may not reflect our income earned in that particular distribution period. The amount of cash available for distribution will be affected by many factors, including without limitation, the amount of income we will earn from investments in target assets, the amount of its operating expenses and many other variables. Actual cash available for distribution may vary substantially from our expectations.
While we intend to fund the payment of quarterly distributions to holders of common stock entirely from distributable cash flows, we may fund quarterly distributions to its stockholders from a combination of available net cash flows, equity capital and proceeds from borrowings. In the event we are unable to consistently fund future quarterly distributions to stockholders entirely from distributable cash flows, the value of our common stock may be negatively impacted.
An increase in market interest rates may have an adverse effect on the market price of our common stock and our ability to make distributions to its stockholders.
One of the factors that investors may consider in deciding whether to buy or sell shares of our common stock is our distribution rate as a percentage of our share price, relative to market interest rates. If market interest rates increase, prospective investors may demand a higher distribution rate on shares of common stock or seek alternative investments paying higher distributions or interest. As a result, interest rate fluctuations and capital market conditions can affect the market price of shares of our common stock. For instance, if interest rates rise without an increase in our distribution rate, the market price of shares of our common stock could decrease because potential investors may require a higher distribution yield on shares of our common stock as market rates on interest-bearing instruments such as bonds rise. In addition, to the extent we have variable rate debt, rising interest rates would result in increased interest expense on our variable rate debt, thereby adversely affecting our cash flow and its ability to service our indebtedness and make distributions to our stockholders.
32
TABLE OF CONTENTS
Cautionary Note Regarding Forward-Looking Information
This report contains “forward-looking statements” within the meaning of Section 27A of the Securities Act and Section 21E of the Securities Exchange Act of 1934, as amended, or the Exchange Act. You can identify forward-looking statements by the use of forward-looking expressions such as “may,” “will,” “should,” “expect,” “believe,” “anticipate,” “estimate,” “intend,” “plan,” “project,” “continue,” or any negative or other variations on such expressions. Forward-looking statements include information concerning possible or assumed future results of our operations, including any forecasts, projections, plans and objectives for future operations. Although we believe that our plans, intentions and expectations as reflected in or suggested by those forward-looking statements are reasonable, we can give no assurance that the plans, intentions or expectations will be achieved. We have listed below some important risks, uncertainties and contingencies which could cause our actual results, performance or achievements to be materially different from the forward-looking statements we make in this report. These risks, uncertainties and contingencies include, but are not limited to, the following:
| • | the success or failure of our efforts to implement our current business strategy; |
| • | our ability to identify and complete additional property acquisitions and risks of real estate acquisitions; |
| • | availability of investment opportunities on real estate assets and real estate-related and other securities; |
| • | the performance and financial condition of tenants and corporate customers; |
| • | the adequacy of our cash reserves, working capital and other forms of liquidity; |
| • | the availability, terms and deployment of short-term and long-term capital; |
| • | demand for industrial and office space; |
| • | the actions of our competitors and our ability to respond to those actions; |
| • | the timing of cash flows from our investments; |
| • | the cost and availability of our financings, which depends in part on our asset quality, the nature of our relationships with our lenders and other capital providers, our business prospects and outlook and general market conditions; |
| • | early termination of the Management Agreement; |
| • | economic conditions generally and in the commercial finance and real estate markets and the banking industry specifically; |
| • | unanticipated increases in financing and other costs, including a rise in interest rates; |
| • | reduction in cash flows received from our investments; |
| • | volatility or reduction in the value or uncertain timing in the realization of our Retained CDO Bonds; |
| • | our ability to profitably dispose of non-core assets; |
| • | the high tenant concentration of our Bank of America Portfolio; |
| • | availability of, and ability to retain, qualified personnel and directors; |
| • | changes to our management and board of directors; |
| • | changes in governmental regulations, tax rates and similar matters; |
| • | legislative and regulatory changes (including changes to real estate and zoning laws, laws governing the taxation of REITs or the exemptions from registration as an investment company); |
| • | environmental and/or safety requirements and risks related to natural disasters; |
| • | declining real estate valuations and impairment charges; |
33
TABLE OF CONTENTS
| • | our ability to satisfy complex rules in order for us to qualify as a REIT for federal income tax purposes and qualify for our exemption under the Investment Company Act, our operating partnership’s ability to satisfy the rules in order for it to qualify as a partnership for federal income tax purposes, and the ability of certain of our subsidiaries to qualify as REITs and certain of our subsidiaries to qualify as TRSs for federal income tax purposes, and our ability and the ability of our subsidiaries to operate effectively within the limitations imposed by these rules; |
| • | uninsured or underinsured losses relating to our properties; |
| • | our inability to comply with the laws, rules and regulations applicable to companies, and in particular, public companies; |
| • | tenant bankruptcies and defaults on or non-renewal of leases by tenants; |
| • | decreased rental rates or increased vacancy rates; |
| • | the continuing threat of terrorist attacks on the national, regional and local economies; and |
| • | other factors discussed under Item 1A, “Risk Factors” of this Annual Report on Form 10-K for the year ended December 31, 2013 and those factors that may be contained in any filing we make with the Securities and Exchange Commission, or the SEC, which are incorporated by reference herein. |
We assume no obligation to update publicly any forward-looking statements, whether as a result of new information, future events, or otherwise. In evaluating forward-looking statements, you should consider these risks and uncertainties, together with the other risks described from time-to-time in our reports and documents which are filed with the SEC, and you should not place undue reliance on those statements.
The risks included here are not exhaustive. Other sections of this report may include additional factors that could adversely affect our business and financial performance. Moreover, we operate in a very competitive and rapidly changing environment. New risk factors emerge from time to time and it is not possible for management to predict all such risk factors, nor can it assess the impact of all such risk factors on our business or the extent to which any factor, or combination of factors, may cause actual results to differ materially from those contained in any forward-looking statements. Given these risks and uncertainties, investors should not place undue reliance on forward-looking statements as a prediction of actual results.
SPECIAL NOTE REGARDING EXHIBITS
In reviewing the agreements included as exhibits to this Annual Report on Form 10-K, please remember they are included to provide you with information regarding their terms and are not intended to provide any other factual or disclosure information about our company or the other parties to the agreements. The agreements contain representations and warranties by each of the parties to the applicable agreement. These representations and warranties have been made solely for the benefit of the other parties to the applicable agreement and:
| • | should not in all instances be treated as categorical statements of fact, but rather as a way of allocating the risk tone of the parties if those statements provide to be inaccurate; |
| • | have been qualified by disclosures that were made to the other party in connection with the negotiation of the applicable agreement, which disclosures are not necessarily reflected in the agreement; |
| • | may apply standards of materiality in a way that is different from what may be viewed as material to you or other investors; and |
| • | were made only as of the date of the applicable agreement or such other date or dates as may be specified in the agreement and are subject to more recent developments. |
Accordingly, these representations and warranties may not describe the actual state of affairs as of the date they were made or at any other time. Additional information about our company may be found elsewhere in this Annual Report on Form 10-K and our other public filings, which are available without charge through the SEC’s website athttp://www.sec.gov. See Item 1, “Business — Corporate Governance and Internet Address: Where Readers Can Find Additional Information.”
34
TABLE OF CONTENTS
| ITEM 1B. | UNRESOLVED STAFF COMMENTS |
As of the date of this filing, we do not have any unresolved comments with the staff of the SEC.
| ITEM 2. | PROPERTIES (Dollar amounts in thousands, except square feet and dollar per square foot amounts) |
Our corporate headquarters are located in midtown Manhattan at 521 Fifth Avenue, 30th Floor, New York, New York 10175. We also have regional offices located in Jenkintown, Pennsylvania and St. Louis, Missouri.
Current Property Portfolio
As of December 31, 2013, we owned interests either directly or through a joint venture in 107 properties containing an aggregate of approximately 7.8 million rentable square feet. The following table provides information about the properties in our wholly owned portfolio as of December 31, 2013:
GPT WHOLLY OWNED PORTFOLIO:
| | | | | | | | | | | | |
No. of
Properties | | Location | | Tenant(s) | | Leased Square Ft | | Contractual Base
Rent Per
Square Foot(1) | | Primary
Term Expiry(2) | | Outside
Term
Expiry |
Industrial Properties
| | | | | | | | | | | | | | | | | | | | | | | | |
1
| | | Greenwood, IN | | | | Nestle Waters North America,
Inc. | | | | 294,388 | | | $ | 3.50 | | | | 7/31/2024 | | | | 7/31/2044 | |
1
| | | Greenfield, IN | | | | Stanley Security Solutions, Inc.(3) | | | | 168,000 | | | $ | 3.23 | | | | 2/28/2022 | | | | 2/28/2032 | |
| | | | | | | Harlan Laboratories, Inc.(3) | | | | 77,041 | | | $ | 6.50 | | | | 12/31/2018 | | | | 12/31/2028 | |
1
| | | Olive Branch, MS | | | | Five Below, Inc. | | | | 605,427 | | | $ | 2.85 | | | | 12/31/2022 | (4) | | | 12/31/2037 | |
1
| | | Garland, TX | | | | Apex Tool Group, LLC | | | | 341,840 | | | $ | 2.23 | | | | 10/31/2032 | | | | 10/31/2052 | |
1
| | | East Brunswick, NJ | (5) | | | Con-Way Freight, Inc. | | | | 33,664 | | | $ | 27.93 | | | | 1/31/2019 | | | | 1/31/2049 | |
1
| | | Atlanta, GA | (5) | | | FedEx Freight, Inc. | | | | 129,535 | | | $ | 4.63 | | | | 5/31/2020 | | | | 5/31/2030 | |
1
| | | Bellmawr, NJ | | | | Federal Express Corporation | | | | 62,230 | | | $ | 4.69 | | | | 10/31/2022 | | | | 10/31/2032 | |
1
| | | Hialeah Gardens, FL | (6) | | | Preferred Freezer Services of
Hialeah LLC | | | | 117,591 | | | | — | (7) | | | 5/31/2039 | | | | 5/31/2059 | |
1
| | | Deer Park, NY (5) | | | | YRC Inc. | | | | 18,396 | | | $ | 16.12 | | | | 12/31/2019 | | | | 12/31/2049 | |
1
| | | Elkridge, MD | (5) | | | New Penn Motor Express, Inc | | | | 33,572 | | | $ | 14.84 | | | | 5/31/2019 | | | | 5/31/2039 | |
1
| | | Orlando, FL | (5) | | | YRC Inc. | | | | 46,458 | | | $ | 8.24 | | | | 1/31/2019 | | | | 1/31/2049 | |
1
| | | Houston, TX | (5) | | | YRC Inc. | | | | 101,940 | | | $ | 5.47 | | | | 5/31/2019 | | | | 5/31/2049 | |
1
| | | Swedesboro, NJ | (6) | | | Albert's Organics, Inc. | | | | 70,000 | | | $ | 10.30 | | | | 5/31/2028 | | | | 5/31/2038 | |
1
| | | Atlanta, GA | | | | KapStone Paper and Packaging
Corp | | | | 133,317 | | | $ | 2.60 | | | | 4/30/2023 | | | | 4/30/2028 | |
1
| | | Manassas, VA | | | | Retrievex Acquisition Corp. V | | | | 40,018 | | | $ | 7.21 | | | | 12/31/2024 | | | | 12/31/2034 | |
1
| | | Manassas, VA | | | | Retrievex Acquisition Corp. V | | | | 43,047 | | | $ | 7.21 | | | | 12/31/2024 | | | | 12/31/2034 | |
1
| | | Yuma, AZ | (6) | | | Earthbound Holdings II, LLC | | | | 216,727 | | | $ | 6.59 | | | | 9/30/2033 | | | | 9/30/2053 | |
1
| | | Austin, TX | | | | Angelica Textile Services, Inc. | | | | 120,347 | | | $ | 6.03 | | | | 10/31/2028 | | | | 10/31/2048 | |
1
| | | Galesburg, IL | | | | Euclid Beverage Ltd. | | | | 52,700 | | | $ | 3.41 | | | | 10/9/2021 | | | | 10/9/2037 | |
1
| | | Peru, IL | | | | Euclid Beverage Ltd. | | | | 78,100 | | | $ | 6.86 | | | | 6/9/2022 | | | | 6/9/2037 | |
1
| | | Lawrence, IN | | | | EF Transit, Inc. | | | | 534,769 | | | $ | 4.71 | | | | 6/30/2024 | | | | 6/30/2039 | |
1
| | | Waco, TX | | | | Associated Hygienic Products,
LLC | | | | 303,000 | | | $ | 6.27 | | | | 7/31/2029 | | | | 7/31/2039 | |
1
| | | Allentown, PA | | | | AMCOR Rigid Plastics USA, Inc. | | | | 480,000 | | | $ | 5.20 | | | | 12/23/2028 | | | | 12/23/2038 | |
1
| | | Vernon, CA | | | | Douglas Steel Supply Company | | | | 66,587 | | | $ | 7.65 | | | | 12/31/2028 | | | | 12/31/2038 | |
1
| | | Vernon, CA | | | | Douglas Steel Supply Company | | | | 53,919 | | | $ | 7.65 | | | | 12/31/2028 | | | | 12/31/2038 | |
25
| | | Subtotal | | | | | | | | 4,222,613 | | | | | | | | | | | | | |
Office/Banking Center Properties
| | | | | | | | | | | | | | | | | | | | | | | | |
1
| | | Emmaus, PA | | | | Sovereign Bank | | | | 4,800 | | | $ | 31.60 | | | | 2/28/2019 | | | | 1/31/2029 | |
1
| | | Calabash, SC | | | | PNC Bank, N.A. | | | | 2,048 | | | $ | 36.62 | | | | 12/31/2018 | | | | 12/31/2018 | |
1
| | | Morristown, NJ | | | | Wells Fargo Bank, N.A. | | | | 29,537 | | | $ | 6.04 | | | | 9/30/2024 | | | | 9/30/2054 | |
| | | | | | | U.S. Bank National Association | (3) | | | 12,324 | | | $ | 20.29 | | | | 10/31/2018 | | | | 10/31/2025 | |
3
| | | Subtotal | | | | | | | | 48,709 | | | | | | | | | | | | | |
Specialty Properties
| | | | | | | | | | | | | | | | | | | | | | | | |
1
| | | Hutchins, TX | | | | Adesa Texas, Inc. | | | | 196,366 | | | $ | 24.97 | | | | 7/31/2029 | | | | 7/31/2049 | |
1
| | | Franklin Park, IL | | | | Enterprise Leasing Company of
Chicago | | | | 22,872 | | | $ | 26.26 | | | | 4/30/2021 | | | | 4/30/2031 | |
1
| | | Chicago, IL | | | | North American Central School
Bus Int. Holding Co., LLC | | | | 36,500 | | | $ | 12.98 | | | | 10/31/2022 | | | | 10/31/2027 | |
3
| | | Subtotal | | | | | | | | 255,738 | | | | | | | | | | | | | |
31
| | | TOTAL WHOLLY OWNED PORTFOLIO | | | | 4,527,060 | | | | | | | | | | | | | |
35
TABLE OF CONTENTS
OUR JOINT VENTURE PORTFOLIO:
| | | | | | | | | | | | |
No. of
Properties | | Location | | Tenant(s) | | Leased Square Ft | | Contractual Base
Rent Per
Square Foot(1) | | Primary
Term Expiry(2) | | Outside
Term
Expiry |
Bank of America Portfolio(8)(10)
| | | | | | | | | | | | | | | | | | | | | | | | |
7
| | | Arizona | | | | Bank of America* | | | | 566,616 | | | $ | 8.87 | | | | 6/20/2023 | | | | 6/30/2053 | |
32
| | | California | | | | Bank of America* | | | | 607,661 | | | $ | 8.87 | | | | 6/30/2023 | | | | 6/30/2053 | |
| | | | | | | Non-Bank of America-9 tenants | | | | 9,353 | | | | various | | | | various | | | | various | |
17
| | | Florida | | | | Bank of America* | | | | 1,483,679 | | | $ | 8.87 | | | | 6/30/2023 | | | | 6/30/2053 | |
| | | | | | | Non-Bank of America-10 tenants | | | | 5,257 | | | | various | | | | various | | | | various | |
1
| | | Georgia | | | | Bank of America* | | | | 21,625 | | | $ | 8.87 | | | | 6/30/2023 | | | | 6/30/2053 | |
1
| | | Kansas | | | | Bank of America* | | | | 12,158 | | | $ | 8.87 | | | | 6/30/2023 | | | | 6/30/2053 | |
2
| | | Maryland | | | | Bank of America* | | | | 36,449 | | | $ | 8.87 | | | | 6/30/2023 | | | | 6/30/2053 | |
7
| | | Missouri | | | | Bank of America* | | | | 88,161 | | | $ | 8.87 | | | | 6/30/2023 | | | | 6/30/2053 | |
| | | | | | | Non-Bank of America-9 tenants | | | | 21,861 | | | | various | | | | various | | | | various | |
1
| | | New Mexico | | | | Bank of America* | | | | 37,029 | | | $ | 8.87 | | | | 6/30/2023 | | | | 6/30/2053 | |
| | | | | | | Non-Bank of America-1 tenant | | | | 22,453 | | | $ | 12.28 | | | | 2/28/2025 | | | | 2/28/2035 | |
3
| | | Texas | | | | Bank of America* | | | | 65,748 | | | $ | 8.87 | | | | 6/30/2023 | | | | 6/30/2053 | |
3
| | | Washington | | | | Bank of America* | | | | 115,439 | | | $ | 8.87 | | | | 6/30/2023 | | | | 6/30/2053 | |
| | | | | | | Non-Bank of America-1 tenant | | | | 408 | | | $ | 8.52 | | | | 2/28/2014 | | | | 2/28/2014 | |
1
| | | Virginia | | | | Bank of America* | | | | 9,466 | | | $ | 8.87 | | | | 12/31/2017 | | | | 6/30/2053 | |
| | | | | | | Non-Bank of America-1 tenant | | | | 2,575 | | | $ | 8.26 | | | | 6/30/2014 | | | | 6/30/2014 | |
75
| | | Subtotal | | | | | | | | 3,105,938 | | | | | | | | | | | | | |
Philips Headquarters(9)
| | | | | | | | | | | | | | | | | | | | | | | | |
1
| | | Somerset, NJ | | | | Philips Holding, USA Inc. | | | | 199,900 | | | $ | 18.81 | | | | 12/31/2021 | | | | 12/31/2041 | |
1
| | | Subtotal | | | | | | | | 199,900 | | | | | | | | | | | | | |
76
| | | TOTAL JOINT VENTURE PORTFOLIO | | | | 3,305,838 | | | | | | | | | | | | | |
107
| | | TOTAL PORTFOLIO | | | | 7,832,898 | | | | | | | | | | | | | |
| (1) | Represents contractual base rent per square foot in effect as of December 31, 2013. |
| (2) | Primary term expiry represents the date on which the current lease will expire should the parties to the lease elect to not exercise a term extension option or provision. Outside term expiry represents the latest date on which the lease will expire should the parties exercise each of the term extension options provided for in the lease. |
| (3) | Tenants lease spaces pursuant to a modified gross lease. |
| (4) | The effective lease expiration date is May 1, 2021. Tenant has an early termination right effective November 1, 2018 upon payment of a termination fee equivalent to 31 months of rent. |
| (6) | Cold storage facility. |
| (7) | Build-to-suit project. Anticipated completion is in May 2014 at which time the contractual base rent will be $17.01 per square foot. |
| (8) | We own a 50% interest in the Bank of America Portfolio properties. |
| (9) | We own a 25% interest in thePhilips Headquarters property. |
| (10) | There are several leases with Bank of America that aggregate to 270,927 sq ft, primarily related to held-for-sale properties in the portfolio, that have slightly varying rental rates and a primary term expiry of 12/31/2017. States containing such a lease are denoted with *. |
36
TABLE OF CONTENTS
Summary Portfolio Characteristics
The following is a summary of the characteristics of our property portfolio, including properties owned in joint ventures, as of December 31, 2013, taking into account the lease for our build-to-suit project in Hialeah Gardens, Florida that is currently under construction and is anticipated to be completed in the second quarter of 2014 and be leased to Preferred Freezer Services of Hialeah, LLC upon completion of construction:
| • | a weighted average remaining lease term of 11.7 years (based on annualized base rent); |
| • | 53.5% investment grade tenancy (includes subsidiaries of non-guarantor investment grade parent companies) (based on annualized base rent); |
| • | Industrial portfolio comprised of 4.2 million aggregate rentable square feet with an average base rent per square foot of $5.33; |
| • | Office portfolio comprised of 3.4 million aggregate rentable square feet with an average base rent per square foot of $9.53 (including the properties we own through joint ventures); |
| • | Specialty asset portfolio of three improved sites comprised of 186 acres of land and 256 thousand aggregate rentable square feet of building space that we lease to a car auction services company, a bus depot and a rental car company; and |
| • | Top five tenants by annualized base rent include Bank of America (31%), Adesa Texas, Inc. (11%), EF Transit, Inc. (6%), AMCOR Rigid Plastics USA, Inc. (6%), Preferred Freezer Services of Hialeah, LLC (5%). Each of the top five tenant leases is guaranteed by the respective tenant’s parent company. Our lease with Preferred Freezer Services of Hialeah, LLC starts upon completion of construction of the facility currently expected in the second quarter of 2014. |
Joint Ventures
Bank of America Portfolio — We own a 50% joint venture interest in the Bank of America Portfolio, which is comprised of 75 office properties and banking centers located across the United States totaling approximately 3.2 million rentable square feet. As of December 2013, 95% of the rentable square feet in the Bank of America Portfolio is leased to Bank of America under a master lease with expiration dates through 2023. As of December 31, 2013, the Bank of America Portfolio had a total portfolio occupancy of approximately 96%. We acquired our joint venture interest in the Bank of America Portfolio in December 2012. The joint venture’s acquisition of the Bank of America Portfolio was financed with a $200,000 floating rate, interest-only mortgage loan maturing in December 2014, collateralized by 67 properties of the portfolio. The mortgage note has three one-year extension options subject to satisfaction of certain terms and conditions. The remaining properties are unencumbered. During the year ended December 31, 2013, the joint venture sold 38 properties for aggregate net proceeds of approximately $43,284.
Philips Building — We own a 25% interest in Philips HQ JV, which is owner of a fee interest in 200 Franklin Square Drive, a 199,900 square foot office building located in Somerset, New Jersey which is 100% net leased to Philips Holdings, USA Inc., a wholly-owned subsidiary of Royal Philips Electronics, through December 2021. The property is subject to a $41,000 fixed-rate mortgage with an anticipated repayment date in 2015.
Leased Properties
Our corporate offices at 521 Fifth Avenue, 30th Floor, New York, New York are subject to an operating lease agreement with 521 Fifth Fee Owner, LLC, an affiliate of SL Green, effective as of September 2013. The lease is for approximately 6,580 square feet and carries a term of 10 years with rents of approximately $373 per annum for year one rising to $463 per annum in year ten. Our previous corporate offices at 420 Lexington Avenue, New York, New York, were subject to an operating lease agreement with SLG Graybar Sublease LLC, an affiliate of SL Green, effective May 1, 2005, which was subsequently amended in May and June 2009 and in June 2012. In April 2013, we cancelled the lease for the corporate offices at 420 Lexington Avenue effective in September 2013 concurrently with the commencement of the lease for the new corporate offices at 521 Fifth Avenue.
37
TABLE OF CONTENTS
Our regional management office located at 610 Old York Road, Jenkintown, Pennsylvania, is subject to an operating lease with an affiliate of KBS. The lease is for approximately 19,000 square feet, and expires on April 30, 2014, with rents of approximately $322 per annum. Our regional management office located at 800 Market Street, St. Louis, Missouri, is subject to an operating lease with St. Louis BOA Plaza, LLC. The lease is for approximately 2,000 square feet, expires on September 30, 2014, and is cancelable with 60 days’ notice. The lease is subject to rents of $32 per annum.
Development Plans
As of December 31, 2013, we have no plans for development of new properties other than in connection with build-to-suit transactions where a tenant has signed a lease in advance of construction, and a developer or builder bears the risk of completion on-time and on-budget. We will, from time to time renovate, improve, expand or repair existing properties where we believe the incremental investment increases the value of the property and the incremental capital can be invested at attractive risk-adjusted returns. We will, from time to time acquire adjacent land parcels to properties in our portfolio in order to accommodate expansions of existing properties. We currently have one build-to-suit transaction in process pursuant to which we have committed to construct a 117,591 square foot cold storage facility in Hialeah Gardens, Florida. The facility will be 100% leased for an initial term of 25 years upon completion of construction, which is expected to occur in the second quarter of 2014.
In December 2010, we sold our 45% joint venture interest in the leased fee of the 2 Herald Square property in New York, New York, for approximately $25.6 million plus assumed mortgage debt of approximately $86.1 million or the 2 Herald Sale Transaction. Subsequent to the closing of the transaction, the New York City Department of Finance, or the NYC DOF, and New York State Department of Taxation, or the NYS DOT, issued notices of determination assessing, in the case of the NYC DOF notice, approximately $2.9 million of real property transfer tax, plus interest, and, in the case of the NYS DOT notice, approximately $446 thousand of real property transfer tax, plus interest, collectively, the Transfer Tax Assessments, against us in connection with the 2 Herald Sale Transaction. We believe that NYC DOF and NYS DOT erred in issuing the Transfer Tax Assessments and intend to vigorously defend against same. In September 2013, we filed a petition challenging the NYC DOF Transfer Tax Assessment with the New York City Tax Appeal Tribunal, and we intend to timely filing a similar petition challenging the NYS DOF Transfer Tax Assessment.
In November 2013, NYC DOF filed an answer to the petition reiterating their position that the 2 Herald Sale Transaction was taxable by NYC DOF. In January and February 2014, the parties held a preliminary conference with the trial judge assigned the matter, agreed to discuss whether a settlement could be reached and subsequently determined that no such settlement was possible. A follow-up conference with the judge is scheduled during March 2014, at which we anticipate that parties will advise the judge that they wish to proceed to trial, which we expect to occur in mid-2014.
An initial conciliation conference for our NYS DOT Transfer Tax Assessment was held in October 2013. In November 2013, the NYS DOT provided additional information in support of its position. In February 2014, following a discussion, we and the NYS DOT determined that the parties could not amicably settle the dispute. We expect that the conciliator will issue its determination shortly, following which we will formally file our petition challenging the NYS DOT Transfer Tax Assessment.
We believe that we have strong defenses against the Transfer Tax Assessments and intend to continue to vigorously assert same. We evaluate contingencies based on information currently available, including the advice of counsel. We establish accruals for litigation and claims when a loss contingency is considered probable and the related amount is reasonably estimable. We will periodically review these contingences and may adjust the amount of the accrual if circumstances change. The outcome of a contingent matter and the amount or range of potential losses at particular points may be difficult to ascertain. If a range of loss is estimated and an amount within such range appears to be a better estimate than any other amount within that range, then that amount is accrued. Considering the recent developments as discussed above, as of December 31, 2013, we established an accrual of approximately $4.3 million for the Transfer Tax
38
TABLE OF CONTENTS
Assessments, which represents the full amount of the assessed tax plus estimated interest and penalties through December 31, 2013, within discontinued operations.
In addition, we and/or one or more of our subsidiaries is party to various litigation matters that are considered routine litigation incidental to our business, none of which are considered material.
| ITEM 4. | MINE SAFETY DISCLOSURES |
Not applicable.
39
TABLE OF CONTENTS
Part II
| ITEM 5. | MARKET FOR REGISTRANT’S COMMON EQUITY, RELATED STOCKHOLDER MATTERS AND ISSUER PURCHASES OF EQUITY SECURITIES |
Our common stock began trading on the New York Stock Exchange, or the NYSE, on August 2, 2004 under the symbol “GKK.” In April 2013, we changed our name from Gramercy Capital Corp. to Gramercy Property Trust Inc. reflecting our transformation into an equity real estate business, and on April 15, 2013, our NYSE ticker symbol was changed to “GPT.” On March 13, 2014, the reported closing sale price per share of common stock on the NYSE was $5.45 and there were approximately 247 holders of record of our common stock. This number does not include stockholders’ shares held in nominee or street name. The table below sets forth the quarterly high and low closing sales prices of our common stock on the NYSE for the years ended December 31, 2013 and 2012 and the distributions paid by us with respect to the periods indicated.
| | | | | | | | | | | | |
| | 2013 | | 2012 |
| Quarter Ended | | High | | Low | | Dividends | | High | | Low | | Dividends |
| March 31 | | $ | 5.21 | | | $ | 3.00 | | | $ | — | | | $ | 3.07 | | | $ | 2.34 | | | $ | — | |
| June 30 | | $ | 5.17 | | | $ | 4.34 | | | $ | — | | | $ | 2.68 | | | $ | 2.45 | | | $ | — | |
| September 30 | | $ | 4.83 | | | $ | 3.99 | | | $ | — | | | $ | 3.09 | | | $ | 2.31 | | | $ | — | |
| December 31 | | $ | 5.76 | | | $ | 3.99 | | | $ | — | | | $ | 3.05 | | | $ | 2.56 | | | $ | — | |
If dividends are declared in a quarter, those dividends will be paid during the subsequent quarter. In December 2013, our board of directors authorized and we declared a “catch-up” dividend in the amount of $10.23524 per share of our 8.125% Series A Cumulative Redeemable Preferred Stock, representing all accrued and unpaid dividends on the Series A Preferred Stock for the period October 1, 2008, through and including October 14, 2013. In December 2013, our board of directors also authorized and we declared a Series A Preferred Stock quarterly dividend payment in the amount of $0.50781 per share, for the period October 15, 2013, through and including January 14, 2014. Both the accrued dividend and the quarterly dividend were paid to holders of the Series A Preferred Stock of record as of the close of business on December 31, 2013. The accrued dividend was paid on January 13, 2014, and the quarterly dividend was paid on January 15, 2014. Both dividend payments will be taxable to the recipients primarily as ordinary income. In accordance with the provisions of our charter, we may not pay any dividends on our common stock until all accrued dividends and the dividend for the then current quarter on the Series A Preferred Stock are paid in full.
In March 2014, our board of directors authorized and declared a quarterly dividend of $0.035 per common share for the first quarter of 2014, payable on April 15, 2014 to holders of record as of the close of business on March 31, 2014. Our board of directors also authorized and declared the Series A Preferred Stock quarterly dividend payment in the amount of $0.50781 per share, for the period January 15, 2014, through and including April 14, 2014, payable on April 15, 2014 to holders of record as of the close of business on March 31, 2014. We expect to continue our policy of generally distributing 100% of our taxable income through dividends, although there is no assurance as to future dividends because they depend on future earnings, capital requirements and financial condition. See Item 7 “Management’s Discussion and Analysis of Financial Condition and Results of Operations — Dividends” for additional information regarding our dividends.
In connection with Mr. Gordon F. DuGan’s agreement to serve as our Chief Executive Officer, on June 7, 2012, Mr. DuGan also agreed to purchase 1,000,000 shares of our common stock from us on June 29, 2012 for an aggregate purchase price of $2.5 million or $2.52 per share. The per share purchase price was equal to the closing price of our common stock on the New York Stock Exchange on the day prior to the date Mr. DuGan entered into the subscription agreement with us to purchase such shares of common stock. The issuance of such shares of common stock was a private placement exempt from the registration requirements of the Securities Act. We intend to use the net proceed from this issuance for general corporate purposes, which may include, but not limited to, acquisitions of single tenant lease investments.
We issued to KBS Acquisition Sub-Owner 2, LLC (i) 2,000,000 shares of our common stock; (ii) 2,000,000 shares of our Class B-1 non-voting common stock; and (iii) 2,000,000 shares of our Class B-2 non-voting common stock, on December 6, 2012. The shares were issued as consideration for the our contribution to the joint venture which purchased the Bank of America Portfolio on the same date and were valued at $2.75 which was the closing price of our common stock on the New York Stock Exchange as of the
40
TABLE OF CONTENTS
date of the executed purchase and sale agreement. Each share of the Class B-1 common stock and Class B-2 common stock is convertible into one share of our common stock at the option of the holder at any time on or after September 5, 2013 and December 6, 2013, respectively. During 2013, all Class B-1 and Class B-2 common stock were converted into an equal amount of shares of our common stock.
In October 2013, we issued 11,535,200 unregistered shares of common stock at a purchase price of $4.11 per share, raising gross proceeds of $47.4 million in a private placement pursuant to a common stock purchase agreement and related joinder agreements, or the Purchase Agreement. Each purchaser has agreed that it will not sell the common stock purchased until March 25, 2014, or the Lock-Up Date. Prior to the Lock-Up Date, if we issue common stock or securities convertible into common stock (except for certain permitted issuances), then the purchasers will have the ability to: (1) purchase their pro rata portion of all or any part of our new issuance, and (2) elect the benefit of any different terms provided to the new investors. We also entered into contingent value rights agreements, or the CVR Agreements, with the purchasers at the closing of the sale of common stock. We issued one Contingent Value Right, or CVR, to each purchaser per common stock purchased. The CVR entitles the purchasers to receive a one-time cash payment on April 1, 2014, not to exceed $0.46 per share, equal to the amount per share that our volume weighted average share price for the ten trading day period ending on the Lock-Up Date, is less than the per share purchase price of $4.11 per share.
Stock Performance Graph
This graph compares the performance of our shares with the Standard & Poor’s 500 Composite Index and the NAREIT All REIT Index. This graph assumes $100 invested on January 1, 2009 and assumes the reinvestment of dividends.
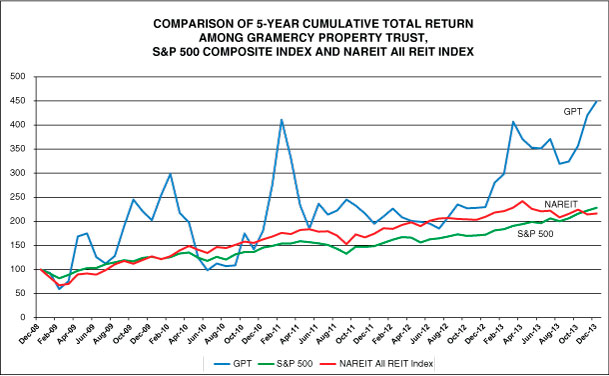
41
TABLE OF CONTENTS
Equity Compensation Plan Information
The following table summarizes information, as of December 31, 2013, relating to our equity compensation plans pursuant to which shares of our common stock or other equity securities may be granted from time to time.
| | | | | | |
| Plan Category | | (a)
Number of securities to be issued upon exercise of outstanding options, warrants and rights | | (b)
Weighted-average exercise price of outstanding options, warrants and rights | | (c)
Number of securities remaining available for future issuance under equity compensation plans (excluding securities reflected in column (a)) |
Equity compensation plans approved by security
holders(1) | | | 341,081 | | | $ | 14.70 | | | | 2,070,416 | |
| Equity compensation plans not approved by security holders(2) | | | — | | | | — | | | | 500,000 | |
| Total | | | 341,081 | | | $ | 14.70 | | | | 2,570,416 | |

| (1) | Includes information related to our 2004 Equity Incentive Plan. |
| (2) | Includes information related to our 2012 Inducement Equity Incentive Plan. |
42
TABLE OF CONTENTS
| ITEM 6. | SELECTED FINANCIAL DATA |
The following tables set forth our selected financial data and should be read in conjunction with our Financial Statements and notes thereto included in Item 8, “Financial Statements and Supplementary Data” and Item 7, “Management’s Discussion and Analysis of Financial Condition and Results of Operations” in this Form 10-K. Certain prior year balances have been reclassified to conform with the current year presentation for assets classified as discontinued operations.
Operating Data (In thousands, except share and per share data)
| | | | | | | | | | |
| | For the year ended December 31, |
| | | 2013 | | 2012 | | 2011 | | 2010 | | 2009 |
| Total revenues | | $ | 56,704 | | | $ | 36,821 | | | $ | 7,772 | | | $ | 1,197 | | | $ | 72 | |
| Property operating expenses | | | 22,279 | | | | 23,226 | | | | 5,947 | | | | 4,033 | | | | 4,963 | |
| Other-than-temporary impairment | | | 2,002 | | | | — | | | | — | | | | — | | | | — | |
| Interest expense | | | 1,732 | | | | — | | | | — | | | | 280 | | | | 2 | |
| Depreciation and amortization | | | 5,675 | | | | 256 | | | | 136 | | | | 174 | | | | 251 | |
| Management, general and administrative | | | 18,210 | | | | 25,335 | | | | 22,150 | | | | 22,369 | | | | 37,365 | |
| Unrealized loss on derivative instruments | | | 115 | | | | — | | | | — | | | | — | | | | — | |
| Business acquistion costs | | | 2,808 | | | | 111 | | | | — | | | | — | | | | — | |
| Total expenses | | | 52,821 | | | | 48,928 | | | | 28,233 | | | | 26,856 | | | | 42,581 | |
| Income (loss) from continuing operations before equity in income (loss) from joint ventures and provision for taxes | | | 3,883 | | | | (12,107 | ) | | | (20,461 | ) | | | (25,659 | ) | | | (42,509 | ) |
| Equity in net income (loss) of joint ventures | | | (5,662 | ) | | | (2,904 | ) | | | 121 | | | | (303 | ) | | | 113 | |
| Loss from continuing operations before provision for taxes, gain on extinguishment of debt, and discontinued operations | | | (1,779 | ) | | | (15,011 | ) | | | (20,340 | ) | | | (25,962 | ) | | | (42,396 | ) |
| Gain on extinguishment of debt | | | — | | | | — | | | | — | | | | — | | | | 106,177 | |
| Provision for taxes | | | (6,393 | ) | | | (3,330 | ) | | | (563 | ) | | | (966 | ) | | | (2,534 | ) |
Net income (loss) from continuing
operations | | | (8,172 | ) | | | (18,341 | ) | | | (20,903 | ) | | | (26,928 | ) | | | 61,247 | |
Net income (loss) from discontinued
operations | | | 392,999 | | | | (153,207 | ) | | | 358,380 | | | | (946,315 | ) | | | (581,646 | ) |
| Net income (loss) | | | 384,827 | | | | (171,548 | ) | | | 337,477 | | | | (973,243 | ) | | | (520,399 | ) |
| Net (income) loss attributable to non-controlling interest | | | — | | | | — | | | | — | | | | (145 | ) | | | 770 | |
| Net income (loss) attributable to Gramercy Property Trust Inc. | | | 384,827 | | | | (171,548 | ) | | | 337,477 | | | | (973,388 | ) | | | (519,629 | ) |
| Accrued preferred stock dividends | | | (7,162 | ) | | | (7,162 | ) | | | (7,162 | ) | | | (8,798 | ) | | | (9,414 | ) |
| Excess of carrying amount of tendered preferred stock over consideration paid | | | — | | | | — | | | | — | | | | 13,713 | | | | — | |
| Net income (loss) avaliable to common stockholders | | $ | 377,665 | | | $ | (178,710 | ) | | $ | 330,315 | | | $ | (968,473 | ) | | $ | (529,043 | ) |
Net income (loss) per common
share – Basic | | $ | 6.14 | | | $ | (3.44 | ) | | $ | 6.58 | | | $ | (19.40 | ) | | $ | (10.61 | ) |
Net income (loss) per common
share – Diluted | | $ | 6.14 | | | $ | (3.44 | ) | | $ | 6.58 | | | $ | (19.40 | ) | | $ | (10.52 | ) |
| Basic weighted average common shares outstanding | | | 61,500,847 | | | | 51,976,462 | | | | 50,229,102 | | | | 49,923,930 | | | | 49,854,174 | |
| Diluted weighted average common shares and common share equivalents outstanding | | | 61,500,847 | | | | 51,976,462 | | | | 50,229,102 | | | | 49,923,930 | | | | 50,306,816 | |
43
TABLE OF CONTENTS
Balance Sheet Data (In thousands)
| | | | | | | | | | |
| | Year ended December 31, |
| | | 2013 | | 2012 | | 2011 | | 2010 | | 2009 |
| Total real estate investments, net | | $ | 333,465 | | | $ | 23,109 | | | $ | 7,631 | | | $ | 2,226,212 | | | $ | 3,148,790 | |
| Loans and other lending investments, net | | | — | | | | 73 | | | | 828 | | | | 1,512 | | | | — | |
| Assets held for sale, net | | | — | | | | 1,952,264 | | | | 2,078,146 | | | | 2,441,827 | | | | 2,633,225 | |
| Investment in unconsolidated joint ventures | | | 39,385 | | | | 72,742 | | | | 496 | | | | 3,650 | | | | 84,865 | |
| Total assets | | $ | 491,663 | | | $ | 2,168,836 | | | $ | 2,258,330 | | | $ | 5,491,993 | | | $ | 6,765,437 | |
| Mortgage note payable | | | 122,180 | | | | — | | | | — | | | | 1,640,671 | | | | 1,702,155 | |
| Mezzanine loans payable | | | — | | | | — | | | | — | | | | 549,713 | | | | 553,522 | |
| Term loan, credit facility and repurchase facility | | | 45,000 | | | | — | | | | — | | | | — | | | | — | |
| Junior subordinated notes | | | — | | | | — | | | | — | | | | — | | | | 52,500 | |
| Total liablilites | | | 225,190 | | | | 2,420,664 | | | | 2,698,760 | | | | 5,984,986 | | | | 6,197,919 | |
| Stockholders' equity | | $ | 266,473 | | | $ | (251,828 | ) | | $ | (440,430 | ) | | $ | (492,993 | ) | | $ | 567,518 | |
Other Data (In thousands)
| | | | | | | | | | |
| | For the year ended December 31, |
| | | 2013 | | 2012 | | 2011 | | 2010 | | 2009 |
| Funds from operations(1) | | $ | 1,267 | | | $ | (24,616 | ) | | $ | (24,696 | ) | | $ | (21,984 | ) | | $ | 53,352 | |
| Cash flows provided by operating activities | | $ | 29,403 | | | $ | 283 | | | $ | 87,105 | | | $ | 116,831 | | | $ | 86,960 | |
| Cash flows provided by (used by) investing activities | | $ | (216,092 | ) | | $ | 248,288 | | | $ | 51,133 | | | $ | 154,707 | | | $ | 131,121 | |
| Cash flows provided by (used by) financing activities | | $ | 124,620 | | | $ | (306,894 | ) | | $ | (195,358 | ) | | $ | (189,038 | ) | | $ | (216,564 | ) |
| (1) | We present FFO because we consider it an important supplemental measure of our operating performance and believe that it is frequently used by securities analysts, investors and other interested parties in the evaluation of REITS. We also use FFO as one of several criteria to determine performance-based incentive compensation for members of our senior management, which may be payable in cash or equity awards. The revised White Paper on FFO approved by the Board of Governors of the National Association of Real Estate Investment Trusts, or NAREIT, defines FFO as net income (loss) (determined in accordance with GAAP), excluding impairment write-downs of investments in depreciable real estate and investments in in-substance real estate investments, gains or losses from debt restructurings and sales of depreciable operating properties, plus real estate-related depreciation and amortization (excluding amortization of deferred financing costs), less distributions to non-controlling interests and gains/losses from discontinued operations and after adjustments for unconsolidated partnerships and joint ventures. FFO does not represent cash generated from operating activities in accordance with GAAP and should not be considered as an alternative to net income (determined in accordance with GAAP), as an indication of our financial performance, or to cash flow from operating activities (determined in accordance with GAAP) as a measure of our liquidity, nor is it entirely indicative of funds available to fund our cash needs, including our ability to make cash distributions. Our calculation of FFO may be different from the calculation used by other companies and, therefore, comparability may be limited. |
A reconciliation of FFO to net income computed in accordance with GAAP is provided under the heading of “Management’s Discussion and Analysis of Financial Condition and Results of Operations — Funds from Operations.”
44
TABLE OF CONTENTS
| ITEM 7. | MANAGEMENT’S DISCUSSION AND ANALYSIS OF FINANCIAL CONDITION AND RESULTS OF OPERATIONS
(Amounts in thousands, except Overview section, share and per share data) |
Overview
Gramercy Property Trust Inc. is a fully-integrated, self-managed commercial real estate investment company focused on acquiring and managing income-producing industrial and office properties net leased to high quality tenants in major markets throughout the United States. We also operate an asset management business that manages for third-parties, including our Bank of America Portfolio joint venture, commercial real estate assets.
We were founded in 2004 as a specialty finance Real Estate Investment Trust focused on originating and acquiring loans and securities related to commercial and multifamily properties. In July 2012, following a strategic review, our board of directors announced a repositioning of us as an equity REIT. To reflect this transformation, in April 2013 we changed our name from Gramercy Capital Corp. to Gramercy Property Trust Inc. and began trading on the New York Stock Exchange under our new symbol GPT.
We seek to acquire and manage a diversified portfolio of high quality net leased properties that generates stable, predictable cash flows and protects investor capital over a long investment horizon. We expect that these properties generally will be leased to a single tenant. Under a net lease, the tenant typically bears the responsibility for all property related expenses such as real estate taxes, insurance, and repair and maintenance costs. We believe this lease structure provides an owner cash flows over the term of the lease that are more stable and predictable than other forms of leases, and minimizes the ongoing capital expenditures often required with other property types.
We approach the net leased market as a value investor, looking to identify and acquire net leased properties that we believe offer attractive risk adjusted returns throughout market cycles. We focus primarily on industrial and office properties, where we believe attractive investment opportunities currently exist. We focus on acquiring assets in major markets where strong demographic and economic growth offer, in our view, a higher probability of producing long term rent growth and/or capital appreciation. Our goal is to grow our existing portfolio and become a pre-eminent owner of net leased commercial industrial and office properties in the United States.
We believe that within the net leased industry, industrial and office investments offer a fundamentally different opportunity from the market for net leased retail assets. Industrial and office assets tend to be heterogeneous, and valuation is frequently influenced by local real estate market conditions and tenant preferences. In our view, the skillset required to properly underwrite industrial and office assets is specific to those assets and can be used to drive significant investment outperformance. We also believe that well-located industrial and office assets are better positioned to experience rent growth and asset price appreciation than single tenant retail assets in an inflationary environment.
As of December 31, 2013, we owned interests (either directly or through a joint venture) in 107 properties containing an aggregate of approximately 7.8 million rentable square feet. The following is a summary of the characteristics of our property portfolio at December 31, 2013 and also taking into account the lease for our build-to-suit project in Hialeah Gardens, Florida that is currently under construction and is anticipated to be completed in the second quarter of 2014 and leased to Preferred Freezer Services of Hialeah, LLC upon completion of construction:
| • | a weighted average remaining lease term of 11.7 years (based on annualized base rent); |
| • | 53.5% investment grade tenancy (includes subsidiaries of non-guarantor investment grade parent companies) (based on annualized base rent); |
| • | Industrial portfolio comprised of 4.2 million aggregate rentable square feet with an average base rent per square foot of $5.33; |
| • | Office portfolio comprised of 3.4 million aggregate rentable square feet with an average base rent per square foot of $9.53 (including the properties we own through joint ventures); |
45
TABLE OF CONTENTS
| • | Specialty asset portfolio of three improved sites comprised of 186 acres of land and 256 thousand aggregate rentable square feet of building space that we lease to a car auction services company, a bus depot and a rental car company; and, |
| • | Top five tenants by annualized base rent include: Bank of America (31%); Adesa Texas, Inc., (11%); EF Transit, Inc., (6%); AMCOR Rigid Plastics USA, Inc., (6%); and Preferred Freezer Services of Hialeah, LLC, (5%). Our lease with Preferred Freezer Services of Hialeah, LLC starts upon completion of construction of the facility currently expected in the second quarter of 2014. |
We have achieved a number of important milestones since our board of directors elected to reposition our company as a REIT focused on acquiring and managing income producing net leased properties, including:
Property Investment
| • | During the year ended December 31, 2013, we acquired 29 properties aggregating approximately 4.0 million square feet for a total purchase price of approximately $340.8 million. |
| • | As of December 31, 2013, our property portfolio is 99.1% occupied for a weighted average lease term of 11.7 years, 53.5% is leased to investment grade tenants. |
Sold Specialty Finance Business/Assets and Reduced Costs
| • | In March 2013, we sold our collateral management and sub-special servicing contracts for our three CDOs, disposed of certain non-core legacy assets and exited the commercial real estate finance business. |
| • | We downsized our New York City headquarters office, closed one satellite property management office, reduced employee headcount, rebid our professional consulting and insurance contracts, and reduced annual run rate management, general and administrative expenses. |
Raised Capital and Repaid Accrued Preferred Stock Dividends
| • | In September 2013, we entered into a $100.0 million senior secured credit facility with an accordion feature to increase the facility to $150.0 million, which was exercised by us and approved by the lenders in February 2014. |
| • | In October 2013, we issued and sold 11.5 million shares of our common stock in a private placement at a price of $4.11 per share, resulting in total net proceeds to us of approximately $45.5 million. |
| • | In December 2013, our board declared, and in January 2014, we paid in full, the accrued and unpaid dividends on our Series A Preferred Stock and began the timely payment of the quarterly preferred dividends beginning with the dividend due January 15, 2014, positioning us to re-commence dividends on our common stock. |
Optimized Asset Management Business
| • | We executed or extended asset management contracts with third-party property owners, including our joint venture partners, resulting in an aggregate of $1.4 billion in assets under management at December 31, 2013; |
| • | During the year ended December 31, 2013, we generated $40.9 million in asset management revenue, including a $12.0 million out-performance fee (pre-tax) under our asset management agreement with KBS. |
46
TABLE OF CONTENTS
We have elected to be taxed as a real estate investment trust, or REIT, under the Internal Revenue Code of 1986, as amended, or the Internal Revenue Code, and generally will not be subject to U.S. federal income taxes to the extent we distribute our taxable income, if any, to our stockholders. We have in the past established, and may in the future establish taxable REIT subsidiaries, or TRSs, to effect various taxable transactions. Those TRSs would incur U.S. federal, state and local taxes on the taxable income from their activities.
We conduct substantially all of our operations through our operating partnership, GPT Property Trust LP, or our Operating Partnership. We are the sole general partner of our Operating Partnership. Our Operating Partnership conducts our commercial real estate investment business through various wholly-owned entities and our realty management business primarily through a wholly-owned TRS.
Unless the context requires otherwise, all references to “Gramercy,” “our Company,” “we,” “our” and “us” mean Gramercy Property Trust Inc., a Maryland corporation, and one or more of its subsidiaries, including our Operating Partnership.
Property Investment
During the year ended December 31, 2013, we acquired 29 properties aggregating approximately 4.0 million square feet for a total purchase price of approximately $340.8 million. A summary of our consolidated portfolio as of December 31, 2013 and 2012 is presented below:
| | | | | | | | | | | | | | | | |
| | Number of Properties | | Rentable Square Feet | | Occupancy | | Weighted-average
Lease Term(1) |
| Properties | | December 31, 2013 | | December 31, 2012(3) | | December 31, 2013 | | December 31, 2012(3) | | December 31, 2013 | | December 31, 2012(3) | | December 31, 2013 | | December 31, 2012(3) |
| Office/Banking Centers | | | 3 | | | | — | | | | 48,709 | | | | — | | | | 100.0 | % | | | 0.0 | % | | | 8.45 | | | | — | |
Industrial
Properties(2) | | | 25 | | | | 2 | | | | 4,222,613 | | | | 539,429 | | | | 100.0 | % | | | 100.0 | % | | | 10.38 | | | | 10.04 | |
| Specialty Assets | | | 3 | | | | — | | | | 255,738 | | | | — | | | | 100.0 | % | | | 0.0 | % | | | 13.87 | | | | — | |
| Total | | | 31 | | | | 2 | | | | 4,527,060 | | | | 539,429 | | | | 100.0 | % | | | 100.0 | % | | | 10.55 | | | | 10.04 | |
| (1) | Weighted-average lease term is based upon the remaining non-cancelable lease term as of December 31, 2013 and 2012, respectively. The weighted-average calculation is based upon square footage. |
| (2) | The Industrial properties line includes the build-to-suit property in Hialeah Gardens, Florida, which was purchased on May 30, 2013 and represents a 118 thousand square foot cold storage facility currently being constructed, which will be 100% leased for an initial term of 25 years when completed in the second quarter of 2014. |
| (3) | Properties classified as held-for-sale at 12/31/2012 are not included in the table above. |
Joint Ventures
Bank of America Portfolio — We own a 50% joint venture interest in the Bank of America Portfolio, which is comprised of 75 office properties and banking centers located across the United States totaling approximately 3.2 million rentable square feet. As of December 2013, 95% of the rentable square feet in the Bank of America Portfolio is leased to Bank of America, N.A. under a master lease with expiration dates through 2023. As of December 31, 2013, the Bank of America Portfolio had a total portfolio occupancy of approximately 96%. We acquired our joint venture interest in the Bank of America Portfolio in December 2012. The joint venture’s acquisition of the Bank of America Portfolio was financed with a $200.0 million floating rate, interest-only mortgage loan maturing in December 2014, collateralized by 67 properties of the portfolio. The remaining eight properties are unencumbered. During the year ended December 31, 2013, the joint venture sold 38 properties for aggregate net proceeds of approximately $43.3 million.
Philips Electronics — We own a 25% interest in Philips HQ JV, which is owner of a fee interest in 200 Franklin Square Drive, a 200 thousand square foot office building located in Somerset, New Jersey which is 100% net leased to Philips Holdings, USA Inc., a wholly-owned subsidiary of Royal Philips Electronics, through December 2021. The property is subject to a $41.0 million fixed-rate mortgage loan with an anticipated repayment date in 2015.
47
TABLE OF CONTENTS
Asset and Property Management
In addition to net leased investing, we also operate a commercial real estate management business for third-parties including our Bank of America Portfolio Joint Venture. As of December 31, 2013, this business, which operates under the name Gramercy Asset Management, managed approximately $1.4 billion of commercial properties leased primarily to regulated financial institutions and affiliated users throughout the United States. We manage properties for companies including KBS, Garrison through their investment in the Bank of America Portfolio Joint Venture, and Oak Tree Capital Management, L.P.
We have an integrated asset management platform within Gramercy Asset Management to consolidate responsibility for, and control over, leasing, lease administration, property management, operations, construction management, tenant relationship management and property accounting. To the extent that we provide asset management services for third-party property owners, we provide such services in consultation with and at the direction of such owners.
In December, 2013, one of our wholly owned TRSs extended the Original Management Agreement with KBS. The Original Management Agreement was extended through execution of an Amended and Restated Asset Management Services Agreement, or the Management Agreement, effective as of December 1, 2013. As part of the execution of the Management Agreement, KBS made a $12.0 million payment to our TRS in satisfaction of the profit participation provisions under the Original Management Agreement. In addition, the Management Agreement provides for a base management fee of $7.5 million per year as well as certain other fees as provided therein. The term of the Management Agreement will continue to December 31, 2016 (with a one year extension option exercisable by KBS), unless earlier terminated as therein provided, and also provides incentive fees in the form of profit participation ranging from 10% – 30% of incentive profits earned on sales.
Commercial Real Estate Finance
On March 15, 2013, we disposed of our Gramercy Finance segment, and exited the commercial real estate finance business. Our commercial real estate finance business invested in and managed a diversified portfolio of real estate loans, including whole loans, bridge loans, subordinate interests in whole loans, mezzanine loans, CMBS and preferred equity involving commercial properties throughout the United States, and which held interests in real estate properties acquired through foreclosures. The disposal was completed pursuant to a sale and purchase agreement to transfer the collateral management and sub-special servicing agreements for our three Collateralized Debt Obligations, or CDOs, to CWCapital Investments LLC, or CWCapital, for proceeds of $6.3 million in cash, after expenses. We retained our subordinate debt and equity ownership, or Retained CDO Bonds, in the CDOs, which may allow us to recoup additional proceeds over the remaining life of the CDOs based upon resolution of underlying assets within the CDOs. However, there is no guarantee that we will realize any proceeds from the Retained CDO Bonds or what the timing of these proceeds might be. On March 15, 2013, we deconsolidated the assets and liabilities of Gramercy Finance from our Consolidated Financial Statements and recognized a gain on the disposal of $389.1 million within discontinued operations. The carrying value of the retained CDO bonds was $6.8 million as of December 31, 2013.
In addition to our Retained CDO Bonds, we expect to receive additional cash proceeds for past CDO servicing advances when specific assets within the CDOs are liquidated. We received reimbursements of $6.1 million during the year ended December 31, 2013, and the carrying value of the receivable for servicing advance reimbursements as of December 31, 2013 is $8.8 million. We do not anticipate receiving a substantial portion of the remaining CDO servicing advance reimbursements until the second half of 2014.
Critical Accounting Policies
The following discussion related to our Consolidated Financial Statements should be read in conjunction with the financial statements appearing in Item 8 of this Annual Report on Form 10-K.
Our discussion and analysis of financial condition and results of operations is based on our financial statements, which have been prepared in accordance with accounting principles generally accepted in the United States, known as GAAP. These accounting principles require us to make some complex and subjective decisions and assessments. Our most critical accounting policies involve decisions and assessments, which
48
TABLE OF CONTENTS
could significantly affect our reported assets, liabilities and contingencies, as well as our reported revenues and expenses. We believe that all of the decisions and assessments upon which our financial statements are based were reasonable at the time and made based upon information available to us at that time. We evaluate these decisions and assessments on an ongoing basis. Actual results may differ from these estimates under different assumptions or conditions. We have identified our most critical accounting policies to be the following:
Variable Interest Entities
Consolidated VIEs
As of December 31, 2013, we had no consolidated VIEs.
Collateralized Debt Obligations
On March 15, 2013, as a result of the disposal of the Gramercy Finance segment, we deconsolidated three VIEs, the CDOs. We were the collateral manager of the three CDOs and in our capacity as collateral manager, we made decisions related to the collateral that most significantly impacted the economic outcome of the CDOs, which was the basis upon which we concluded that we were the primary beneficiary of the CDOs as of December 31, 2012. In connection with the disposal of Gramercy Finance, we transferred the collateral management and sub-special servicing agreements for our three CDOs to CWCapital, thereby removing ourselves as the collateral manager and our ability to make any and all decisions related to the collateral, including those that would most significantly impact the economic outcome of the CDOs. As of March 15, 2013, we had no continuing involvement with the collateral to the CDOs, and as a result, we determined that we were no longer the primary beneficiary of the CDOs, and therefore deconsolidated the CDOs.
We have retained our subordinate debt and equity ownership, or the Retained CDO Bonds, in the CDOs, which were previously eliminated in consolidation and were not sold as part of the disposal of Gramercy Finance. The Retained CDO Bonds may provide us with the potential to receive continuing cash flows in the future, however, there is no guarantee that we will realize any proceeds from the Retained CDO Bonds, or what the timing of these proceeds might be. These interests have been recognized at fair value as the Retained CDO Bonds on the Consolidated Balance Sheets.
Unconsolidated VIEs
Investment in Retained CDO Bonds
As further discussed above, on March 15, 2013, we recognized an asset in Retained CDO Bonds in connection with the disposal of the Gramercy Finance segment. We are not obligated to provide any financial support to these CDOs. Our maximum exposure to loss is limited to our interest in the Retained CDO Bonds and we do not control the activities that most significantly impact the VIEs’ economic performance.
Real Estate Investments
We record acquired real estate investments as business combinations when the real estate is occupied, at least in part, at acquisition. Costs directly related to the acquisition of such investments are expensed as incurred. We allocate the purchase price of real estate to land, building and intangibles, such as the value of above-, below- and at-market leases and origination costs associated with the in-place leases at the acquisition date. The values of the above- and below-market leases are amortized and recorded as either an increase in the case of below-market leases or a decrease in the case of above-market leases to rental revenue over the remaining term of the associated lease. The values associated with in-place leases are amortized over the expected term of the associated lease. We assess the fair value of the leases at acquisition based upon estimated cash flow projections that utilize appropriate discount and capitalization rates and available market information. Estimates of future cash flows are based on a number of factors including the historical operating results, known trends, and market/economic conditions that may affect the property. To the extent acquired leases contain fixed rate renewal options that are below-market and determined to be material, we amortize such below-market lease value into rental revenue over the renewal period.
Acquired real estate definitions that do not meet the definition of a business combination are recorded at cost. Acquired real estate investments which are under construction are considered build-to-suit transactions
49
TABLE OF CONTENTS
and are also recorded at cost. In build-to-suit transactions, we engage a developer to construct a property or provide funds to a tenant to develop a property. We capitalize the funds provided to the developer/tenant and the internal costs of interest and real estate taxes, if applicable, during the construction period.
Certain improvements are capitalized when they are determined to increase the useful life of the building. Depreciation is computed using the straight-line method over the shorter of the estimated useful life at acquisition of the capitalized item or 40 years for buildings, five to ten years for building equipment and fixtures, and the lesser of the useful life or the remaining lease term for tenant improvements and leasehold interests. Maintenance and repair expenditures are charged to expense as incurred.
In leasing office space, we may provide funding to the lessee through a tenant allowance. In accounting for tenant allowances, we determine whether the allowance represents funding for the construction of leasehold improvements and evaluate the ownership of such improvements. If we are considered the owner of the leasehold improvements, we capitalize the amount of the tenant allowance and depreciate it over the shorter of the useful life of the leasehold improvements or the lease term. If the tenant allowance represents a payment for a purpose other than funding leasehold improvements, or in the event we are not considered the owner of the improvements for accounting purposes, the allowance is considered to be a lease incentive and is recognized over the lease term as a reduction of rental revenue. Factors considered during this evaluation usually include (i) who holds legal title to the improvements, (ii) evidentiary requirements concerning the spending of the tenant allowance, and (iii) other controlling rights provided by the lease agreement (e.g. unilateral control of the tenant space during the build-out process). Determination of the accounting for a tenant allowance is made on a case-by-case basis, considering the facts and circumstances of the individual tenant lease.
We also review the recoverability of the property’s carrying value when circumstances indicate a possible impairment of the value of a property. The review of recoverability is based on an estimate of the future undiscounted cash flows, excluding interest charges, expected to result from the property’s use and eventual disposition. These estimates consider factors such as changes in strategy resulting in an increased or decreased holding period, expected future operating income, market and other applicable trends and residual value, as well as the effects of leasing demand, competition and other factors. If management determines impairment exists due to the inability to recover the carrying value of a property, an impairment loss is recorded to the extent that the carrying value exceeds the estimated fair value of the property for properties to be held and used and for assets held for sale, an impairment loss is recorded to the extent that the carrying value exceeds the fair value less estimated cost to dispose for assets held for sale. These assessments are recorded as an impairment loss in our Consolidated Statements of Comprehensive Income (loss) in the period the determination is made. The estimated fair value of the asset becomes its new cost basis. For a depreciable long-lived asset, the new cost basis will be depreciated or amortized over the remaining useful life of that asset.
During 2013, we recorded no impairment charges related to our investments in real estate. During 2012, we recorded impairment charges of $35,043 related to our investments in real estate, which were classified as discontinued operations related to the disposal of Gramercy Finance. During 2011, we recorded impairment charges of $1,237 related to our investments in real estate, which were re-classified as discontinued operations as part of the Settlement Agreement with KBS.
Investments in Joint Ventures
We account for our investments in joint ventures under the equity method of accounting since we exercise significant influence, but do not unilaterally control the entities, and we are not considered to be the primary beneficiary. In the joint ventures, the rights of the other investors are protective and participating. Unless we are determined to be the primary beneficiary, these rights preclude us from consolidating the investments. The investments are recorded initially at cost as an investment in joint ventures, and subsequently are adjusted for equity in net income (loss) and cash contributions and distributions. Any difference between the carrying amount of the investments on our balance sheet and the underlying equity in net assets is evaluated for impairment at each reporting period. None of the joint venture debt is recourse to us. As of December 31, 2013 and 2012, we had investments of $39,385 and $72,742 in joint ventures, respectively.
50
TABLE OF CONTENTS
Assets Held-for-Sale
As of December 31, 2013, we had no assets classified as held for sale.
In connection with our efforts to exit Gramercy Finance and the commercial real estate finance business, we classified the assets and liabilities of Gramercy Finance as held-for-sale. As of December 31, 2012, we had assets classified as held-for-sale of $1,952,264 related to the disposal of Gramercy Finance. We recorded impairment charges of $27,180 within discontinued operations on loans and real estate investments to adjust the carrying value to the lower of cost or fair value and other-than-temporary impairments of $128,087 within discontinued operations as we no longer could express the intent to hold CMBS investments until the recovery of amortized cost for all CMBS in an unrealized loss position. On March 15, 2013, we completed the disposal of Gramercy Finance. For a further discussion regarding the measurement of financial instruments and real estate assets of the Gramercy Finance segment see Note 11 and Note 3 in the accompanying notes to our Consolidated Financial Statements.
Real estate investments to be disposed of are reported at the lower of carrying amount or estimated fair value, less costs to sell. Once an asset is classified as held-for-sale, depreciation expense is no longer recorded on real estate assets and current and prior periods are reclassified as “discontinued operations.” As of December 31, 2013 and 2012, we had real estate investments held-for-sale of $0 and $88,806, respectively. We recorded impairment charges of $0, $35,043 and $1,237 during the years ended December 31, 2013, 2012 and 2011, respectively, related to real estate investments within discontinued operations.
Settlement of Debt
A gain on settlement of debt is recorded when the carrying amount of the liability settled exceeds the fair value of the assets transferred to the lender or special servicer. In 2013 and 2012, we did not recognize any gain on settlement of debt.
Pursuant to the execution of the Settlement Agreement, the transfer of 867 Gramercy Asset Management properties, with an aggregate carrying value of $2,631,902 and associated mortgage, mezzanine and other liabilities of $2,843,345, occurred in September and December 2011 and we recognized a gain on settlement of debt of $285,634 in connection with such transfer as part of discontinued operations. The gain on settlement of debt includes $54,083 of gain on disposal of assets. During the year ended December 31, 2011, we recorded $2,489 of legal and professional fees related to the restructuring of the Goldman Mortgage Loan and the Goldman Mezzanine Loans.
In July 2011, the Dana portfolio, which consisted of 15 properties totaling approximately 3.8 million rentable square feet, was transferred to its mortgage lender through a deed in lieu of foreclosure. We recognized gain on settlement of debt of $74,191 year ended December 31, 2011 as part of discontinued operations. We realized a $15,892 gain on the disposal the assets, which is included in the gain on settlement of debt.
Tenant and Other Receivables
Tenant and other receivables are derived from management fees, rental revenue and tenant reimbursements.
Management fees, including incentive management fees, are recognized as earned in accordance with the terms of the management agreements. The management agreements may contain provisions for fees related to dispositions, administration of the assets including fees related to accounting, valuation and legal services, and management of capital improvements or projects on the underlying assets.
Rental revenue is recorded on a straight-line basis over the initial term of the lease. Since many leases provide for rental increases at specified intervals, straight-line basis accounting requires us to record a receivable, and include in revenues, unbilled rent receivables that will only be received if the tenant makes all rent payments required through the expiration of the initial term of the lease. Tenant and other receivables also include receivables related to tenant reimbursements for common area maintenance expenses and certain other recoverable expenses that are recognized as revenue in the period in which the related expenses are incurred.
We continually review receivables related to rent, tenant reimbursements, management fees, including incentive fees, and unbilled rent receivables and determines collectability by taking into consideration the
51
TABLE OF CONTENTS
tenant or asset management clients’ payment history, the financial condition of the tenant or asset management client, business conditions in the industry in which the tenant or asset management client operates and economic conditions in the area in which the property or asset management client is located. In the event that the collectability of a receivable is in doubt, we increase the allowance for doubtful accounts or record a direct write-off of the receivable.
Intangible Assets and Liabilities
We follow the acquisition method of accounting for business combinations. We allocate the purchase price of acquired properties to tangible and identifiable intangible assets and liabilities acquired based on their respective fair values. Tangible assets include land, buildings and improvements on an as-if vacant basis. We utilize various estimates, processes and information to determine the as-if vacant property value. Estimates of value are made using customary methods, including data from appraisals, comparable sales, discounted cash flow analyses and other methods. Identifiable intangible assets include amounts allocated to acquired leases for above- and below-market lease rates and the value of in-place leases. Management also considers information obtained about each property as a result of its pre-acquisition due diligence in estimating the fair value of the tangible and intangible assets and liabilities acquired.
Above-market and below-market lease values for properties acquired are recorded based on the present value (using an interest rate which reflects the risks associated with the leases acquired) of the difference between the contractual amount to be paid pursuant to each in-place lease and management’s estimate of the fair market lease rate for each such in-place lease, measured over a period equal to the remaining non-cancelable term of the lease. The above-market lease values are amortized as a reduction of rental revenue over the remaining non-cancelable terms of the respective leases. The below-market lease values are amortized as an increase to rental revenue over the initial term of the respective leases. If a tenant terminates its lease prior to its contractual expiration and no future rental payments will be received, any unamortized balance of the market lease intangibles will be written off to rental revenue.
The aggregate value of intangible assets related to in-place leases is primarily the difference between the property valued with existing in-place leases adjusted to market rental rates and the property valued as-if vacant. Factors considered by management in its analysis of the in-place lease intangibles include an estimate of carrying costs during the expected lease-up period for each property taking into account current market conditions and costs to execute similar leases. In estimating carrying costs, management includes real estate taxes, insurance and other operating expenses and estimates of lost rentals at market rates during the anticipated lease-up period, which is expected to average six months. Management also estimates costs to execute similar leases including leasing commissions and other related expenses. The value of in-place leases is amortized to depreciation and amortization expense over the remaining non-cancelable term of the respective leases. In no event does the amortization period for intangible assets exceed the remaining depreciable life of the building. If a tenant terminates its lease prior to its contractual expiration and no future rental payments will be received, any unamortized balance of the in-place lease intangible would be written off to depreciation and amortization expense.
Servicing Advances Receivable
Servicing advances receivable is comprised of the accrual for the reimbursement of servicing advances recognized as part of the disposal of Gramercy Finance. The accrual for reimbursement of servicing advances incurred while we were the collateral manager of the CDOs includes expenses such as legal fees incurred to negotiate modifications and foreclosures on loan investments, professional fees incurred on certain loans, or fees for services such as appraisals obtained on real estate properties that served as collateral for loan investments. These reimbursement proceeds will be realized when the related assets within the CDOs are liquidated in accordance with the terms of the collateral management and sub-special servicing agreements, which were sold in connection with the disposal of Gramercy Finance. We have no control over the timing of the resolution of the related assets, however, we earn accrued interest at the prime rate for the time that these reimbursements are outstanding. For the year ended December 31, 2013 we received reimbursements of $6,055. As of December 31, 2013, the servicing advances receivable is $8,758.
52
TABLE OF CONTENTS
We review the servicing advances receivable on a quarterly basis and determine collectability by reviewing the expected resolution and timing of the underlying assets of the CDOs. As of December 31, 2013, we have reviewed the outstanding servicing advances and have determined that all amounts are collectible.
Retained CDO Bonds
The Retained CDO Bonds are non-investment grade subordinate bonds, preferred shares and ordinary shares of three CDO’s, which we recognized at fair value in March 2013 in conjunction with the disposal of Gramercy Finance. Our management estimated the timing and amount of cash flows expected to be collected and recognized an investment in the Retained CDO Bonds equal to the net present value of these discounted cash flows. There is no guarantee that we will realize any proceeds from this investment, or what the timing of investment income for the expected remaining life of the Retained CDO Bonds. We consider these investments to be not of high credit quality and do not expect a full recovery of interest and principal. Therefore, we have suspended interest income accruals on these investments. On a quarterly basis, we evaluate the Retained CDO Bonds to determine whether significant changes in estimated cash flows or unrealized losses on these investments, if any, reflect a decline in value which is other-than-temporary. If there is a decrease in estimated cash flows and the investment is in an unrealized loss position, we will record an other-than-temporary impairment in the Consolidated Statements of Operations and Comprehensive Income (Loss). To determine the component of the other-than-temporary impairment related to expected credit losses, we compare the amortized cost basis of the Retained CDO Bonds to the present value of our revised expected cash flows, discounted using our pre-impairment yield. Conversely, if the security is in an unrealized gain position and there is a decrease or significant increase in expected cash flows, we will prospectively adjust the yield using the effective yield method.
As of December 31, 2013, the Retained CDO Bonds had an amortized cost of $7,981 and a fair value of $6,762. For the year ended December 31, 2013, we recognized an other-than-temporary impairment, or OTTI, of $2,002 on the Retained CDO Bonds.
Valuation of Financial Instruments
At December 31, 2013, we measured financial instruments, including Retained CDO Bonds and derivative instruments on a recurring and non-recurring basis. At December 31, 2012, we measured financial instruments that were disposed of in the first quarter of 2013 in connection with the disposal of Gramercy Finance at fair value on a recurring basis and non-recurring basis. These financial instruments were deconsolidated at fair value in connection with the disposal of Gramercy Finance on March 15, 2013.
ASC 820-10, “Fair Value Measurements and Disclosures,” among other things, establishes a hierarchical disclosure framework associated with the level of pricing observability utilized in measuring financial instruments at fair value. Considerable judgment is necessary to interpret market data and develop estimated fair values. Accordingly, fair values are not necessarily indicative of the amounts that we could realize on disposition of the financial instruments. Financial instruments with readily available actively quoted prices or for which fair value can be measured from actively quoted prices generally will have a higher degree of pricing observability and will require a lesser degree of judgment to be utilized in measuring fair value. Conversely, financial instruments rarely traded or not quoted will generally have less, or no, pricing observability and will require a higher degree of judgment to be utilized in measuring fair value. Pricing observability is generally affected by such items as the type of financial instrument, whether the financial instrument is new to the market and not yet established, the characteristics specific to the transaction and overall market conditions. The use of different market assumptions and/or estimation methodologies may have a material effect on estimated fair value amounts.
Fair value is defined as the price that would be received to sell an asset or paid to transfer a liability in an orderly transaction between market participants at the measurement date, or an exit price. The level of pricing observability generally correlates to the degree of judgment utilized in measuring the fair value of financial instruments. The less judgment utilized in measuring fair value financial instruments such as with readily available actively quoted prices or for which fair value can be measured from actively quoted prices in active markets generally have more pricing observability. Conversely, financial instruments rarely traded or not quoted have less observability and are measured at fair value using valuation models that require more judgment. Impacted by a number of factors, pricing observability is generally affected by such items as the
53
TABLE OF CONTENTS
type of financial instrument, whether the financial instrument is new to the market and not yet established, the characteristics specific to the transaction and overall market conditions.
The three broad levels defined are as follows:
Level I — This level is comprised of financial instruments that have quoted prices that are available in active markets for identical assets or liabilities. The types of financial instruments included in this category are highly liquid instruments with actively quoted prices.
Level II — This level is comprised of financial instruments that have pricing inputs other than quoted prices in active markets that are either directly or indirectly observable. The nature of these financial instruments includes instruments for which quoted prices are available but traded less frequently and instruments that are fair valued using other financial instruments, the parameters of which can be directly observed.
Level III — This level is comprised of financial instruments that have little to no pricing observability as of the reported date. These financial instruments do not have active markets and are measured using management’s best estimate of fair value, where the inputs into the determination of fair value require significant management judgment and assumptions. Instruments that are generally included in this category are derivatives, whole loans, subordinate interests in whole loans and mezzanine loans.
At December 31, 2013, we measured financial instruments, including Retained CDO bonds and derivative instruments on a recurring basis. At December 31, 2012, we measured financial instruments, including CMBS available for sale and derivative instruments on a recurring basis.
Retained CDO Bonds: Retained CDO Bonds are valued on a recurring basis using an internally developed discounted cash flow model. Management estimates the timing and amount of cash flows expected to be collected and applies a discount rate equal to the yield that we would expect to pay for similar securities with similar risks at the valuation date. Future expected cash flows generated by management require significant assumptions and judgment regarding the expected resolution of the underlying collateral, which includes loans and other lending investments, real estate investments, and CMBS. The resolution of the underlying collateral requires further management assumptions regarding capitalization rates, lease-up periods, future occupancy rates, market rental rates, holding periods, capital improvements, net property operating income, timing of workouts and recoveries, loan loss severities and other factors. The models are most sensitive to the unobservable inputs such as the timing of a loan default or property sale and the severity of loan losses. Significant increases (decreases) in any of those inputs in isolation as well as any change in the expected timing of those inputs would result in a significantly lower (higher) fair value measurement.
Derivative instruments: Fair values of our derivative instruments, such as interest rate swaps, are valued using advice from a third-party derivative specialist, based on a combination of observable market-based inputs, such as interest rate curves, and unobservable inputs such as credit valuation adjustments due to the risk of non-performance. Fair value of our derivative instruments, such our CVR investments are valued using a Black-Scholes model. This model requires inputs such as expected term, expected volatility, and risk-free interest rate.
At December 31, 2013, we did not measure any financial instruments on a non-recurring basis. At December 31, 2012, we measured real estate investments and loans subject to impairment or reserves for loan loss at fair value on a nonrecurring basis.
Real Estate investments: The real estate investments identified for impairment have been classified as assets held-for-sale. The impairment on properties classified as held-for-sale is calculated by comparing unsolicited purchase offers to the carrying value of the respective property. The marketing valuations are based on internally developed discounted cash flow models which include assumptions that require significant management judgment regarding capitalization rates, lease-up periods, future occupancy rates, market rental rates, holding periods, capital improvements and other factors deemed necessary by management. The impairment is calculated by comparing our internally developed discounted cash flow methodology to the carrying value of the respective property.
54
TABLE OF CONTENTS
The valuations of financial instruments derived from pricing models may include adjustments to the financial instruments. These adjustments may be made when, in management’s judgment, either the size of the position in the financial instrument or other features of the financial instrument such as its complexity, or the market in which the financial instrument is traded (such as counterparty, credit, concentration or liquidity) require that an adjustment be made to the value derived from the pricing models. Additionally, an adjustment from the price derived from a model typically reflects management’s judgment that other participants in the market for the financial instrument being measured at fair value would also consider such an adjustment in pricing that same financial instrument.
Assets and liabilities presented at fair value and categorized as Level III are generally those that are marked to model using relevant empirical data to extrapolate an estimated fair value. The models’ inputs reflect assumptions that market participants would use in pricing the instrument in a current period transaction and outcomes from the models represent an exit price and expected future cash flows. The parameters and inputs are adjusted for assumptions about risk and current market conditions. Changes to inputs in valuation models are not changes to valuation methodologies; rather, the inputs are modified to reflect direct or indirect impacts on asset classes from changes in market conditions. Accordingly, results from valuation models in one period may not be indicative of future period measurements.
Revenue Recognition
Real Estate Investments
Rental revenue from leases is recognized on a straight-line basis regardless of when payments are contractually due. Certain lease agreements also contain provisions that require tenants to reimburse us for real estate taxes, common area maintenance costs and the amortized cost of capital expenditures with interest. Such amounts are included in both revenues and operating expenses when we are the primary obligor for these expenses and assume the risks and rewards of a principal under these arrangements. Under leases where the tenant pays these expenses directly, such amounts are not included in revenues or expenses.
Deferred revenue represents rental revenue and management fees received prior to the date earned. Deferred revenue also includes rental payments received in excess of rental revenues recognized as a result of straight-line basis accounting.
Other income includes fees paid by tenants to terminate their leases, which are recognized when fees due are determinable, no further actions or services are required to be performed by us, and collectability is reasonably assured. In the event of early termination, the unrecoverable net book values of the assets or liabilities related to the terminated lease are recognized as depreciation and amortization expense in the period of termination.
We recognize sales of real estate properties only upon closing. Payments received from purchasers prior to closing are recorded as deposits. Profit on real estate sold is recognized using the full accrual method upon closing when the collectability of the sale price is reasonably assured and we are not obligated to perform significant activities after the sale. Profit may be deferred in whole or part until the sale meets the requirements of profit recognition on sale of real estate.
Asset Management Business
The management agreements may contain provisions for fees related to dispositions, administration of the assets including fees related to accounting, valuation and legal services, and management of capital improvements or projects on the underlying assets.
Certain of our asset management contracts include provisions that may allow us to earn additional fees, generally described as incentive fees or profit participation interests, based on the achievement of a targeted valuation of the managed assets or the achievement of a certain internal rate of return on the managed assets. We recognize incentive fees on our asset management contracts based upon the amount that would be due pursuant to the contract, if the contract were terminated at the reporting date, through the measurement date. If the contact may be terminated at will, revenue will only be recognized to the amount that would be due pursuant to that termination. If the incentive fee is a fixed amount, only a proportionate share of revenue is recognized at the reporting date, with the remaining fees recognized on a straight-line basis over the measurement period. The values of incentive management fees are periodically evaluated by management.
55
TABLE OF CONTENTS
The Original Management Agreement, originally entered into March 30, 2012, was extended in 2013 through execution of an Amended and Restated Asset Management Services Agreement, or the Management Agreement, effective as of December 1, 2013 and provides for a base management fee of $7,500 per year, payable monthly, plus the reimbursement of certain administrative and property related expenses. The Management Agreement is effective through December 31, 2016 with a one-year extension option through December 31, 2017, exercisable by KBS, and also provides incentive fees in the form of profit participation ranging from 10% – 30% of incentive profits earned on sales.
Our Original Management Agreement with KBS, which was in effect through December 1, 2013, provided a base management fee of $9,000 per year, payable monthly, plus the reimbursement of all property related expenses paid, and an incentive fee, or the Threshold Value Profits Participation, in an amount equal to the greater of: (a) $3,500 or (b) 10% of the amount, if any, by which the portfolio equity value exceeds $375,000 (as adjusted for future cash contributions into, and distributions out of, KBS). The Threshold Value Profits Participation was capped at a maximum of $12,000 and was payable 60 days after the earlier to occur of June 30, 2014 (or March 31, 2015 upon satisfaction of certain extension conditions including the payment by KBS of a $750 extension fee) and the date on which KBS, directly or indirectly sells, conveys or otherwise transfers at least 90% of the KBS portfolio.
In the second quarter of 2013, after consideration of the termination provisions of the agreement and the sales of real estate assets made to date, we recognized incentive fees of $5,700 related to our Original Management Agreement with KBS, pursuant to which we provide asset management services to KBS with respect to a portfolio of office and banks branches, or the KBS Portfolio. Subsequently, following the signing of the Management Agreement, KBS paid $12,000 to us in satisfaction of our profit participation interest under the Original Management Agreement. For the year ended December 31, 2013, 2012 and 2011 we recognized incentive fees of $10,223, $1,277 and $500, respectively.
Rent Expense
Rent expense is recognized on a straight-line basis regardless of when payments are due. Accounts payable and accrued expenses in the accompanying Consolidated Balance Sheets as of December 31, 2013 and 2012 includes an accrual for rental expense recognized in excess of amounts due at that time. Rent expense related to leasehold interests is included in property operating expenses, and rent expense related to office rentals is included in management, general and administrative expense.
Stock-Based Compensation Plans
We have a stock-based compensation plan, described more fully in Note 13 in the accompanying financial statements. We account for this plan using the fair value recognition provisions. We use the Black-Scholes option-pricing model to estimate the fair value of a stock option award. This model requires inputs such as expected term, expected volatility, and risk-free interest rate. Further, the forfeiture rate also impacts the amount of aggregate compensation cost. These inputs are highly subjective and generally require significant analysis and judgment to develop.
Compensation cost for stock options, if any, is recognized ratably over the vesting period of the award. Our policy is to grant options with an exercise price equal to the quoted closing market price of our stock on the business day preceding the grant date. Awards of stock or restricted stock are expensed as compensation on a current basis over the benefit period.
The fair value of each stock option granted is estimated on the date of grant for options issued to employees, and quarterly for options issued to non-employees, using the Black-Scholes option pricing model with the following weighted average assumptions for grants in 2013 and 2012.
| | | | |
| | 2013 | | 2012 |
| Dividend yield | | | 5.50 | % | | | 5.00 | % |
| Expected life of option | | | 5.0 years | | | | 5.0 years | |
| Risk-free interest rate | | | 0.72 | % | | | 0.89 | % |
| Expected stock price volatility | | | 53.00 | % | | | 80.00 | % |
56
TABLE OF CONTENTS
Derivative Instruments
In the normal course of business, we are exposed to the effect of interest rate changes and limit these risks by following established risk management policies and procedures including the use of derivatives. We use a variety of derivative instruments to manage, or hedge, interest rate risk. We require that hedging derivative instruments be effective in reducing the interest rate risk exposure that they are designated to hedge. This effectiveness is essential for qualifying for hedge accounting. Instruments that meet these hedging criteria are formally designated as hedges at the inception of the derivative contract. We use a variety of commonly used derivative products that are considered “plain vanilla” derivatives. These derivatives typically include interest rate swaps, caps, collars and floors. We expressly prohibit the use of unconventional derivative instruments and using derivative instruments for trading or speculative purposes. Further, we have a policy of only entering into contracts with major financial institutions based upon their credit ratings and other factors.
We may from time to time use derivative instruments in connection with the private placement of equity. In October 2013, we entered into contingent value rights agreements, or CVR agreements, with the share purchasers. Pursuant to each CVR Agreement, we issued to each purchaser the number of contingent value rights, or CVRs, equal to the number of common stock purchased. On March 25, 2014, or the CVR Test Date, we will calculate the volume-weighted average price, or the VWAP, for the common stock for the 10 trading days period ending on, and including, March 25, 2014, or the CVR Period VWAP. On April 1, 2014, we will pay to the holder of the contingent value rights, in immediately available funds, an amount in cash, equal to (a) the number of contingent value rights held by the holder on the CVR Test Date multiplied by (b) the amount, not to exceed $0.46 equal to the difference between the per share purchase price of $4.11 and the CVR Period VWAP. These CVRs are not designated as hedge instruments. The CVRs do not qualify, nor did we intend for these instruments to qualify, as hedging instruments.
To determine the fair value of derivative instruments, we use a variety of methods and assumptions that are based on market conditions and risks existing at each balance sheet date. For the majority of financial instruments including most derivatives, long-term investments and long-term debt, standard market conventions and techniques such as discounted cash flow analysis, option-pricing models, replacement cost and termination cost are used to determine fair value. All methods of assessing fair value result in a general approximation of value, and such value may never actually be realized.
We recognize all derivatives on the balance sheet at fair value. Derivative instruments that were assets and liabilities of the CDOs were classified as held-for-sale as of December 31, 2012 and then disposed of in the first quarter of 2013 in connection with the disposal of Gramercy Finance. Derivatives that are not hedges must be adjusted to fair value through income. If a derivative is a hedge, depending on the nature of the hedge, changes in the fair value of the derivative will either be offset against the change in fair value of the hedged asset, liability or firm commitment through earnings, or recognized in other comprehensive income until the hedged item is recognized in earnings. The ineffective portion of a derivative’s change in fair value will be immediately recognized in earnings. Derivative accounting may increase or decrease reported net income and stockholders’ equity prospectively, depending on future levels of LIBOR, swap spreads and other variables affecting the fair values of derivative instruments and hedged items, but will have no effect on cash flows, provided the contract is carried through to full term.
All hedges held by us are deemed effective based upon the hedging objectives established by our corporate policy governing interest rate risk management. The effect of our derivative instruments on our financial statements is discussed more fully in Note 12.
Income Taxes
We elected to be taxed as a REIT, under Sections 856 through 860 of the Internal Revenue Code, beginning with our taxable year ended December 31, 2004. To qualify as a REIT, we must meet certain organizational and operational requirements, including a requirement to distribute at least 90% of our ordinary taxable income, if any, to stockholders. As a REIT, we generally will not be subject to U.S. federal income tax on taxable income that we distribute to our stockholders. If we fail to qualify as a REIT in any taxable year, we will then be subject to U.S. federal income taxes on our taxable income at regular corporate rates and we will not be permitted to qualify for treatment as a REIT for U.S. federal income tax purposes for four years following the year during which qualification is lost unless the Internal Revenue Service grants us relief
57
TABLE OF CONTENTS
under certain statutory provisions. Such an event could materially adversely affect our net income and net cash available for distributions to stockholders. However, we believe that we will be organized and operate in such a manner as to qualify for treatment as a REIT and we intend to operate in the foreseeable future in such a manner so that we will qualify as a REIT for U.S. federal income tax purposes. We may, however, be subject to certain state and local taxes. Our TRSs are subject to federal, state and local taxes.
For the years ended December 31, 2013, 2012 and 2011, we recorded $8,908, $3,330, and $563 of income tax expense, including $2,515, $0, and $0 within discontinued operations, respectively. Tax expense for each year is comprised of federal, state and local taxes. Income taxes, primarily related to our TRSs, are accounted for under the asset and liability method. Deferred tax assets and liabilities are recognized for the estimated future tax consequences attributable to differences between the financial statement carrying amounts of existing assets and liabilities and their respective tax basis and operating loss carryforwards. Deferred tax assets and liabilities are measured using enacted tax rates in effect for the year in which those temporary differences are expected to be recovered or settled. A valuation allowance is provided if we believe it is more likely than not that all or a portion of a deferred tax asset will not be realized. Any increase or decrease in a valuation allowance is included in the tax provision when such a change occurs.
Our policy for interest and penalties, if any, on material uncertain tax positions recognized in the financial statements is to classify these as interest expense and operating expense, respectively. As of December 31, 2013, 2012 and 2011, we did not incur any material interest or penalties.
Results of Operations
Comparison of the year ended December 31, 2013 to the year ended December 31, 2012
Revenues
| | | | | | |
| | 2013 | | 2012 | | Change |
| Management fees | | $ | 40,896 | | | $ | 34,667 | | | $ | 6,229 | |
| Rental revenue | | | 12,181 | | | | 267 | | | | 11,914 | |
| Investment income | | | 1,717 | | | | 600 | | | | 1,117 | |
| Operating expense reimbursements | | | 1,203 | | | | 174 | | | | 1,029 | |
| Other income | | | 707 | | | | 1,113 | | | | (406 | ) |
| Total Revenue | | $ | 56,704 | | | $ | 36,821 | | | $ | 19,883 | |
| Equity in net loss of joint ventures | | $ | (5,662 | ) | | $ | (2,904 | ) | | $ | (2,758 | ) |
Management fees for the year ended December 31, 2013 are $40,896 as compared to $34,667 for the year ended December 31, 2012. Management fees are comprised of asset management, property management, incentive and administration fees earned pursuant to the Management Agreement with KBS and the Bank of America Portfolio Joint Venture which commenced in December 2012. For the year ended December 31, 2013, we earned $29,794 from our contract with KBS, $8,330 from our contract with the Bank of America Portfolio Joint Venture, and $2,772 from other management contracts. For the year ended December 31, 2012, we earned $34,667 from our contract with KBS. The increase in management fees is primarily attributable to $10,223 of incentive fees recognized for the year ended December 31, 2013 as compared to $1,277 recognized for the year ended December 31, 2012.
Rental revenue was $12,181 and $267 for the years ended December 31, 2013 and 2012, respectively. The increase of $11,914 is due to the acquisition of 29 properties in the year ended December 31, 2013 compared to the acquisition of 2 properties in the year ended December 31, 2012.
Investment income for the years ended December 31, 2013 and 2012 was $1,717 and $600, respectively. Investment income for the year ended December 31, 2013 was primarily attributable to income accretion on the Retained CDO Bonds subsequent to our disposal of our Gramercy Finance segment and exit from the commercial real estate finance business in March 2013. For the year ended December 31, 2012, investment income was primarily generated from a mezzanine loan investment made in connection with the acquisition of our Bank of America Portfolio Joint Venture.
Operating expense reimbursements are comprised of amounts reimbursed by tenants for property operating expenses we are responsible for paying, and the costs are passed through to the tenants. Operating
58
TABLE OF CONTENTS
expense reimbursements were $1,203 and $174 for the year ended December 31, 2013 and 2012, respectively. The increase in operating expense reimbursements is attributable to acquisitions made during the year ended December 31, 2013. For the year ended December 31, 2012, operating expense reimbursements were only attributable to the Indianapolis Industrial Portfolio, which was acquired in November 2012.
For the year ended December 31, 2013, other income is primarily comprised of $611 gain on the liquidation of a joint venture and interest earned on cash balances held by us. For the year ended December 31, 2012, other income is primarily comprised of $1,000 payment received related to settlement of a previously defaulted loan investment held outside of our commercial real estate finance segment and interest earned on cash balances held by us.
The equity in net loss of joint ventures of $5,662 and $2,904 for the year ended December 31, 2013 and 2012, respectively, represents our proportionate share of the loss generated by our joint venture interests, including our Bank of America Portfolio Joint Venture acquired in December 2012. The Bank of America Portfolio Joint Venture net loss for the year ended December 31, 2013 includes our pro-rata share of impairments of $4,866 and gains on sales of $399 related to held-for-sale and sold properties and $4,534 loss from the sale of successor borrower of a defeased mortgage acquired as part of the joint venture’s acquisition. The pool of government securities which served as collateral for the mortgage, generated sufficient cash flows to cover the debt service requirements, but did not generate income to offset the corresponding interest expense. Our proportionate share of the income (loss) generated by our joint venture interests includes $8,878 and $669 of real estate-related depreciation and amortization, which when added back with the impairments and gains, results in a contribution to Funds from Operations, or FFO, of $5,449 and $7,846 for the years ended December 31, 2013 and 2012, respectively. For the year ended December 31, 2012, there was $5,611 of equity in net income of joint ventures classified as discontinued operations.
Expenses
| | | | | | |
| | 2013 | | 2012 | | Change |
| Property operating expenses | | $ | 22,279 | | | $ | 23,226 | | | $ | (947 | ) |
| Other-than-temporary impairment | | | 2,002 | | | | — | | | | 2,002 | |
| Depreciation and amortization | | | 5,675 | | | | 256 | | | | 5,419 | |
| Interest expense | | | 1,732 | | | | — | | | | 1,732 | |
| Management, general and administrative | | | 18,210 | | | | 25,335 | | | | (7,125 | ) |
| Unrealized loss on derivatives | | | 115 | | | | — | | | | 115 | |
| Acquisition expenses | | | 2,808 | | | | 111 | | | | 2,697 | |
| Provision for taxes | | | 6,393 | | | | 3,330 | | | | 3,063 | |
| Total Expenses | | $ | 59,214 | | | $ | 52,258 | | | $ | 6,956 | |
Property operating expenses are comprised of costs related to our asset and property management business as well as expenses directly attributable to our owned portfolio of income producing industrial and office properties. Property operating expenses include those costs in our owned portfolio which we are responsible for during the lease term but the cost is passed through to the tenant as operating expense reimbursement revenue. Property operating expenses were $22,279 and $23,226 for the year ended December 31, 2013 and 2012 respectively. The decrease in property operating expenses is primarily attributable reduced professional fees related to rebidding professional consulting and other contracts in an effort to reduce our annual operating costs and reduction in salaries and benefits.
During the year ended December 31, 2013, we recorded other-than-temporary impairments of $2,002 on our retained CDO Bonds, due to adverse changes in expected cash flows related to the retained bonds subsequent to our disposal of our Gramercy Finance segment and exit from the commercial real estate finance business in March 2013. Accordingly there was no other-than-temporary impairments during the year ended December 31, 2012.
We recorded depreciation and amortization expenses of $5,675 for the year ended December 31, 2013, compared to $256 for the year ended December 31, 2012. The increase of $5,419 in depreciation expense is primarily due to the acquisition of 29 properties in the year ended December 31, 2013, compared to the acquisition of 2 properties in the year ended December 31, 2012.
59
TABLE OF CONTENTS
Interest expense is incurred from borrowings under our senior secured credit facility as well as expenses incurred in connection with other secured financing arrangements encumbering eight other properties. We recorded interest expenses of $1,732 for the year ended December 31, 2013 related to long-term secured debt aggregating $167,180 as of December 31, 2013. For the year ended December 31, 2012, we had no long term secured debt and accordingly no interest expense was incurred.
Management, general and administrative expenses were $18,210 for the year ended December 31, 2013 as compared to $25,335 for the year ended 2012. The decrease of $7,125 is primarily related to $2,615 of costs incurred in connection with our strategic review process completed in 2012, and reduced employee headcount and corresponding decreases in salary and employee benefit costs of $1,696, a reduction in legal and professional fees of $1,095, a reduction in compliance and auditing costs of $1,004 and reduced insurance costs of $336, all of which related to rebiding professional and consulting arrangements as well as savings achieved in connection with reduced complexity of our business subsequent to our disposal of our Gramercy Finance segment and exit from the commercial real estate finance business in March 2013. The remainder of the decrease in management, general and administrative costs for the year ended December 31, 2013 is primarily attributable to lower occupancy costs for leased corporate and regional management offices.
Real estate acquisition costs were $2,808 and $111 for the year ended December 31, 2013 and 2012, respectively, and were comprised of costs incurred to complete the acquisition of properties accounted for as business combinations.
The provision for taxes is primarily attributable to federal, state and local taxes incurred in connection with our asset and property management business conducted in a TRS. The provision for taxes was $6,393 and $3,330 for the year ended December 31, 2013 and 2012, respectively. The increase in the provision is primarily attributable to additional incentive fee revenue recognized during the year ended December 31, 2013.
Comparison of the year ended December 31, 2012 to the year ended December 31, 2011
Revenues
| | | | | | |
| | 2012 | | 2011 | | Change |
| Management fees | | $ | 34,667 | | | $ | 7,336 | | | $ | 27,331 | |
| Rental revenue | | | 267 | | | | — | | | | 267 | |
| Investment income | | | 600 | | | | — | | | | 600 | |
| Operating expense reimbursements | | | 174 | | | | — | | | | 174 | |
| Other income | | | 1,113 | | | | 436 | | | | 677 | |
| Total Revenue | | $ | 36,821 | | | $ | 7,772 | | | $ | 29,049 | |
| Equity in net income (loss) of joint ventures | | $ | (2,904 | ) | | $ | 121 | | | $ | (3,025 | ) |
Management fees for the year ended December 31, 2012 were $34,667 and for the year ended December 31, 2011 were $7,336. Management fees are comprised of asset management, property management and administration fees earned pursuant to the Management Agreement which was effective September 1, 2011.
Rental revenue was $267 and $0 for the years ended December 31, 2012 and 2011, respectively. The increase of $267 is due to the acquisition of two industrial properties in November 2012.
Investment income was primarily generated from a mezzanine loan investment made in connection with the acquisition of our Bank of America Portfolio Joint Venture.
Operating expense reimbursements were $174 the year ended December 31, 2012 and were related two industrial properties acquired in November 2012.
Other income of $1,113 for the year ended December 31, 2012 is primarily comprised of a $1,000 payment received related to settlement of a previously defaulted loan investment held outside of our commercial real estate finance segment. The remainder of other income for the year ended December 31, 2012 and 2011 is related to interest earned on cash balances held by us.
60
TABLE OF CONTENTS
The equity in net income (loss) of joint ventures of $2,904 for the year ended December 31, 2012 represents our proportionate share of the loss generated by two joint venture interests, including our Bank of America Portfolio Joint Venture acquired in December 2012. The equity in net income of joint ventures of $121 for the year ended December 31, 2011 represents our proportionate share of the income generated by one joint venture interest. Our proportionate share of the income (loss) generated by our joint venture interests including $669 and $3,219 of real estate-related depreciation and amortization, which when added back, results in a reduction of Funds from Operations, or FFO, of $7,846 for the year ended December 31, 2012 and a contribution to FFO, of $1,242 for the year ended December 31, 2011, including losses of $5,611 and $2,098 classified as discontinued operations, respectively.
Expenses
| | | | | | |
| | 2012 | | 2011 | | Change |
| Property operating expenses | | $ | 23,226 | | | $ | 5,947 | | | $ | 17,279 | |
| Other-than-temporary impairment | | | — | | | | — | | | | — | |
| Depreciation and amortization | | | 256 | | | | 136 | | | | 120 | |
| Interest expense | | | — | | | | — | | | | — | |
| Management, general and administrative | | | 25,335 | | | | 22,150 | | | | 3,185 | |
| Unrealized loss on derivatives | | | — | | | | — | | | | — | |
| Acquisition expenses | | $ | 111 | | | | — | | | $ | 111 | |
| Provision for taxes | | | 3,330 | | | | 563 | | | | 2,767 | |
| Total Expenses | | $ | 52,258 | | | $ | 28,796 | | | $ | 23,462 | |
Property operating expenses increased by $17,279 from the $5,947 recorded in the year ended December 31, 2011 to $23,226 recorded in the year ended December 31, 2012. The increase is attributable to additional costs incurred in connection with management of the KBS portfolio for twelve months of 2012 as compared to only four months in 2011. Property operating expenses in 2011 was also reduced by the reversal of a reserve for litigation of approximately $5,392 which was settled in 2011.
We recorded depreciation and amortization expenses of $256 for the year ended December 31, 2012, compared to $136 for the year ended December 31, 2011. The increase of $120 is primarily due to the acquisition of the Indianapolis Industrial Portfolio in November 2012.
Management, general and administrative expenses were $25,446 for the year ended December 31, 2012, compared to $22,150 for the same period in 2011. The increase of $3,296 is primarily related to the write off of $2,615 in costs related to our strategic review process completed in the second quarter of 2012, $111 of acquisition costs for two industrial properties, increases of corporate legal fees of $715 and salary and employee benefit costs of $1,201, which were partially offset by reductions in audit fees, other professional fees and insurance of $1,347.
The provision for taxes was $3,330 for the year ended December 31, 2012, versus $563 for the year ended December 31, 2011. The increase of $2,767 is primarily related to taxes on our asset management business which is conducted in a TRS.
Liquidity and Capital Resources
Liquidity is a measurement of our ability to meet cash requirements, including ongoing commitments to fund acquisitions of real estate assets, repay borrowings, pay dividends and other general business needs. In addition to cash on hand, our primary sources of funds for short-term and long-term liquidity requirements, including working capital, distributions, debt service and additional investments, consist of: (i) cash flow from operations; (ii) proceeds from our private placement of common equity; (iii) borrowings under our credit facility; (iv) new financings, and; (v) proceeds from additional common or preferred equity offerings. We believe these sources of financing will be sufficient to meet our short-term and long-term liquidity requirements. Our future growth will depend, in large part, upon our ability to raise additional capital. In the event we are not able to successfully access new equity or debt capital, we will rely primarily on cash on hand and cash flows from operations to satisfy our liquidity requirements. As of the date of this filing, we expect that our cash on hand and cash flow from operations will be sufficient to satisfy our anticipated
61
TABLE OF CONTENTS
short-term and long-term liquidity needs as well as our recourse liabilities, if any. Our ability to fund our short-term liquidity needs, including debt service and general operations (including employment related benefit expenses), through cash flow from operations can be evaluated through the Consolidated Statements of Cash Flows included in our Consolidated Financial Statements.
Our debt financing terms may require us, among other restrictive covenants, to keep uninvested cash on hand, to maintain a certain minimum tangible net worth, to maintain a certain portion of our assets free from liens and to secure such borrowings with assets. These conditions could limit our ability to do further borrowings and may have a material adverse effect on our liquidity, the value of our common stock, and our ability to make distributions to our stockholders.
Beginning with the third quarter of 2008 our board of directors elected not to pay a dividend on our common stock. Additionally our board of directors elected not to pay the Series A Preferred Stock dividend of $0.50781 per share beginning with the fourth quarter of 2008. As of December 31, 2013 and December 31, 2012, we accrued $37,600 and $30,438, respectively, for the Series A Preferred Stock dividends. In December 2013, our board of directors authorized and we declared a “catch-up” dividend for all accrued and unpaid dividends on the Series A Preferred Stock for the period October 1, 2008, through and including October 14, 2013. In December 2013, our board of directors also authorized and we declared a Series A Preferred Stock quarterly dividend payment for the period October 15, 2013, through and including January 14, 2014. Both the accrued dividend and the quarterly dividend will be paid to holders of the Series A Preferred Stock of record as of the close of business on December 31, 2013. The accrued dividend was paid on January 13, 2014, and the quarterly dividend was paid on January 15, 2014.
In March 2014, our board of directors authorized and declared a quarterly dividend of $0.035 per common share for the first quarter of 2014, payable on April 15, 2014 to holders of record as of the close of business on March 31, 2014. Our board of directors also authorized and declared the Series A Preferred Stock quarterly dividend payment in the amount of $0.50781 per share, for the period January 15, 2014, through and including April 14, 2014, payable on April 15, 2014 to holders of record as of the close of business on March 31, 2014.
To maintain our qualification as a REIT under the Internal Revenue Code, we must distribute annually at least 90% of our taxable income. This distribution requirement limits our ability to retain earnings and thereby replenish or increase capital for operations. In accordance with the provisions of our charter, we may not pay any dividends on our common stock until all accrued dividends and the dividend for the then current quarter on the Series A Preferred Stock are paid in full.
Cash Flows
Net cash provided by operating activities increased $29,120 to $29,403 for the year ended December 31, 2013 compared to $283 for the same period in 2012. Operating cash flow was generated primarily by management fees, servicing advance recoveries and net rental revenue from our real estate investments.
Net cash used by investing activities for the year ended December 31, 2013 was $216,092 compared to net cash provided by investing activities of $248,288 during the same period in 2012. The decrease in cash flow from investing activities is primarily attributable to the acquisition of 29 properties net of assumed mortgages. The change is also attributable to activities in our commercial real estate finance business which we disposed of in the first quarter of 2013 and classified as discontinued operations. The decrease in cash flows from our finance business is attributable to the decrease in proceeds from real estate sales and principal collections on investments, which is offset by proceeds from the sale of the collateral management and sub-special servicing agreements for our three CDOs and the sale of a joint venture to a related party.
Net cash provided by financing activities for the year ended December 31, 2013 was $124,620 as compared to net cash used by financing activities of $306,894 during the same period in 2012. The change is primarily attributable to the decrease in restricted cash within the CDOs and proceeds from the sale of repurchased CDO bonds, and partially offset by an increase in repayments of liabilities issued by our CDOs. The decrease in cash flows in 2013 is also attributable to proceeds received from the origination of a mortgage note payable on our real estate assets.
62
TABLE OF CONTENTS
Capitalization
Our authorized capital stock consists of 200,000,000 shares, $0.001 par value per share, of which we are authorize to issue up to 100,000,000 shares of common stock, $0.001 par value per share, 25,000,000 shares of preferred stock, $0.001 par value per share, and 75,000,000 shares of excess stock, $0.001 par value per share. As of December 31, 2013, 71,313,043 shares of common stock, 3,525,822 shares of preferred stock and no shares of excess stock were issued and outstanding, respectively.
In connection with Mr. Gordon F. DuGan’s agreement to serve as our Chief Executive Officer, on June 7, 2012, Mr. DuGan also agreed to purchase 1,000,000 shares of our common stock on June 29, 2012 for an aggregate purchase price of $2,520 or $2.52 per share. The per share purchase price was equal to the closing price our common stock on the New York Stock Exchange on the day prior to the date Mr. DuGan entered into the subscription agreement with us to purchase such shares of common stock. The issuance of such shares of common stock was a private placement exempt from the registration requirements of the Securities Act.
We issued to KBS Acquisition Sub-Owner 2, LLC (i) 2,000,000 shares of our common stock, par value $0.001 per share; (ii) 2,000,000 shares of Class B-1 non-voting common stock, par value $0.001 per share; and (iii) 2,000,000 shares of Class B-2 non-voting common stock, par value $0.001 per share on December 6, 2012. The shares were issued as consideration for our contribution to the joint venture with Garrison in connection with the acquisition of the Bank of America Portfolio on the same date and were valued at $2.75 which was the closing price of our common stock on the New York Stock Exchange on the day prior. Each share of the Class B-1 common stock and Class B-2 common stock will be convertible into one share of our common stock at the option of the holder at any time on or after September 5, 2013 and December 6, 2013, respectively. Each share of Class B-1 common stock and Class B-2 common stock that has not previously been converted and remains outstanding on March 5, 2014 shall, automatically and without any action on the part of the holder thereof, convert into one share of common stock on such date. During 2013, all Class B-1 and Class B-2 common stock was converted into an equal amount of shares of our common stock. In December, 2013, we filed an articles supplementary to our charter to reclassify 2,000,000 authorized shares of Class B-1 common stock and 2,000,000 authorized shares of Class B-2 common stock into the same number of authorized but unissued shares of our common stock. The reclassification (i) increased the number of shares of common stock from 96,000,000 shares immediately prior to the reclassification to 100,000,000 shares of common stock immediately after the reclassification; (ii) decreased the number of shares classified as Class B-1 Common Stock from 2,000,000 shares immediately prior to the reclassification to no shares immediately after the reclassification; and (iii) decreased the number of shares classified as Class B-2 Common Stock from 2,000,000 shares immediately prior to the reclassification to no shares immediately after the reclassification.
In October 2013, we entered into a common stock purchase agreement and related joinder agreements, or the Purchase Agreement, for the issuance of 11,535,200 unregistered shares of common stock at a purchase price of $4.11 per share, raising net proceeds of $45,520. Pursuant to the Purchase Agreement, each purchaser has agreed that it will not, without our prior written consent, offer, sell, contract to sell, pledge or otherwise dispose any or all of the common stock purchased pursuant to the purchase agreement until March 25, 2014, or the Lock-Up Period. During the Lock-Up Period, if we issue common stock or securities convertible into common stock, except for certain permitted issuances, then the purchasers will have the ability to: (1) purchase their pro rata portion of all or any part of the new issuance and (2) elect the benefit of any different terms provided to the new investors.
Pursuant to the Purchase Agreement, we entered into contingent value rights agreements, or CVR agreements, with the purchasers at the closing of the sale of common stock. Pursuant to each CVR Agreement, we issued to each purchaser the number of contingent value rights, or CVRs, equal to the number of common stock purchased. On March 25, 2014, or the CVR Test Date, we will calculate the volume-weighted average price, or the VWAP, for the common stock for the 10 trading days period ending on, and including, March 25, 2014, or the CVR Period VWAP. On April 1, 2014, we will pay to the holder of the contingent value rights, in immediately available funds, an amount in cash, equal to (a) the number of contingent value rights held by the holder on the CVR Test Date multiplied by (b) the amount, not to exceed $0.46 equal to the difference between the per share purchase price of $4.11 and the CVR Period VWAP.
63
TABLE OF CONTENTS
Preferred Stock
In April 2007, we issued 4,600,000 shares of our 8.125% Series A cumulative redeemable preferred stock (including the underwriters’ over-allotment option of 600,000 shares) with a mandatory liquidation preference of $25.00 per share, or the Series A Preferred Stock. Holders of the Series A Preferred Stock are entitled to annual dividends of $2.03125 per share on a quarterly basis and dividends are cumulative, subject to certain provisions. On or after April 18, 2012, we may at our option redeem the Series A Preferred Stock at par for cash. Net proceeds (after deducting underwriting fees and expenses) from the offering were approximately $111,205. In November 2010, we repurchased 1,074,178 shares of the Series A Preferred Stock pursuant to a tender offer.
Beginning with the fourth quarter of 2008, our board of directors elected not to pay the quarterly Series A Preferred Stock dividends of $0.50781 per share. As of December 31, 2013 and 2012, we accrued Series A Preferred Stock dividends of $37,600 and $30,438, respectively. In December 2013, our board of directors authorized and we declared a “catch-up” dividend in the amount of $10.23524 per share of our 8.125% Series A Cumulative Redeemable Preferred Stock, representing all accrued and unpaid dividends on the Series A Preferred Stock for the period October 1, 2008, through and including October 14, 2013. In December 2013, our board of directors also authorized and we declared a Series A Preferred Stock quarterly dividend payment in the amount of $0.50781 per share, for the period October 15, 2013, through and including January 14, 2014. Both the accrued dividend and the quarterly dividend were paid to holders of the Series A Preferred Stock of record as of the close of business on December 31, 2013. The accrued dividend was paid on January 13, 2014, and the quarterly dividend was paid on January 15, 2014.
Deferred Stock Compensation Plan for Directors
Under our Independent Director’s Deferral Program, which commenced April 2005, our independent directors may elect to defer up to 100% of their annual retainer fee, chairman fees and meeting fees. Unless otherwise elected by a participant, fees deferred under the program shall be credited in the form of phantom stock units. The phantom stock units are convertible into an equal number of shares of common stock upon such directors’ termination of service from the board of directors or a change in control by us, as defined by the program. Phantom stock units are credited to each independent director quarterly using the closing price of our common stock on the applicable dividend record date for the respective quarter. If dividends are declared by us, each participating independent director who elects to receive fees in the form of phantom stock units has the option to have their account credited for an equivalent amount of phantom stock units based on the dividend rate for each quarter or have dividends paid in cash.
As of December 31, 2013, there were approximately 534,038 phantom stock units outstanding, of which 528,538 units are vested.
Market Capitalization
At December 31, 2013, our consolidated market capitalization is $665,376 based on a common stock price of $5.75 per share and the closing price of our common stock on the New York Stock Exchange on December 31, 2013. Market capitalization includes consolidated debt and common and preferred stock.
Equity Incentive Plan
In connection with the hiring of Gordon F. DuGan, Benjamin P. Harris, and Nicholas L. Pell, who joined on July 1, 2012 as Chief Executive Officer, President and Managing Director, respectively, we have granted equity awards to these new executives pursuant to a newly adopted outperformance plan, or the 2012 Outperformance Plan. Pursuant to the 2012 Outperformance Plan, these executives, in the aggregate, may earn up to $20,000 of LTIP Units based on our common stock price appreciation over a four-year performance period ending June 30, 2016. The amount of LTIP Units earned under the 2012 Outperformance Plan will range from $4,000 if our common stock price equals a minimum hurdle of $5.00 per share (less any dividends paid during the performance period) to $20,000 if our common stock price equals or exceeds $9.00 per share (less any dividends paid during the performance period) at the end of the performance period. In the event that the performance hurdles are not met on a vesting date, the award scheduled to vest on that vesting date may vest on a subsequent vesting date if the common stock price hurdle is met as of such subsequent vesting date. The executives will not earn any LTIP Units under the 2012 Outperformance Plan to the extent that our
64
TABLE OF CONTENTS
common stock price is less than the minimum hurdle. Messrs. DuGan, Harris and Pell were granted awards under the 2012 Outperformance Plan pursuant to which they may earn up to $10,000, $6,000 and $4,000 of LTIP Units, respectively. During the performance period, the executives may earn up to 12%, 24% and 36% of the maximum amount under the 2012 Outperformance Plan at the end of the first, second and third years, respectively, of the performance period if our common stock price has equaled or exceeded the stock price hurdles as of the end of such years. If the minimum stock price hurdle is met as of the end of any such year, the actual amount earned will range on a sliding scale from 20% of the maximum amount that may be earned as of such date (at the minimum stock price hurdle) to 100% of the maximum amount that may be earned as of such date (at the maximum stock price hurdle). Any LTIP Units earned under the 2012 Outperformance Plan will remain subject to vesting, with 50% of any LTIP Units earned vesting on June 30, 2016 and the remaining 50% vesting on June 30, 2017 based, in each case, on continued employment through the vesting date. The LTIP Units issued in July 2012 in connection with the hiring of new executives had a fair value of $1,870 on the date of grant, which was calculated in accordance with ASC 718. In March 2013, we granted four senior officers equity awards pursuant to the 2012 Outperformance Plan in the form of LTIP units having an aggregate maximum value of $4,000, and a fair value of $845, which was calculated in accordance with ASC 718. We used a probabilistic valuation approach to estimate the inherent uncertainty that the LTIP Units may have with respect to our common stock. Compensation expense of $555 and $210 was recorded for the years ended December 31, 2013 and 2012 for the 2012 Outperformance Plan. Compensation expense of $1,943 will be recorded over the course of the next 36 months, representing the remaining weighted average vesting period of the LTIP Units as of December 31, 2013.
In connection with the equity awards made to Messrs. DuGan, Harris and Pell in connection with the hiring of these executives, we adopted the 2012 Inducement Equity Incentive Plan, or the Inducement Plan. Under the Inducement Plan, we may grant equity awards for up to 4,500,000 shares of common stock pursuant to the employment inducement award exemption provided by the New York Stock Exchange Listed Company Manual. The Inducement Plan permits us to issue a variety of equity awards, including stock options, restricted stock, phantom shares, dividend equivalent rights and other equity-based awards. All of the shares available under the Inducement Plan were issued or reserved for issuance to Messrs. DuGan, Harris and Pell in connection with the equity awards made upon the commencement of their employment. Equity awards issued under the Inducement Plan had a fair value of $3,830 on the date of grant. Compensation expense of $766 and $383 was recorded for years ended December 31, 2013 and 2012 for the 2012 Inducement Equity Incentive Plan. Compensation expense of $2,681 will be recorded over the course of the next 30 months representing the remaining weighted average vesting period of equity awards issued under the Inducement Plan as of December 31, 2012. In March 2013, we granted to four senior officers pursuant to the Equity Incentive Plan a total of 115,000 time-based restricted stock awards and 345,000 performance-based restricted stock units. The time-based awards vest in five equal annual installments commencing December 15, 2013, subject to continued employment. Vesting of the performance-based units requires, in addition to continued employment over a 5-year period, achievement of absolute increases in either our stock price or an adjusted funds from operations (as defined by our compensation committee).
Indebtedness
The table below summarizes secured and other debt at December 31, 2013 and 2012:
| | | | |
| | December 31,
2013 | | December 31,
2012 |
| Mortgage notes payable | | $ | 122,180 | | | $ | — | |
| Secured revolving credit facility | | | 45,000 | | | | — | |
| Collateralized debt obligations | | | — | | | | 2,188,597 | |
| Total | | $ | 167,180 | | | $ | 2,188,597 | |
| Cost of debt | | | 0.00% to 6.95 | % | | | LIBOR+0.47 | % |
65
TABLE OF CONTENTS
Secured Revolving Credit Facility
On September 4, 2013, we entered into a Credit and Guaranty Agreement, with Deutsche Bank Securities, Inc., as lead arranger and bookrunner, and Deutsche Bank AG New York Branch, as administrative agent, for a $100,000 senior secured revolving credit facility, which Credit and Guaranty Agreement was amended and restated on September 24, 2013, or the Credit Facility. The aggregate amount of the Credit Facility may be increased to a total of up to $150,000, subject to the approval of the administrative agent and the identification of lenders willing to make available additional amounts. The maturity date of the revolving credit facility is September 2015, with one 12-month extension option exercisable by us, subject, among other things, to there being an absence of an event of default under the Credit Facility and to the payment of an extension fee. The Credit Facility is guaranteed by Gramercy Property Trust Inc. and certain subsidiaries and is secured by first priority mortgages on designated properties, or the Borrowing Base. Outstanding borrowings under the Credit Facility are limited to the lesser of (i) the sum of the $100,000 revolving commitment and the maximum $50,000 commitment increase available or (ii) 60.0% of the value of the Borrowing Base. Interest on advances made on the Credit Facility, will be incurred at a floating rate based upon, at our option, either (i) LIBOR plus the applicable LIBOR margin, or (ii) the applicable base rate which is the greater of the Prime Rate, 0.50% above the Federal Funds Rate, or 30-day LIBOR plus 1.00%. The applicable LIBOR margin will range from 1.90% to 2.75%, depending on the ratio of our outstanding consolidated indebtedness to the value of our consolidated gross assets. The Credit Facility will have an initial borrowing rate of LIBOR plus 1.90%. The Credit Facility includes a series of financial and other covenants that we must comply with in order to borrow under the facility. We are in compliance with the covenants under the Credit Facility at December 31, 2013. As of December 31, 2013, there were borrowings of $45,000 outstanding under the Credit Facility and 18 properties were in the borrowing base.
Mortgage and Mezzanine Loans
Certain real estate assets are subject to mortgage and mezzanine liens. During 2013, we entered into $72,245 non-recourse mortgage loans with weighted average fixed-rate of 4.83% and a weighted-average floating rate of LIBOR + 2.10%. These mortgages were secured by six properties. We also assumed $48,898 of non-recourse mortgages in connection with the acquisition of two real estate acquisitions.
Contractual Obligations
We are obligated under certain tenant leases, to construct the underlying leased property or fund tenant expansions. As of December 31, 2013, we had four outstanding commitments: (1) the construction of an approximately 118,000 square foot cold storage facility located in Hialeah Gardens, Florida, of which the unfunded amounts were estimated to be $16,772; (2) the contribution of $1,500 towards tenant improvements on a warehouse/industrial property in Garland, Texas, of which the unfunded amounts were estimated to be $854; (3) the expansion of a property located in Olive Branch, Mississippi whereby the tenant has a one-time option to expand the building by 250,000 square feet; and (4) the expansion of a property located in Logan Township, New Jersey whereby the tenant has a one-time option to expand the building by 25,000 square feet. The tenants have not noticed us for the building expansion options and therefore, no amounts are due and no unfunded amounts have been estimated.
Combined aggregate principal maturities of our credit facility, non-recourse mortgages and operating leases as of December 31, 2013 are as follows:
| | | | | | | | |
| | Credit Facility | | Mortgage Notes Payable | | Interest Payments | | Total |
| 2014 | | $ | — | | | $ | 7,576 | | | $ | 6,203 | | | $ | 13,779 | |
| 2015 | | | 45,000 | | | | 2,763 | | | | 5,939 | | | | 53,702 | |
| 2016 | | | — | | | | 2,895 | | | | 5,091 | | | | 7,986 | |
| 2017 | | | — | | | | 3,045 | | | | 4,935 | | | | 7,980 | |
| 2018 | | | — | | | | 15,986 | | | | 4,563 | | | | 20,549 | |
| Thereafter | | | — | | | | 88,108 | | | | 18,137 | | | | 106,245 | |
| Above/Below Market Interest | | | — | | | | — | | | | 1,807 | | | | 1,807 | |
| Total | | $ | 45,000 | | | $ | 120,373 | | | $ | 46,675 | | | $ | 212,048 | |
66
TABLE OF CONTENTS
Leasing Agreements
Future minimum rental revenue under non-cancelable and excluding reimbursements for operating expenses, as of December 31, 2013 are as follows:
| | |
| | Operating Leases |
| 2014 | | $ | 28,917 | |
| 2015 | | | 30,398 | |
| 2016 | | | 30,694 | |
| 2017 | | | 31,040 | |
| 2018 | | | 31,575 | |
| Thereafter | | | 284,577 | |
| Total minimum lease rental income | | $ | 437,201 | |
Off-Balance-Sheet Arrangements
We have off-balance-sheet investments, including joint ventures. These investments all have varying ownership structures. Substantially all of our joint venture arrangements are accounted for under the equity method of accounting as we have the ability to exercise significant influence, but not control over the operating and financial decisions of these joint venture arrangements. Our off-balance-sheet arrangements are discussed in Note 5 in the accompanying financial statements.
Dividends
To maintain our qualification as a REIT, we must pay annual dividends to our stockholders of at least 90% of our REIT taxable income, determined before taking into consideration the dividends paid deduction and net capital gains. Before we pay any dividend, whether for U.S. federal income tax purposes or otherwise, which would only be paid out of available cash, we must first meet both our operating requirements and scheduled debt service on our mortgages and loans payable. In accordance with the provisions of our charter, we may not pay any dividends on our common stock until all accrued dividends and the dividend for the then current quarter on the Series A Preferred Stock are paid in full.
Beginning with the third quarter of 2008, our board of directors elected not to pay a dividend on our common stock. Our board of directors also elected not to pay the Series A Preferred Stock dividend of $0.50781 per share beginning with the fourth quarter of 2008. The unpaid preferred stock dividends were accrued for 21 quarters through December 31, 2013. In December 2013, our board of directors authorized and we declared a “catch-up” dividend in the amount of $10.23524 per share of our 8.125% Series A Cumulative Redeemable Preferred Stock, representing all accrued and unpaid dividends on the Series A Preferred Stock for the period October 1, 2008, through and including October 14, 2013. In December 2013, our board of directors also authorized and we declared a Series A Preferred Stock quarterly dividend payment in the amount of $0.50781 per share, for the period October 15, 2013, through and including January 14, 2014. Both the accrued dividend and the quarterly dividend were paid to holders of the Series A Preferred Stock of record as of the close of business on December 31, 2013. The accrued dividend was paid on January 13, 2014, and the quarterly dividend was paid on January 15, 2014.
In addition, the board of directors authorized and we declared a dividend of $0.035 per common share for the first quarter of 2014, to be paid on April 15, 2014 to holders of record as of March 31, 2014.
Inflation
A majority of our assets and liabilities are interest rate sensitive in nature. As a result, interest rates and other factors influence our performance more so than inflation. Changes in interest rates do not necessarily correlate with inflation rates or changes in inflation rates.
Further, our financial statements are prepared in accordance with GAAP and our distributions are determined by our board of directors based primarily on our net income as calculated for tax purposes, in each case, our activities and balance sheet are measured with reference to historical costs or fair market value without considering inflation.
67
TABLE OF CONTENTS
Transactions with Director Related Entities
The Chief Executive Officer of SL Green Realty Corp. (NYSE: SLG), or SL Green, is one of our directors.
In June 2013, we signed a lease agreement with 521 Fifth Fee Owner LLC, an affiliate of SL Green, for new corporate office space located at 521 Fifth Avenue, 30th Floor, New York, New York. The lease commenced in September 2013, following the completion of certain improvements to the space. The lease is for approximately 6,580 square feet and carries a term of 10 years with rents of approximately $373 per annum for year one rising to $463 per annum in year ten. There were four months of rent abated at the commencement of the lease and as such we did not pay any rent under the lease for the year ended December 31, 2013.
From May 2005 through September 2013, we were party to a lease agreement with SLG Graybar Sublease LLC, an affiliate of SL Green, for our previous corporate offices at 420 Lexington Avenue, New York, New York. In April 2013, we gave notice that we were cancelling the lease for the corporate offices at 420 Lexington Avenue effective in September 2013 concurrently with the commencement of the lease for the new corporate offices at 521 Fifth Avenue.
In September 2012, we recapitalized a portfolio of office buildings, which were part of the Gramercy Finance segment and owned within our CDOs, and located in Southern California, or the Southern California Office Portfolio, with an affiliate of SL Green and several other unrelated parties, through the contribution of an existing preferred equity investment to a newly formed joint venture. In January 2013, we sold the 10.6% interest in a joint venture of the Southern California Office Portfolio to an affiliate of SL Green for proceeds of $8,275 and recorded a gain on disposition to a director related entity of $1,317.
Funds from Operations
We present FFO because we consider it an important supplemental measure of our operating performance and believe that it is frequently used by securities analysts, investors and other interested parties in the evaluation of REITS. We also use FFO as one of several criteria to determine performance-based incentive compensation for members of our senior management, which may be payable in cash or equity awards. The revised White Paper on FFO approved by the Board of Governors of the National Association of Real Estate Investment Trusts, or NAREIT, defines FFO as net income (loss) (determined in accordance with GAAP), excluding impairment write-downs of investments in depreciable real estate and investments in in-substance real estate investments, gains or losses from debt restructurings and sales of depreciable operating properties, plus real estate-related depreciation and amortization (excluding amortization of deferred financing costs), less distributions to non-controlling interests and gains/losses from discontinued operations and after adjustments for unconsolidated partnerships and joint ventures. FFO does not represent cash generated from operating activities in accordance with GAAP and should not be considered as an alternative to net income (determined in accordance with GAAP), as an indication of our financial performance, or to cash flow from operating activities (determined in accordance with GAAP) as a measure of our liquidity, nor is it entirely indicative of funds available to fund our cash needs, including our ability to make cash distributions. Our calculation of FFO may be different from the calculation used by other companies and, therefore, comparability may be limited.
68
TABLE OF CONTENTS
FFO for the years ended December 31, 2013, 2012 and 2011 are as follows:
| | | | | | |
| | For the Year Ended December 31, |
| | | 2013 | | 2012 | | 2011 |
| Net income (loss) available to common shareholders | | $ | 377,665 | | | $ | (178,710 | ) | | $ | 330,315 | |
Add:
| | | | | | | | | | | | |
| Depreciation and amortization | | | 6,449 | | | | 5,205 | | | | 70,215 | |
| FFO adjustments for unconsolidated joint ventures | | | 11,111 | | | | 669 | | | | 3,219 | |
| Non-cash impairment of real estate investments | | | — | | | | 35,043 | | | | 1,296 | |
| (Income) loss from discontinued operations | | | (392,999 | ) | | | 153,207 | | | | (358,380 | ) |
Less:
| | | | | | | | | | | | |
| Non real estate depreciation and amortization | | | (952 | ) | | | (4,059 | ) | | | (7,044 | ) |
| Gain on sale | | | — | | | | (15,915 | ) | | | (2,713 | ) |
| FFO adjustment for discontinued operations | | | (7 | ) | | | (20,056 | ) | | | (61,604 | ) |
| Funds from operations | | $ | 1,267 | | | $ | (24,616 | ) | | $ | (24,696 | ) |
| Funds from operations per share – basic | | $ | 0.02 | | | $ | (0.47 | ) | | $ | (0.49 | ) |
| Funds from operations per share – diluted | | $ | 0.02 | | | $ | (0.47 | ) | | $ | (0.49 | ) |
Recently Issued Accounting Pronouncements
In February 2013, the FASB issued additional guidance on comprehensive income which requires the provision of information about the amounts reclassified out of accumulated other comprehensive income by component. This guidance also requires presentation on the Consolidated Statements of Operations and Comprehensive Income (Loss) or in the notes, significant amounts reclassified out of accumulated other comprehensive income by the respective line items of net income but only if the amount reclassified is required under U.S. GAAP to be reclassified to net income in its entirety in the same reporting period. For other amounts that are not required under U.S. GAAP to be reclassified in their entirety to net income, a cross-reference must be provided to other disclosures required under U.S. GAAP that provide additional detail about those amounts. This update is effective for reporting periods beginning after December 15, 2012 with early adoption permitted. We adopted this guidance for the first quarter of 2013, and our adoption resulted in increased disclosures but did not have a material effect on our Consolidated Financial Statements.
69
TABLE OF CONTENTS
ITEM 7A. QUANTITATIVE AND QUALITATIVE DISCLOSURE ABOUT MARKET RISK
Market Risk
Market risk includes risks that arise from changes in interest rates, credit, commodity prices, equity prices and other market changes that affect market sensitive instruments. In pursuing our business plan, we expect that the primary market risks to which we will be exposed are real estate, interest rate and credit risks. These risks are highly sensitive to many factors, including governmental monetary and tax policies, domestic and international economic and political considerations and other factors that are beyond our control.
Real Estate Risk
Commercial property values and net operating income derived from such properties are subject to volatility and may be affected adversely by a number of factors, including, but not limited to, national, regional and local economic conditions, local real estate conditions (such as an oversupply of retail, industrial, office or other commercial or multi-family space), changes or continued weakness in specific industry segments, construction quality, age and design, demographic factors, retroactive changes to building or similar codes, and increases in operating expenses (such as energy costs). We may seek to mitigate these risks by employing careful business selection, rigorous underwriting and credit approval processes and attentive asset management.
Interest Rate Risk
Interest rate risk is highly sensitive to many factors, including governmental monetary and tax policies, domestic and international economic and political considerations and other factors beyond our control. Our operating results will depend in large part on differences between the income from our assets and our borrowing costs. Our real estate assets generate income principally from fixed long-term leases and we are exposed to changes in interest rates primarily from floating rate borrowing arrangements. We expect that we will primarily finance our investment in commercial real estate with fixed rate, non-recourse mortgage financing, however, to the extent that we use floating rate borrowing arrangements, our net income from our real estate investments will generally decease if LIBOR increases. We have used, and may continue to use, interest rate caps or swaps to manage our exposure to interest rate changes. We currently have a $45,000 floating rate secured line of credit and our Bank of America Joint Venture financed the acquisition of its portfolio with a $200,000 floating rate, interest-only first mortgage note. The following chart shows a hypothetical 100 basis point increase in interest rates along the entire interest rate curve:
| | |
| Change in LIBOR | | Projected Increase (Decrease) in Net Income |
Base case
| | | | |
| +100 bps | | $ | ( 266 | ) |
| +200 bps | | $ | ( 532 | ) |
| +300 bps | | $ | ( 798 | ) |
Credit Risk
Credit risk refers to the ability of each tenant in our portfolio of real estate investments to make contractual lease payments on the scheduled due dates. We seek to reduce credit risk of our real estate investments by entering into long-term leases with tenants after a careful evaluation of credit worthiness as part of our property acquisition process. If defaults occur, we employ our asset management resources to mitigate the severity of any losses and seek to relet the property. In the event of a significant rising interest rate environment and/or economic downturn, tenant delinquencies and defaults may increase and result in credit losses that would materially and adversely affect our business, financial condition and results of operations.
70
TABLE OF CONTENTS
ITEM 8. FINANCIAL STATEMENTS AND SUPPLEMENTARY DATA
Index to Financial Statements and Schedules
All other schedules are omitted because they are not required or the required information is shown in the financial statements or notes thereto.
71
TABLE OF CONTENTS
Report of Independent Registered Public Accounting Firm
The Board of Directors and Stockholders of Gramercy Property Trust Inc.
We have audited the accompanying consolidated balance sheets of Gramercy Property Trust Inc. as of December 31, 2013 and 2012, and the related consolidated statements of operations and comprehensive income (loss), stockholders' equity (deficit) and non-controlling interests, and cash flows for each of the three years in the period ended December 31, 2013. Our audits also included the financial statement schedule listed in the Index at Item 15(a). These financial statements and schedule are the responsibility of the Company's management. Our responsibility is to express an opinion on these financial statements and schedule based on our audits.
We conducted our audits in accordance with the standards of the Public Company Accounting Oversight Board (United States). Those standards require that we plan and perform the audit to obtain reasonable assurance about whether the financial statements are free of material misstatement. An audit includes examining, on a test basis, evidence supporting the amounts and disclosures in the financial statements. An audit also includes assessing the accounting principles used and significant estimates made by management, as well as evaluating the overall financial statement presentation. We believe that our audits provide a reasonable basis for our opinion.
In our opinion, the financial statements referred to above present fairly, in all material respects, the consolidated financial position of Gramercy Property Trust Inc. at December 31, 2013 and 2012, and the consolidated results of its operations and its cash flows for each of the three years in the period ended December 31, 2013, in conformity with U.S. generally accepted accounting principles. Also, in our opinion, the related financial statement schedule, when considered in relation to the basic financial statements taken as a whole, present fairly in all material respects the information set forth therein.
We also have audited, in accordance with the standards of the Public Company Accounting Oversight Board (United States), Gramercy Property Trust Inc.’s internal control over financial reporting as of December 31, 2013, based on criteria established in Internal Control — Integrated Framework issued by the Committee of Sponsoring Organizations of the Treadway Commission (1992 framework) and our report dated March 14, 2014 expressed an unqualified opinion.
/s/ Ernst & Young LLP
New York, New York
March 14, 2014
72
TABLE OF CONTENTS
Report of Independent Registered Public Accounting Firm
The Board of Directors and Stockholders of Gramercy Property Trust Inc.
We have audited Gramercy Property Trust Inc.’s internal control over financial reporting as of December 31, 2013, based on criteria established in Internal Control — Integrated Framework issued by the Committee of Sponsoring Organizations of the Treadway Commission (1992 framework) (the COSO criteria). Gramercy Property Trusts Inc.’s management is responsible for maintaining effective internal control over financial reporting, and for its assessment of the effectiveness of internal control over financial reporting included in the accompanying Management’s Annual Report on Internal Control over Financial Reporting. Our responsibility is to express an opinion on the company’s internal control over financial reporting based on our audit.
We conducted our audit in accordance with the standards of the Public Company Accounting Oversight Board (United States). Those standards require that we plan and perform the audit to obtain reasonable assurance about whether effective internal control over financial reporting was maintained in all material respects. Our audit included obtaining an understanding of internal control over financial reporting, assessing the risk that a material weakness exists, testing and evaluating the design and operating effectiveness of internal control based on the assessed risk, and performing such other procedures as we considered necessary in the circumstances. We believe that our audit provides a reasonable basis for our opinion.
A company’s internal control over financial reporting is a process designed to provide reasonable assurance regarding the reliability of financial reporting and the preparation of financial statements for external purposes in accordance with generally accepted accounting principles. A company’s internal control over financial reporting includes those policies and procedures that (1) pertain to the maintenance of records that, in reasonable detail, accurately and fairly reflect the transactions and dispositions of the assets of the company; (2) provide reasonable assurance that transactions are recorded as necessary to permit preparation of financial statements in accordance with generally accepted accounting principles, and that receipts and expenditures of the company are being made only in accordance with authorizations of management and directors of the company; and (3) provide reasonable assurance regarding prevention or timely detection of unauthorized acquisition, use, or disposition of the company’s assets that could have a material effect on the financial statements.
Because of its inherent limitations, internal control over financial reporting may not prevent or detect misstatements. Also, projections of any evaluation of effectiveness to future periods are subject to the risk that controls may become inadequate because of changes in conditions, or that the degree of compliance with the policies or procedures may deteriorate.
In our opinion, Gramercy Property Trust Inc. maintained, in all material respects, effective internal control over financial reporting as of December 31, 2013, based on the COSO criteria.
We also have audited, in accordance with the standards of the Public Company Accounting Oversight Board (United States), the 2013 consolidated financial statements of Gramercy Property Trust Inc. and our report dated March 14, 2014 expressed an unqualified opinion thereon.
/s/ Ernst & Young LLP
New York, New York
March 14, 2014
73
TABLE OF CONTENTS
Gramercy Property Trust Inc.
Consolidated Balance Sheets
(Amounts in thousands, except share and per share data)
| | | | |
| | December 31, 2013 | | December 31, 2012 |
Assets:
| | | | | | | | |
Real estate investments, at cost:
| | | | | | | | |
| Land | | $ | 73,131 | | | $ | 1,800 | |
| Building and improvements | | | 264,581 | | | | 21,359 | |
| Less: accumulated depreciation | | | (4,247 | ) | | | (50 | ) |
| Total real estate investments, net | | | 333,465 | | | | 23,109 | |
| Cash and cash equivalents | | | 43,333 | | | | 105,402 | |
| Restricted cash | | | 179 | | | | 12 | |
| Investment in joint ventures | | | 39,385 | | | | 72,742 | |
| Servicing advances receivable | | | 8,758 | | | | — | |
| Retained CDO bonds available for sale | | | 6,762 | | | | — | |
| Assets held-for-sale, net (includes consolidated VIEs of $0 and $1,913,353, respectively) | | | — | | | | 1,952,264 | |
| Tenant and other receivables, net | | | 5,976 | | | | 4,123 | |
| Acquired lease assets, net of accumulated amortization of $1,596 and $42 | | | 40,960 | | | | 4,386 | |
| Deferred costs, net of accumulated amortization of $634 and $2,033 | | | 5,815 | | | | 415 | |
| Other assets | | | 7,030 | | | | 6,383 | |
| Total assets | | $ | 491,663 | | | $ | 2,168,836 | |
Liabilities and Equity (Deficit):
| | | | | | | | |
Liabilities:
| | | | | | | | |
| Secured revolving credit facility | | $ | 45,000 | | | $ | — | |
| Mortgage notes payable | | | 122,180 | | | | — | |
| Total long term, secured debt | | | 167,180 | | | | — | |
| Accounts payable and accrued expenses | | | 11,517 | | | | 8,908 | |
| Dividends payable | | | 37,600 | | | | 30,438 | |
| Accrued interest payable | | | 81 | | | | — | |
| Deferred revenue | | | 1,581 | | | | 33 | |
| Below-market lease liabilities, net of accumulated amortization of $300 and $4 | | | 6,077 | | | | 458 | |
| Liabilities related to assets held-for-sale (includes consolidated VIEs of $0 and $2,374,516, respectively) | | | — | | | | 2,380,162 | |
| Derivative instruments, at fair value | | | 302 | | | | — | |
| Other liabilities | | | 852 | | | | 665 | |
| Total liabilities | | | 225,190 | | | | 2,420,664 | |
| Commitments and contingencies | | | — | | | | — | |
Equity (Deficit):
| | | | | | | | |
| Common stock, par value $0.001, 100,000,000 and 96,000,000 shares authorized, 71,313,043 and 56,731,002 shares issued and outstanding at December 31, 2013 and 2012, respectively. | | | 71 | | | | 57 | |
| Common stock, Class B-1, par value $0.001, 0 and 2,000,000 shares authorized, issued and outstanding at December 31, 2013 and 2012, respectively. | | | — | | | | 2 | |
| Common stock, Class B-2, par value $0.001, 0 and 2,000,000 shares authorized, issued and outstanding at December 31, 2013 and 2012, respectively. | | | — | | | | 2 | |
| Series A cumulative redeemable preferred stock, par value $0.001, liquidation preference $88,146, 3,525,822 shares authorized, issued and outstanding at December 31, 2013 and 2012, respectively. | | | 85,235 | | | | 85,235 | |
| Additional paid-in-capital | | | 1,149,896 | | | | 1,102,227 | |
| Accumulated other comprehensive loss | | | (1,405 | ) | | | (95,265 | ) |
| Accumulated deficit | | | (967,324 | ) | | | (1,344,989 | ) |
| Total Gramercy Property Trust Inc. stockholders' equity (deficit) | | | 266,473 | | | | (252,731 | ) |
| Non-controlling interest | | | — | | | | 903 | |
| Total equity (deficit) | | | 266,473 | | | | (251,828 | ) |
| Total liabilities and equity (deficit) | | $ | 491,663 | | | $ | 2,168,836 | |
The accompanying notes are an integral part of these financial statements.
74
TABLE OF CONTENTS
Gramercy Property Trust Inc.
Consolidated Statements of Operations and Comprehensive Income (Loss)
(Amounts in thousands, except share and per share data)
| | | | | | |
| | Year Ended December 31, |
| | | 2013 | | 2012 | | 2011 |
Revenues
| | | | | | | | | | | | |
| Management fees | | $ | 40,896 | | | $ | 34,667 | | | $ | 7,336 | |
| Rental revenue | | | 12,181 | | | | 267 | | | | — | |
| Investment income | | | 1,717 | | | | 600 | | | | — | |
| Operating expense reimbursements | | | 1,203 | | | | 174 | | | | — | |
| Other income | | | 707 | | | | 1,113 | | | | 436 | |
| Total revenues | | | 56,704 | | | | 36,821 | | | | 7,772 | |
Expenses
| | | | | | | | | | | | |
Property operating expenses:
| | | | | | | | | | | | |
| Property management expenses | | | 20,868 | | | | 21,380 | | | | 10,099 | |
| Property operating expenses: | | | 1,411 | | | | 1,846 | | | | (4,152 | ) |
| Total property operating expenses | | | 22,279 | | | | 23,226 | | | | 5,947 | |
| Other-than-temporary impairment | | | 3,339 | | | | — | | | | — | |
| Portion of impairment recognized in other comprehensive loss | | | (1,337 | ) | | | — | | | | — | |
| Net impairment recognized in earnings | | | 2,002 | | | | — | | | | — | |
| Interest expense | | | 1,732 | | | | — | | | | — | |
| Depreciation and amortization | | | 5,675 | | | | 256 | | | | 136 | |
| Management, general and administrative | | | 18,210 | | | | 25,335 | | | | 22,150 | |
| Unrealized loss on derivative instruments | | | 115 | | | | — | | | | — | |
| Acquisition expenses | | | 2,808 | | | | 111 | | | | — | |
| Total expenses | | | 52,821 | | | | 48,928 | | | | 28,233 | |
| Income (loss) from continuing operations before equity in income (loss) from joint ventures and provisions for taxes | | | 3,883 | | | | (12,107 | ) | | | (20,461 | ) |
| Equity in net income (loss) of joint ventures | | | (5,662 | ) | | | (2,904 | ) | | | 121 | |
| Loss from continuing operations before provision for taxes and discontinued operations | | | (1,779 | ) | | | (15,011 | ) | | | (20,340 | ) |
| Provision for taxes | | | (6,393 | ) | | | (3,330 | ) | | | (563 | ) |
| Loss from continuing operations | | | (8,172 | ) | | | (18,341 | ) | | | (20,903 | ) |
| Income (loss) from discontinued operations | | | 5,057 | | | | (169,174 | ) | | | 70,034 | |
| Gain on sale of joint venture interest to a director related entity | | | 1,317 | | | | — | | | | — | |
| Gain on settlement of debt | | | — | | | | — | | | | 285,634 | |
| Net gains from disposals | | | 389,140 | | | | 15,967 | | | | 2,712 | |
| Provision for taxes | | | (2,515 | ) | | | — | | | | — | |
| Income (loss) from discontinued operations | | | 392,999 | | | | (153,207 | ) | | | 358,380 | |
| Net income (loss) attributable to Gramercy Property Trust Inc. | | | 384,827 | | | | (171,548 | ) | | | 337,477 | |
| Accrued preferred stock dividends | | | (7,162 | ) | | | (7,162 | ) | | | (7,162 | ) |
| Net income (loss) available to common stockholders | | $ | 377,665 | | | $ | (178,710 | ) | | $ | 330,315 | |
Other comprehensive income (loss):
| | | | | | | | | | | | |
| Unrealized gain (loss) on available for sale debt securities | | | (3,221 | ) | | | 174,331 | | | | (279,243 | ) |
Reclassification adjustment for other-than-temporary impairment in net
income (loss) | | | 2,002 | | | | 169,197 | | | | 18,423 | |
| Unrealized gain (loss) on derivative instruments | | | (187 | ) | | | 2,146 | | | | (19,334 | ) |
| Reclassification of unrealized holding gains on securities and derivative instruments due to the disposal of Gramery Finance | | | 95,265 | | | | — | | | | — | |
| Other comprehensive income (loss) | | | 93,859 | | | | 345,674 | | | | (280,154 | ) |
| Comprehensive income (loss) attributable to Gramercy Property Trust Inc. | | | 478,686 | | | | 174,126 | | | | 57,323 | |
| Comprehensive income (loss) attributable to common stockholders | | $ | 471,524 | | | $ | 166,964 | | | $ | 50,161 | |
Basic earnings per share:
| | | | | | | | | | | | |
| Net loss from continuing operations, after preferred dividends | | $ | (0.25 | ) | | $ | (0.49 | ) | | $ | (0.55 | ) |
| Net income (loss) from discontinued operations | | | 6.39 | | | | (2.95 | ) | | | 7.13 | |
| Net income (loss) available to common stockholders | | $ | 6.14 | | | $ | (3.44 | ) | | $ | 6.58 | |
Diluted earnings per share:
| | | | | | | | | | | | |
| Net loss from continuing operations, after preferred dividends | | $ | (0.25 | ) | | $ | (0.49 | ) | | $ | (0.55 | ) |
| Net income (loss) from discontinued operations | | | 6.39 | | | | (2.95 | ) | | | 7.13 | |
| Net income (loss) available to common stockholders | | $ | 6.14 | | | $ | (3.44 | ) | | $ | 6.58 | |
| Basic weighted average common shares outstanding | | | 61,500,847 | | | | 51,976,462 | | | | 50,229,102 | |
| Diluted weighted average common shares and common share equivalents outstanding | | | 61,500,847 | | | | 51,976,462 | | | | 50,229,102 | |
The accompanying notes are an integral part of these financial statements.
75
TABLE OF CONTENTS
Gramercy Property Trust Inc.
Consolidated Statements of Stockholders’ Equity (Deficit) and Non-controlling Interests
(Amounts in thousands, except share data)
| | | | | | | | | | | | | | | | | | | | | | | | | | |
| | Common Stock | | Common Stock, Class B-1 | | Common Stock, Class B-2 | | Series A Preferred Stock | | Additional Paid-In-Capital | | Accumulated Other Comprehensive Income (Loss) | | Retained Earnings/
(Accumulated Deficit) | | Total
Gramercy Property Trust Inc. | | Non-controlling interest | | Total |
| | | Shares | | Par Value | | Shares | | Par Value | | Shares | | Par Value |
| Balance at December 31, 2010 | | | 49,984,559 | | | $ | 50 | | | | — | | | $ | — | | | | — | | | $ | — | | | $ | 85,235 | | | $ | 1,078,198 | | | $ | (160,785 | ) | | $ | (1,496,594 | ) | | $ | (493,896 | ) | | $ | 903 | | | $ | (492,993 | ) |
| Net income | | | — | | | | — | | | | — | | | | — | | | | — | | | | — | | | | — | | | | — | | | | — | | | | 337,477 | | | | 337,477 | | | | — | | | | 337,477 | |
| Change in net unrealized loss on derivative instruments | | | — | | | | — | | | | — | | | | — | | | | — | | | | — | | | | — | | | | — | | | | (19,334 | ) | | | — | | | | (19,334 | ) | | | — | | | | (19,334 | ) |
| Change in net unrealized loss on securities available for sale | | | — | | | | — | | | | — | | | | — | | | | — | | | | — | | | | — | | | | — | | | | (260,820 | ) | | | — | | | | (260,820 | ) | | | — | | | | (260,820 | ) |
| Issuance of stock – stock purchase plan | | | 20,448 | | | | — | | | | — | | | | — | | | | — | | | | — | | | | — | | | | — | | | | — | | | | — | | | | — | | | | — | | | | — | |
| Stock based compensation – fair value | | | 1,081,259 | | | | — | | | | — | | | | — | | | | — | | | | — | | | | — | | | | 2,402 | | | | — | | | | — | | | | 2,402 | | | | — | | | | 2,402 | |
| Dividends accrued on preferred stock | | | — | | | | — | | | | — | | | | — | | | | — | | | | — | | | | — | | | | — | | | | — | | | | (7,162 | ) | | | (7,162 | ) | | | — | | | | (7,162 | ) |
| Balance at December 31, 2011 | | | 51,086,266 | | | $ | 50 | | | | — | | | $ | — | | | | — | | | $ | — | | | $ | 85,235 | | | $ | 1,080,600 | | | $ | (440,939 | ) | | $ | (1,166,279 | ) | | $ | (441,333 | ) | | $ | 903 | | | $ | (440,430 | ) |
| Net loss | | | — | | | | — | | | | — | | | | — | | | | — | | | | — | | | | — | | | | — | | | | — | | | | (171,548 | ) | | | (171,548 | ) | | | — | | | | (171,548 | ) |
| Change in net unrealized loss on derivative instruments | | | — | | | | — | | | | — | | | | — | | | | — | | | | — | | | | — | | | | — | | | | 2,146 | | | | — | | | | 2,146 | | | | — | | | | 2,146 | |
| Change in net unrealized loss on securities available for sale | | | — | | | | — | | | | — | | | | — | | | | — | | | | — | | | | — | | | | — | | | | 343,528 | | | | — | | | | 343,528 | | | | — | | | | 343,528 | |
| Issuance of stock – stock purchase plan | | | 36,324 | | | | 1 | | | | — | | | | — | | | | — | | | | — | | | | — | | | | 185 | | | | — | | | | — | | | | 186 | | | | — | | | | 186 | |
| Stock based compensation – fair value | | | 2,608,412 | | | | 3 | | | | — | | | | — | | | | — | | | | — | | | | — | | | | 2,429 | | | | — | | | | — | | | | 2,432 | | | | — | | | | 2,432 | |
| Issuance of stock | | | 3,000,000 | | | | 3 | | | | 2,000,000 | | | | 2 | | | | 2,000,000 | | | | 2 | | | | — | | | | 19,013 | | | | — | | | | — | | | | 19,020 | | | | — | | | | 19,020 | |
| Dividends accrued on preferred stock | | | — | | | | — | | | | — | | | | — | | | | — | | | | — | | | | — | | | | — | | | | — | | | | (7,162 | ) | | | (7,162 | ) | | | — | | | | (7,162 | ) |
| Balance at December 31, 2012 | | | 56,731,002 | | | $ | 57 | | | | 2,000,000 | | | $ | 2 | | | | 2,000,000 | | | $ | 2 | | | $ | 85,235 | | | $ | 1,102,227 | | | $ | (95,265 | ) | | $ | (1,344,989 | ) | | $ | (252,731 | ) | | $ | 903 | | | $ | (251,828 | ) |
The accompanying notes are an integral part of these financial statements.
76
TABLE OF CONTENTS
Gramercy Property Trust Inc.
Consolidated Statements of Stockholders’ Equity (Deficit) and Non-controlling Interests – (Continued)
(Amounts in thousands, except share data)
| | | | | | | | | | | | | | | | | | | | | | | | | | |
| | Common Stock | | Common Stock, Class B-1 | | Common Stock, Class B-2 | | Series A Preferred Stock | | Additional Paid-In-Capital | | Accumulated Other Comprehensive Income (Loss) | | Retained Earnings/
(Accumulated Deficit) | | Total
Gramercy Property Trust Inc. | | Non-controlling interest | | Total |
| | | Shares | | Par Value | | Shares | | Par Value | | Shares | | Par Value |
| Balance at December 31, 2012 | | | 56,731,002 | | | $ | 57 | | | | 2,000,000 | | | $ | 2 | | | | 2,000,000 | | | $ | 2 | | | $ | 85,235 | | | $ | 1,102,227 | | | $ | (95,265 | ) | | $ | (1,344,989 | ) | | $ | (252,731 | ) | | $ | 903 | | | $ | (251,828 | ) |
| Net income | | | — | | | | — | | | | — | | | | — | | | | — | | | | — | | | | — | | | | — | | | | — | | | | 384,827 | | | | 384,827 | | | | — | | | | 384,827 | |
| Change in net unrealized loss on derivative instruments | | | — | | �� | | — | | | | — | | | | — | | | | — | | | | — | | | | — | | | | — | | | | 9,914 | | | | — | | | | 9,914 | | | | — | | | | 9,914 | |
| Change in net unrealized gain on debt securities available for sale | | | — | | | | — | | | | — | | | | — | | | | — | | | | — | | | | — | | | | — | | | | (1,219 | ) | | | — | | | | (1,219 | ) | | | — | | | | (1,219 | ) |
| Change in net unrealized loss on securities available for sale | | | — | | | | — | | | | — | | | | — | | | | — | | | | — | | | | — | | | | — | | | | 23,083 | | | | — | | | | 23,083 | | | | — | | | | 23,083 | |
Gramercy Finance
disposal | | | — | | | | — | | | | — | | | | — | | | | — | | | | — | | | | — | | | | — | | | | 62,082 | | | | — | | | | 62,082 | | | | (42 | ) | | | 62,040 | |
| Conversion of Class B-1 & Class B-2 shares into common stock | | | 4,000,000 | | | | 4 | | | | (2,000,000 | ) | | | (2 | ) | | | (2,000,000 | ) | | | (2 | ) | | | — | | | | — | | | | — | | | | — | | | | — | | | | — | | | | — | |
| Issuance of stock | | | 11,535,200 | | | | 12 | | | | — | | | | — | | | | — | | | | — | | | | — | | | | 45,520 | | | | — | | | | — | | | | 45,532 | | | | — | | | | 45,532 | |
| Issuance of stock – stock purchase plan | | | 9,002 | | | | — | | | | — | | | | — | | | | — | | | | — | | | | — | | | | 13 | | | | — | | | | — | | | | 13 | | | | — | | | | 13 | |
| Stock based compensation – fair value(1) | | | (962,161 | ) | | | (2 | ) | | | — | | | | — | | | | — | | | | — | | | | — | | | | 2,136 | | | | — | | | | — | | | | 2,134 | | | | — | | | | 2,134 | |
| Liquidation of non- controlling interest | | | — | | | | — | | | | — | | | | — | | | | — | | | | — | | | | — | | | | — | | | | — | | | | — | | | | — | | | | (861 | ) | | | (861 | ) |
| Dividends accrued on preferred stock | | | — | | | | — | | | | — | | | | — | | | | — | | | | — | | | | — | | | | — | | | | — | | | | (7,162 | ) | | | (7,162 | ) | | | — | | | | (7,162 | ) |
| Balance at December 31, 2013 | | | 71,313,043 | | | $ | 71 | | | | — | | | $ | — | | | | — | | | $ | — | | | $ | 85,235 | | | $ | 1,149,896 | | | $ | (1,405 | ) | | $ | (967,324 | ) | | $ | 266,473 | | | $ | — | | | $ | 266,473 | |
| (1) | In the first quarter of 2013, the Company excluded unvested restricted share units from the outstanding share count. |
The accompanying notes are an integral part of these financial statements.
77
TABLE OF CONTENTS
Gramercy Property Trust Inc.
Consolidated Statements of Cash Flows
(Amounts in thousands)
| | | | | | |
| | Year ended December 31, |
| | | 2013 | | 2012 | | 2011 |
Operating Activities
| | | | | | | | | | | | |
| Net income (loss) | | $ | 384,827 | | | $ | (171,548 | ) | | $ | 337,477 | |
Adjustments to net cash provided by operating activities:
| | | | | | | | | | | | |
| Depreciation and amortization | | | 6,383 | | | | 1,195 | | | | 69,430 | |
| Amortization of leasehold interests | | | — | | | | — | | | | (2,698 | ) |
| Amortization of acquired leases to rental revenue | | | (65 | ) | | | (188 | ) | | | (54,420 | ) |
| Amortization of deferred costs | | | 175 | | | | 3,719 | | | | 4,749 | |
| Amortization of discount and other fees | | | (10,577 | ) | | | (25,704 | ) | | | (33,312 | ) |
| Payment of capitalized tenant leasing costs | | | — | | | | (61 | ) | | | (2,072 | ) |
| Payment for lease inducement costs | | | (2,630 | ) | | | — | | | | — | |
| Straight-line rent adjustment | | | (2,225 | ) | | | (188 | ) | | | (6,772 | ) |
| Non-cash impairment charges | | | 9,643 | | | | 206,122 | | | | 19,492 | |
| Gain on liquidation of non-controlling interest | | | (611 | ) | | | — | | | | — | |
| Net gain on sale of properties and lease terminations | | | — | | | | (15,915 | ) | | | (2,712 | ) |
| Impairment on business acquisition, net | | | — | | | | — | | | | (59 | ) |
| Net realized gain on loans | | | — | | | | 108 | | | | (16,643 | ) |
| Net realized gain on disposal of Gramercy Finance | | | (389,140 | ) | | | — | | | | — | |
| Distributions from joint ventures | | | 7,985 | | | | — | | | | — | |
| Equity in net loss of joint ventures | | | 6,466 | | | | 8,515 | | | | 1,977 | |
| Gain on extinguishment of debt | | | — | | | | — | | | | (300,909 | ) |
| Amortization of stock compensation | | | 2,149 | | | | 2,433 | | | | 2,243 | |
| Provision for loan losses | | | — | | | | (7,181 | ) | | | 48,180 | |
| Unrealized gain on derivative instruments | | | 115 | | | | — | | | | 16 | |
Net realized loss on sale of joint venture investment to a director related
entity | | | (1,317 | ) | | | — | | | | — | |
Changes in operating assets and liabilities:
| | | | | | | | | | | | |
| Restricted cash | | | (1,108 | ) | | | 412 | | | | 2,803 | |
| Tenant and other receivables | | | 588 | | | | (2,803 | ) | | | 27,693 | |
| Accrued interest | | | 5,780 | | | | 12,393 | | | | 1,097 | |
| Other assets | | | 13,710 | | | | (11,285 | ) | | | 8,896 | |
| Accounts payable, accrued expenses and other liabities | | | (2,362 | ) | | | 777 | | | | 22,306 | |
| Deferred revenue | | | 1,617 | | | | (518 | ) | | | (39,657 | ) |
| Net cash provided by operating activities | | | 29,403 | | | | 283 | | | | 87,105 | |
Investing Activities
| | | | | | | | | | | | |
| Capital expenditures and leasehold costs | | | (8,345 | ) | | | (2,649 | ) | | | (7,752 | ) |
| Payment for acquistions of real estate investments | | | (283,148 | ) | | | (27,125 | ) | | | — | |
| Proceeds from sale of joint venture investment | | | — | | | | — | | | | 387 | |
| Proceeds from sale of securities available for sale | | | — | | | | — | | | | 65,584 | |
| Proceeds from sale of joint venture investment to a director related entity | | | 8,275 | | | | — | | | | — | |
| Proceeds from sale of real estate | | | — | | | | 77,257 | | | | 22,895 | |
| Proceeds from disposal of Gramercy Finance | | | 6,291 | | | | — | | | | — | |
| New loan investment originations and funded commitments | | | — | | | | (19,295 | ) | | | (293,450 | ) |
| Principal collections on investments | | | 34,990 | | | | 254,789 | | | | 329,975 | |
| Proceeds from loan syndications | | | — | | | | 15,300 | | | | — | |
| Investment in commercial mortgage-backed securities | | | — | | | | (535 | ) | | | (84,871 | ) |
| Distribution received from joint ventures | | | 21,642 | | | | 411 | | | | 668 | |
| Investment in joint ventures | | | (1,750 | ) | | | (58,911 | ) | | | 372 | |
| Change in accrued interest income | | | — | | | | — | | | | 71 | |
| Proceeds from repayments of servicing advance receivable | | | 5,953 | | | | — | | | | — | |
| Sale of marketable investments | | | — | | | | — | | | | 6,560 | |
| Change in restricted cash from investing activities | | | — | | | | 7,887 | | | | 8,271 | |
| Deferred investment costs | | | — | | | | 1,159 | | | | 2,423 | |
| Net cash provided by (used by) investing activities | | | (216,092 | ) | | | 248,288 | | | | 51,133 | |
The accompanying notes are an integral part of these financial statements.
78
TABLE OF CONTENTS
Gramercy Property Trust Inc.
Consolidated Statements of Cash Flows – (Continued)
(Amounts in thousands)
| | | | | | |
| | Year ended December 31, |
| | | 2013 | | 2012 | | 2011 |
Financing Activities
| | | | | | | | | | | | |
| Distribution to non-controlling interest holders | | | (250 | ) | | | — | | | | — | |
| Purchase of interest rate caps | | | — | | | | — | | | | (1,277 | ) |
| Repayment of collateralized debt obligations | | | (85,912 | ) | | | (282,548 | ) | | | (164,977 | ) |
| (Repurchase) issuance of collateralized debt obligations | | | — | | | | — | | | | (33,997 | ) |
| Proceeds from mortgage note payables | | | 67,255 | | | | — | | | | — | |
| Repayment of mortgage notes | | | (771 | ) | | | — | | | | (33,315 | ) |
| Proceeds from stock options excerised | | | — | | | | — | | | | 160 | |
| Cash transfer pursuant to Settlement Agreement | | | — | | | | — | | | | (37,148 | ) |
| Proceeds from secured credit faciliity | | | 45,000 | | | | — | | | | — | |
| Proceeds from acquisition financing | | | — | | | | — | | | | — | |
| Deferred financing costs and other liabilities | | | (3,546 | ) | | | — | | | | (3,742 | ) |
| Net proceeds of sale of common stock | | | 45,532 | | | | 2,555 | | | | — | |
| Proceeds from sale of repurchased bonds | | | 34,364 | | | | — | | | | — | |
| Change in restricted cash from financing activities | | | 22,948 | | | | (26,901 | ) | | | 78,938 | |
| Net cash (used by) provided by financing activities | | | 124,620 | | | | (306,894 | ) | | | (195,358 | ) |
| Net (decrease) increase in cash and cash equivalents | | | (62,069 | ) | | | (58,323 | ) | | | (57,120 | ) |
| Cash and cash equivalents at beginning of period | | | 105,402 | | | | 163,725 | | | | 220,845 | |
| Cash and cash equivalents at end of period | | $ | 43,333 | | | $ | 105,402 | | | $ | 163,725 | |
Non-cash activity
| | | | | | | | | | | | |
| Deferred gain (loss) and other non-cash activity related to derivatives | | $ | — | | | $ | — | | | $ | (19,334 | ) |
| Land acquired for consideration of a note payable | | $ | 4,839 | | | $ | — | | | $ | — | |
| Debt assumed in acquisition of real estate | | $ | 53,889 | | | $ | — | | | $ | — | |
| Mortgage loans, mezzanine loans and related interest satisfied in connection with deed-in-lieu of foreclosure and settlement agreement | | $ | — | | | $ | — | | | $ | 721,404 | |
| Non-cash assets transferred in connection with deed-in-lieu of foreclosure and settlement agreement | | $ | — | | | $ | — | | | $ | 2,776,447 | |
| Mortgages and liabilities transferred in connection with deed-in-lieu of foreclosure and settlement agreement | | $ | — | | | $ | — | | | $ | 2,378,324 | |
Supplemental cash flow disclosures
| | | | | | | | | | | | |
| Interest paid | | $ | 17,902 | | | $ | 67,110 | | | $ | 140,687 | |
| Income taxes paid | | $ | 9,237 | | | $ | 5,624 | | | $ | 955 | |
The accompanying notes are an integral part of these financial statements.
79
TABLE OF CONTENTS
Gramercy Property Trust Inc.
Notes To Consolidated Financial Statements
(Amounts in thousands, except share and per share data)
December 31, 2013
1. Business and Organization
Gramercy Property Trust Inc., or the Company, is a fully-integrated, self-managed commercial real estate investment company focused on acquiring and managing income-producing industrial and office properties net leased to high quality tenants in major markets throughout the United States. The Company also operates an asset management business that manages for third-parties, including the Company’s Bank of America Portfolio joint venture, commercial real estate assets.
The Company was founded in 2004 as a specialty finance Real Estate Investment Trust, or REIT, focused on originating and acquiring loans and securities related to commercial and multifamily properties. In July 2012, following a strategic review, the Company’s board of directors announced a repositioning of the Company as an equity REIT focused on acquiring and managing income producing net leased real estate. To reflect this transformation, in April 2013 the Company changed its name from Gramercy Capital Corp. to Gramercy Property Trust Inc. and began trading on the New York Stock Exchange under the new symbol GPT.
The Company seeks to acquire and manage a diversified portfolio of high quality net leased properties that generates stable, predictable cash flows and protects investor capital over a long investment horizon. The Company expects that these properties generally will be leased to a single tenant. Under a net lease, the tenant typically bears the responsibility for all property related expenses such as real estate taxes, insurance, and repair and maintenance costs. This lease structure provides an owner cash flows over the term of the lease that are more stable and predictable than other forms of leases, and minimizes the ongoing capital expenditures often required with other property types.
The Company approaches the net leased market as a value investor, looking to identify and acquire net leased properties that offer attractive risk adjusted returns throughout market cycles. The Company focuses primarily on industrial and office properties, in major markets where strong demographic and economic growth offer, a higher probability of producing long term rent growth and/or capital appreciation.
As of December 31, 2013, the Company owns, either directly or in joint ventures, a portfolio of 107 net leased industrial and office properties with 99% occupancy. Tenants include Bank of America, N.A, Kar Auction Services, E.F. Transit, Amcor Rigid Plastics USA, Preferred Freezer Services of Hialeah LLC and others. As of that date, the Company’s asset management business, which operates under the name Gramercy Asset Management, manages for third-parties approximately $1,400,000 of commercial real estate assets.
During the year ended December 31, 2013, the Company acquired 29 properties aggregating approximately 3,892,000 square feet for a total purchase price of approximately $340,786.
The Company has elected to be taxed as a real estate investment trust, or REIT, under the Internal Revenue Code of 1986, as amended, or the Internal Revenue Code, and generally will not be subject to U.S. federal income taxes to the extent it distributes its taxable income, if any, to its stockholders. The Company has in the past established, and may in the future establish taxable REIT subsidiaries, or TRSs, to effect various taxable transactions. Those TRSs would incur U.S. federal, state and local taxes on the taxable income from their activities.
The Company conducts substantially all of its operations through its operating partnership, GPT Property Trust LP, or the Operating Partnership. The Company is the sole general partner of its Operating Partnership. The Company’s Operating Partnership conducts its commercial real estate investment business through various wholly-owned entities and its realty management business primarily through a wholly-owned TRS.
On March 15, 2013, the Company disposed of its Gramercy Finance segment and exited the commercial real estate finance business. The disposal was completed pursuant a purchase and sale agreement to transfer the collateral management and subspecial servicing agreements for the Company’s three Collateralized Debt Obligations, CDO 2005-1, CDO 2006-1 and CDO 2007-1, or the CDOs, to CWCapital Investments LLC or
80
TABLE OF CONTENTS
Gramercy Property Trust Inc.
Notes To Consolidated Financial Statements
(Amounts in thousands, except share and per share data)
December 31, 2013
1. Business and Organization – (continued)
CWCapital for $6,291, in cash after expenses. The Company retained its non-investment grade subordinate bonds, preferred shares and ordinary shares, or the Retained CDO Bonds, which may provide the Company with the potential to recoup additional proceeds over the remaining life of the CDOs based upon resolution of underlying assets within the CDOs. However, there is no guarantee that the Company will realize any proceeds from the Retained CDO Bonds, or what the timing of these proceeds may be. The carrying value of the Retained CDO Bonds as of December 31, 2013 is approximately $6,762. In February 2013, the Company also sold a portfolio of repurchased notes previously issued by two of its three CDOs, generating cash proceeds of $34,381. In addition, the Company expects to receive additional cash proceeds for past CDO servicing advances including accrued interest at the prime rate of 3.25%, when specific assets within the CDOs are liquidated. For the year ended December 31, 2013, the Company received reimbursements of $6,055 and the carrying value of the receivable for servicing advance reimbursements as of December 31, 2013 is $8,758, including accrued interest. On March 15, 2013, the Company deconsolidated the assets and liabilities of Gramercy Finance from the Company’s Condensed Consolidated Financial Statements and recognized a gain on the disposal of $389,140 within discontinued operations. For a further discussion regarding the disposal of the Gramercy Finance segment see Note 3 “Dispositions and Assets Held-for-Sale”.
2. Significant Accounting Policies
Reclassification
Certain prior year balances have been reclassified to conform with the current year presentation for assets classified as discontinued operations. Certain reclassifications were made to the Consolidated Balance Sheets, Consolidated Statements of Operations and Comprehensive Income (Loss) and footnote disclosures for all periods presented to reflect held-for-sale and discontinued operations as of December 31, 2013.
Principles of Consolidation
The Consolidated Financial Statements include the Company’s accounts and those of the Company’s subsidiaries which are wholly-owned or controlled by the Company, or entities which are variable interest entities, or VIEs, in which the Company is the primary beneficiary. The primary beneficiary is the party that absorbs a majority of the VIE’s anticipated losses and/or a majority of the expected returns. The Company has evaluated its investments for potential classification as variable interests by evaluating the sufficiency of each entity’s equity investment at risk to absorb losses. As of December 31, 2012, the Company had consolidated its three CDOs, which were classified as held-for-sale VIEs. On March 15, 2013, following the disposal of the Gramercy Finance segment as more fully discussed in Note 1, the CDOs were deconsolidated as the Company determined that it was no longer the primary beneficiary of the VIEs. For further discussion on the deconsolidation of the CDOs, see the discussion on VIEs below.
Entities which the Company does not control and are considered VIEs, but where the Company is not the primary beneficiary are accounted for under the equity method. All significant intercompany balances and transactions have been eliminated.
Real Estate Investments
The Company records acquired real estate investments as business combinations when the real estate is occupied, at least in part, at acquisition. Costs directly related to the acquisition of such investments are expensed as incurred. The Company allocates the purchase price of real estate to land, building, improvements and intangibles, such as the value of above- and below-market leases and origination costs associated with the in-place leases at the acquisition date. The values of the above- and below-market leases are amortized and recorded as either an increase in the case of below-market leases or a decrease in the case of above-market leases to rental revenue over the remaining term of the associated lease. The values associated with in-place leases are amortized to depreciation and amortization expense over the remaining term of the associated lease.
81
TABLE OF CONTENTS
Gramercy Property Trust Inc.
Notes To Consolidated Financial Statements
(Amounts in thousands, except share and per share data)
December 31, 2013
2. Significant Accounting Policies – (continued)
The Company assesses the fair value of the leases at acquisition based upon estimated cash flow projections that utilize appropriate discount and available market information. Estimates of future cash flows are based on a number of factors including the historical operating results, known trends, and market/economic conditions that may affect the property. To the extent acquired leases contain fixed rate renewal options that are below-market and determined to be material, the Company amortizes such below-market lease value into rental revenue over the renewal period.
Acquired real estate investments that do not meet the definition of a business combination are recorded at cost. Acquired real estate investments which are under construction are considered build-to-suit transactions and are also recorded at cost. In build-to-suit transactions, the Company engages a developer to construct a property or provide funds to a tenant to develop a property. The Company capitalizes the funds provided to the developer/tenant and the internal costs of interest and real estate taxes, if applicable, during the construction period.
Certain improvements are capitalized when they are determined to increase the useful life of the building. Depreciation is computed using the straight-line method over the shorter of the estimated useful life at acquisition of the capitalized item or 40 years for buildings, five to ten years for building equipment and fixtures, and the lesser of the useful life or the remaining lease term for tenant improvements and leasehold interests. Maintenance and repair expenditures are charged to expense as incurred.
In leasing space, the Company may provide funding to the lessee through a tenant allowance. In accounting for tenant allowances, the Company determines whether the allowance represents funding for the construction of leasehold improvements and evaluates the ownership of such improvements. If the Company is considered the owner of the leasehold improvements, the Company capitalizes the amount of the tenant allowance and depreciates it over the shorter of the useful life of the leasehold improvements or the lease term. If the tenant allowance represents a payment for a purpose other than funding leasehold improvements, or in the event the Company is not considered the owner of the improvements for accounting purposes, the allowance is considered to be a lease incentive and is recognized over the lease term as a reduction of rental revenue. Factors considered during this evaluation usually include (i) who holds legal title to the improvements, (ii) evidentiary requirements concerning the spending of the tenant allowance, and (iii) other controlling rights provided by the lease agreement (e.g. unilateral control of the tenant space during the build-out process). Determination of the accounting for a tenant allowance is made on a case-by-case basis, considering the facts and circumstances of the individual tenant lease.
The Company also reviews the recoverability of the property’s carrying value when circumstances indicate a possible impairment of the value of a property. The review of recoverability is based on an estimate of the future undiscounted cash flows, excluding interest charges, expected to result from the property’s use and eventual disposition. These estimates consider factors such as changes in strategy resulting in an increased or decreased holding period, expected future operating income, market and other applicable trends and residual value, as well as the effects of leasing demand, competition and other factors. If management determines impairment exists due to the inability to recover the carrying value of a property, an impairment loss is recorded to the extent that the carrying value exceeds the estimated fair value of the property for properties to be held and used and for assets held for sale, an impairment loss is recorded to the extent that the carrying value exceeds the fair value less estimated cost to dispose. These assessments are recorded as an impairment loss in the Consolidated Statements of Operations and Comprehensive Income (Loss) in the period the determination is made. The estimated fair value of the asset becomes its new cost basis. For a depreciable long-lived asset to be held and used, the new cost basis will be depreciated or amortized over the remaining useful life of that asset.
82
TABLE OF CONTENTS
Gramercy Property Trust Inc.
Notes To Consolidated Financial Statements
(Amounts in thousands, except share and per share data)
December 31, 2013
2. Significant Accounting Policies – (continued)
Investments in Joint Ventures
The Company accounts for its investments in joint ventures under the equity method of accounting since it exercises significant influence, but does not unilaterally control the entities, and is not considered to be the primary beneficiary. In the joint ventures, the rights of the other investors are protective and participating. Unless the Company is determined to be the primary beneficiary, these rights preclude it from consolidating the investments. The investments are recorded initially at cost as an investment in joint ventures, and subsequently are adjusted for equity interest in net income (loss) and cash contributions and distributions. The amount of the investments on the Consolidated Balance Sheets is evaluated for impairment at each reporting period. None of the joint venture debt is recourse to the Company. As of December 31, 2013 and 2012, the Company had equity investments of $39,385 and $72,742 in unconsolidated joint ventures at December 31, 2013 and 2012, respectively.
Cash and Cash Equivalents
The Company considers all highly liquid investments with maturities of three months or less when purchased to be cash equivalents.
Restricted Cash
The Company has restricted cash of $179 and $12 at December 31, 2013 and 2012, respectively, which includes cash held in escrow in connection with property acquisitions and reserves for certain capital improvements, leasing, interest and real estate tax and insurance payments as required by certain mortgage loan obligations.
Variable Interest Entities
The Company had no consolidated VIEs as of December 31, 2013. The following is a summary of the Company’s involvement with unconsolidated VIEs as of December 31, 2013:
| | | | | | | | |
| | Company carrying
value – assets | | Company carrying
value – liabilities | | Face value of assets held
by the VIEs | | Face value of liabilities issued
by the VIEs |
Assets
| | | | | | | | | | | | | | | | |
| Unconsolidated VIEs | | | | | | | | | | | | | | | | |
| Retained CDO Bonds(1) | | $ | 6,762 | (1) | | $ | — | | | $ | 2,156,218 | | | $ | 1,948,901 | |
| (1) | Retained CDO Bonds were previously eliminated in consolidation. |
The following is a summary of the Company’s involvement with VIEs as of December 31, 2012:
| | | | | | | | |
| | Company carrying
value – assets | | Company carrying
value – liabilities | | Face value of assets held
by the VIE | | Face value of liabilities issued
by the VIE |
Liabilities of assets held for sale
| | | | | | | | | | | | | | | | |
| Consolidated VIEs | | | | | | | | | | | | | | | | |
| Collateralized debt obligations | | $ | 1,913,353 | (1) | | $ | 2,374,516 | | | $ | 2,469,856 | | | $ | 2,593,392 | |
| (1) | Collateralized debt obligations are a component of non-recourse liabilities of consolidated VIEs held for sale on the Consolidated Balance Sheets. |
Consolidated VIEs
Collateralized Debt Obligations
On March 15, 2013, as a result of the disposal of the Gramercy Finance segment as more fully described in Note 1, the Company deconsolidated three VIEs, the CDOs. The Company was the collateral manager of
83
TABLE OF CONTENTS
Gramercy Property Trust Inc.
Notes To Consolidated Financial Statements
(Amounts in thousands, except share and per share data)
December 31, 2013
2. Significant Accounting Policies – (continued)
the three CDOs and in its capacity as collateral manager the Company made decisions related to the collateral that most significantly impacted the economic outcome of the CDOs, which was the basis upon which the Company concluded that it was the primary beneficiary of the CDOs as of December 31, 2012. In connection with the disposal of Gramercy Finance, the Company transferred the collateral management and sub-special servicing agreements for its three CDOs to CWCapital, thereby removing the Company as the collateral manager and its ability to make any and all decisions related to the collateral, including those that would most significantly impact the economic outcome of the CDOs. As of March 15, 2013, the Company had no continuing involvement with the collateral to the CDOs, and as a result, the Company determined that it was no longer the primary beneficiary of the CDOs, and therefore deconsolidated the CDOs.
The Company has retained its subordinate debt and equity ownership, or the Retained CDO Bonds, in the CDOs, which were previously eliminated in consolidation and were not sold as part of the disposal of Gramercy Finance. The Retained CDO Bonds may provide the potential for the Company to receive continuing cash flows in the future, however, there is no guarantee that the Company will realize any proceeds from the Retained CDO Bonds, or what the timing of these proceeds might be. These interests have been recognized at fair value as the Retained CDO Bonds on the Consolidated Balance Sheets. For further discussion of the measurement of fair value of the Retained CDO Bonds see Note 11.
Unconsolidated VIEs
Investment in Retained CDO Bonds
As further discussed above, on March 15, 2013, the Company recognized an asset in Retained CDO Bonds in connection with the disposal of the Gramercy Finance segment. The Company is not obligated to provide any financial support to these CDOs. The Company’s maximum exposure to loss is limited to its interest in the Retained CDO Bonds and the Company does not control the activities that most significantly impact the VIEs’ economic performance.
Assets Held for Sale
As of December 31, 2013, the Company had no assets classified as held for sale.
As of December 31, 2012, in connection with the Company’s efforts to exit Gramercy Finance and the commercial real estate finance business, the Company classified the assets and liabilities of Gramercy Finance as held-for-sale. As of December 31, 2012, the Company had assets classified as held for sale of $1,952,264 related to the disposal of Gramercy Finance. For the year ended December 31, 2012, the Company recorded impairment charges of $27,180 within discontinued operations on loans and real estate investments owned to adjust the carrying value to the lower of cost or fair value and other-than-temporary impairments of $128,087 within discontinued operations as the Company no longer could express the intent to hold CMBS investments until the recovery of amortized cost for all CMBS in an unrealized loss position. On March 15, 2013, the Company completed the disposal of Gramercy Finance. For a further discussion regarding the measurement of financial instruments and real estate assets of the Gramercy Finance segment see Note 11 for the discussion on the valuation and Note 3 and Note 6 for the discussion on the disposal of the assets and liabilities related to the assets of Gramercy Finance.
Real estate investments to be disposed of are reported at the lower of carrying amount or estimated fair value, less costs to sell. Once an asset is classified as held-for-sale, depreciation expense is no longer recorded and current and prior periods are reclassified as discontinued operations. As of December 31, 2013 and 2012, the Company had real estate investments held-for-sale of $0 and $88,806, respectively. The Company recorded impairment charges of $0, $35,043 and $1,237 during the years ended December 31, 2013, 2012 and 2011, respectively, within discontinued operations related to real estate investments classified as held-for-sale.
84
TABLE OF CONTENTS
Gramercy Property Trust Inc.
Notes To Consolidated Financial Statements
(Amounts in thousands, except share and per share data)
December 31, 2013
2. Significant Accounting Policies – (continued)
Settlement of Debt
A gain on settlement of debt is recorded when the carrying amount of the liability settled exceeds the fair value of the assets transferred to the lender or special servicer. In 2013 and 2012, the Company did not recognize any gain on settlement of debt.
Pursuant to the execution of the Settlement Agreement, the transfer of 867 Gramercy Asset Management properties, with an aggregate carrying value of $2,631,902 and associated mortgage, mezzanine and other liabilities of $2,843,345, occurred in September and December 2011 and the Company recognized a gain on settlement of debt of $285,634 in connection with such transfer as part of discontinued operations on the Consolidated Statements of Operations and Comprehensive Income (Loss). The gain on settlement of debt includes $54,083 of gain on disposal of assets. During the year ended December 31, 2011, the Company recorded $2,489 of legal and professional fees related to the restructuring of the Goldman Mortgage Loan and the Goldman Mezzanine Loans in the Consolidated Statements of Operations and Comprehensive Income (Loss).
In July 2011, the Dana portfolio, which consisted of 15 properties totaling approximately 3,800,000 rentable square feet, was transferred to its mortgage lender through a deed in lieu of foreclosure. The Company recognized gain on settlement of debt of $74,191 for the year ended December 31, 2011 as part of discontinued operations on the Consolidated Statements of Operations and Comprehensive Income (Loss). The Company realized a $15,892 gain on the disposal the assets, which is included in the gain on settlement of debt.
Tenant and Other Receivables
Tenant and other receivables are derived from management fees, rental revenue and tenant reimbursements.
Management fees, including incentive management fees, are recognized as earned in accordance with the terms of the management agreements. The management agreements may contain provisions for fees related to dispositions, administration of the assets including fees related to accounting, valuation and legal services, and management of capital improvements or projects on the underlying assets.
Rental revenue is recorded on a straight-line basis over the initial term of the lease. Since many leases provide for rental increases at specified intervals, straight-line basis accounting requires the Company to record a receivable, and include in revenues, unbilled rent receivables that will only be received if the tenant makes all rent payments required through the expiration of the initial term of the lease. Tenant and other receivables also include receivables related to tenant reimbursements for common area maintenance expenses and certain other recoverable expenses that are recognized as revenue in the period in which the related expenses are incurred.
Tenant and other receivables are recorded net of the allowances for doubtful accounts, which as of December 31, 2013 and 2012 were $449 and $211, respectively. The Company continually reviews receivables related to rent, tenant reimbursements, management fees, including incentive fees, and unbilled rent receivables and determines collectability by taking into consideration the tenant or asset management clients’ payment history, the financial condition of the tenant or asset management client, business conditions in the industry in which the tenant or asset management client operates and economic conditions in the area in which the property or asset management client is located. In the event that the collectability of a receivable is in doubt, the Company increases the allowance for doubtful accounts or records a direct write-off of the receivable.
85
TABLE OF CONTENTS
Gramercy Property Trust Inc.
Notes To Consolidated Financial Statements
(Amounts in thousands, except share and per share data)
December 31, 2013
2. Significant Accounting Policies – (continued)
Servicing Advances Receivable
Servicing advances receivable is comprised of the accrual for the reimbursement of servicing advances recognized as part of the disposal of Gramercy Finance in March 2013. The accrual for reimbursement of servicing advances incurred while the Company was the collateral manager of the CDOs includes expenses such as legal fees incurred to negotiate modifications and foreclosures on loan investments, professional fees incurred on certain loans, or fees for services such as appraisals obtained on real estate properties that served as collateral for loan investments. These reimbursement proceeds will be realized when the related assets within the CDOs are liquidated in accordance with the terms of the collateral management and sub-special servicing agreements, which were sold in connection with the disposal of Gramercy Finance. The Company has no control over the timing of the resolution of the related assets, however, the Company earns accrued interest at the prime rate for the time that these reimbursements are outstanding. For the year ended December 31, 2013 the Company received reimbursements of $6,055. As of December 31, 2013, the servicing advances receivable is $8,758.
The Company reviews the servicing advances receivable on a quarterly basis and determines collectability by reviewing the expected resolution and timing of the underlying assets of the CDOs. As of December 31, 2013, the Company has reviewed the outstanding servicing advances and has determined that all amounts are collectible.
Retained CDO Bonds
The Retained CDO Bonds are non-investment grade subordinate bonds, preferred shares and ordinary shares of three CDO’s, which the Company recognized at fair value in March 2013 in conjunction with the disposal of Gramercy Finance. Management estimated the timing and amount of cash flows expected to be collected and recognized an investment in the Retained CDO Bonds equal to the net present value of these discounted cash flows. There is no guarantee that the Company will realize any proceeds from this investment, or what the timing of investment income for the expected remaining life of the Retained CDO Bonds. The Company considers these investments to be not of high credit quality and does not expect a full recovery of interest and principal. Therefore, the Company has suspended interest income accruals on these investments. On a quarterly basis, the Company evaluates the Retained CDO Bonds to determine whether significant changes in estimated cash flows or unrealized losses on these investments, if any, reflect a decline in value which is other-than-temporary. If there is a decrease in estimated cash flows and the investment is in an unrealized loss position, the Company will record an other-than-temporary impairment in the Consolidated Statements of Operations and Comprehensive Income (Loss). To determine the component of the other-than-temporary impairment related to expected credit losses, the Company compares the amortized cost basis of the Retained CDO Bonds to the present value of the revised expected cash flows, discounted using the pre-impairment yield. Conversely, if the security is in an unrealized gain position and there is a decrease or significant increase in expected cash flows, the Company will prospectively adjust the yield using the effective yield method.
86
TABLE OF CONTENTS
Gramercy Property Trust Inc.
Notes To Consolidated Financial Statements
(Amounts in thousands, except share and per share data)
December 31, 2013
2. Significant Accounting Policies – (continued)
For the year ended December 31, 2013, the Company recognized an other-than-temporary impairment, or OTTI, of $2,002, respectively, on its Retained CDO Bonds. The Company’s Retained CDO Bonds have been in an unrealized loss position for less than twelve months. A summary of the Company’s Retained CDO Bonds as of December 31, 2013 is as follows:
| | | | | | | | | | | | | | |
| Description | | Number of Securities | | Face
Value | | Amortized Cost | | Gross Unrealized Gain (Loss) | | Other-than-temporary impairment | | Fair
Value | | Weighted Average Expected Life |
Available for Sale, Non-investment Grade:
| | | | | | | | | | | | | | | | | | | | | | | | | | | | |
| Retained CDO Bonds | | | 9 | | | $ | 356,711 | | | $ | 7,981 | | | $ | (1,219 | ) | | $ | 2,002 | | | $ | 6,762 | | | | 5.6 years | |
| Total | | | 9 | | | $ | 356,711 | | | $ | 7,981 | | | $ | (1,219 | ) | | $ | 2,002 | | | $ | 6,762 | | | | 5.6 years | |
The following table summarizes the activity related to credit losses on the Retained CDO Bonds for the year ended December 31, 2013:
| | |
| Balance as of December 31, 2012 of credit losses on Retained CDO Bonds for which a portion of an OTTI was recognized in other comprehensive income | | $ | — | |
Additions to credit losses:
| | | | |
| On Retained CDO Bonds for which an OTTI was not previously recognized | | | 1,682 | |
| On Retained CDO Bonds for which an OTTI was previously recognized and a portion of an other-than-temporary impairment was recognized in other comprehensive income | | | 320 | |
| On Retained CDO Bonds for which an OTTI was previously recognized without any portion of other-than-temporary impairment recognized in other comprehensive income | | | — | |
| Reduction for credit losses: | | | — | |
| On Retained CDO Bonds for which no other-than-temporary impairment was recognized in other comprehensive income at current measurement date | | | — | |
| On Retained CDO Bonds sold during the period | | | — | |
| On Retained CDO Bonds charged off during the period | | | — | |
| For increases in cash flows expected to be collected that are recognized over the remaining life of the Retained CDO Bonds | | | — | |
| Balance as of December 31, 2013 of credit losses on Retained CDO Bonds for which a portion of an OTTI was recognized in other comprehensive income | | $ | 2,002 | |
Intangible Assets and Liabilities
The Company follows the acquisition method of accounting for business combinations. The Company allocates the purchase price of acquired properties to tangible and identifiable intangible assets acquired based on their respective fair values. Tangible assets include land, buildings and improvements on an as-if vacant basis. The Company utilizes various estimates, processes and information to determine the as-if vacant property value. Estimates of value are made using customary methods, including data from appraisals, comparable sales, discounted cash flow analyses and other methods. Identifiable intangible assets include amounts allocated to acquired leases for above- and below-market lease rates and the value of in-place leases. Management also considers information obtained about each property as a result of its pre-acquisition due diligence in estimating the fair value of the tangible and intangible assets and liabilities acquired.
87
TABLE OF CONTENTS
Gramercy Property Trust Inc.
Notes To Consolidated Financial Statements
(Amounts in thousands, except share and per share data)
December 31, 2013
2. Significant Accounting Policies – (continued)
Above-market and below-market lease values for properties acquired are recorded based on the present value (using an interest rate which reflects the risks associated with the leases acquired) of the difference between the contractual amount to be paid pursuant to each in-place lease and management’s estimate of the fair market lease rate for each such in-place lease, measured over a period equal to the remaining non-cancelable term of the lease. The above-market lease values are amortized as a reduction of rental revenue over the remaining non-cancelable terms of the respective leases. The below-market lease values are amortized as an increase to rental revenue over the initial term of the respective leases. If a tenant terminates its lease prior to its contractual expiration and no future rental payments will be received, any unamortized balance of the market lease intangibles will be written off to rental revenue.
The aggregate value of intangible assets related to in-place leases is primarily the difference between the property valued with existing in-place leases adjusted to market rental rates and the property valued as-if vacant. Factors considered by management in its analysis of the in-place lease intangibles include an estimate of carrying costs during the expected lease-up period for each property taking into account current market conditions and costs to execute similar leases. In estimating carrying costs, management includes real estate taxes, insurance and other operating expenses and estimates of lost rentals at market rates during the anticipated lease-up period, which is expected to average six months. Management also estimates costs to execute similar leases including leasing commissions and other related expenses. The value of in-place leases is amortized to depreciation and amortization expense over the remaining non-cancelable term of the respective leases. In no event does the amortization period for intangible assets exceed the remaining depreciable life of the building. If a tenant terminates its lease prior to its contractual expiration and no future rental payments will be received, any unamortized balance of the in-place lease intangible would be written off to depreciation and amortization expense.
Intangible assets and acquired lease obligations consist of the following:
| | | | |
| | December 31, 2013 | | December 31, 2012 |
Intangible assets:
| | | | | | | | |
In-place leases, net of accumulated amortization of $1,318
and $359 | | $ | 32,773 | | | $ | 3,639 | |
Above-market leases, net of accumulated amortization of
$278 and $48 | | | 8,187 | | | | 935 | |
| Amounts related to assets held for sale, net of accumulated amortization of $0 and $365 | | | — | | | | (188 | ) |
| Total intangible assets | | $ | 40,960 | | | $ | 4,386 | |
Intangible liabilities:
| | | | | | | | |
Below-market leases, net of accumulated amortization of $300
and $1,395 | | $ | 6,077 | | | $ | 2,161 | |
| Amounts related to liabilities held for sale, net of accumulated amortization of $0 and $1,391 | | | — | | | | (1,703 | ) |
| Total intangible liabilities | | $ | 6,077 | | | $ | 458 | |
88
TABLE OF CONTENTS
Gramercy Property Trust Inc.
Notes To Consolidated Financial Statements
(Amounts in thousands, except share and per share data)
December 31, 2013
2. Significant Accounting Policies – (continued)
The following table provides the weighted-average amortization period as of December 31, 2013 for intangible assets and liabilities and the projected amortization expense for the next five years.
| | | | | | | | | | | | |
| | Weighted-Average Amortization Period | | 2014 | | 2015 | | 2016 | | 2017 | | 2018 |
| In-place leases | | | 12.3 | | | $ | 2,986 | | | $ | 2,986 | | | $ | 2,986 | | | $ | 2,986 | | | $ | 2,986 | |
| Total to be included in depreciation and amorization expense | | | | | | $ | 2,986 | | | $ | 2,986 | | | $ | 2,986 | | | $ | 2,986 | | | $ | 2,986 | |
| Above-market lease assets | | | 10.6 | | | $ | 843 | | | $ | 843 | | | $ | 843 | | | $ | 843 | | | $ | 843 | |
| Below-market lease liabilities | | | 13.5 | | | | (507 | ) | | | (507 | ) | | | (507 | ) | | | (507 | ) | | | (507 | ) |
| Total to be included as a reduction to rental revenue | | | | | | $ | 336 | | | $ | 336 | | | $ | 336 | | | $ | 336 | | | $ | 336 | |
The Company recorded $1,291, $80 and $23,374 of amortization of intangible assets as part of depreciation and amortization, including $3, $50 and $23,374 within discontinued operations for the years ended December 2013, 2012, and 2011, respectively. The Company recorded ($64), $188, and $54,420 of amortization of intangible assets and liabilities as an increase (decrease) to rental revenue, including ($34), $196 and $54,420 within discontinued operations for the years ended December 2013, 2012, and 2011, respectively.
Deferred Costs
Deferred costs include deferred financing costs that represent commitment fees, legal and other third-party costs associated with obtaining commitments for financing which result in a closing of such financing. These costs are amortized over the terms of the respective agreements and the amortization is reflected as interest expense. Unamortized deferred financing costs are expensed when the associated debt is refinanced or repaid before maturity. Costs incurred in seeking financing transactions that do not close are expensed in the period in which it is determined that the financing will not close.
The Company has deferred certain expenditures related to the leasing of certain properties. Direct costs of leasing are deferred and amortized over the terms of the underlying leases.
Other Assets
The Company makes payments for certain expenses such as insurance and property taxes in advance of the period in which it receives the benefit. These payments are classified as other assets and amortized over the respective period of benefit relating to the contractual arrangement. The Company also escrows deposits related to pending acquisitions and financing arrangements, as required by a seller or lender, respectively. Costs prepaid in connection with securing financing for a property are reclassified into deferred financing costs at the time the transaction is completed.
The Company capitalizes its costs of software purchased for internal use and once the software is placed into service, the costs are amortized into expense on a straight-line basis over the assets' estimated useful life, which is generally three years. During the years ended December 31, 2013 and 2012, the Company had $705 and $0 of unamortized computer software costs, respectively. The Company did not record any amortization expense on capitalized software costs during the years ended December 31, 2013, 2012 or 2011. The Company will begin amortizing the software costs capitalized during the year ended December 31, 2013 in January 2014.
89
TABLE OF CONTENTS
Gramercy Property Trust Inc.
Notes To Consolidated Financial Statements
(Amounts in thousands, except share and per share data)
December 31, 2013
2. Significant Accounting Policies – (continued)
The following table provides the weighted-average amortization period as of December 31, 2013 for capitalized software and the projected amortization expense for the next five years.
| | | | | | | | | | | | |
| | Weighted-Average Amortization Period | | 2014 | | 2015 | | 2016 | | 2017 | | 2018 |
| Capitalized software costs(1) | | | 3.0 | | | $ | 235 | | | $ | 235 | | | $ | 235 | | | $ | — | | | $ | — | |
| Total to be included in depreciation and amorization expense | | | | | | $ | 235 | | | $ | 235 | | | $ | 235 | | | $ | — | | | $ | — | |
| (1) | The Company may capitalize additional costs incurred related to the purchase of internal use software during 2014. |
Asset Retirement Obligation
Accounting for asset retirement obligations, refers to a legal obligation to perform an asset retirement activity in which the timing and (or) method of settlement are conditional on a future event that may or may not be within the control of the entity. The obligation to perform the asset retirement activity is unconditional even though uncertainty exists about the timing and (or) method of settlement. Thus, the timing and (or) method of settlement may be conditional on a future event. Accordingly, an entity is required to recognize a liability for the fair value of a conditional asset retirement obligation if the fair value of the liability can be reasonably estimated. The fair value of a liability for the conditional asset retirement obligation is recognized when incurred — generally upon acquisition, construction, or development and (or) through the normal operation of the asset. The Company assessed the cost associated with its legal obligation to remediate asbestos in its properties known to contain asbestos and recorded the present value of the asset retirement obligation. As of December 31, 2013 and December 31, 2012 the Company has not recorded an asset retirement obligation liability. The Company recorded an expense of $0, $0, and $139 for the years ended December 31, 2013, 2012, and 2011, respectively, within discontinued operations.
Valuation of Financial Instruments
At December 31, 2013, the Company measured financial instruments, including Retained CDO Bonds and derivative instruments on a recurring basis. At December 31, 2012, the Company measured financial instruments that were disposed of in the first quarter of 2013 in connection with the disposal of Gramercy Finance at fair value on a recurring basis and non-recurring basis. These financial instruments were deconsolidated at fair value in connection with the disposal of Gramercy Finance on March 15, 2013.
ASC 820-10, “Fair Value Measurements and Disclosures,” among other things, establishes a hierarchical disclosure framework associated with the level of pricing observability utilized in measuring financial instruments at fair value. Considerable judgment is necessary to interpret market data and develop estimated fair values. Accordingly, fair values are not necessarily indicative of the amounts the Company could realize on disposition of the financial instruments. Financial instruments with readily available actively quoted prices or for which fair value can be measured from actively quoted prices generally will have a higher degree of pricing observability and will require a lesser degree of judgment to be utilized in measuring fair value. Conversely, financial instruments rarely traded or not quoted will generally have less, or no, pricing observability and will require a higher degree of judgment to be utilized in measuring fair value. Pricing observability is generally affected by such items as the type of financial instrument, whether the financial instrument is new to the market and not yet established, the characteristics specific to the transaction and overall market conditions. The use of different market assumptions and/or estimation methodologies may have a material effect on estimated fair value amounts.
Fair value is defined as the price that would be received to sell an asset or paid to transfer a liability in an orderly transaction between market participants at the measurement date, or an exit price. The level of
90
TABLE OF CONTENTS
Gramercy Property Trust Inc.
Notes To Consolidated Financial Statements
(Amounts in thousands, except share and per share data)
December 31, 2013
2. Significant Accounting Policies – (continued)
pricing observability generally correlates to the degree of judgment utilized in measuring the fair value of financial instruments. The less judgment utilized in measuring fair value financial instruments such as with readily available active quoted prices or for which fair value can be measured from actively quoted prices in active markets generally have more pricing observability. Conversely, financial instruments rarely traded or not quoted have less observability and are measured at fair value using valuation models that require more judgment. Impacted by a number of factors, pricing observability is generally affected by such items as the type of financial instrument, whether the financial instrument is new to the market and not yet established, the characteristics specific to the transaction and overall market conditions.
The three broad levels defined are as follows:
Level I — This level is comprised of financial instruments that have quoted prices that are available in active markets for identical assets or liabilities. The types of financial instruments included in this category are highly liquid instruments with actively quoted prices.
Level II — This level is comprised of financial instruments that have pricing inputs other than quoted prices in active markets that are either directly or indirectly observable. The nature of these financial instruments includes instruments for which quoted prices are available but traded less frequently and instruments that are fair valued using other financial instruments, the parameters of which can be directly observed.
Level III — This level is comprised of financial instruments that have little to no pricing observability as of the reported date. These financial instruments do not have active markets and are measured using management’s best estimate of fair value, where the inputs into the determination of fair value require significant management judgment and assumptions. Instruments that are generally included in this category are derivatives, whole loans, subordinate interests in whole loans and mezzanine loans.
For a further discussion regarding the measurement of financial instruments see Note 11, “Fair Value of Financial Instruments.”
Revenue Recognition
Real Estate Investments
Rental revenue from leases is recognized on a straight-line basis regardless of when payments are contractually due. Certain lease agreements also contain provisions that require tenants to reimburse the Company for real estate taxes, common area maintenance costs and the amortized cost of capital expenditures with interest. Such amounts are included in both revenues and operating expenses when the Company is the primary obligor for these expenses and assumes the risks and rewards of a principal under these arrangements. Under leases where the tenant pays these expenses directly, such amounts are not included in revenues or expenses.
Deferred revenue represents rental revenue and management fees received prior to the date earned. Deferred revenue also includes rental payments received in excess of rental revenues recognized as a result of straight-line basis accounting.
Other income includes fees paid by tenants to terminate their leases, which are recognized when fees due are determinable, no further actions or services are required to be performed by the Company, and collectability is reasonably assured. In the event of early termination, the unrecoverable net book values of the assets or liabilities related to the terminated lease are recognized as depreciation and amortization expense in the period of termination.
The Company recognizes sales of real estate properties only upon closing. Payments received from purchasers prior to closing are recorded as deposits. Profit on real estate sold is recognized using the full
91
TABLE OF CONTENTS
Gramercy Property Trust Inc.
Notes To Consolidated Financial Statements
(Amounts in thousands, except share and per share data)
December 31, 2013
2. Significant Accounting Policies – (continued)
accrual method upon closing when the collectability of the sale price is reasonably assured and the Company is not obligated to perform significant activities after the sale. Profit may be deferred in whole or part until the sale meets the requirements of profit recognition on sale of real estate.
Asset Management Business
The management agreements may contain provisions for fees related to dispositions, administration of the assets including fees related to accounting, valuation and legal services, and management of capital improvements or projects on the underlying assets.
Certain of the Company’s asset management contracts include provisions that may allow it to earn additional fees, generally described as incentive fees or profit participation interests, based on the achievement of a targeted valuation of the managed assets or the achievement of a certain internal rate of return on the managed assets. The Company recognizes incentive fees on our asset management contracts based upon the amount that would be due pursuant to the contract, if the contract were terminated at the reporting date. If the contact may be terminated at will, revenue will only be recognized to the amount that would be due pursuant to that termination. If the incentive fee is a fixed amount, only a proportionate share of revenue is recognized at the reporting date, with the remaining fees recognized on a straight-line basis over the measurement period. The values of incentive management fees are periodically evaluated by management.
The Original Management Agreement was extended through execution of an Amended and Restated Asset Management Services Agreement, or the Management Agreement, effective as of December 1, 2013, and provides for a base management fee of $7,500 per year, payable monthly, plus the reimbursement of certain administrative and property related expenses. The Management Agreement is effective through December 31, 2016 with a one-year extension option through December 31, 2017, exercisable by KBSAS, and also provides incentive fees in the form of profit participation ranging from 10% – 30% of incentive profits earned on sales.
The Original Management Agreement, which was in effect through December 1, 2013, provided a base management fee of $9,000 per year, payable monthly, plus the reimbursement of all property related expenses paid, and an incentive fee, or the Threshold Value Profits Participation, in an amount equal to the greater of: (a) $3,500 or (b) 10% of the amount, if any, by which the portfolio equity value exceeds $375,000 (as adjusted for future cash contributions into, and distributions out of, KBSAS by KBS REIT). The Threshold Value Profits Participation was capped at a maximum of $12,000 and was payable 60 days after the earlier to occur of June 30, 2014 (or March 31, 2015 upon satisfaction of certain extension conditions including the payment by KBSAS of a $750 extension fee) and the date on which KBSAS, directly or indirectly sells, conveys or otherwise transfers at least 90% of the KBS portfolio.
In the second quarter of 2013, after consideration of the termination provisions of the agreement and the sales of real estate assets made to date, the Company recognized incentive fees of $5,700 related to its Original Management Agreement, with KBS Acquisition Sub, LLC, or KBSAS, a wholly-owned subsidiary of KBS Real Estate Investment Trust, Inc., or KBS REIT, pursuant to which the Company provides asset management services to KBSAS with respect to a portfolio of office and banks branches, or the KBS Portfolio. Subsequently, following the signing of the Management Agreement, KBSAS paid $12,000 to the Company in satisfaction of the Company’s profit participation interest under the Original Management Agreement. For the year ended December 31, 2013, 2012 and 2011, the Company recognized incentive fees of $10,223, $1,277 and $500, respectively.
Rent Expense
Rent expense is recognized on a straight-line basis regardless of when payments are due. Accounts payable and accrued expenses in the accompanying Consolidated Balance Sheets as of December 31, 2013
92
TABLE OF CONTENTS
Gramercy Property Trust Inc.
Notes To Consolidated Financial Statements
(Amounts in thousands, except share and per share data)
December 31, 2013
2. Significant Accounting Policies – (continued)
and 2012 includes an accrual for rental expense recognized in excess of amounts due at that time. Rent expense related to leasehold interests is included in property operating expenses, and rent expense related to office rentals is included in management, general and administrative expense.
Stock-Based Compensation Plans
The Company has a stock-based compensation plan, described more fully in Note 12. The Company accounts for this plan using the fair value recognition provisions. The Company uses the Black-Scholes option-pricing model to estimate the fair value of a stock option award. This model requires inputs such as expected term, expected volatility, and risk-free interest rate. Further, the forfeiture rate also impacts the amount of aggregate compensation cost. These inputs are highly subjective and generally require significant analysis and judgment to develop.
Compensation cost for stock options, if any, is recognized ratably over the vesting period of the award. The Company’s policy is to grant options with an exercise price equal to the quoted closing market price of its stock on the business day preceding the grant date. Awards of stock or restricted stock are expensed as compensation over the benefit period. For the years ended December 31, 2013, 2012 and 2011, basic EPS was determined by dividing net income allocable to common stockholders for the applicable period by the weighted-average number of shares of common stock outstanding during such period. Net income during the applicable period is also allocated to the time-based unvested restricted stock as these grants are entitled to receive dividends and are therefore considered a participating security. Time-based unvested restricted stock is not allocated net losses and/or any excess of dividends declared over net income; such amounts are allocated entirely to the common stockholders other than the holders of time-based unvested restricted stock. For the year ended December 31, 2013, the Company had 678,784 weighted-average unvested restricted shares outstanding.
The fair value of each stock option granted is estimated on the date of grant for options issued to employees, and quarterly awards to non-employees, using the Black-Scholes option pricing model with the following weighted average assumptions for grants in 2013 and 2012.
| | | | |
| | 2013 | | 2012 |
| Dividend yield | | | 5.50 | % | | | 5.00 | % |
| Expected life of option | | | 5.0 years | | | | 5.0 years | |
| Risk-free interest rate | | | 0.72 | % | | | 0.89 | % |
| Expected stock price volatility | | | 53.00 | % | | | 80.00 | % |
Derivative Instruments
In the normal course of business, the Company is exposed to the effect of interest rate changes and limits these risks by following established risk management policies and procedures including the use of derivatives. The Company uses a variety of derivative instruments to manage, or hedge, interest rate risk. The Company requires that hedging derivative instruments be effective in reducing the interest rate risk exposure that they are designated to hedge. This effectiveness is essential for qualifying for hedge accounting. Instruments that meet these hedging criteria are formally designated as hedges at the inception of the derivative contract. The Company uses a variety of commonly used derivative products that are considered “plain vanilla” derivatives. These derivatives typically include interest rate swaps, caps, collars and floors. The Company expressly prohibits the use of unconventional derivative instruments and using derivative instruments for trading or speculative purposes. Further, the Company has a policy of only entering into contracts with major financial institutions based upon their credit ratings and other factors.
The Company may from time to time use derivative instruments in connection with the private placement of equity. In October 2013, the Company entered into contingent value rights agreements, or CVR agreements,
93
TABLE OF CONTENTS
Gramercy Property Trust Inc.
Notes To Consolidated Financial Statements
(Amounts in thousands, except share and per share data)
December 31, 2013
2. Significant Accounting Policies – (continued)
with the share purchasers. Pursuant to each CVR Agreement, the Company issued to each purchaser the number of contingent value rights, or CVRs, equal to the number of common stock purchased. On March 25, 2014, or the CVR Test Date, the Company will calculate the volume-weighted average price, or the VWAP, for the common stock for the 10 trading days period ending on, and including, March 25, 2014, or the CVR Period VWAP. On April 1, 2014, the Company will pay to the holder of the contingent value rights, in immediately available funds, an amount in cash, equal to (a) the number of contingent value rights held by the holder on the CVR Test Date multiplied by (b) the amount, not to exceed $0.46 equal to the difference between the per share purchase price of $4.11 and the CVR Period VWAP. These CVRs are not designated as hedge instruments. The CVRs do not qualify, nor did the Company intend for these instruments to qualify, as hedging instruments. At December 31, 2013, the CVRs have a fair value of $115 and were reported on the Consolidated Balance Sheet as a component of derivative instruments.
The Company recognizes all derivatives on the Consolidated Balance Sheets at fair value. To determine the fair value of derivative instruments, the Company uses a variety of methods and assumptions that are based on market conditions and risks existing at each balance sheet date. For the majority of financial instruments including most derivatives, long-term investments and long-term debt, standard market conventions and techniques such as discounted cash flow analysis, option-pricing models, replacement cost and termination cost are used to determine fair value. All methods of assessing fair value result in a general approximation of value, and such value may never actually be realized.
Derivative instruments that were assets or liabilities of the CDOs were classified as held-for-sale as of December 31, 2012 and then disposed of in the first quarter of 2013 in connection with the disposal of Gramercy Finance. Derivatives that are not hedges must be adjusted to fair value through income. If a derivative is a hedge, depending on the nature of the hedge, changes in the fair value of the derivative will either be offset against the change in fair value of the hedged asset, liability or firm commitment through earnings, or recognized in other comprehensive income until the hedged item is recognized in earnings. The ineffective portion of a derivative’s change in fair value will be immediately recognized in earnings. Derivative accounting may increase or decrease reported net income and stockholders’ equity prospectively, depending on future levels of LIBOR, swap spreads and other variables affecting the fair values of derivative instruments and hedged items, but will have no effect on cash flows, provided the contract is carried through to full term.
All hedges held by the Company are deemed effective based upon the hedging objectives established by the Company’s corporate policy governing interest rate risk management. The effect of the Company’s derivative instruments on its financial statements is discussed more fully in Note 12.
Income Taxes
The Company elected to be taxed as a REIT, under Sections 856 through 860 of the Internal Revenue Code, beginning with its taxable year ended December 31, 2004. To qualify as a REIT, the Company must meet certain organizational and operational requirements, including a requirement to distribute at least 90% of its ordinary taxable income, to stockholders. As a REIT, the Company generally will not be subject to U.S. federal income tax on taxable income that the Company distributes to its stockholders. If the Company fails to qualify as a REIT in any taxable year, it will then be subject to U.S. federal income taxes on taxable income at regular corporate rates and will not be permitted to qualify for treatment as a REIT for U.S. federal income tax purposes for four years following the year during which qualification is lost unless the Internal Revenue Service grants the Company relief under certain statutory provisions. Such an event could materially adversely affect the Company’s net income and net cash available for distributions to stockholders. However, the Company believes that it will be organized and operate in such a manner as to qualify for treatment as a REIT and the Company intends to operate in the foreseeable future in such a manner so that it will qualify as
94
TABLE OF CONTENTS
Gramercy Property Trust Inc.
Notes To Consolidated Financial Statements
(Amounts in thousands, except share and per share data)
December 31, 2013
2. Significant Accounting Policies – (continued)
a REIT for U.S. federal income tax purposes. The Company is subject to certain state and local taxes. The Company’s TRSs are subject to federal, state and local taxes.
For the years ended December 31, 2013, 2012 and 2011, the Company recorded $8,908, $3,330, and $563 of income tax expense, including $2,515, $0, and $0 within discontinued operations, respectively. Tax expense for each year is comprised of federal, state and local taxes. Income taxes, primarily related to the Company’s TRSs, are accounted for under the asset and liability method. Deferred tax assets and liabilities are recognized for the estimated future tax consequences attributable to differences between the financial statement carrying amounts of existing assets and liabilities and their respective tax basis and operating loss carryforwards. Deferred tax assets and liabilities are measured using enacted tax rates in effect for the year in which those temporary differences are expected to be recovered or settled. A valuation allowance is provided if the Company believes it is more likely than not that all or a portion of a deferred tax asset will not be realized. Any increase or decrease in a valuation allowance is included in the tax provision when such a change occurs.
The Company’s policy for interest and penalties, if any, on material uncertain tax positions recognized in the financial statements is to classify these as interest expense and operating expense, respectively. As of December 31, 2013, 2012 and 2011, the Company did not incur any material interest or penalties.
Earnings Per Share
The Company presents both basic and diluted earnings per share, or EPS. Basic EPS excludes dilution and is computed by dividing net income available to common stockholders by the weighted average number of common shares outstanding during the period. Diluted EPS reflects the potential dilution that could occur if securities or other contracts to issue common stock were exercised or converted into common stock, as long as their inclusion would not be anti-dilutive.
Concentrations of Credit Risk
Financial instruments that potentially subject the Company to concentrations of credit risk consist primarily of cash investments, debt investments and accounts receivable. The Company places its cash investments in excess of insured amounts with high quality financial institutions. Prior to the disposal of Gramercy Finance in March 2013, the Company had also performed ongoing analysis of credit risk concentrations in its loan and other lending investment portfolio by evaluating exposure to various markets, underlying property types, investment structure, term, sponsors, tenants and other credit metrics.
One asset management client, KBS, accounted for 73%, 100% and 100% of the Company’s management fee income for the years ended December 31, 2013, 2012 and 2011, respectively. One tenant accounted for 24% and 45% of the Company’s rental revenue for the years ended December 31, 2013 and 2012, respectively. The Company did not have any rental revenue in continuing operations for the year ended December 31, 2011.
Use of Estimates
The preparation of financial statements in conformity with GAAP requires management to make estimates and assumptions that affect the amounts reported in the financial statements and accompanying notes. Actual results could differ from those estimates.
Recently Issued Accounting Pronouncements
In February 2013, the FASB issued additional guidance on comprehensive income which requires the provision of information about the amounts reclassified out of accumulated other comprehensive income by component. This guidance also requires presentation on the Consolidated Statements of Operations and
95
TABLE OF CONTENTS
Gramercy Property Trust Inc.
Notes To Consolidated Financial Statements
(Amounts in thousands, except share and per share data)
December 31, 2013
2. Significant Accounting Policies – (continued)
Comprehensive Income (Loss) or in the notes, significant amounts reclassified out of accumulated other comprehensive income by the respective line items of net income but only if the amount reclassified is required under U.S. GAAP to be reclassified to net income in its entirety in the same reporting period. For other amounts that are not required under U.S. GAAP to be reclassified in their entirety to net income, a cross-reference must be provided to other disclosures required under U.S. GAAP that provide additional detail about those amounts. This update is effective for reporting periods beginning after December 15, 2012 with early adoption permitted. The Company’s adoption resulted in increased disclosures; however, it did not have a material effect on the Company’s Consolidated Financial Statements.
3. Dispositions and Assets Held-for-Sale
The Company did not classify any assets as held-for-sale as of December 31, 2013. The Company classified Gramercy Finance as held-for-sale as of December 31, 2012. The following table summarizes the assets held-for-sale as of December 31, 2012.
| | |
| | December 31, 2012 |
Assets held for sale:
| | | | |
Real estate investments, at cost:
| | | | |
| Land | | $ | 20,074 | |
| Building and improvements | | | 17,592 | |
| Total real estate investments, at cost | | | 37,666 | |
| Less: accumulated depreciation | | | (2,965 | ) |
| Real estate investments held for sale, net | | | 34,701 | |
| Restricted cash | | | 61,385 | |
| Loans and other lending investments, net | | | 784,945 | |
| Commercial mortgage-backed securities – available for sale | | | 931,383 | |
| Investments in joint ventures | | | 59,244 | |
| Tenant and other receivables, net | | | 1,519 | |
| Derivative instruments, at fair value | | | 173 | |
| Accrued interest | | | 13,251 | |
| Acquired lease asets, net of accumulated amortization | | | 188 | |
| Deferred costs | | | 6,466 | |
| Other assets | | | 59,009 | |
| Total assets held for sale | | $ | 1,952,264 | |
96
TABLE OF CONTENTS
Gramercy Property Trust Inc.
Notes To Consolidated Financial Statements
(Amounts in thousands, except share and per share data)
December 31, 2013
3. Dispositions and Assets Held-for-Sale – (continued)
The following operating results for Gramercy Finance and the assets previously sold for the years ended December 31, 2013, 2012 and 2011 are included in discontinued operations for all periods presented:
| | | | | | |
| | Year Ended December 31, |
| | | 2013 | | 2012 | | 2011 |
Operating Results:
| |
| Revenues | | $ | 33,352 | | | $ | 162,059 | | | $ | 562,393 | |
| Operating expenses | | | (4,063 | ) | | | (54,747 | ) | | | (171,870 | ) |
| Marketing, general and administrative(1) | | | (6,524 | ) | | | (18,508 | ) | | | (16,367 | ) |
| Interest expense | | | (14,654 | ) | | | (88,159 | ) | | | (186,620 | ) |
| Depreciation and amortization | | | (15 | ) | | | (967 | ) | | | (64,076 | ) |
| Loans held for sale and CMBS OTTI | | | (7,641 | ) | | | (171,079 | ) | | | (18,423 | ) |
| Provision for loan losses | | | — | | | | 7,838 | | | | (48,180 | ) |
| Expense reimbursements(2) | | | 5,406 | | | | — | | | | — | |
| Equity in net income from joint venture | | | (804 | ) | | | (5,611 | ) | | | (2,098 | ) |
| Net income (loss) from operations | | | 5,057 | | | | (169,174 | ) | | | 54,759 | |
Loss on sale of joint venture interests to a director
related entity | | | 1,317 | | | | — | | | | — | |
| Gain on extinguishment of debt | | | — | | | | — | | | | 300,909 | |
| Net gains from disposals | | | 389,140 | | | | 15,967 | | | | 2,712 | |
| Provision for taxes | | | (2,515 | ) | | | — | | | | — | |
| Net income (loss) from discontinued operations | | $ | 392,999 | | | $ | (153,207 | ) | | $ | 358,380 | |
| (1) | An accrual of $4,339 for the Transfer Tax Assessments on the Company’s sale of a 45% joint venture interest in the leased fee of the 2 Herald Square property is included in management, general and administrative. For more information see Note 15. |
| (2) | In the first quarter of 2013, the Company received reimbursements for enforcement costs of $5,406 incurred on the behalf of a pari-passu lender for one loan held by the CDOs, which the Company incurred in prior years. The Company fully reserved for these costs when incurred due to the uncertainty of recovery. |
Discontinued operations have not been segregated in the Consolidated Statements of Cash Flows.
Gramercy Finance Segment
On March 15, 2013, the Company disposed of Gramercy Finance and exited the commercial real estate finance business, as discussed more fully in Note 1. The Company reclassified the results of operations of Gramercy Finance in discontinued operations for the years ended December 31, 2013, 2012 and 2011. In 2013, the Company recognized a gain of $389,140 in discontinued operations related to the disposal. The gain was calculated based upon the difference between the proceeds received of $6,291, after expenses, the fair value of the Retained CDO Bonds of $8,492, the accrual for the reimbursement of past servicing advances paid plus accrued interest of $14,529 and the net difference of the carrying value of the liabilities and the assets of Gramercy Finance of ($421,911) as of the date of disposal, March 15, 2013.
The basis of the assets and liabilities of Gramercy Finance were derecognized as follows:
| - | Loans and other lending investments were derecognized at the lower of cost or market value as of the date of disposal. The fair value of the loans was measured by an internally developed model which considered the price that a third-party would pay to assume the loans and other lending investments at the disposal date; |
97
TABLE OF CONTENTS
Gramercy Property Trust Inc.
Notes To Consolidated Financial Statements
(Amounts in thousands, except share and per share data)
December 31, 2013
3. Dispositions and Assets Held-for-Sale – (continued)
| - | CMBS investments were derecognized at fair value as of the date of disposal. For CMBS investments in an unrealized loss position, the Company recognized an other-than-temporary impairment equal to the entire difference between the investment’s amortized cost basis and its fair value at the date of disposal which is included in net income from discontinued operations. For CMBS investments in an unrealized gain position as of the date of disposal, the Company recorded the unrealized gains as a component of accumulated other comprehensive income (loss) in stockholders’ equity; |
| - | Derivative instruments were derecognized at fair value as of March 15, 2013. The derivatives were not terminated, but instead were transferred with the CDOs; and, |
| - | The non-recourse CDOs were derecognized at carrying value, which represents the full amount of outstanding liabilities issued by the CDO trusts. |
For a further discussion regarding the measurement of financial instruments see Note 11.
The Company recognized other assets and other receivables retained in the disposal of Gramercy Finance and previously eliminated in consolidation as follows:
| - | Retained CDO Bonds were recognized at the present value of cash flows expected to be collected, which is based upon management’s assumptions and judgments regarding the resolution of the underlying assets; and, |
| - | The accrual for reimbursement of past servicing advances is based upon actual expenses incurred by the Company plus accrued interest at the prime rate for the time from which the expenses were incurred through March 15, 2013. |
Loans Investments
At December 31, 2012, the Company classified substantially all of its loan investments as held-for-sale and recorded an impairment of $882 to adjust the carrying value of seven loans to the lower of cost or market value. The fair value of the loans was measured by an internally developed model which considered the price that a third-party would pay to assume the loan at December 31, 2012. For a further discussion regarding the measurement of financial instruments see Note 11, “Fair Value of Financial Instruments.”
Available-for-Sale CMBS Investments
In connection with the disposal of Gramercy Finance, CMBS investments were classified as held-for-sale as of December 31, 2012. As of December 31, 2012, due to the expected disposal of Gramercy Finance at that reporting date, the Company recognized an other-than-temporary impairment of $128,087 for all CMBS investments in an unrealized loss position because it could no longer express the intent to hold its CMBS until maturity. On the date of disposal, March 15, 2013, the Company marked all CMBS to fair value and then recognized an other-than-temporary impairment of $84,690 for all CMBS in an unrealized loss position equal to the entire difference between the amortized cost basis and the fair value, before deconsolidating the Company’s portfolio of CMBS. The Company recorded the unrealized gain portion of CMBS equal to the excess of the fair value over the amortized cost as a component of accumulated other comprehensive income (loss) in stockholders’ equity (deficit) before deconsolidation.
Real Estate Investments
As of December 31, 2012, the Company designated real estate investments held-for-sale in connection with the disposal of Gramercy Finance and recorded impairment charges of $26,298 to adjust the carrying value to the lower of cost or market. The impairment is calculated by comparing the results of the company’s marketing efforts and unsolicited purchase offers to the carrying value of the respective property. These real estate investments were disposed of in connection with the disposal of Gramercy Finance on March 15, 2013.
98
TABLE OF CONTENTS
Gramercy Property Trust Inc.
Notes To Consolidated Financial Statements
(Amounts in thousands, except share and per share data)
December 31, 2013
3. Dispositions and Assets Held-for-Sale – (continued)
Restricted cash
As of December 31, 2012, restricted cash classified as held-for-sale in connection with the disposal of Gramercy Finance and disposed of on March 15, 2013, consisted of $61,305 on deposit with the trustee of the Company’s CDOs.
Deferred costs
As of December 31, 2012, deferred financing costs of $6,401 related to the CDOs were classified as held-for-sale in connection with the disposal of Gramercy Finance and disposed of on March 15, 2013. For a further discussion regarding deferred costs see Note 10.
Investments in Joint Ventures
As of December 31, 2012, the Company had two joint ventures that were classified as held-for-sale, the Southern California office portfolio and the Las Vegas Hotel, related to the Gramercy Finance segment. The joint ventures are further described below.
Southern California Office Portfolio — In September 2012, the Company, an affiliate of SL Green and several other unrelated parties recapitalized a portfolio of office buildings located in Southern California, or the Southern California Office Portfolio, through the contribution of an existing preferred equity investment to a newly formed joint venture. As of December 31, 2012, the Company’s 10.6% interest in the joint venture had a carrying value of $7,215 and was classified as held for sale in connection with the classification of Gramercy Finance as held for sale. For the year ended December 31, 2012, the Company recorded its pro rata share of net losses on the joint venture of $3,222, within discontinued operations. In January 2013, the Company sold the 10.6% interest in a joint venture of the Southern California Office Portfolio to an affiliate of SL Green for proceeds of $8,275 and recorded a gain on disposition to a director related entity of $1,317.
Las Vegas Hotel — In December 2012, the Company acquired via a deed-in-lieu of foreclosure, a 30% interest through a TRS in the Las Vegas Hotel, a hotel and casino, located in Las Vegas, Nevada. As of December 31, 2012, the joint venture had a carrying value of $52,029 and was classified as held for sale in connection with the classification of Gramercy Finance as held for sale. For the year ended December 31, 2012, the Company recorded its pro rata share of net losses on the joint venture of $2,388, within discontinued operations. The Las Vegas Hotel was classified as held for sale at December 31, 2012 in connection with the disposal of Gramercy Finance and was disposed of on March 15, 2013.
Real Estate Dispositions
During the year ended December 31, 2013, the Company did not sell any properties. During the year ended December 31, 2012, the Company sold 21 properties. The sales transactions generated net proceeds of $77,413 and resulted in gains totaling $15,967 for the years ended December 31, 2012 within discontinued operations.
| | | | | | |
| | For the year ended December 31, 2012 |
| | | Number of Properties | | Net Sale Proceeds | | Gains |
| Finance | | | 6 | | | $ | 71,370 | | | $ | 13,693 | |
| Realty | | | 15 | | | | 6,043 | | | | 2,274 | |
| Total | | | 21 | | | $ | 77,413 | | | $ | 15,967 | |
The Company separately classifies properties held-for-sale in the Consolidated Balance Sheets and Consolidated Statements of Operations and Comprehensive Income (Loss). In the normal course of business the Company identifies non-strategic assets for sale. Changes in the market may compel the Company to decide to classify a property held-for-sale or classify a property that was designated as held-for-sale back to
99
TABLE OF CONTENTS
Gramercy Property Trust Inc.
Notes To Consolidated Financial Statements
(Amounts in thousands, except share and per share data)
December 31, 2013
3. Dispositions and Assets Held-for-Sale – (continued)
held for investment. During the year ended December 31, 2013, the Company did not reclassify any properties previously identified as held-for-sale to held for investment. During the year ended December 31, 2012, the Company did not reclassify any properties previously identified as held-for-sale to held for investment.
In the December 2013, the Company entered into an agreement with our non-controlling interest to dissolve a legal entity related to a sold property resulting in a gain to the Company of $611.
4. Acquisitions
During the year ended December 31, 2013, the Company’s property acquisitions are summarized as follows:
| | | | | | | | | | |
| Property Type | | Number of Properties | | Number of Buildings | | Square
Feet | | Purchase Price | | Weighted-average
Remaining Lease Term |
| Industrial(1),(2) | | | 23 | | | | 25 | | | | 3,683,184 | | | | 261,416 | | | | 11.14 | |
| Office/Banking Center | | | 3 | | | | 3 | | | | 48,709 | | | $ | 7,120 | | | | 8.45 | |
| Specialty(2) | | | 3 | | | | 7 | | | | 255,738 | | | | 72,250 | | | | 13.87 | |
| Total | | | 29 | | | | 35 | | | | 3,987,631 | | | $ | 340,786 | | | | 11.28 | |
| (1) | The industrial properties line includes the build-to-suit property located in Hialeah Gardens, Florida, which represents a commitment to construct an approximately 118,000 square foot cold storage facility which will be 100% leased for an initial term of 25 years when completed. The facility is currently being constructed. The Company acquired the land for the property with a $4,990 zero-coupon mortgage note payable to the seller. Total costs are expected to be approximately $25,000, of which the unfunded amounts were estimated to be $16,772 at December 31, 2013. |
| (2) | The Company assumed mortgages on two of its property acquisitions in 2013, one of which was on an industrial property and one of which was on a specialty asset. The gross value of the mortgages assumed at acquisition was $48,899. Refer to Note 7 for more information on the Company’s debt obligations related to acquisitions. |
The Company analyzed the fair value of the leases and real estate assets of seven of its property investments acquired in 2013; and, accordingly, the purchase price allocation is finalized. The current allocation of the assets includes $57,751 of net real estate assets, $10,578 of intangible assets and $3,679 of intangible liabilities.
The Company is currently analyzing the fair value of the lease and real estate assets of its remaining twenty-two property investments acquired in 2013; and accordingly, the purchase price allocation is preliminary and subject to change. The initial recording of the assets included $248,977 of net real estate assets, $27,550 of intangible assets and $2,236 of intangible liabilities.
During the year ended December 31, 2012, the Company’s property acquisitions are summarized as follows:
| | | | | | | | | | |
| Property Type | | Number of Properties | | Number of Buildings | | Square
Feet | | Purchase Price | | Weighted-average
Remaining
Lease Term |
| Industrial | | | 2 | | | | 2 | | | | 539,429 | | | $ | 27,125 | | | | 10.2 | |
| Total | | | 2 | | | | 2 | | | | 539,429 | | | $ | 27,125 | | | | 10.2 | |
The Company analyzed the fair value of the leases and real estate assets of its two property investments acquired in 2012; and, accordingly, the purchase price allocation is finalized. The final allocation of the assets includes $23,159 of net real estate assets, $4,429 of intangible assets and $462 of intangible liabilities.
100
TABLE OF CONTENTS
Gramercy Property Trust Inc.
Notes To Consolidated Financial Statements
(Amounts in thousands, except share and per share data)
December 31, 2013
4. Acquisitions – (continued)
All of the Company’s acquisitions are 100% leased. The Company recorded revenues and net income for the year ended December 31, 2013 of $10,724 and $1,525, respectively, related to the twenty-nine acquisitions during the year. The Company recorded revenues and net income for the year ended December 31, 2012 of $436 and $25, respectively, related to the two acquisitions during the year.
The Company classifies its properties into one of the following categories based on the characteristics of the property and the following definitions of classifications:
| (1) | Office/Banking Center — A commercial property utilized for professional activities. Examples include generic office properties, call centers, retail bank branches or operation centers. |
| (2) | Industrial — A commercial property used for general industrial activities such as production, manufacturing, assembly, warehousing, storage, distribution, and truck terminals. The Company currently owns six industrial properties that are truck terminals. |
| (3) | Specialty Asset — An improved land site that allows a tenant to perform functions directly related to its overall business. Specialty assets currently owned by Gramercy include an auto auction site, a rental car maintenance facility and a bus depot. |
Pro Forma
The following table summarizes, on an unaudited pro forma basis, the Company’s combined results of operations for the years ended December 31, 2013, 2012 and 2011 as though the acquisitions closed during the years ended December 31, 2013 and 2012 were completed on January 1, 2011. The supplemental pro forma operating data is not necessarily indicative of what the actual results of operations would have been assuming the transaction had been completed as set forth above, nor do they purport to represent the Company’s results of operations for future periods.
| | | | | | |
| | 2013 | | 2012 | | 2011 |
| Pro forma revenues | | $ | 75,092 | | | $ | 68,031 | | | $ | 39,244 | |
| Pro forma net income (loss) available to common stockholders | | $ | 394,625 | | | $ | (169,362 | ) | | $ | 339,432 | |
| Pro forma earnings per common share – basic | | $ | 6.42 | | | $ | (3.26 | ) | | $ | 6.76 | |
| Pro forma earnings per common share – diluted | | $ | 6.42 | | | $ | (3.26 | ) | | $ | 6.76 | |
| Pro forma common shares – basic | | | 61,500,847 | | | | 51,976,462 | | | | 50,229,102 | |
| Pro forma common share – diluted | | | 61,500,847 | | | | 51,976,462 | | | | 50,229,102 | |
5. Investments in Joint Ventures
Bank of America Portfolio
In August 2012, the Company and Garrison formed a joint venture and in December 2012, the Company contributed $59,061 in cash plus the issuance of 6,000,000 shares of the Company’s common stock, valued at $15,000 as of the date of execution of the purchase agreement and a value of $16,500 as of the date of closing, representing a 50% interest in the joint venture’s acquisition of the Bank of America Portfolio from KBS for $485,000. The acquisition was financed with a $200,000 two-year, floating rate, interest-only mortgage loan and collateralized by 67 properties of the portfolio. The mortgage note has three one-year extension options subject to satisfaction of certain terms and conditions. The remaining properties are unencumbered. The Bank of America Portfolio is an office portfolio that originally contained 115 properties. The Bank of America Portfolio totals approximately 3.2 million rentable square feet and is 95% leased to Bank of America, N.A., under a master lease with expiration dates through 2023, with total portfolio occupancy of approximately 96%. During the years ended December 31, 2013 and 2012, the Joint Venture
101
TABLE OF CONTENTS
Gramercy Property Trust Inc.
Notes To Consolidated Financial Statements
(Amounts in thousands, except share and per share data)
December 31, 2013
5. Investments in Joint Ventures – (continued)
sold 38 and 2 properties for net proceeds of $43,284 and $143,408, respectively. In May 2013, the Joint Venture sold a defeased mortgage and the corresponding pool of pledged treasury securities, and recorded a gain of $4,578. As of December 31, 2013 and December 31, 2012, the investment had a carrying value of $39,385 and $72,742, and the Company recorded its pro rata share of net income (loss) of the joint venture of ($5,874) and ($3,020), respectively. During the years ended December 31, 2013 and 2012, the Company received distributions of $29,215 and $0 from the Joint Venture, respectively. The joint venture analyzed the fair value of the leases and real estate assets in the Bank of America portfolio; and, accordingly, the purchase price allocation is finalized. The final allocation of the assets includes $460,012 of net real estate assets, $58,172 of intangible assets and $50,963 of intangible liabilities.
| | | | |
| | 2013 | | 2012 |
| Bank of America Properties | | $ | (163 | ) | | $ | (2,416 | ) |
| Bank of America Defeasance | | | (5,711 | ) | | | (604 | ) |
| Company's equity in net loss of the Bank of America Portfolio | | $ | (5,874 | ) | | $ | (3,020 | ) |
Philips Building
The Company owns a 25% interest in the equity owner of a fee interest in 200 Franklin Square Drive, a 200,000 square foot building located in Somerset, New Jersey which is 100% net leased to Philips Holdings, USA Inc., a wholly-owned subsidiary of Royal Philips Electronics through December 2021. As of December 31, 2013 and December 31, 2012, the investment has a carrying value of $0 and $201, respectively. The Company recorded its pro rata share of net income of the joint venture of $212, $115 and $121 for the years ended December 31, 2013, 2012 and 2011, respectively. During the years ended December 31, 2013, 2012, and 2011 the Company received distributions of $413, $392, and $371 from the joint venture, respectively.
The Consolidated Balance Sheets for the Company’s joint ventures at December 31, 2013 and 2012 are as follows:
| | | | |
| | 2013 | | 2012 |
Assets:
| | | | | | | | |
| Real estate assets, net | | $ | 305,798 | | | $ | 452,692 | |
| Other assets(1) | | | 100,560 | | | | 219,760 | |
| Total assets | | $ | 406,358 | | | $ | 672,452 | |
Liabilities and members' equity:
| | | | | | | | |
| Mortgages payable(1) | | $ | 241,000 | | | $ | 553,140 | |
| Other liabilities | | | 84,608 | | | | 90,255 | |
| Members' equity | | | 80,750 | | | | 29,057 | |
| Liabilities and members' equity | | $ | 406,358 | | | $ | 672,452 | |
| (1) | In May 2013, the Joint Venture sold a defeased mortgage and the corresponding pool of pledged treasury securities, which were acquired by the Joint Venture at acquisition of the Bank of America Portfolio. |
102
TABLE OF CONTENTS
Gramercy Property Trust Inc.
Notes To Consolidated Financial Statements
(Amounts in thousands, except share and per share data)
December 31, 2013
5. Investments in Joint Ventures – (continued)
The Consolidated Statements of Operations and Comprehensive Income (Loss) for the joint ventures for the three years ended December 31, 2013, 2012 and 2011 or partial period for acquisitions or dispositions which closed during these periods, are as follows:
| | | | | | |
| | 2013 | | 2012 | | 2011 |
| Revenues | | $ | 71,839 | | | $ | 8,431 | | | $ | 8,148 | |
| Operating expenses | | | 37,459 | | | | 6,551 | | | | 454 | |
| Interest | | | 18,328 | | | | 4,136 | | | | 5,578 | |
| Depreciation | | | 18,469 | | | | 2,290 | | | | 4,082 | |
| Total expenses | | | 74,256 | | | | 12,977 | | | | 10,114 | |
| Net loss from operations | | | (2,417 | ) | | | (4,546 | ) | | | (1,966 | ) |
| Net gain on disposals | | | (9,046 | ) | | | — | | | | — | |
| Net loss | | $ | (11,463 | ) | | $ | (4,546 | ) | | $ | (1,966 | ) |
| Company's equity in net income (loss) within continuing operations | | $ | (5,662 | ) | | $ | (2,904 | ) | | $ | 121 | |
| Company's equity in net loss within discontinued operations | | $ | (804 | ) | | $ | (5,611 | ) | | $ | (2,098 | ) |
6. Liabilities Related to Assets Held-For-Sale
The Company did not classify any assets as held-for-sale as of December 31, 2013. The Company classified Gramercy Finance as held-for-sale as of December 31, 2012. The following table summarizes the liabilities related to assets held-for-sale as of December 31, 2012:
| | |
| | December 31, 2012 |
Liabilities related to assets held-for-sale:
| | | | |
| Collaterized debt obligations | | $ | 2,188,597 | |
| Accounts payable and accrued expenses | | | 10,552 | |
| Accrued interest payable | | | 3,137 | |
| Deferred revenue | | | 2,142 | |
| Below market lease liabilities, net | | | 1,703 | |
| Derivative instruments, at fair value | | | 173,623 | |
| Other liabilities | | | 408 | |
| Total liabilities related to assets held-for-sale | | $ | 2,380,162 | |
Collateralized Debt Obligations
In the fourth quarter of 2012, the Company classified its CDOs as held-for-sale in connection with the disposal of Gramercy Finance. The outstanding debt is presented as a component of the liabilities related to assets held-for-sale on the Consolidated Balance Sheets. In March 2013, following the completion of the disposal of Gramercy Finance, the Company deconsolidated the CDOs from the Company’s Consolidated Financial Statements.
During 2005, the Company issued approximately $1,000,000 of CDO bonds through two indirect subsidiaries, Gramercy Real Estate CDO 2005-1 Ltd., or the 2005 Issuer, and Gramercy Real Estate CDO 2005-1 LLC, or the 2005 Co-Issuer. At issuance, the CDO consisted of $810,500 of investment grade notes, $84,500 of non-investment grade notes, which were co-issued by the 2005 Issuer and the 2005 Co-Issuer, and $105,000 of preferred shares, which were issued by the 2005 Issuer. The investment grade notes were issued with floating rate coupons with a combined weighted average rate of three-month LIBOR plus 0.49%. The Company incurred approximately $11,957 of costs related to Gramercy Real Estate CDO 2005-1, which were amortized on a level-yield basis over the average life of the CDO.
103
TABLE OF CONTENTS
Gramercy Property Trust Inc.
Notes To Consolidated Financial Statements
(Amounts in thousands, except share and per share data)
December 31, 2013
6. Liabilities Related to Assets Held-For-Sale – (continued)
During 2006, the Company issued approximately $1,000,000 of CDO bonds through two indirect subsidiaries, Gramercy Real Estate CDO 2006-1 Ltd., or the 2006 Issuer, and Gramercy Real Estate CDO 2006-1 LLC, or the 2006 Co-Issuer. At issuance, the CDO consisted of $903,750 of investment grade notes, $38,750 of non-investment grade notes, which were co-issued by the 2006 Issuer and the 2006 Co-Issuer, and $57,500 of preferred shares, which were issued by the 2006 Issuer. The investment grade notes were issued with floating rate coupons with a combined weighted average rate of three-month LIBOR plus 0.37%. The Company incurred approximately $11,364 of costs related to Gramercy Real Estate CDO 2006-1, which were amortized on a level-yield basis over the average life of the CDO.
In August 2007, the Company issued $1,100,000 of CDO bonds through two indirect subsidiaries, Gramercy Real Estate CDO 2007-1 Ltd., or the 2007 issuer and Gramercy Real Estate CDO 2007-1 LLC, or the 2007 Co-Issuer. At issuance, the CDO consisted of $1,045,550 of investment grade notes, $22,000 of non-investment grade notes, which were co-issued by the 2007 Issuer and the 2007 Co-Issuer, and $32,450 of preferred shares, which were issued by the 2007 Issuer. The investment grade notes were issued with floating rate coupons with a combined weighted average rate of three-month LIBOR plus 0.46%. The Company incurred approximately $16,816 of costs related to Gramercy Real Estate CDO 2007-1, which were amortized on a level-yield basis over the average life of the CDO.
In connection with the closing of each of the Company’s CDOs, pursuant to the collateral management agreement, the Manager agreed to provide certain advisory and administrative services in relation to the collateral debt securities and other eligible investments securing the CDO notes. The Company retained all non-investment grade securities, the preferred shares and the ordinary shares in the Issuer of each CDO. The Issuers and Co-Issuers in each CDO held assets, consisting primarily of whole loans, subordinate interests in whole loans, mezzanine loans, preferred equity investments and CMBS, which served as collateral for the CDO.
Loans and other investments were owned by the Issuers and the Co-Issuers, served as collateral for the Company’s CDO securities, and the income generated from these investments was used to fund interest obligations of the Company’s CDO securities and the remaining income, if any, was retained by the Company. The CDO indentures contain minimum interest coverage and asset overcollateralization covenants that must be satisfied in order for the Company to receive cash flow on the interests retained in its CDOs and to receive the subordinate collateral management fee earned.
Derivative Instruments
Derivative assets with a notional value of $200,129 and a fair value of $173 and derivative liabilities with a notional value of $1,005,087 and a fair value of $173,623 were held within the Company’s CDOs and classified as held-for-sale at December 31, 2012. These derivative instruments were designated as cash flow hedges, and were derecognized at fair value when they were transferred with the CDOs’ liabilities in connection with the disposal of Gramercy Finance on March 15, 2013, the date of disposal. For further information on how the Company values derivative instruments see Note 12. For information regarding the Company’s accounting policies for derivative instruments, see the discussion on derivative instruments in Note 2.
Other Liabilities Related to Assets Held-For-Sale
As of December 31, 2012, the Company had other liabilities related to assets held for sale primarily consisting of accrued expenses and accounts payable related to accrued legal fees and operating expenses of real estate and interest payable related to the outstanding CDO debt, which was disposed of in connection with the disposal of Gramercy Finance on March 15, 2013.
104
TABLE OF CONTENTS
Gramercy Property Trust Inc.
Notes To Consolidated Financial Statements
(Amounts in thousands, except share and per share data)
December 31, 2013
7. Debt Obligations
Certain real estate assets are subject to mortgage liens. The following is a summary of the Company’s secured financing arrangements as of December 31, 2013:
| | | | | | | | | | |
| | Encumbered Properties | | Balance | | Interest Rate | | Weighted-average Effective Interest
Rate | | Weighted-average
Maturity |
| Fixed-rate mortgages | | | 7 | | | $ | 104,318 | | | | 0.00% to 6.95% | | | | 4.83 | % | | | June 2014 to
June 2029 | |
Variable-rate
mortgages(1),(2) | | | 1 | | | | 16,055 | | | | 1 Month LIBOR + 2.10 | % | | | 2.27 | % | | | December 2020 | |
| Secured credit facility(1) | | | 18 | | | | 45,000 | | | | 1 Month LIBOR + 1.90 | % | | | 2.07 | % | | | September 2015 | |
| Total secured financings | | | 26 | | | $ | 165,373 | |
| Above/below market interest | | | | | | | 1,807 | | | | | | | | | | | | | |
| Balance at December 31, 2013 | | | 26 | | | $ | 167,180 | | | | | | | | | | | | | |
| (1) | All of the Company’s variable-rate financings are monthly LIBOR plus a fixed spread. |
| (2) | This mortgage is hedged by an interest rate swap which has a maturity date of December 2020. Refer to Note 12 for further information on hedging and the Company’s derivative instruments. |
On September 4, 2013, the Company entered into a Credit and Guaranty Agreement with Deutsche Bank Securities, Inc., as lead arranger and bookrunner, and Deutsche Bank AG New York Branch, as administrative agent, for a $100,000 senior secured revolving credit facility, which Credit and Guaranty Agreement was amended and restated on September 24, 2013, or the Credit Facility. The aggregate amount of the Credit Facility may be increased to a total of up to $150,000, subject to the approval of the administrative agent and the identification of lenders willing to make available additional amounts. The Company exercised the $50,000 accordion feature in February 2014, which increased its borrowing capacity to $150,000. The maturity date of the revolving credit facility is September 2015, with one 12-month extension option exercisable by the Company, subject, among other things, to there being an absence of an event of default under the Credit Facility and to the payment of an extension fee. The Credit Facility is guaranteed by Gramercy Property Trust Inc. and certain subsidiaries and is secured by first priority mortgages on designated properties, or the Borrowing Base. Outstanding borrowings under the Credit Facility are limited to the lesser of (i) the sum of the $100,000 revolving commitment and the maximum $50,000 commitment increase available or (ii) 60.0% of the value of the Borrowing Base. Interest on advances made on the Credit Facility, will be incurred at a floating rate based upon, at the Company’s option, either (i) LIBOR plus the applicable LIBOR margin, or (ii) the applicable base rate which is the greater of the Prime Rate, 0.50% above the Federal Funds Rate, or 30-day LIBOR plus 1.00%. The applicable LIBOR margin will range from 1.90% to 2.75%, depending on the ratio of the Company's outstanding consolidated indebtedness to the value of the Company’s consolidated gross assets. The Credit Facility will have an initial borrowing rate of LIBOR plus 1.90%. The Credit Facility includes a series of financial and other covenants that the Company must comply with in order to borrow under the facility. The Company was in compliance with the covenants under the Credit Facility at December 31, 2013. As of December 31, 2013, there were borrowings of $45,000 outstanding under the Credit Facility and 18 properties were in the borrowing base.
On May 16, 2013, the Company entered into a $14,500 non-recourse mortgage loan at a fixed annual interest rate of 3.28%. The loan is collateralized by two industrial properties totaling 539,000 square feet acquired by the Company on November 20, 2012, which are 100% leased through 2018 and 2024. The loan matures in June 2018.
105
TABLE OF CONTENTS
Gramercy Property Trust Inc.
Notes To Consolidated Financial Statements
(Amounts in thousands, except share and per share data)
December 31, 2013
7. Debt Obligations – (continued)
On May 31, 2013, the Company entered into a $4,990 non-recourse, interest-free mortgage loan, collateralized by a property acquired by the Company on May 30, 2013, on which the Company is funding construction of a 118,000 industrial cold storage facility that will be 100% leased for a term of 25 years upon completion. The loan matures in June 2014.
On June 27, 2013, the Company assumed a non-recourse mortgage loan with a face value of $26,322 and a fair value of $29,385 at the acquisition of a 196,000 square foot specialty asset, which served as collateral for the loan. The property is 100% leased through July 2029 and bears interest at a fixed annual rate of 6.95%. The loan matures in June 2029.
On November 15, 2013, in connection with the acquisition of a portfolio of three industrial distribution centers totaling 675,000 square feet, the Company assumed a non-recourse mortgage loan with a face value of $22,577 and a fair value of $21,503 at acquisition on one of the properties, which is 100% leased through June 2024. The assumed loan has a fixed annual interest rate of 4.00% and matures in January 2020.
On November 21, 2013, the Company entered into a $12,600 non-recourse mortgage loan at a fixed annual interest rate of 5.15%. The loan is collateralized by a 220,000 square foot industrial property acquired by the Company on October 1, 2013, which is 100% leased through September 2033. The loan matures in December 2023.
On December 19, 2013, the Company entered into a $16,055 non-recourse mortgage loan at a floating interest rate of 1 Month LIBOR plus 2.10%. The loan is collateralized by a 303,000 square foot industrial property acquired by the Company on November 21, 2013, which is 100% leased through July 2029. The loan matures in December 2020. In connection with the financing, the Company also entered into a fixed rate swap agreement with the lender, Texas Capital Bank, N.A., which is an effective cash flow hedge against the floating rate loan and whereby the Company will pay an effective fixed rate of 4.55%.
On December 31, 2013, the Company entered into a $24,100 non-recourse mortgage loan at a fixed annual interest rate of 5.0715%. The loan is collateralized by a 480,000 square foot industrial property acquired by the Company on December 23, 2013, which is 100% leased through December 2028. The loan matures in January 2024.
During the years ended December 31, 2013 and 2012, the Company capitalized $94 and $0, respectively of interest associated with redevelopment activities.
As of December 31, 2013, eight of the Company’s real estate investments were encumbered with mortgage notes with a cumulative outstanding balance of $120,373 and the Company’s secured revolving line of credit had an outstanding balance of $45,000. Combined aggregate principal maturities of the Company's mortgage notes and credit facility as of December 31, 2013 are as follows:
| | | | | | | | |
| | Credit
Facility | | Mortgage
Notes
Payable | | Interest Payments | | Total |
| 2014 | | $ | — | | | $ | 7,576 | | | $ | 6,203 | | | $ | 13,779 | |
| 2015 | | | 45,000 | | | | 2,763 | | | | 5,939 | | | | 53,702 | |
| 2016 | | | — | | | | 2,895 | | | | 5,091 | | | | 7,986 | |
| 2017 | | | — | | | | 3,045 | | | | 4,935 | | | | 7,980 | |
| 2018 | | | — | | | | 15,986 | | | | 4,563 | | | | 20,549 | |
| Thereafter | | | — | | | | 88,108 | | | | 18,137 | | | | 106,245 | |
| Above/Below Market Interest | | | — | | | | — | | | | 1,807 | | | | 1,807 | |
| Total | | $ | 45,000 | | | $ | 120,373 | | | $ | 46,675 | | | $ | 212,048 | |
106
TABLE OF CONTENTS
Gramercy Property Trust Inc.
Notes To Consolidated Financial Statements
(Amounts in thousands, except share and per share data)
December 31, 2013
8. Leasing Agreements
The Company’s properties are leased and subleased to tenants under operating leases with expiration dates extending through the year 2032. These leases generally contain rent increases and renewal options.
Future minimum rental income under non-cancelable leases excluding reimbursements for operating expenses as of December 31, 2013 are as follows:
| | |
| | Operating Leases |
| 2014 | | $ | 28,917 | |
| 2015 | | | 30,398 | |
| 2016 | | | 30,694 | |
| 2017 | | | 31,040 | |
| 2018 | | | 31,575 | |
| Thereafter | | | 284,577 | |
| Total minimum lease rental income | | $ | 437,201 | |
9. Transactions with Director Related Entities
The Chief Executive Officer of SL Green Realty Corp. (NYSE: SLG), or SL Green, is one of the Company’s directors.
In June 2013, the Company signed a lease agreement with 521 Fifth Fee Owner LLC, an affiliate of SL Green, for new corporate office space located at 521 Fifth Avenue, 30th Floor, New York, New York. The lease commenced in September 2013, following the completion of certain improvements to the space. The lease is for approximately 6,580 square feet and carries a term of 10 years with rents of approximately $373 per annum for year one rising to $463 per annum in year ten. There were four months of rent abated at the commencement of the lease and as such we did not pay any rent under the lease for the year ended December 31, 2013.
From May 2005 through September 2013, the Company was party to a lease agreement with SLG Graybar Sublease LLC, an affiliate of SL Green, for the Company’s previous corporate offices at 420 Lexington Avenue, New York, New York. In April 2013, the Company gave notice that that it was cancelling the lease for its corporate offices at 420 Lexington Avenue. The lease agreement with SLG Graybar Sublease LLC was terminated in September 2013.
10. Deferred Costs
Deferred costs at December 31, 2013 and 2012 consisted of the following:
| | | | |
| | 2013 | | 2012 |
| Deferred financing costs | | $ | 3,818 | | | $ | 44,077 | |
| Deferred acquisition costs | | | 2,630 | | | | 146 | |
| Deferred leasing costs | | | — | | | | 245 | |
| | | | 6,448 | | | | 44,468 | |
| Accumulated amortization | | | (634 | ) | | | (37,587 | ) |
| | | | 5,814 | | | | 6,881 | |
| Less: Held for sale | | | — | | | | (6,466 | ) |
| | | $ | 5,814 | | | $ | 415 | |
107
TABLE OF CONTENTS
Gramercy Property Trust Inc.
Notes To Consolidated Financial Statements
(Amounts in thousands, except share and per share data)
December 31, 2013
10. Deferred Costs – (continued)
At December 31, 2013, deferred financing costs relate to the Company’s new financing arrangements entered into during the year, including its credit facility and financing assumed on property acquisitions. These costs are amortized on a straight-line basis to interest expense based on the contractual term of the related financing.
Deferred leasing costs include direct costs incurred to initiate and renew operating leases and are amortized on a straight-line basis over the related lease term.
Deferred acquisition costs include lease inducement fees paid to secure acquisition and are amortized over a straight-line basis over the related lease term.
11. Fair Value of Financial Instruments
The Company discloses fair value information about financial instruments, whether or not recognized in the statement of financial condition, for which it is practicable to estimate that value. In cases where quoted market prices are not available, fair values are based upon the application of discount rates to estimated future cash flows based upon market yields or by using other valuation methodologies. Considerable judgment is necessary to interpret market data and develop estimated fair value. Accordingly, fair values are not necessarily indicative of the amounts the Company could realize on disposition of the financial instruments. The use of different market assumptions and/or estimation methodologies may have a material effect on estimated fair value amounts.
In connection with the Company’s disposal of Gramercy Finance and the subsequent exit from the commercial real estate finance business, more fully described in Note 3 — “Dispositions and Assets Held for Sale”, for the year ended December 31, 2012, the Company recorded impairment charges of $882 on its loan investments, CMBS investments, and real estate held by the CDOs as a result of the reclassification of all loan investments and real estate held by the CDOs as held-for-sale and the inability to express the intent to hold impaired CMBS investments until amortized cost is recovered. In connection with the disposal of Gramercy Finance, the Company also recorded recurring and non-recurring fair value measurements as of the date of disposal for certain financial instruments before derecognition.
The following table presents the carrying value in the financial statements, and approximate fair value of financial instruments at December 31, 2013 and 2012:
| | | | | | | | |
| | December 31, 2013 | | December 31, 2012 |
| | | Carrying Value | | Fair
Value | | Carrying Value | | Fair
Value |
Financial assets:
| | | | | | | | | | | | | | | | |
| Lending investments(1),(2) | | $ | — | | | $ | — | | | $ | 784,135 | | | $ | 816,283 | |
| CMBS(2) | | $ | — | | | $ | — | | | $ | 932,265 | | | $ | 932,265 | |
| Derivative instruments(2) | | $ | — | | | $ | — | | | $ | 173 | | | $ | 173 | |
| Retained CDO Bonds(3) | | $ | 6,762 | | | $ | 6,762 | | | $ | — | | | $ | — | |
Financial liabilities:
| | | | | | | | | | | | | | | | |
| Collateralized debt obligations(1),(2) | | $ | — | | | $ | — | | | $ | 2,188,579 | | | $ | 1,474,236 | |
| Derivative instruments(2) | | $ | 187 | | | $ | 187 | | | $ | 173,623 | | | $ | 173,623 | |
| Mortgage notes payable(1) | | $ | 122,180 | | | $ | 123,349 | | | $ | — | | | $ | — | |
| Contingent Value Rights(4) | | $ | 115 | | | $ | 115 | | | $ | — | | | $ | — | |
| (1) | Lending investments, mortgage notes payable, and CDOs are classified as Level III due to significance of unobservable inputs which are based upon management assumptions. |
108
TABLE OF CONTENTS
Gramercy Property Trust Inc.
Notes To Consolidated Financial Statements
(Amounts in thousands, except share and per share data)
December 31, 2013
11. Fair Value of Financial Instruments – (continued)
| (2) | In connection with the classification of Gramercy Finance as held for sale, lending investments, CMBS, derivative instruments, and collateralized debt obligations are classified as held for sale as of December 31, 2012. |
| (3) | Retained CDO Bonds represent the CDOs’ subordinate bonds, preferred shares, and ordinary shares, which were retained subsequent to the disposal of Gramercy Finance and were previously eliminated in consolidation. |
| (4) | Pursuant to the Company’s private placement of equity, the Company entered into contingent value right agreements with purchasers of the Company’s common stock. The contingent value rights entitle each purchaser to cash payment contingent on the Company’s stock price, as follows: On April 1, 2014, the purchasers will receive cash payment of (a) the number of their contingent values rights multiplied by (b) the amount, not to exceed $0.46, equal to the difference between the share price at time of purchase, $4.11, and the volume-weighted average price for the time trading days ending on and including March 25, 2014. |
The following methods and assumptions were used to estimate the fair value of each class of financial instruments for which it is practicable to estimate the value:
Cash and cash equivalents, accrued interest, and accounts payable: These balances in the Consolidated Financial Statements reasonably approximate their fair values due to the short maturities of these items.
Lending investments: These instruments are presented in the Consolidated Financial Statements at the lower of cost or market value and not at fair value. The fair values were estimated by using market floating rate and fixed rate yields (as appropriate) for loans with similar credit characteristics.
CMBS investments: These investments are presented in the Consolidated Financial Statements at fair value. The fair values were based upon valuations obtained from dealers of those securities, third-party pricing services, and internal models.
Collateralized debt obligations: These obligations are presented in the Consolidated Financial Statements on the basis of proceeds received at issuance and not at fair value. The fair value was estimated based upon the amount at which similarly placed financial instruments would be valued at December 31, 2013.
Derivative instruments: The Company’s derivative instruments, which are primarily comprised of interest rate caps and interest rate swap agreements, are carried at fair value in the Consolidated Financial Statements based upon third-party valuations.
Retained CDO Bonds: Non-investment grade, subordinate CDO bonds, preferred shares and ordinary shares are presented on the Consolidated Financial Statements at fair value. The fair value is determined by an internally developed discounted cash flow model.
Mortgage notes payable: These obligations are presented in the Consolidated Financial Statements based on the actual balance outstanding and not at fair value. The fair value was estimated using discounted cash flows methodology, using discount rates that best reflect current market rates for financing with similar characteristics and credit quality.
Contingent value rights: The Company’s contingent value rights are presented at fair value on the Consolidated Financial Statements based upon valuation using the Black Scholes model.
Disclosure about fair value of financial instruments is based on pertinent information available to the Company at December 31, 2013 and 2012. Although the Company is not aware of any factors that would significantly affect the reasonable fair value amounts, such amounts have not been comprehensively revalued
109
TABLE OF CONTENTS
Gramercy Property Trust Inc.
Notes To Consolidated Financial Statements
(Amounts in thousands, except share and per share data)
December 31, 2013
11. Fair Value of Financial Instruments – (continued)
for the purpose of these financial statements since December 31, 2013 and 2012, and current estimates of fair value may differ significantly from the amounts presented herein.
The following discussion of fair value was determined by the Company using available market information and appropriate valuation methodologies. Considerable judgment is necessary to interpret market data and develop estimated fair value. Accordingly, fair values are not necessarily indicative of the amounts the Company could realize on disposition of the financial instruments. Financial instruments with readily available actively quoted prices or for which fair value can be measured from actively quoted prices generally will have a higher degree of pricing observability and a lower degree of judgment utilized in measuring fair value. Conversely, financial instruments rarely traded or not quoted will generally have less, or no, pricing observability and a higher degree of judgment utilized in measuring fair value. The use of different market assumptions and/or estimation methodologies may have a material effect on estimated fair value amounts. Determining which category an asset or liability falls within the hierarchy requires significant judgment and the Company evaluates its hierarchy disclosures each quarter.
Fair Value on a Recurring Basis
Assets and liabilities measured at fair value on a recurring basis are categorized in the table below based upon the lowest level of significant input to the valuations.
| | | | | | | | |
| At December 31, 2013 | | Total | | Level I | | Level II | | Level III |
Financial Assets:
| | | | | | | | | | | | | | | | |
Retained CDO Bonds:
| | | | | | | | | | | | | | | | |
| Non-investment grade, subordinate CDO bonds | | $ | 6,762 | | | $ | — | | | $ | — | | | $ | 6,762 | |
| | | $ | 6,762 | | | $ | — | | | $ | — | | | $ | 6,762 | |
Financial Liabilities:
| �� | | | | | | | | | | | | | | | |
Derivative instruments:
| | | | | | | | | | | | | | | | |
| Interest rate swaps | | $ | 187 | | | $ | — | | | $ | — | | | $ | 187 | |
| Contingent value rights | | | 115 | | | | — | | | | — | | | | 115 | |
| | | $ | 302 | | | $ | — | | | $ | — | | | $ | 302 | |
| | | | | | | | |
| At December 31, 2012 | | Total | | Level I | | Level II | | Level III |
Financial Assets:
| | | | | | | | | | | | | | | | |
Derivative instruments:
| | | | | | | | | | | | | | | | |
| Interest rate caps | | $ | 173 | | | $ | — | | | $ | — | | | $ | 173 | |
| Interest rate swaps | | | — | | | | — | | | | — | | | | — | |
| | | $ | 173 | | | $ | — | | | $ | — | | | $ | 173 | |
CMBS available for sale:
| | | | | | | | | | | | | | | | |
| Investment grade | | $ | 281,495 | | | $ | — | | | $ | — | | | $ | 281,495 | |
| Non-investment grade | | | 650,770 | | | | — | | | | — | | | | 650,770 | |
| | | $ | 932,265 | | | $ | — | | | $ | — | | | $ | 932,265 | |
Financial Liabilities:
| | | | | | | | | | | | | | | | |
Derivative instruments:
| | | | | | | | | | | | | | | | |
| Interest rate caps | | $ | 173,623 | | | $ | — | | | $ | — | | | $ | 173,623 | |
| Interest rate swaps | | | — | | | | — | | | | — | | | | — | |
| | | $ | 173,623 | | | $ | — | | | $ | — | | | $ | 173,623 | |
Derivative instruments: Interest rate caps and swaps were valued with the assistance of a third-party derivative specialist, who uses a combination of observable market-based inputs, such as interest rate curves, and unobservable inputs which require significant judgment such as the credit valuation adjustments due to the risk of non-performance by both the Company and its counterparties. The fair value of derivatives classified as Level III are most sensitive to the credit valuation adjustment as all or a portion of the credit valuation
110
TABLE OF CONTENTS
Gramercy Property Trust Inc.
Notes To Consolidated Financial Statements
(Amounts in thousands, except share and per share data)
December 31, 2013
11. Fair Value of Financial Instruments – (continued)
adjustment may be reversed or otherwise adjusted in future periods in the event of changes in the credit risk of the Company or its counterparties. Fair value of our derivative instruments, such our CVR investments are valued using a Black-Scholes model.
Total losses or (gains) from derivatives for the year ended December 31, 2013 and the year ended December 31, 2012 were $9,914 and ($2,146), respectively, in Accumulated Other Comprehensive Income (Loss). Subsequently, on March 15, 2013, the date of disposal, the Company reclassified the amounts out of Accumulated Other Comprehensive Income (Loss) and derecognized the derivative instruments. During the year ended December 31, 2013, the Company entered into an interest rate swap agreement and did not enter into any new interest rate caps.
CMBS: CMBS securities are generally valued on a recurring basis by (i) obtaining assessments from third-party dealers who primarily use market-based inputs such as changes in interest rates and credit spreads, along with recent comparable trade data; and (ii) pricing services who use a combination of market-based inputs along with unobservable inputs that require significant judgment, such as assumptions on the underlying loans regarding net property operating income, capitalization rates, debt service coverage ratios and loan-to-value default thresholds, timing of workouts and recoveries, and loan loss severities. Third-party dealer marks, which are used to value the majority of the Company’s CMBS securities, are indications received from dealers in the respective security, from which the Company could transact at on the valuation date. The Company uses all data points obtained, including comparable trades completed by the Company or available in the market place in determining its fair value of CMBS. Pricing service models are designed to replicate a market view of the underlying collateral, however, the models are most sensitive to the unobservable inputs such as timing of loan defaults and severity of loan losses and significant increases (decreases) in any of those inputs in isolation as well as any change in the expected timing of those inputs, would result in a significantly lower (higher) fair value measurement. Due to the inherent uncertainty in the determination of fair value, the Company has designated its CMBS securities as Level III.
Retained CDO Bonds: Retained CDO Bonds are valued on a recurring basis using an internally developed discounted cash flow model. Management estimates the timing and amount of cash flows expected to be collected and applies a discount rate equal to the yield that the Company would expect to pay for similar securities with similar risks at the valuation date. Future expected cash flows generated by management require significant assumptions and judgment regarding the expected resolution of the underlying collateral, which includes loans and other lending investments, real estate investments, and CMBS. The resolution of the underlying collateral requires further management assumptions regarding capitalization rates, lease-up periods, future occupancy rates, market rental rates, holding periods, capital improvements, net property operating income, timing of workouts and recoveries, loan loss severities and other factors. The models are most sensitive to the unobservable inputs such as the timing of a loan default or property sale and the severity of loan losses. Significant increases (decreases) in any of those inputs in isolation as well as any change in the expected timing of those inputs would result in a significantly lower (higher) fair value measurement. Due to the inherent uncertainty in the determination of fair value, the Company has designated its Retained CDO Bonds as Level III.
111
TABLE OF CONTENTS
Gramercy Property Trust Inc.
Notes To Consolidated Financial Statements
(Amounts in thousands, except share and per share data)
December 31, 2013
11. Fair Value of Financial Instruments – (continued)
Quantitative information regarding the valuation techniques and the range of significant unobservable Level III inputs used to determine fair value measurements on a recurring basis as of December 31, 2013 are:
| | | | | | | | |
| | At December 31, 2013 |
| Financial Asset | | Fair Value | | Valuation Technique | | Unobservable Inputs | | Range |
| Non-investment grade, subordinate CDO bonds | | $ | 6,762 | | | | Discounted cash flows | | | | Discount rate | | | | 25.00% to 40.00 | % |
| Contingent value rights | | | 115 | | | | Black-Scholes model | | | | Implied volatility | | | | 40.00% to 60.00 | % |
| Interest rate swaps | | | 187 | | | | Hypothetical derivative method | | | | Credit borrowing spread | | | | 150 to 250 basis points | |
The following table reconciles the beginning and ending balances of financial assets measured at fair value on a recurring basis using Level III inputs:
| | | | | | | | |
| | CMBS Available for sale – Investment Grade | | CMBS Available for Sale – Non- Investment Grade | | Derivative Instruments | | Retained
CDO Bonds |
| Balance as of December 31, 2012 | | $ | 281,495 | | | $ | 650,770 | | | $ | 173 | | | $ | — | |
| Change in CMBS investment status | | | (1,506 | ) | | | 1,506 | | | | — | | | | — | |
| Amortization of discounts or premiums | | | 1,264 | | | | 6,075 | | | | — | | | | 1,491 | |
| Proceeds from CMBS principal repayments | | | (10,526 | ) | | | — | | | | — | | | | — | |
| Gramercy Finance disposal | | | (274,133 | ) | | | (670,387 | ) | | | (219 | ) | | | 8,492 | |
Adjustments to fair value:
| | | | | | | | | | | | | | | | |
| Included in other comprehensive income | | | 3,406 | | | | 19,677 | | | | 46 | | | | (1,219 | ) |
| Other-than-temporary impairments | | | — | | | | (7,641 | ) | | | — | | | | (2,002 | ) |
| Balance as of December 31, 2013 | | $ | — | | | $ | — | | | $ | — | | | $ | 6,762 | |
The following roll forward table reconciles the beginning and ending balances of financial liabilities measured at fair value on a recurring basis using Level III inputs:
| | |
| | Derivative Instruments |
| Balance as of December 31, 2012 | | $ | 173,623 | |
| Gramercy Finance disposal | | | (163,716 | ) |
| Issuance of contingent rights value obligation | | | 1,730 | |
Adjustments to fair value:
| |
| Unrealized loss | | | (11,335 | ) |
| Balance as of December 31, 2013 | | $ | 302 | |
Fair Value on a Non-Recurring Basis
The Company uses fair value measurements on a non-recurring basis in its assessment of fair value on loans and other lending investments that have been written down to fair value as a result of valuation allowances established for loan losses and loans and other lending investments classified as held-for-sale to adjust the carrying value to the lower of cost or fair value. As of March 15, 2013, or on the date of disposal of Gramercy Finance, the Company evaluated its loan investments for impairment before derecognizing the loan investments at the lower of cost or fair value. The Company recorded no impairments as of March 15,
112
TABLE OF CONTENTS
Gramercy Property Trust Inc.
Notes To Consolidated Financial Statements
(Amounts in thousands, except share and per share data)
December 31, 2013
11. Fair Value of Financial Instruments – (continued)
2013. This differs from the Company’s determination of allowances for loan losses as the Company considered the value that a purchaser would be willing to acquire the asset at the date of disposal instead of at the ultimate resolution of the asset.
At December 31, 2013, the Company did not measure any assets at fair value on a non-recurring basis. The following table shows the fair value hierarchy for those assets measured at fair value on a non-recurring basis based upon the lowest level of significant input to the valuations for which a non-recurring change in fair value has been recorded during the year ended December 31, 2012.
| | | | | | | | |
| At December 31, 2012 | | Total | | Level I | | Level II | | Level III |
Financial Assets:
| | | | | | | | | | | | | | | | |
Lending investments – held-for-sale (allowance for loan loss):
| | | | | | | | | | | | | | | | |
| Whole loans | | $ | 60,335 | | | $ | — | | | $ | — | | | $ | 60,335 | |
| Subordinate interests in whole loans | | | 9,131 | | | | — | | | | — | | | | 9,131 | |
| Mezzanine loans | | | — | | | | — | | | | — | | | | — | |
| Preferred equity | | | — | | | | — | | | | — | | | | — | |
| | | $ | 69,466 | | | $ | — | | | $ | — | | | $ | 69,466 | |
Lending investments – held-for-sale (impairment for lower of cost or fair value):
| | | | | | | | | | | | | | | | |
| Whole loans | | $ | 174,477 | | | $ | — | | | $ | — | | | $ | 174,477 | |
| Subordinate interests in whole loans | | | 1,649 | | | | — | | | | — | | | | 1,649 | |
| Mezzanine loans | | | 20,422 | | | | — | | | | — | | | | 20,422 | |
| Preferred equity | | | — | | | | — | | | | — | | | | — | |
| | | $ | 196,548 | | | $ | — | | | $ | — | | | $ | 196,548 | |
Real Estate Investments:
| | | | | | | | | | | | | | | | |
| Office | | $ | 3,593 | | | $ | — | | | $ | — | | | $ | 3,593 | |
| Land | | | 24,195 | | | | — | | | | — | | | | 24,195 | |
| Hotel | | | 24,034 | | | | — | | | | — | | | | 24,034 | |
| Branch | | | 4,749 | | | | — | | | | — | | | | 4,749 | |
| Industrial | | | — | | | | — | | | | — | | | | — | |
| | | $ | 56,571 | | | $ | — | | | $ | — | | | $ | 56,571 | |
Real estate investments: The properties identified for impairment have been classified as assets held-for-sale. The impairment on properties classified as held-for-sale is calculated by comparing the results of the Company’s marketing efforts and unsolicited purchase offers to the carrying value of the respective property. The marketing valuations are based on internally developed discounted cash flow models which include assumptions that require significant management judgment regarding capitalization rates, lease-up periods, future occupancy rates, market rental rates, holding periods, capital improvements and other factors deemed necessary by management. The impairment is calculated by comparing the Company’s internally developed discounted cash flow methodology to the carrying value of the respective property.
Loans subject to impairments or reserves for loan loss: The loans identified for impairment or reserves for loan loss are collateral dependent loans. Impairment or reserves for loan loss are measured by comparing management’s estimated fair value of the underlying collateral to the carrying value of the respective loan. These valuations require significant judgments, which include assumptions regarding
113
TABLE OF CONTENTS
Gramercy Property Trust Inc.
Notes To Consolidated Financial Statements
(Amounts in thousands, except share and per share data)
December 31, 2013
11. Fair Value of Financial Instruments – (continued)
capitalization rates, leasing, creditworthiness of major tenants, occupancy rates, availability of financing, exit plan, loan sponsorship, actions of other lenders and other factors deemed necessary by management.
The valuations derived from pricing models may include adjustments to the financial instruments. These adjustments may be made when, in management’s judgment, either the size of the position in the financial instrument or other features of the financial instrument such as its complexity, or the market in which the financial instrument is traded (such as counterparty, credit, concentration or liquidity) require that an adjustment be made to the value derived from the pricing models. Additionally, an adjustment from the price derived from a model typically reflects management’s judgment that other participants in the market for the financial instrument being measured at fair value would also consider such an adjustment in pricing that same financial instrument.
Assets and liabilities presented at fair value and categorized as Level III are generally those that are marked to model using relevant empirical data to extrapolate an estimated fair value. The models’ inputs reflect assumptions that market participants would use in pricing the instrument in a current period transaction and outcomes from the models represent an exit price and expected future cash flows. The parameters and inputs are adjusted for assumptions about risk and current market conditions. Changes to inputs in valuation models are not changes to valuation methodologies; rather, the inputs are modified to reflect direct or indirect impacts on asset classes from changes in market conditions. Accordingly, results from valuation models in one period may not be indicative of future period measurements.
12. Derivative Instruments
The Company recognizes all derivatives on the balance sheet at fair value. Derivatives that are not hedges must be adjusted to fair value through income. If a derivative is a hedge, depending on the nature of the hedge, changes in the fair value of the derivative will either be offset against the change in fair value of the hedged asset, liability or firm commitment through earnings, or recognized in other comprehensive income until the hedged item is recognized in earnings. The ineffective portion of a derivative’s change in fair value will be immediately recognized in earnings. Derivative accounting may increase or decrease reported net income and stockholders’ equity prospectively, depending on future levels of LIBOR interest rates and other variables affecting the fair values of derivative instruments and hedged items, but will have no effect on cash flows, provided the contract is carried through to full term.
The following table summarizes the notional and fair value of the Company’s derivative financial instruments at December 31, 2013. The notional value is an indication of the extent of the Company’s involvement in this instrument at that time, but does not represent exposure to credit, interest rate or market risks:
| | | | | | | | | | | | |
| | Benchmark Rate | | Notional Value | | Strike Rate | | Effective Date | | Expiration Date | | Fair
Value |
Assets of Non-VIEs:
| | | | | | | | | | | | | | | | | | | | | | | | |
| Interest Rate Swap | | | 1 mo. USD-LIBOR-BBA | | | $ | 16,055 | | | | 4.55 | % | | | 12/19/13 | | | | 12/19/20 | | | $ | (187 | ) |
| Interest Rate Cap | | | 1 mo. USD-LIBOR-BBA | | | | 24,000 | | | | 5.00 | % | | | 07/19/11 | | | | 08/09/14 | | | | — | |
| Contingent Value Rights(1) | | | n/a | | | | 11,535 | | | | n/a | | | | 10/01/13 | | | | 03/25/14 | | | | (115 | ) |
| Total derivatives | | | | | | $ | 51,590 | | | | | | | | | | | | | | | $ | (302 | ) |
114
TABLE OF CONTENTS
Gramercy Property Trust Inc.
Notes To Consolidated Financial Statements
(Amounts in thousands, except share and per share data)
December 31, 2013
12. Derivative Instruments – (continued)
| (1) | Pursuant to each CVR Agreement, on March 25, 2014, the Company will calculate the volume-weighted average price, or the VWAP, for the common stock for the 10 trading days period ending on, and including, March 25, 2014, or the CVR Period VWAP. On April 1, 2014, the Company will pay to the holder of the contingent value rights, in immediately available funds, an amount in cash, equal to (a) the number of contingent value rights held by the holder on the CVR Test Date multiplied by (b) the amount, not to exceed $0.46 equal to the difference between the per share purchase price of $4.11 and the CVR Period VWAP. |
The Company is hedging exposure to variability in future interest payments on its debt facilities. At December 31, 2013, derivative instruments were reported at their fair value as a net liability of $302. At December 31, 2012, derivative instruments were reported at their fair value as a net liability of $173,450 within discontinued operations. Over time, the realized and unrealized gains and losses held in Accumulated Other Comprehensive Income will be reclassified into earnings in the same periods in which the hedged interest payments affect earnings.
13. Stockholders’ Equity (Deficit)
The Company’s authorized capital stock consists of 200,000,000 shares, $0.001 par value per share, of which the Company is authorized to issue up to 100,000,000 shares of common stock, $0.001 par value per share, 25,000,000 shares of preferred stock, par value $0.001 per share and 75,000,000 shares of excess stock, $0.001 par value per share. As of December 31, 2013, 71,313,043 shares of common stock, 3,525,822 shares of preferred stock and no shares of excess stock were issued and outstanding, respectively.
In connection with Mr. Gordon F. DuGan’s agreement to serve as the Company’s Chief Executive Officer, on June 7, 2012, Mr. DuGan also agreed to purchase 1,000,000 shares of the Company’s common stock from the Company on June 29, 2012 for an aggregate purchase price of $2,520 or $2.52 per share. The per share purchase price was equal to the closing price of the Company’s common stock on the New York Stock Exchange on the day prior to the date Mr. DuGan entered into the subscription agreement with the Company to purchase such shares of common stock. The issuance of such shares of common stock was a private placement exempt from the registration requirements of the Securities Act of 1933, as amended.
The Company issued to KBS Acquisition Sub-Owner 2, LLC (i) 2,000,000 shares of common stock of the Company, par value $0.001 per share; (ii) 2,000,000 shares of Class B-1 non-voting common stock of the Company, par value $0.001 per share; and (iii) 2,000,000 shares of Class B-2 non-voting common stock of the Company, par value $0.001 per share on December 6, 2012. The shares were issued as consideration for the Company’s contribution to the joint venture with Garrison in connection with the acquisition of the Bank of America Portfolio on the same date and were valued at $2.75 which was the closing price of the Company’s common stock on the New York Stock Exchange on the day prior. Each share of the Class B-1 common stock and Class B-2 common stock will be convertible into one share of the Company’s common stock at the option of the holder at any time on or after September 5, 2013 and December 6, 2013, respectively. During 2013, all Class B-1 and Class B-2 common stock was converted into an equal amount of shares of the Company’s common stock. In December, 2013, we filed an articles supplementary to our charter to reclassify 2,000,000 authorized shares of Class B-1 common stock and 2,000,000 authorized shares of Class B-2 common stock into the same number of authorized but unissued shares of our common stock. The reclassification (i) increased the number of shares of common stock from 96,000,000 shares immediately prior to the reclassification to 100,000,000 shares of common stock immediately after the reclassification; (ii) decreased the number of shares classified as Class B-1 Common Stock from 2,000,000 shares immediately prior to the reclassification to no shares immediately after the reclassification; and (iii) decreased the number of shares classified as Class B-2 Common Stock from 2,000,000 shares immediately prior to the reclassification to no shares immediately after the reclassification.
115
TABLE OF CONTENTS
Gramercy Property Trust Inc.
Notes To Consolidated Financial Statements
(Amounts in thousands, except share and per share data)
December 31, 2013
13. Stockholders’ Equity (Deficit) – (continued)
In October 2013, the Company entered into a common stock purchase agreement and related joinder agreements, or the Purchase Agreement, for the issuance of 11,535,200 shares of common stock at a purchase price of $4.11 per share, raising gross proceeds of $47,410, to various purchasers in a private placement, or the Private Placement. Pursuant to the Purchase Agreement, each purchaser has agreed that it will not, without the prior written consent of the Company, offer, sell, contract to sell, pledge or otherwise dispose any or all of the common stock purchased until March 25, 2014, or the Lock-Up Period. During the Lock-Up Period, if the Company issues common stock or securities convertible into common stock (except for certain permitted issuances), then the purchasers will have the ability to: (1) purchase their pro rata portion of all or any part of the new issuance, and (2) elect the benefit of any different terms provided to the new investors.
Pursuant to the Purchase Agreement, the Company entered into contingent value rights agreements, or the CVR Agreements, with the Purchasers at the closing of the sale of common stock in the Private Placement which are discussed in more detail in Note 12.
The shares of common stock sold in the Private Placement were offered and sold pursuant to an exemption from the registration requirements under Rule 506 of Regulation D promulgated under the Securities Act of 1933. The purchasers were accredited investors as defined in Rule 501 of Regulation D promulgated under the Securities Act of 1933. Morgan Stanley & Co. LLC acted as the placement agent in connection with the Private Placement.
Preferred Stock
In April 2007, the Company issued 4,600,000 shares of its 8.125% Series A cumulative redeemable preferred stock (including the underwriters’ over-allotment option of 600,000 shares) with a mandatory liquidation preference of $25.00 per share, or the Series A Preferred Stock. Holders of the Series A Preferred Stock are entitled to receive annual dividends of $2.03125 per share on a quarterly basis and dividends are cumulative, subject to certain provisions. On or after April 18, 2012, the Company may at its option redeem the Series A Preferred Stock at par for cash. Net proceeds (after deducting underwriting fees and expenses) from the offering were approximately $111,205. In November 2010, we repurchased 1,074,178 shares of the Series A Preferred Stock pursuant to a tender offer.
As of December 31, 2013 and 2012, the Company accrued Series A Preferred Stock dividends of $37,600 and $30,438, respectively. In December 2013, the Company’s board of directors authorized and declared a “catch-up” dividend in the amount of $10.23524 per share of its 8.125% Series A Cumulative Redeemable Preferred Stock, representing all accrued and unpaid dividends on the Series A Preferred Stock for the period October 1, 2008, through and including October 14, 2013. In December 2013, the Company’s board of directors also authorized and declared a Series A Preferred Stock quarterly dividend payment in the amount of $0.50781 per share, for the period October 15, 2013, through and including January 14, 2014. Both the accrued dividend and the quarterly dividend were paid to holders of the Series A Preferred Stock of record as of the close of business on December 31, 2013. The accrued dividend was paid on January 13, 2014, and the quarterly dividend was paid on January 15, 2014.
Equity Incentive Plan
As part of the Company’s initial public offering, the Company instituted its Equity Incentive Plan. The Equity Incentive Plan, as amended, authorizes (i) the grant of stock options that qualify as incentive stock options under Section 422 of the Internal Revenue Code, or ISOs, (ii) the grant of stock options that do not qualify, or NQSOs, (iii) the grant of stock options in lieu of cash directors’ fees and (iv) grants of shares of restricted and unrestricted common stock. The exercise price of stock options will be determined by the compensation committee, but may not be less than 100% of the fair market value of the shares of common stock on the date of grant. At December 31, 2013, 2,070,416 shares of common stock were available for issuance under the Equity Incentive Plan.
116
TABLE OF CONTENTS
Gramercy Property Trust Inc.
Notes To Consolidated Financial Statements
(Amounts in thousands, except share and per share data)
December 31, 2013
13. Stockholders’ Equity (Deficit) – (continued)
Through December 31, 2013, 1,787,872 restricted shares had been issued under the Equity Incentive Plan, of which 91% have vested. Except for certain performance based awards, the vested and unvested shares are currently entitled to receive distributions on common stock if declared by the Company. Holders of restricted shares are prohibited from selling such shares until they vest but are provided the ability to vote such shares beginning on the date of grant. Compensation expense of $579, $958 and $301 was recorded for the years ended December 31, 2013, 2012 and 2011, respectively, related to the issuance of restricted shares. Compensation expense of $1,542 will be recorded over the course of the next 50 months representing the remaining weighted average vesting period of equity awards issued under the Equity Incentive Plan as of December 31, 2013. Certain of the Company’s awards are subject to performance vesting conditions which were determined in March 2013 and are assessed on a quarterly basis.
Options granted under the Equity Incentive Plan to recipients who are employees of Gramercy are exercisable at the fair market value on the date of grant and, subject to termination of employment, expire ten years from the date of grant, are not transferable other than on death, and are exercisable in three to four annual installments commencing one year from the date of grant. The Company issues new shares upon the exercise of vested options. In some instances, options may be granted under the Equity Incentive Plan to persons who provide significant services to the Company but are not employees of the Company. Options granted to recipients that are not employees have the same terms as those issued to employees except as it relates to any performance-based provisions within the grant. To the extent there are performance provisions associated with a grant to a recipient who is not an employee, an estimated expense related to these options is recognized over the vesting period and the final expense is reconciled at the point performance has been met, or the measurement date. If no performance based provision exists, the Company recognizes compensation expense over the vesting period on a straight line basis.
A summary of the status of the Company’s stock options as of December 31, 2013, 2012 and 2011 are presented below:
| | | | | | | | | | | | |
| | December 31, 2013 | | December 31, 2012 | | December 31, 2011 |
| | | Options Outstanding | | Weighted Average Exercise Price | | Options Outstanding | | Weighted Average Exercise Price | | Options Outstanding | | Weighted Average Exercise Price |
| Balance at beginning of period | | | 360,251 | | | $ | 16.14 | | | | 565,026 | | | $ | 17.25 | | | | 841,377 | | | $ | 11.82 | |
| Granted | | | 30,000 | | | | 3.05 | | | | 25,000 | | | | 2.50 | | | | 25,000 | | | | 2.79 | |
| Exercised | | | — | | | | — | | | | — | | | | — | | | | (300,000 | ) | | | 0.80 | |
| Lapsed or cancelled | | | (49,170 | ) | | | 22.49 | | | | (229,775 | ) | | | 16.83 | | | | (1,351 | ) | | | 22.50 | |
| Balance at end of period | | | 341,081 | | | $ | 14.70 | | | | 360,251 | | | $ | 16.14 | | | | 565,026 | | | $ | 17.25 | |
For the year ended December 31, 2013, all options were granted with a price of $3.05. The remaining weighted average contractual life of the options was 3.9 years. Compensation expense of $51, $29 and $138 was recorded for the years ended December 31, 2013, 2012 and 2011, respectively, related to the issuance of stock options.
In March 2013, the Company granted to four senior officers of the Company pursuant to the Equity Incentive Plan a total of 115,000 time-based restricted stock awards and 345,000 performance-based restricted stock units. The time-based awards vest in five equal annual installments commencing December 15, 2013, subject to continued employment. Vesting of the performance-based units requires, in addition to continued employment over a 5-year period, achievement of absolute increases in either the Company’s stock price or an adjusted funds from operations (as defined by the Company’s compensation committee).
117
TABLE OF CONTENTS
Gramercy Property Trust Inc.
Notes To Consolidated Financial Statements
(Amounts in thousands, except share and per share data)
December 31, 2013
13. Stockholders’ Equity (Deficit) – (continued)
In connection with the hiring of Gordon F. DuGan, Benjamin P. Harris, and Nicholas L. Pell, who joined the Company on July 1, 2012 as Chief Executive Officer, President and Managing Director, respectively, the Company has granted equity awards to these new executives pursuant to a newly adopted outperformance plan, or the 2012 Outperformance Plan, in the form of LTIP units. LTIP units are a class of limited partnership interests in GPT Property Trust LP, the Company’s operating partnership, that are structured to quality as “profits interests” for federal income tax purposes and do not have full parity, on a per unit basis, with the Class A limited partnership interests in the Company or its operating partnership with respect to liquidating distributions. Pursuant to the 2012 Outperformance Plan, these executives, in the aggregate, may earn up to $20,000 of LTIP Units based on the Company’s common stock price appreciation over a four-year performance period ending June 30, 2016. The amount of LTIP Units earned under the 2012 Outperformance Plan will range from $4,000 if the Company’s common stock price equals a minimum hurdle of $5.00 per share (less any dividends paid during the performance period) to $20,000 if the Company’s common stock price equals or exceeds $9.00 per share (less any dividends paid during the performance period) at the end of the performance period. In the event that the performance hurdles are not met on a vesting date, the award scheduled to vest on that vesting date may vest on a subsequent vesting date if the common stock price hurdle is met as of such subsequent vesting date. The executives will not earn any LTIP Units under the 2012 Outperformance Plan to the extent that the Company’s common stock price is less than the minimum hurdle. Messrs. DuGan, Harris and Pell were granted awards under the 2012 Outperformance Plan pursuant to which they may earn up to $10,000, $6,000 and $4,000 of LTIP Units, respectively. During the performance period, the executives may earn up to 12%, 24% and 36% of the maximum amount under the 2012 Outperformance Plan at the end of the first, second and third years, respectively, of the performance period if the Company’s common stock price has equaled or exceeded the stock price hurdles as of the end of such years. If the minimum stock price hurdle is met as of the end of any such year, the actual amount earned will range on a sliding scale from 20% of the maximum amount that may be earned as of such date (at the minimum stock price hurdle) to 100% of the maximum amount that may be earned as of such date (at the maximum stock price hurdle). Any LTIP Units earned under the 2012 Outperformance Plan will remain subject to vesting, with 50% of any LTIP Units earned vesting on June 30, 2016 and the remaining 50% vesting on June 30, 2017 based, in each case, on continued employment through the vesting date. The LTIP Units issued in July 2012 in connection with the hiring of new executives had a fair value of $1,870 on the date of grant, which was calculated in accordance with ASC 718.
In March 2013, the Company granted four senior officers equity awards pursuant to the 2012 Outperformance Plan in the form of LTIP units having an aggregate maximum value of $4,000, and a fair value of $845, which was calculated in accordance with ASC 718. The Company used a probabilistic valuation approach to estimate the inherent uncertainty that the LTIP Units may have with respect to the Company’s common stock. Compensation expense of $555 and $210 was recorded for the years ended December 31, 2013 and 2012 for the 2012 Outperformance Plan. Compensation expense of $1,943 will be recorded over the course of the next 36 months, representing the remaining weighted average vesting period of the LTIP Units as of December 31, 2013.
In connection with the equity awards made to Messrs. DuGan, Harris and Pell in connection with the Company’s hiring of these executives, the Company adopted the 2012 Inducement Equity Incentive Plan, or the Inducement Plan. Under the Inducement Plan, the Company may grant equity awards for up to 4,500,000 shares of common stock pursuant to the employment inducement award exemption provided by the New York Stock Exchange Listed Company Manual. The Inducement Plan permits the Company to issue a variety of equity awards, including stock options, restricted stock, phantom shares, dividend equivalent rights and other equity-based awards. All of the shares available under the Inducement Plan were issued or reserved for issuance to Messrs. DuGan, Harris and Pell in connection with the equity awards made upon the commencement of their employment with the Company. Equity awards issued under the Inducement Plan had
118
TABLE OF CONTENTS
Gramercy Property Trust Inc.
Notes To Consolidated Financial Statements
(Amounts in thousands, except share and per share data)
December 31, 2013
13. Stockholders’ Equity (Deficit) – (continued)
a fair value of $3,830 on the date of grant which was calculated in accordance with ASC 718. Compensation expense of $766 and $383 was recorded for years ended December 31, 2013 and 2012 for the 2012 Inducement Equity Incentive Plan. Compensation expense of $2,681 will be recorded over the course of the next 30 months representing the remaining weighted average vesting period of equity awards issued under the Inducement Plan as of December 31, 2013.
The Company had previously issued LTIP unit awards to both the former Chief Executive Officer and the former President. During 2011, the Company entered into an amendment to the LTIP unit award agreement with these executives to cancel the vesting schedule of outstanding LTIP units in the Partnership (“LTIP Units”) and grant a new vesting schedule with respect to such LTIP Units. The new vesting schedule provided for 50% of each executive's LTIP Units to vest on June 30, 2012 subject to continued employment and an additional 50% of each Executive's LTIP Units to vest upon the satisfaction of certain vesting conditions relating to the settlement of the Company's mortgage and mezzanine loans. Compensation expense of $0, $401 and $1,433 was recorded for the years ended December 31, 2013, 2012 and 2011, respectively, related to the issuance and modification of LTIP units.
Employee Stock Purchase Plan
In November 2007, the Company’s board of directors adopted, and the stockholders subsequently approved in June 2008, the 2008 Employee Stock Purchase Plan, or ESPP, to provide equity-based incentives to eligible employees. The ESPP is intended to qualify as an “employee stock purchase plan” under Section 423 of the Internal Revenue Code of 1986, as amended, and has been adopted by the board to enable the Company’s eligible employees to purchase its shares of common stock through payroll deductions. The ESPP became effective on January 1, 2008 with a maximum of 250,000 shares of the common stock available for issuance, subject to adjustment upon a merger, reorganization, stock split or other similar corporate change. The Company filed a registration statement on Form S-8 with the Securities and Exchange Commission with respect to the ESPP. The common stock is offered for purchase through a series of successive offering periods. Each offering period will be three months in duration and will begin on the first day of each calendar quarter, with the first offering period having commenced on January 1, 2008. The ESPP provides for eligible employees to purchase the common stock at a purchase price equal to 85% of the lesser of (1) the market value of the common stock on the first day of the offering period or (2) the market value of the common stock on the last day of the offering period.
Deferred Stock Compensation Plan for Directors
Under the Company’s Independent Director’s Deferral Program, which commenced April 2005, the Company’s independent directors may elect to defer up to 100% of their annual retainer fee, chairman fees and meeting fees. Unless otherwise elected by a participant, fees deferred under the program shall be credited in the form of phantom stock units. The phantom stock units are convertible into an equal number of shares of common stock upon such directors’ termination of service from the board of directors or a change in control by the Company, as defined by the program. Phantom stock units are credited to each independent director quarterly using the closing price of the Company’s common stock on the applicable dividend record date for the respective quarter. If dividends are declared by the Company, each participating independent director who elects to receive fees in the form of phantom stock units has the option to have their account credited for an equivalent amount of phantom stock units based on the dividend rate for each quarter or have dividends paid in cash.
As of December 31, 2013, there were approximately 534,038 phantom stock units outstanding, of which 528,538 units are vested.
119
TABLE OF CONTENTS
Gramercy Property Trust Inc.
Notes To Consolidated Financial Statements
(Amounts in thousands, except share and per share data)
December 31, 2013
13. Stockholders’ Equity (Deficit) – (continued)
Earnings per Share
Earnings per share for the years ended December 31, 2013, 2012 and 2011 are computed as follows:
| | | | | | |
| | For the Year Ended December 31, |
| | | 2013 | | 2012 | | 2011 |
Numerator – Income (loss)
| | | | | | | | | | | | |
| Net income (loss) from continuing operations | | $ | (8,172 | ) | | $ | (18,341 | ) | | $ | (20,903 | ) |
| Net income (loss) from discontinued operations | | | 392,999 | | | | (153,207 | ) | | | 358,380 | |
| Net Income (loss) | | | 384,827 | | | | (171,548 | ) | | | 337,477 | |
| Preferred stock dividends | | | (7,162 | ) | | | (7,162 | ) | | | (7,162 | ) |
| Numerator for basic income per share – Net income (loss) available to common stockholders: | | | 377,665 | | | | (178,710 | ) | | | 330,315 | |
| Effect of dilutive securities | | | — | | | | — | | | | — | |
Diluted Earnings:
| | | | | | | | | | | | |
| Net income (loss) available to common stockholders | | $ | 377,665 | | | $ | (178,710 | ) | | $ | 330,315 | |
Denominator – Weighted Average shares:
| | | | | | | | | | | | |
| Weighted average shares outstanding | | | 62,179,631 | | | | 53,359,850 | | | | 50,229,102 | |
| Less: Unvested restricted shares | | | (678,784 | ) | | | (1,383,388 | ) | | | — | |
| Denominator for basic income per share | | | 61,500,847 | | | | 51,976,462 | | | | 50,229,102 | |
Effect of dilutive securities
| | | | | | | | | | | | |
| LTIP | | | — | | | | — | | | | — | |
| Stock based compensation plans | | | — | | | | — | | | | — | |
| Phantom stock units | | | — | | | | — | | | | — | |
| Diluted shares | | | 61,500,847 | | | | 51,976,462 | | | | 50,229,102 | |
Diluted income (loss) per share assumes the conversion of all common share equivalents into an equivalent number of common shares if the effect is not anti-dilutive. For the year ended December 31, 2013, 51,412 share options and 534,038 phantom share units were computed using the treasury share method, which due to the net loss from continuing operations were anti-dilutive. For the year ended December 31, 2012, 16,362 share options, and 462,102 phantom share units were computed using the treasury share method, which due to the net loss from continuing operations were anti-dilutive. For the year ended December 31, 2011, 261,918 share options and 499,143 phantom share units were computed using the treasury share method, which due to the net loss from continuing operations were anti-dilutive.
120
TABLE OF CONTENTS
Gramercy Property Trust Inc.
Notes To Consolidated Financial Statements
(Amounts in thousands, except share and per share data)
December 31, 2013
13. Stockholders’ Equity (Deficit) – (continued)
Accumulated other comprehensive income (loss)
Accumulated other comprehensive income (loss) as of December 31, 2013, 2012 and 2011 is comprised of the following:
| | | | | | |
| | As of December 31, |
| | | 2013 | | 2012 | | 2011 |
| Net realized and unrealized losses on interest rate swap and cap agreements accounted for as cash flow hedges | | $ | (186 | ) | | $ | (179,956 | ) | | $ | (182,102 | ) |
| Net unrealized gain (loss) on available-for-sale securities | | | — | | | | 84,691 | | | | (258,837 | ) |
| Net unrealized loss on debt securities | | | (1,219 | ) | | | — | | | | — | |
| Total accumulated other comprehensive (loss) | | $ | (1,405 | ) | | $ | (95,265 | ) | | $ | (440,939 | ) |
The Company reclassified unrealized gains on CMBS of $107,774 for the year ended December 31, 2013 into net income as a component of the gain on disposal of Gramercy Finance on the Consolidated Statement of Operations and Comprehensive Income (Loss). The Company also reclassified the unamortized fair value of terminated swaps previously designated as cash flow hedges of $6,359 into net income as a component of the gain on disposal of Gramercy Finance on the Consolidated Statement of Operations and Comprehensive Income (Loss).
14. Benefit Plans
In June 2009, the Company implemented a 401(k) Savings/Retirement Plan, or the 401(k) Plan, to cover eligible employees of the Company, and any designated affiliate. The 401(k) Plan permits eligible employees to defer up to 15% of their annual compensation, subject to certain limitations imposed by the Code. The employees’ elective deferrals are immediately vested and non-forfeitable. The 401(k) Plan provides for discretionary matching contributions by the Company. Except for the 401(k) Plan, at December 31, 2013, the Company did not maintain a defined benefit pension plan, post-retirement health and welfare plan or other benefit plans. The expense associated with the Company’s matching contribution was $156, $227 and $218 for the years ended December 31, 2013, 2012 and 2011, respectively.
15. Commitments and Contingencies
The Company is obligated under certain tenant leases, to construct the underlying leased property or fund tenant expansions. As of December 31, 2013, the Company had four outstanding commitments: (1) the construction of a 118,000 square foot cold storage facility located in Hialeah Gardens, Florida, of which the unfunded amounts were estimated to be $16,772; (2) the contribution of $1,500 towards tenant improvements on a warehouse/industrial property in Garland, Texas, of which the unfunded amounts were estimated to be $854; (3) the expansion of a property located in Olive Branch, Mississippi, whereby the tenant has a one-time option to expand the building by 250,000 square feet; and (4) the expansion of a property located in Logan Township, New Jersey, whereby the tenant has a one-time option to expand the building by 25,000 square feet. The tenants have not noticed the Company for the building expansion options and as such, no amounts are due and no unfunded amounts have been estimated.
The Company evaluates litigation contingencies based on information currently available, including the advice of counsel and the assessment of available insurance coverage. The Company will establish accruals for litigation and claims when a loss contingency is considered probable and the related amount is reasonably estimable. The Company will periodically review these contingences which may be adjusted if circumstances change. The outcome of a litigation matter and the amount or range of potential losses at particular points may be difficult to ascertain. If a range of loss is estimated and an amount within such range appears to be a better estimate than any other amount within that range, then that amount is accrued.
121
TABLE OF CONTENTS
Gramercy Property Trust Inc.
Notes To Consolidated Financial Statements
(Amounts in thousands, except share and per share data)
December 31, 2013
15. Commitments and Contingencies – (continued)
In December 2010, the Company sold its 45% joint venture interest in the leased fee of the 2 Herald Square property in New York, New York, for approximately $25,600 plus assumed mortgage debt of approximately $86,100 or the 2 Herald Sale Transaction. Subsequent to the closing of the transaction, the New York City Department of Finance, or the NYC DOF, and New York State Department of Taxation, or the NYS DOT, issued notices of determination assessing, in the case of the NYC DOF notice, approximately $2,924 of real property transfer tax, plus interest, and, in the case of the NYS DOT notice, approximately $446 of real property transfer tax, plus interest, collectively, the Transfer Tax Assessments, against the Company in connection with the 2 Herald Sale Transaction. The Company believes that NYC DOF and NYS DOT erred in issuing the Transfer Tax Assessments and intends to vigorously defend against same. In September 2013, the Company filed a petition challenging the NYC DOF Transfer Tax Assessment with the New York City Tax Appeal Tribunal, and intends to timely file a similar petition challenging the NYS DOF Transfer Tax Assessment.
In November 2013, NYC DOF filed an answer to the petition reiterating their position that the 2 Herald Sale Transaction was taxable by NYC DOF. In January and February 2014, the parties held a preliminary conference with the trial judge assigned the matter, agreed to discuss whether a settlement could be reached and subsequently determined that no such settlement was possible. A follow-up conference with the judge is scheduled during March 2014, at which the Company anticipates that parties will advise the judge that they wish to proceed to trial, which the Company expects to occur in mid-2014.
An initial conciliation conference for the NYS DOT Transfer Tax Assessment was held in October 2013. In November 2013, the NYS DOT provided additional information in support of its position. In February 2014, following a discussion, the Company and the NYS DOT determined that the parties could not amicably settle the dispute. The Company expects that the conciliator will issue its determination shortly, following which the Company will formally file our petition challenging the NYS DOT Transfer Tax Assessment.
The Company believes that it has strong defenses against the Transfer Tax Assessments and intends to continue to vigorously assert same. The Company evaluates contingencies based on information currently available, including the advice of counsel. The Company establishes accruals for litigation and claims when a loss contingency is considered probable and the related amount is reasonably estimable. The Company will periodically review these contingences and may adjust the amount of the accrual if circumstances change. The outcome of a contingent matter and the amount or range of potential losses at particular points may be difficult to ascertain. If a range of loss is estimated and an amount within such range appears to be a better estimate than any other amount within that range, then that amount is accrued. Considering the recent developments as discussed above, as of December 31, 2013, the Company established an accrual of approximately $4,339 for the Transfer Tax Assessments, which represents the full amount of the assessed tax plus estimated interest and penalties through December 31, 2013, within discontinued operations.
In addition, the Company and/or one or more of its subsidiaries is party to various litigation matters that are considered routine litigation incidental to its business, none of which are considered material.
The Company’s corporate offices at 521 Fifth Avenue, 30th Floor, New York, New York are subject to an operating lease agreement with 521 Fifth Fee Owner, LLC, an affiliate of SL Green, effective as of September 2013. The lease is for approximately 6,580 square feet and carries a term of 10 years with rents of approximately $373 per annum for year one rising to $463 per annum in year ten.
The Company’s previous corporate offices at 420 Lexington Avenue, New York, New York, were subject to an operating lease agreement with SLG Graybar Sublease LLC, an affiliate of SL Green, effective May 1, 2005, which was subsequently amended in May and June 2009 and in June 2012. In April 2013, the Company
122
TABLE OF CONTENTS
Gramercy Property Trust Inc.
Notes To Consolidated Financial Statements
(Amounts in thousands, except share and per share data)
December 31, 2013
15. Commitments and Contingencies – (continued)
gave notice that it was cancelling the lease for the corporate offices at 420 Lexington Avenue effective in September 2013 concurrently with the commencement of the lease for the new corporate offices at 521 Fifth Avenue.
The Company’s regional management office located at 610 Old York Road, Jenkintown, Pennsylvania, is subject to an operating lease with an affiliate of KBS REIT. The lease is for approximately 19,000 square feet, and expires on April 30, 2014, with rents of approximately $322 per annum. The Company’s regional management office located at 800 Market Street, St. Louis, Missouri is subject to an operating lease with St. Louis BOA Plaza, LLC. The lease is for approximately 2,000 square feet, expires on September 30, 2014, and is cancelable with 60 days’ notice. The lease is subject to rents of $32 per annum.
16. Income Taxes
The Company has elected to be taxed as a REIT, under Sections 856 through 860 of the Internal Revenue Code beginning with its taxable year ended December 31, 2004. To qualify as a REIT, the Company must meet certain organizational and operational requirements, including a requirement to distribute at least 90% of its ordinary taxable income to stockholders. As a REIT, the Company generally will not be subject to U.S. federal income tax on taxable income that it distributes to its stockholders. If the Company fails to qualify as a REIT in any taxable year, it will then be subject to U.S. federal income taxes on taxable income at regular corporate rates and will not be permitted to qualify for treatment as a REIT for U.S. federal income tax purposes for four years following the year during which qualification is lost unless the Internal Revenue Service grants the Company relief under certain statutory provisions. Such an event could materially adversely affect the Company’s net income and net cash available for distributions to stockholders. However, the Company believes that it is organized and will operate in such a manner as to qualify for treatment as a REIT and the Company intends to operate in the foreseeable future in such a manner so that it will qualify as a REIT for U.S. federal income tax purposes. The Company may, however, be subject to certain state and local taxes. Our TRSs are subject to federal, state and local taxes. The Company’s Asset and Property management business, Gramercy Asset Management, conducts its business through a wholly-owned TRS. In addition to the limitation on the Company's use of its net operating losses under Section 382, since the Company uses separate taxable REIT subsidiaries to conduct different aspects of its business, losses incurred by the individual TRSs are only available to offset taxable income derived by each respective TRS.
Beginning with the third quarter of 2008, the Company’s board of directors elected to not pay a dividend to common stockholders. The board of directors also elected not to pay the Series A Preferred Stock dividend of $0.50781 per share beginning with the fourth quarter of 2008. The unpaid preferred stock dividends were accrued for twenty-one quarters through December 31, 2013. In December 2013, the board of directors authorized and the Company declared a “catch-up” dividend in the amount of $10.23524 per share of the 8.125% Series A Cumulative Redeemable Preferred Stock, representing all accrued and unpaid dividends on the Series A Preferred Stock for the period October 1, 2008, through and including October 14, 2013. In December 2013, the board of directors also authorized and the Company declared a Series A Preferred Stock quarterly dividend payment in the amount of $0.50781 per share, for the period October 15, 2013, through and including January 14, 2014. Both the accrued dividend and the quarterly dividend were paid to holders of the Series A Preferred Stock of record as of the close of business on December 31, 2013. The accrued dividend was paid on January 13, 2014, and the quarterly dividend was paid on January 15, 2014.
123
TABLE OF CONTENTS
Gramercy Property Trust Inc.
Notes To Consolidated Financial Statements
(Amounts in thousands, except share and per share data)
December 31, 2013
16. Income Taxes – (continued)
The Company’s provision for income taxes for the years ended December 31, 2013, 2012 and 2011 is summarized as follows:
| | | | | | |
| | 2013 | | 2012 | | 2011 |
Current:
| | | | | | | | | | | | |
| Federal | | $ | (5,902 | ) | | $ | (1,990 | ) | | $ | (275 | ) |
| State and local | | | (2,535 | ) | | | (1,061 | ) | | | (206 | ) |
| Total current | | | (8,437 | ) | | | (3,051 | ) | | | (481 | ) |
Deferred:
| | | | | | | | | | | | |
| Federal | | | (348 | ) | | | (174 | ) | | | (62 | ) |
| State and local | | | (123 | ) | | | (105 | ) | | | (20 | ) |
| Total deferred | | | (471 | ) | | | (279 | ) | | | (82 | ) |
| Total income tax expense | | $ | (8,908 | ) | | $ | (3,330 | ) | | $ | (563 | ) |
For the years ended December 31, 2013, 2012 and 2011 the Company recorded $8,908, $3,330, and $563 of income tax expense, including $2,515, $0, and $0 within discontinued operations, respectively. Tax expense for the years ended December 31, 2013, 2012 and 2011 in continuing operations is comprised of federal, state and local taxes primarily attributable to Gramercy Asset Management. Tax expense for the year ended December 31, 2013 included in discontinued operations is comprised of federal, state and local taxes attributable to the sale of the CDO management contracts to CWCapital. As of December 31, 2013, returns for the calendar years 2010 through 2013 remain subject to examination by the Internal Revenue Service and various state and local tax jurisdictions. As of December 31, 2013, certain returns for calendar year 2009 also remain subject to examination by various state and local tax jurisdictions.
Net deferred tax assets of $635 and $0 are included in other assets on the accompanying Consolidated Balance Sheets at December 31, 2013 and 2012, respectively. These net deferred tax assets relate primarily to differences in the timing of the recognition of income (loss) between GAAP and tax. All deferred tax assets relating to net operating loss carry forwards of TRSs are fully reserved.
The income tax provision differs from the amount computed by applying the statutory federal income tax rate to pre-tax operating income, as follows:
| | | | | | |
| | For the year ended December 31, |
| | | 2013 | | 2012 | | 2011 |
| Income tax (expense) benefit at federal statutory rate | | $ | (137,775 | ) | | $ | 58,366 | | | $ | (118,314 | ) |
| Tax effect of REIT election | | | 138,563 | | | | (60,230 | ) | | | 118,596 | |
| State and local taxes, net of federal benefit | | | (1,088 | ) | | | (843 | ) | | | (186 | ) |
| Permanent difference | | | (1 | ) | | | 1,252 | | | | 99 | |
| Valuation allowance | | | (8,607 | ) | | | (1,672 | ) | | | (737 | ) |
| Other | | | — | | | | (203 | ) | | | (21 | ) |
| Total income tax benefit (provision) | | $ | (8,908 | ) | | $ | (3,330 | ) | | $ | (563 | ) |
As of December 31, 2013, the Company and each of its eleven subsidiaries which file corporate tax returns, had total net loss carryforwards, inclusive of net operating losses and capital losses, of approximately $560,000. Net operating loss carryforwards and capital loss carryforwards can generally be used to offset future ordinary income and capital gains of the entity originating the losses, for up to 20 years and 5 years, respectively. The amounts of net operating loss carryforwards and capital loss carryforwards as of December 31, 2013 are subject to the completion of the 2013 tax returns. In January 2011, the Company and
124
TABLE OF CONTENTS
Gramercy Property Trust Inc.
Notes To Consolidated Financial Statements
(Amounts in thousands, except share and per share data)
December 31, 2013
16. Income Taxes – (continued)
two of its subsidiaries experienced an ownership change, as defined for purposes of Section 382 of the Internal Revenue Code of 1986, as amended. In general, an “ownership change” occurs if there is a change in ownership of more than 50% of its common stock during a cumulative three year period. For this purpose, determinations of ownership changes are generally limited to shareholders deemed to own 5% or more of the Company’s common stock. The provisions of Section 382 will apply an annual limit to the amount of net loss carryforwards that can be used to offset future ordinary income and capital gains, beginning with the 2011 taxable year.
In addition to the limitation on the Company’s use of its net operating losses under section 382, since the company uses separate taxable REIT subsidiaries to conduct different aspects of its business, losses incurred by the individual TRSs are only available to offset taxable income derived by each respective TRS.
The Company’s policy for interest and penalties, if any, on material uncertain tax positions recognized in the financial statements is to classify these as interest expense and operating expense, respectively. As of December 31, 2013, 2012 and 2011, the Company did not incur any material interest or penalties.
17. Environmental Matters
The Company believes that it is in compliance in all material respects with applicable federal, state and local ordinances and regulations regarding environmental issues. Its management is not aware of any environmental liability that it believes would have a materially adverse impact on the Company’s financial position, results of operations or cash flows.
18. Segment Reporting
As of December 31, 2013, the Company has determined that it has two reportable operating segments: Asset Management and Investments/Corporate. On March 15, 2013, the Company disposed of its third reportable segment, Gramercy Finance, as more fully discussed in Note 1. The reportable segments are determined based upon the management approach, which looks to the Company’s internal organizational structure. The Company’s lines of business require different support infrastructures. In 2012, as a result of the KBS settlement and management agreements, the Company changed the composition of its business segments to separate Asset Management from Investments. The year ended December 31, 2011 has been restated to conform with this change.
The Investments/Corporate segment includes all of the Company’s activities related to net lease investments in markets across the United States. The Investments/Corporate segment generates revenues from rental revenues from properties owned by the Company.
The Asset Management segment includes substantially all of the Company’s activities related to asset and property management services. The Asset Management segment generates revenues from fee income related to the management agreements for properties owned by third-parties.
The Finance segment, which included the Company’s activities related to origination, acquisition and portfolio management of whole loans, bridge loans, subordinate interests in whole loans, mezzanine loans, preferred equity, CMBS and other real estate related securities, and which generated revenues from interest income on loans, other lending investments and CMBS owned in the Company’s CDOs, was classified as held for sale at December 31, 2012 in connection with the disposal in the first quarter of 2013.
125
TABLE OF CONTENTS
Gramercy Property Trust Inc.
Notes To Consolidated Financial Statements
(Amounts in thousands, except share and per share data)
December 31, 2013
18. Segment Reporting – (continued)
The Company evaluates performance based on the following financial measures for each segment:
| | | | | | | | |
| | Finance | | Asset Management | | Investments/ Corporate | | Total |
Year Ended December 31, 2013
| | | | | | | | | | | | | | | | |
| Total revenues | | $ | — | | | $ | 40,896 | | | $ | 15,808 | | | $ | 56,704 | |
| Equity in net loss from unconsolidated joint ventures | | | — | | | | — | | | | (5,662 | ) | | | (5,662 | ) |
| Total operating and interest expense(1) | | | — | | | | (30,887 | ) | | | (28,327 | ) | | | (59,214 | ) |
| Net income (loss) from continuing operations(2) | | $ | — | | | $ | 10,009 | | | $ | (18,181 | ) | | $ | (8,172 | ) |
| | | | | | | | |
| | Finance | | Asset Management | | Corporate/ Other(2) | | Total |
Year Ended December 31, 2012
| | | | | | | | | | | | | | | | |
| Total revenues | | $ | — | | | $ | 34,667 | | | $ | 2,154 | | | $ | 36,821 | |
| Equity in net loss from unconsolidated joint ventures | | | — | | | | — | | | | (2,904 | ) | | | (2,904 | ) |
| Total operating and interest expense(1) | | | — | | | | (24,824 | ) | | | (27,434 | ) | | | (52,258 | ) |
| Net income (loss) from continuing operations(2) | | $ | — | | | $ | 9,843 | | | $ | (28,184 | ) | | $ | (18,341 | ) |
| | | | | | | | |
| | Finance | | Asset Management | | Corporate/ Other(2) | | Total |
Year Ended December 31, 2011
| | | | | | | | | | | | | | | | |
| Total revenues | | $ | — | | | $ | 7,336 | | | $ | 436 | | | $ | 7,772 | |
| Equity in net income from unconsolidated joint ventures | | | — | | | | — | | | | 121 | | | | 121 | |
| Total operating and interest expense(1) | | | — | | | | (10,555 | ) | | | (18,241 | ) | | | (28,796 | ) |
| Net loss from continuing operations(2) | | $ | — | | | $ | (3,219 | ) | | $ | (17,684 | ) | | $ | (20,903 | ) |
Total Assets:
| | | | | | | | | | | | | | | | |
| December 31, 2013 | | $ | — | | | $ | 12,950 | | | $ | 478,713 | | | $ | 491,663 | |
| December 31, 2012 | | $ | 1,937,554 | | | $ | — | | | $ | 231,282 | | | $ | 2,168,836 | |
| (1) | Total operating and interest expense includes operating costs on commercial property assets for the Investments segment and costs to perform required functions under the management agreement for the Asset Management segment. Depreciation and amortization of $5,675, $256 and $136 and provision for taxes of $6,393, $3,330 and $563 for the years ended December 31, 2013, 2012, and 2011, respectively, are included in the amounts presented above. |
| (2) | Net income (loss) from continuing operations represents loss before discontinued operations. |
126
TABLE OF CONTENTS
Gramercy Property Trust Inc.
Notes To Consolidated Financial Statements
(Amounts in thousands, except share and per share data)
December 31, 2013
19. Supplemental Disclosure of Non-Cash Investing and Financing Activities
The following table represents non-cash activities recognized in other comprehensive income for the years ended December 31, 2013, 2012 and 2011:
| | | | | | |
| | 2013 | | 2012 | | 2011 |
| Deferred losses and other non-cash activity related to derivatives | | $ | (187 | ) | | $ | 2,146 | | | $ | (19,334 | ) |
| Change in net unrealized loss on securities available for sale | | $ | (1,219 | ) | | $ | 343,528 | | | $ | (260,820 | ) |
20. Selected Quarterly Financial Data (unaudited)
This unaudited interim financial information has been adjusted to reflect reclassifications for discontinued operations as of December 31, 2013.
| | | | | | | | |
| 2013 Quarter Ended | | December 31 | | September 30 | | June 30 | | March 31 |
| Total Revenues | | $ | 17,712 | | | $ | 13,421 | | | $ | 16,304 | | | $ | 9,267 | |
| Income (loss) before equity in net income (loss) of joint ventures, provision for taxes, non-controlling interest and discontinued operations | | | 2,109 | | | | 766 | | | | 3,325 | | | | (2,317 | ) |
| Equity in net income (loss) of joint ventures | | | (2,854 | ) | | | 983 | | | | (2,603 | ) | | | (1,188 | ) |
| Income (loss) from continuing operations before provision for taxes and discontinued operations | | | (745 | ) | | | 1,749 | | | | 722 | | | | (3,505 | ) |
| Provision for taxes | | | (803 | ) | | | (744 | ) | | | (4,441 | ) | | | (405 | ) |
| Net income (loss) continuing operations | | | (1,548 | ) | | | 1,005 | | | | (3,719 | ) | | | (3,910 | ) |
| Net income (loss) from discontinued operations | | | (4,399 | ) | | | (514 | ) | | | (1,175 | ) | | | 399,087 | |
| Net income (loss) attributable to Gramercy Property Trust Inc. | | | (5,947 | ) | | | 491 | | | | (4,894 | ) | | | 395,177 | |
| Preferred stock dividends | | | (1,792 | ) | | | (1,790 | ) | | | (1,790 | ) | | | (1,790 | ) |
| Net income (loss) available to common stockholders | | $ | (7,739 | ) | | $ | (1,299 | ) | | $ | (6,684 | ) | | $ | 393,387 | |
Basic earnings per share:
| | | | | | | | | | | | | | | | |
| Net loss from continuing operations and after preferred dividends | | $ | (0.05 | ) | | $ | (0.01 | ) | | $ | (0.09 | ) | | $ | (0.10 | ) |
| Net income (loss) from discontinued operations | | | (0.06 | ) | | | (0.01 | ) | | | (0.02 | ) | | | 6.80 | |
| Net income (loss) available to common stock holders | | $ | (0.11 | ) | | $ | (0.02 | ) | | $ | (0.11 | ) | | $ | 6.70 | |
Diluted earnings per share:
| | | | | | | | | | | | | | | | |
| Net loss from continuing operations and after preferred dividends | | $ | (0.05 | ) | | $ | (0.01 | ) | | $ | (0.09 | ) | | $ | (0.10 | ) |
| Net income (loss) from discontinued operations | | | (0.06 | ) | | | (0.01 | ) | | | (0.02 | ) | | | 6.80 | |
| Net income (loss) available to common stock holders | | $ | (0.11 | ) | | $ | (0.02 | ) | | $ | (0.11 | ) | | $ | 6.70 | |
| Basic weighted average common shares outstanding | | | 69,724,546 | | | | 58,902,708 | | | | 58,605,219 | | | | 58,678,078 | |
| Diluted weighted average common shares and common share equivalents outstanding | | | 69,724,546 | | | | 58,902,708 | | | | 58,605,219 | | | | 58,678,078 | |
127
TABLE OF CONTENTS
Gramercy Property Trust Inc.
Notes To Consolidated Financial Statements
(Amounts in thousands, except share and per share data)
December 31, 2013
20. Selected Quarterly Financial Data (unaudited) – (continued)
| | | | | | | | |
| 2012 Quarter Ended | | December 31 | | September 30 | | June 30 | | March 31 |
| Total Revenues | | $ | 9,666 | | | $ | 9,157 | | | $ | 9,644 | | | $ | 8,354 | |
| Loss before equity in net income of joint ventures, provision for taxes and discontinued operations | | | (310 | ) | | | (4,790 | ) | | | (5,416 | ) | | | (1,591 | ) |
| Equity in net income (loss) of joint ventures | | | (2,992 | ) | | | 31 | | | | 29 | | | | 28 | |
| Loss from continuing operations before provision for taxes and discontinued operations | | | (3,302 | ) | | | (4,759 | ) | | | (5,387 | ) | | | (1,563 | ) |
| Provision for taxes | | | 48 | | | | 40 | | | | (2,106 | ) | | | (1,312 | ) |
| Net loss from continuing operations | | | (3,254 | ) | | | (4,719 | ) | | | (7,493 | ) | | | (2,875 | ) |
| Net income (loss) from discontinued operations | | | (145,334 | ) | | | 1,829 | | | | (12,218 | ) | | | 2,516 | |
| Net loss attributable to Gramercy Property Trust Inc. | | | (148,588 | ) | | | (2,890 | ) | | | (19,711 | ) | | | (359 | ) |
| Preferred stock dividends | | | (1,792 | ) | | | (1,790 | ) | �� | | (1,790 | ) | | | (1,790 | ) |
| Net loss to common stockholders | | $ | (150,380 | ) | | $ | (4,680 | ) | | $ | (21,501 | ) | | $ | (2,149 | ) |
Basic earnings per share:
| | | | | | | | | | | | | | | | |
| Net loss from continuing operations, net of non-controlling interest and after preferred dividends | | $ | (0.09 | ) | | $ | (0.12 | ) | | $ | (0.18 | ) | | $ | (0.09 | ) |
| Net income (loss) from discontinued operations | | | (2.69 | ) | | | 0.03 | | | | (0.24 | ) | | | 0.05 | |
| Net loss to common stockholders | | $ | (2.78 | ) | | $ | (0.09 | ) | | $ | (0.42 | ) | | $ | (0.04 | ) |
Diluted earnings per share:
| | | | | | | | | | | | | | | | |
| Net loss from continuing operations, net of non-controlling interest and after preferred dividends | | $ | (0.09 | ) | | $ | (0.12 | ) | | $ | (0.18 | ) | | $ | (0.09 | ) |
| Net income (loss) from discontinued operations | | | (2.69 | ) | | | 0.03 | | | | (0.24 | ) | | | 0.05 | |
| Net loss available to common stockholders | | $ | (2.78 | ) | | $ | (0.09 | ) | | $ | (0.42 | ) | | $ | (0.04 | ) |
Basic weighted average common shares
outstanding | | | 54,120,499 | | | | 52,308,653 | | | | 50,759,306 | | | | 51,261,325 | |
| Diluted weighted average common shares and common share equivalents outstanding | | | 54,120,499 | | | | 52,308,653 | | | | 50,759,306 | | | | 51,261,325 | |
21. Subsequent Events
In February 2014, the Company closed on the acquisition of a 115,472 square foot, industrial property located in Des Plaines, Illinois for a purchase price of approximately $6,300. The property is 100% leased to one tenant through October 2025. The Company is currently analyzing the fair value of the leases and real estate assets and accordingly, the purchase price allocation is preliminary and subject to change. In connection with the acquisition, the Company assumed the existing mortgage note on the property. The assumed loan was for $2,664, with an annual fixed interest rate of 5.25% and a maturity date of October 31, 2020.
In March 2014, the Company’s board of directors declared a quarterly dividend of $0.035 per common share for the first quarter of 2014, payable on April 15, 2014 to holders of record as of the close of business on March 31, 2014. The Company’s board of directors also declared the Series A Preferred Stock quarterly dividend payment in the amount of $0.50781 per share, for the period January 15, 2014, through and including April 14, 2014, payable on April 15, 2014 to holders of record as of the close of business on March 31, 2014.
In February 2014, the Company exercised the $50,000 accordion feature of its senior secured credit facility which increased the Company’s borrowing capacity from $100,000 to $150,000. All other terms of the credit facility remained the same.
128
TABLE OF CONTENTS
Gramercy Property Trust Inc.
SCHEDULE III
Real Estate Investments
(In thousands)
| | | | | | | | | | | | | | | | | | | | | | |
| | | | | | | | | | | | | | | | | | | | | | |
| City | | State | | Acquisition Date | | Encumbrances
at
December 31,
2013(1) | | Initial Costs | | Net Improvements (Retirements) Since Acquisition | | Gross Amount at Which Carried December 31, 2013 | | Accumulated Depreciation December 31, 2013 | | Average Depreciable Life |
| | Land | | Building and Improvements | | Land | | Building and Improvements | | Total(3) |
Industrial:
| | | | | | | | | | | | | | | | | | | | | | | | | | | | | | | | | | | | | | | | | | | | |
| Greenwood | | | IN | | | | 11/20/2012 | | | $ | 7,940 | | | $ | 1,200 | | | $ | 12,002 | | | $ | — | | | $ | 1,200 | | | $ | 12,002 | | | $ | 13,202 | | | $ | (378 | ) | | | 38 | |
| Greenfield | | | IN | | | | 11/20/2012 | | | | 6,417 | | | | 600 | | | | 9,357 | | | | — | | | | 600 | | | | 9,357 | | | | 9,957 | | | | (279 | ) | | | 39 | |
| Olive Branch | | | MS | | | | 3/11/2013 | | | | (2) | | | | 2,250 | | | | 18,891 | | | | 35 | | | | 2,250 | | | | 18,926 | | | | 21,176 | | | | (424 | ) | | | 39 | |
| Garland | | | TX | | | | 3/19/2013 | | | | (2) | | | | 2,200 | | | | 6,081 | | | | 645 | | | | 2,200 | | | | 6,726 | | | | 8,926 | | | | (260 | ) | | | 19 | |
| East Brunswick | | | NJ | | | | 3/28/2013 | | | | (2) | | | | 5,700 | | | | 4,970 | | | | 38 | | | | 5,700 | | | | 5,008 | | | | 10,708 | | | | (165 | ) | | | 27 | |
| Atlanta | | | GA | | | | 5/6/2013 | | | | (2) | | | | 1,700 | | | | 4,949 | | | | — | | | | 1,700 | | | | 4,949 | | | | 6,649 | | | | (389 | ) | | | 20 | |
| Bellmawr | | | NJ | | | | 5/30/2013 | | | | (2) | | | | 540 | | | | 2,992 | | | | — | | | | 540 | | | | 2,992 | | | | 3,532 | | | | (66 | ) | | | 34 | |
| Hialeah Gardens | | | FL | | | | 5/30/2013 | | | | 4,990 | | | | 4,839 | | | | 1,437 | | | | 6,971 | | | | 4,839 | | | | 8,408 | | | | 13,247 | | | | — | | | | — | |
| Deer Park | | | NY | | | | 6/18/2013 | | | | — | | | | 1,700 | | | | 2,200 | | | | — | | | | 1,700 | | | | 2,200 | | | | 3,900 | | | | (66 | ) | | | 18 | |
| Elkridge | | | MD | | | | 6/19/2013 | | | | (2) | | | | 3,300 | | | | 2,600 | | | | — | | | | 3,300 | | | | 2,600 | | | | 5,900 | | | | (47 | ) | | | 28 | |
| Orlando | | | FL | | | | 6/26/2013 | | | | (2) | | | | 2,000 | | | | 3,036 | | | | — | | | | 2,000 | | | | 3,036 | | | | 5,036 | | | | (148 | ) | | | 16 | |
| Houston | | | TX | | | | 6/26/2013 | | | | (2) | | | | 2,630 | | | | 4,151 | | | | 135 | | | | 2,630 | | | | 4,286 | | | | 6,916 | | | | (166 | ) | | | 14 | |
| Logan | | | NJ | | | | 6/28/2013 | | | | (2) | | | | 750 | | | | 10,975 | | | | — | | | | 750 | | | | 10,975 | | | | 11,725 | | | | (154 | ) | | | 38 | |
| Atlanta | | | GA | | | | 8/22/2013 | | | | (2) | | | | 230 | | | | 3,770 | | | | — | | | | 230 | | | | 3,770 | | | | 4,000 | | | | (57 | ) | | | 24 | |
| Manassas | | | VA | | | | 9/5/2013 | | | | (2) | | | | 720 | | | | 3,512 | | | | — | | | | 720 | | | | 3,512 | | | | 4,232 | | | | (35 | ) | | | 33 | |
| Manassas | | | VA | | | | 9/5/2013 | | | | (2) | | | | 780 | | | | 3,782 | | | | — | | | | 780 | | | | 3,782 | | | | 4,562 | | | | (38 | ) | | | 33 | |
| Yuma | | | AZ | | | | 10/1/2013 | | | | 12,600 | | | | 1,900 | | | | 16,273 | | | | — | | | | 1,900 | | | | 16,273 | | | | 18,173 | | | | (116 | ) | | | 35 | |
| Austin | | | TX | | | | 10/22/2013 | | | | (2) | | | | 970 | | | | 5,648 | | | | — | | | | 970 | | | | 5,648 | | | | 6,618 | | | | (41 | ) | | | 23 | |
| Galesburg | | | IL | | | | 11/15/2013 | | | | (2) | | | | 300 | | | | 903 | | | | — | | | | 300 | | | | 903 | | | | 1,203 | | | | (7 | ) | | | 27 | |
| Peru | | | IL | | | | 11/15/2013 | | | | (2) | | | | 460 | | | | 3,024 | | | | — | | | | 460 | | | | 3,024 | | | | 3,484 | | | | (14 | ) | | | 39 | |
| Indianapolis | | | IN | | | | 11/15/2013 | | | | 22,483 | | | | 2,300 | | | | 26,512 | | | | — | | | | 2,300 | | | | 26,512 | | | | 28,812 | | | | (110 | ) | | | 40 | |
| Waco | | | TX | | | | 11/21/2013 | | | | 16,055 | | | | 1,780 | | | | 16,442 | | | | — | | | | 1,780 | | | | 16,442 | | | | 18,222 | | | | (39 | ) | | | 36 | |
| Upper Macungie | | | PA | | | | 12/23/2013 | | | | 24,100 | | | | 4,800 | | | | 25,553 | | | | — | | | | 4,800 | | | | 25,553 | | | | 30,353 | | | | — | | | | 33 | |
| Vernon | | | CA | | | | 12/30/2013 | | | | — | | | | 3,757 | | | | 4,431 | | | | — | | | | 3,757 | | | | 4,431 | | | | 8,188 | | | | — | | | | 38 | |
| Vernon | | | CA | | | | 12/30/2013 | | | | — | | | | 3,043 | | | | 3,588 | | | | — | | | | 3,043 | | | | 3,588 | | | | 6,631 | | | | — | | | | 38 | |
Office/Banking Center:
| | | | | | | | | | | | | | | | | | | | | | | | | | | | | | | | | | | | | | | | | | | | |
| Emmaus | | | PA | | | | 6/6/2013 | | | | — | | | | 720 | | | | 890 | | | | — | | | | 720 | | | | 890 | | | | 1,610 | | | | (13 | ) | | | 40 | |
| Calabash | | | SC | | | | 6/6/2013 | | | | — | | | | 402 | | | | 208 | | | | — | | | | 402 | | | | 208 | | | | 610 | | | | (3 | ) | | | 40 | |
| Morristown | | | NJ | | | | 8/1/2013 | | | | (2) | | | | 1,960 | | | | 2,940 | | | | — | | | | 1,960 | | | | 2,940 | | | | 4,900 | | | | (49 | ) | | | 25 | |
Specialty:
| | | | | | | | | | | | | | | | | | | | | | | | | | | | | | | | | | | | | | | | | | | | |
| Hutchins | | | TX | | | | 6/27/2013 | | | | 25,788 | | | | 9,600 | | | | 52,038 | | | | — | | | | 9,600 | | | | 52,038 | | | | 61,638 | | | | (1,148 | ) | | | 8 | |
| Franklin Park | | | IL | | | | 11/21/2013 | | | | (2) | | | | 6,300 | | | | 1,577 | | | | — | | | | 6,300 | | | | 1,577 | | | | 7,877 | | | | (16 | ) | | | 9 | |
| Chicago | | | IL | | | | 11/22/2013 | | | | (2) | | | | 3,700 | | | | 2,025 | | | | — | | | | 3,700 | | | | 2,025 | | | | 5,725 | | | | (19 | ) | | | 29 | |
| | | | | | | | | | | $ | 120,373 | | | $ | 73,131 | | | $ | 256,757 | | | $ | 7,824 | | | $ | 73,131 | | | $ | 264,581 | | | $ | 337,712 | | | $ | (4,247 | ) | | | | |
| (1) | Encumbrances represent balances at 12/31/2013 of mortgage notes payable that are collateralized by the property for which they are noted. |
| (2) | These properties collateralize the Company’s credit facility which had an outstanding balance of $45,000 at 12/31/2013. |
| (3) | The aggregate cost basis of land, building and improvements, before depreciation, for Federal income tax purposes at December 31, 2013 was $350,621. |
129
TABLE OF CONTENTS
Set forth below is a rollforward of the carrying values for our real estate investments classified as held-for-investment:
| | | | | | |
| | Years Ended December 31, |
| | | 2013 | | 2012 | | 2011 |
Investment in real estate:
| | | | | | | | | | | | |
| Balance at beginning of year | | $ | 23,159 | | | $ | 68,690 | | | $ | 2,471,923 | |
| Improvements | | | 7,824 | | | | 1,203 | | | | 8,494 | |
| Business acquisitions | | | 306,729 | | | | 39,202 | | | | 61,626 | |
| Change in held for sale | | | 37,667 | | | | (7,519 | ) | | | (3,393 | ) |
| Impairments | | | — | | | | (22,637 | ) | | | (348 | ) |
| Property sales | | | (37,667 | ) | | | (55,780 | ) | | | (20,547 | ) |
| Transfer of foreclosed assets | | | — | | | | — | | | | (2,449,065 | ) |
| Balance at end of year | | $ | 337,712 | | | $ | 23,159 | | | $ | 68,690 | |
Accumulated depreciation:
| | | | | | | | | | | | |
| Balance at beginning of year | | $ | 50 | | | $ | 2,983 | | | $ | 168,541 | |
| Depreciation expense | | | 4,197 | | | | 1,022 | | | | 39,707 | |
| Change in held for sale | | | 2,966 | | | | (2,468 | ) | | | (296 | ) |
| Property sales | | | (2,966 | ) | | | (1,487 | ) | | | (412 | ) |
| Transfer of foreclosed assets | | | — | | | | — | | | | (204,557 | ) |
| Balance at end of year | | $ | 4,247 | | | $ | 50 | | | $ | 2,983 | |
130
TABLE OF CONTENTS
| ITEM 9. | CHANGES IN AND DISAGREEMENTS WITH ACCOUNTANTS ON ACCOUNTING AND FINANCIAL DISCLOSURE |
None.
ITEM 9A. CONTROLS AND PROCEDURES
Evaluation of Disclosure Controls and Procedures
We maintain disclosure controls and procedures that are designed to ensure that information required to be disclosed in our Exchange Act reports is recorded, processed, summarized and reported within the time frame specified in the SEC’s rules and forms, and that such information is accumulated and communicated to our management, including our Chief Executive Officer and Chief Financial Officer, as appropriate, to allow for timely decisions regarding required disclosure based closely on the definition of “disclosure controls and procedures” in Rule 13a-15(e). Notwithstanding the foregoing, a control system, no matter how well designed and operated, can provide only reasonable, not absolute, assurance that it will detect or uncover failures within our company to disclose material information otherwise required to be set forth in our periodic reports. Also, we may have investments in certain unconsolidated entities. As we do not control these entities, our disclosure controls and procedures with respect to such entities are necessarily substantially more limited than those we maintain with respect to our consolidated subsidiaries.
As of the end of the period covered by this report, we carried out an evaluation, under the supervision and with the participation of our management, including our Chief Executive Officer and our Chief Financial Officer, of the effectiveness of the design and operation of our disclosure controls and procedures. Based upon that evaluation, our Chief Executive Officer and Chief Financial Officer concluded that our disclosure controls and procedures were effective as of the end of the period covered by this report.
Management’s Annual Report on Internal Control over Financial Reporting
We are responsible for establishing and maintaining adequate internal control over financial reporting, as such term is defined in Exchange Act Rules 13a-15(f) and 15d-15(f). Under the supervision and with the participation of our management, including our Chief Executive Officer and Chief Financial Officer, we conducted an evaluation of the effectiveness of our internal control over financial reporting as of December 31, 2013 based on the framework in Internal Control — Integrated Framework issued by the Committee of Sponsoring Organizations of the Treadway Commission (COSO). Based on that evaluation, we concluded that our internal control over financial reporting was effective as of December 31, 2013.
Our internal control over financial reporting during the year ended December 31, 2013 has been audited by Ernst & Young LLP, an independent registered public accounting firm, as stated in their report, appearing on page 73, which expresses an unqualified opinion on the effectiveness of our internal control over financial reporting as of December 31, 2013.
Changes in Internal Control over Financial Reporting
As part of the repositioning of the Company as an equity REIT focused on acquiring and managing income producing net leased real estate, we have implemented a new and more efficient accounting systems during the year ended December 31, 2013. This implementation did not require any material changes in our internal control over financial reporting during the year ended December 31, 2013, that have materially affected or are reasonably likely to materially affect, our internal control over financial reporting.
ITEM 9B. OTHER INFORMATION
None.
131
TABLE OF CONTENTS
Part III
| ITEM 10. | DIRECTORS, EXECUTIVE OFFICERS AND CORPORATE GOVERNANCE |
The information required by Item 10 will be set forth in our Definitive Proxy Statement for our 2014 Annual Meeting of Stockholders, expected to be filed pursuant to Regulation 14A under the Exchange Act within 120 days after December 31, 2013 or the 2014 Proxy Statement, and is incorporated herein by reference.
| ITEM 11. | EXECUTIVE COMPENSATION |
The information required by Item 11 will be set forth in the 2014 Proxy Statement and is incorporated herein by reference.
| ITEM 12. | SECURITY OWNERSHIP OF CERTAIN BENEFICIAL OWNERS AND MANAGEMENT AND RELATED STOCKHOLDER MATTERS |
The information required by Item 12 will be set forth in the 2014 Proxy Statement and is incorporated herein by reference.
| ITEM 13. | CERTAIN RELATIONSHIPS AND RELATED TRANSACTIONS, AND DIRECTOR INDEPENDENCE |
The information required by Item 13 will be set forth in the 2014 Proxy Statement and is incorporated herein by reference.
| ITEM 14. | PRINCIPAL ACCOUNTING FEES AND SERVICES |
The information regarding principal accounting fees and services and the audit committee’s pre-approval policies and procedures required by this Item 14 is incorporated herein by reference to the 2014 Proxy Statement.
132
TABLE OF CONTENTS
Part IV
| ITEM 15. | EXHIBITS, FINANCIAL STATEMENTS AND SCHEDULES |
(a)(1) Consolidated Financial Statements
GRAMERCY PROPERTY TRUST INC.
Schedules other than those listed are omitted as they are not applicable or the required or equivalent information has been included in the financial statements or notes thereto.
(a)(3) Exhibits
See Index to Exhibits on following page
133
TABLE OF CONTENTS
INDEX TO EXHIBITS
| | |
| Exhibit No. | | Description |
| 3.1 | | Articles of Incorporation of the Company, incorporated by reference to the Company’s Registration Statement on Form S-11 (No. 333-114673), filed with the SEC on July 26, 2004. |
| 3.2 | | Amended and Restated Bylaws of the Company, incorporated by reference to the Company’s Current Report on Form 8-K, filed with the SEC on May 9, 2013. |
| 3.3 | | Articles Supplementary designating the 8.125% Series A Cumulative Redeemable Preferred Stock, liquidation preference $25.00 per share, par value $0.001 per share, dated April 18, 2007, incorporated by reference to the Company’s Current Report on Form 8-K, filed with the SEC on April 18, 2007. |
| 3.4 | | Articles Supplementary designating the Class B-1 non-voting common stock of Gramercy Property Trust Inc., par value $0.001 per share, and Class B-2 non-voting common stock of Gramercy Property Trust Inc., par value $0.001 per share, incorporated by reference to the Company’s Quarterly Report on Form 10-Q, filed with the SEC on November 8, 2013. |
| 3.5 | | Articles of Amendment to the Articles of Amendment and Restatement of the Company, dated as of April 12, 2013, incorporated by reference to the Company’s Current Report on Form 8-K, filed with the SEC on April 18, 2013. |
| 3.6 | | Articles Supplementary Reclassifying 2,000,000 shares of Class B-1 non-voting common stock and 2,000,000 shares of Class B-2 non-voting common stock into shares of common stock, dated December 10, 2013, incorporated by reference to the Company’s Current Report on Form 8-K, filed with the SEC on December 13, 2013. |
| 4.1 | | Form of specimen stock certificate representing the common stock of the Company, par value $.001 per share, filed herewith. |
| 4.2 | | Form of stock certificate evidencing the 8.125% Series A Cumulative Redeemable Preferred Stock of the Company, liquidation preference $25.00 per share, par value $0.001 per share, incorporated by reference to the Company’s Current Report on Form 8-K, filed with the SEC on April 18, 2007. |
| 10.1 | | Third Amended and Restated Agreement of Limited Partnership of GKK Capital LP, dated April 19, 2006, filed herewith. |
| 10.2 | | First Amendment to the Third Amended and Restated Agreement of Limited Partnership of GKK Capital LP, dated as of April 18, 2007, incorporated by reference to the Company’s Current Report on Form 8-K, filed with the SEC on April 18, 2007. |
| 10.3 | | Second Amendment to the Third Amended and Restated Agreement of Limited Partnership of GKK Capital LP, dated as of October 27, 2008, incorporated by reference to the Company’s Quarterly Report on Form 10-Q, filed with the SEC on November 10, 2008. |
| 10.4 | | Third Amendment to the Third Amended and Restated Agreement of Limited Partnership of GKK Capital LP, dated as of August 7, 2013, incorporated by reference to the Company’s Quarterly Report on Form 10-Q, filed with the SEC on August 8, 2013. |
| 10.5 | | Amended and Restated Credit and Guaranty Agreement, dated as of September 24, 2013, by and among GPT Property Trust LP, as borrower, Gramercy Property Trust Inc. and certain of its subsidiaries, as guarantors, the lenders party thereto from time to time, Deutsche Bank AG New York Branch as administrative agent, Deutsche Bank Securities Inc. and Merrill Lynch, Pierce, Fenner & Smith as joint lead arrangers, Deutsche Bank Securities Inc. as sole bookrunner, and Bank of America, N.A. and RBC Capital Markets as co-syndication agents, incorporated by reference to the Company’s Current Report on Form 8-K, filed with the SEC on September 30, 2013. |
134
TABLE OF CONTENTS
| | |
| Exhibit No. | | Description |
| 10.6 | | First Amendment to the Amended and Restated Credit and Gauranty Agreement, dated as of February 28, 2014, by and among GPT Property Trust LP, as borrower, Gramercy Property Trust Inc. and certain of its subsidiaries, as guarantors, the lenders party thereto from time to time, Deutsche Bank AG New York Branch as administrative agent and each of the other agents party thereto, filed herewith. |
| 10.7 | | Collateral Management Agreement, by and between Gramercy Real Estate CDO 2005 1, Ltd., as issuer and GKK Manager LLC, as collateral manager, incorporated by reference to the Company’s Quarterly Report on Form 10-Q for the fiscal quarter ended June 30, 2005. |
| 10.8 | | Collateral Management Agreement, dated as of August 24, 2006, by and between Gramercy Real Estate CDO 2006-1, Ltd., as issuer and GKK Manager LLC, as collateral manager, incorporated by reference to the Company’s Quarterly Report on Form 10-Q for the fiscal quarter ended September 30, 2006. |
| 10.9 | | Collateral Management Agreement, dated as of August 8, 2007, by and between Gramercy Real Estate CDO 2007-1, Ltd. And GKK Manager LLC, incorporated by reference to the Company’s Quarterly Report on Form 10-Q for the fiscal quarter ended September 30, 2007. |
| 10.10 | | Indenture, by and among Gramercy Real Estate CDO 2005-1, Ltd., as issuer, Gramercy Real Estate CDO 2005-1 LLC, as co-issuer, GKK Liquidity LLC, as advancing agent and Wells Fargo Bank, National Association, as trustee, paying agent, calculation agent, transfer agent, custodial securities intermediary, backup advancing agent, notes registrar, incorporated by reference to the Company’s Quarterly Report on Form 10-Q for the fiscal quarter ended June 30, 2005. |
| 10.11 | | Indenture, dated as of August 24, 2006, by and among Gramercy Real Estate CDO 2006-1, Ltd., as issuer, Gramercy Real Estate CDO 2006-1 LLC, as co-issuer, GKK Liquidity LLC, as advancing agent, and Wells Fargo Bank, National Association, as trustee, paying agent, calculation agent, transfer agent, custodial securities intermediary, backup advancing agent and notes registrar, incorporated by reference to the Company’s Quarterly Report on Form 10-Q for the fiscal quarter ended September 30, 2006. |
| 10.12 | | Indenture, dated as of August 8, 2007, by and among Gramercy Real Estate CDO 2007-1, Ltd., Gramercy Real Estate CDO 2007-1, LLC, GKK Liquidity LLC and Wells Fargo Bank, National Association, incorporated by reference to the Company’s Quarterly Report on Form 10-Q for the fiscal quarter ended September 30, 2007. |
| 10.13 | | Second Amended and Restated Registration Rights Agreement by and between the Company and SL Green Operating Partnership, L.P., incorporated by reference to the Company’s Current Report on Form 8-K, filed with the SEC on April 20, 2006. |
| 10.14 | | Registration Rights Agreement, by and between various holders of the Company’s common stock and the Company, incorporated by reference to the Company’s Current Report on Form 8-K, filed with the SEC on December 9, 2004. |
| 10.15 | | Master Lease Agreement, dated of January 1, 2005, by and between First States Investors 5000A, LLC and Bank of America, N.A., incorporated by reference to the Company’s Annual Report on Form 10-K for the fiscal year ended December 31, 2009, filed with the SEC on March 17, 2010. |
| 10.16 | | Letter Agreement, dated March 13, 2011, by and among the Company, as guarantor, GKK Stars Junior Mezz I, LLC, as guarantor, the Borrowers, the Mortgage Lenders, the Mezzanine Lenders, KBS GKK Participation Holdings I, LLC and KBS GKK Participation Holdings II, LLC, incorporated by reference to the Company’s Current Report on Form 8-K, filed with the SEC on March 14, 2011. |
135
TABLE OF CONTENTS
| | |
| Exhibit No. | | Description |
| 10.17 | | Letter Agreement, dated April 15, 2011, by and among the Company, as guarantor, GKK Stars Junior Mezz I, LLC, as guarantor, the Borrowers, the Mortgage Lenders, the Mezzanine Lenders, KBS GKK Participation Holdings I, LLC and KBS GKK Participation Holdings II, LLC, incorporated by reference to the Company’s Current Report on Form 8-K, filed with the SEC on April 19, 2011. |
| 10.18 | | Collateral Transfer and Settlement Agreement, dated as of September 1, 2011, by and among GKK Stars Acquisition LLC, KBS Acquisition Sub, LLC, KBS Debt Holdings Mezz Holder, LLC, KBS GKK Participation Holdings I, LLC, KBS GKK Participation Holdings II, LLC and KBS Acquisition Holdings, LLC, incorporated by reference to the Company’s Current Report on Form 8-K, filed with the SEC on September 8, 2011. |
| 10.19 | | Agreement For Sale of Membership Interests, dated August 17, 2012, by and between KBS Acquisition Sub-Owner 2, LLC and BBD1 Holdings LLC, incorporated by reference to the Company’s Current Report on Form 8-K, filed with the SEC on August 22, 2012. |
| 10.20 | | Loan Agreement, dated August 17, 2012, between KBS REIT Properties, LLC; KBS Acquisition Sub-Owner 5, LLC; KBS Acquisition Sub-Owner 6, LLC; KBS Acquisition Sub-Owner 7, LLC; KBS Acquisition Sub-Owner 8, LLC, as borrowers, Gramercy Investment Trust and Garrison Commercial Funding XI LLC, as lenders, and Gramercy Loan Services LLC, as agent for lenders, incorporated by reference to the Company’s Current Report on Form 8-K, filed with the SEC on August 22, 2012. |
| 10.21 | | Loan Agreement, dated December 6, 2012, by and between GPT GIG BOA Portfolio Owner LLC and JPMorgan Chase Bank, National Association, incorporated by reference to the Company’s Current Report on Form 8-K, filed with the SEC on December 12, 2012. |
| 10.22 | | Stockholder Agreement, dated December 6, 2012, by and between Gramercy Property Trust Inc. and KBS Acquisition Sub-Owner 2, LLC, incorporated by reference to the Company’s Current Report on Form 8-K, filed with the SEC on December 12, 2012. |
| 10.23 | | Sale and Purchase Agreement, dated January 30, 2013, by and among Gramercy Investment Trust, Gramercy Investment Trust II, GKK Manager LLC, Gramercy Loan Services LLC, GKK Liquidity LLC, Gramercy Property Trust Inc., CWCapital Investments LLC and CW Financial Services LLC, incorporated by reference to the Company’s Current Report on Form 8-K, filed with the SEC on February 5, 2013. |
| 10.24 | | Common Stock Purchase Agreement, dated as of October 4, 2013, among the Company, BHR Master Fund, Ltd. and BHR OC Master Fund, Ltd., incorporated by reference to the Company’s Current Report on Form 8-K/A, filed with the SEC on October 7, 2013. |
| 10.25 | | Form of Joinder Agreement pursuant to the Common Stock Purchase Agreement, dated as of October 4, 2013, among the Company, BHR Master Fund, Ltd. and BHR OC Master Fund, Ltd. (attached thereto is information with respect to the number of common shares and aggregate purchase price for each additional purchaser), incorporated by reference to the Company’s Current Report on Form 8-K/A, filed with the SEC on October 7, 2013. |
| 10.26 | | Form of Contingent Value Rights Agreement pursuant to the Common Stock Purchase Agreement, dated as of October 4, 2013, among the Company, BHR Master Fund, Ltd. and BHR OC Master Fund, Ltd. (attached thereto is information with respect to the number of contingent value rights for each purchaser), incorporated by reference to the Company’s Current Report on Form 8-K/A, filed with the SEC on October 7, 2013. |
| 10.27 | | Amended and Restated Asset Management Services Agreement, dated as of December 1, 2013, by and between KBS Acquisition Sub, LLC, and GKK Realty Advisors LLC, incorporated by reference to the Company’s Current Report on Form 8-K, filed with the SEC on December 20, 2013. |
136
TABLE OF CONTENTS
| | |
| Exhibit No. | | Description |
| 10.28 | | Amended and Restated 2004 Equity Incentive Plan, dated as of October 27, 2008, incorporated by reference to the Company’s Quarterly Report on Form 10-Q, filed with the SEC on November 10, 2008.* |
| 10.29 | | First Amendment to Amended and Restated 2004 Equity Incentive Plan, dated as of October 27, 2008, incorporated by reference to the Company’s Quarterly Report on Form 10-Q, filed with the SEC on November 10, 2008.* |
| 10.30 | | 2008 Employee Stock Purchase Plan, incorporated by referenced to the Company’s Registration Statement on Form S-8 (333-149838), filed with the SEC on March 20, 2008.* |
| 10.31 | | 2012 Inducement Equity Incentive Plan, incorporated by reference to the Company’s Current Report on Form 8-K, filed with the SEC on June 13, 2012.* |
| 10.32 | | Gramercy Property Trust Inc. Director’s Deferral Program, incorporated by reference to the Company’s Quarterly Report on Form 10-Q/A for the fiscal quarter ended June 30, 2005.* |
| 10.33 | | Form of Restricted Stock Award Agreement, incorporated by reference to the Company’s Annual Report on Form 10-K for the fiscal year ended December 31, 2007, filed with the SEC on March 17, 2008.* |
| 10.34 | | Form of Option Award Agreement, incorporated by reference to the Company’s Annual Report on Form 10-K for the fiscal year ended December 31, 2007, filed with the SEC on March 17, 2008.* |
| 10.35 | | Form of Phantom Share Award Agreement, incorporated by reference to the Company’s Annual Report on Form 10-K for the fiscal year ended December 31, 2007, filed with the SEC on March 17, 2008.* |
| 10.36 | | Form of 2012 Long-Term Outperformance Plan Award Agreement, incorporated by reference to the Company’s Current Report on Form 8-K, dated June 7, 2012, filed with the SEC on June 13, 2012.* |
| 10.37 | | Employment and Noncompetition Agreement, dated as of April 27, 2009, by and between Gramercy Property Trust Inc. and Jon W. Clark, incorporated by reference to the Company’s Current Report on Form 8-K, filed with the SEC on April 28, 2009.* |
| 10.38 | | Restricted Stock Award, dated as of January 5, 2012, by the Company to Roger M. Cozzi, incorporated by reference to the Company’s Annual Report on Form 10-K for the fiscal year ended December 31, 2011, filed with the SEC on March 15, 2012.* |
| 10.39 | | Amendment, dated as of January 1, 2012, by and between GKK Capital LP and Jon W. Clark, incorporated by reference to the Company’s Annual Report on Form 10-K for the fiscal year ended December 31, 2011, filed with the SEC on March 15, 2012.* |
| 10.40 | | Employment and Noncompetition Agreement, dated as of June 7, 2012, by and between Gramercy Property Trust Inc. and Gordon DuGan, incorporated by reference to the Company’s Current Report on Form 8-K, filed with the SEC on June 13, 2012.* |
| 10.41 | | Employment and Noncompetition Agreement, dated as of June 12, 2012, by and between Gramercy Property Trust Inc. and Benjamin P. Harris, incorporated by reference to the Company’s Current Report on Form 8-K, filed with the SEC on June 13, 2012.* |
| 10.42 | | Separation and Release Agreement, dated as of June 12, 2012, by and among Gramercy Property Trust Inc., GKK Capital LP and Roger M. Cozzi, incorporated by reference to the Company’s Current Report on Form 8-K, filed with the SEC on June 13, 2012.* |
| 10.43 | | Transition and Release Agreement, dated as of June 12, 2012, by and among Gramercy Property Trust Inc., GKK Capital LP and Timothy J. O’Connor, incorporated by reference to the Company’s Current Report on Form 8-K, filed with the SEC on June 13, 2012.* |
| 10.44 | | Amendment to Retention Agreement, dated as of June 12, 2012, by and between Gramercy Property Trust Inc. and Michael G. Kavourias, incorporated by reference to the Company’s Current Report on Form 8-K, filed with the SEC on June 13, 2012.* |
137
TABLE OF CONTENTS
| | |
| Exhibit No. | | Description |
| 10.45 | | Amendment, dated as of July 28, 2011, by and among the Company, GKK Capital LP and Roger M. Cozzi, incorporated by reference to the Company’s Current Report on Form 8-K, dated July 28, 2011, filed with the SEC on August 3, 2011.* |
| 10.46 | | Amendment to LTIP Unit Award Agreement, dated as of July 28, 2011, by and among the Company, GKK Capital LP and Roger M. Cozzi, incorporated by reference to the Company’s Current Report on Form 8-K, filed with the SEC on August 3, 2011.* |
| 10.47 | | Amendment, dated as of July 28, 2011, by and among the Company, GKK Capital LP and Timothy J. O’Connor, incorporated by reference to the Company’s Current Report on Form 8-K, filed with the SEC on August 3, 2011.* |
| 10.48 | | Amendment to LTIP Unit Award Agreement, dated as of July 28, 2011, by and among the Company, GKK Capital LP and Timothy J. O’Connor, incorporated by reference to the Company’s Current Report on Form 8-K, filed with the SEC on August 3, 2011.* |
| 10.49 | | First Amendment, dated April 30, 2013, to the Employment and Noncompetition Agreement, dated July 1, 2012, as amended, by and between Gramercy Property Trust Inc. and Gordon F. DuGan, incorporated by reference to the Company’s Current Report on Form 8-K, filed with the SEC on May 6, 2013.* |
| 21.1 | | Subsidiaries of the Registrant, filed herewith. |
| 23.1 | | Consent of Independent Registered Accounting Firm, filed herewith. |
| 31.1 | | Certification by the Chief Executive Officer pursuant to Section 302 of the Sarbanes-Oxley Act of 2002, filed herewith. |
| 31.2 | | Certification by the Chief Financial Officer pursuant to Section 302 of the Sarbanes-Oxley Act of 2002, filed herewith. |
| 32.1 | | Certification by the Chief Executive Officer pursuant to 18 U.S.C. section 1350, as adopted pursuant to Section 906 of the Sarbanes-Oxley Act of 2002, furnished herewith. |
| 32.2 | | Certification by the Chief Financial Officer pursuant to 18 U.S.C. section 1350, as adopted pursuant to Section 906 of the Sarbanes-Oxley Act of 2002, furnished herewith. |
| 101.INS | | XBRL Instance Document, filed herewith. |
| 101.SCH | | XBRL Taxonomy Extension Schema, filed herewith. |
| 101.CAL | | XBRL Taxonomy Extension Calculation Linkbase, filed herewith. |
| 101.DEF | | XBRL Taxonomy Extension Definition Linkbase, filed herewith. |
| 101.LAB | | XBRL Taxonomy Extension Label Linkbase, filed herewith. |
| 101.PRE | | XBRL Taxonomy Extension Presentation Linkbase, filed herewith. |
| * | This exhibit is a management contract or a compensatory plan or arrangement. |
138
TABLE OF CONTENTS
SIGNATURES
Pursuant to the requirements of Section 13 or 15(d) of the Securities Exchange Act of 1934, the registrant has duly caused this report to be signed on its behalf by the undersigned, thereunto duly authorized.
| | |
| | GRAMERCY PROPERTY TRUST INC. |
| Dated: March 14, 2014 | | By: /s/ Jon W. Clark
Name: Jon W. Clark
Title: Chief Financial Officer |
Pursuant to the requirements of the Securities Exchange Act of 1934, this report has been signed below by the following persons on behalf of the registrant and in the capacities and on the dates indicated:
| | | | |
| Signatures | | Title | | Date |
/s/ Gordon F. DuGan
Gordon F. DuGan | | Chief Executive Officer,
(Principal Executive Officer) | | March 14, 2014 |
/s/ Jon W. Clark
Jon W. Clark | | Chief Financial Officer,
(Principal Financial and Accounting Officer) | | March 14, 2014 |
/s/ Allan J. Baum
Allan J. Baum | | Chairman of the Board | | March 14, 2014 |
/s/ Marc Holliday
Marc Holliday | | Director | | March 14, 2014 |
/s/ Gregory F. Hughes
Gregory F. Hughes | | Director | | March 14, 2014 |
/s/ Jeffrey E. Kelter
Jeffrey E. Kelter | | Director | | March 14, 2014 |
/s/ Charles S. Laven
Charles S. Laven | | Director | | March 14, 2014 |
/s/ William H. Lenehan
William H. Lenehan | | Director | | March 14, 2014 |
139