Exhibit 99.2
Exhibit 99.2
THIRD QUARTER 2014
SUPPLEMENTAL INFORMATION

Table of Contents
Company Information 1
Reconciliation of Net Income to Funds from Operations. 2
Investment and Revenue by Asset Type, Operator, Country and State 3
Lease Maturity Schedule 4
Debt Summary 5
Consolidated Statements of Income 6
Consolidated Balance Sheets 7
Acquisitions and Summary of Development Projects 8
Detail of Other Assets .9
The information in this supplemental information package should be read in conjunction with the Company’s Annual Report on Form 10-K, Quarterly Reports on Form 10-Q, Current Reports on Form 8-K and other information filed with the Securities and Exchange Commission. You can access these documents free of charge at www.sec.gov and from the Company’s website at www.medicalpropertiestrust.com. The information contained on the Company’s website is not incorporated by reference into, and should not be considered a part of, this supplemental package.
For more information, please contact:
Charles Lambert, Managing Director—Capital Markets at (205) 397-8897 Tim Berryman, Director—Investor Relations at (205) 397-8589

United Kingdom
Germany
Company Information
Headquarters: Medical Properties Trust, Inc. 1000 Urban Center Drive, Suite 501 Birmingham, AL 35242 (205) 969-3755 Fax: (205) 969-3756
Website: www.medicalpropertiestrust.com
Executive Officers: Edward K. Aldag, Jr., Chairman, President and Chief Executive Officer R. Steven Hamner, Executive Vice President and Chief Financial Officer Emmett E. McLean, Executive Vice President, Chief Operating Officer, Secretary and Treasurer
Frank R. Williams, Senior Vice President, Senior Managing Director—Acquisitions
Investor Relations: Medical Properties Trust, Inc. 1000 Urban Center Drive, Suite 501 Birmingham, AL 35242 Attn: Tim Berryman (205) 397-8589 tberryman@medicalpropertiestrust.com
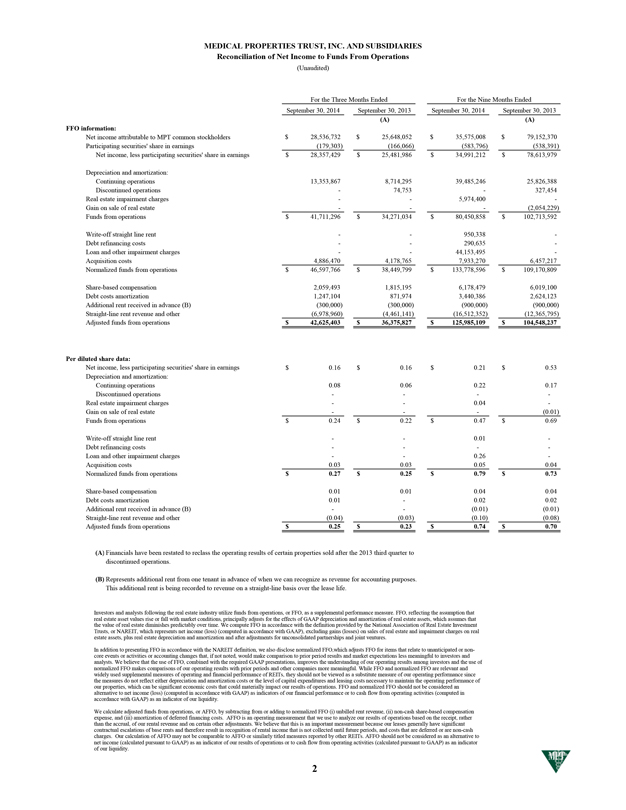
MEDICAL PROPERTIES TRUST, INC. AND SUBSIDIARIES Reconciliation of Net Income to Funds From Operations
(Unaudited)
For the Three Months Ended For the Nine Months Ended
September 30, 2014 September 30, 2013 September 30, 2014 September 30, 2013
(A)(A)
FFO information:
Net income attributable to MPT common stockholders $ 28,536,732 $ 25,648,052 $ 35,575,008 $ 79,152,370
Participating securities’ share in earnings(179,303)(166,066)(583,796)(538,391)
Net income, less participating securities’ share in earnings $ 28,357,429 $ 25,481,986 $ 34,991,212 $ 78,613,979
Depreciation and amortization:
Continuing operations 13,353,867 8,714,295 39,485,246 25,826,388
Discontinued operations—74,753—327,454
Real estate impairment charges — 5,974,400 -
Gain on sale of real estate — -(2,054,229)
Funds from operations $ 41,711,296 $ 34,271,034 $ 80,450,858 $ 102,713,592
Write-off straight line rent — 950,338 -
Debt refinancing costs — 290,635 -
Loan and other impairment charges — 44,153,495 -
Acquisition costs 4,886,470 4,178,765 7,933,270 6,457,217
Normalized funds from operations $ 46,597,766 $ 38,449,799 $ 133,778,596 $ 109,170,809
Share-based compensation 2,059,493 1,815,195 6,178,479 6,019,100
Debt costs amortization 1,247,104 871,974 3,440,386 2,624,123
Additional rent received in advance (B)(300,000)(300,000)(900,000)(900,000)
Straight-line rent revenue and other(6,978,960)(4,461,141)(16,512,352)(12,365,795)
Adjusted funds from operations $ 42,625,403 $ 36,375,827 $ 125,985,109 $ 104,548,237
Per diluted share data:
Net income, less participating securities’ share in earnings $ 0.16 $ 0.16 $ 0.21 $ 0.53
Depreciation and amortization:
Continuing operations 0.08 0.06 0.22 0.17
Discontinued operations — —
Real estate impairment charges — 0.04 -
Gain on sale of real estate — -(0.01)
Funds from operations $ 0.24 $ 0.22 $ 0.47 $ 0.69
Write-off straight line rent — 0.01 -
Debt refinancing costs — —
Loan and other impairment charges — 0.26 -
Acquisition costs 0.03 0.03 0.05 0.04
Normalized funds from operations $ 0.27 $ 0.25 $ 0.79 $ 0.73
Share-based compensation 0.01 0.01 0.04 0.04
Debt costs amortization 0.01—0.02 0.02
Additional rent received in advance (B) —(0.01)(0.01)
Straight-line rent revenue and other(0.04)(0.03)(0.10)(0.08)
Adjusted funds from operations $ 0.25 $ 0.23 $ 0.74 $ 0.70
(A) Financials have been restated to reclass the operating results of certain properties sold after the 2013 third quarter to discontinued operations.
(B) Represents additional rent from one tenant in advance of when we can recognize as revenue for accounting purposes. This additional rent is being recorded to revenue on a straight-line basis over the lease life.
Investors and analysts following the real estate industry utilize funds from operations, or FFO, as a supplemental performance measure. FFO, reflecting the assumption that real estate asset values rise or fall with market conditions, principally adjusts for the effects of GAAP depreciation and amortization of real estate assets, which assumes that the value of real estate diminishes predictably over time. We compute FFO in accordance with the definition provided by the National Association of Real Estate Investment Trusts, or NAREIT, which represents net income (loss) (computed in accordance with GAAP), excluding gains (losses) on sales of real estate and impairment charges on real estate assets, plus real estate depreciation and amortization and after adjustments for unconsolidated partnerships and joint ventures.
In addition to presenting FFO in accordance with the NAREIT definition, we also disclose normalized FFO,which adjusts FFO for items that relate to unanticipated or non-core events or activities or accounting changes that, if not noted, would make comparison to prior period results and market expectations less meaningful to investors and analysts. We believe that the use of FFO, combined with the required GAAP presentations, improves the understanding of our operating results among investors and the use of normalized FFO makes comparisons of our operating results with prior periods and other companies more meaningful. While FFO and normalized FFO are relevant and widely used supplemental measures of operating and financial performance of REITs, they should not be viewed as a substitute measure of our operating performance since the measures do not reflect either depreciation and amortization costs or the level of capital expenditures and leasing costs necessary to maintain the operating performance of our properties, which can be significant economic costs that could materially impact our results of operations. FFO and normalized FFO should not be considered an alternative to net income (loss) (computed in accordance with GAAP) as indicators of our financial performance or to cash flow from operating activities (computed in accordance with GAAP) as an indicator of our liquidity.
We calculate adjusted funds from operations, or AFFO, by subtracting from or adding to normalized FFO (i) unbilled rent revenue, (ii) non-cash share-based compensation expense, and (iii) amortization of deferred financing costs. AFFO is an operating measurement that we use to analyze our results of operations based on the receipt, rather than the accrual, of our rental revenue and on certain other adjustments. We believe that this is an important measurement because our leases generally have significant contractual escalations of base rents and therefore result in recognition of rental income that is not collected until future periods, and costs that are deferred or are non-cash charges. Our calculation of AFFO may not be comparable to AFFO or similarly titled measures reported by other REITs. AFFO should not be considered as an alternative to net income (calculated pursuant to GAAP) as an indicator of our results of operations or to cash flow from operating activities (calculated pursuant to GAAP) as an indicator of our liquidity.
2
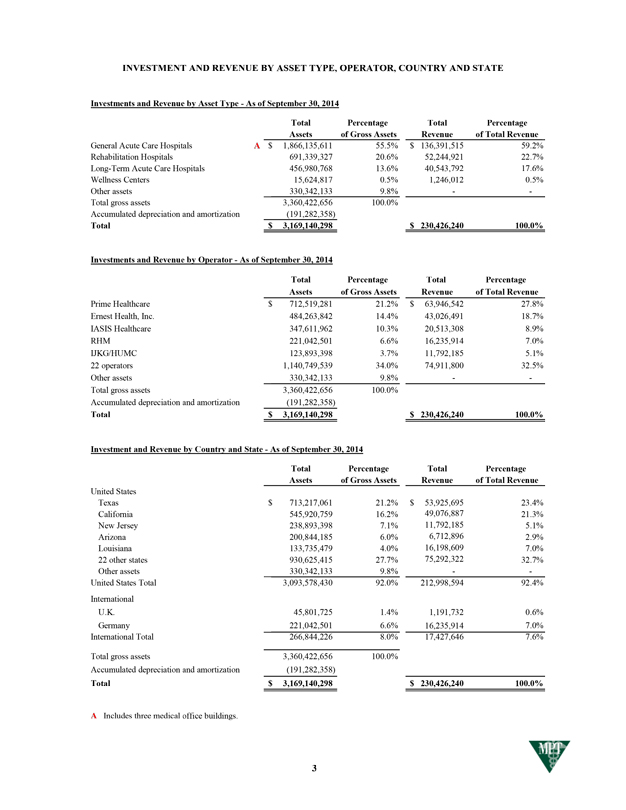
INVESTMENT AND REVENUE BY ASSET TYPE, OPERATOR, COUNTRY AND STATE
Investments and Revenue by Asset Type—As of September 30, 2014
Total Assets
Percentage of Gross Assets
Total Revenue
Percentage of Total Revenue
General Acute Care Hospitals A $ 1,866,135,611 55.5% $ 136,391,515 59.2%
Rehabilitation Hospitals 691,339,327 20.6% 52,244,921 22.7%
Long-Term Acute Care Hospitals 456,980,768 13.6% 40,543,792 17.6%
Wellness Centers 15,624,817 0.5% 1,246,012 0.5%
Other assets 330,342,133 9.8% —
Total gross assets 3,360,422,656 100.0%
Accumulated depreciation and amortization(191,282,358)
Total $ 3,169,140,298 $ 230,426,240 100.0%
Investments and Revenue by Operator—As of September 30, 2014
Total Assets
Percentage of Gross Assets
Total Revenue
Percentage of Total Revenue
Prime Healthcare $ 712,519,281 21.2% $ 63,946,542 27.8%
Ernest Health, Inc. 484,263,842 14.4% 43,026,491 18.7%
IASIS Healthcare 347,611,962 10.3% 20,513,308 8.9%
RHM 221,042,501 6.6% 16,235,914 7.0%
IJKG/HUMC 123,893,398 3.7% 11,792,185 5.1%
22 operators 1,140,749,539 34.0% 74,911,800 32.5%
Other assets 330,342,133 9.8% —
Total gross assets 3,360,422,656 100.0%
Accumulated depreciation and amortization(191,282,358)
Total $ 3,169,140,298 $ 230,426,240 100.0%
Investment and Revenue by Country and State—As of September 30, 2014
Total Assets
Percentage of Gross Assets
Total Revenue
Percentage of Total Revenue
United States
Texas $ 713,217,061 21.2% $ 53,925,695 23.4%
California 545,920,759 16.2% 49,076,887 21.3%
New Jersey 238,893,398 7.1% 11,792,185 5.1%
Arizona 200,844,185 6.0% 6,712,896 2.9%
Louisiana 133,735,479 4.0% 16,198,609 7.0%
22 other states 930,625,415 27.7% 75,292,322 32.7%
Other assets 330,342,133 9.8% —
United States Total 3,093,578,430 92.0% 212,998,594 92.4%
International
U.K. 45,801,725 1.4% 1,191,732 0.6%
Germany 221,042,501 6.6% 16,235,914 7.0%
International Total 266,844,226 8.0% 17,427,646 7.6%
Total gross assets 3,360,422,656 100.0%
Accumulated depreciation and amortization(191,282,358)
Total $ 3,169,140,298 $ 230,426,240 100.0%
A Includes three medical office buildings.
3
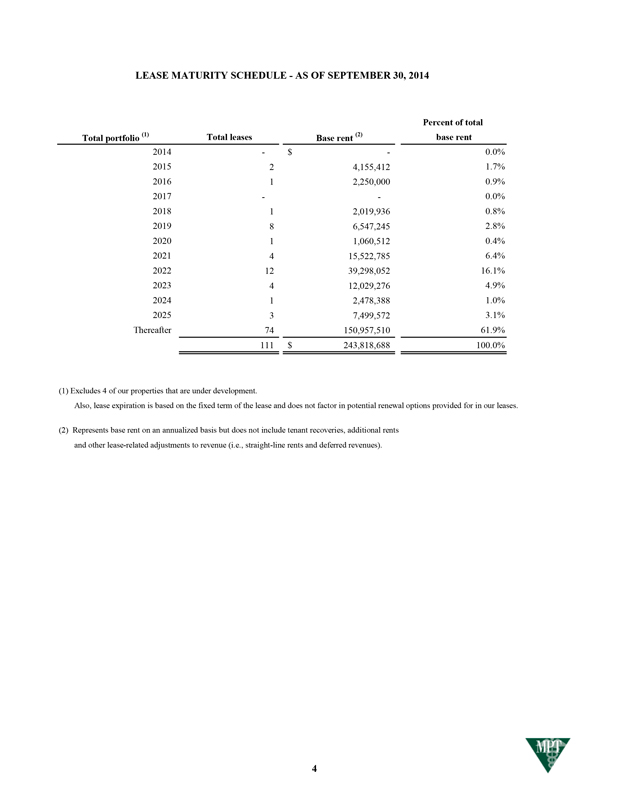
LEASE MATURITY SCHEDULE—AS OF SEPTEMBER 30, 2014
Percent of total base rent
Total portfolio (1) Total leases Base rent (2)
2014—$—0.0%
2015 2 4,155,412 1.7%
2016 1 2,250,000 0.9%
2017 — 0.0%
2018 1 2,019,936 0.8%
2019 8 6,547,245 2.8%
2020 1 1,060,512 0.4%
2021 4 15,522,785 6.4%
2022 12 39,298,052 16.1%
2023 4 12,029,276 4.9%
2024 1 2,478,388 1.0%
2025 3 7,499,572 3.1%
Thereafter 74 150,957,510 61.9%
111 $ 243,818,688 100.0%
(1) Excludes 4 of our properties that are under development.
Also, lease expiration is based on the fixed term of the lease and does not factor in potential renewal options provided for in our leases.
(2) Represents base rent on an annualized basis but does not include tenant recoveries, additional rents and other lease-related adjustments to revenue (i.e., straight-line rents and deferred revenues).
4
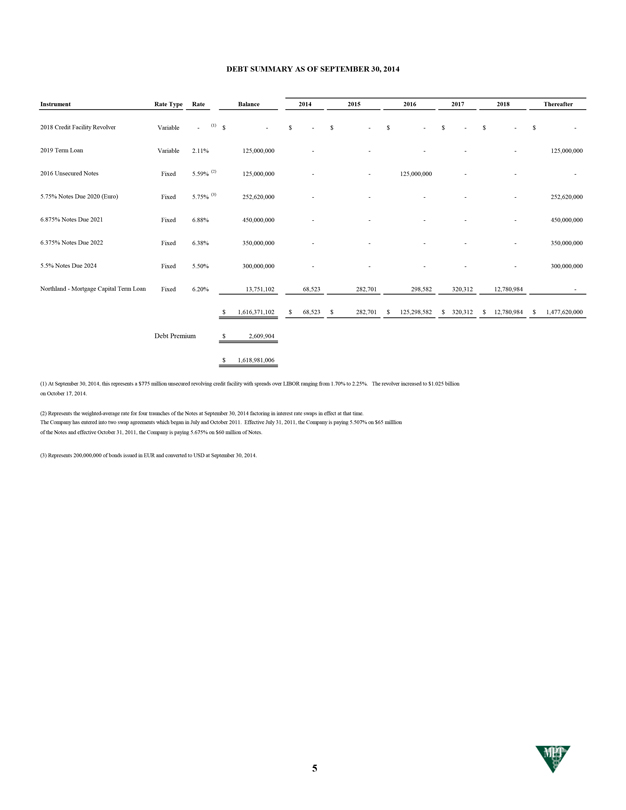
DEBT SUMMARY AS OF SEPTEMBER 30, 2014
Instrument Rate Type Rate Balance 2014 2015 2016 2017 2018 Thereafter
2018 Credit Facility Revolver Variable—(1) $—$—$—$—$—$—$ -
2019 Term Loan Variable 2.11% 125,000,000 — ——125,000,000
2016 Unsecured Notes Fixed 5.59% (2) 125,000,000 — 125,000,000 — -
5.75% Notes Due 2020 (Euro) Fixed 5.75% (3) 252,620,000 — ——252,620,000
6.875% Notes Due 2021 Fixed 6.88% 450,000,000 — ——450,000,000
6.375% Notes Due 2022 Fixed 6.38% 350,000,000 — ——350,000,000
5.5% Notes Due 2024 Fixed 5.50% 300,000,000 — ——300,000,000
Northland—Mortgage Capital Term Loan Fixed 6.20% 13,751,102 68,523 282,701 298,582 320,312 12,780,984 -
$ 1,616,371,102 $ 68,523 $ 282,701 $ 125,298,582 $ 320,312 $ 12,780,984 $ 1,477,620,000
Debt Premium $ 2,609,904
$ 1,618,981,006
(1) At September 30, 2014, this represents a $775 million unsecured revolving credit facility with spreads over LIBOR ranging from 1.70% to 2.25%. The revolver increased to $1.025 billion on October 17, 2014.
(2) Represents the weighted-average rate for four traunches of the Notes at September 30, 2014 factoring in interest rate swaps in effect at that time.
The Company has entered into two swap agreements which began in July and October 2011. Effective July 31, 2011, the Company is paying 5.507% on $65 milllion of the Notes and effective October 31, 2011, the Company is paying 5.675% on $60 million of Notes.
(3) Represents 200,000,000 of bonds issued in EUR and converted to USD at September 30, 2014.
5
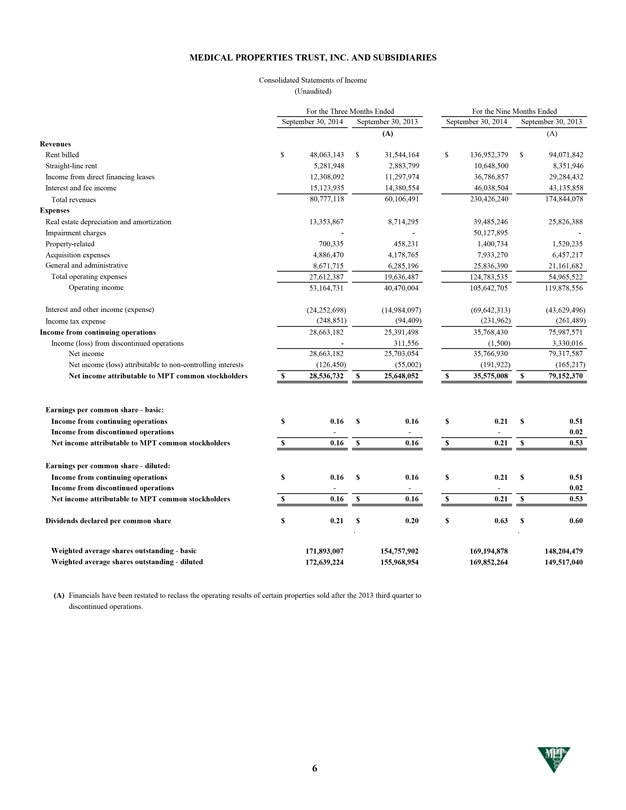
MEDICAL PROPERTIES TRUST, INC. AND SUBSIDIARIES
Consolidated Statements of Income
(Unaudited)
For the Three Months Ended For the Nine Months Ended
September 30, 2014 September 30, 2013 September 30, 2014 September 30, 2013
(A)(A)
Revenues
Rent billed $ 48,063,143 $ 31,544,164 $ 136,952,379 $ 94,071,842
Straight-line rent 5,281,948 2,883,799 10,648,500 8,351,946
Income from direct financing leases 12,308,092 11,297,974 36,786,857 29,284,432
Interest and fee income 15,123,935 14,380,554 46,038,504 43,135,858
Total revenues 80,777,118 60,106,491 230,426,240 174,844,078
Expenses
Real estate depreciation and amortization 13,353,867 8,714,295 39,485,246 25,826,388
Impairment charges — 50,127,895 -
Property-related 700,335 458,231 1,400,734 1,520,235
Acquisition expenses 4,886,470 4,178,765 7,933,270 6,457,217
General and administrative 8,671,715 6,285,196 25,836,390 21,161,682
Total operating expenses 27,612,387 19,636,487 124,783,535 54,965,522
Operating income 53,164,731 40,470,004 105,642,705 119,878,556
Interest and other income (expense)(24,252,698)(14,984,097)(69,642,313)(43,629,496)
Income tax expense(248,851)(94,409)(231,962)(261,489)
Income from continuing operations 28,663,182 25,391,498 35,768,430 75,987,571
Income (loss) from discontinued operations—311,556(1,500) 3,330,016
Net income 28,663,182 25,703,054 35,766,930 79,317,587
Net income (loss) attributable to non-controlling interests(126,450)(55,002)(191,922)(165,217)
Net income attributable to MPT common stockholders $ 28,536,732 $ 25,648,052 $ 35,575,008 $ 79,152,370
Earnings per common share—basic:
Income from continuing operations $ 0.16 $ 0.16 $ 0.21 $ 0.51
Income from discontinued operations ——0.02
Net income attributable to MPT common stockholders $ 0.16 $ 0.16 $ 0.21 $ 0.53
Earnings per common share—diluted:
Income from continuing operations $ 0.16 $ 0.16 $ 0.21 $ 0.51
Income from discontinued operations ——0.02
Net income attributable to MPT common stockholders $ 0.16 $ 0.16 $ 0.21 $ 0.53
Dividends declared per common share $ 0.21 $ 0.20 $ 0.63 $ 0.60
Weighted average shares outstanding—basic 171,893,007 154,757,902 169,194,878 148,204,479
Weighted average shares outstanding—diluted 172,639,224 155,968,954 169,852,264 149,517,040
(A) Financials have been restated to reclass the operating results of certain properties sold after the 2013 third quarter to
discontinued operations.
6
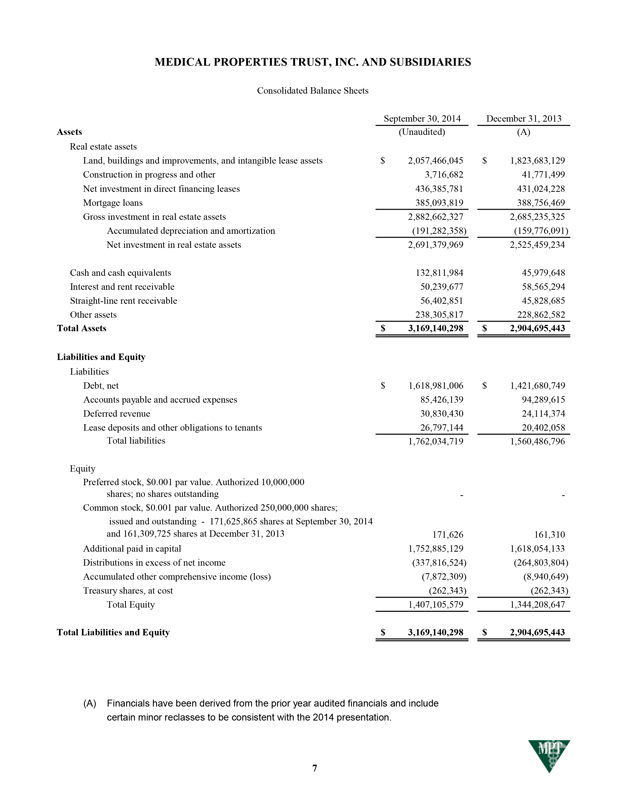
MEDICAL PROPERTIES TRUST, INC. AND SUBSIDIARIES
Consolidated Balance Sheets
September 30, 2014 December 31, 2013
Assets(Unaudited)(A)
Real estate assets
Land, buildings and improvements, and intangible lease assets $ 2,057,466,045 $ 1,823,683,129
Construction in progress and other 3,716,682 41,771,499
Net investment in direct financing leases 436,385,781 431,024,228
Mortgage loans 385,093,819 388,756,469
Gross investment in real estate assets 2,882,662,327 2,685,235,325
Accumulated depreciation and amortization(191,282,358)(159,776,091)
Net investment in real estate assets 2,691,379,969 2,525,459,234
Cash and cash equivalents 132,811,984 45,979,648
Interest and rent receivable 50,239,677 58,565,294
Straight-line rent receivable 56,402,851 45,828,685
Other assets 238,305,817 228,862,582
Total Assets $ 3,169,140,298 $ 2,904,695,443
Liabilities and Equity
Liabilities
Debt, net $ 1,618,981,006 $ 1,421,680,749
Accounts payable and accrued expenses 85,426,139 94,289,615
Deferred revenue 30,830,430 24,114,374
Lease deposits and other obligations to tenants 26,797,144 20,402,058
Total liabilities 1,762,034,719 1,560,486,796
Equity
Preferred stock, $0.001 par value. Authorized 10,000,000
shares; no shares outstanding —
Common stock, $0.001 par value. Authorized 250,000,000 shares;
issued and outstanding—171,625,865 shares at September 30, 2014
and 161,309,725 shares at December 31, 2013 171,626 161,310
Additional paid in capital 1,752,885,129 1,618,054,133
Distributions in excess of net income(337,816,524)(264,803,804)
Accumulated other comprehensive income (loss)(7,872,309)(8,940,649)
Treasury shares, at cost(262,343)(262,343)
Total Equity 1,407,105,579 1,344,208,647
Total Liabilities and Equity $ 3,169,140,298 $ 2,904,695,443
(A) Financials have been derived from the prior year audited financials and include certain minor reclasses to be consistent with the 2014 presentation.
7
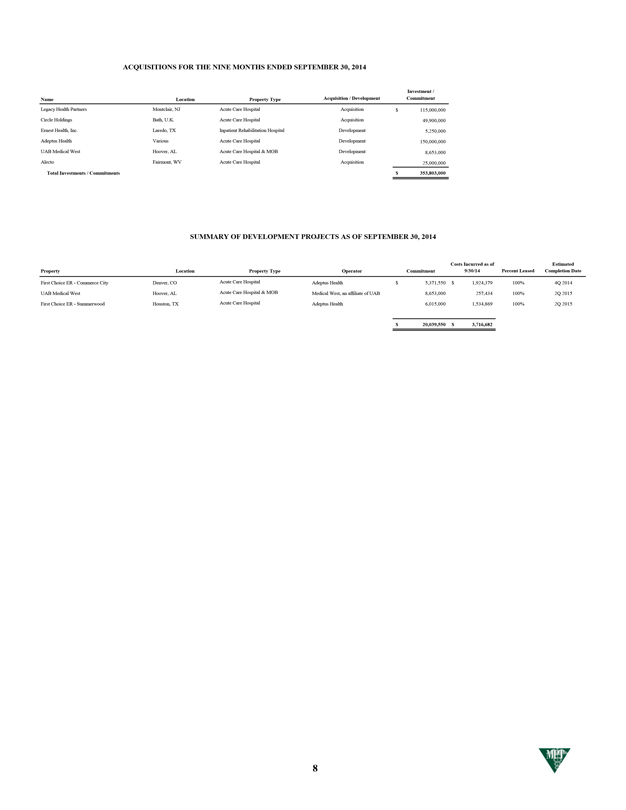
ACQUISITIONS FOR THE NINE MONTHS ENDED SEPTEMBER 30, 2014
Name Location Property Type Acquisition / Development Investment / commitment
Legacy Health Partners Montclair, NJ Acute Care Hospital Acquisition $ 115,000,000
Circle Holdings Bath, U.K. Acute Care Hospital Acquisition 49,900,000
Ernest Health, Inc. Laredo, TX Inpatient Rehabilitation Hospital Development 5,250,000
Adeptus Health Various Acute Care Hospital Development 150,000,000
UAB Medical West Hoover, AL Acute Care Hospital & MOB Development 8,653,000
Alecto Fairmont, WV Acute Care Hospital Acquisition 25,000,000
Total Investments / Commitments $ 353,803,000
SUMMARY OF DEVELOPMENT PROJECTS AS OF SEPTEMBER 30, 2014
Property Location Property Type Operator Commitment Costs Incurred as of 9/30/14 Percent Leased Estimated Completion Date
First Choice ER—Commerce City Denver, CO Acute Care Hospital Adeptus Health $ 5,371,550 $ 1,924,379 100% 4Q 2014
UAB Medical West Hoover, AL Acute Care Hospital & MOB Medical West, an affiliate of UAB 8,653,000 257,434 100% 2Q 2015
First Choice ER—Summerwood Houston, TX Acute Care Hospital Adeptus Health 6,015,000 1,534,869 100% 2Q 2015
$ 20,039,550 $ 3,716,682
8
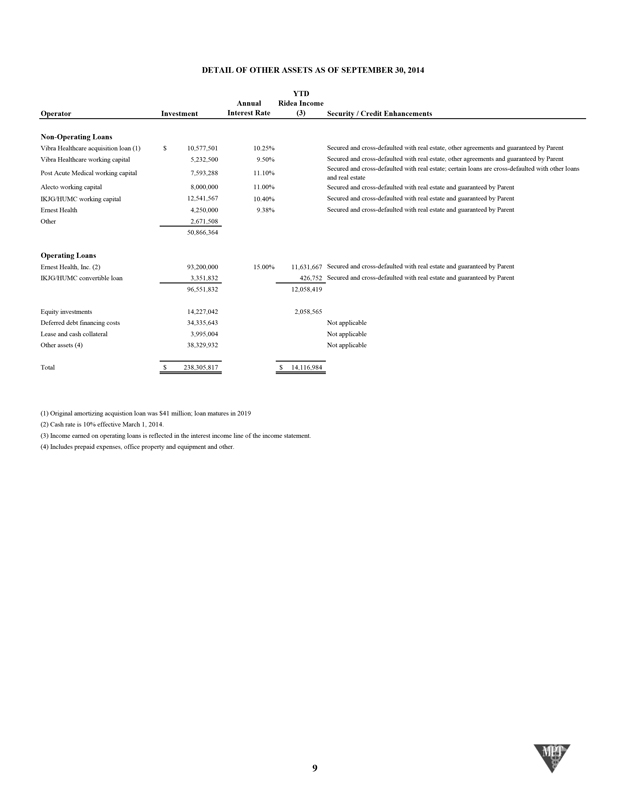
DETAIL OF OTHER ASSETS AS OF SEPTEMBER 30, 2014
Operator Investment
Annual Interest Rate
YTD Ridea Income (3)
Security / Credit Enhancements
Non-Operating Loans
Vibra Healthcare acquisition loan (1) $ 10,577,501 10.25% Secured and cross-defaulted with real estate, other agreements and guaranteed by Parent
Vibra Healthcare working capital 5,232,500 9.50% Secured and cross-defaulted with real estate, other agreements and guaranteed by Parent
Post Acute Medical working capital 7,593,288 11.10% Secured and cross-defaulted with real estate; certain loans are cross-defaulted with other loans
and real estate
Alecto working capital 8,000,000 11.00% Secured and cross-defaulted with real estate and guaranteed by Parent
IKJG/HUMC working capital 12,541,567 10.40% Secured and cross-defaulted with real estate and guaranteed by Parent
Ernest Health 4,250,000 9.38% Secured and cross-defaulted with real estate and guaranteed by Parent
Other 2,671,508
50,866,364
Operating Loans
Ernest Health, Inc. (2) 93,200,000 15.00% 11,631,667 Secured and cross-defaulted with real estate and guaranteed by Parent
IKJG/HUMC convertible loan 3,351,832 426,752 Secured and cross-defaulted with real estate and guaranteed by Parent
96,551,832 12,058,419
Equity investments 14,227,042 2,058,565
Deferred debt financing costs 34,335,643 Not applicable
Lease and cash collateral 3,995,004 Not applicable
Other assets (4) 38,329,932 Not applicable
Total $ 238,305,817 $ 14,116,984
(1) Original amortizing acquistion loan was $41 million; loan matures in 2019
(2) Cash rate is 10% effective March 1, 2014.
(3) Income earned on operating loans is reflected in the interest income line of the income statement.
(4) Includes prepaid expenses, office property and equipment and other.
9

Medical Properties Trust, Inc. 1000 Urban Center Drive, Suite 501 Birmingham, AL 35242 (205) 969-3755 www.medicalpropertiestrust.com
Contact:
Charles Lambert, Managing Director—Capital Markets (205) 397-8897 or clambert@medicalpropertiestrust.com or Tim Berryman, Director—Investor Relations (205) 397-8589 or tberryman@medicalpropertiestrust.com
InvestIng In the future of healthcare.