Exhibit 99.2
|
Medical Properties Trust
FIRST QUARTER 2015
Supplemental Information
|
MEDICALPROPERTIESTRUST.COM
TABLE OF CONTENTS
COMPANY OVERVIEW
Company Information 3
FINANCIAL INFORMATION
Reconciliation of Net Income to Funds from Operations 5
Debt Summary 6
Debt Maturity Schedule 7
PORTFOLIO INFORMATION
Lease Maturity Schedule 8
Investments and Revenue by Asset Type, Operator, State and Country 9
Acquisitions and Summary of Development Projects 12
FINANCIAL STATEMENTS
Consolidated Statements of Income 13
Consolidated Balance Sheets 14
Detail of Other Assets 15
FORWARD-LOOKING STATEMENT Forward-looking statements involve known and unknown risks, uncertainties and other factors that may cause the actual results of the Company or future events to differ materially from those expressed in or underlying such forward-looking statements, including without limitation: the satisfaction of all conditions to, and the timely closing (if at all) of the Median sale-leaseback transactions; the Company financing of the transactions described herein; the capacity of Median and the Company’s other tenants to meet the terms of their agreements; Normalized FFO per share; expected payout ratio, the amount of acquisitions of healthcare real estate, if any; capital markets conditions, the repayment of debt arrangements; statements concerning the additional income to the Company as a result of ownership interests in certain hospital operations and the timing of such income; the payment of future dividends, if any; completion of additional debt arrangement, and additional investments; national and international economic, business, real estate and other market conditions; the competitive environment in which the Company operates; the execution of the Company’s business plan; financing risks; the Company’s ability to maintain its status as a REIT for federal income tax purposes; acquisition and development risks; potential environmental and other liabilities; and other factors affecting the real estate industry generally or healthcare real estate in particular. For further discussion of the factors that could affect outcomes, please refer to the “Risk factors” section of the Company’s Annual Report on Form 10-K for the year ended December 31, 2014, and as updated by the Company’s subsequently filed Quarterly Reports on Form 10-Q and other SEC filings. Except as otherwise required by the federal securities laws, the Company undertakes no obligation to update the information in this report.
Q1 2015 | SUPPLEMENTAL INFORMATION
2
|
MEDICALPROPERTIESTRUST.COM
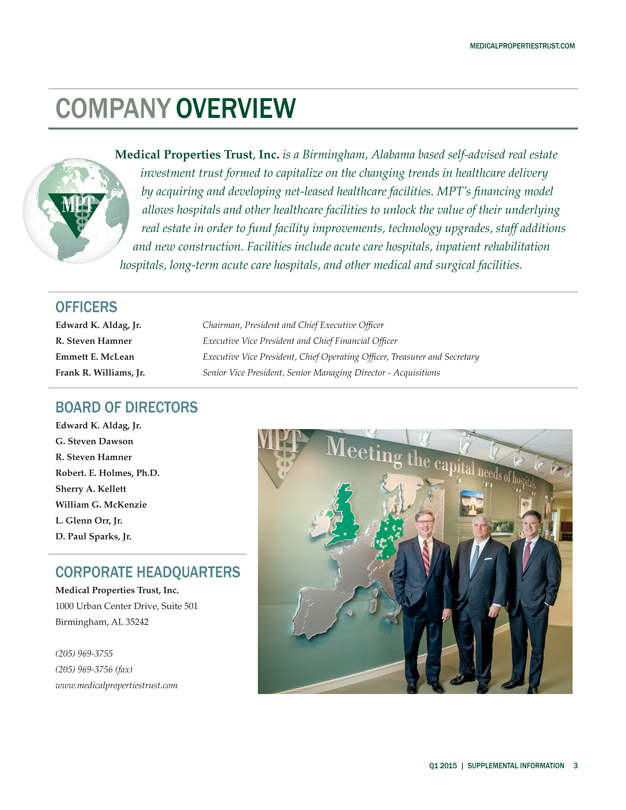
COMPANY OVERVIEW
Medical Properties Trust, Inc. is a Birmingham, Alabama based self-advised real estate investment trust formed to capitalize on the changing trends in healthcare delivery by acquiring and developing net-leased healthcare facilities. MPT’s financing model allows hospitals and other healthcare facilities to unlock the value of their underlying real estate in order to fund facility improvements, technology upgrades, staff additions and new construction. Facilities include acute care hospitals, inpatient rehabilitation hospitals, long-term acute care hospitals, and other medical and surgical facilities.
OFFICERS
Edward K. Aldag, Jr. Chairman, President and Chief Executive Officer R. Steven Hamner Executive Vice President and Chief Financial Officer
Emmett E. McLean Executive Vice President, Chief Operating Officer, Treasurer and Secretary Frank R. Williams, Jr. Senior Vice President, Senior Managing Director—Acquisitions
BOARD OF DIRECTORS
Edward K. Aldag, Jr. G. Steven Dawson R. Steven Hamner Robert. E. Holmes, Ph.D. Sherry A. Kellett William G. McKenzie L. Glenn Orr, Jr. D. Paul Sparks, Jr.
CORPORATE HEADQUARTERS
Medical Properties Trust, Inc.
1000 Urban Center Drive, Suite 501 Birmingham, AL 35242
(205) 969-3755 (205) 969-3756 (fax) www.medicalpropertiestrust.com
Q1 2015 | SUPPLEMENTAL INFORMATION
3
|
MEDICALPROPERTIESTRUST.COM
COMPANY OVERVIEW (continued)
INVESTOR RELATIONS CAPITAL MARKETS
Tim Berryman | Director—Investor Relations Charles Lambert | Managing Director—Capital Markets
(205) 397-8589 (205) 397-8897
tberryman@medicalpropertiestrust.com clambert@medicalpropertiestrust.com
TRANSFER AGENT STOCK EXCHANGE SENIOR UNSECURED
American Stock Transfer LISTING AND DEBT RATINGS
and Trust Company TRADING SYMBOL Moody’s – Ba1
6201 15th Avenue New York Stock Exchange Standard & Poor’s – BBB-
Brooklyn, NY 11219 (NYSE): MPW
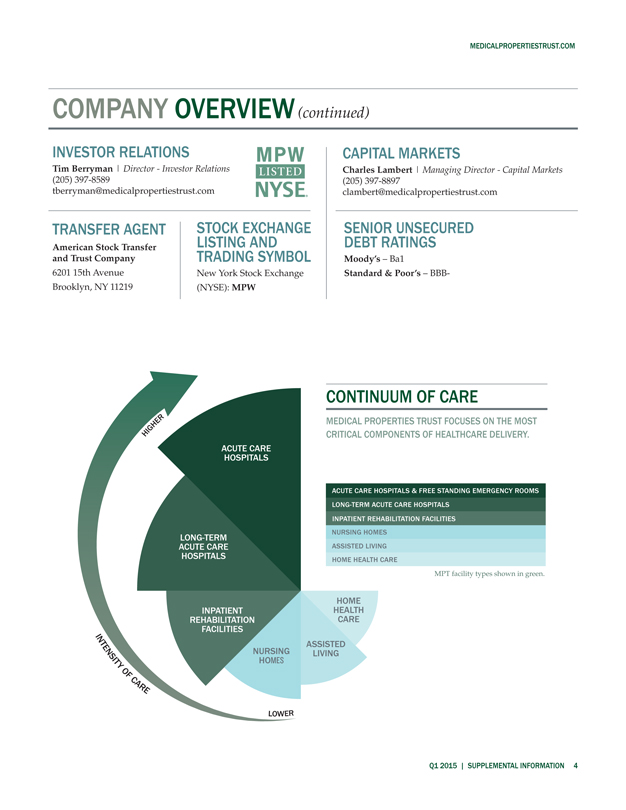
CONTINUUM OF CARER
E MEDICAL PROPERTIES TRUST FOCUSES ON THE MOST H
H I G CRITICAL COMPONENTS OF HEALTHCARE DELIVERY.
ACUTE HOSPITALS CARE
ACUTE CARE HOSPITALS & FREE STANDING EMERGENCY ROOMS LONG-TERM ACUTE CARE HOSPITALS
INPATIENT REHABILITATION FACILITIES NURSING HOMES
LONG-TERM
ACUTE CARE ASSISTED LIVING HOSPITALS HOME HEALTH CARE
MPT facility types shown in green.
HEALTH HOME REHABILITATION INPATIENT CARE
I FACILITIES
N T ASSISTED E N NURSING
S LIVING I T HOMES
Y
OF
C
AR
E
LOWER
Q1 2015 | SUPPLEMENTAL INFORMATION
4
|
MEDICALPROPERTIESTRUST.COM
FINANCIAL INFORMATION
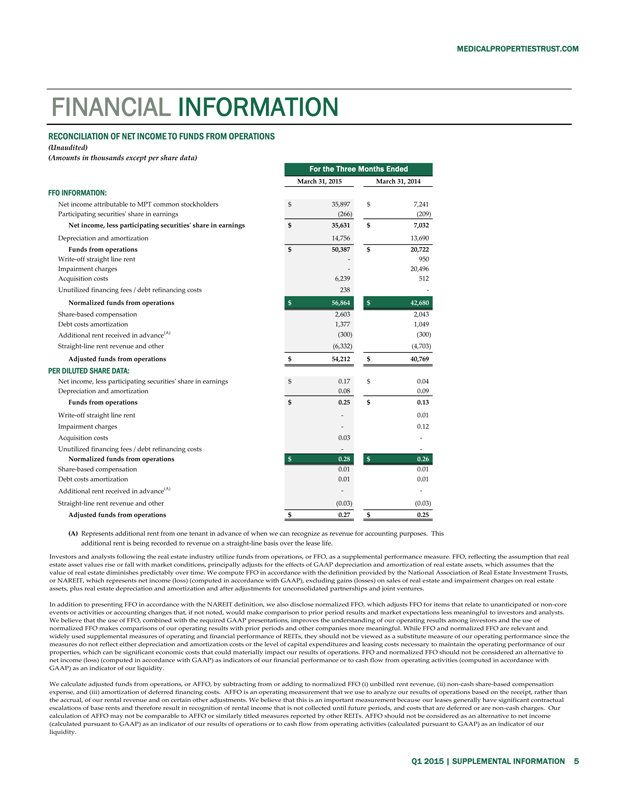
RECONCILIATION OF NET INCOME TO FUNDS FROM OPERATIONS
(Unaudited)
(Amounts in thousands except per share data)
For the Three Months Ended
March 31, 2015 March 31, 2014
FFO INFORMATION:
Net income attributable to MPT common stockholders $ 35,897 $ 7,241
Participating securities’ share in earnings (266) (209)
Net income, less participating securities’ share in earnings $ 35,631 $ 7,032
Depreciation and amortization 14,756 13,690
Funds from operations $ 50,387 $ 20,722
Write-off straight line rent — 950
Impairment charges — 20,496
Acquisition costs 6,239 512
Unutilized financing fees / debt refinancing costs 238 -
Normalized funds from operations $ 56,864 $ 42,680
Share-based compensation 2,603 2,043
Debt costs amortization 1,377 1,049
Additional rent received in advance(A) (300) (300)
Straight-line rent revenue and other (6,332) (4,703)
Adjusted funds from operations $ 54,212 $ 40,769
PER DILUTED SHARE DATA:
Net income, less participating securities’ share in earnings $ 0.17 $ 0.04
Depreciation and amortization 0.08 0.09
Funds from operations $ 0.25 $ 0.13
Write-off straight line rent — 0.01
Impairment charges — 0.12
Acquisition costs 0.03 -
Unutilized financing fees / debt refinancing costs — -
Normalized funds from operations $ 0.28 $ 0.26
Share-based compensation 0.01 0.01
Debt costs amortization 0.01 0.01
Additional rent received in advance(A) — -
Straight-line rent revenue and other (0.03) (0.03)
Adjusted funds from operations $ 0.27 $ 0.25
(A) Represents additional rent from one tenant in advance of when we can recognize as revenue for accounting purposes. This additional rent is being recorded to revenue on a straight-line basis over the lease life.
Investors and analysts following the real estate industry utilize funds from operations, or FFO, as a supplemental performance measure. FFO, reflecting the assumption that real estate asset values rise or fall with market conditions, principally adjusts for the effects of GAAP depreciation and amortization of real estate assets, which assumes that the value of real estate diminishes predictably over time. We compute FFO in accordance with the definition provided by the National Association of Real Estate Investment Trusts, or NAREIT, which represents net income (loss) (computed in accordance with GAAP), excluding gains (losses) on sales of real estate and impairment charges on real estate assets, plus real estate depreciation and amortization and after adjustments for unconsolidated partnerships and joint ventures.
In addition to presenting FFO in accordance with the NAREIT definition, we also disclose normalized FFO, which adjusts FFO for items that relate to unanticipated or non-core events or activities or accounting changes that, if not noted, would make comparison to prior period results and market expectations less meaningful to investors and analysts. We believe that the use of FFO, combined with the required GAAP presentations, improves the understanding of our operating results among investors and the use of normalized FFO makes comparisons of our operating results with prior periods and other companies more meaningful. While FFO and normalized FFO are relevant and widely used supplemental measures of operating and financial performance of REITs, they should not be viewed as a substitute measure of our operating performance since the measures do not reflect either depreciation and amortization costs or the level of capital expenditures and leasing costs necessary to maintain the operating performance of our properties, which can be significant economic costs that could materially impact our results of operations. FFO and normalized FFO should not be considered an alternative to net income (loss)
(computed in accordance with GAAP) as indicators of our financial performance or to cash flow from operating activities (computed in accordance with GAAP) as an indicator of our liquidity.
We calculate adjusted funds from operations, or AFFO, by subtracting from or adding to normalized FFO (i) unbilled rent revenue, (ii) non-cash share-based compensation expense, and (iii) amortization of deferred financing costs. AFFO is an operating measurement that we use to analyze our results of operations based on the receipt, rather than the accrual, of our rental revenue and on certain other adjustments. We believe that this is an important measurement because our leases generally have significant contractual escalations of base rents and therefore result in recognition of rental income that is not collected until future periods, and costs that are deferred or are non-cash charges. Our calculation of AFFO may not be comparable to AFFO or similarly titled measures reported by other REITs. AFFO should not be considered as an alternative to net income (calculated pursuant to GAAP) as an indicator of our results of operations or to cash flow from operating activities (calculated pursuant to GAAP) as an indicator of our liquidity.
Q1 2015 | SUPPLEMENTAL INFORMATION
5 |
|
|
MEDICALPROPERTIESTRUST.COM
FINANCIAL INFORMATION
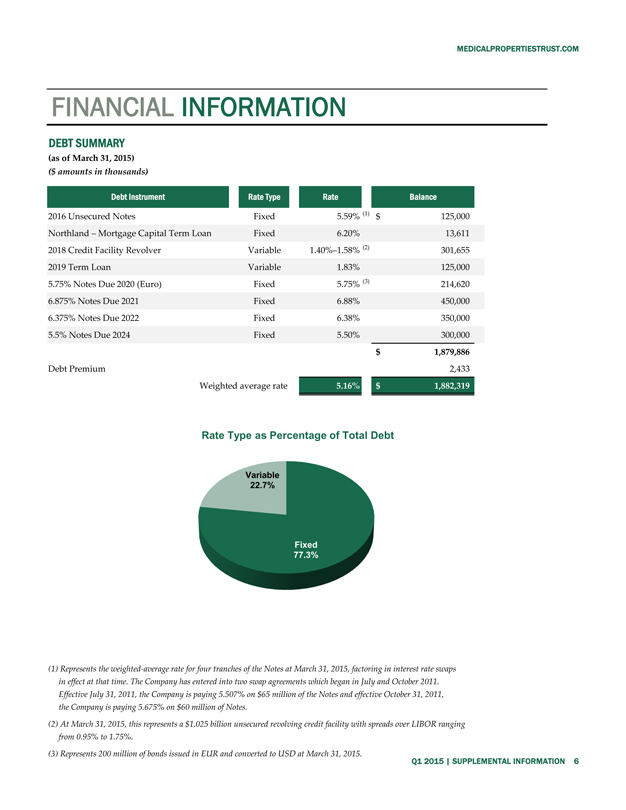
DEBT SUMMARY
(as of March 31, 2015)
($ amounts in thousands)
Debt Instrument Rate Type Rate Balance
2016 Unsecured Notes Fixed 5.59% (1) $ 125,000
Northland – Mortgage Capital Term Loan Fixed 6.20% 13,611
2018 Credit Facility Revolver Variable 1.40%–1.58% (2) 301,655
2019 Term Loan Variable 1.83% 125,000
5.75% Notes Due 2020 (Euro) Fixed 5.75% (3) 214,620
6.875% Notes Due 2021 Fixed 6.88% 450,000
6.375% Notes Due 2022 Fixed 6.38% 350,000
5.5% Notes Due 2024 Fixed 5.50% 300,000
$ 1,879,886
Debt Premium 2,433
Weighted average rate 5.16% $ 1,882,319
Rate Type as Percentage of Total Debt
Variable 22.7%
Fixed 77.3%
(1) Represents the weighted-average rate for four tranches of the Notes at March 31, 2015, factoring in interest rate swaps in effect at that time. The Company has entered into two swap agreements which began in July and October 2011. Effective July 31, 2011, the Company is paying 5.507% on $65 million of the Notes and effective October 31, 2011, the Company is paying 5.675% on $60 million of Notes.
(2) At March 31, 2015, this represents a $1.025 billion unsecured revolving credit facility with spreads over LIBOR ranging from 0.95% to 1.75%.
(3) Represents 200 million of bonds issued in EUR and converted to USD at March 31, 2015. Q1 2015 | SUPPLEMENTAL INFORMATION
6
|
MEDICALPROPERTIESTRUST.COM
FINANCIAL INFORMATION
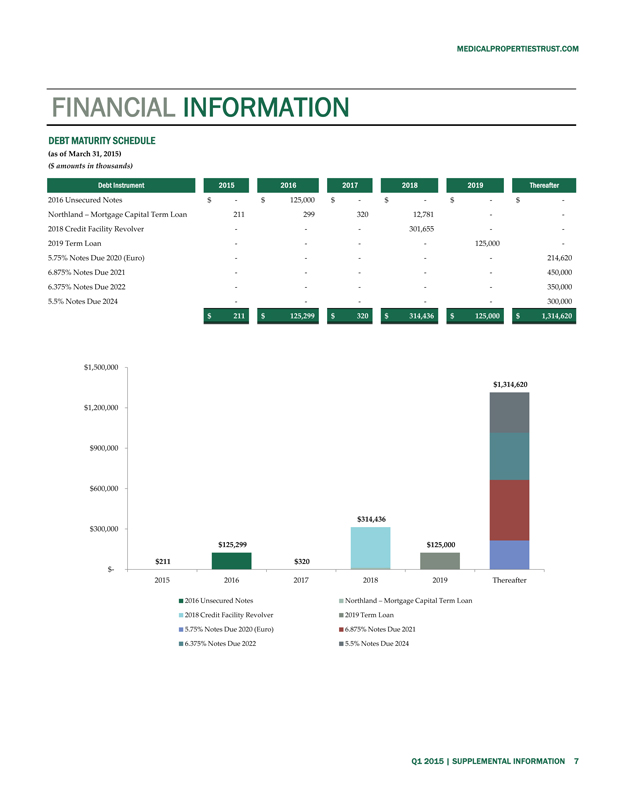
DEBT MATURITY SCHEDULE
(as of March 31, 2015)
($ amounts in thousands)
Debt Instrument 2015 2016 2017 2018 2019 Thereafter
2016 Unsecured Notes $ — $ 125,000 $ — $ — $ — $ -
Northland – Mortgage Capital Term Loan 211 299 320 12,781 — -
2018 Credit Facility Revolver — — — 301,655 — -
2019 Term Loan — — — — 125,000 -
5.75% Notes Due 2020 (Euro) — — — — — 214,620
6.875% Notes Due 2021 — — — — — 450,000
6.375% Notes Due 2022 — — — — — 350,000
5.5% Notes Due 2024 — — — — — 300,000
$ 211 $ 125,299 $ 320 $ 314,436 $ 125,000 $ 1,314,620
$1,500,000 $1,314,620 $1,200,000
$900,000
$600,000
$314,436 $300,000
$125,299 $125,000
$211 $320 $-
2015 2016 2017 2018 2019 Thereafter
2016 Unsecured Notes Northland – Mortgage Capital Term Loan
2018 Credit Facility Revolver 2019 Term Loan
5.75% Notes Due 2020 (Euro) 6.875% Notes Due 2021
6.375% Notes Due 2022 5.5% Notes Due 2024
Q1 2015 | SUPPLEMENTAL INFORMATION 7
|

MEDICALPROPERTIESTRUST.COM
PORTFOLIO INFORMATION
LEASE MATURITY SCHEDULE
(as of March 31, 2015) ($ amounts in thousands)
Years of Lease Maturities (1) Total Leases Base Rent (2) Percent of Total
Base Rent
2015 — $ — -
2016 1 2,250 0.9%
2017 — — -
2018 1 2,020 0.8%
2019 8 6,547 2.5%
2020 1 1,061 0.4%
2021 3 14,244 5.5%
2022(3) 12 37,955 14.7%
2023 4 12,029 4.6%
2024 1 2,478 1.0%
Thereafter 87 179,887 69.6%
118 ## $ 258,471 100.0%
Percentageo f Total Base Rent
80%
69.6%
70% 60% 50% 40% 30%
20% 14.7%
10% 5.5% 4.6%
0.9% 2.5% 1.0%
— — 0.8% 0.4%
0%
(1) Excludes 13 of our properties that are under development. Also, lease expiration is based on the fixed term of the lease
and does not factor in potential renewal options provided for in our leases.
(2) Represents base rent on an annualized basis but does not include tenant recoveries, additional rents and other
lease-related adjustments to revenue (i.e., straight-line rents and deferred revenues).
(3) 95% of the 2022 maturities are under a Master Lease with Prime Healthcare; Master Lease renewal options
are for all properties or none of them.
Q1 2015 | SUPPLEMENTAL INFORMATION 8
|
MEDICALPROPERTIESTRUST.COM
PORTFOLIO INFORMATION
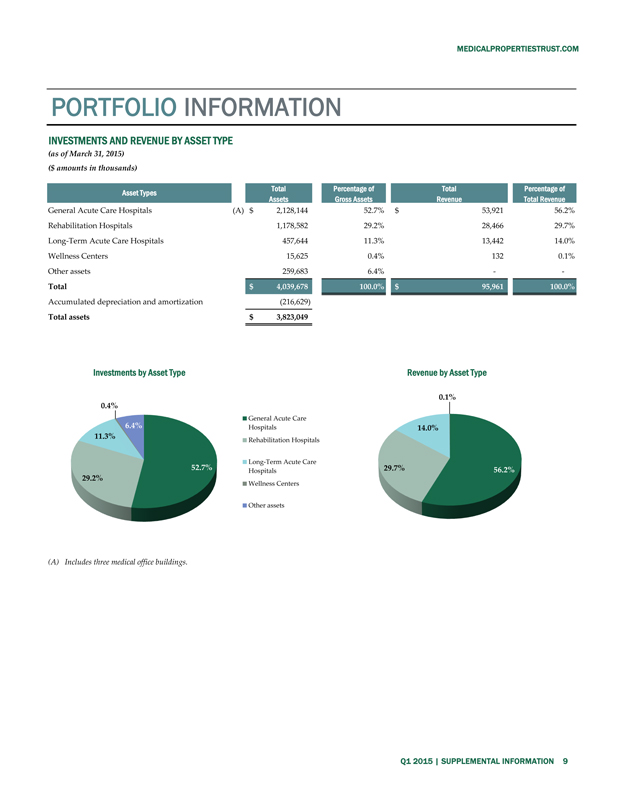
INVESTMENTS AND REVENUE BY ASSET TYPE
(as of March 31, 2015)
($ amounts in thousands)
Asset Types Total Percentage of Total Percentage of
Assets Gross Assets Revenue Total Revenue
General Acute Care Hospitals (A) $ 2,128,144 52.7% $ 53,921 56.2%
Rehabilitation Hospitals 1,178,582 29.2% 28,466 29.7%
Long-Term Acute Care Hospitals 457,644 11.3% 13,442 14.0%
Wellness Centers 15,625 0.4% 132 0.1%
Other assets 259,683 6.4% — -
Total $ 4,039,678 100.0% $ 95,961 100.0%
Accumulated depreciation and amortization (216,629)
Total assets $ 3,823,049
Investments by Asset Type Revenue by Asset Type
0.1%
0.4%
General Acute Care
6.4% Hospitals 14.0% 11.3%
Rehabilitation Hospitals
52.7% Long-Term Acute Care
Hospitals 29.7% 56.2%
29.2% Wellness Centers
Other assets
(A) Includes three medical office buildings.
Q1 2015 | SUPPLEMENTAL INFORMATION 9
|
MEDICALPROPERTIESTRUST.COM
PORTFOLIO INFORMATION
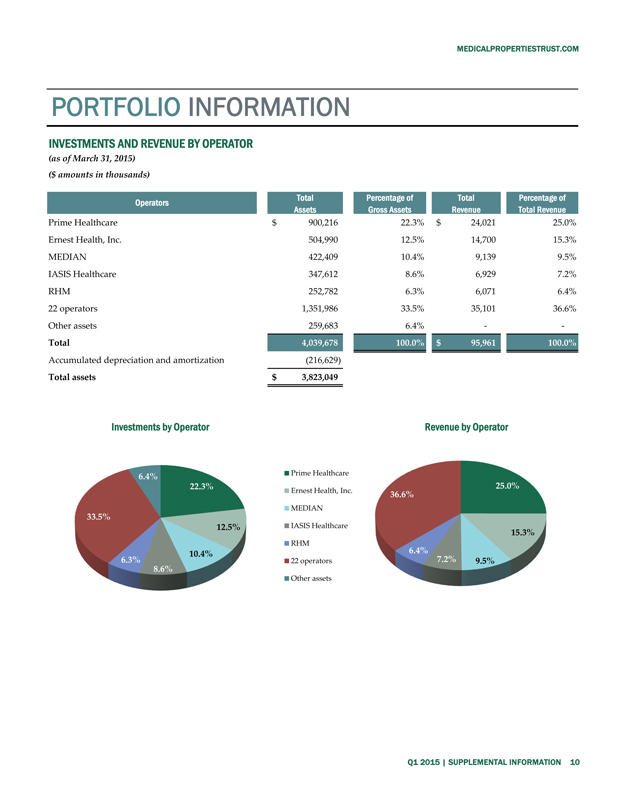
INVESTMENTS AND REVENUE BY OPERATOR
(as of March 31, 2015)
($ amounts in thousands)
Operators Total Percentage of Total Percentage of
Assets Gross Assets Revenue Total Revenue
Prime Healthcare $ 900,216 22.3% $ 24,021 25.0%
Ernest Health, Inc. 504,990 12.5% 14,700 15.3%
MEDIAN 422,409 10.4% 9,139 9.5%
IASIS Healthcare 347,612 8.6% 6,929 7.2%
RHM 252,782 6.3% 6,071 6.4%
22 operators 1,351,986 33.5% 35,101 36.6%
Other assets 259,683 6.4% — -
Total 4,039,678 100.0% $ 95,961 100.0%
Accumulated depreciation and amortization (216,629)
Total assets $ 3,823,049
Investments by Operator Revenue by Operator
Prime Healthcare
6.4%
22.3% 25.0%
Ernest Health, Inc.
36.6%
MEDIAN
33.5%
12.5% IASIS Healthcare
15.3%
RHM
6.4% 10.4%
6.3% 22 operators 7.2% 9.5%
8.6%
Other assets
Q1 2015 | SUPPLEMENTAL INFORMATION 10
MEDICALPROPERTIESTRUST.COM
PORTFOLIO INFORMATION
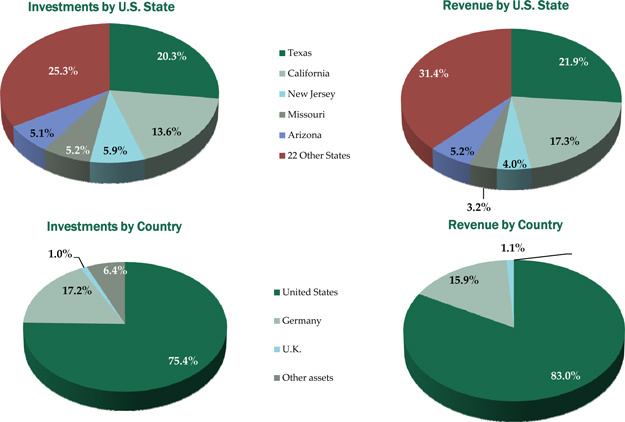
INVESTMENTS AND REVENUE BY U.S. STATE AND COUNTRY
(as of March 31, 2015)
($ amounts in thousands)
U.S. States and Other Countries | Total Assets | Percentage of Gross Assets | Total Revenue | Percentage of Total Revenue | ||||||||||||
Texas | $ | 818,980 | 20.3 | % | $ | 21,016 | 21.9 | % | ||||||||
California | 547,095 | 13.6 | % | 16,539 | 17.3 | % | ||||||||||
New Jersey | 237,388 | 5.9 | % | 3,841 | 4.0 | % | ||||||||||
Missouri | 210,921 | 5.2 | % | 3,080 | 3.2 | % | ||||||||||
Arizona | 206,391 | 5.1 | % | 5,024 | 5.2 | % | ||||||||||
22 Other States | 1,022,168 | 25.3 | % | 30,169 | 31.4 | % | ||||||||||
United States | 3,042,943 | 75.4 | % | 79,669 | 83.0 | % | ||||||||||
Germany | 695,191 | 17.2 | % | 15,210 | 15.9 | % | ||||||||||
U.K. | 41,861 | 1.0 | % | 1,082 | 1.1 | % | ||||||||||
International | 737,052 | 18.2 | % | 16,292 | 17.0 | % | ||||||||||
Other assets | 259,683 | 6.4 | % | |||||||||||||
Total | 4,039,678 | 100.0 | % | $ | 95,961 | 100.0 | % | |||||||||
Accumulated depreciation and amortization | (216,629 | ) | ||||||||||||||
Total assets | $ | 3,823,049 | ||||||||||||||
Q1 2015 | SUPPLEMENTAL INFORMATION 11
MEDICALPROPERTIESTRUST.COM
PORTFOLIO INFORMATION
ACQUISITIONS FOR THE THREE MONTHS ENDED MARCH 31, 2015
($ amounts in thousands)
Name | Location | Property Type | Acquisition / | Investment / Commitment | ||||||
Weslaco Regional Rehabilitation Hospital | Weslaco, TX | Inpatient Rehabilitation Hospital | Acquisition | $ | 15,700 | |||||
St. Joseph Medical Center | Kansas City, MO | Acute Care Hospital | Acquisition | 80,000 | ||||||
St. Mary’s Medical Center | Blue Springs, MO | Acute Care Hospital | Acquisition | 30,000 | ||||||
Total Investments / Commitments | $ | 125,700 | ||||||||
SUMMARY OF DEVELOPMENT PROJECTS AS OF MARCH 31, 2015
($ amounts in thousands)
Property | Location | Property Type | Operator | Commitment | Costs Incurred as of 3/31/2015 | Estimated Completion Date | ||||||||||||
UAB Medical West | Hoover, AL | Acute Care Hospital & MOB | Medical West, an affiliate of UAB | $ | 8,653 | $ | 5,853 | 2Q 2015 | ||||||||||
First Choice ER - Chandler | Chandler, AZ | Acute Care Hospital | Adeptus Health | 5,049 | 2,502 | 2Q 2015 | ||||||||||||
First Choice ER - Converse | Converse, TX | Acute Care Hospital | Adeptus Health | 5,754 | 4,311 | 2Q 2015 | ||||||||||||
First Choice ER - Denver 48th | Denver, CO | Acute Care Hospital | Adeptus Health | 5,123 | 1,174 | 2Q 2015 | ||||||||||||
First Choice ER - Aurora | Aurora, CO | Acute Care Hospital | Adeptus Health | 5,273 | �� | 21 | 3Q 2015 | |||||||||||
First Choice ER - Carrollton | Carrollton, TX | Acute Care Hospital | Adeptus Health | 35,820 | 23,458 | 3Q 2015 | ||||||||||||
First Choice ER - Conroe | Houston, TX | Acute Care Hospital | Adeptus Health | 6,110 | 1,668 | 3Q 2015 | ||||||||||||
First Choice ER - Gilbert | Gilbert, AZ | Acute Care Hospital | Adeptus Health | 6,500 | 2,481 | 3Q 2015 | ||||||||||||
First Choice ER - Glendale | Glendale, AZ | Acute Care Hospital | Adeptus Health | 4,824 | 564 | 3Q 2015 | ||||||||||||
First Choice ER - McKinney | McKinney, TX | Acute Care Hospital | Adeptus Health | 4,750 | 1,002 | 3Q 2015 | ||||||||||||
First Choice ER - Victory Lakes | Houston, TX | Acute Care Hospital | Adeptus Health | 4,939 | 554 | 3Q 2015 | ||||||||||||
First Choice ER - Vintage Preserve | Houston, TX | Acute Care Hospital | Adeptus Health | 45,961 | 5,678 | 3Q 2016 | ||||||||||||
First Choice Emergency Rooms | Various | Acute Care Hospital | Adeptus Health | 13,448 | — | |||||||||||||
| $ | 152,204 | $ | 49,266 | |||||||||||||||
Q1 2015 | SUPPLEMENTAL INFORMATION 12
|
MEDICALPROPERTIESTRUST.COM
FINANCIAL STATEMENTS
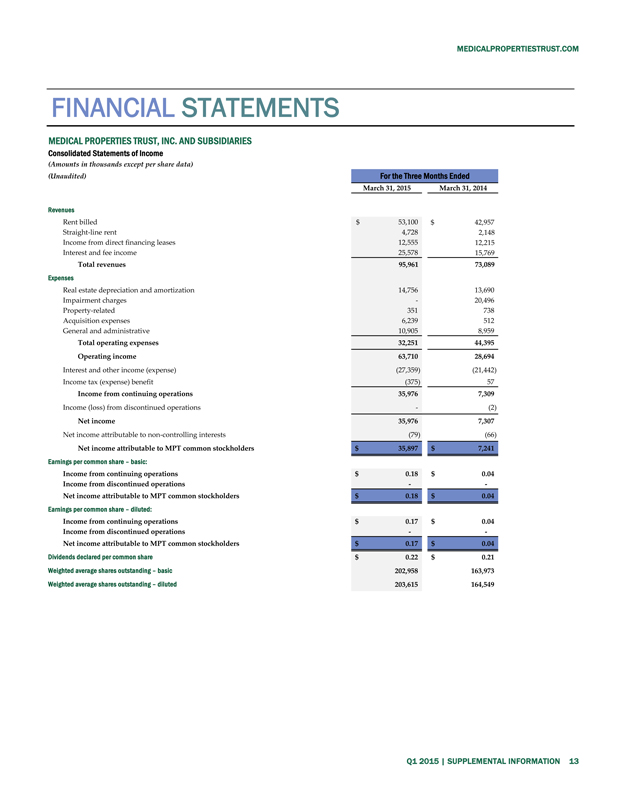
MEDICAL PROPERTIES TRUST, INC. AND SUBSIDIARIES
Consolidated Statements of Income
(Amounts in thousands except per share data)
(Unaudited)
For the Three Months Ended
March 31, 2015 March 31, 2014
Revenues
Rent billed $ 53,100 $ 42,957
Straight-line rent 4,728 2,148
Income from direct financing leases 12,555 12,215
Interest and fee income 25,578 15,769
Total revenues 95,961 73,089
Expenses
Real estate depreciation and amortization 14,756 13,690
Impairment charges — 20,496
Property-related 351 738
Acquisition expenses 6,239 512
General and administrative 10,905 8,959
Total operating expenses 32,251 44,395
Operating income 63,710 28,694
Interest and other income (expense) (27,359) (21,442)
Income tax (expense) benefit (375) 57
Income from continuing operations 35,976 7,309
Income (loss) from discontinued operations — (2)
Net income 35,976 7,307
Net income attributable to non-controlling interests (79) (66)
Net income attributable to MPT common stockholders $ 35,897 $ 7,241
Earnings per common share – basic:
Income from continuing operations $ 0.18 $ 0.04
Income from discontinued operations — -
Net income attributable to MPT common stockholders $ 0.18 $ 0.04
Earnings per common share – diluted:
Income from continuing operations $ 0.17 $ 0.04
Income from discontinued operations — -
Net income attributable to MPT common stockholders $ 0.17 $ 0.04
Dividends declared per common share $ 0.22 $ 0.21
Weighted average shares outstanding – basic 202,958 163,973
Weighted average shares outstanding – diluted 203,615 164,549
Q1 2015 | SUPPLEMENTAL INFORMATION 13
|
MEDICALPROPERTIESTRUST.COM
FINANCIAL STATEMENTS
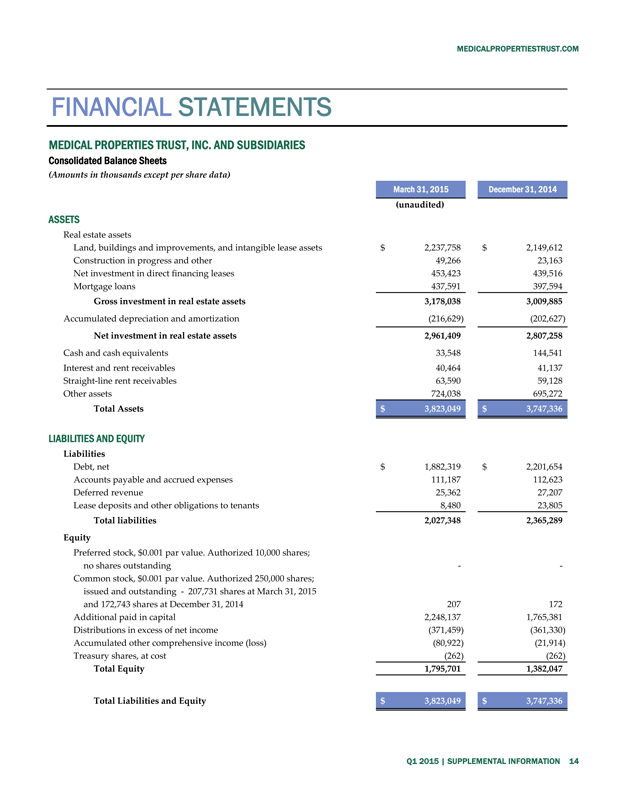
MEDICAL PROPERTIES TRUST, INC. AND SUBSIDIARIES
Consolidated Balance Sheets
(Amounts in thousands except per share data)
March 31, 2015 December 31, 2014
(unaudited)
ASSETS
Real estate assets
Land, buildings and improvements, and intangible lease assets $ 2,237,758 $ 2,149,612
Construction in progress and other 49,266 23,163
Net investment in direct financing leases 453,423 439,516
Mortgage loans 437,591 397,594
Gross investment in real estate assets 3,178,038 3,009,885
Accumulated depreciation and amortization (216,629) (202,627)
Net investment in real estate assets 2,961,409 2,807,258
Cash and cash equivalents 33,548 144,541
Interest and rent receivables 40,464 41,137
Straight-line rent receivables 63,590 59,128
Other assets 724,038 695,272
Total Assets $ 3,823,049 $ 3,747,336
LIABILITIES AND EQUITY
Liabilities
Debt, net $ 1,882,319 $ 2,201,654
Accounts payable and accrued expenses 111,187 112,623
Deferred revenue 25,362 27,207
Lease deposits and other obligations to tenants 8,480 23,805
Total liabilities 2,027,348 2,365,289
Equity
Preferred stock, $0.001 par value. Authorized 10,000 shares;
no shares outstanding — -
Common stock, $0.001 par value. Authorized 250,000 shares;
issued and outstanding—207,731 shares at March 31, 2015
and 172,743 shares at December 31, 2014 207 172
Additional paid in capital 2,248,137 1,765,381
Distributions in excess of net income (371,459) (361,330)
Accumulated other comprehensive income (loss) (80,922) (21,914)
Treasury shares, at cost (262) (262)
Total Equity 1,795,701 1,382,047
Total Liabilities and Equity $ 3,823,049 $ 3,747,336
Q1 2015 | SUPPLEMENTAL INFORMATION 14
MEDICALPROPERTIESTRUST.COM
FINANCIAL STATEMENTS
DETAIL OF OTHER ASSETS AS OF MARCH 31, 2015
($ amounts in thousands)
Operator | Investment | Annual Interest Rate | YTD Ridea Income(3) | Security / Credit Enhancements | ||||||||||
Non-Operating Loans | ||||||||||||||
Vibra Healthcare acquisition loan(1) | $ | 9,746 | 10.25 | % | Secured and cross-defaulted with real estate, other agreements and guaranteed by Parent | |||||||||
Vibra Healthcare working capital | 5,234 | 9.50 | % | Secured and cross-defaulted with real estate, other agreements and guaranteed by Parent | ||||||||||
Post Acute Medical working capital | 5,619 | 11.36 | % | Secured and cross-defaulted with real estate; certain loans are cross-defaulted with other loans and real estate | ||||||||||
Alecto working capital | 16,680 | 11.12 | % | Secured and cross-defaulted with real estate and guaranteed by Parent | ||||||||||
IKJG/HUMC working capital | 11,037 | 10.40 | % | Secured and cross-defaulted with real estate and guaranteed by Parent | ||||||||||
Ernest Health | 9,250 | 9.26 | % | Secured and cross-defaulted with real estate and guaranteed by Parent | ||||||||||
Other | 5,432 | |||||||||||||
| 62,998 | ||||||||||||||
Operating Loans | ||||||||||||||
Ernest Health, Inc.(2) | 93,200 | 15.00 | % | $ | 3,724 | Secured and cross-defaulted with real estate and guaranteed by Parent | ||||||||
IKJG/HUMC convertible loan | 3,352 | 54 | Secured and cross-defaulted with real estate and guaranteed by Parent | |||||||||||
| 96,552 | 3,778 | |||||||||||||
MEDIAN investments(4) | 471,400 | |||||||||||||
Equity investments | 14,831 | 103 | ||||||||||||
Deferred debt financing costs | 33,383 | Not applicable | ||||||||||||
Lease and cash collateral | 3,313 | Not applicable | ||||||||||||
Other assets(5) | 41,561 | Not applicable | ||||||||||||
Total | $ | 724,038 | $ | 3,881 | ||||||||||
| (1) | Original amortizing acquisition loan was $41 million; loan matures in 2019. |
| (2) | Cash rate is 10% effective March 1, 2014. |
| (3) | Income earned on operating loans is reflected in the interest income line of the income statement. |
| (4) | Includes loans and equity investment. |
| (5) | Includes prepaid expenses, office property and equipment and other. |
Q1 2015 | SUPPLEMENTAL INFORMATION 15
|

1000 Urban Center Drive, Suite 501 Birmingham, AL 35242 (205) 969-3755 NYSE: MPW www.medicalpropertiestrust.com
Contact:
Charles Lambert, Managing Director—Capital Markets
(205) 397-8897 or clambert@medicalpropertiestrust.com or Tim Berryman, Director—Investor Relations
(205) 397-8589 or tberryman@medicalpropertiestrust.com