Exhibit 99.2
Exhibit 99.2
SECOND QUARTER 2015
Supplemental Information
MEDICALPROPERTIESTRUST.COM
TABLE OF CONTENTS
COMPANY OVERVIEW
Company Information 3
FINANCIAL INFORMATION
Reconciliation of Net Income to Funds from Operations 5Debt Summary 6Debt Maturity Schedule 7
PORTFOLIO INFORMATION
Lease Maturity Schedule 8Investments and Revenue by Asset Type, Operator, State and Country 9
EBITDAR to Rent Coverage 12Acquisitions and Summary of Development Projects 13
FINANCIAL STATEMENTS
Consolidated Statements of Income 14Consolidated Balance Sheets 15Detail of Other Assets 16 FORWARD-LOOKING STATEMENT Forward-looking statements involve known and unknown risks, uncertainties and other factors that may cause the actual results of the Company or future events to differ materially from those expressed in or underlying such forward-looking statements, including without limitation: the satisfaction of all conditions to, and the timely closing (if at all) of the Median sale-leaseback transactions; the Company financing of the transactions described herein; the capacity of Median and the Company’s other tenants to meet the terms of their agreements; Normalized FFO per share; expected payout ratio, the amount of acquisitions of healthcare real estate, if any; capital markets conditions, the repayment of debt arrangements; statements concerning the additional income to the Company as a result of ownership interests in certain hospital operations and the timing of such income; the payment of future dividends, if any; completion of additional debt arrangement, and additional investments; national and international economic, business, real estate and other market conditions; the competitive environment in which the Company operates; the execution of the Company’s business plan; financing risks; the Company’s ability to maintain its status as a REIT for federal income tax purposes; acquisition and development risks; potential environmental and other liabilities; and other factors affecting the real estate industry generally or healthcare real estate in particular. For further discussion of the factors that could affect outcomes, please refer to the “Risk factors” section of the Company’s Annual Report on Form 10-K for the year ended December 31, 2014, and as updated by the Company’s subsequently filed Quarterly Reports on Form 10-Q and other SEC filings. Except as otherwise required by the federal securities laws, the Company undertakes no obligation to update the information in this report.
On the Cover: Saint Joseph Medical Center—Kansas City, Missouri. Acquired in 2015.
Q2 2015 | SUPPLEMENTAL INFORMATION 2
MEDICALPROPERTIESTRUST.COM OFFICERS
Edward K. Aldag, Jr. Chairman, President and Chief Executive Officer
R. Steven Hamner Executive Vice President and Chief Financial Officer
Emmett E. McLean Executive Vice President, Chief Operating Officer, Treasurer and Secretary
Frank R. Williams, Jr. Senior Vice President, Senior Managing Director—Acquisitions
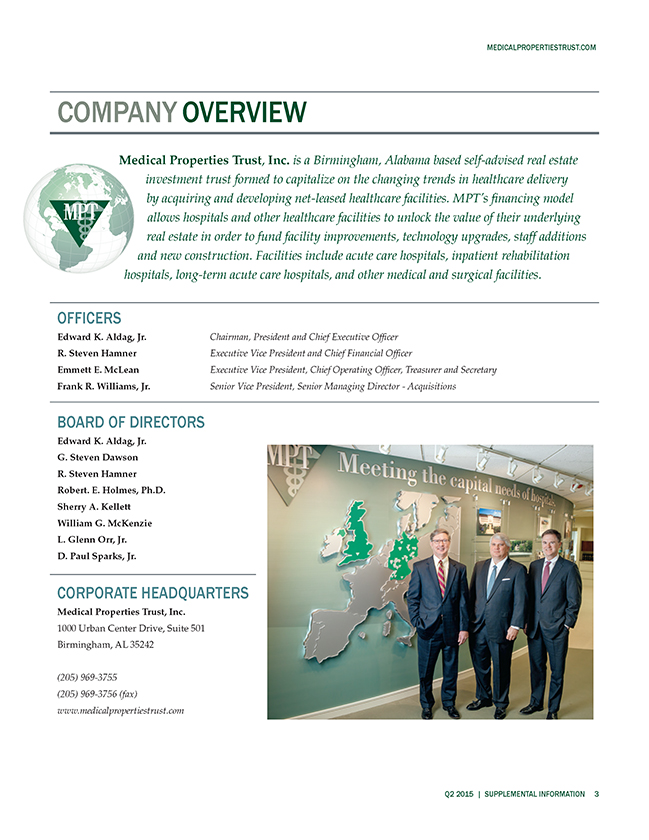
Medical Properties Trust, Inc. is a Birmingham, Alabama based self-advised real estate
investment trust formed to capitalize on the changing trends in healthcare delivery
by acquiring and developing net-leased healthcare facilities. MPT’s financing model
allows hospitals and other healthcare facilities to unlock the value of their underlying
real estate in order to fund facility improvements, technology upgrades, staff additions
and new construction. Facilities include acute care hospitals, inpatient rehabilitation
hospitals, long-term acute care hospitals, and other medical and surgical facilities.
COMPANY OVERVIEW CORPORATE HEADQUARTERS
Medical Properties Trust, Inc.
1000 Urban Center Drive, Suite 501
Birmingham, AL 35242
(205) 969-3755
(205) 969-3756 (fax)
www.medicalpropertiestrust.com
BOARD OF DIRECTORS
Edward K. Aldag, Jr.
G. Steven Dawson
R. Steven Hamner
Robert. E. Holmes, Ph.D.
Sherry A. Kellett
William G. McKenzie
L. Glenn Orr, Jr.
D. Paul Sparks, Jr.
Q2 2015 | SUPPLEMENTAL INFORMATION 3
INVESTOR RELATIONS
COMPANY OVERVIEW (continued)
Tim Berryman | Director—Investor Relations
(205) 397-8589
tberryman@medicalpropertiestrust.com
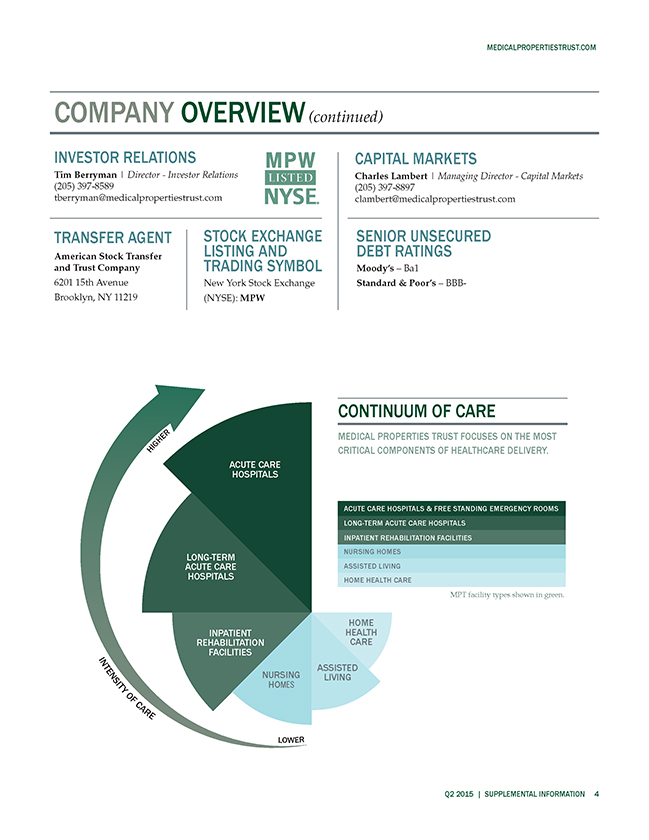
MEDICAL PROPERTIES TRUST FOCUSES ON THE MOST
CRITICAL COMPONENTS OF HEALTHCARE DELIVERY.
CONTINUUM OF CARE
ACUTE CARE HOSPITALS & FREE STANDING EMERGENCY ROOMS
LONG-TERM ACUTE CARE HOSPITALS
INPATIENT REHABILITATION FACILITIES
NURSING HOMES
ASSISTED LIVING
HOME HEALTH CARE
MPT facility types shown in green.
INTENSITY OF CARE
HIGHER
LOWER
ACUTE CARE
HOSPITALS
LONG-TERM
ACUTE CARE
HOSPITALS
INPATIENT
REHABILITATION
FACILITIES
NURSING
HOMES
ASSISTED
LIVING
HOME
HEALTH
CARE
CAPITAL MARKETS
Charles Lambert | Managing Director—Capital Markets
(205) 397-8897
clambert@medicalpropertiestrust.com
TRANSFER AGENT
American Stock Transfer
and Trust Company
6201 15th Avenue
Brooklyn, NY 11219
STOCK EXCHANGE
LISTING AND
TRADING SYMBOL
New York Stock Exchange (NYSE): MPW
SENIOR UNSECURED
DEBT RATINGS
Moody’s – Ba1
Standard & Poor’s – BBBMEDICALPROPERTIESTRUST.
COM
Q2 2015 | SUPPLEMENTAL INFORMATION 4
MEDICALPROPERTIESTRUST.COM
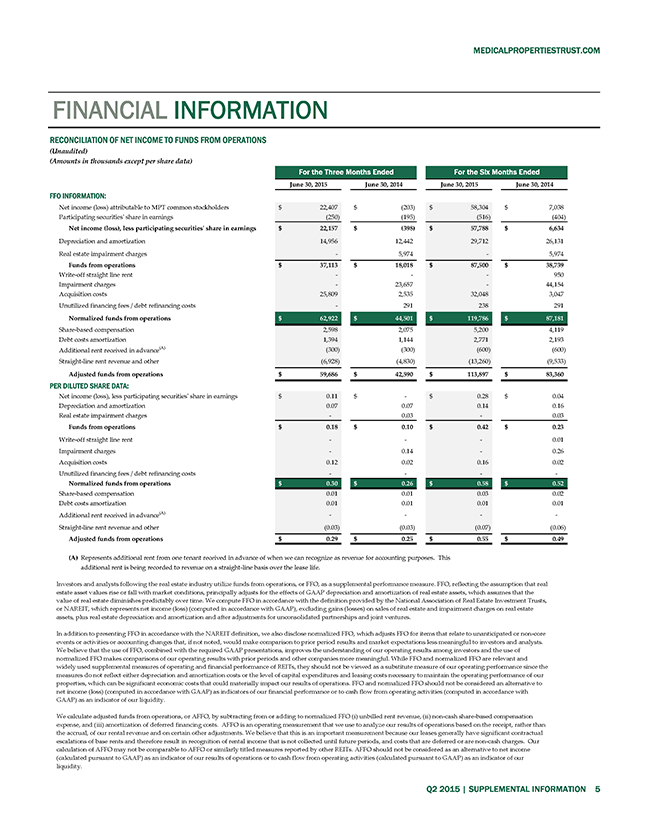
FINANCIAL INFORMATION RECONCILIATION OF NET INCOME TO FUNDS FROM OPERATIONS
(Unaudited)
(Amounts in thousands except per share data) For the Three Months Ended For the Six Months Ended
June 30, 2015 June 30, 2014 June 30, 2015 June 30, 2014
FFO INFORMATION:
Net income (loss) attributable to MPT common stockholders $ 22,407 $ (203) $ 58,304 $ 7,038
Participating securities’ share in earnings (250) (195) (516) (404)
Net income (loss), less participating securities’ share in earnings $ 22,157 $ (398) $ 57,788 $ 6,634
Depreciation and amortization 14,956 12,442 29,712 26,131
Real estate impairment charges—5,974—5,974
Funds from operations $ 37,113 $ 18,018 $ 87,500 $ 38,739
Write-off straight line rent ——950
Impairment charges—23,657—44,154
Acquisition costs 25,809 2,535 32,048 3,047
Unutilized financing fees / debt refinancing costs—291 238 291
Normalized funds from operations $ 62,922 $ 44,501 $ 119,786 $ 87,181
Share-based compensation 2,598 2,075 5,200 4,119
Debt costs amortization 1,394 1,144 2,771 2,193
Additional rent received in advance(A) (300) (300) (600) (600)
Straight-line rent revenue and other (6,928) (4,830) (13,260) (9,533)
Adjusted funds from operations $ 59,686 $ 42,590 $ 113,897 $ 83,360
PER DILUTED SHARE DATA:
Net income (loss), less participating securities’ share in earnings $ 0.11 $—$ 0.28 $ 0.04
Depreciation and amortization 0.07 0.07 0.14 0.16
Real estate impairment charges—0.03—0.03
Funds from operations $ 0.18 $ 0.10 $ 0.42 $ 0.23
Write-off straight line rent ——0.01
Impairment charges—0.14—0.26
Acquisition costs 0.12 0.02 0.16 0.02
Unutilized financing fees / debt refinancing costs — —
Normalized funds from operations $ 0.30 $ 0.26 $ 0.58 $ 0.52
Share-based compensation 0.01 0.01 0.03 0.02
Debt costs amortization 0.01 0.01 0.01 0.01
Additional rent received in advance(A) — —
Straight-line rent revenue and other (0.03) (0.03) (0.07) (0.06)
Adjusted funds from operations $ 0.29 $ 0.25 $ 0.55 $ 0.49 (A) Represents additional rent from one tenant received in advance of when we can recognize as revenue for accounting purposes. This additional rent is being recorded to revenue on a straight-line basis over the lease life. Investors and analysts following the real estate industry utilize funds from operations, or FFO, as a supplemental performance measure. FFO, reflecting the assumption that real estate asset values rise or fall with market conditions, principally adjusts for the effects of GAAP depreciation and amortization of real estate assets, which assumes that the value of real estate diminishes predictably over time. We compute FFO in accordance with the definition provided by the National Association of Real Estate Investment Trusts, or NAREIT, which represents net income (loss) (computed in accordance with GAAP), excluding gains (losses) on sales of real estate and impairment charges on real estate assets, plus real estate depreciation and amortization and after adjustments for unconsolidated partnerships and joint ventures. In addition to presenting FFO in accordance with the NAREIT definition, we also disclose normalized FFO, which adjusts FFO for items that relate to unanticipated or non-core events or activities or accounting changes that, if not noted, would make comparison to prior period results and market expectations less meaningful to investors and analysts. We believe that the use of FFO, combined with the required GAAP presentations, improves the understanding of our operating results among investors and the use of normalized FFO makes comparisons of our operating results with prior periods and other companies more meaningful. While FFO and normalized FFO are relevant and widely used supplemental measures of operating and financial performance of REITs, they should not be viewed as a substitute measure of our operating performance since the measures do not reflect either depreciation and amortization costs or the level of capital expenditures and leasing costs necessary to maintain the operating performance of our properties, which can be significant economic costs that could materially impact our results of operations. FFO and normalized FFO should not be considered an alternative to net income (loss) (computed in accordance with GAAP) as indicators of our financial performance or to cash flow from operating activities (computed in accordance with GAAP) as an indicator of our liquidity. We calculate adjusted funds from operations, or AFFO, by subtracting from or adding to normalized FFO (i) unbilled rent revenue, (ii) non-cash share-based compensation expense, and (iii) amortization of deferred financing costs. AFFO is an operating measurement that we use to analyze our results of operations based on the receipt, rather than the accrual, of our rental revenue and on certain other adjustments. We believe that this is an important measurement because our leases generally have significant contractual escalations of base rents and therefore result in recognition of rental income that is not collected until future periods, and costs that are deferred or are non-cash charges. Our calculation of AFFO may not be comparable to AFFO or similarly titled measures reported by other REITs. AFFO should not be considered as an alternative to net income (calculated pursuant to GAAP) as an indicator of our results of operations or to cash flow from operating activities (calculated pursuant to GAAP) as an indicator of our liquidity. Q2 2015 | SUPPLEMENTAL INFORMATION 5
MEDICALPROPERTIESTRUST.COM
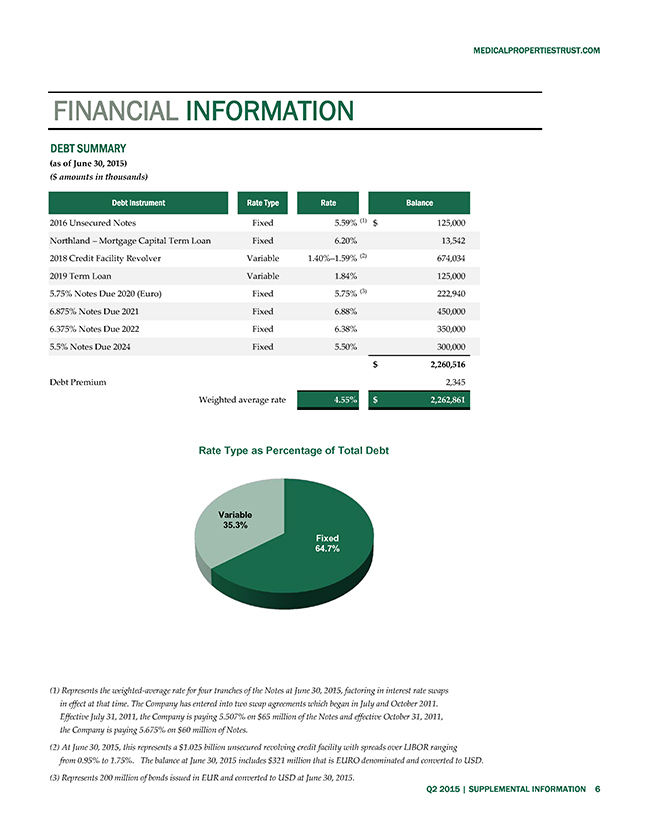
FINANCIAL INFORMATION DEBT SUMMARY
(as of June 30, 2015)
($ amounts in thousands) Debt Instrument Rate Type Rate Balance
2016 Unsecured Notes Fixed 5.59% (1) $ 125,000
Northland – Mortgage Capital Term Loan Fixed 6.20% 13,542
2018 Credit Facility Revolver Variable 1.40%–1.59% (2) 674,034
2019 Term Loan Variable 1.84% 125,000
5.75% Notes Due 2020 (Euro) Fixed 5.75% (3) 222,940
6.875% Notes Due 2021 Fixed 6.88% 450,000
6.375% Notes Due 2022 Fixed 6.38% 350,000
5.5% Notes Due 2024 Fixed 5.50% 300,000
$ 2,260,516
Debt Premium 2,345
Weighted average rate 4.55% $ 2,262,861 Rate Type as Percentage of Total Debt
Variable
35.3%
Fixed
64.7%
(1) Represents the weighted-average rate for four tranches of the Notes at June 30, 2015, factoring in interest rate swaps in effect at that time. The Company has entered into two swap agreements which began in July and October 2011. Effective July 31, 2011, the Company is paying 5.507% on $65 million of the Notes and effective October 31, 2011, the Company is paying 5.675% on $60 million of Notes. (2) At June 30, 2015, this represents a $1.025 billion unsecured revolving credit facility with spreads over LIBOR ranging from 0.95% to 1.75%. The balance at June 30, 2015 includes $321 million that is EURO denominated and converted to USD. (3) Represents 200 million of bonds issued in EUR and converted to USD at June 30, 2015. Q2 2015 | SUPPLEMENTAL INFORMATION 6
MEDICALPROPERTIESTRUST.COM
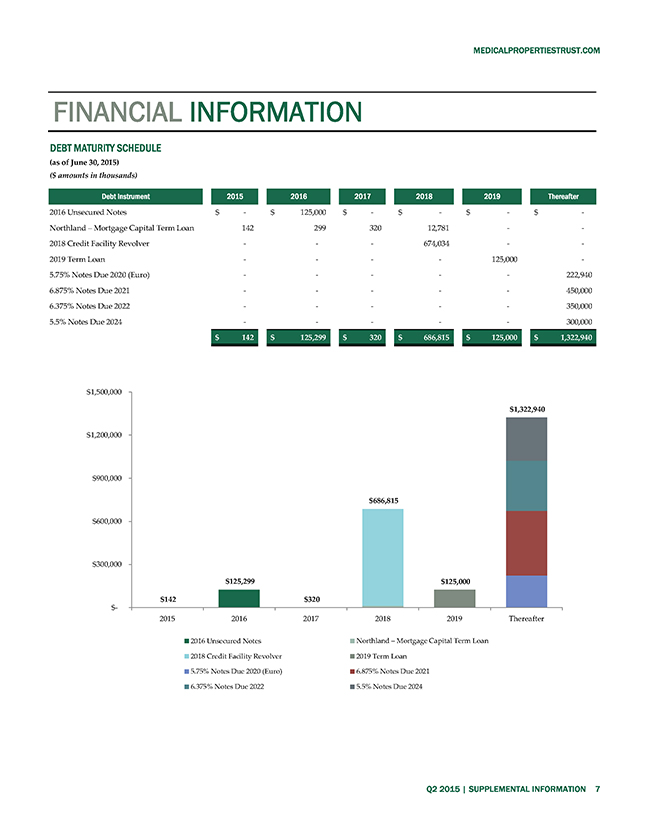
FINANCIAL INFORMATION DEBT MATURITY SCHEDULE
(as of June 30, 2015)
($ amounts in thousands) Debt Instrument 2015 2016 2017 2018 2019 Thereafter
2016 Unsecured Notes $—$ 125,000 $—$—$—$—
Northland – Mortgage Capital Term Loan 142 299 320 12,781 —
2018 Credit Facility Revolver ——674,034 —
2019 Term Loan — — 125,000—
5.75% Notes Due 2020 (Euro) — ——222,940
6.875% Notes Due 2021 — ——450,000
6.375% Notes Due 2022 — ——350,000
5.5% Notes Due 2024 — ——300,000
$ 142 $ 125,299 $ 320 $ 686,815 $ 125,000 $ 1,322,940 $1,500,000 $1,322,940
$1,200,000
$900,000 $686,815 $600,000
$300,000 $125,299 $125,000
$? $142 $320
2015 2016 2017 2018 2019 Thereafter
2016 Unsecured Notes Northland – Mortgage Capital Term Loan 2018 Credit Facility Revolver 2019 Term Loan
5.75% Notes Due 2020 (Euro) 6.875% Notes Due 2021
6.375% Notes Due 2022 5.5% Notes Due 2024
Q2 2015 | SUPPLEMENTAL INFORMATION 7
MEDICALPROPERTIESTRUST.COM
PORTFOLIO INFORMATION
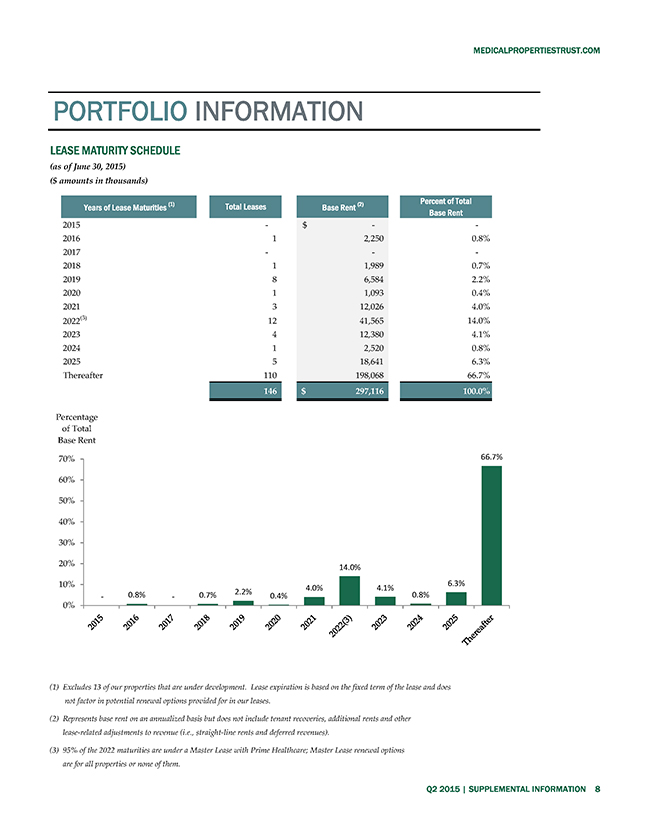
LEASE MATURITY SCHEDULE
(as of June 30, 2015)
($ amounts in thousands) Years of Lease Maturities (1) Total Leases Base Rent (2) Percent of Total Base Rent
2015—$ —
2016 1 2,250 0.8%
2017 ——
2018 1 1,989 0.7%
2019 8 6,584 2.2%
2020 1 1,093 0.4%
2021 3 12,026 4.0%
2022(3) 12 41,565 14.0%
2023 4 12,380 4.1%
2024 1 2,520 0.8%
2025 5 18,641 6.3%
Thereafter 110 198,068 66.7%
146 $ 297,116 100.0% Percentage of Total Base Rent
70% 66.7%
60% 50% 40% 30%
20% 14.0%
10% 6.3%
2.2% 4.0% 4.1%
? 0.8% ? 0.7% 0.4% 0.8%
0%
(1) Excludes 13 of our properties that are under development. Lease expiration is based on the fixed term of the lease and does not factor in potential renewal options provided for in our leases.
(2) Represents base rent on an annualized basis but does not include tenant recoveries, additional rents and other lease-related adjustments to revenue (i.e., straight-line rents and deferred revenues).
(3) 95% of the 2022 maturities are under a Master Lease with Prime Healthcare; Master Lease renewal options are for all properties or none of them.
Q2 2015 | SUPPLEMENTAL INFORMATION 8
MEDICALPROPERTIESTRUST.COM
PORTFOLIO INFORMATION
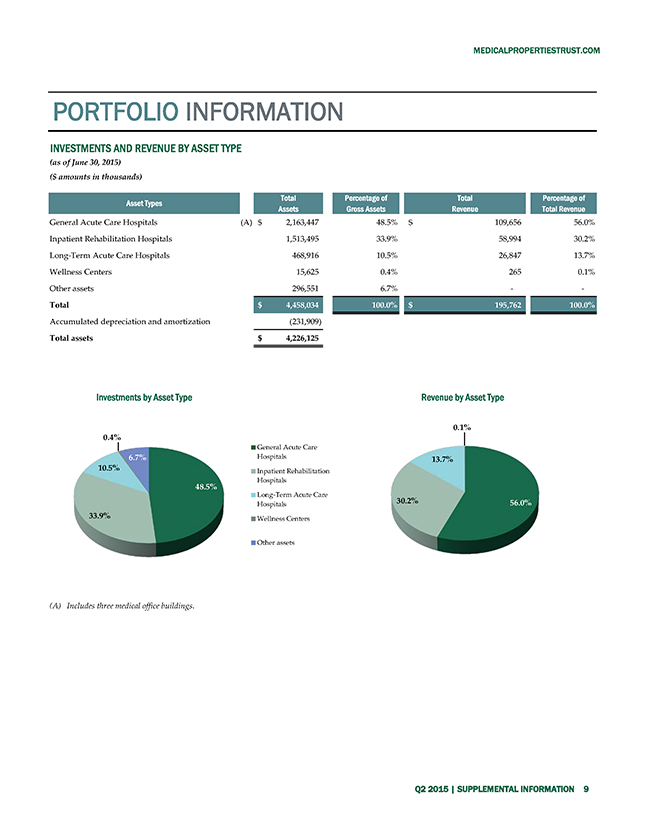
INVESTMENTS AND REVENUE BY ASSET TYPE
(as of June 30, 2015)
($ amounts in thousands)
Asset Types Total Assets Percentage of Gross Assets Total Revenue Percentage of Total Revenue
General Acute Care Hospitals (A) $ 2,163,447 48.5% $ 109,656 56.0%
Inpatient Rehabilitation Hospitals 1,513,495 33.9% 58,994 30.2%
Long-Term Acute Care Hospitals 468,916 10.5% 26,847 13.7%
Wellness Centers 15,625 0.4% 265 0.1%
Other assets 296,551 6.7% —
Total $ 4,458,034 100.0% $ 195,762 100.0%
Accumulated depreciation and amortization (231,909)
Total assets $ 4,226,125 Investments by Asset Type Revenue by Asset Type
0.1% 0.4% 6.7% General Acute Care Hospitals 13.7%
10.5% Inpatient Rehabilitation Hospitals
48.5%
Long?Term Acute Care
Hospitals 30.2% 56.0%
33.9% Wellness Centers Other assets
(A) Includes three medical office buildings. Q2 2015 | SUPPLEMENTAL INFORMATION 9
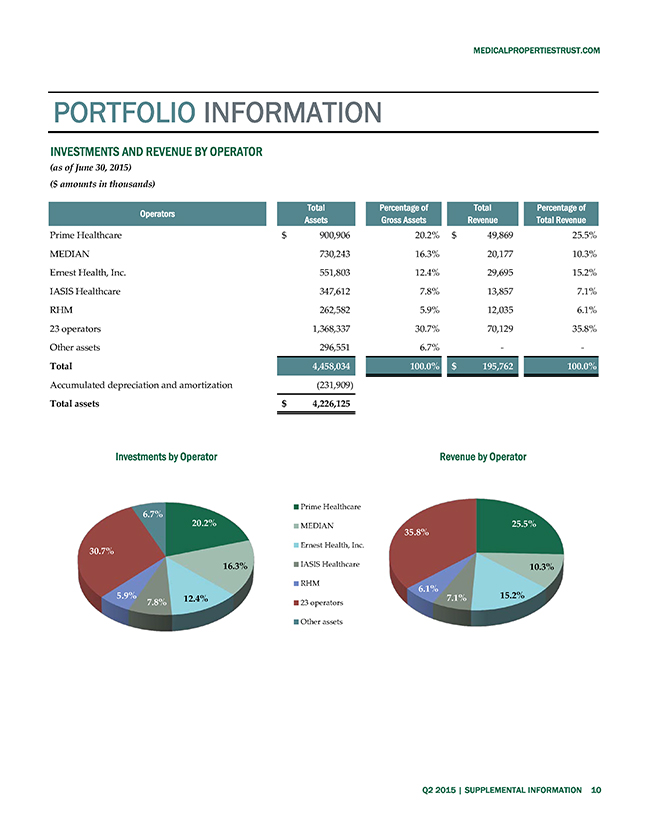
MEDICALPROPERTIESTRUST.COM PORTFOLIO INFORMATION INVESTMENTS AND REVENUE BY OPERATOR
(as of June 30, 2015)
($ amounts in thousands)
Operators Total Assets Percentage of Gross Assets Total Revenue Percentage of Total Revenue
Prime Healthcare $ 900,906 20.2% $ 49,869 25.5%
MEDIAN 730,243 16.3% 20,177 10.3%
Ernest Health, Inc. 551,803 12.4% 29,695 15.2%
IASIS Healthcare 347,612 7.8% 13,857 7.1%
RHM 262,582 5.9% 12,035 6.1%
23 operators 1,368,337 30.7% 70,129 35.8%
Other assets 296,551 6.7% —
Total 4,458,034 100.0% $ 195,762 100.0%
Accumulated depreciation and amortization (231,909)
Total assets $ 4,226,125 Investments by Operator Revenue by Operator
6.7% Prime Healthcare
20.2% 25.5%
MEDIAN 35.8% 30.7% Ernest Health, Inc.
16.3% IASIS Healthcare 10.3% RHM
6.1%
5.9% 12.4% 23 operators 7.1% 15.2%
7.8%
Other assets
Q2 2015 | SUPPLEMENTAL INFORMATION 10
MEDICALPROPERTIESTRUST.COM
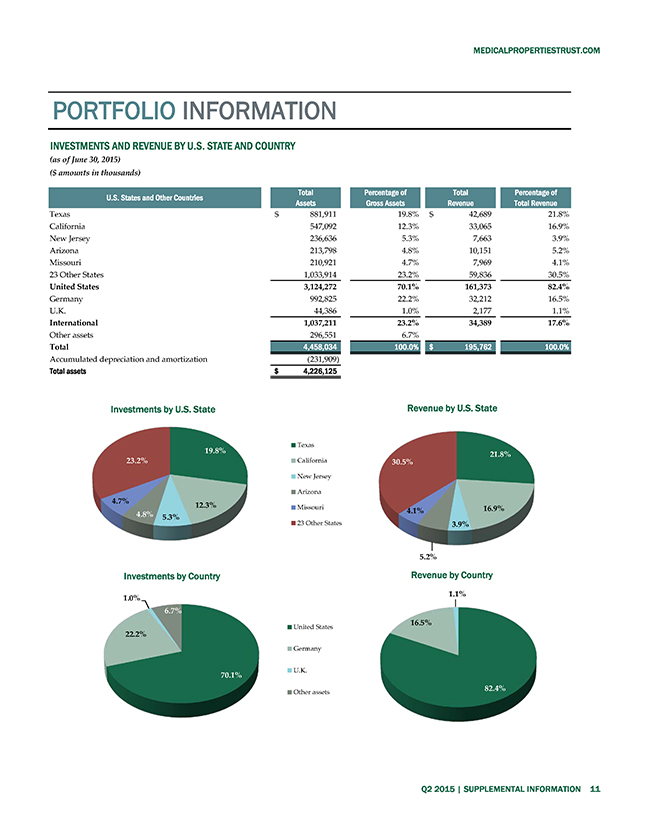
PORTFOLIO INFORMATION INVESTMENTS AND REVENUE BY U.S. STATE AND COUNTRY
(as of June 30, 2015)
($ amounts in thousands) U.S. States and Other Countries Total Assets Percentage of Gross Assets Total Revenue Percentage of Total Revenue
Texas $ 881,911 19.8% $ 42,689 21.8% California 547,092 12.3% 33,065 16.9% New Jersey 236,636 5.3% 7,663 3.9% Arizona 213,798 4.8% 10,151 5.2% Missouri 210,921 4.7% 7,969 4.1%
23 Other States 1,033,914 23.2% 59,836 30.5%
United States 3,124,272 70.1% 161,373 82.4%
Germany 992,825 22.2% 32,212 16.5% U.K. 44,386 1.0% 2,177 1.1%
International 1,037,211 23.2% 34,389 17.6%
Other assets 296,551 6.7%
Total 4,458,034 100.0% $ 195,762 100.0%
Accumulated depreciation and amortization (231,909)
Total assets $ 4,226,125
Investments by U.S. State Revenue by U.S. State
19.8% Texas
21.8% 23.2% California 30.5%
New Jersey Arizona
4.7% Missouri
12.3% 16.9%
4.8% 4.1%
5.3% 23 Other States
3.9%
5.2%
Investments by Country Revenue by Country
1.1% 0.0%
1.0%
6.7% 16.5%
United States
22.2%
Germany
U.K.
70.1%
Other assets 82.4%
Q2 2015 | SUPPLEMENTAL INFORMATION 11
MEDICALPROPERTIESTRUST.COM
PORTFOLIO INFORMATION
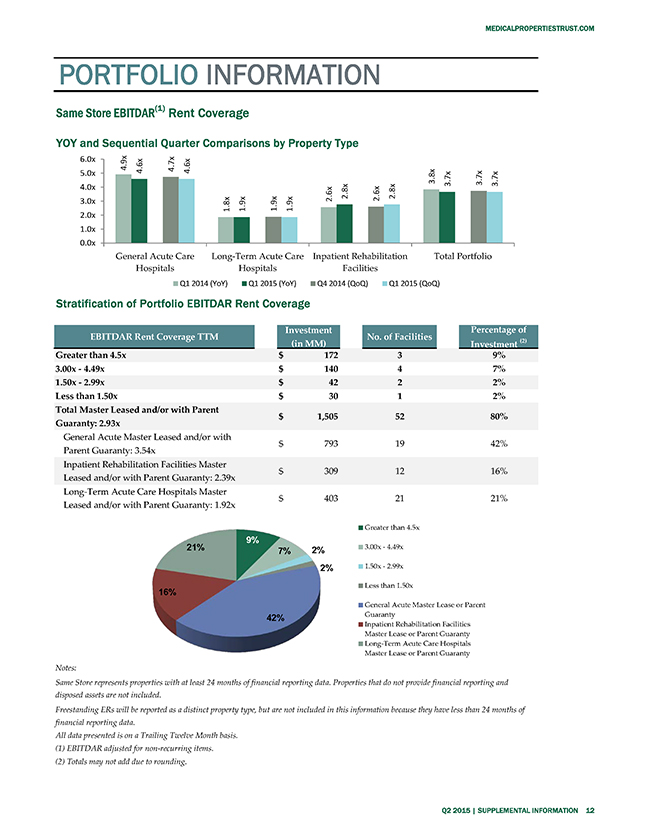
Same Store EBITDAR(1) Rent Coverage
YOY and Sequential Quarter Comparisons by Property Type
6.0x 4.9x 4.7x 5.0x 4.6x 4.6x
3.8x 3.7x 3.7x 3.7x 4.0x 2.8x 2.8x 3.0x 2.6x 2.6x 1.8x 1.9x 1.9x 1.9x 2.0x 1.0x 0.0x
General Acute Care Long?Term Acute Care Inpatient Rehabilitation Total Portfolio Hospitals Hospitals Facilities
Q1 2014 (YoY) Q1 2015 (YoY) Q4 2014 (QoQ) Q1 2015 (QoQ)
Stratification of Portfolio EBITDAR Rent Coverage
EBITDAR Rent Coverage TTM Investment (in MM) No. of Facilities Percentage of Investment (2)
Greater than 4.5x $ 172 3 9%
3.00x—4.49x $ 140 4 7%
1.50x—2.99x $ 42 2 2%
Less than 1.50x $ 30 1 2%
Total Master Leased and/or with Parent Guaranty: 2.93x $ 1,505 52 80%
General Acute Master Leased and/or with Parent Guaranty: 3.54x $ 793 19 42%
Inpatient Rehabilitation Facilities Master Leased and/or with Parent Guaranty: 2.39x $ 309 12 16%
Long-Term Acute Care Hospitals Master Leased and/or with Parent Guaranty: 1.92x $ 403 21 21%
Greater than 4.5x
9% 3.00x ? 4.49x
21% 7% 2%
2% 1.50x ? 2.99x Less than 1.50x
16%
General Acute Master Lease or Parent 42% Guaranty Inpatient Rehabilitation Facilities Master Lease or Parent Guaranty Long?Term Acute Care Hospitals Master Lease or Parent Guaranty Notes:
Same Store represents properties with at least 24 months of financial reporting data. Properties that do not provide financial reporting and disposed assets are not included.
Freestanding ERs will be reported as a distinct property type, but are not included in this information because they have less than 24 months of financial reporting data.
All data presented is on a Trailing Twelve Month basis.
(1) | | EBITDAR adjusted for non-recurring items. |
(2) | | Totals may not add due to rounding. Q2 2015 | SUPPLEMENTAL INFORMATION 12 |
MEDICALPROPERTIESTRUST.COM
PORTFOLIO INFORMATION
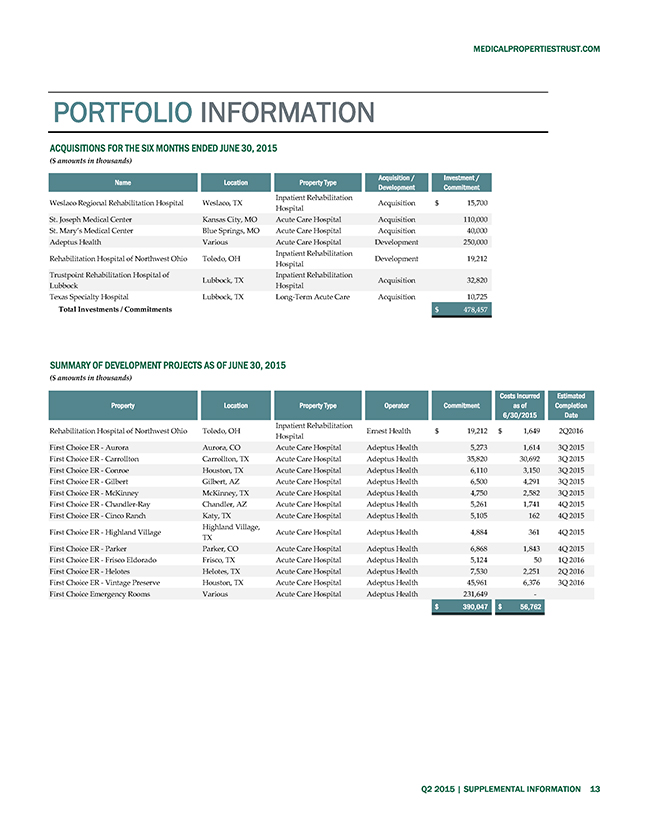
ACQUISITIONS FOR THE SIX MONTHS ENDED JUNE 30, 2015
($ amounts in thousands)
Name Location Property Type Acquisition / Development Investment / Commitment
Weslaco Regional Rehabilitation Hospital Weslaco, TX Inpatient Rehabilitation Hospital Acquisition $ 15,700
St. Joseph Medical Center Kansas City, MO Acute Care Hospital Acquisition 110,000
St. Mary’s Medical Center Blue Springs, MO Acute Care Hospital Acquisition 40,000
Adeptus Health Various Acute Care Hospital Development 250,000
Rehabilitation Hospital of Northwest Ohio Toledo, OH Inpatient Rehabilitation Hospital Development 19,212
Trustpoint Rehabilitation Hospital of Lubbock Lubbock, TX Inpatient Rehabilitation Hospital Acquisition 32,820
Texas Specialty Hospital Lubbock, TX Long-Term Acute Care Acquisition 10,725
Total Investments / Commitments $ 478,457
SUMMARY OF DEVELOPMENT PROJECTS AS OF JUNE 30, 2015
($ amounts in thousands)
Property Location Property Type Operator Commitment Costs Incurred as of 6/30/2015 Estimated Completion Date
Rehabilitation Hospital of Northwest Ohio Toledo, OH Inpatient Rehabilitation Hospital Ernest Health $ 19,212 $ 1,649 2Q2016
First Choice ER—Aurora Aurora, CO Acute Care Hospital Adeptus Health 5,273 1,614 3Q 2015
First Choice ER—Carrollton Carrollton, TX Acute Care Hospital Adeptus Health 35,820 30,692 3Q 2015
First Choice ER—Conroe Houston, TX Acute Care Hospital Adeptus Health 6,110 3,150 3Q 2015
First Choice ER—Gilbert Gilbert, AZ Acute Care Hospital Adeptus Health 6,500 4,291 3Q 2015
First Choice ER—McKinney McKinney, TX Acute Care Hospital Adeptus Health 4,750 2,582 3Q 2015
First Choice ER—Chandler-Ray Chandler, AZ Acute Care Hospital Adeptus Health 5,261 1,741 4Q 2015
First Choice ER—Cinco Ranch Katy, TX Acute Care Hospital Adeptus Health 5,105 162 4Q 2015
First Choice ER—Highland Village Highland Village, TX Acute Care Hospital Adeptus Health 4,884 361 4Q 2015
First Choice ER—Parker Parker, CO Acute Care Hospital Adeptus Health 6,868 1,843 4Q 2015
First Choice ER—Frisco Eldorado Frisco, TX Acute Care Hospital Adeptus Health 5,124 50 1Q 2016
First Choice ER—Helotes Helotes, TX Acute Care Hospital Adeptus Health 7,530 2,251 2Q 2016
First Choice ER—Vintage Preserve Houston, TX Acute Care Hospital Adeptus Health 45,961 6,376 3Q 2016
First Choice Emergency Rooms Various Acute Care Hospital Adeptus Health 231,649—$ 390,047 $ 56,762 Q2 2015 | SUPPLEMENTAL INFORMATION 13
MEDICALPROPERTIESTRUST.COM
FINANCIAL STATEMENTS
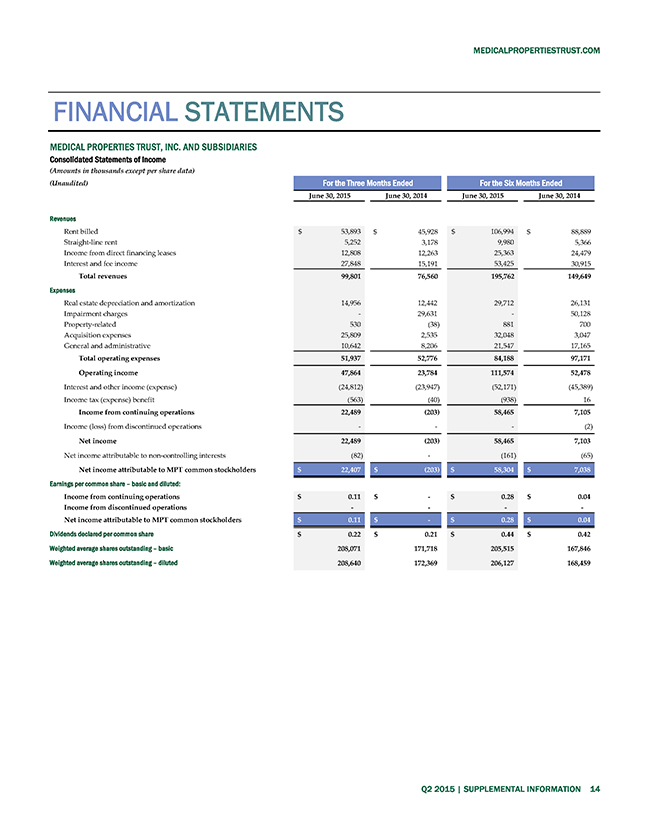
MEDICAL PROPERTIES TRUST, INC. AND SUBSIDIARIES
Consolidated Statements of Income
(Amounts in thousands except per share data)
(Unaudited) For the Three Months Ended For the Six Months Ended
June 30, 2015 June 30, 2014 June 30, 2015 June 30, 2014
Revenues
Rent billed $ 53,893 $ 45,928 $ 106,994 $ 88,889
Straight-line rent 5,252 3,178 9,980 5,366
Income from direct financing leases 12,808 12,263 25,363 24,479
Interest and fee income 27,848 15,191 53,425 30,915
Total revenues 99,801 76,560 195,762 149,649
Expenses
Real estate depreciation and amortization 14,956 12,442 29,712 26,131
Impairment charges—29,631—50,128
Property-related 530 (38) 881 700
Acquisition expenses 25,809 2,535 32,048 3,047
General and administrative 10,642 8,206 21,547 17,165
Total operating expenses 51,937 52,776 84,188 97,171
Operating income 47,864 23,784 111,574 52,478
Interest and other income (expense) (24,812) (23,947) (52,171) (45,389)
Income tax (expense) benefit (563) (40) (938) 16
Income from continuing operations 22,489 (203) 58,465 7,105
Income (loss) from discontinued operations ——(2)
Net income 22,489 (203) 58,465 7,103
Net income attributable to non-controlling interests (82)—(161) (65)
Net income attributable to MPT common stockholders $ 22,407 $ (203) $ 58,304 $ 7,038
Earnings per common share – basic and diluted:
Income from continuing operations $ 0.11 $—$ 0.28 $ 0.04
Income from discontinued operations — —
Net income attributable to MPT common stockholders $ 0.11 $—$ 0.28 $ 0.04
Dividends declared per common share $ 0.22 $ 0.21 $ 0.44 $ 0.42
Weighted average shares outstanding – basic 208,071 171,718 205,515 167,846
Weighted average shares outstanding – diluted 208,640 172,369 206,127 168,459 Q2 2015 | SUPPLEMENTAL INFORMATION 14
MEDICALPROPERTIESTRUST.COM
FINANCIAL STATEMENTS
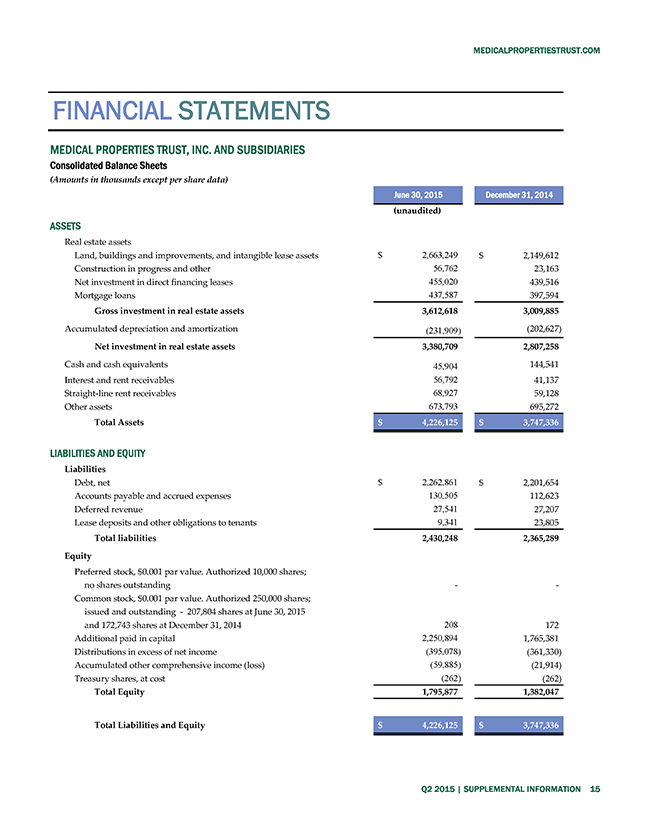
MEDICAL PROPERTIES TRUST, INC. AND SUBSIDIARIES
Consolidated Balance Sheets
(Amounts in thousands except per share data)
June 30, 2015 December 31, 2014
(unaudited)
ASSETS
Real estate assets
Land, buildings and improvements, and intangible lease assets $ 2,663,249 $ 2,149,612
Construction in progress and other 56,762 23,163
Net investment in direct financing leases 455,020 439,516
Mortgage loans 437,587 397,594
Gross investment in real estate assets 3,612,618 3,009,885
Accumulated depreciation and amortization (231,909) (202,627)
Net investment in real estate assets 3,380,709 2,807,258
Cash and cash equivalents 45,904 144,541
Interest and rent receivables 56,792 41,137
Straight-line rent receivables 68,927 59,128
Other assets 673,793 695,272
Total Assets $ 4,226,125 $ 3,747,336
LIABILITIES AND EQUITY
Liabilities
Debt, net $ 2,262,861 $ 2,201,654
Accounts payable and accrued expenses 130,505 112,623
Deferred revenue 27,541 27,207
Lease deposits and other obligations to tenants 9,341 23,805
Total liabilities 2,430,248 2,365,289
Equity
Preferred stock, $0.001 par value. Authorized 10,000 shares;
no shares outstanding —
Common stock, $0.001 par value. Authorized 250,000 shares;
issued and outstanding—207,804 shares at June 30, 2015
and 172,743 shares at December 31, 2014 208 172
Additional paid in capital 2,250,894 1,765,381
Distributions in excess of net income (395,078) (361,330)
Accumulated other comprehensive income (loss) (59,885) (21,914)
Treasury shares, at cost (262) (262)
Total Equity 1,795,877 1,382,047
Total Liabilities and Equity $ 4,226,125 $ 3,747,336
Q2 2015 | SUPPLEMENTAL INFORMATION 15
MEDICALPROPERTIESTRUST.COM
FINANCIAL STATEMENTS
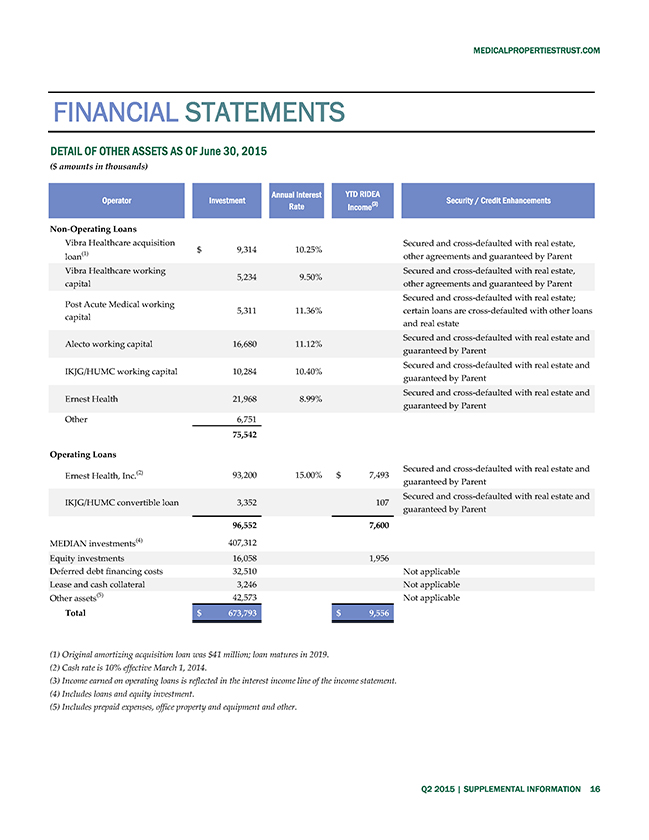
DETAIL OF OTHER ASSETS AS OF June 30, 2015
($ amounts in thousands)
Operator Investment Annual Interest Rate YTD RIDEA Income(3) Security / Credit Enhancements
Non-Operating Loans
Vibra Healthcare acquisition loan(1) $ 9,314 10.25% Secured and cross-defaulted with real estate, other agreements and guaranteed by Parent
Vibra Healthcare working capital 5,234 9.50% Secured and cross-defaulted with real estate, other agreements and guaranteed by Parent
Post Acute Medical working capital 5,311 11.36% Secured and cross-defaulted with real estate; certain loans are cross-defaulted with other loans and real estate
Alecto working capital 16,680 11.12% Secured and cross-defaulted with real estate and guaranteed by Parent
IKJG/HUMC working capital 10,284 10.40% Secured and cross-defaulted with real estate and guaranteed by Parent
Ernest Health 21,968 8.99% Secured and cross-defaulted with real estate and guaranteed by Parent
Other 6,751
75,542
Operating Loans
Ernest Health, Inc.(2) 93,200 15.00% $ 7,493 Secured and cross-defaulted with real estate and guaranteed by Parent
IKJG/HUMC convertible loan 3,352 107 Secured and cross-defaulted with real estate and guaranteed by Parent
96,552 7,600
MEDIAN investments(4) 407,312
Equity investments 16,058 1,956
Deferred debt financing costs 32,510 Not applicable
Lease and cash collateral 3,246 Not applicable
Other assets(5) 42,573 Not applicable
Total $ 673,793 $ 9,556
(1) | | Original amortizing acquisition loan was $41 million; loan matures in 2019. |
(2) | | Cash rate is 10% effective March 1, 2014. |
(3) | | Income earned on operating loans is reflected in the interest income line of the income statement. |
(4) | | Includes loans and equity investment. |
(5) | | Includes prepaid expenses, office property and equipment and other. |
Q2 2015 | SUPPLEMENTAL INFORMATION 16

1000 Urban Center Drive, Suite 501
Birmingham, AL 35242
(205) 969-3755 NYSE: MPW
www.medicalpropertiestrust.com
Investing in the future of healthcare.
Contact:
Charles Lambert, Managing Director—Capital Markets
(205) 397-8897 or clambert@medicalpropertiestrust.com
or
Tim Berryman, Director—Investor Relations
(205) 397-8589 or tberryman@medicalpropertiestrust.com