EXHIBIT 99.1
Link to searchable text of slide shown above
Link to searchable text of slide shown above
Link to searchable text of slide shown above
Searchable text section of graphics shown above
[GRAPHIC]
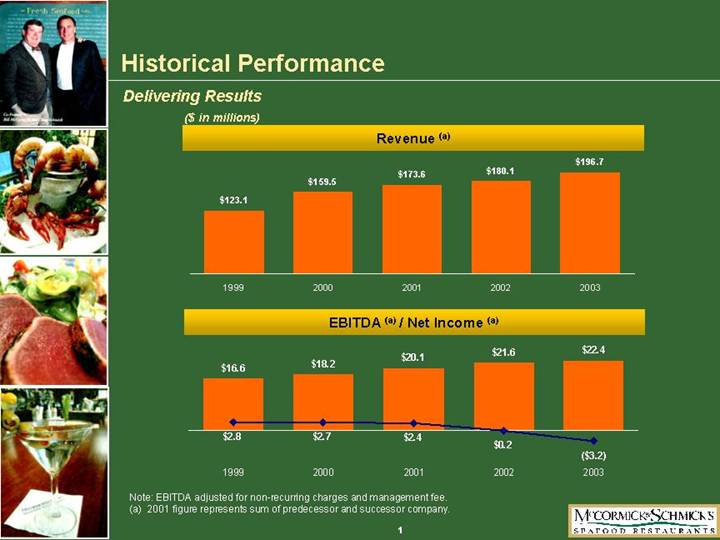
Historical Performance
Delivering Results
($ in millions)
Revenue (a)
[CHART]
$123.1 | | $159.5 | | $173.6 | | $180.1 | | $196.7 | |
| | | | | | | | | |
1999 | | 2000 | | 2001 | | 2002 | | 2003 | |
EBITDA (a) / Net Income (a)
[CHART]
$16.6/$2.8 | | $18.2/$2.7 | | $20.1/$2.4 | | $21.6/$0.2 | | $22.4/($3.2) | |
| | | | | | | | | |
1999 | | 2000 | | 2001 | | 2002 | | 2003 | |
Note: EBITDA adjusted for non-recurring charges and management fee.
(a) 2001 figure represents sum of predecessor and successor company.
[LOGO]
1
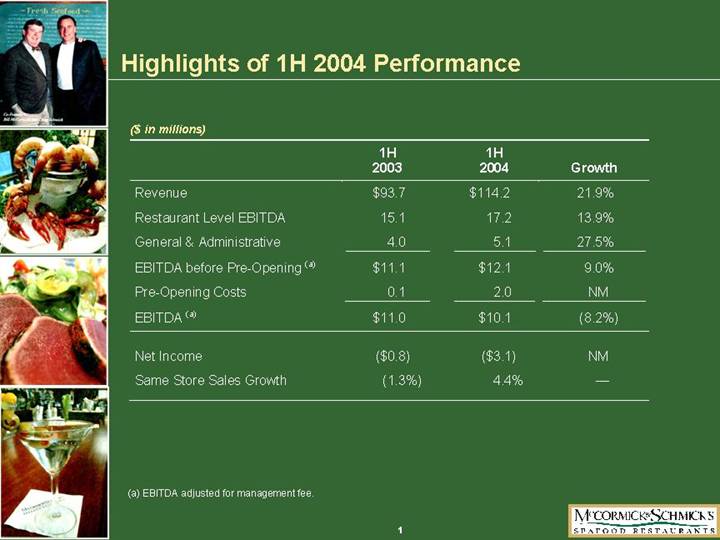
Highlights of 1H 2004 Performance
($ in millions)
| | 1H
2003 | | 1H
2004 | | Growth | |
Revenue | | $ | 93.7 | | $ | 114.2 | | 21.9 | % |
| | | | | | | |
Restaurant Level EBITDA | | 15.1 | | 17.2 | | 13.9 | % |
| | | | | | | |
General & Administrative | | 4.0 | | 5.1 | | 27.5 | % |
| | | | | | | |
EBITDA before Pre-Opening (a) | | $ | 11.1 | | $ | 12.1 | | 9.0 | % |
| | | | | | | |
Pre-Opening Costs | | 0.1 | | 2.0 | | NM | |
| | | | | | | |
EBITDA (a) | | $ | 11.0 | | $ | 10.1 | | (8.2 | )% |
| | | | | | | |
Net Income | | $ | (0.8 | ) | $ | (3.1 | ) | NM | |
| | | | | | | |
Same Store Sales Growth | | (1.3 | )% | 4.4 | % | — | |
(a) EBITDA adjusted for management fee.
2
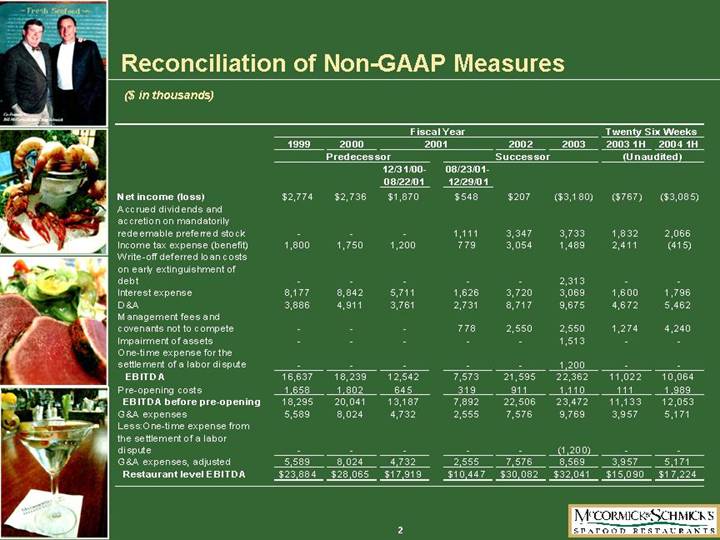
Reconciliation of Non-GAAP Measures
($ in thousands)
| | Fiscal Year | | Twenty Six Weeks | |
| | 1999 | | 2000 | | 2001 | | 2002 | | 2003 | | | | | |
| | Predecessor | | Successor | | (Unaudited) | |
| | | | | | 12/31/00-
08/22/01 | | 08/23/01-
12/29/01 | | | | | | | | | |
Net income (loss) | | $ | 2,774 | | $ | 2,736 | | $ | 1,870 | | $ | 548 | | $ | 207 | | $ | (3,180 | ) | $ | (767 | ) | $ | (3,085 | ) |
Accrued dividends and accretion on mandatorily redeemable preferred stock | | — | | — | | — | | 1,111 | | 3,347 | | 3,733 | | 1,832 | | 2,066 | |
Income tax expense (benefit) | | 1,800 | | 1,750 | | 1,200 | | 779 | | 3,054 | | 1,489 | | 2,411 | | (415 | ) |
Write-off deferred loan costs on early extinguishment of debt | | — | | — | | — | | — | | — | | 2,313 | | — | | — | |
Interest expense | | 8,177 | | 8,842 | | 5,711 | | 1,626 | | 3,720 | | 3,069 | | 1,600 | | 1,796 | |
D&A | | 3,886 | | 4,911 | | 3,761 | | 2,731 | | 8,717 | | 9,675 | | 4,672 | | 5,462 | |
Management fees and covenants not to compete | | — | | — | | — | | 778 | | 2,550 | | 2,550 | | 1,274 | | 4,240 | |
Impairment of assets | | — | | — | | — | | — | | — | | 1,513 | | — | | — | |
One-time expense for the settlement of a labor dispute | | — | | — | | — | | — | | — | | 1,200 | | — | | — | |
EBITDA | | 16,637 | | 18,239 | | 12,542 | | 7,573 | | 21,595 | | 22,362 | | 11,022 | | 10,064 | |
Pre-opening costs | | 1,658 | | 1,802 | | 645 | | 319 | | 911 | | 1,110 | | 111 | | 1,989 | |
EBITDA before pre-opening | | 18,295 | | 20,041 | | 13,187 | | 7,892 | | 22,506 | | 23,472 | | 11,133 | | 12,053 | |
G&A expenses | | 5,589 | | 8,024 | | 4,732 | | 2,555 | | 7,576 | | 9,769 | | 3,957 | | 5,171 | |
Less: One-time expense from the settlement of a labor dispute | | — | | — | | — | | — | | — | | (1,200 | ) | — | | — | |
G&A expenses, adjusted | | 5,589 | | 8,024 | | 4,732 | | 2,555 | | 7,576 | | 8,569 | | 3,957 | | 5,171 | |
Restaurant level EBITDA | | $ | 23,884 | | $ | 28,065 | | $ | 17,919 | | $ | 10,447 | | $ | 30,082 | | $ | 32,041 | | $ | 15,090 | | $ | 17,224 | |
3