UNITED STATES
SECURITIES AND EXCHANGE COMMISSION
Washington, D.C. 20549
FORM N-CSR
CERTIFIED SHAREHOLDER REPORT OF REGISTERED
MANAGEMENT INVESTMENT COMPANIES
Investment Company Act file number: 811-21583
Clough Global Allocation Fund
(exact name of registrant as specified in charter)
1290 Broadway, Suite 1100, Denver, Colorado 80203
(Address of principal executive offices) (Zip code)
Erin D. Nelson, Secretary
Clough Global Allocation Fund
1290 Broadway, Suite 1100
Denver, Colorado 80203
(Name and address of agent for service)
Registrant’s telephone number, including area code: 303-623-2577
Date of fiscal year end: March 31
Date of reporting period: March 31, 2014
Item 1. Reports to Stockholders.
| | |
| | | CLOUGH GLOBAL ALLOCATION FUND CLOUGH GLOBAL EQUITY FUND CLOUGH GLOBAL OPPORTUNITIES FUND |


|
| S ECTION 19(B) DISCLOSURE |
March 31, 2014 (Unaudited)
Clough Global Allocation Fund, Clough Global Equity Fund, and Clough Global Opportunities Fund (each a “Fund” and collectively, the “Funds”), acting pursuant to a Securities and Exchange Commission (“SEC”) exemptive order and with the approval of each Fund’s Board of Trustees (the “Board”), have adopted a plan, consistent with each Fund’s investment objectives and policies to support a level distribution of income, capital gains and/or return of capital (the “Plan”). In accordance with the Plan, Clough Global Allocation Fund and Clough Global Equity Fund currently distribute $0.105 per share on a monthly basis and Clough Global Opportunities Fund distributes $0.095 per share on a monthly basis.
The fixed amount distributed per share is subject to change at the discretion of each Fund’s Board. Under the Plan, each Fund will distribute all available investment income to its shareholders, consistent with each Fund’s primary investment objectives and as required by the Internal Revenue Code of 1986, as amended (the “Code”). If sufficient investment income is not available on a monthly basis, each Fund will distribute long-term capital gains and/or return of capital to shareholders in order to maintain a level distribution. Each monthly distribution to shareholders is expected to be at the fixed amount established by the Board, except for extraordinary distributions and potential distribution rate increases or decreases to enable each Fund to comply with the distribution requirements imposed by the Code.
Shareholders should not draw any conclusions about each Fund’s investment performance from the amount of these distributions or from the terms of the Plan. Each Fund’s total return performance on net asset value is presented in its financial highlights table.
The Board may amend, suspend or terminate each Fund’s Plan without prior notice if it deems such action to be in the best interest of either the Fund or its shareholders. The suspension or termination of the Plan could have the effect of creating a trading discount (if a Fund’s stock is trading at or above net asset value) or widening an existing trading discount. Each Fund is subject to risks that could have an adverse impact on its ability to maintain level distributions. Examples of potential risks include, but are not limited to, economic downturns impacting the markets, increased market volatility, companies suspending or decreasing corporate dividend distributions and changes in the Code. Please refer to each Fund’s prospectus for a more complete description of its risks.
Please refer to Additional Information for a cumulative summary of the Section 19(a) notices for each Fund’s current fiscal period. Section 19(a) notices for each Fund, as applicable, are available on the Clough Global Closed-End Funds website www.cloughglobal.com.
| | |
Clough Global Funds | | Table of Contents |
| | |
Shareholder Letter | | Clough Global Funds |
| March 31, 2014 (Unaudited) | | |
To Our Shareholders:
Clough Global Allocation Fund (GLV)
During the twelve-months ended March 31, 2014, the Clough Global Allocation Fund’s total return, assuming reinvestment of all distributions, was 11.14% based on the net asset value and 11.12% based on the market price of the Fund. The S&P 500 and the MSCI World Index returned 21.86% and 17.17% respectively over the same period. The Fund paid $1.515 per share in distributions during the year. As of March 31st, the Fund had a dividend distribution rate on the market price of 9.98%.
Clough Global Equity Fund (GLQ)
During the twelve-months ended March 31, 2014, the Clough Global Equity Fund’s total return, assuming reinvestment of all distributions, was 13.57% based on the net asset value and 15.52% based on the market price of the Fund. The S&P 500 and the MSCI World Index returned 21.86% and 17.17% respectively over the same period. The Fund paid $1.475 per share in distributions during the year. As of March 31st, the Fund had a dividend distribution rate on the market price of 9.57%.
Clough Global Opportunities Fund (GLO)
During the twelve-months ended March 31, 2014, the Clough Global Opportunities Fund’s total return, assuming reinvestment of all distributions, was 11.26% based on the net asset value and 9.99% based on the market price of the Fund. The S&P 500 and the MSCI World Index returned 21.86% and 17.17% respectively over the same period. The Fund paid $1.365 per share in distributions during the year. As of March 31st, the Fund had a dividend distribution rate on the market price of 10.71%.
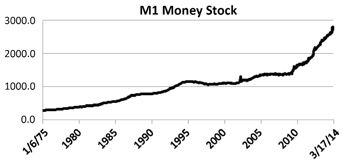
Source: Federal Reserve Bank of St. Louis
I want to first draw your attention to the time series plotted above. M1 represents cash balances in the economy. It measures the amount of currency and securities (e.g., deposits) that can immediately be turned into currency in the economy. As you can see it has exploded in recent years and virtually all of it just sits there as stranded cash. Moreover, liquidity has become stranded around the world. While $14 trillion in cash type assets sit on US household sector balance sheets, over $9 trillion (US) sit in Japanese savings. Almost $2.5 trillion in cash and near cash sit on US corporate balance sheets. What does it mean?
It certainly indicates liquidity per se is not a problem for the securities markets. Central banks have pumped over $11 trillion into banking system reserves over the past three years. Federal Reserve Credit in the United States has risen at a 31% annual rate over the past six months and free reserves in the banking system now total $2.5 trillion, and they are still growing. Many fear that money printing has become excessive and inflation pressures are building. But in order for that to happen those latent reserves have to be turned into bank credit. Yet, very little of that has happened; just like money balances in M1, the vast bulk of those central bank reserves have become stranded. Although a lot of reserves have been stuffed into a lot of banking systems, the world is not anything like 2007. Today, unlike then, the credit cycle is not well advanced, it is just emerging. Total bank credit in the US grew only 5.5% over the past three months at an annual rate and just 2.2% over the past year. And since the European Central Bank is being run like the old Japanese Central Bank, there are concerns Europe may actually fall into deflation.
So, banking system liquidity and bank capital are ample, at least in the US. It would be equity bullish if those cash balances eventually were processed through the financial system, and credit finally began to grow. That is why the Funds still hold a package of financial companies.
It would be far less positive for equities and the economy if balance sheet leverage is still too large, borrowing does not pick up, and those bank reserves remain just that. That would suggest it is difficult if not impossible to provide the credit for growth until a lot more debt is worked off. In our view it is too early to make that judgment.
Excess liquidity has certainly had a dramatic effect on securities markets. The scramble for a shrinking yield supply has driven yield curves lower all over the world. In the US, the high yield market has become anything but and covenant light loans by both banks and the supposedly sophisticated capital markets have made their reappearance. We have seen an unseemly scramble to bid up the value of peripheral sovereign debt in Europe. Peripheral yields have not only fallen below the competitively rated securities of the “core” countries in Europe, but in a few instances actually have challenged US Treasury yields.
As you know, we try to position the Funds within specific strategies and cash flow has been the primary driver of our investment strategies for several years. The portfolios are about as diversified among industries as ever. We seek out companies which possess the competitive advantages, industry leadership and investment discipline that allow them to generate high free cash flow yields. We believe our managements are all good stewards of capital. We have coined the term “compounders” to capture the dynamic of the investment opportunities we see in owning these companies. We expect the values of our portfolios to grow and even with the overall market at higher levels, we can find numerous examples of such investments.
| | |
Clough Global Funds | | Shareholder Letter |
| | March 31, 2014 (Unaudited) |
We are particularly interested in investing where cash flow generation combines with an industry tailwind which allows profit margins to expand. Here are a few examples of our industry focus.
| (1) | Homebuilding is one industry we have written about previously. New home inventories are the lowest in decades. New construction has fallen well behind underlying demand which is finally recovering as higher employment spurs household formations. To meet that demand new home construction would have to be 30 -50% higher in a few years. The major builders will likely capture a large portion of that as the collapse of 2008 has reduced the ability of independent builders to compete cost wise or in financing ability. We suspect the homebuilders will add to Fund performance as spring moves on. |
More importantly the healing process in housing is likely to be a long drawn out affair, lasting years, and we suspect we will hold the stocks with that timing in mind. Home prices are rising (usually a sign of shortages), the industry has restored profitability and is generating cash, the larger builders are very competitive and are gaining share. Meanwhile bond yields seem to have hit a wall, at least for now and purchase mortgage applications are rising.
| (2) | We think auto dealers will generate the highest profit margins along the auto manufacturing and distribution chain. More automobile manufacturing capacity exists in North America than in 2007 and that will limit profits from new auto sales. The dealer chains however capture higher margins as the new autos delivered since the cycle low in 2009 reach the five year point where they require parts and service. In addition the industry has become more professionally managed and benefits from the competitive moat established by state franchise laws. |
| (3) | The Funds are positioned for a coming decline in the spread between the price of oil and natural gas by investing in both gas producers and oil refiners. The ratio of standard oil to standard gas prices spiked from a normal 6:1 to as high as 45:1 at one point1. That may now be normalizing. Shale oil production in the US is rising at a rate of 10% per year while demand is flat to declining and oil inventories are building. Meanwhile an abnormally cold winter brought gas storage nearly 900 billion cubic feet below normal, far too low to allow replacement of normal shortage before winter. Meanwhile demand for gas will rise simply due to mandated coal to gas utility switching. Natural gas producers have to be price incentivized to hold storage ahead of winter 2015 and those able to increase production should also see higher prices. As US oil production creates surpluses in more geographies, US oil refiners should continue to benefit from the spread between US oil prices and Brent, the international oil price benchmark. By 2015 when US production is more than 2 million barrels higher, that spread could rise to $30 - 40 from something closer to $10 today. |
| 1 | Source: Bloomberg, L.P. “WTI Cushing Crude Oil Historical Price Chart compared to Henry Hub Gas Historical Price Chart May 2014.” Bloomberg Database |
A major strategy in the Funds is based on the improvement in the quality of the economy’s credit structure. We also hold a handful of US bank equities, particularly those with capital market operations. Commercial and industrial loans rose 15.3% annualized over the past three months, indicating a corporate credit cycle is emerging.
While most of our financial holdings have done well, the largest holding in the Fund, Citigroup, has been a recent disappointment. Concerns have risen over the company’s emerging market exposure and weakness in fixed income trading. A write down in its Mexican bank brought forth questions about the bank’s controls, which are critical in such a far flung global enterprise. And then of course the bank failed the recent Fed exam which put off distributions to shareholders to at least 2015.
Citigroup has become one of the attractively priced bank stocks in the US. UBS just released an analysis which pointed out that Citi is being valued as if the investment banking division is worth one times 2015 earnings were market multiples to be assigned to its other operations. The company has $42 billion of deferred tax assets (DTA). We can see $6.00 of earning power in 2015 with any recovery in capital markets activity. What is the upside? Once capital requirements are met, banks like Citi could dividend out 45% or more of earnings or buy in the equivalent value in stock. As it is the stock sells at 75% of tangible book value and buying back stock below book adds shareholder value at a rapid rate. Now that Citi Holdings (the bad bank) has run off, the company is beginning to use the DTA. At one time Citi Holdings lost $4 billion annually. It now is nearing profitability. Further runoff would lead to a $2.8 billion reserves release. The bank already has the highest capital ratios among the big banks with $18 - 19 billion of excess capital. And that excess capital is growing.
In recent weeks our financial holdings have declined in price but as the distribution rate curve steepens we think value in the sector will rise again.
Investing in Japan has been a Fund strategy for the better part of 18 months and while price deflation was the subject of a recent Wall Street Journal front page article, Japan is one economy winning that war. Its central bank has pledged to increase the size of its balance sheet until a 2% inflation rate is achieved. The economy’s growth is outpacing capacity expansion so the output gap is closing and it is one of the few economies seeing upward price pressures. Since pricing and profitability historically are highly correlated we still think Japan’s profit cycle could be stronger than anticipated. One emerging positive is the likelihood that Japan restarts some of its nuclear plants. That would reduce energy costs and improve real incomes. Just 8% of Japanese savings are in stocks versus one third in the US. In addition, Japan’s Government Pension Investment Fund, the largest investment pension pool in the world, is being encouraged to shift from bonds to stocks at the margin. Specifically it is being advised to invest in a new index, the JPX-Nikkei 400, which is designed to measure the performance of Japan’s high return on equity companies. Despite all this, Japan’s broader Tokyo Stock Exchange Tokyo Price Index (TOPIX Index) is off 11% so far in 2014 and until Japanese equities begin to perform better we have reduced exposure.
| | |
Annual Report | March 31, 2014 | | 3 |
| | |
Shareholder Letter | | Clough Global Funds |
| March 31, 2014 (Unaudited) | | |
So where does all this leave us?
Overall we think 2014 will deliver a different opportunity set than did 2013. Investment and merger and acquisition activity could make a dent in the large cash hoard on corporate balance sheets. The US capital stock is nearing 22 years of age and in many sectors is in need of upgrading. This is the reason we expect to see capital spending rise in the months ahead. This is also why we suspect profit margins are likely to remain high. At the same time industry restructuring is likely to continue to offer investment opportunity as the current merger battle in the US cable industry exemplifies.
Over time, our policy is to increase the annualized distribution rate based on the market price in line with the growth of retained net asset value.
If you have any questions about your investment, please call 1-877-256-8445.
Sincerely,

Charles I. Clough, Jr.
Past performance is no guarantee of future results.
The information in this letter represents the opinions of the individual Portfolio Managers and is not intended to be a forecast of future events, a guarantee of future results, or investment advice.
The Funds’ distribution policy will, under certain circumstances, have certain adverse consequences to the Fund and its shareholders because it may result in a return of capital resulting in less of a shareholder’s assets being invested in the Fund and, over time, increase the Fund’s expense ratio.
MSCI World Index – A free float-adjusted market capitalization weighted index that is designed to measure the equity market performance of developed and emerging markets. The index includes reinvestment of dividends, net of foreign withholding taxes.
S&P 500® Index – Standard & Poor’s composite index of 500 stocks, a widely recognized, unmanaged index of common stock prices.
JPX-Nikkei Index 400 – Index is composed of 400 companies with a high appeal to investors, which meet specific requirements of the efficient use of capital and investor-focused management perspectives. The new index will promote the appeal of Japanese corporations domestically and abroad, while encouraging continued improvement of corporate value, thereby aiming to revitalize the Japanese stock market.
Tokyo Stock Exchange Tokyo Price Index – Commonly known as TOPIX is an important stock market index for the Tokyo Stock Exchange (TSE) in Japan, tracking all domestic companies of the exchange’s First Section. It is calculated and published by the TSE. There are approximately 1,700 companies listed on the First Section of the TSE.
It is not possible to invest directly in an index.
| | | | |
| GLV | | | |
Top 10 Equity Holdings* | | | % of Total Portfolio | |
1. Citigroup, Inc. | | | 3.27% | |
2. Western Union Co. | | | 2.61% | |
3. Wyndham Worldwide Corp. | | | 2.57% | |
4. AutoNation, Inc. | | | 2.42% | |
5. Liberty Ventures - Series A | | | 2.16% | |
6. United Continental Holdings, Inc. | | | 1.95% | |
7. Allison Transmission Holdings, Inc. | | | 1.92% | |
8. Liberty Media Corp. - Class A | | | 1.92% | |
9. Lennar Corp. - Class A | | | 1.89% | |
10. Google, Inc. - Class A | | | 1.75% | |
| |
GLQ | | | | |
Top 10 Equity Holdings* | | | % of Total Portfolio | |
1. Citigroup, Inc. | | | 3.41% | |
2. Wyndham Worldwide Corp. | | | 2.75% | |
3. Western Union Co. | | | 2.61% | |
4. AutoNation, Inc. | | | 2.40% | |
5. Liberty Ventures - Series A | | | 2.23% | |
6. Liberty Media Corp. - Class A | | | 2.16% | |
7. Allison Transmission Holdings, Inc. | | | 2.00% | |
8. United Continental Holdings, Inc. | | | 1.95% | |
9. Lennar Corp. - Class A | | | 1.88% | |
10. ViaSat, Inc. | | | 1.75% | |
| |
GLO | | | | |
Top 10 Equity Holdings* | | | % of Total Portfolio | |
1. Citigroup, Inc. | | | 3.33% | |
2. Western Union Co. | | | 2.61% | |
3. Wyndham Worldwide Corp. | | | 2.61% | |
4. AutoNation, Inc. | | | 2.46% | |
5. Liberty Ventures - Series A | | | 2.21% | |
6. United Continental Holdings, Inc. | | | 1.96% | |
7. Allison Transmission Holdings, Inc. | | | 1.96% | |
8. Liberty Media Corp. - Class A | | | 1.93% | |
9. Lennar Corp. - Class A | | | 1.90% | |
10. DR Horton, Inc. | | | 1.76% | |
Holdings are subject to change.
*Only long positions are listed.
| | |
Clough Global Allocation Fund | | Portfolio Allocation |
| | March 31, 2014 (Unaudited) |
| | | | |
Asset Allocation* | |
| |
Common Stocks - US | | | 83.38% | |
Common Stocks - Foreign | | | 8.24% | |
Exchange Traded Funds | | | -14.67% | |
| |
Total Equities | | | 76.95% | |
| |
| |
Government L/T | | | 4.92% | |
Corporate Debt | | | 6.52% | |
Asset/Mortgage Backed | | | 0.57% | |
| |
Total Fixed Income | | | 12.01% | |
| |
| |
Short-Term Investments | | | 10.89% | |
Options | | | 0.10% | |
Warrants | | | 0.09% | |
Total Return Swap Contracts | | | -0.09% | |
Other (Foreign Cash) | | | 0.05% | |
| |
Total Other | | | 11.04% | |
| |
| | | | |
| |
TOTAL INVESTMENTS | | | 100.00% | |
| |
| * | Percentages are based on total investments, including options written and securities sold short. Holdings are subject to change. |
| ^ | Includes securities sold short and foreign cash balances. |
| † | US Multinational Corporations – has more than 50% of revenues derived outside of the U.S. |
| | | | |
Global Securities Holdings^ | |
| |
United States | | | 83.32% | |
U.S. Multinationals† | | | 9.69% | |
Japan | | | 4.75% | |
United Kingdom | | | 1.49% | |
Netherlands | | | 1.15% | |
Mexico | | | 0.93% | |
Israel | | | 0.73% | |
Brazil | | | 0.53% | |
China | | | 0.32% | |
Norway | | | 0.28% | |
Other | | | -3.19% | |
| |
TOTAL INVESTMENTS | | | 100.00% | |
| |
| | |
Annual Report | March 31, 2014 | | 5 |
| | |
Portfolio Allocation | | Clough Global Equity Fund |
| March 31, 2014 (Unaudited) | | |
| | | | |
Asset Allocation* | |
| |
Common Stocks - US | | | 89.21% | |
Common Stocks - Foreign | | | 10.86% | |
Exchange Traded Funds | | | -14.83% | |
| |
Total Equities | | | 85.24% | |
| |
| |
Government L/T | | | 3.81% | |
Corporate Debt | | | 5.62% | |
| |
Total Fixed Income | | | 9.43% | |
| |
| |
Short-Term Investments | | | 5.18% | |
Options | | | 0.10% | |
Warrants | | | 0.09% | |
Total Return Swap Contracts | | | -0.08% | |
Other (Foreign Cash) | | | 0.04% | |
| |
Total Other | | | 5.33% | |
| |
| | | | |
| |
TOTAL INVESTMENTS | | | 100.00% | |
| |
| * | Percentages are based on total investments, including options written and securities sold short. Holdings are subject to change. |
| ^ | Includes securities sold short and foreign cash balances. |
| † | US Multinational Corporations – has more than 50% of revenues derived outside of the U.S. |
| | | | |
Global Securities Holdings^ | |
| |
United States | | | 80.14% | |
U.S. Multinationals† | | | 10.23% | |
Japan | | | 5.21% | |
United Kingdom | | | 1.47% | |
Netherlands | | | 1.13% | |
Mexico | | | 0.92% | |
Thailand | | | 0.77% | |
Canada | | | 0.75% | |
Israel | | | 0.71% | |
China | | | 0.69% | |
Other | | | -2.02% | |
| |
TOTAL INVESTMENTS | | | 100.00% | |
| |
| | |
Clough Global Opportunities Fund | | Portfolio Allocation |
| | March 31, 2014 (Unaudited) |
| | | | |
Asset Allocation* | |
| |
Common Stocks - US | | | 84.25% | |
Common Stocks - Foreign | | | 8.36% | |
Exchange Traded Funds | | | -14.76% | |
| |
Total Equities | | | 77.85% | |
| |
| |
Government L/T | | | 4.43% | |
Corporate Debt | | | 6.37% | |
Asset/Mortgage Backed | | | 0.37% | |
| |
Total Fixed Income | | | 11.17% | |
| |
| |
Short-Term Investments | | | 10.83% | |
Options | | | 0.10% | |
Warrants | | | 0.09% | |
Total Return Swap Contracts | | | -0.09% | |
Other (Foreign Cash) | | | 0.05% | |
| |
Total Other | | | 10.98% | |
| |
| | | | |
| |
TOTAL INVESTMENTS | | | 100.00% | |
| |
| * | Percentages are based on total investments, including options written and securities sold short. Holdings are subject to change. |
| ^ | Includes securities sold short and foreign cash balances. |
| † | US Multinational Corporations – has more than 50% of revenues derived outside of the U.S. |
| | | | |
Global Securities Holdings^ | |
| |
United States | | | 83.11% | |
U.S. Multinationals† | | | 9.77% | |
Japan | | | 4.83% | |
United Kingdom | | | 1.50% | |
Netherlands | | | 1.16% | |
Mexico | | | 0.94% | |
Israel | | | 0.72% | |
Brazil | | | 0.54% | |
China | | | 0.35% | |
Norway | | | 0.30% | |
Other | | | -3.22% | |
| |
TOTAL INVESTMENTS | | | 100.00% | |
| |
| | |
Annual Report | March 31, 2014 | | 7 |
| | |
Report of Independent Registered Public Accounting Firm |
To the Shareholders and Board of Trustees of
Clough Global Allocation Fund,
Clough Global Equity Fund, and
Clough Global Opportunities Fund
We have audited the accompanying statements of assets and liabilities, including the statements of investments, of Clough Global Allocation Fund, Clough Global Equity Fund, and Clough Global Opportunities Fund (each a “Fund”, collectively the “Funds”), as of March 31, 2014, and the related statements of operations and cash flows for the year then ended, the statements of changes in net assets for each of the two years in the period then ended, and the financial highlights for each of the three years in the period then ended. These financial statements and financial highlights are the responsibility of the Funds’ management. Our responsibility is to express an opinion on these financial statements and financial highlights based on our audits. The financial highlights for the periods indicated prior to March 31, 2012, were audited by another independent registered public accounting firm whose report dated May 18, 2011, expressed unqualified opinions on those financial highlights.
We conducted our audits in accordance with the standards of the Public Company Accounting Oversight Board (United States). Those standards require that we plan and perform the audit to obtain reasonable assurance about whether the financial statements and financial highlights are free of material misstatement. An audit includes examining, on a test basis, evidence supporting the amounts and disclosures in the financial statements. Our procedures included confirmation of securities owned as of March 31, 2014, by correspondence with the custodian and brokers or by other appropriate auditing procedures where replies from brokers or counterparties were not received. An audit also includes assessing the accounting principles used and significant estimates made by management, as well as evaluating the overall financial statement presentation. We believe that our audits provide a reasonable basis for our opinion.
In our opinion, the financial statements and financial highlights referred to above present fairly, in all material respects, the financial position of Clough Global Allocation Fund, Clough Global Equity Fund, and Clough Global Opportunities Fund as of March 31, 2014, the results of their operations and their cash flows for the year then ended, the changes in their net assets for each of the two years in the period then ended, and the financial highlights for each of the three years in the period then ended, in conformity with accounting principles generally accepted in the United States of America.
COHEN FUND AUDIT SERVICES, LTD.
Cleveland, Ohio
May 23, 2014
| | |
Clough Global Allocation Fund | | Statement of Investments |
| | March 31, 2014 |
| | | | | | | | |
| | | Shares | | | Value | |
COMMON STOCKS 120.35% | | | | | | | | |
Consumer Discretionary 32.86% | | | | | | | | |
Asbury Automotive Group, Inc.(a)(b)(c) | | | 41,404 | | | $ | 2,290,055 | |
AutoNation, Inc.(a)(b) | | | 93,882 | | | | 4,997,339 | |
Beazer Homes USA,
Inc.(a)(b)(c) | | | 98,471 | | | | 1,977,298 | |
Byd Co., Ltd. - Class H(a) | | | 64,866 | | | | 400,996 | |
Charter Communications, Inc. - Class A(a)(b)(c) | | | 27,700 | | | | 3,412,640 | |
Cia de Locacao das Americas(d) | | | 161,639 | | | | 243,634 | |
Comcast Corp. -
Class A(b) | | | 34,100 | | | | 1,705,682 | |
Denso Corp. | | | 9,100 | | | | 436,243 | |
Don Quijote Co., Ltd. | | | 6,900 | | | | 356,314 | |
DR Horton, Inc.(b)(c) | | | 166,400 | | | | 3,602,560 | |
Group 1 Automotive,
Inc.(b)(c) | | | 33,389 | | | | 2,192,322 | |
Imax Corp.(a)(b) | | | 36,200 | | | | 989,346 | |
Kate Spade & Co.(a)(b) | | | 20,683 | | | | 767,132 | |
Las Vegas Sands
Corp.(b)(c) | | | 7,675 | | | | 619,987 | |
Lennar Corp. -
Class A(b)(c) | | | 98,200 | | | | 3,890,684 | |
Liberty Interactive Corp. - Class A(a)(b) | | | 42,912 | | | | 1,238,869 | |
Liberty Media Corp. - Class A(a)(b)(c) | | | 30,312 | | | | 3,962,688 | |
Liberty Ventures -
Series A(a)(b)(c) | | | 34,186 | | | | 4,455,461 | |
Lithia Motors, Inc. -
Class A(b)(c) | | | 40,615 | | | | 2,699,273 | |
Man Wah Holdings, Ltd. | | | 674,334 | | | | 1,138,887 | |
Orient-Express Hotels, Ltd. - Class A(a)(b) | | | 45,406 | | | | 654,300 | |
Penske Automotive Group, Inc.(b)(c) | | | 64,341 | | | | 2,751,221 | |
PulteGroup, Inc.(b)(c) | �� | | 143,845 | | | | 2,760,386 | |
Samsonite International S.A. | | | 202,997 | | | | 628,109 | |
Service Corp. International(b) | | | 81,700 | | | | 1,624,196 | |
Signet Jewelers, Ltd.(b) | | | 14,700 | | | | 1,556,142 | |
Starbucks Corp.(b) | | | 26,200 | | | | 1,922,556 | |
Toll Brothers, Inc.(a) | | | 41,200 | | | | 1,479,080 | |
Wyndham Worldwide Corp.(b) | | | 72,300 | | | | 5,294,529 | |
| | | | | | | | |
| | | | | | | 60,047,929 | |
| | | | | | | | |
| | |
Consumer Staples 1.50% | | | | | | | | |
Brasil Pharma S.A.(a)(d) | | | 170,528 | | | | 287,846 | |
Suntory Beverage & Food, Ltd. | | | 10,600 | | | | 365,092 | |
Vinda International Holdings, Ltd. | | | 581,996 | | | | 846,376 | |
Whole Foods Market,
Inc.(b) | | | 24,600 | | | | 1,247,466 | |
| | | | | | | | |
| | | | | | | 2,746,780 | |
| | | | | | | | |
| | | | | | | | |
| | | Shares | | | Value | |
Energy 18.97% | | | | | | | | |
Coal 0.26% | | | | | | | | |
Arch Coal, Inc. | | | 98,414 | | | $ | 474,355 | |
| | | | | | | | |
|
Natural Gas Leveraged Exploration & Production 3.73% | |
Antero Resources Corp.(a)(b) | | | 8,500 | | | | 532,100 | |
EOG Resources, Inc.(b) | | | 8,700 | | | | 1,706,679 | |
Gulfport Energy Corp.(a)(b) | | | 31,788 | | | | 2,262,670 | |
Rice Energy,
Inc.(a)(b) | | | 32,000 | | | | 844,480 | |
Southwestern Energy Co.(a) | | | 32,000 | | | | 1,472,320 | |
| | | | | | | | |
| | | | | | | 6,818,249 | |
| | | | | | | | |
|
Non-North American Producers 1.18% | |
InterOil Corp.(a)(b)(c) | | | 33,419 | | | | 2,164,214 | |
| | | | | | | | |
|
Oil Leveraged Exploration & Production 3.16% | |
Anadarko Petroleum
Corp.(b)(c) | | | 8,906 | | | | 754,873 | |
Concho Resources,
Inc.(a)(b)(c) | | | 8,900 | | | | 1,090,250 | |
Hess Corp.(b) | | | 15,100 | | | | 1,251,488 | |
Occidental Petroleum
Corp.(b)(c) | | | 12,800 | | | | 1,219,712 | |
Stone Energy Corp.(a) | | | 16,034 | | | | 672,947 | |
Whiting Petroleum Corp.(a) | | | 11,200 | | | | 777,168 | |
| | | | | | | | |
| | | | | | | 5,766,438 | |
| | | | | | | | |
|
Oil Services & Drillers 4.31% | |
Halliburton Co.(b) | | | 30,300 | | | | 1,784,367 | |
Helmerich & Payne, Inc.(b)(c) | | | 11,400 | | | | 1,226,184 | |
Key Energy Services, Inc.(a) | | | 26,163 | | | | 241,746 | |
Nabors Industries, Ltd.(b)(c) | | | 40,100 | | | | 988,465 | |
Patterson-UTI Energy, Inc.(b)(c) | | | 38,400 | | | | 1,216,512 | |
Schlumberger,
Ltd.(b)(c) | | | 7,900 | | | | 770,250 | |
Superior Energy Services, Inc.(b)(c) | | | 53,700 | | | | 1,651,812 | |
| | | | | | | | |
| | | | | | | 7,879,336 | |
| | | | | | | | |
|
Refiners 6.01% | |
HollyFrontier
Corp.(b) | | | 18,496 | | | | 880,040 | |
Marathon Petroleum
Corp.(b) | | | 35,200 | | | | 3,063,808 | |
Phillips 66(b) | | | 38,800 | | | | 2,989,928 | |
Tesoro Corp. | | | 13,200 | | | | 667,788 | |
Valero Energy Corp.(b) | | | 63,700 | | | | 3,382,470 | |
| | | | | | | | |
| | | | | | | 10,984,034 | |
| | | | | | | | |
|
Tankers 0.32% | |
Golar LNG, Ltd.(b)(c) | | | 13,973 | | | | 582,534 | |
| | | | | | | | |
| | |
TOTAL ENERGY | | | | | | | 34,669,160 | |
| | | | | | | | |
| | |
Financials 21.19% | | | | | | | | |
Capital Markets 2.79% | |
Daiwa Securities Group, Inc. | | | 182,105 | | | | 1,584,366 | |
| | |
Annual Report | March 31, 2014 | | 9 |
| | |
Statement of Investments | | Clough Global Allocation Fund |
| March 31, 2014 | | |
| | | | | | | | |
| | | Shares | | | Value | |
Financials (continued) | | | | | | | | |
Morgan Stanley(b)(c) | | | 95,287 | | | $ | 2,970,096 | |
Nomura Holdings, Inc. | | | 84,600 | | | | 542,607 | |
| | | | | | | | |
| | | | | | | 5,097,069 | |
| | | | | | | | |
|
Commercial Banks 3.57% | |
Grupo Financiero Banorte SAB de CV - Class O | | | 105,888 | | | | 716,085 | |
Mitsubishi UFJ Financial Group, Inc. | | | 87,700 | | | | 481,770 | |
Mizuho Financial Group, Inc. | | | 291,900 | | | | 576,928 | |
Sumitomo Mitsui Financial Group, Inc. | | | 13,200 | | | | 563,860 | |
Sumitomo Mitsui Trust Holdings, Inc. | | | 277,500 | | | | 1,252,870 | |
SunTrust Banks, Inc.(b) | | | 35,554 | | | | 1,414,694 | |
Wells Fargo &
Co.(b)(c) | | | 30,500 | | | | 1,517,070 | |
| | | | | | | | |
| | | | | | | 6,523,277 | |
| | | | | | | | |
|
Diversified Financials 6.27% | |
Atlas Mara Co.-Nvest, Ltd.(a)(d) | | | 116,958 | | | | 1,333,322 | |
Bank of America Corp.(b) | | | 197,091 | | | | 3,389,965 | |
Citigroup, Inc.(b)(c) | | | 141,727 | | | | 6,746,205 | |
| | | | | | | | |
| | | | | | | 11,469,492 | |
| | | | | | | | |
|
Insurance 2.29% | |
Genworth Financial, Inc. -
Class A(a)(b)(c) | | | 132,393 | | | | 2,347,328 | |
Hartford Financial Services Group, Inc.(b) | | | 51,928 | | | | 1,831,500 | |
| | | | | | | | |
| | | | | | | 4,178,828 | |
| | | | | | | | |
|
Real Estate Investment Trusts 4.93% | |
Colony Financial, Inc. | | | 47,600 | | | | 1,044,820 | |
Lexington Realty Trust | | | 65,400 | | | | 713,514 | |
MFA Financial, Inc. | | | 300,144 | | | | 2,326,116 | |
PennyMac Mortgage Investment Trust | | | 77,905 | | | | 1,861,929 | |
Select Income
REIT(d) | | | 18,300 | | | | 553,941 | |
Two Harbors Investment Corp. | | | 244,900 | | | | 2,510,225 | |
| | | | | | | | |
| | | | | | | 9,010,545 | |
| | | | | | | | |
|
Real Estate Management & Development 1.03% | |
Altisource Residential
Corp.(b) | | | 41,900 | | | | 1,322,364 | |
BHG S.A. - Brazil Hospitality
Group(a) | | | 84,200 | | | | 555,149 | |
| | | | | | | | |
| | | | | | | 1,877,513 | |
| | | | | | | | |
|
Thrifts & Mortgage Finance 0.31% | |
MGIC Investment Corp.(a)(b)(c) | | | 66,712 | | | | 568,386 | |
| | | | | | | | |
| | |
TOTAL FINANCIALS | | | | | | | 38,725,110 | |
| | | | | | | | |
| | | | | | | | |
| | | Shares | | | Value | |
Health Care 19.61% | | | | | | | | |
Aetna, Inc.(b)(c) | | | 25,751 | | | $ | 1,930,552 | |
Akorn, Inc.(a)(b)(c) | | | 64,800 | | | | 1,425,600 | |
Alkermes PLC(a)(b) | | | 10,400 | | | | 458,536 | |
Allergan, Inc.(b)(c) | | | 13,700 | | | | 1,700,170 | |
Astellas Pharma, Inc. | | | 114,500 | | | | 1,357,826 | |
Biogen Idec, Inc.(a)(b) | | | 3,082 | | | | 942,691 | |
Bristol-Myers Squibb
Co.(b)(c) | | | 59,987 | | | | 3,116,325 | |
Catamaran Corp.(a)(b)(c) | | | 37,800 | | | | 1,691,928 | |
Celgene Corp.(a) | | | 3,047 | | | | 425,361 | |
Centene Corp.(a)(b)(c) | | | 23,057 | | | | 1,435,298 | |
Community Health Systems, Inc.(a)(b) | | | 19,806 | | | | 775,801 | |
Forest Laboratories,
Inc.(a)(b) | | | 8,329 | | | | 768,517 | |
Gilead Sciences, Inc.(a)(b) | | | 22,595 | | | | 1,601,082 | |
HCA Holdings, Inc.(a)(b) | | | 35,677 | | | | 1,873,043 | |
Healthways, Inc.(a) | | | 115,129 | | | | 1,973,311 | |
Intrexon Corp.(a)(b) | | | 36,579 | | | | 961,662 | |
Ironwood Pharmaceuticals,
Inc.(a)(b)(c) | | | 76,300 | | | | 940,016 | |
Jazz Pharmaceuticals PLC(a)(b)(c) | | | 2,197 | | | | 304,680 | |
LifePoint Hospitals,
Inc.(a)(b)(c) | | | 19,458 | | | | 1,061,434 | |
McKesson Corp.(b) | | | 3,230 | | | | 570,321 | |
Medivation, Inc.(a)(b) | | | 7,800 | | | | 502,086 | |
Perrigo Co. PLC(b)(c) | | | 8,983 | | | | 1,389,311 | |
Pfizer, Inc.(b) | | | 3,700 | | | | 118,844 | |
Salix Pharmaceuticals, Ltd.(a)(b)(c) | | | 7,700 | | | | 797,797 | |
Sanofi - ADR(b) | | | 17,153 | | | | 896,759 | |
Sinopharm Group Co., Ltd. - Class H | | | 335,600 | | | | 919,422 | |
Team Health Holdings, Inc.(a)(b) | | | 16,734 | | | | 748,847 | |
Teva Pharmaceutical Industries, Ltd. - ADR | | | 28,400 | | | | 1,500,656 | |
Towa Pharmaceutical Co., Ltd. | | | 5,343 | | | | 230,616 | |
UnitedHealth Group,
Inc.(b)(c) | | | 9,400 | | | | 770,706 | |
Veracyte, Inc.(a)(b) | | | 7,700 | | | | 131,901 | |
WellPoint, Inc.(b)(c) | | | 25,300 | | | | 2,518,615 | |
| | | | | | | | |
| | | | | | | 35,839,714 | |
| | | | | | | | |
| | |
Industrials 12.48% | | | | | | | | |
Allison Transmission Holdings, Inc.(b)(d) | | | 132,569 | | | | 3,969,116 | |
Brenntag AG | | | 5,588 | | | | 1,036,582 | |
Delta Air Lines, Inc.(b) | | | 101,000 | | | | 3,499,650 | |
Empresas ICA SAB de CV(a) | | | 241,609 | | | | 403,437 | |
Empresas ICA SAB de CV - ADR(a)(b)(c) | | | 15,930 | | | | 104,979 | |
FLIR Systems, Inc.(b) | | | 97,000 | | | | 3,492,000 | |
Mitsubishi Heavy Industries, Ltd. | | | 182,000 | | | | 1,052,696 | |
Scorpio Bulkers, Inc.(a)(b) | | | 54,300 | | | | 548,973 | |
| | |
Clough Global Allocation Fund | | Statement of Investments |
| | March 31, 2014 |
| | | | | | | | |
| | | Shares | | | Value | |
Industrials (continued) | | | | | | | | |
Sumitomo Corp. | | | 37,672 | | | $ | 479,226 | |
United Continental Holdings, Inc.(a)(b)(c) | | | 89,920 | | | | 4,013,130 | |
Verisk Analytics, Inc. - Class A(a) | | | 5,882 | | | | 352,685 | |
ViaSat, Inc.(a)(b)(c) | | | 47,949 | | | | 3,310,399 | |
Wesco Aircraft Holdings, Inc.(a)(b) | | | 24,900 | | | | 548,049 | |
| | | | | | | | |
| | | | | | | 22,810,922 | |
| | | | | | | | |
| | |
Information Technology 9.89% | | | | | | | | |
eBay, Inc.(a)(b) | | | 52,807 | | | | 2,917,059 | |
EVERTEC, Inc.(b) | | | 37,842 | | | | 934,697 | |
Google, Inc. -
Class A(a)(b) | | | 3,240 | | | | 3,611,012 | |
Hoya Corp. | | | 19,600 | | | | 610,132 | |
NXP Semiconductor
NV(a)(b) | | | 40,152 | | | | 2,361,339 | |
Samsung Electronics Co., Ltd. | | | 553 | | | | 697,712 | |
Seagate Technology(b)(c) | | | 14,900 | | | | 836,784 | |
Western Digital Corp.(b) | | | 7,800 | | | | 716,196 | |
Western Union Co.(b)(c) | | | 328,900 | | | | 5,380,804 | |
| | | | | | | | |
| | | | | | | 18,065,735 | |
| | | | | | | | |
| | |
Materials 3.13% | | | | | | | | |
Berry Plastics Group, Inc.(a)(b)(c) | | | 72,801 | | | | 1,685,343 | |
Graphic Packaging Holding Co.(a)(b) | | | 153,405 | | | | 1,558,595 | |
Taminco Corp.(a)(b) | | | 46,500 | | | | 976,965 | |
WR Grace & Co.(a)(b) | | | 15,100 | | | | 1,497,467 | |
| | | | | | | | |
| | | | | | | 5,718,370 | |
| | | | | | | | |
| | |
Telecommunication Services 0.72% | | | | | | | | |
Nippon Telegraph & Telephone Corp. | | | 24,000 | | | | 1,306,554 | |
| | | | | | | | |
| | |
TOTAL COMMON STOCKS (Cost $203,754,993) | | | | | | | 219,930,274 | |
| | | | | | | | |
| | |
EXCHANGE TRADED FUNDS 1.47% | | | | | | | | |
iShares® MSCI Mexico Capped ETF(b) | | | 10,800 | | | | 690,660 | |
SPDR® Gold Shares(a)(b) | | | 16,070 | | | | 1,986,413 | |
| | | | | | | | |
| | | | | | | 2,677,073 | |
| | | | | | | | |
| | |
TOTAL EXCHANGE TRADED FUNDS (Cost $2,780,378) | | | | | | | 2,677,073 | |
| | | | | | | | |
| | | | | | | | |
| | | Shares | | | Value | |
WARRANTS 0.10% | | | | | | | | |
Atlas Mara Co.-Nvest, Ltd., Strike price $11.50, Expires 12/17/2017(a)(d) | | | 116,958 | | | $ | 175,437 | |
| | | | | | | | |
| | |
TOTAL WARRANTS (Cost $1,170) | | | | | | | 175,437 | |
| | | | | | | | |
| | |
Description and Maturity Date | | Principal Amount | | | Value | |
CORPORATE BONDS 7.36% | | | | | | | | |
Bank of America Corp. | | | | | | | | |
Series U, Perpetual Maturity,
5.200%(b)(e)(f) | | $ | 1,665,000 | | | | 1,573,425 | |
Bank of New York Mellon Corp. | | | | | | | | |
Series D, Perpetual Maturity,
4.500%(b)(e)(f) | | | 1,640,000 | | | | 1,496,500 | |
Citigroup, Inc. | | | | | | | | |
Perpetual Maturity, 5.950% (b)(e)(f) | | | 430,000 | | | | 420,863 | |
Series D, Perpetual Maturity,
5.350%(b)(e)(f) | | | 905,000 | | | | 843,162 | |
Crown Americas LLC / Crown | | | | | | | | |
Americas Capital Corp. IV | | | | | | | | |
Series WI, 01/15/2023, 4.500%(b) | | | 830,000 | | | | 796,800 | |
Eaton Vance Corp. | | | | | | | | |
06/15/2023, 3.625% (b) | | | 800,000 | | | | 798,568 | |
General Electric Capital Corp. | | | | | | | | |
Series C, Perpetual Maturity,
5.250%(b)(e)(f) | | | 600,000 | | | | 585,120 | |
General Motors Co. | | | | | | | | |
10/02/2023,
4.875% (b)(d) | | | 1,065,000 | | | | 1,096,950 | |
JPMorgan Chase & Co. | | | | | | | | |
Series Q, Perpetual Maturity,
5.150%(b)(e)(f) | | | 1,485,000 | | | | 1,399,612 | |
M&T Bank Corp. | | | | | | | | |
Perpetual Maturity, 6.875% (b)(d)(f) | | | 950,000 | | | | 955,013 | |
PNC Financial Services Group, Inc., | | | | | | | | |
Series R, Perpetual Maturity,
4.850%(b)(e)(f) | | | 1,490,000 | | | | 1,400,600 | |
Provident Bank of Maryland | | | | | | | | |
05/01/2018, 9.500% (b) | | | 1,000,000 | | | | 1,004,182 | |
Zions Bancorporation | | | | | | | | |
Perpetual Maturity, 5.800% (b)(e)(f) | | | 1,155,000 | | | | 1,079,925 | |
| | | | | | | | |
| | |
TOTAL CORPORATE BONDS (Cost $13,143,163) | | | | | | | 13,450,720 | |
| | | | | | | | |
| | |
Annual Report | March 31, 2014 | | 11 |
| | |
Statement of Investments | | Clough Global Allocation Fund |
| March 31, 2014 | | |
| | | | | | | | |
Description and Maturity Date | | Principal Amount | | | Value | |
ASSET/MORTGAGE BACKED SECURITIES 0.64% | |
Fannie Mae REMICS | | | | | | | | |
Series 2013-100, Class MS, 06/25/2043, 3.846%(b)(e) | | | $860,559 | | | | $802,463 | |
Small Business Administration | | | | | | | | |
Participation Certificates | | | | | | | | |
Series 2008-20L, Class 1, 12/01/2028, 6.220%(b) | | | 321,901 | | | | 369,151 | |
| | | | | | | | |
| |
TOTAL ASSET/MORTGAGE BACKED SECURITIES (Cost $1,135,667) | | | | 1,171,614 | |
| | | | | | | | |
|
GOVERNMENT & AGENCY OBLIGATIONS 5.55% | |
U.S. Treasury Bonds | | | | | | | | |
11/15/2018, 3.750% (b) | | | 1,743,000 | | | | 1,911,785 | |
05/15/2021, 3.125% (b) | | | 2,200,000 | | | | 2,317,993 | |
02/15/2022, 2.000% (b) | | | 3,530,000 | | | | 3,413,757 | |
11/15/2028, 5.250% (b) | | | 2,000,000 | | | | 2,500,938 | |
| | | | | | | | |
| |
TOTAL GOVERNMENT & AGENCY OBLIGATIONS (Cost $10,210,724) | | | | 10,144,473 | |
| | | | | | | | |
| | |
| | | Number of Contracts | | | Value | |
PURCHASED OPTIONS 0.15% | |
Put Options Purchased 0.15% | | | | | |
S&P 500® Index, Expires April 2014, Exercise Price $1,840.00 | | | 300 | | | | 277,500 | |
| | | | | | | | |
| |
TOTAL PURCHASED OPTIONS (Cost $780,612) | | | | 277,500 | |
| | | | | | | | |
| | |
| | | Shares/Principal Amount | | | Value | |
SHORT-TERM INVESTMENTS 12.29% | |
Money Market Fund 11.74% | | | | | |
Morgan Stanley Institutional Liquidity Funds - Prime Portfolio (0.055% 7-day yield) | | | 21,466,149 | | | | 21,466,149 | |
| | | | | | | | |
| | |
U.S. Treasury Bills 0.55% | | | | | | | | |
U.S. Treasury Bills Discount Notes 04/24/2014, 0.049%(b)(g) | | | $1,000,000 | | | | 999,968 | |
| | | | | | | | |
| |
TOTAL SHORT-TERM INVESTMENTS (Cost $22,466,117) | | | | 22,466,117 | |
| | | | | | | | |
| | | | | | | | |
| | | | | | Value | |
Total Investments - 147.91% (Cost $254,272,824) | | | | | | | $270,293,208 | |
| | |
Liabilities in Excess of Other Assets - (47.91%)(h) | | | | | | | (87,556,689) | |
| | | | | | | | |
| | |
NET ASSETS - 100.00% | | | | | | | $182,736,519 | |
| | | | | | | | |
| | |
| SCHEDULE OF WRITTEN OPTIONS | | Number of Contracts | | | Value | |
|
PUT OPTIONS WRITTEN (0.03%) | |
S&P 500® Index, Expires April 2014, Exercise Price $1,760.00 | | | (300 | ) | | | $(61,500) | |
| | | | | | | | |
| |
TOTAL PUT OPTIONS WRITTEN (Premiums received $299,388) | | | | $(61,500) | |
| | | | | | | | |
| | |
SCHEDULE OF SECURITIES SOLD
SHORT (a) | | Shares | | | Value | |
COMMON STOCKS (16.97%) | | | | | | | | |
Consumer Discretionary (1.30%) | | | | | | | | |
CarMax, Inc. | | | (19,700 | ) | | | $(921,960) | |
Johnson Controls, Inc. | | | (19,600 | ) | | | (927,472) | |
Yamada Denki Co., Ltd. | | | (157,480 | ) | | | (524,857) | |
| | | | | | | | |
| | | | | | | (2,374,289) | |
| | | | | | | | |
| | |
Financials (3.20%) | | | | | | | | |
Capital Markets (0.69%) | | | | | | | | |
Deutsche Bank AG | | | (20,665 | ) | | | (926,412) | |
Mediobanca SpA | | | (29,997 | ) | | | (343,002) | |
| | | | | | | | |
| | | | | | | (1,269,414) | |
| | | | | | | | |
Commercial Banks (1.73%) | | | | | | | | |
Banco Bilbao Vizcaya Argentaria S.A. - ADR | | | (7,771 | ) | | | (93,330) | |
Banco Santander S.A. | | | (49,724 | ) | | | (474,107) | |
Credit Agricole S.A. | | | (35,715 | ) | | | (563,129) | |
HSBC Holdings PLC | | | (70,800 | ) | | | (716,991) | |
Societe Generale S.A. | | | (18,477 | ) | | | (1,137,964) | |
UniCredit SpA | | | (18,961 | ) | | | (173,187) | |
| | | | | | | | |
| | | | | | | (3,158,708) | |
| | | | | | | | |
Insurance (0.78%) | | | | | | | | |
Everest Re Group, Ltd. | | | (4,532 | ) | | | (693,623) | |
PartnerRe, Ltd. | | | (7,100 | ) | | | (734,850) | |
| | | | | | | | |
| | | | | | | (1,428,473) | |
| | | | | | | | |
| | |
TOTAL FINANCIALS | | | | | | | (5,856,595) | |
| | | | | | | | |
| | |
Health Care (5.95%) | | | | | | | | |
Baxter International, Inc. | | | (17,600 | ) | | | (1,295,008) | |
| | |
Clough Global Allocation Fund | | Statement of Investments |
| | March 31, 2014 |
| | | | | | | | |
SCHEDULE OF SECURITIES SOLD
SHORT(a) | | Shares | | | Value | |
Health Care (continued) | |
Charles River Laboratories International, Inc. | | | (18,200 | ) | | $ | (1,098,188 | ) |
Covance, Inc. | | | (8,550 | ) | | | (888,345 | ) |
Hanger, Inc. | | | (8,334 | ) | | | (280,689 | ) |
Healthcare Services Group, Inc. | | | (20,000 | ) | | | (581,200 | ) |
Intuitive Surgical, Inc. | | | (1,143 | ) | | | (500,623 | ) |
Laboratory Corp. of America Holdings | | | (7,500 | ) | | | (736,575 | ) |
Merck & Co., Inc. | | | (23,900 | ) | | | (1,356,803 | ) |
Owens & Minor, Inc. | | | (18,200 | ) | | | (637,546 | ) |
Quest Diagnostics, Inc. | | | (12,900 | ) | | | (747,168 | ) |
ResMed, Inc. | | | (32,200 | ) | | | (1,439,018 | ) |
St. Jude Medical, Inc. | | | (11,800 | ) | | | (771,602 | ) |
Waters Corp. | | | (4,900 | ) | | | (531,209 | ) |
| | | | | | | | |
| | | | | | | (10,863,974 | ) |
| | | | | | | | |
| | |
Industrials (3.59%) | | | | | | | | |
Atlas Copco AB - A Shares | | | (55,752 | ) | | | (1,608,223 | ) |
Bombardier, Inc. - Class B | | | (200,283 | ) | | | (744,607 | ) |
Caterpillar, Inc. | | | (6,400 | ) | | | (635,968 | ) |
Emerson Electric Co. | | | (20,500 | ) | | | (1,369,400 | ) |
Mitsui & Co., Ltd. | | | (50,500 | ) | | | (713,845 | ) |
Sandvik AB | | | (104,789 | ) | | | (1,480,610 | ) |
| | | | | | | | |
| | | | | | | (6,552,653 | ) |
| | | | | | | | |
| | |
Materials (2.93%) | | | | | | | | |
Bemis Co., Inc. | | | (17,900 | ) | | | (702,396 | ) |
BHP Billiton, Ltd. | | | (27,839 | ) | | | (941,581 | ) |
Cliffs Natural Resources, Inc. | | | (34,834 | ) | | | (712,704 | ) |
Freeport-McMoRan Copper & Gold, Inc. | | | (16,800 | ) | | | (555,576 | ) |
Glencore Xstrata PLC | | | (300,107 | ) | | | (1,544,988 | ) |
United States Steel Corp. | | | (32,800 | ) | | | (905,608 | ) |
| | | | | | | | |
| | | | | | | (5,362,853 | ) |
| | | | | | | | |
| | |
TOTAL COMMON STOCKS (Proceeds $29,338,524) | | | | | | | (31,010,364 | ) |
| | | | | | | | |
| | |
EXCHANGE TRADED FUNDS (18.03%) | | | | | | | | |
Health Care Select Sector SPDR® Fund | | | (59,400 | ) | | | (3,474,306 | ) |
iShares® China Large Cap ETF | | | (73,955 | ) | | | (2,646,110 | ) |
iShares® MSCI Emerging Markets Fund | | | (61,843 | ) | | | (2,534,945 | ) |
iShares® MSCI South Korea Capped Fund | | | (11,400 | ) | | | (701,100 | ) |
iShares® Nasdaq Biotechnology ETF | | | (1,839 | ) | | | (434,831 | ) |
iShares® Russell 2000® Fund | | | (140,200 | ) | | | (16,310,868 | ) |
SPDR® S&P 500® ETF Trust | | | (36,000 | ) | | | (6,733,440 | ) |
| | | | | | | | |
SCHEDULE OF SECURITIES SOLD
SHORT(a) | | Shares | | | Value | |
EXCHANGE TRADED FUNDS (continued) | |
United States Natural Gas Fund LP | | | (4,662 | ) | | $ | (113,846 | ) |
| | | | | | | | |
| | |
TOTAL EXCHANGE TRADED FUNDS (Proceeds $29,656,822) | | | | | | | (32,949,446 | ) |
| | | | | | | | |
| | |
TOTAL SECURITIES SOLD SHORT (Proceeds $58,995,346) | | | | | | $ | (63,959,810 | ) |
| | | | | | | | |
| (a) | Non-income producing security. |
| (b) | Pledged security; a portion or all of the security is pledged as collateral for written options, securities sold short or borrowings as of March 31, 2014. (See Note 1 and Note 6) |
| (c) | Loaned security; a portion or all of the security is on loan as of March 31, 2014. |
| (d) | Security exempt from registration under Rule 144A of the Securities Act of 1933. These securities may be resold in transactions exempt from registration, normally to qualified institutional buyers. As of March 31, 2014, these securities had a total value of $8,615,259 or 4.71% of net assets. |
| (e) | Floating or variable rate security - rate disclosed as of March 31, 2014. |
| (f) | This security has no contractual maturity date, is not redeemable and contractually pays an indefinite stream of interest. |
| (g) | Rate shown represents the bond equivalent yield to maturity at date of purchase. |
| (h) | Includes cash which is being held as collateral for total return swap contracts. |
| | |
Annual Report | March 31, 2014 | | 13 |
| | |
Statement of Investments | | Clough Global Allocation Fund |
| March 31, 2014 | | |
TOTAL RETURN SWAP CONTRACTS
| | | | | | | | | | | | | | | | |
| Counter Party | | Reference Entry/Obligation | | Notional
Amount | | | Floating Rate Paid by the Fund | | Floating
Rate Index | | Termination Date | | Net Unrealized
Appreciation | |
Morgan Stanley | | Housing Development Finance Corp. | | $ | 726,632 | | | 30 bps + 1D FEDEF | | 1D FEDEF | | 01/15/2016 | | $ | 58,662 | |
| | | | | | | | | | | | | | | | |
| | | | $ | 726,632 | | | | | | | | | $ | 58,662 | |
| | | | | | | | | | | | | | | | |
| | | | | | |
| Counter Party | | Reference Entry/Obligation | | Notional
Amount | | | Floating Rate Paid by the Fund | | Floating
Rate Index | | Termination Date | | Net Unrealized
Depreciation | |
Morgan Stanley | | Bharti Infratel, Ltd. | | $ | 1,535,035 | | | 30 bps + 1D FEDEF | | 1D FEDEF | | 12/30/2014 | | $ | (240,059 | ) |
| | | | | | | | | | | | | | | | |
| | | | $ | 1,535,035 | | | | | | | | | $ | (240,059 | ) |
| | | | | | | | | | | | | | | | |
See Notes to the Financial Statements.
| | |
Clough Global Equity Fund | | Statement of Investments |
| | March 31, 2014 |
| | | | | | | | |
| | | Shares | | | Value | |
COMMON STOCKS 129.72% | | | | | | | | |
Consumer Discretionary 35.22% | | | | | | | | |
Asbury Automotive Group, Inc.(a)(b) | | | 68,718 | | | | $3,800,793 | |
AutoNation, Inc.(a)(b) | | | 155,527 | | | | 8,278,702 | |
Beazer Homes USA, Inc.(a)(b)(c) | | | 164,030 | | | | 3,293,722 | |
Byd Co., Ltd. - Class H(a) | | | 107,890 | | | | 666,967 | |
Charter Communications, Inc. - Class A(a)(b)(c) | | | 46,400 | | | | 5,716,480 | |
Cia de Locacao das Americas(d) | | | 262,571 | | | | 395,766 | |
Comcast Corp. -
Class A(b) | | | 57,000 | | | | 2,851,140 | |
Denso Corp. | | | 15,200 | | | | 728,669 | |
Don Quijote Co., Ltd. | | | 11,300 | | | | 583,530 | |
DR Horton, Inc.(b)(c) | | | 278,100 | | | | 6,020,865 | |
Group 1 Automotive, Inc.(b)(c) | | | 55,374 | | | | 3,635,857 | |
Imax Corp.(a)(b)(c) | | | 139,495 | | | | 3,812,398 | |
Kate Spade & Co.(a)(b) | | | 40,127 | | | | 1,488,311 | |
Las Vegas Sands
Corp.(b) | | | 12,859 | | | | 1,038,750 | |
Lennar Corp. -
Class A(b)(c) | | | 163,900 | | | | 6,493,718 | |
Liberty Interactive Corp. - Class A(a)(b) | | | 135,486 | | | | 3,911,481 | |
Liberty Media Corp. - Class A(a)(b)(c) | | | 56,868 | | | | 7,434,354 | |
Liberty Ventures - Series A(a)(b)(c) | | | 59,134 | | | | 7,706,934 | |
Lithia Motors, Inc. - Class A(b)(c) | | | 67,227 | | | | 4,467,906 | |
Man Wah Holdings, Ltd. | | | 1,120,272 | | | | 1,892,034 | |
Orient-Express Hotels, Ltd. - Class A(a)(b)(c) | | | 101,637 | | | | 1,464,589 | |
Penske Automotive Group, Inc.(b)(c) | | | 106,496 | | | | 4,553,769 | |
PulteGroup, Inc.(b)(c) | | | 240,125 | | | | 4,607,999 | |
Samsonite International S.A. | | | 802,303 | | | | 2,482,469 | |
Service Corp. International(b) | | | 136,700 | | | | 2,717,596 | |
Signet Jewelers,
Ltd.(b)(c) | | | 24,200 | | | | 2,561,812 | |
Starbucks Corp.(b) | | | 43,900 | | | | 3,221,382 | |
Toll Brothers, Inc.(a) | | | 67,600 | | | | 2,426,840 | |
Wyndham Worldwide Corp.(b)(c) | | | 129,600 | | | | 9,490,608 | |
| | | | | | | | |
| | | | | | | 107,745,441 | |
| | | | | | | | |
| | |
Consumer Staples 1.80% | | | | | | | | |
Brasil Pharma S.A.(a)(d) | | | 279,686 | | | | 472,101 | |
Suntory Beverage & Food, Ltd. | | | 17,500 | | | | 602,747 | |
Vinda International Holdings, Ltd. | | | 1,620,107 | | | | 2,356,063 | |
Whole Foods Market, Inc.(b) | | | 40,900 | | | | 2,074,039 | |
| | | | | | | | |
| | | | | | | 5,504,950 | |
| | | | | | | | |
| | | | | | | | |
| | | Shares | | | Value | |
Energy 19.84% | | | | | | | | |
Coal 0.25% | | | | | | | | |
Arch Coal, Inc. | | | 159,898 | | | | $770,708 | |
| | | | | | | | |
Natural Gas Leveraged Exploration & Production 3.90% | |
Antero Resources Corp.(a)(b) | | | 14,300 | | | | 895,180 | |
EOG Resources, Inc.(b) | | | 15,300 | | | | 3,001,401 | |
Gulfport Energy Corp.(a)(b) | | | 59,003 | | | | 4,199,834 | |
Rice Energy,
Inc.(a)(b) | | | 53,500 | | | | 1,411,865 | |
Southwestern Energy Co.(a) | | | 52,300 | | | | 2,406,323 | |
| | | | | | | | |
| | | | | | | 11,914,603 | |
| | | | | | | | |
| |
Non-North American Producers 1.17% | | | | | |
InterOil
Corp.(a)(b)(c) | | | 55,384 | | | | 3,586,668 | |
| | | | | | | | |
|
Oil Leveraged Exploration & Production 3.80% | |
Anadarko Petroleum
Corp.(b) | | | 16,338 | | | | 1,384,809 | |
Concho Resources,
Inc.(a)(b)(c) | | | 14,900 | | | | 1,825,250 | |
Hess Corp.(b)(c) | | | 25,500 | | | | 2,113,440 | |
Occidental Petroleum
Corp.(b) | | | 27,400 | | | | 2,610,946 | |
Pacific Coast Oil Trust(b)(d) | | | 95,800 | | | | 1,282,762 | |
Stone Energy
Corp.(a) | | | 26,251 | | | | 1,101,754 | |
Whiting Petroleum Corp.(a) | | | 18,700 | | | | 1,297,593 | |
| | | | | | | | |
| | | | | | | 11,616,554 | |
| | | | | | | | |
|
Oil Services & Drillers 4.41% | |
Halliburton
Co.(b) | | | 57,400 | | | | 3,380,286 | |
Helmerich & Payne,
Inc.(b)(c) | | | 18,800 | | | | 2,022,128 | |
Key Energy Services, Inc.(a) | | | 42,849 | | | | 395,925 | |
Nabors Industries,
Ltd.(b)(c) | | | 67,000 | | | | 1,651,550 | |
Patterson-UTI Energy,
Inc.(b)(c) | | | 63,800 | | | | 2,021,184 | |
Schlumberger,
Ltd.(b) | | | 13,200 | | | | 1,287,000 | |
Superior Energy Services, Inc.(b)(c) | | | 89,000 | | | | 2,737,640 | |
| | | | | | | | |
| | | | | | | 13,495,713 | |
| | | | | | | | |
| |
Refiners 5.98% | | | | | |
HollyFrontier
Corp.(b) | | | 30,718 | | | | 1,461,562 | |
Marathon Petroleum
Corp.(b) | | | 58,700 | | | | 5,109,248 | |
Phillips 66(b) | | | 64,600 | | | | 4,978,076 | |
Tesoro Corp. | | | 22,200 | | | | 1,123,098 | |
Valero Energy Corp.(b) | | | 106,100 | | | | 5,633,910 | |
| | | | | | | | |
| | | | | | | 18,305,894 | |
| | | | | | | | |
| |
Tankers 0.33% | | | | | |
Golar LNG,
Ltd.(b)(c) | | | 24,139 | | | | 1,006,355 | |
| | | | | | | | |
| | |
TOTAL ENERGY | | | | | | | 60,696,495 | |
| | | | | | | | |
| | |
Annual Report | March 31, 2014 | | 15 |
| | |
Statement of Investments | | Clough Global Equity Fund |
| March 31, 2014 | | |
| | | | | | | | |
| | | Shares | | | Value | |
Financials 25.27% | | | | | | | | |
Capital Markets 3.42% | | | | | | | | |
Daiwa Securities Group, Inc. | | | 303,157 | | | | $2,637,553 | |
Ladder Capital Corp.
- Class A(a)(d) | | | 102,100 | | | | 1,927,648 | |
Morgan Stanley(b)(c) | | | 158,196 | | | | 4,930,969 | |
Nomura Holdings, Inc. | | | 149,100 | | | | 956,297 | |
| | | | | | | | |
| | | | | | | 10,452,467 | |
| | | | | | | | |
| | |
Commercial Banks 4.21% | | | | | | | | |
Grupo Financiero Banorte SAB de CV - Class O | | | 175,725 | | | | 1,188,369 | |
Kasikornbank PCL | | | 170,100 | | | | 933,348 | |
Mitsubishi UFJ Financial Group, Inc. | | | 171,800 | | | | 943,764 | |
Mizuho Financial Group, Inc. | | | 558,300 | | | | 1,103,456 | |
Siam Commercial Bank PCL | | | 137,600 | | | | 668,064 | |
Sumitomo Mitsui Financial Group, Inc. | | | 25,200 | | | | 1,076,460 | |
Sumitomo Mitsui Trust Holdings, Inc. | | | 461,000 | | | | 2,081,345 | |
SunTrust Banks,
Inc.(b) | | | 59,529 | | | | 2,368,659 | |
Wells Fargo & Co.(b) | | | 50,800 | | | | 2,526,792 | |
| | | | | | | | |
| | | | | | | 12,890,257 | |
| | | | | | | | |
| | |
Consumer Finance 0.38% | | | | | | | | |
Springleaf Holdings, Inc.(a) | | | 45,900 | | | | 1,154,385 | |
| | | | | | | | |
| |
Diversified Financials 6.49% | | | | | |
Atlas Mara Co.-Nvest, Ltd.(a)(d) | | | 195,720 | | | | 2,231,208 | |
Bank of America Corp.(b) | | | 340,705 | | | | 5,860,126 | |
Citigroup, Inc.(b)(c) | | | 247,072 | | | | 11,760,627 | |
| | | | | | | | |
| | | | | | | 19,851,961 | |
| | | | | | | | |
| | |
Insurance 2.77% | | | | | | | | |
Genworth Financial, Inc. -
Class A(a)(b)(c) | | | 256,390 | | | | 4,545,795 | |
Hartford Financial Services Group,
Inc.(b) | | | 85,628 | | | | 3,020,099 | |
National General Holdings
Corp.(b)(d) | | | 65,000 | | | | 910,000 | |
| | | | | | | | |
| | | | | | | 8,475,894 | |
| | | | | | | | |
| | |
Real Estate Investment
Trusts 5.14% | | | | | | | | |
Ares Commercial Real Estate Corp. | | | 51,400 | | | | 689,274 | |
Colony Financial, Inc. | | | 79,700 | | | | 1,749,415 | |
Lexington Realty Trust | | | 109,000 | | | | 1,189,190 | |
MFA Financial, Inc. | | | 501,868 | | | | 3,889,477 | |
PennyMac Mortgage Investment Trust | | | 130,373 | | | | 3,115,915 | |
Select Income
REIT(d) | | | 29,700 | | | | 899,019 | |
| | | | | | | | |
| | | Shares | | | Value | |
Financials (continued) | | | | | | | | |
Two Harbors Investment Corp. | | | 409,100 | | | | $4,193,275 | |
| | | | | | | | |
| | | | | | | 15,725,565 | |
| | | | | | | | |
| | |
Real Estate Management & Development 1.42% | | | | | | | | |
Altisource Residential Corp.(b) | | | 109,200 | | | | 3,446,352 | |
BHG S.A. - Brazil Hospitality Group(a) | | | 138,714 | | | | 914,571 | |
| | | | | | | | |
| | | | | | | 4,360,923 | |
| | | | | | | | |
| | |
Thrifts & Mortgage Finance 1.44% | | | | | | | | |
MGIC Investment
Corp.(a)(b) | | | 111,900 | | | | 953,388 | |
Oritani Financial Corp.(b)(c) | | | 114,300 | | | | 1,807,083 | |
Stonegate Mortgage Corp.(a) | | | 111,111 | | | | 1,651,110 | |
| | | | | | | | |
| | | | | | | 4,411,581 | |
| | | | | | | | |
| | |
TOTAL FINANCIALS | | | | | | | 77,323,033 | |
| | | | | | | | |
| | |
Health Care 20.01% | | | | | | | | |
Aetna, Inc.(b)(c) | | | 42,913 | | | | 3,217,188 | |
Akorn, Inc.(a)(b)(c) | | | 133,600 | | | | 2,939,200 | |
Alkermes PLC(a)(b) | | | 17,200 | | | | 758,348 | |
Allergan, Inc.(b)(c) | | | 22,700 | | | | 2,817,070 | |
Astellas Pharma, Inc. | | | 189,500 | | | | 2,247,232 | |
Biogen Idec, Inc.(a)(b) | | | 5,092 | | | | 1,557,490 | |
Bristol-Myers Squibb
Co.(b) | | | 100,216 | | | | 5,206,221 | |
Catamaran Corp.(a)(b)(c) | | | 62,400 | | | | 2,793,024 | |
Celgene Corp.(a) | | | 5,142 | | | | 717,823 | |
Centene Corp.(a)(b)(c) | | | 38,399 | | | | 2,390,338 | |
Community Health Systems, Inc.(a)(b) | | | 32,811 | | | | 1,285,207 | |
Forest Laboratories,
Inc.(a)(b) | | | 13,812 | | | | 1,274,433 | |
Gilead Sciences, Inc.(a)(b) | | | 37,683 | | | | 2,670,217 | |
HCA Holdings, Inc.(a)(b) | | | 59,515 | | | | 3,124,537 | |
Healthways, Inc.(a) | | | 191,441 | | | | 3,281,299 | |
Intrexon Corp.(a)(b) | | | 61,097 | | | | 1,606,240 | |
Ironwood Pharmaceuticals,
Inc.(a)(b)(c) | | | 127,500 | | | | 1,570,800 | |
Jazz Pharmaceuticals PLC(a)(b)(c) | | | 4,259 | | | | 590,638 | |
LifePoint Hospitals,
Inc.(a)(b) | | | 34,174 | | | | 1,864,192 | |
McKesson Corp.(b) | | | 5,410 | | | | 955,244 | |
Medivation, Inc.(a)(b) | | | 13,000 | | | | 836,810 | |
Perrigo Co. PLC(b)(c) | | | 15,046 | | | | 2,327,014 | |
Pfizer, Inc.(b) | | | 17,900 | | | | 574,948 | |
Salix Pharmaceuticals,
Ltd.(a)(b)(c) | | | 12,700 | | | | 1,315,847 | |
Sanofi - ADR(b) | | | 28,498 | | | | 1,489,875 | |
Sinopharm Group Co., Ltd. - Class H | | | 570,800 | | | | 1,563,785 | |
Team Health Holdings, Inc.(a)(b) | | | 27,762 | | | | 1,242,350 | |
| | |
Clough Global Equity Fund | | Statement of Investments |
| | March 31, 2014 |
| | | | | | | | |
| | | Shares | | | Value | |
Health Care (continued) | | | | | | | | |
Teva Pharmaceutical Industries, Ltd. - ADR | | | 46,600 | | | | $2,462,344 | |
Towa Pharmaceutical Co., Ltd. | | | 8,902 | | | | 384,231 | |
UnitedHealth Group,
Inc.(b)(c) | | | 15,600 | | | | 1,279,044 | |
Veracyte, Inc.(a)(b) | | | 40,906 | | | | 700,720 | |
WellPoint, Inc.(b)(c) | | | 42,100 | | | | 4,191,055 | |
| | | | | | | | |
| | | | | | | 61,234,764 | |
| | | | | | | | |
| | |
Industrials 13.86% | | | | | | | | |
Airports of Thailand PCL | | | 176,900 | | | | 1,057,910 | |
Allison Transmission Holdings, Inc.(b)(c)(d) | | | 230,363 | | | | 6,897,068 | |
Brenntag AG | | | 9,202 | | | | 1,706,985 | |
Delta Air Lines, Inc.(b)(c) | | | 167,500 | | | | 5,803,875 | |
Empresas ICA SAB de CV(a) | | | 400,359 | | | | 668,517 | |
Empresas ICA SAB de CV - ADR(a)(b)(c) | | | 26,448 | | | | 174,292 | |
FleetCor Technologies, Inc.(a)(b) | | | 11,500 | | | | 1,323,650 | |
FLIR Systems, Inc.(b) | | | 160,800 | | | | 5,788,800 | |
IHI Corp. | | | 270,044 | | | | 1,135,485 | |
Mitsubishi Heavy Industries, Ltd. | | | 302,000 | | | | 1,746,781 | |
Scorpio Bulkers, Inc.(a)(b)(c) | | | 91,100 | | | | 921,021 | |
Sumitomo Corp. | | | 71,215 | | | | 905,928 | |
United Continental Holdings, Inc.(a)(b)(c) | | | 150,856 | | | | 6,732,703 | |
Verisk Analytics, Inc. - Class A(a) | | | 9,780 | | | | 586,409 | |
ViaSat, Inc.(a)(b)(c) | | | 87,542 | | | | 6,043,900 | |
Wesco Aircraft Holdings, Inc.(a)(b) | | | 41,500 | | | | 913,415 | |
| | | | | | | | |
| | | | | | | 42,406,739 | |
| | | | | | | | |
| | |
Information Technology 9.81% | | | | | | | | |
eBay, Inc.(a)(b) | | | 88,431 | | | | 4,884,928 | |
EVERTEC, Inc.(b) | | | 63,498 | | | | 1,568,401 | |
Google, Inc. - Class A(a)(b) | | | 5,321 | | | | 5,930,308 | |
Hoya Corp. | | | 32,600 | | | | 1,014,812 | |
NXP Semiconductor
NV(a)(b) | | | 66,308 | | | | 3,899,573 | |
Samsung Electronics Co., Ltd. | | | 915 | | | | 1,154,441 | |
Seagate Technology(b)(c) | | | 24,700 | | | | 1,387,152 | |
Western Digital Corp.(b) | | | 12,800 | | | | 1,175,296 | |
Western Union Co.(b)(c) | | | 549,700 | | | | 8,993,092 | |
| | | | | | | | |
| | | | | | | 30,008,003 | |
| | | | | | | | |
| | |
Materials 3.09% | | | | | | | | |
Berry Plastics Group,
Inc.(a)(b) | | | 120,334 | | | | 2,785,732 | |
| | | | | | | | |
| | | Shares | | | Value | |
Materials (continued) | | | | | | | | |
Graphic Packaging Holding Co.(a)(b)(c) | | | 249,287 | | | | $2,532,756 | |
Taminco Corp.(a)(b)(c) | | | 78,100 | | | | 1,640,881 | |
WR Grace & Co.(a)(b) | | | 25,200 | | | | 2,499,084 | |
| | | | | | | | |
| | | | | | | 9,458,453 | |
| | | | | | | | |
| | |
Telecommunication Services 0.71% | | | | | | | | |
Nippon Telegraph & Telephone Corp. | | | 40,100 | | | | 2,183,035 | |
| | | | | | | | |
| | |
Utilities 0.11% | | | | | | | | |
Huadian Fuxin Energy Corp., Ltd. | | | 611,453 | | | | 333,455 | |
| | | | | | | | |
| | |
TOTAL COMMON STOCKS (Cost $361,384,091) | | | | | | | 396,894,368 | |
| | | | | | | | |
| | |
EXCHANGE TRADED FUNDS 1.44% | | | | | | | | |
iShares® MSCI Mexico Capped ETF(b) | | | 18,100 | | | | 1,157,495 | |
SPDR® Gold
Shares(a)(b) | | | 26,320 | | | | 3,253,415 | |
| | | | | | | | |
| | | | | | | 4,410,910 | |
| | | | | | | | |
| | |
TOTAL EXCHANGE TRADED FUNDS (Cost $4,580,653) | | | | | | | 4,410,910 | |
| | | | | | | | |
| | |
WARRANTS 0.10% | | | | | | | | |
Atlas Mara Co.-Nvest, Ltd., Strike price $11.50, Expires 12/17/2017(a)(d) | | | 195,720 | | | | 293,580 | |
| | | | | | | | |
| | |
TOTAL WARRANTS (Cost $1,957) | | | | | | | 293,580 | |
| | | | | | | | |
| | |
Description and Maturity Date | | Principal
Amount | | | Value | |
CORPORATE BONDS 6.33% | | | | | | | | |
Bank of America Corp. | | | | | | | | |
Series U, Perpetual Maturity,
5.200%(b)(e)(f) | | | $2,050,000 | | | | 1,937,250 | |
Bank of New York Mellon Corp. | | | | | | | | |
Series D, Perpetual Maturity, 4.500%(b)(e)(f) | | | 2,620,000 | | | | 2,390,750 | |
Citigroup, Inc. | | | | | | | | |
Perpetual Maturity, 5.950% (b)(e)(f) | | | 725,000 | | | | 709,594 | |
Series D, Perpetual Maturity,
5.350%(b)(e)(f) | | | 1,450,000 | | | | 1,350,923 | |
| | |
Annual Report | March 31, 2014 | | 17 |
| | |
Statement of Investments | | Clough Global Equity Fund |
| March 31, 2014 | | |
| | | | | | | | |
Description and Maturity Date | | Principal
Amount | | | Value | |
CORPORATE BONDS (continued) | | | | | |
Crown Americas LLC / Crown | | | | | | | | |
Americas Capital Corp. IV Series WI, 01/15/2023, 4.500%(b) | | | $1,320,000 | | | | $1,267,200 | |
Eaton Vance Corp. | | | | | | | | |
06/15/2023, 3.625%(b) | | | 1,275,000 | | | | 1,272,718 | |
General Electric Capital Corp. | | | | | | | | |
Series C, Perpetual Maturity,
5.250%(b)(e)(f) | | | 990,000 | | | | 965,448 | |
General Motors Co. | | | | | | | | |
10/02/2023, 4.875%(b)(d) | | | 1,635,000 | | | | 1,684,050 | |
JPMorgan Chase & Co. | | | | | | | | |
Series Q, Perpetual Maturity,
5.150%(b)(e)(f) | | | 2,415,000 | | | | 2,276,137 | |
M&T Bank Corp. | | | | | | | | |
Perpetual Maturity,
6.875%(b)(d)(f) | | | 1,440,000 | | | | 1,447,599 | |
PNC Financial Services Group, Inc., | | | | | | | | |
Series R, Perpetual Maturity,
4.850%(b)(e)(f) | | | 2,450,000 | | | | 2,303,000 | |
Zions Bancorporation | | | | | | | | |
Perpetual Maturity,
5.800%(b)(e)(f) | | | 1,885,000 | | | | 1,762,475 | |
| | | | | | | | |
| | |
TOTAL CORPORATE BONDS (Cost $18,856,674) | | | | | | | 19,367,144 | |
| | | | | | | | |
| |
GOVERNMENT & AGENCY OBLIGATIONS 4.29% | | | | | |
U.S. Treasury Bonds | | | | | | | | |
11/15/2018, 3.750%(b) | | | 2,800,000 | | | | 3,071,141 | |
05/15/2021, 3.125%(b) | | | 1,100,000 | | | | 1,158,996 | |
02/15/2022, 2.000%(b) | | | 5,050,000 | | | | 4,883,703 | |
11/15/2028, 5.250%(b) | | | 3,200,000 | | | | 4,001,501 | |
| | | | | | | | |
| |
TOTAL GOVERNMENT & AGENCY OBLIGATIONS (Cost $13,210,681) | | | | 13,115,341 | |
| | | | | | | | |
| | |
| | | Number of
Contracts | | | Value | |
PURCHASED OPTIONS 0.15% | | | | | |
Put Options Purchased 0.15% | | | | | |
S&P 500® Index, Expires April 2014, Exercise Price $1,840.00 | | | 500 | | | | 462,500 | |
| | | | | | | | |
| |
TOTAL PURCHASED OPTIONS (Cost $1,301,020) | | | | 462,500 | |
| | | | | | | | |
| | | | | | | | |
| | |
| | | Shares/Principal Amount | | | Value | |
SHORT-TERM INVESTMENTS 5.84% | | | | | |
Money Market Fund 5.51% | | | | | |
Morgan Stanley Institutional Liquidity Funds - Prime Portfolio (0.055% 7-day yield) | | | 16,867,010 | | | | $16,867,010 | |
| | | | | | | | |
| |
U.S. Treasury Bills 0.33% | | | | | |
U.S. Treasury Bills Discount Notes 04/24/2014, 0.049%(b)(g) | | | $1,000,000 | | | | 999,968 | |
| | | | | | | | |
| |
TOTAL SHORT-TERM INVESTMENTS (Cost $17,866,978) | | | | 17,866,978 | |
| | | | | | | | |
| |
Total Investments - 147.87% (Cost $ 417,202,054) | | | | 452,410,821 | |
| | |
Liabilities in Excess of Other Assets - (47.87%)(h) | | | | | | | (146,452,694) | |
| | | | | | | | |
| | |
NET ASSETS - 100.00% | | | | | | | $305,958,127 | |
| | | | | | | | |
| | |
SCHEDULE OF WRITTEN
OPTIONS | | Number of
Contracts | | | Value | |
| |
PUT OPTIONS WRITTEN (0.03%) | | | | | |
S&P 500® Index, Expires April 2014, Exercise Price $1,760.00 | | | (500) | | | | $(102,500) | |
| | | | | | | | |
| |
TOTAL PUT OPTIONS WRITTEN (Premiums received $498,980) | | | | $(102,500) | |
| | | | | | | | |
| | |
SCHEDULE OF
SECURITIES SOLD
SHORT (a) | | Shares | | | Value | |
COMMON STOCKS (16.89%) | | | | | |
Consumer Discretionary (1.29%) | | | | | |
CarMax, Inc. | | | (32,800) | | | | $(1,535,040) | |
Johnson Controls, Inc. | | | (32,600) | | | | (1,542,632) | |
Yamada Denki Co., Ltd. | | | (263,690) | | | | (878,839) | |
| | | | | | | | |
| | | | | | | (3,956,511) | |
| | | | | | | | |
| | |
Financials (3.17%) | | | | | | | | |
Capital Markets (0.69%) | | | | | | | | |
Deutsche Bank AG | | | (34,610) | | | | (1,551,566) | |
Mediobanca SpA | | | (50,077) | | | | (572,608) | |
| | | | | | | | |
| | | | | | | (2,124,174) | |
| | | | | | | | |
Commercial Banks (1.70%) | | | | | | | | |
Banco Bilbao Vizcaya Argentaria S.A. - ADR | | | (12,906) | | | | (155,001) | |
Banco Santander S.A. | | | (83,080) | | | | (792,148) | |
Credit Agricole S.A. | | | (58,023) | | | | (914,865) | |
HSBC Holdings PLC | | | (118,400) | | | | (1,199,036) | |
| | |
Clough Global Equity Fund | | Statement of Investments |
| | March 31, 2014 |
| | | | | | | | |
| SCHEDULE OF SECURITIES SOLD | | | | | | |
| SHORT(a) | | Shares | | | Value | |
Financials (continued) | | | | | | | | |
Societe Generale S.A. | | | (30,171 | ) | | | $(1,858,177 | ) |
UniCredit SpA | | | (31,490 | ) | | | (287,625 | ) |
| | | | | | | | |
| | | | | | | (5,206,852 | ) |
| | | | | | | | |
| | |
Insurance (0.78%) | | | | | | | | |
Everest Re Group, Ltd. | | | (7,553 | ) | | | (1,155,987 | ) |
PartnerRe, Ltd. | | | (11,800 | ) | | | (1,221,300 | ) |
| | | | | | | | |
| | | | | | | (2,377,287 | ) |
| | | | | | | | |
| | |
TOTAL FINANCIALS | | | | | | | (9,708,313 | ) |
| | | | | | | | |
| | |
Health Care (5.95%) | | | | | | | | |
Baxter International, Inc. | | | (29,400 | ) | | | (2,163,252 | ) |
Charles River Laboratories International, Inc. | | | (30,400 | ) | | | (1,834,336 | ) |
Covance, Inc. | | | (14,250 | ) | | | (1,480,575 | ) |
Hanger, Inc. | | | (13,964 | ) | | | (470,308 | ) |
Healthcare Services Group, Inc. | | | (33,400 | ) | | | (970,604 | ) |
Intuitive Surgical, Inc. | | | (1,961 | ) | | | (858,898 | ) |
Laboratory Corp. of America Holdings | | | (12,600 | ) | | | (1,237,446 | ) |
Merck & Co., Inc. | | | (39,800 | ) | | | (2,259,446 | ) |
Owens & Minor, Inc. | | | (30,800 | ) | | | (1,078,924 | ) |
Quest Diagnostics, Inc. | | | (21,600 | ) | | | (1,251,072 | ) |
ResMed, Inc. | | | (54,100 | ) | | | (2,417,729 | ) |
St. Jude Medical, Inc. | | | (19,600 | ) | | | (1,281,644 | ) |
Waters Corp. | | | (8,300 | ) | | | (899,803 | ) |
| | | | | | | | |
| | | | | | | (18,204,037 | ) |
| | | | | | | | |
| | |
Industrials (3.55%) | | | | | | | | |
Atlas Copco AB - A Shares | | | (92,311 | ) | | | (2,662,804 | ) |
Bombardier, Inc. - Class B | | | (334,462 | ) | | | (1,243,454 | ) |
Caterpillar, Inc. | | | (10,700 | ) | | | (1,063,259 | ) |
Emerson Electric Co. | | | (34,100 | ) | | | (2,277,880 | ) |
Mitsui & Co., Ltd. | | | (84,500 | ) | | | (1,194,453 | ) |
Sandvik AB | | | (170,736 | ) | | | (2,412,405 | ) |
| | | | | | | | |
| | | | | | | (10,854,255 | ) |
| | | | | | | | |
| | |
Materials (2.93%) | | | | | | | | |
Bemis Co., Inc. | | | (30,000 | ) | | | (1,177,200 | ) |
BHP Billiton, Ltd. | | | (46,121 | ) | | | (1,559,922 | ) |
Cliffs Natural Resources, Inc. | | | (57,957 | ) | | | (1,185,800 | ) |
Freeport-McMoRan Copper & Gold, Inc. | | | (28,200 | ) | | | (932,574 | ) |
Glencore Xstrata PLC | | | (502,430 | ) | | | (2,586,573 | ) |
United States Steel Corp. | | | (54,700 | ) | | | (1,510,267 | ) |
| | | | | | | | |
| | | | | | | (8,952,336 | ) |
| | | | | | | | |
| | |
TOTAL COMMON STOCKS | | | | | | | | |
(Proceeds $48,918,277) | | | | | | | (51,675,452 | ) |
| | | | | | | | |
| | | | | | | | |
| SCHEDULE OF SECURITIES SOLD | | | | | | |
| SHORT(a) | | Shares | | | Value | |
EXCHANGE TRADED FUNDS (18.16%) | | | | | | | | |
Health Care Select Sector SPDR® Fund | | | (99,700 | ) | | | $(5,831,453 | ) |
iShares® China Large Cap ETF | | | (123,514 | ) | | | (4,419,331 | ) |
iShares® MSCI Emerging Markets Fund | | | (102,851 | ) | | | (4,215,862 | ) |
iShares® MSCI South Korea Capped Fund | | | (19,200 | ) | | | (1,180,800 | ) |
iShares® Nasdaq Biotechnology ETF | | | (3,210 | ) | | | (759,005 | ) |
iShares® Russell 2000® Fund | | | (241,600 | ) | | | (28,107,744 | ) |
SPDR® S&P 500® ETF Trust | | | (58,050 | ) | | | (10,857,672 | ) |
United States Natural Gas Fund LP | | | (7,791 | ) | | | (190,256 | ) |
| | | | | | | | |
| | |
TOTAL EXCHANGE TRADED FUNDS | | | | | | | | |
(Proceeds $49,954,426) | | | | | | | (55,562,123 | ) |
| | | | | | | | |
| | |
TOTAL SECURITIES SOLD SHORT | | | | | | | | |
(Proceeds $98,872,703) | | | | | | | $(107,237,575 | ) |
| | | | | | | | |
| (a) | Non-income producing security. |
| (b) | Pledged security; a portion or all of the security is pledged as collateral for written options, securities sold short or borrowings as of March 31, 2014. (See Note 1 and Note 6) |
| (c) | Loaned security; a portion or all of the security is on loan as of March 31, 2014. |
| (d) | Security exempt from registration under Rule 144A of the Securities Act of 1933. These securities may be resold in transactions exempt from registration, normally to qualified institutional buyers. As of March 31, 2014, these securities had a total value of $18,440,801 or 6.02% of net assets. |
| (e) | Floating or variable rate security - rate disclosed as of March 31, 2014. |
| (f) | This security has no contractual maturity date, is not redeemable and contractually pays an indefinite stream of interest. |
| (g) | Rate shown represents the bond equivalent yield to maturity at date of purchase. |
| (h) | Includes cash which is being held as collateral for total return swap contracts. |
| | |
Annual Report | March 31, 2014 | | 19 |
| | |
Statement of Investments | | Clough Global Equity Fund |
| March 31, 2014 | | |
TOTAL RETURN SWAP CONTRACTS
| | | | | | | | | | | | | | | | | | | | | | |
| | | Reference | | | | | Floating Rate | | | Floating | | | | | | Net Unrealized | |
| Counter Party | | Entry/Obligation | | Notional Amount | | | Paid by the Fund | | | Rate Index | | | Termination Date | | | Appreciation | |
Morgan Stanley | | Housing Development Finance Corp. | | | $ 1,218,403 | | | | 30 bps + 1D FEDEF | | | | 1D FEDEF | | | | 01/15/2016 | | | | $ 98,363 | |
| | | | | | | | | | | | | | | | | | | | | | |
| | | | | $ 1,218,403 | | | | | | | | | | | | | | | | $ 98,363 | |
| | | | | | | | | | | | | | | | | | | | | | |
| | | | | | |
| | | Reference | | | | | Floating Rate | | | Floating | | | | | | Net Unrealized | |
| Counter Party | | Entry/Obligation | | Notional Amount | | | Paid by the Fund | | | Rate Index | | | Termination Date | | | Depreciation | |
Morgan Stanley | | Bharti Infratel, Ltd. | | | $ 2,468,093 | | | | 30 bps + 1D FEDEF | | | | 1D FEDEF | | | | 12/30/2014 | | | | $ (385,977 | ) |
| | | | | | | | | | | | | | | | | | | | | | |
| | | | | $ 2,468,093 | | | | | | | | | | | | | | | | $ (385,977 | ) |
| | | | | | | | | | | | | | | | | | | | | | |
See Notes to the Financial Statements.
| | |
Clough Global Opportunities Fund | | Statement of Investments |
| | March 31, 2014 |
| | | | | | | | |
| | | Shares | | | Value | |
COMMON STOCKS 121.70% | |
Consumer Discretionary 33.23% | |
Asbury Automotive Group, Inc.(a)(b)(c) | | | 174,943 | | | | $9,676,097 | |
AutoNation, Inc.(a)(b)(c) | | | 396,866 | | | | 21,125,177 | |
Beazer Homes USA, Inc.(a)(b)(c) | | | 413,215 | | | | 8,297,357 | |
Byd Co., Ltd. - Class H(a) | | | 273,438 | | | | 1,690,370 | |
Charter Communications, Inc. - Class A(a)(b)(c) | | | 115,500 | | | | 14,229,600 | |
Cia de Locacao das Americas(d) | | | 678,156 | | | | 1,022,165 | |
Comcast Corp. - Class A(b) | | | 141,800 | | | | 7,092,836 | |
Denso Corp. | | | 37,800 | | | | 1,812,085 | |
Don Quijote Co., Ltd. | | | 29,000 | | | | 1,497,554 | |
DR Horton, Inc.(b)(c) | | | 694,900 | | | | 15,044,585 | |
Group 1 Automotive, Inc.(b)(c) | | | 140,971 | | | | 9,256,156 | |
Imax Corp.(a)(b) | | | 152,300 | | | | 4,162,359 | |
Kate Spade & Co.(a)(b) | | | 87,458 | | | | 3,243,817 | |
Las Vegas Sands Corp.(b) | | | 32,503 | | | | 2,625,592 | |
Lennar Corp. - Class A(b)(c) | | | 410,000 | | | | 16,244,200 | |
Liberty Interactive Corp. - Class A(a)(b) | | | 182,302 | | | | 5,263,059 | |
Liberty Media Corp. - Class A(a)(b)(c) | | | 126,256 | | | | 16,505,447 | |
Liberty Ventures - Series A(a)(b)(c) | | | 145,245 | | | | 18,929,781 | |
Lithia Motors, Inc. - Class A(b)(c) | | | 171,136 | | | | 11,373,699 | |
Man Wah Holdings, Ltd. | | | 2,844,358 | | | | 4,803,853 | |
Orient-Express Hotels, Ltd. - Class A(a)(b) | | | 192,914 | | | | 2,779,891 | |
Penske Automotive Group, Inc.(b)(c) | | | 271,277 | | | | 11,599,805 | |
PulteGroup, Inc.(b) | | | 599,555 | | | | 11,505,460 | |
Samsonite International S.A. | | | 862,193 | | | | 2,667,780 | |
Service Corp. International(b) | | | 340,200 | | | | 6,763,176 | |
Signet Jewelers, Ltd.(b) | | | 61,700 | | | | 6,531,562 | |
Starbucks Corp.(b) | | | 109,100 | | | | 8,005,758 | |
Toll Brothers, Inc.(a) | | | 170,300 | | | | 6,113,770 | |
Wyndham Worldwide Corp.(b)(c) | | | 305,200 | | | | 22,349,796 | |
| | | | | | | | |
| | | | | | | 252,212,787 | |
| | | | | | | | |
|
Consumer Staples 1.53% | |
Brasil Pharma S.A.(a)(d) | | | 734,966 | | | | 1,240,599 | |
| | | | | | | | |
Suntory Beverage & Food, Ltd. | | | 44,500 | | | | 1,532,699 | |
Vinda International Holdings, Ltd. | | | 2,484,319 | | | | 3,612,856 | |
Whole Foods Market, Inc.(b) | | | 103,200 | | | | 5,233,272 | |
| | | | | | | | |
| | | | | | | 11,619,426 | |
| | | | | | | | |
| | | | | | | | |
| | | Shares | | | Value | |
Energy 19.15% | | | | | | | | |
Coal 0.26% | | | | | | | | |
Arch Coal, Inc. | | | 403,804 | | | | $1,946,335 | |
| | | | | | | | |
|
Natural Gas Leveraged Exploration & Production 3.76% | |
Antero Resources Corp.(a)(b) | | | 35,500 | | | | 2,222,300 | |
EOG Resources, Inc.(b) | | | 36,600 | | | | 7,179,822 | |
Gulfport Energy Corp.(a)(b) | | | 133,846 | | | | 9,527,158 | |
Rice Energy, Inc.(a)(b) | | | 133,300 | | | | 3,517,787 | |
Southwestern Energy Co.(a) | | | 132,300 | | | | 6,087,123 | |
| | | | | | | | |
| | | | | | | 28,534,190 | |
| | | | | | | | |
| |
Non-North American Producers 1.21% | | | | | |
InterOil Corp.(a)(b)(c) | | | 141,694 | | | | 9,176,104 | |
| | | | | | | | |
|
Oil Leveraged Exploration & Production 3.17% | |
Anadarko Petroleum Corp.(b) | | | 37,294 | | | | 3,161,039 | |
Concho Resources, Inc.(a)(b)(c) | | | 37,100 | | | | 4,544,750 | |
Hess Corp.(b) | | | 63,100 | | | | 5,229,728 | |
Occidental Petroleum Corp.(b) | | | 53,900 | | | | 5,136,131 | |
Stone Energy Corp.(a) | | | 66,317 | | | | 2,783,325 | |
Whiting Petroleum Corp.(a) | | | 46,700 | | | | 3,240,513 | |
| | | | | | | | |
| | | | | | | 24,095,486 | |
| | | | | | | | |
|
Oil Services & Drillers 4.32% | |
Halliburton Co.(b) | | | 127,300 | | | | 7,496,697 | |
Helmerich & Payne, Inc.(b)(c) | | | 47,100 | | | | 5,066,076 | |
Key Energy Services, Inc.(a) | | | 108,333 | | | | 1,000,997 | |
Nabors Industries, Ltd.(b)(c) | | | 167,100 | | | | 4,119,015 | |
Patterson-UTI Energy, Inc.(b)(c) | | | 159,800 | | | | 5,062,464 | |
Schlumberger, Ltd.(b) | | | 32,900 | | | | 3,207,750 | |
Superior Energy Services, Inc.(b) | | | 223,100 | | | | 6,862,556 | |
| | | | | | | | |
| | | | | | | 32,815,555 | |
| | | | | | | | |
| | |
Refiners 6.09% | | | | | | | | |
HollyFrontier Corp.(b) | | | 79,957 | | | | 3,804,354 | |
Marathon Petroleum Corp.(b)(c) | | | 148,200 | | | | 12,899,328 | |
Phillips 66(b) | | | 162,900 | | | | 12,553,074 | |
Tesoro Corp. | | | 55,100 | | | | 2,787,509 | |
Valero Energy Corp.(b) | | | 267,600 | | | | 14,209,560 | |
| | | | | | | | |
| | | | | | | 46,253,825 | |
| | | | | | | | |
| | |
Tankers 0.34% | | | | | | | | |
Golar LNG, Ltd.(b)(c) | | | 60,952 | | | | 2,541,089 | |
| | | | | | | | |
TOTAL ENERGY | | | | | | | 145,362,584 | |
| | | | | | | | |
| | |
Annual Report | March 31, 2014 | | 21 |
| | |
Statement of Investments | | Clough Global Opportunities Fund |
| March 31, 2014 | | |
| | | | | | | | |
| | | Shares | | | Value | |
Financials 21.46% | |
Capital Markets 2.84% | |
Daiwa Securities Group, Inc. | | | 772,000 | | | $ | 6,716,621 | |
Morgan Stanley(b)(c) | | | 401,813 | | | | 12,524,511 | |
Nomura Holdings, Inc. | | | 358,300 | | | | 2,298,063 | |
| | | | | | | | |
| | | | | | | 21,539,195 | |
| | | | | | | | |
Commercial Banks 3.63% | |
Grupo Financiero Banorte SAB de CV - Class O | | | 447,444 | | | | 3,025,915 | |
Mitsubishi UFJ Financial Group, Inc. | | | 375,400 | | | | 2,062,218 | |
Mizuho Financial Group, Inc. | | | 1,244,800 | | | | 2,460,294 | |
Sumitomo Mitsui Financial Group, Inc. | | | 56,200 | | | | 2,400,676 | |
Sumitomo Mitsui Trust Holdings, Inc. | | | 1,174,000 | | | | 5,300,431 | |
SunTrust Banks, Inc.(b) | | | 148,109 | | | | 5,893,257 | |
Wells Fargo & Co.(b) | | | 128,600 | | | | 6,396,564 | |
| | | | | | | | |
| | | | | | | 27,539,355 | |
| | | | | | | | |
Diversified Financials 6.38% | |
Atlas Mara Co.-Nvest, Ltd.(a)(d) | | | 487,322 | | | | 5,555,471 | |
Bank of America Corp.(b) | | | 833,410 | | | | 14,334,652 | |
Citigroup, Inc.(b) | | | 598,859 | | | | 28,505,688 | |
| | | | | | | | |
| | | | | | | 48,395,811 | |
| | | | | | | | |
Insurance 2.32% | |
Genworth Financial, Inc. - Class A(a)(b)(c) | | | 556,755 | | | | 9,871,266 | |
Hartford Financial Services Group, Inc.(b) | | | 218,380 | | | | 7,702,263 | |
| | | | | | | | |
| | | | | | | 17,573,529 | |
| | | | | | | | |
Real Estate Investment Trusts 4.95% | |
Colony Financial, Inc. | | | 198,500 | | | | 4,357,075 | |
Lexington Realty Trust | | | 272,400 | | | | 2,971,884 | |
MFA Financial, Inc. PennyMac Mortgage | | | 1,250,697 | | | | 9,692,902 | |
Investment Trust | | | 324,819 | | | | 7,763,174 | |
Select Income REIT(d) Two Harbors Investment | | | 77,000 | | | | 2,330,790 | |
Corp. | | | 1,023,800 | | | | 10,493,950 | |
| | | | | | | | |
| | | | | | | 37,609,775 | |
| | | | | | | | |
Real Estate Management & Development 1.03% | |
Altisource Residential Corp.(b) | | | 174,700 | | | | 5,513,532 | |
BHG S.A. - Brazil Hospitality Group(a) | | | 354,877 | | | | 2,339,780 | |
| | | | | | | | |
| | | | | | | 7,853,312 | |
| | | | | | | | |
| | | | | | | | |
| | | Shares | | | Value | |
Financials (continued) | |
Thrifts & Mortgage Finance 0.31% | |
MGIC Investment Corp.(a)(b) | | | 278,451 | | | $ | 2,372,402 | |
| | | | | | | | |
| |
TOTAL FINANCIALS | | | | 162,883,379 | |
| | | | | | | | |
Health Care 19.84% | | | | | | | | |
Aetna, Inc.(b)(c) | | | 108,762 | | | | 8,153,887 | |
Akorn, Inc.(a)(b)(c) | | | 274,300 | | | | 6,034,600 | |
Alkermes PLC(a)(b) | | | 44,000 | | | | 1,939,960 | |
Allergan, Inc.(b)(c) | | | 57,800 | | | | 7,172,980 | |
Astellas Pharma, Inc. | | | 482,000 | | | | 5,715,913 | |
Biogen Idec, Inc.(a)(b) | | | 12,931 | | | | 3,955,205 | |
Bristol-Myers Squibb Co.(b) | | | 250,100 | | | | 12,992,695 | |
Catamaran Corp.(a)(b)(c) | | | 159,300 | | | | 7,130,268 | |
Celgene Corp.(a) | | | 12,801 | | | | 1,787,020 | |
Centene Corp.(a)(b)(c) | | | 96,585 | | | | 6,012,416 | |
Community Health Systems, Inc.(a)(b) | | | 83,840 | | | | 3,284,013 | |
Forest Laboratories, Inc.(a)(b) | | | 35,329 | | | | 3,259,807 | |
Gilead Sciences, Inc.(a)(b) | | | 94,155 | | | | 6,671,823 | |
HCA Holdings, Inc.(a)(b) | | | 148,447 | | | | 7,793,467 | |
Healthways, Inc.(a) | | | 483,963 | | | | 8,295,126 | |
Intrexon Corp.(a)(b) | | | 152,359 | | | | 4,005,518 | |
Ironwood Pharmaceuticals, Inc.(a)(b)(c) | | | 318,300 | | | | 3,921,456 | |
Jazz Pharmaceuticals PLC(a)(b)(c) | | | 9,183 | | | | 1,273,498 | |
LifePoint Hospitals, Inc.(a)(b) | | | 82,508 | | | | 4,500,811 | |
McKesson Corp.(b) | | | 13,480 | | | | 2,380,164 | |
Medivation, Inc.(a)(b) | | | 32,300 | | | | 2,079,151 | |
Perrigo Co. PLC(b)(c) | | | 37,486 | | | | 5,797,585 | |
Pfizer, Inc.(b) | | | 19,300 | | | | 619,916 | |
Salix Pharmaceuticals, Ltd.(a)(b)(c) | | | 32,500 | | | | 3,367,325 | |
Sanofi - ADR(b) | | | 72,550 | | | | 3,792,914 | |
Sinopharm Group Co., Ltd. - Class H | | | 1,420,000 | | | | 3,890,286 | |
Team Health Holdings, Inc.(a)(b) | | | 70,693 | | | | 3,163,512 | |
Teva Pharmaceutical Industries, Ltd. - ADR | | | 117,400 | | | | 6,203,416 | |
Towa Pharmaceutical Co., Ltd. | | | 22,663 | | | | 978,188 | |
UnitedHealth Group, Inc.(b)(c) | | | 39,700 | | | | 3,255,003 | |
Veracyte, Inc.(a)(b) | | | 32,000 | | | | 548,160 | |
WellPoint, Inc.(b)(c) | | | 106,700 | | | | 10,621,985 | |
| | | | | | | | |
| | | | | | | 150,598,068 | |
| | | | | | | | |
Industrials 12.65% | |
Allison Transmission | | | | | | | | |
Holdings, Inc.(b)(c)(d) | | | 560,562 | | | | 16,783,226 | |
Brenntag AG | | | 23,500 | | | | 4,359,286 | |
| | |
Clough Global Opportunities Fund | | Statement of Investments |
| | March 31, 2014 |
| | | | | | | | |
| | | Shares | | | Value | |
Industrials (continued) | | | | | | | | |
Delta Air Lines, Inc.(b)(c) | | | 426,200 | | | $ | 14,767,830 | |
Empresas ICA SAB de CV(a) | | | 1,019,764 | | | | 1,702,796 | |
Empresas ICA SAB de CV - ADR(a)(b)(c) | | | 67,240 | | | | 443,112 | |
FLIR Systems, Inc.(b) | | | 409,400 | | | | 14,738,400 | |
Mitsubishi Heavy Industries, Ltd. | | | 768,000 | | | | 4,442,145 | |
Scorpio Bulkers, Inc.(a)(b) | | | 226,600 | | | | 2,290,926 | |
Sumitomo Corp. | | | 157,725 | | | | 2,006,423 | |
United Continental Holdings, Inc.(a)(b)(c) | | | 376,203 | | | | 16,789,940 | |
Verisk Analytics, Inc. - Class A(a) | | | 24,613 | | | | 1,475,796 | |
ViaSat, Inc.(a)(b)(c) | | | 201,535 | | | | 13,913,976 | |
Wesco Aircraft Holdings, Inc.(a)(b) | | | 105,100 | | | | 2,313,251 | |
| | | | | | | | |
| | | | | | | 96,027,107 | |
| | | | | | | | |
| |
Information Technology 9.94% | | | | | |
eBay, Inc.(a)(b) | | | 220,307 | | | | 12,169,759 | |
EVERTEC, Inc.(b) | | | 157,945 | | | | 3,901,241 | |
Google, Inc. -
Class A(a)(b)(c) | | | 13,423 | | | | 14,960,068 | |
Hoya Corp. | | | 82,400 | | | | 2,565,046 | |
NXP Semiconductor
NV(a)(b) | | | 169,386 | | | | 9,961,591 | |
Samsung Electronics Co., Ltd. | | | 2,334 | | | | 2,944,771 | |
Seagate Technology(b)(c) | | | 62,800 | | | | 3,526,848 | |
Western Digital Corp.(b) | | | 32,800 | | | | 3,011,696 | |
Western Union Co.(b)(c) | | | 1,369,600 | | | | 22,406,656 | |
| | | | | | | | |
| | | | | | | 75,447,676 | |
| | | | | | | | |
| | |
Materials 3.18% | | | | | | | | |
Berry Plastics Group, Inc.(a)(b) | | | 306,950 | | | | 7,105,892 | |
Graphic Packaging Holding Co.(a)(b) | | | 648,732 | | | | 6,591,117 | |
Taminco Corp.(a)(b)(c) | | | 194,100 | | | | 4,078,041 | |
WR Grace & Co.(a)(b) | | | 64,200 | | | | 6,366,714 | |
| | | | | | | | |
| | | | | | | 24,141,764 | |
| | | | | | | | |
|
Telecommunication Services 0.72% | |
Nippon Telegraph & Telephone Corp. | | | 100,700 | | | | 5,482,084 | |
| | | | | | | | |
| |
TOTAL COMMON STOCKS (Cost $847,484,661) | | | | 923,774,875 | |
| | | | | | | | |
| | | | | | | | |
| | | Shares | | | Value | |
EXCHANGE TRADED FUNDS 1.49% | |
iShares® MSCI Mexico Capped ETF(b) | | | 44,900 | | | $ | 2,871,355 | |
SPDR® Gold
Shares(a)(b) | | | 68,410 | | | | 8,456,160 | |
| | | | | | | | |
| | | | | | | 11,327,515 | |
| | | | | | | | |
TOTAL EXCHANGE TRADED FUNDS (Cost $11,765,778) | | | | 11,327,515 | |
| | | | | | | | |
WARRANTS 0.10% | | | | | | | | |
Atlas Mara Co.-Nvest, Ltd., Strike price $11.50, Expires 12/17/2017(a)(d) | | | 487,322 | | | | 730,983 | |
| | | | | | | | |
TOTAL WARRANTS (Cost $4,873) | | | | 730,983 | |
| | | | | | | | |
| | |
Description and Maturity Date | | Principal
Amount | | | Value | |
CORPORATE BONDS 7.19% | | | | | |
Bank of America Corp.
Series U, Perpetual Maturity,
5.200%(b)(e)(f) | | $ | 6,785,000 | | | | 6,411,825 | |
Bank of New York Mellon Corp.
Series D, Perpetual Maturity,
4.500%(b)(e)(f) | | | 6,740,000 | | | | 6,150,250 | |
Citigroup, Inc.
Perpetual Maturity, 5.950% (b)(e)(f) | | | 1,845,000 | | | | 1,805,794 | |
Series D, Perpetual Maturity,
5.350%(b)(e)(f) | | | 3,645,000 | | | | 3,395,941 | |
Crown Americas LLC / Crown Americas Capital Corp.
IV Series WI, 01/15/2023,
4.500%(b) | | | 3,350,000 | | | | 3,216,000 | |
Eaton Vance Corp.
06/15/2023,
3.625% (b) | | | 3,250,000 | | | | 3,244,182 | |
General Electric Capital Corp.
Series C, Perpetual Maturity,
5.250%(b)(e)(f) | | | 2,410,000 | | | | 2,350,232 | |
General Motors Co.
10/02/2023,
4.875% (b)(d) | | | 4,300,000 | | | | 4,429,000 | |
JPMorgan Chase & Co. Series Q, Perpetual Maturity,
5.150%(b)(e)(f) | | | 6,100,000 | | | | 5,749,250 | |
M&T Bank Corp. Perpetual Maturity, 6.875% (b)(d)(f) | | | 3,610,000 | | | | 3,629,050 | |
| | |
Annual Report | March 31, 2014 | | 23 |
| | |
Statement of Investments | | Clough Global Opportunities Fund |
| March 31, 2014 | | |
| | | | | | | | |
Description and Maturity Date | | Principal
Amount | | | Value | |
CORPORATE BONDS (continued) | | | | | |
PNC Financial Services Group, Inc., Series R, Perpetual Maturity, 4.850%(b)(e)(f) | | $ | 6,060,000 | | | $ | 5,696,400 | |
Provident Bank of Maryland
05/01/2018, 9.500% (b) | | | 4,000,000 | | | | 4,016,728 | |
Zions Bancorporation Perpetual Maturity, 5.800% (b)(e)(f) | | | 4,760,000 | | | | 4,450,600 | |
| | | | | | | | |
TOTAL CORPORATE BONDS (Cost $53,292,921) | | | | | | | 54,545,252 | |
| | | | | | | | |
ASSET/MORTGAGE BACKED SECURITIES 0.42% | |
Fannie Mae REMICS Series 2013-100, Class MS, 06/25/2043, 3.846%(b)(e) | | | 3,442,235 | | | | 3,209,850 | |
| | | | | | | | |
TOTAL ASSET/MORTGAGE BACKED SECURITIES (Cost $3,255,064) | | | | 3,209,850 | |
| | | | | | | | |
GOVERNMENT & AGENCY OBLIGATIONS 5.00% | |
U.S. Treasury Bonds | | | | | | | | |
11/15/2018, 3.750% (b) | | | 6,400,000 | | | | 7,019,750 | |
05/15/2021, 3.125% (b) | | | 8,700,000 | | | | 9,166,607 | |
02/15/2022, 2.000% (b) | | | 13,100,000 | | | | 12,668,617 | |
11/15/2028, 5.250% (b) | | | 7,300,000 | | | | 9,128,424 | |
| | | | | | | | |
TOTAL GOVERNMENT & AGENCY OBLIGATIONS (Cost $38,229,134) | | | | 37,983,398 | |
| | | | | | | | |
| | |
| | | Number of
Contracts | | | Value | |
PURCHASED OPTIONS 0.15% | |
Put Options Purchased 0.15% | |
S&P 500® Index, Expires April 2014,
Exercise Price $1,840.00 | | | 1,200 | | | | 1,110,000 | |
| | | | | | | | |
TOTAL PURCHASED OPTIONS (Cost $3,122,448) | | | | 1,110,000 | |
| | | | | | | | |
| | |
| | | Shares | | | Value | |
SHORT-TERM INVESTMENTS 12.22% | |
Money Market Fund 11.70% | |
Morgan Stanley Institutional Liquidity Funds - Prime Portfolio (0.055% 7-day yield) | | | 88,791,265 | | | | 88,791,265 | |
| | | | | | | | |
| | | | | | | | |
| | | Principal
Amount | | | Value | |
SHORT-TERM INVESTMENTS (continued) | |
U.S. Treasury Bills 0.52% | | | | | |
U.S. Treasury Bills Discount Notes 04/24/2014, 0.049%(b)(g) | | | $4,000,000 | | | | $3,999,871 | |
| | | | | | | | |
TOTAL SHORT-TERM INVESTMENTS (Cost $92,791,136) | | | | 92,791,136 | |
| | | | | | | | |
| |
Total Investments - 148.27% (Cost $1,049,946,015) | | | | 1,125,473,009 | |
| | |
Liabilities in Excess of Other Assets - (48.27%)(h) | | | | | | | (366,388,884) | |
| | | | | | | | |
| |
NET ASSETS - 100.00% | | | | $759,084,125 | |
| | | | | | | | |
| | |
SCHEDULE OF WRITTEN
OPTIONS | | Number of
Contracts | | | Value | |
PUT OPTIONS WRITTEN (0.03%) | |
S&P 500® Index, Expires April 2014, Exercise Price $1,760.00 | | | (1,200) | | | | $(246,000) | |
| | | | | | | | |
TOTAL PUT OPTIONS WRITTEN (Premiums received $1,197,552) | | | | $(246,000) | |
| | | | | | | | |
| | |
SCHEDULE OF SECURITIES
SOLD SHORT (a) | | Shares | | | Value | |
COMMON STOCKS (17.11%) | | | | | |
Consumer Discretionary (1.30%) | |
CarMax, Inc. | | | (82,100) | | | | $(3,842,280) | |
Johnson Controls, Inc. | | | (81,700) | | | | (3,866,044) | |
Yamada Denki Co., Ltd. | | | (655,520) | | | | (2,184,749) | |
| | | | | | | | |
| | | | | | | (9,893,073) | |
| | | | | | | | |
| |
Financials (3.23%) | | | | | |
Capital Markets (0.70%) | | | | | |
Deutsche Bank AG | | | (86,204) | | | | (3,864,525) | |
Mediobanca SpA | | | (124,855) | | | | (1,427,661) | |
| | | | | | | | |
| | | | | | | (5,292,186) | |
| | | | | | | | |
| |
Commercial Banks (1.75%) | | | | | |
Banco Bilbao Vizcaya
Argentaria S.A. - ADR | | | (32,850) | | | | (394,528) | |
Banco Santander S.A. | | | (207,266) | | | | (1,976,233) | |
Credit Agricole S.A. | | | (151,456) | | | | (2,388,050) | |
HSBC Holdings PLC | | | (296,400) | | | | (3,001,640) | |
Societe Generale S.A. | | | (78,414) | | | | (4,829,374) | |
UniCredit SpA | | | (80,266) | | | | (733,139) | |
| | | | | | | | |
| | | | | | | (13,322,964) | |
| | | | | | | | |
| | |
Clough Global Opportunities Fund | | Statement of Investments |
| | March 31, 2014 |
| | | | | | | | |
SCHEDULE OF SECURITIES
SOLD SHORT(a) | | Shares | | | Value | |
Financials (continued) | | | | | | | | |
Insurance (0.78%) | | | | | |
Everest Re Group, Ltd. | | | (18,793) | | | $ | (2,876,269) | |
PartnerRe, Ltd. | | | (29,400) | | | | (3,042,900) | |
| | | | | | | | |
| | | | | | | (5,919,169) | |
| | | | | | | | |
TOTAL FINANCIALS | | | | | | | (24,534,319) | |
| | | | | | | | |
| |
Health Care (6.00%) | | | | | |
Baxter International, Inc. | | | (73,600) | | | | (5,415,488) | |
Charles River Laboratories International, Inc. | | | (75,600) | | | | (4,561,704) | |
Covance, Inc. | | | (35,550) | | | | (3,693,645) | |
Hanger, Inc. | | | (34,752) | | | | (1,170,448) | |
Healthcare Services Group, Inc. | | | (83,200) | | | | (2,417,792) | |
Intuitive Surgical, Inc. | | | (4,867) | | | | (2,131,697) | |
Laboratory Corp. of America Holdings | | | (31,500) | | | | (3,093,615) | |
Merck & Co., Inc. | | | (100,500) | | | | (5,705,385) | |
Owens & Minor, Inc. | | | (77,200) | | | | (2,704,316) | |
Quest Diagnostics, Inc. | | | (53,900) | | | | (3,121,888) | |
ResMed, Inc. | | | (134,400) | | | | (6,006,336) | |
St. Jude Medical, Inc. | | | (49,800) | | | | (3,256,422) | |
Waters Corp. | | | (20,700) | | | | (2,244,087) | |
| | | | | | | | |
| | | | | | | (45,522,823) | |
| | | | | | | | |
| |
Industrials (3.62%) | | | | | |
Atlas Copco AB - A Shares | | | (235,433) | | | | (6,791,302) | |
Bombardier, Inc. - Class B | | | (835,168) | | | | (3,104,966) | |
Caterpillar, Inc. | | | (26,700) | | | | (2,653,179) | |
Emerson Electric Co. | | | (85,200) | | | | (5,691,360) | |
Mitsui & Co., Ltd. | | | (210,200) | | | | (2,971,291) | |
Sandvik AB | | | (443,255) | | | | (6,262,947) | |
| | | | | | | | |
| | | | | | | (27,475,045) | |
| | | | | | | | |
| | |
Materials (2.96%) | | | | | | | | |
Bemis Co., Inc. | | | (74,700) | | | | (2,931,228) | |
BHP Billiton, Ltd. | | | (117,293) | | | | (3,967,129) | |
Cliffs Natural Resources, Inc. | | | (146,936) | | | | (3,006,311) | |
Freeport-McMoRan Copper & Gold, Inc. | | | (70,100) | | | | (2,318,207) | |
Glencore Xstrata PLC | | | (1,250,404) | | | | (6,437,236) | |
United States Steel Corp. | | | (137,000) | | | | (3,782,570) | |
| | | | | | | | |
| | | | | | | (22,442,681) | |
| | | | | | | | |
| |
TOTAL COMMON STOCKS (Proceeds $122,818,389) | | | | (129,867,941) | |
| | | | | | | | |
|
EXCHANGE TRADED FUNDS (18.16%) | |
Health Care Select Sector SPDR® Fund | | | (247,700) | | | | (14,487,973) | |
iShares® China Large Cap ETF | | | (308,269) | | | | (11,029,865) | |
iShares® MSCI Emerging Markets Fund | | | (259,506) | | | | (10,637,151) | |
| | | | | | | | |
SCHEDULE OF SECURITIES
SOLD SHORT(a) | | Shares | | | Value | |
EXCHANGE TRADED FUNDS (continued) | |
iShares® MSCI South Korea Capped Fund | | | (47,700) | | | $ | (2,933,550) | |
iShares® Nasdaq Biotechnology ETF | | | (7,701) | | | | (1,820,902) | |
iShares® Russell 2000® Fund | | | (582,800) | | | | (67,802,952) | |
SPDR® S&P 500® ETF Trust | | | (153,350) | | | | (28,682,584) | |
United States Natural Gas Fund LP | | | (19,451) | | | | (474,993) | |
| | | | | | | | |
| |
TOTAL EXCHANGE TRADED FUNDS (Proceeds $124,085,285) | | | | (137,869,970) | |
| | | | | | | | |
| |
TOTAL SECURITIES SOLD SHORT
(Proceeds $246,903,674) | | | $ | (267,737,911) | |
| | | | | | | | |
| (a) | Non-income producing security. |
| (b) | Pledged security; a portion or all of the security is pledged as collateral for written options, securities sold short or borrowings as of March 31, 2014. (See Note 1 and Note 6) (c) Loaned security; a portion or all of the security is on loan as of March 31, 2014. |
| (d) | Security exempt from registration under Rule 144A of the Securities Act of 1933. These securities may be resold in transactions exempt from registration, normally to qualified institutional buyers. As of March 31, 2014, these securities had a total value of $35,721,284 or 4.71% of net assets. |
| (e) | Floating or variable rate security - rate disclosed as of March 31, 2014. |
| (f) | This security has no contractual maturity date, is not redeemable and contractually pays an indefinite stream of interest. |
| (g) | Rate shown represents the bond equivalent yield to maturity at date of purchase. |
| (h) | Includes cash which is being held as collateral for total return swap contracts. |
| | |
Annual Report | March 31, 2014 | | 25 |
| | |
Statement of Investments | | Clough Global Opportunities Fund |
| March 31, 2014 | | |
TOTAL RETURN SWAP CONTRACTS
| | | | | | | | | | | | | | | | | | | | | | |
| Counter Party | | Reference
Entry/
Obligation | | Notional Amount | | | Floating Rate Paid by the Fund | | | Floating Rate Index | | | Termination Date | | | Net Unrealized
Appreciation | |
Morgan Stanley | | Housing Development
Finance Corp. | | $ | 3,033,286 | | | | 30 bps + 1D FEDEF | | | | 1D FEDEF | | | | 01/15/2016 | | | $ | 244,881 | |
| | | | | | | | | | | | | | | | | | | | | | |
| | | | $ | 3,033,286 | | | | | | | | | | | | | | | $ | 244,881 | |
| | | | | | | | | | | | | | | | | | | | | | |
| | | | | | |
| Counter Party | | Reference
Entry/
Obligation | | Notional Amount | | | Floating Rate Paid by the Fund | | | Floating Rate Index | | | Termination
Date | | | Net Unrealized
Depreciation | |
Morgan Stanley | | Bharti
Infratel, Ltd. | | $ | 6,471,229 | | | | 30 bps + 1D FEDEF | | | | 1D FEDEF | | | | 12/30/2014 | | | $ | (1,012,014) | |
| | | | | | | | | | | | | | | | | | | | | | |
| | | | $ | 6,471,229 | | | | | | | | | | | | | | | $ | (1,012,014) | |
| | | | | | | | | | | | | | | | | | | | | | |
See Notes to the Financial Statements.
| | |
Clough Global Funds | | Statement of Investments |
| | March 31, 2014 |
Abbreviations:
1D FEDEF - Federal Funds Effective Rate (Daily)
AB - Aktiebolag is the Swedish equivalent of the term corporation
ADR - American Depositary Receipt
AG - Aktiengesellschaft is a German term that refers to a corporation that is limited by shares, i.e., owned by shareholders
Bps - Basis Points
ETF - Exchange Traded Fund
LLC - Limited Liability Corporation
LP - Limited Partnership
Ltd. - Limited
MSCI - Morgan Stanley Capital International
NV - Naamloze Vennootschap (Dutch: Limited Liability Company)
PLC - Public Limited Liability
REIT - Real Estate Investment Trust
S.A. - Generally designates corporations in various countries, mostly those employing the civil law
SpA - Societa` Per Azioni is an Italian shared company
SAB de CV - Sociedad Anonima de Capital Variable (Spanish Variable Capital Company)
S&P - Standard & Poor’s
SPDR - Standard & Poor’s Depositary Receipt
For Fund compliance purposes, each Fund’s industry classifications refer to any one of the industry sub-classifications used by one or more widely recognized market indexes, and/or as defined by each Fund’s management. This definition may not apply for purposes of this report, which may combine industry sub-classifications for reporting ease. Industries are shown as a percent of net assets. These industry classifications are unaudited.
See Notes to the Financial Statements.
| | |
Annual Report | March 31, 2014 | | 27 |
| | |
| Statements of Assets and Liabilities | | Clough Global Funds |
| March 31, 2014 | | |
| | | | | | | | | | | | | | |
| | | Clough Global
Allocation Fund | | | Clough Global
Equity Fund | | | Clough Global
Opportunities Fund |
ASSETS: | | | | | | | | | | | | | | |
| | | | |
Investments, at value (Cost - see below)(a) | | $ | 270,293,208 | | | $ | 452,410,821 | | | $ | 1,125,473,009 | | | |
Cash | | | 2,244,152 | | | | 3,818,086 | | | | 10,085,407 | | | |
Deposit with broker for written options and securities sold short | | | 74,758,704 | | | | 126,072,865 | | | | 310,459,054 | | | |
Deposit with broker for total return swap contracts | | | 2,262,020 | | | | 3,687,093 | | | | 9,505,985 | | | |
Unrealized appreciation on total return swap contracts | | | 58,662 | | | | 98,363 | | | | 244,881 | | | |
Dividends receivable | | | 285,097 | | | | 516,155 | | | | 1,195,055 | | | |
Interest receivable | | | 371,782 | | | | 478,997 | | | | 1,448,084 | | | |
Receivable for investments sold | | | 12,363,499 | | | | 17,193,279 | | | | 47,197,368 | | | |
Total Assets | | | 362,637,124 | | | | 604,275,659 | | | | 1,505,608,843 | | | |
| | | | |
LIABILITIES: | | | | | | | | | | | | | | |
| | | | |
Foreign currency due to custodian (Cost $164,619, $267,888 and $681,493) | | | 162,757 | | | | 264,940 | | | | 673,983 | | | |
Loan payable | | | 93,300,000 | | | | 156,000,000 | | | | 388,900,000 | | | |
Interest due on loan payable | | | 10,187 | | | | 17,033 | | | | 42,462 | | | |
Securities sold short (Proceeds $58,995,346, $98,872,703 and $246,903,674) | | | 63,959,810 | | | | 107,237,575 | | | | 267,737,911 | | | |
Written options, at value (Premiums received $299,388, $498,980 and $1,197,552) | | | 61,500 | | | | 102,500 | | | | 246,000 | | | |
Payable for investments purchased | | | 21,732,184 | | | | 33,470,103 | | | | 85,688,369 | | | |
Unrealized depreciation on total return swap contracts | | | 240,059 | | | | 385,977 | | | | 1,012,014 | | | |
Dividends payable - short sales | | | 97,718 | | | | 161,443 | | | | 410,491 | | | |
Interest payable - margin account | | | 36,104 | | | | 60,641 | | | | 151,078 | | | |
Accrued investment advisory fee | | | 211,468 | | | | 453,394 | | | | 1,257,341 | | | |
Accrued administration fee | | | 86,098 | | | | 161,206 | | | | 402,349 | | | |
Accrued trustees fee | | | 2,500 | | | | 2,500 | | | | 2,500 | | | |
Other payables and accrued expenses | | | 220 | | | | 220 | | | | 220 | | | |
Total Liabilities | | | 179,900,605 | | | | 298,317,532 | | | | 746,524,718 | | | |
Net Assets | | $ | 182,736,519 | | | $ | 305,958,127 | | | $ | 759,084,125 | | | |
| | | | | | | | | | | | | | | |
Cost of Investments | | $ | 254,272,824 | | | $ | 417,202,054 | | | $ | 1,049,946,015 | | | |
| | | | | | | | | | | | | | | |
| | | | |
COMPOSITION OF NET ASSETS: | | | | | | | | | | | | | | |
| | | | |
Paid-in capital | | $ | 166,087,962 | | | $ | 266,419,905 | | | $ | 714,484,492 | | | |
Overdistributed net investment income | | | (25,714) | | | | (58,333) | | | | (4,669,930) | | | |
Accumulated net realized gain/(loss) on investment securities, written options, securities sold short, total return swap contracts and foreign currency transactions | | | 5,561,725 | | | | 12,643,942 | | | | (5,607,938) | | | |
Net unrealized appreciation in value of investment securities, written options, securities sold short, total return swap contracts and translation of assets and liabilities denominated in foreign currency | | | 11,112,546 | | | | 26,952,613 | | | | 54,877,501 | | | |
Net Assets | | $ | 182,736,519 | | | $ | 305,958,127 | | | $ | 759,084,125 | | | |
| | | | | | | | | | | | | | | |
Shares of common stock outstanding of no par value, unlimited shares authorized | | | 10,434,606 | | | | 17,840,705 | | | | 51,736,859 | | | |
| | | | | | | | | | | | | | | |
Net assets value per share | | $ | 17.51 | | | $ | 17.15 | | | $ | 14.67 | | | |
| | | | | | | | | | | | | | | |
| | | | |
(a) Securities Loaned, at value | | $ | 17,656,495 | | | $ | 29,895,511 | | | $ | 78,397,982 | | | |
See Notes to the Financial Statements.
| | |
Clough Global Funds | | Statements of Operations |
| | For the Year Ended March 31, 2014 |
| | | | | | | | | | | | | | |
| | | Clough Global
Allocation Fund | | | Clough Global
Equity Fund | | | Clough Global
Opportunities Fund |
INVESTMENT INCOME: | | | | | | | | | | | | | | |
| | | | |
Dividends (net of foreign withholding taxes of $43,260, $75,463 and $182,695) | | $ | 2,404,817 | | | $ | 4,306,515 | | | $ | 9,635,289 | | | |
Interest on investment securities | | | 800,213 | | | | 818,628 | | | | 3,249,449 | | | |
Hypothecated securities income (See Note 6) | | | 222,440 | | | | 373,396 | | | | 1,012,655 | | | |
Total Income | | | 3,427,470 | | | | 5,498,539 | | | | 13,897,393 | | | |
| | | | |
EXPENSES: | | | | | | | | | | | | | | |
| | | | |
Investment advisory fee | | | 2,439,482 | | | | 5,208,740 | | | | 14,660,276 | | | |
Administration fee | | | 993,217 | | | | 1,851,996 | | | | 4,691,289 | | | |
Interest on loan | | | 922,380 | | | | 1,518,062 | | | | 3,956,800 | | | |
Interest expense - margin account | | | 400,975 | | | | 672,991 | | | | 1,684,402 | | | |
Trustees fee | | | 133,372 | | | | 133,372 | | | | 133,371 | | | |
Dividend expense - short sales | | | 1,236,143 | | | | 2,070,138 | | | | 5,201,889 | | | |
Other expenses | | | 2,650 | | | | 2,631 | | | | 2,875 | | | |
Total Expenses | | | 6,128,219 | | | | 11,457,930 | | | | 30,330,902 | | | |
Net Investment Loss | | | (2,700,749) | | | | (5,959,391 | ) | | | (16,433,509) | | | |
| | | | |
NET REALIZED GAIN/(LOSS) ON: | | | | | | | | | | | | | | |
Investment securities | | | 33,757,575 | | | | 59,677,261 | | | | 154,280,979 | | | |
Securities sold short | | | (11,724,746) | | | | (19,377,471) | | | | (49,230,469) | | | |
Written options | | | 1,157,134 | | | | 2,132,270 | | | | 2,518,366 | | | |
Total return swap contracts | | | (397,065) | | | | (778,872) | | | | (1,681,206) | | | |
Foreign currency transactions | | | (1,364,844) | | | | (2,282,452) | | | | (5,764,401) | | | |
NET CHANGE IN UNREALIZED APPRECIATION/(DEPRECIATION) ON: | | | | | | | | | | | | | | |
Investment securities | | | 1,545,066 | | | | 7,138,315 | | | | 1,301,682 | | | |
Securities sold short | | | (3,663,378) | | | | (6,297,210) | | | | (15,331,017) | | | |
Written options | | | 237,888 | | | | 396,480 | | | | 951,552 | | | |
Total return swap contracts | | | 387,137 | | | | 912,341 | | | | 1,634,232 | | | |
Translation of assets and liabilities denominated in foreign currencies | | | 1,667 | | | | 2,278 | | | | 6,869 | | | |
Net gain on investment securities, securities sold short, written options, total return swap contracts and foreign currency transactions | | | 19,936,434 | | | | 41,522,940 | | | | 88,686,587 | | | |
Net Increase in Net Assets Attributable to Common Shares from Operations | | $ | 17,235,685 | | | $ | 35,563,549 | | | $ | 72,253,078 | | | |
| | | | | | | | | | | | | | | |
See Notes to the Financial Statements.
| | |
Annual Report | March 31, 2014 | | 29 |
| | |
Statements of Changes in Net Assets | | Clough Global Funds |
| | |
| | | | | | | | | | | | | | | | | | | | | | | | | | |
| | | Clough Global Allocation Fund | | | Clough Global Equity Fund | | | Clough Global Opportunities Fund | | | |
| | | For the Year��Ended March 31, 2014 | | | For the Year Ended March 31, 2013 | | | For the Year Ended March 31, 2014 | | | For the Year Ended March 31, 2013 | | | For the Year Ended March 31, 2014 | | | For the Year Ended March 31, 2013 | | | |
| |
COMMON SHAREHOLDERS OPERATIONS: | | | |
| | | | | | | |
Net investment loss | | $ | (2,700,749) | | | $ | (69,712) | | | $ | (5,959,391) | | | $ | (983,944) | | | $ | (16,433,509) | | | $ | (4,407,866) | | | |
Net realized gain/(loss) from: | | | | | | | | | | | | | | | | | | | | | | | | | | |
Investment securities | | | 33,757,575 | | | | 24,958,582 | | | | 59,677,261 | | | | 40,944,160 | | | | 154,280,979 | | | | 85,789,337 | | | |
Securities sold short | | | (11,724,746) | | | | 3,273,485 | | | | (19,377,471) | | | | 5,058,198 | | | | (49,230,469) | | | | 14,018,291 | | | |
Written options | | | 1,157,134 | | | | 1,756,731 | | | | 2,132,270 | | | | 2,891,304 | | | | 2,518,366 | | | | 7,011,300 | | | |
Total return swap contracts | | | (397,065) | | | | (112,013) | | | | (778,872) | | | | (174,134) | | | | (1,681,206) | | | | (473,796) | | | |
Foreign currency transactions | | | (1,364,844) | | | | (736,407) | | | | (2,282,452) | | | | (1,185,512) | | | | (5,764,401) | | | | (3,066,474) | | | |
Net change in urealized appreciation/(depreciation) on: | | | | | | | | | | | | | | | | | | | | | | | | | | |
Investment securities | | | 1,545,066 | | | | (2,632,864) | | | | 7,138,315 | | | | (1,538,547) | | | | 1,301,682 | | | | 9,736,891 | | | |
Securities sold short | | | (3,663,378) | | | | (2,291,702) | | | | (6,297,210) | | | | (3,687,914) | | | | (15,331,017) | | | | (9,730,672) | | | |
Written options | | | 237,888 | | | | 135,484 | | | | 396,480 | | | | 223,842 | | | | 951,552 | | | | 650,071 | | | |
Total return swap contracts | | | 387,137 | | | | (568,534) | | | | 912,341 | | | | (1,199,955) | | | | 1,634,232 | | | | (2,401,365) | | | |
Foreign currency transactions | | | 1,667 | | | | (2,585) | | | | 2,278 | | | | (4,143) | | | | 6,869 | | | | (11,019) | | | |
Net Increase in Net Assets From Operations | | | 17,235,685 | | | | 23,710,465 | | | | 35,563,549 | | | | 40,343,355 | | | | 72,253,078 | | | | 97,114,698 | | | |
| |
DISTRIBUTIONS TO COMMON SHAREHOLDERS: | | | |
| | | | | | | |
Net investment income | | | (2,508,129) | | | | (9,391,145) | | | | (6,725,986) | | | | (15,521,413) | | | | (5,714,309) | | | | (55,875,807) | | | |
Net realized gains | | | (13,300,299) | | | | (3,130,382) | | | | (19,589,053) | | | | (5,173,804) | | | | (64,906,503) | | | | – | | | |
Net Decrease in Net Assets from Distributions | | | (15,808,428) | | | | (12,521,527) | | | | (26,315,039) | | | | (20,695,217) | | | | (70,620,812) | | | | (55,875,807) | | | |
Net Increase in Net Assets Attributable to Common Shares | | | 1,427,257 | | | | 11,188,938 | | | | 9,248,510 | | | | 19,648,138 | | | | 1,632,266 | | | | 41,238,891 | | | |
| |
NET ASSETS ATTRIBUABLE TO COMMON SHARES: | | | |
| | | | | | | |
Beginning of period | | | 181,309,262 | | | | 170,120,324 | | | | 296,709,617 | | | | 277,061,479 | | | | 757,451,859 | | | | 716,212,968 | | | |
End of period* | | $ | 182,736,519 | | | $ | 181,309,262 | | | $ | 305,958,127 | | | $ | 296,709,617 | | | $ | 759,084,125 | | | $ | 757,451,859 | | | |
| | | | | | | | | | | | | | | | | | | | | | | | | | | |
*Includes Overdistributed Net Investment Income of: | | $ | (25,714) | | | $ | (1,019,963) | | | $ | (58,333) | | | $ | (2,013,693) | | | $ | (4,669,930) | | | $ | (5,320,120) | | | |
See Notes to the Financial Statements.
| | |
Clough Global Funds | | Statements of Cash Flows |
| | For the Year Ended March 31, 2014 |
| | | | | | | | | | | | | | |
| | | Clough Global
Allocation Fund | | | Clough Global
Equity Fund | | | Clough Global
Opportunities Fund |
CASH FLOWS FROM OPERATING ACTIVITIES: | | | | | | | | | | | | | | |
Net increase in net assets from operations | | $ | 17,235,685 | | | $ | 35,563,549 | | | $ | 72,253,078 | | | |
Adjustments to reconcile net increase/(decrease) in net assets from operations to net cash provided by operating activities: | | | | | | | | | | | | | | |
Purchase of investment securities | | | (433,037,075) | | | | (686,514,711) | | | | (1,792,763,035) | | | |
Proceeds from disposition of investment securities | | | 479,320,220 | | | | 759,969,777 | | | | 2,011,048,103 | | | |
Proceeds from securities sold short transactions | | | 229,586,058 | | | | 383,510,232 | | | | 974,663,385 | | | |
Cover securities sold short transactions | | | (248,043,344) | | | | (415,504,252) | | | | (1,054,593,097) | | | |
Premiums received from written options transactions | | | 2,697,925 | | | | 4,491,177 | | | | 9,640,740 | | | |
Premiums paid on closing written options transactions | | | (1,241,403) | | | | (1,859,927) | | | | (5,924,822) | | | |
Purchased options transactions | | | (6,057,666) | | | | (10,096,110) | | | | (21,691,930) | | | |
Proceeds from purchased options transactions | | | 1,676,696 | | | | 2,794,493 | | | | 9,256,788 | | | |
Net purchases of short-term investment securities | | | (2,778,652) | | | | (2,637,130) | | | | (15,607,391) | | | |
Net realized gain from investment securities | | | (33,757,575) | | | | (59,677,261) | | | | (154,280,979) | | | |
Net realized loss on securities sold short | | | 11,724,746 | | | | 19,377,471 | | | | 49,230,469 | | | |
Net realized gain on written options | | | (1,157,134) | | | | (2,132,270) | | | | (2,518,366) | | | |
Net realized loss on total return swap contracts | | | 397,065 | | | | 778,872 | | | | 1,681,206 | | | |
Net realized loss on foreign currency transactions | | | 1,202,318 | | | | 2,000,002 | | | | 5,074,913 | | | |
Net change in unrealized appreciation on investment securities | | | (1,545,066) | | | | (7,138,315) | | | | (1,301,682) | | | |
Net change in unrealized depreciation on securities sold short | | | 3,663,378 | | | | 6,297,210 | | | | 15,331,017 | | | |
Net change in unrealized appreciation on written options | | | (237,888) | | | | (396,480) | | | | (951,552) | | | |
Net change in unrealized appreciation on total return swap contracts | | | (387,137) | | | | (912,341) | | | | (1,634,232) | | | |
Net change in unrealized appreciation on translation of assets and liabilities denominated in foreign currencies | | | (1,667) | | | | (2,278) | | | | (6,869) | | | |
Net payments on total return swap contracts | | | (397,065) | | | | (778,872) | | | | (1,681,206) | | | |
Discount and premiums amortized | | | 224,315 | | | | 199,371 | | | | 1,031,400 | | | |
Increase in deposits with broker for written options and securities sold short | | | (5,686,565) | | | | (10,978,765) | | | | (21,734,902) | | | |
Decrease in deposits with broker for total return swap contracts | | | 1,588,719 | | | | 5,535,847 | | | | 7,614,521 | | | |
Increase in dividends receivable | | | (83,052) | | | | (148,245) | | | | (342,904) | | | |
Increase/(Decrease) in interest receivable | | | (6,036) | | | | (40,602) | | | | 288,139 | | | |
Decrease in due to custodian for foreign currency | | | (439,957) | | | | (743,902) | | | | (1,778,416) | | | |
Decrease in interest due on loan payable | | | (2,694) | | | | (4,053) | | | | (13,324) | | | |
Increase in dividends payable - short sales | | | 68,441 | | | | 113,869 | | | | 286,565 | | | |
Increase in interest payable - margin account | | | 5,348 | | | | 18,144 | | | | 20,766 | | | |
Increase in accrued investment advisory fee | | | 9,688 | | | | 25,541 | | | | 52,139 | | | |
Increase in accrued administration fee | | | 3,945 | | | | 9,080 | | | | 16,685 | | | |
Decrease in accrued trustees fee | | | (2,471) | | | | (2,471) | | | | (2,471) | | | |
Increase in other payables | | | 180 | | | | 180 | | | | 155 | | | |
Net cash provided by operating activities | | | 14,542,280 | | | | 21,116,830 | | | | 80,662,891 | | | |
| | | | |
CASH FLOWS FROM FINANCING ACTIVITIES: | | | | | | | | | | | | | | |
Net proceeds from bank borrowing | | | 3,500,000 | | | | 9,000,000 | | | | – | | | |
Cash distributions paid | | | (15,808,428 | ) | | | (26,315,039 | ) | | | (70,620,812 | ) | | |
Net cash used in financing activities | | | (12,308,428 | ) | | | (17,315,039 | ) | | | (70,620,812 | ) | | |
| | | | |
Effect of exchange rates on cash | | | 1,667 | | | | 2,278 | | | | 6,869 | | | |
| | | | |
Net Change in Cash and Foreign Rates on Cash and Foreign Currency | | | 2,235,519 | | | | 3,804,069 | | | | 10,048,948 | | | |
| | | | |
Cash and foreign currency, beginning of period | | $ | 8,633 | | | $ | 14,017 | | | $ | 36,459 | | | |
Cash and foreign currency, end of period | | $ | 2,244,152 | | | $ | 3,818,086 | | | $ | 10,085,407 | | | |
| | | | | | | | | | | | | | | |
| | | | |
SUPPLEMENTAL DISCLOSURE OF CASH FLOW INFORMATION: | | | | | | | | | | | | | | |
Cash paid during the period for interest from bank borrowing: | | $ | 925,074 | | | $ | 1,522,115 | | | $ | 3,970,124 | | | |
See Notes to the Financial Statements.
| | |
Annual Report | March 31, 2014 | | 31 |
| | |
Financial Highlights | | Clough Global Allocation Fund |
| For a share outstanding throughout the years indicated | | |
| | | | | | | | | | | | | | | | | | | | |
| | | For the
Year Ended
March 31, 2014 | | | For the
Year Ended
March 31, 2013 | | | For the
Year Ended
March 31, 2012 | | | For the
Year Ended
March 31, 2011 | | | For the
Year Ended
March 31, 2010 | |
| |
PER COMMON SHARE OPERATING PERFORMANCE: | | | | | |
Net asset value - beginning of period | | | $17.38 | | | | $16.30 | | | | $18.35 | | | | $16.90 | | | | $13.24 | |
Income from investment operations: | | | | | | | | | | | | | | | | | | | | |
Net investment income/(loss)* | | | (0.26) | | | | (0.01) | | | | 0.26 | | | | 0.38 | | | | 0.32 | |
Net realized and unrealized gain/(loss) on investments | | | 1.90 | | | | 2.29 | | | | (1.11) | | | | 2.27 | | | | 4.44 | |
Total Income from Investment Operations | | | 1.64 | | | | 2.28 | | | | (0.85) | | | | 2.65 | | | | 4.76 | |
| | |
DISTRIBUTIONS TO COMMON SHAREHOLDERS FROM: | | | | | | | | | |
Net investment income | | | (0.24) | | | | (0.90) | | | | (1.20) | | | | (1.20) | | | | (0.46) | |
Net realized gains | | | (1.27) | | | | (0.30) | | | | – | | | | – | | | | – | |
Tax return of capital | | | – | | | | – | | | | – | | | | – | | | | (0.64) | |
Total Distributions to Common Shareholders | | | (1.51) | | | | (1.20) | | | | (1.20) | | | | (1.20) | | | | (1.10) | |
| | | | | |
Net asset value - end of period | | | $17.51 | | | | $17.38 | | | | $16.30 | | | | $18.35 | | | | $16.90 | |
| | | | | | | | | | | | | | | | | | | | | |
Market price - end of period | | | $15.18 | | | | $15.07 | | | | $13.94 | | | | $16.24 | | | | $15.92 | |
| | | | | | | | | | | | | | | | | | | | | |
| | | | | |
Total Investment Return - Net Asset Value:(1) | | | 11.14% | | | | 16.19% | | | | (3.48)% | | | | 17.30% | | | | 38.14% | |
Total Investment Return - Market Price:(1) | | | 11.12% | | | | 17.81% | | | | (6.73)% | | | | 10.20% | | | | 61.32% | |
| |
RATIOS AND SUPPLEMENTAL DATA: | | | | | |
Net assets attributable to common shares, end of period (000s) | | | $182,737 | | | | $181,309 | | | | $170,120 | | | | $191,502 | | | | $176,317 | |
Ratios to average net assets attributable to common shareholders: | | | | | | | | | | | | | | | | | | | | |
Total expenses | | | 3.34% | | | | 3.24% | | | | 3.05% | | | | 2.87% | | | | 3.22% | |
Total expenses excluding interest expense and dividends on short sales expense | | | 1.94% | | | | 1.93% | | | | 1.80% | | | | 1.74% | | | | 1.88% | |
Net investment income/(loss) | | | (1.47)% | | | | (0.04)% | | | | 1.61% | | | | 2.28% | | | | 1.96% | |
Portfolio turnover rate | | | 179% | | | | 250% | | | | 192% | | | | 172% | | | | 115% | |
| | | | |
Borrowings at End of Period | | | | | | | | | | | | | | | | | |
Aggregate Amount Outstanding (000s) | | | $93,300 | | | | $89,800 | | | | $89,800 | | | | $89,800 | | | | $89,800 | |
Asset Coverage Per $1,000 (000s) | | | $2,959 | | | | $3,019 | | | | $2,894 | | | | $3,133 | | | | $2,963 | |
| * | Based on average shares outstanding. |
| (1) | Total investment return is calculated assuming a purchase of a common share at the opening on the first day and a sale at the closing on the last day of each period reported. Dividends and distributions, if any, are assumed for purposes of this calculation to be reinvested at price obtained under the Fund’s dividend reinvestment plan. Total investment returns do not reflect brokerage commissions on the purchase or sale of the Fund’s common shares. Past performance is not a guarantee of future results. |
See Notes to the Financial Statements.
| | |
Clough Global Equity Fund | | Financial Highlights |
| | For a share outstanding throughout the years indicated |
| | | | | | | | | | | | | | | | | | | | |
| | | For the
Year Ended
March 31, 2014 | | | For the
Year Ended
March 31, 2013 | | | For the
Year Ended
March 31, 2012 | | | For the
Year Ended
March 31, 2011 | | | For the
Year Ended
March 31, 2010 | |
|
PER COMMON SHARE OPERATING PERFORMANCE: | |
Net asset value - beginning of period | | | $16.63 | | | | $15.53 | | | | $17.62 | | | | $16.29 | | | | $12.28 | |
Income from investment operations: | | | | | | | | | | | | | | | | | | | | |
Net investment income/(loss)* | | | (0.33 | ) | | | (0.06 | ) | | | 0.21 | | | | 0.30 | | | | 0.22 | |
Net realized and unrealized gain/(loss) on investments | | | 2.33 | | | | 2.32 | | | | (1.14 | ) | | | 2.19 | | | | 4.82 | |
Total Income from Investment Operations | | | 2.00 | | | | 2.26 | | | | (0.93 | ) | | | 2.49 | | | | 5.04 | |
|
DISTRIBUTIONS TO COMMON SHAREHOLDERS FROM: | |
Net investment income | | | (0.38 | ) | | | (0.87 | ) | | | (1.14 | ) | | | (1.16 | ) | | | (0.39 | ) |
Net realized gains | | | (1.10 | ) | | | (0.29 | ) | | | – | | | | – | | | | – | |
Tax return of capital | | | – | | | | – | | | | (0.02 | ) | | | – | | | | (0.64 | ) |
Total Distributions to Common Shareholders | | | (1.48 | ) | | | (1.16 | ) | | | (1.16 | ) | | | (1.16 | ) | | | (1.03 | ) |
Net asset value - end of period | | | $17.15 | | | | $16.63 | | | | $15.53 | | | | $17.62 | | | | $16.29 | |
| | | | | | | | | | | | | | | | | | | | | |
Market price - end of period | | | $15.42 | | | | $14.70 | | | | $13.09 | | | | $15.37 | | | | $14.33 | |
| | | | | | | | | | | | | | | | | | | | | |
Total Investment Return - Net Asset Value:(1) | | | 13.57 | % | | | 16.90 | % | | | (4.08 | )% | | | 17.05 | % | | | 43.62 | % |
Total Investment Return - Market Price:(1) | | | 15.52 | % | | | 22.60 | % | | | (7.32 | )% | | | 16.07 | % | | | 58.80 | % |
|
RATIOS AND SUPPLEMENTAL DATA: | |
Net assets attributable to common shares, end of period (000s) | | | $305,958 | | | | $296,710 | | | | $277,061 | | | | $314,355 | | | | $290,577 | |
Ratios to average net assets attributable to common shareholders: | | | | | | | | | | | | | | | | | | | | |
Total expenses | | | 3.76 | % | | | 3.67 | % | | | 3.43 | % | | | 3.23 | % | | | 3.57 | % |
Total expenses excluding interest expense and dividends on short sales expense | | | 2.36 | % | | | 2.35 | % | | | 2.18 | % | | | 2.10 | % | | | 2.25 | % |
Net investment income/(loss) | | | (1.95 | )% | | | (0.37 | )% | | | 1.34 | % | | | 1.87 | % | | | 1.43 | % |
Portfolio turnover rate | | | 166 | % | | | 250 | % | | | 183 | % | | | 173 | % | | | 116 | % |
|
Borrowings at End of Period | |
Aggregate Amount Outstanding (000s) | | | $156,000 | | | | $147,000 | | | | $147,000 | | | | $147,000 | | | | $147,000 | |
Asset Coverage Per $1,000 (000s) | | | $2,961 | | | | $3,018 | | | | $2,885 | | | | $3,138 | | | | $2,977 | |
| * | Based on average shares outstanding. |
| (1) | Total investment return is calculated assuming a purchase of a common share at the opening on the first day and a sale at the closing on the last day of each period reported. Dividends and distributions, if any, are assumed for purposes of this calculation to be reinvested at price obtained under the Fund’s dividend reinvestment plan. Total investment returns do not reflect brokerage commissions on the purchase or sale of the Fund’s common shares. Past performance is not a guarantee of future results. |
See Notes to the Financial Statements.
| | |
Annual Report | March 31, 2014 | | 33 |
| | |
Financial Highlights | | Clough Global Opportunities Fund |
| For a share outstanding throughout the years indicated | | |
| | | | | | | | | | | | | | | | | | | | |
| | | For the
Year Ended
March 31, 2014 | | | For the
Year Ended
March 31, 2013 | | | For the
Year Ended
March 31, 2012 | | | For the
Year Ended
March 31, 2011 | | | For the
Year Ended
March 31, 2010 | |
|
PER COMMON SHARE OPERATING PERFORMANCE: | |
Net asset value - beginning of period | | | $14.64 | | | | $13.84 | | | | $15.72 | | | | $14.68 | | | | $11.55 | |
Income from investment operations: | | | | | | | | | | | | | | | | | | | | |
Net investment income/(loss)* | | | (0.32 | ) | | | (0.09 | ) | | | 0.14 | | | | 0.25 | | | | 0.17 | |
Net realized and unrealized gain/(loss) on investments | | | 1.72 | | | | 1.97 | | | | (0.94 | ) | | | 1.87 | | | | 3.94 | |
Total Income from Investment Operations | | | 1.40 | | | | 1.88 | | | | (0.80 | ) | | | 2.12 | | | | 4.11 | |
|
DISTRIBUTIONS TO COMMON SHAREHOLDERS FROM: | |
Net investment income | | | (0.11 | ) | | | (1.08 | ) | | | (1.05 | ) | | | (1.08 | ) | | | (0.29 | ) |
Net realized gains | | | (1.26 | ) | | | – | | | | – | | | | – | | | | – | |
Tax return of capital | | | – | | | | – | | | | (0.03 | ) | | | – | | | | (0.69 | ) |
Total Distributions to Common Shareholders | | | (1.37 | ) | | | (1.08 | ) | | | (1.08 | ) | | | (1.08 | ) | | | (0.98 | ) |
Net asset value - end of period | | | $14.67 | | | | $14.64 | | | | $13.84 | | | | $15.72 | | | | $14.68 | |
| | | | | | | | | | | | | | | | | | | | | |
Market price - end of period | | | $12.75 | | | | $12.87 | | | | $11.78 | | | | $13.85 | | | | $13.04 | |
| | | | | | | | | | | | | | | | | | | | | |
Total Investment Return - Net Asset Value:(1) | | | 11.26 | % | | | 15.87 | % | | | (3.88 | )% | | | 16.21 | % | | | 37.93 | % |
Total Investment Return - Market Price:(1) | | | 9.99 | % | | | 19.67 | % | | | (7.14 | )% | | | 15.27 | % | | | 53.82 | % |
|
RATIOS AND SUPPLEMENTAL DATA: | |
Net assets attributable to common shares, end of period (000s) | | | $759,084 | | | | $757,452 | | | | $716,213 | | | | $813,178 | | | | $759,601 | |
Ratios to average net assets attributable to common shareholders: | | | | | | | | | | | | | | | | | | | | |
Total expenses | | | 3.97 | % | | | 3.86 | % | | | 3.61 | % | | | 3.40 | % | | | 3.72 | % |
Total expenses excluding interest expense and dividends on short sales expense | | | 2.55 | % | | | 2.52 | % | | | 2.35 | % | | | 2.25 | % | | | 2.39 | % |
Net investment income/(loss) | | | (2.15 | )% | | | (0.64 | )% | | | 1.04 | % | | | 1.74 | % | | | 1.19 | % |
Portfolio turnover rate | | | 178 | % | | | 241 | % | | | 193 | % | | | 171 | % | | | 115 | % |
|
Borrowings at End of Period | |
Aggregate Amount Outstanding (000s) | | | $388,900 | | | | $388,900 | | | | $388,900 | | | | $388,900 | | | | $388,900 | |
Asset Coverage Per $1,000 (000s) | | | $2,952 | | | | $2,948 | | | | $2,842 | | | | $3,091 | | | | $2,953 | |
| * | Based on average shares outstanding. |
| (1) | Total investment return is calculated assuming a purchase of a common share at the opening on the first day and a sale at the closing on the last day of each period reported. Dividends and distributions, if any, are assumed for purposes of this calculation to be reinvested at price obtained under the Fund’s dividend reinvestment plan. Total investment returns do not reflect brokerage commissions on the purchase or sale of the Fund’s common shares. Total investment returns for less than a full year are not annualized. Past performance is not a guarantee of future results. |
See Notes to the Financial Statements.
| | |
Clough Global Funds | | Notes to Financial Statements |
| | March 31, 2014 |
1. ORGANIZATION AND SIGNIFICANT ACCOUNTING AND OPERATING POLICIES
Clough Global Allocation Fund, Clough Global Equity Fund, and Clough Global Opportunities Fund, are closed-end management investment companies registered under the Investment Company Act of 1940 (the “1940 Act”). The Funds were organized under the laws of the state of Delaware by an Amended Agreement and Declaration of Trust dated April 27, 2004 and January 25, 2005, respectively for Clough Global Allocation Fund and Clough Global Equity Fund, and an Agreement and Declaration of Trust dated January 12, 2006, for Clough Global Opportunities Fund. The Funds were previously registered as non-diversified investment companies. As a result of ongoing operations, each of the Funds became a diversified company. The Funds may not resume operating in a non-diversified manner without first obtaining shareholder approval. Each Fund’s investment objective is to provide a high level of total return. Each Declaration of Trust provides that the Board of Trustees may authorize separate classes of shares of beneficial interest.
The following is a summary of significant accounting policies followed by the Funds. These policies are in conformity with U.S. generally accepted accounting principles (“GAAP”). The preparation of financial statements in accordance with GAAP requires management to make estimates and assumptions that affect the reported amounts and disclosures in the financial statements during the reporting period. Management believes the estimates and security valuations are appropriate; however, actual results may differ from those estimates, and the security valuations reflected in the financial statements may differ from the value the Funds ultimately realize upon sale of the securities. The financial statements have been prepared as of the close of the New York Stock Exchange (“NYSE” or the “Exchange”) on March 31, 2014.
The net asset value per share of each Fund is determined no less frequently than daily, on each day that the Exchange is open for trading, as of the close of regular trading on the Exchange (normally 4:00 p.m. New York time). Trading may take place in foreign issues held by the Fund at times when a Fund is not open for business. As a result, each Fund’s net asset value may change at times when it is not possible to purchase or sell shares of a Fund.
Investment Valuation: Securities held by each Fund for which exchange quotations are readily available are valued at the last sale price, or if no sale price or if traded on the over-the-counter market, at the mean of the bid and asked prices on such day. Most securities listed on a foreign exchange are valued at the last sale price at the close of the exchange on which the security is primarily traded. In certain countries market maker prices are used since they are the most representative of the daily trading activity. Market maker prices are usually the mean between the bid and ask prices. Certain markets are not closed at the time that the Funds price their portfolio securities. In these situations, snapshot prices are provided by the individual pricing services or other alternate sources at the close of the NYSE as appropriate. Securities not traded on a particular day are valued at the mean between the last reported bid and the asked quotes, or the last sale price when appropriate; otherwise fair value will be determined by the board-appointed fair valuation committee. Debt securities for which the over-the-counter market is the primary market are normally valued on the basis of prices furnished by one or more pricing services or dealers at the mean between the latest available bid and asked prices. As authorized by the Board of Trustees, debt securities (other than short-term obligations) may be valued on the basis of valuations furnished by a pricing service which determines valuations based upon market transactions for normal, institutional-size trading units of securities or a matrix method which considers yield or price of comparable bonds provided by a pricing service. Short-term obligations maturing within 60 days are valued at amortized cost, which approximates value, unless the Board of Trustees determine that under particular circumstances such method does not result in fair value. Over-the-counter options are valued at the mean between bid and asked prices provided by dealers. Financial futures contracts listed on commodity exchanges and exchange-traded options are valued at closing settlement prices. Total return swaps are priced based on valuations provided by a board approved independent third party pricing agent. If a total return swap price cannot be obtained from an independent third party pricing agent the Fund shall seek to obtain a bid price from at least one independent and/or executing broker.
If the price of a security is unavailable in accordance with the aforementioned pricing procedures, or the price of a security is unreliable, e.g., due to the occurrence of a significant event, the security may be valued at its fair value determined by management pursuant to procedures adopted by the Board of Trustees. For this purpose, fair value is the price that a Fund reasonably expects to receive on a current sale of the security. Due to the number of variables affecting the price of a security, however; it is possible that the fair value of a security may not accurately reflect the price that a Fund could actually receive on a sale of the security.
A three-tier hierarchy has been established to classify fair value measurements for disclosure purposes. Inputs refer broadly to the assumptions that market participants would use in pricing the asset or liability, including assumptions about risk. Inputs may be observable or unobservable. Observable inputs are inputs that reflect the assumptions market participants would use in pricing the asset or liability that are developed based on market data obtained from sources independent of the reporting entity. Unobservable inputs are inputs that reflect the reporting entity’s own assumptions about the assumptions market participants would use in pricing the asset or liability that are developed based on the best information available.
Various inputs are used in determining the value of each Fund’s investments as of the reporting period end. These inputs are categorized in the following hierarchy under applicable financial accounting standards:
| | |
| Level 1 – | | Unadjusted quoted prices in active markets for identical, unrestricted assets or liabilities that a Fund has the ability to access at the measurement date; |
| Level 2 – | | Quoted prices which are not active, quoted prices for similar assets or liabilities in active markets or inputs other than quoted prices that are observable (either directly or indirectly) for substantially the full term of the asset or liability; and |
| Level 3 – | | Significant unobservable prices or inputs (including the Fund’s own assumptions in determining the fair value of investments) where there is little or no market activity for the asset or liability at the measurement date. |
| | |
Annual Report | March 31, 2014 | | 35 |
| | |
Notes to Financial Statements | | Clough Global Funds |
| March 31, 2014 | | |
The following is a summary of the inputs used as of March 31, 2014, in valuing each Fund’s investments carried at value.
Clough Global Allocation Fund
| | | | | | | | | | | | | | | | |
| Investments in Securities at Value* | | Level 1 | | | Level 2 | | | Level 3 | | | Total | |
| |
Common Stocks | | $ | 219,930,274 | | | $ | – | | | $ | – | | | $ | 219,930,274 | |
Exchange Traded Funds | | | 2,677,073 | | | | – | | | | – | | | | 2,677,073 | |
Warrants | | | 175,437 | | | | – | | | | – | | | | 175,437 | |
Corporate Bonds | | | – | | | | 13,450,720 | | | | – | | | | 13,450,720 | |
Asset/Mortgage Backed Securities | | | – | | | | 1,171,614 | | | | – | | | | 1,171,614 | |
Government & Agency Obligations | | | – | | | | 10,144,473 | | | | – | | | | 10,144,473 | |
Purchased Options | | | 277,500 | | | | – | | | | – | | | | 277,500 | |
Short-Term Investments | | | | | | | | | | | | | | | | |
Money Market Fund | | | 21,466,149 | | | | – | | | | – | | | | 21,466,149 | |
U.S. Treasury Bills | | | – | | | | 999,968 | | | | – | | | | 999,968 | |
| |
TOTAL | | $ | 244,526,433 | | | $ | 25,766,775 | | | $ | – | | | $ | 270,293,208 | |
| |
| | | | |
Other Financial Instruments | | | | | | | | | | | | | | | | |
| |
Assets | | | | | | | | | | | | | | | | |
Total Return Swap Contracts** | | $ | – | | | $ | 58,662 | | | $ | – | | | $ | 58,662 | |
| | | | |
Liabilities | | | | | | | | | | | | | | | | |
Written Options | | | (61,500 | ) | | | – | | | | – | | | | (61,500 | ) |
Securities Sold Short | | | | | | | | | | | | | | | | |
Common Stocks | | | (31,010,364 | ) | | | – | | | | – | | | | (31,010,364 | ) |
Exchange Traded Funds | | | (32,949,446 | ) | | | – | | | | – | | | | (32,949,446 | ) |
Total Return Swap Contracts** | | | – | | | | (240,059 | ) | | | – | | | | (240,059 | ) |
| |
TOTAL | | $ | (64,021,310 | ) | | $ | (181,397 | ) | | $ | – | | | $ | (64,202,707 | ) |
| |
| | | | |
Clough Global Equity Fund | | | | | | | | | | | | | | | | |
| | | | |
| Investments in Securities at Value* | | Level 1 | | | Level 2 | | | Level 3 | | | Total | |
| |
Common Stocks | | $ | 396,894,368 | | | $ | – | | | $ | – | | | $ | 396,894,368 | |
Exchange Traded Funds | | | 4,410,910 | | | | – | | | | – | | | | 4,410,910 | |
Warrants | | | 293,580 | | | | – | | | | – | | | | 293,580 | |
Corporate Bonds | | | – | | | | 19,367,144 | | | | – | | | | 19,367,144 | |
Government & Agency Obligations | | | – | | | | 13,115,341 | | | | – | | | | 13,115,341 | |
Purchased Options | | | 462,500 | | | | – | | | | – | | | | 462,500 | |
Short-Term Investments | | | | | | | | | | | | | | | | |
Money Market Fund | | | 16,867,010 | | | | – | | | | – | | | | 16,867,010 | |
U.S. Treasury Bills | | | – | | | | 999,968 | | | | – | | | | 999,968 | |
| |
TOTAL | | $ | 418,928,368 | | | $ | 33,482,453 | | | $ | – | | | $ | 452,410,821 | |
| |
| | | | |
Other Financial Instruments | | | | | | | | | | | | | | | | |
| |
Assets | | | | | | | | | | | | | | | | |
Total Return Swap Contracts** | | $ | – | | | $ | 98,363 | | | $ | – | | | $ | 98,363 | |
| | | | |
Liabilities | | | | | | | | | | | | | | | | |
Written Options | | | (102,500 | ) | | | – | | | | – | | | | (102,500 | ) |
Securities Sold Short | | | | | | | | | | | | | | | | |
Common Stocks | | | (51,675,452 | ) | | | – | | | | – | | | | (51,675,452 | ) |
Exchange Traded Funds | | | (55,562,123 | ) | | | – | | | | – | | | | (55,562,123 | ) |
Total Return Swap Contracts** | | | – | | | | (385,977 | ) | | | – | | | | (385,977 | ) |
| |
TOTAL | | $ | (107,340,075 | ) | | $ | (287,614 | ) | | $ | – | | | $ | (107,627,689 | ) |
| |
| | |
Clough Global Funds | | Notes to Financial Statements |
| | March 31, 2014 |
Clough Global Opportunities Fund
| | | | | | | | | | | | | | | | |
| Investments in Securities at Value* | | Level 1 | | | Level 2 | | | Level 3 | | | Total | |
| |
Common Stocks | | $ | 923,774,875 | | | $ | – | | | $ | – | | | $ | 923,774,875 | |
Exchange Traded Funds | | | 11,327,515 | | | | – | | | | – | | | | 11,327,515 | |
Warrants | | | 730,983 | | | | – | | | | – | | | | 730,983 | |
Corporate Bonds | | | – | | | | 54,545,252 | | | | – | | | | 54,545,252 | |
Asset/Mortgage Backed Securities | | | – | | | | 3,209,850 | | | | – | | | | 3,209,850 | |
Government & Agency Obligations | | | – | | | | 37,983,398 | | | | – | | | | 37,983,398 | |
Purchased Options | | | 1,110,000 | | | | – | | | | – | | | | 1,110,000 | |
Short-Term Investments | | | | | | | | | | | | | | | | |
Money Market Fund | | | 88,791,265 | | | | – | | | | – | | | | 88,791,265 | |
U.S. Treasury Bills | | | – | | | | 3,999,871 | | | | – | | | | 3,999,871 | |
| |
TOTAL | | $ | 1,025,734,638 | | | $ | 99,738,371 | | | $ | – | | | $ | 1,125,473,009 | |
| |
| | | | |
Other Financial Instruments | | | | | | | | | | | | | | | | |
| |
Assets | | | | | | | | | | | | | | | | |
Total Return Swap Contracts** | | $ | – | | | $ | 244,881 | | | $ | – | | | $ | 244,881 | |
| | | | |
Liabilities | | | | | | | | | | | | | | | | |
Written Options | | | (246,000 | ) | | | – | | | | – | | | | (246,000 | ) |
Securities Sold Short | | | | | | | | | | | | | | | | |
Common Stocks | | | (129,867,941 | ) | | | – | | | | – | | | | (129,867,941 | ) |
Exchange Traded Funds | | | (137,869,970 | ) | | | – | | | | – | | | | (137,869,970 | ) |
Total Return Swap Contracts** | | | – | | | | (1,012,014 | ) | | | – | | | | (1,012,014 | ) |
| |
TOTAL | | $ | (267,983,911 | ) | | $ | (767,133 | ) | | $ | – | | | $ | (268,751,044 | ) |
| |
| * | For detailed industry descriptions, see the accompanying Statement of Investments. |
| ** | Swap contracts are reported at their unrealized appreciation/(depreciation) at measurement date, which represents the change in the contract’s value from trade date. |
The Funds recognize transfers between the levels as of the end of the period in which the transfer occurred. During the year ended March 31, 2014, Clough Global Allocation Fund, Clough Global Equity Fund, and Clough Opportunities Fund transferred Government & Agency Obligations with a market value of $2,500,938, $4,001,501, and $9,128,424 respectively, from Level 1 to Level 2 due to the unavailability of a quoted price in an active market.
In the event a board approved independent pricing service is unable to provide an evaluated price for a security or Clough Capital Partners L.P. (the “Adviser” or “Clough”) believes the price provided is not reliable, securities of each Fund may be valued at fair value as described above. In these instances the Adviser may seek to find an alternative independent source, such as a broker/dealer to provide a price quote, or by using evaluated pricing models similar to the techniques and models used by the independent pricing service. These fair value measurement techniques may utilize unobservable inputs (Level 3).
On a monthly basis, the Fair Value Committee of each Fund meets and discusses securities that have been fair valued during the preceding month in accordance with the Fund’s Fair Value Procedures and reports quarterly to the Board of Trustees on the results of those meetings.
For the year ended March 31, 2014, the Funds did not have significant unobservable inputs (Level 3) used in determining fair value. Therefore, a reconciliation of assets in which significant unobservable inputs (Level 3) were used in determining fair value is not applicable.
Foreign Securities: Each Fund may invest a portion of its assets in foreign securities. In the event that a Fund executes a foreign security transaction, the Fund will generally enter into a forward foreign currency contract to settle the foreign security transaction. Foreign securities may carry more risk than U.S. securities, such as political, market and currency risks.
The accounting records of each Fund are maintained in U.S. dollars. Prices of securities denominated in foreign currencies are translated into U.S. dollars at the closing rates of exchange at period end. Amounts related to the purchase and sale of foreign securities and investment income are translated at the rates of exchange prevailing on the respective dates of such transactions.
The effect of changes in foreign currency exchange rates on investments is reported with all other foreign currency realized and unrealized gains and losses in the Funds’ Statements of Operations.
| | |
Annual Report | March 31, 2014 | | 37 |
| | |
Notes to Financial Statements | | Clough Global Funds |
| March 31, 2014 | | |
A foreign currency spot contract is a commitment to purchase or sell a foreign currency at a future date, at a negotiated rate. Each Fund may enter into foreign currency spot contracts to settle specific purchases or sales of securities denominated in a foreign currency and for protection from adverse exchange rate fluctuation. Risks to a Fund include the potential inability of the counterparty to meet the terms of the contract.
The net U.S. dollar value of foreign currency underlying all contractual commitments held by a Fund and the resulting unrealized appreciation or depreciation are determined using prevailing forward foreign currency exchange rates. Unrealized appreciation and depreciation on foreign currency spot contracts are reported in the Funds’ Statements of Assets and Liabilities as a receivable or a payable and in the Funds’ Statements of Operations with the change in unrealized appreciation or depreciation on translation of assets and liabilities denominated in foreign currencies. These spot contracts are used by the broker to settle investments denominated in foreign currencies.
A Fund may realize a gain or loss upon the closing or settlement of the foreign transaction. Such realized gains and losses are reported with all other foreign currency gains and losses in the Statements of Operations.
Short Sales: Each Fund may sell a security it does not own in anticipation of a decline in the fair value of that security. When a Fund sells a security short, it must borrow the security sold short and deliver it to the broker-dealer through which it made the short sale. A gain, limited to the price at which a Fund sold the security short, or a loss, unlimited in size, will be recognized upon the termination of the short sale.
Each Fund’s obligation to replace the borrowed security will be secured by collateral deposited with the broker-dealer, usually cash, U.S. government securities or other liquid securities. Each Fund will also be required to designate on its books and records similar collateral with its custodian to the extent, if any, necessary so that the aggregate collateral value is at all times at least equal to the current market value of the security sold short. The cash amount is reported on the Statements of Assets and Liabilities as Deposit with broker for securities sold short. The market value of securities held as collateral for securities sold short as of March 31, 2014, was $37,999,935, $54,504,854 and $151,270,448 for Clough Global Allocation Fund, Clough Global Equity Fund and Clough Global Opportunities Fund, respectively. Each Fund is obligated to pay interest to the broker for any debit balance of the margin account relating to short sales. The interest incurred by the Funds for the year ended March 31, 2014, is reported on the Statements of Operations as Interest expense – margin account. Interest amounts payable by the Funds as of March 31, 2014, are reported on the Statements of Assets and Liabilities as Interest payable – margin account.
Each Fund may also sell a security short if it owns at least an equal amount of the security sold short or another security convertible or exchangeable for an equal amount of the security sold short without payment of further compensation (a short sale against-the-box). In a short sale against-the-box, the short seller is exposed to the risk of being forced to deliver stock that it holds to close the position if the borrowed stock is called in by the lender, which would cause gain or loss to be recognized on the delivered stock. Each Fund expects normally to close its short sales against-the-box by delivering newly acquired stock.
Derivatives Instruments and Hedging Activities: The following discloses the Funds’ use of derivative instruments and hedging activities.
The Funds’ investment objectives not only permit the Funds to purchase investment securities, they also allow the Funds to enter into various types of derivative contracts, including, but not limited to, purchased and written options, swaps, futures and warrants. In doing so, the Funds will employ strategies in differing combinations to permit them to increase, decrease, or change the level or types of exposure to market factors. Central to those strategies are features inherent to derivatives that make them more attractive for this purpose than equity securities; they require little or no initial cash investment, they can focus exposure on only certain selected risk factors, and they may not require the ultimate receipt or delivery of the underlying security (or securities) to the contract. This may allow the Funds to pursue their objectives more quickly and efficiently than if they were to make direct purchases or sales of securities capable of affecting a similar response to market factors.
Market Risk Factors: In pursuit of their investment objectives, certain Funds may seek to use derivatives to increase or decrease their exposure to the following market risk factors:
Equity Risk: Equity risk relates to the change in value of equity securities as they relate to increases or decreases in the general market.
Risk of Investing in Derivatives: The Funds’ use of derivatives can result in losses due to unanticipated changes in the market risk factors and the overall market. In instances where the Funds are using derivatives to decrease or hedge exposures to market risk factors for securities held by the Funds, there are also risks that those derivatives may not perform as expected, resulting in losses for the combined or hedged positions.
Derivatives may have little or no initial cash investment relative to their market value exposure and therefore can produce significant gains or losses in excess of their cost. This use of embedded leverage allows the Funds to increase their market value exposure relative to their net assets and can substantially increase the volatility of the Funds’ performance.
| | |
Clough Global Funds | | Notes to Financial Statements |
| | March 31, 2014 |
Additional associated risks from investing in derivatives also exist and potentially could have significant effects on the valuation of the derivative and the Funds. Typically, the associated risks are not the risks that the Funds are attempting to increase or decrease exposure to, per their investment objectives, but are the additional risks from investing in derivatives.
Examples of these associated risks are liquidity risk, which is the risk that the Funds will not be able to sell the derivative in the open market in a timely manner, and counterparty credit risk, which is the risk that the counterparty will not fulfill its obligation to the Funds. Associated risks can be different for each type of derivative and are discussed by each derivative type in the notes that follow.
Each Fund may acquire put and call options and options on stock indices and enter into stock index futures contracts, certain credit derivatives transactions and short sales in connection with its equity investments. In connection with a Fund’s investments in debt securities, it may enter into related derivatives transactions such as interest rate futures, swaps and options thereon and certain credit derivatives transactions. Derivatives transactions of the types described above subject a Fund to increased risk of principal loss due to imperfect correlation or unexpected price or interest rate movements. Each Fund also will be subject to credit risk with respect to the counterparties to the derivatives contracts purchased by a Fund. If a counterparty becomes bankrupt or otherwise fails to perform its obligations under a derivatives contract due to financial difficulties, each Fund may experience significant delays in obtaining any recovery under the derivatives contract in a bankruptcy or other reorganization proceeding. Each Fund may obtain only a limited recovery or may obtain no recovery in such circumstances.
Option Writing/Purchasing: Each Fund may purchase or write (sell) put and call options. One of the risks associated with purchasing an option among others, is that a Fund pays a premium whether or not the option is exercised. Additionally, a Fund bears the risk of loss of premium and change in market value should the counterparty not perform under the contract. The cost of securities acquired through the exercise of call options is increased by premiums paid. The proceeds from securities sold through the exercise of put options are decreased by the premiums paid. Each Fund is obligated to pay interest to the broker for any debit balance of the margin account relating to options. The interest incurred on the Funds for the year ended March 31, 2014 is reported on the Statements of Operations as Interest expense – margin account. Interest amounts payable by the Funds as of March 31, 2014 are reported on the Statements of Assets and Liabilities as Interest payable – margin account.
When a Fund writes an option, an amount equal to the premium received by a Fund is recorded as a liability and is subsequently adjusted to the current value of the option written. Premiums received from writing options that expire unexercised are treated by a Fund on the expiration date as realized gains. The difference between the premium received and the amount paid on effecting a closing purchase transaction, including brokerage commissions, is recorded as a realized gain or loss. If a call option is exercised, the premium is added to the proceeds from the sale of the underlying security or currency in determining whether a Fund has realized a gain or loss. If a put option is exercised, the premium reduces the cost basis of the securities purchased by a Fund. Each Fund, as writer of an option, bears the market risk of an unfavorable change in the price of the security underlying the written option.
Written option activity for the year ended March 31, 2014, was as follows:
| | | | | | | | | | | | | | | | | | |
| Clough Global Allocation Fund | | | | | | | | |
| | | |
| | | Written Call Options | | | Written Put Options | | | |
|
| | | Contracts | | | Premiums | | | Contracts | | | Premiums | | | |
|
Outstanding, March 31, 2013 | | | – | | | $ | – | | | | – | | | $ | – | | | |
Positions opened | | | 2,499 | | | | 271,090 | | | | (1,800 | ) | | | 2,426,835 | | | |
Closed | | | (1,999 | ) | | | (236,513 | ) | | | 1,500 | | | | (2,127,447 | ) | | |
Exercised | | | (500 | ) | | | (34,577 | ) | | | – | | | | – | | | |
|
Outstanding, March 31, 2014 | | | – | | | $ | – | | | | (300 | ) | | $ | 299,388 | | | |
|
Market Value, March 31, 2014 | | | | | | $ | – | | | | | | | $ | (61,500 | ) | | |
|
| | | | | |
| Clough Global Equity Fund | | | | | | | | | | | | | | | | | | |
| | | |
| | | Written Call Options | | | Written Put Options | | | |
|
| | | Contracts | | | Premiums | | | Contracts | | | Premiums | | | |
|
Outstanding, March 31, 2013 | | | – | | | $ | – | | | | – | | | $ | – | | | |
Positions opened | | | 4,173 | | | | 446,452 | | | | (3,000 | ) | | | 4,044,725 | | | |
Closed | | | (3,223 | ) | | | (378,262 | ) | | | 2,500 | | | | (3,545,745 | ) | | |
Exercised | | | (950 | ) | | | (68,190 | ) | | | – | | | | – | | | |
|
Outstanding, March 31, 2014 | | | – | | | $ | – | | | | (500 | ) | | $ | 498,980 | | | |
|
Market Value, March 31, 2014 | | | | | | $ | – | | | | | | | $ | (102,500 | ) | | |
|
| | |
Annual Report | March 31, 2014 | | 39 |
| | |
Notes to Financial Statements | | Clough Global Funds |
| March 31, 2014 | | |
| | | | | | | | | | | | | | | | | | |
| Clough Global Opportunities Fund | | | | | | | | |
| | | |
| | | Written Call Options | | | Written Put Options | | | |
|
| | | Contracts | | | Premiums | | | Contracts | | | Premiums | | | |
|
Outstanding, March 31, 2013 | | | – | | | $ | – | | | | – | | | $ | – | | | |
Positions opened | | | 12,566 | | | | 1,351,699 | | | | (6,200 | ) | | | 8,289,041 | | | |
Closed | | | (10,421 | ) | | | (1,201,120 | ) | | | 5,000 | | | | (7,091,489 | ) | | |
Exercised | | | (2,145 | ) | | | (150,579 | ) | | | – | | | | – | | | |
|
Outstanding, March 31, 2014 | | | – | | | $ | – | | | | (1,200 | ) | | $ | 1,197,552 | | | |
|
Market Value, March 31, 2014 | | | | | | $ | – | | | | | | | $ | (246,000 | ) | | |
|
Swaps: During the year each Fund engaged in total return swaps. A swap is an agreement that obligates two parties to exchange a series of cash flows at specified intervals based upon or calculated by reference to changes in specified prices or rates for a specified amount of an underlying asset. Each Fund may utilize swap agreements as a means to gain exposure to certain assets and/or to “hedge” or protect the Fund from adverse movements in securities prices or interest rates. Each Fund is subject to equity risk and interest rate risk in the normal course of pursuing its investment objective through investments in swap contracts. Swap agreements entail the risk that a party will default on its payment obligation to a Fund. If the other party to a swap defaults, a Fund would risk the loss of the net amount of the payments that it contractually is entitled to receive. If each Fund utilizes a swap at the wrong time or judges market conditions incorrectly, the swap may result in a loss to the Fund and reduce the Fund’s total return.
Total return swaps involve an exchange by two parties in which one party makes payments based on a set rate, either fixed or variable, while the other party makes payments based on the return of an underlying asset, which includes both the income it generates and any capital gains over the payment period. A Fund’s maximum risk of loss from counterparty risk or credit risk is the discounted value of the payments to be received from/paid to the counterparty over the contract’s remaining life, to the extent that the amount is positive. The risk is mitigated by having a netting arrangement between a Fund and the counterparty and by the posting of collateral to a Fund to cover the Fund’s exposure to the counterparty.
International Swaps and Derivatives Association, Inc. Master Agreements (“ISDA Master Agreements”) govern OTC financial derivative transactions entered into by a Fund and those counterparties. The ISDA Master Agreements maintain provisions for general obligations, representations, agreements, collateral and events of default or termination. Events of termination include conditions that may entitle counterparties to elect to terminate early and cause settlement of all outstanding transactions under the applicable ISDA Master Agreement. Any election to early terminate could be material to the financial statements.
During the year ended March 31, 2014, the Funds invested in swap agreements consistent with the Funds’ investment strategies to gain exposure to certain markets or indices.
Warrants: Each Fund may purchase or otherwise receive warrants or rights. Warrants and rights generally give the holder the right to receive, upon exercise, a security of the issuer at a set price. Funds typically use warrants and rights in a manner similar to their use of purchased options on securities, as described in options above. Risks associated with the use of warrants and rights are generally similar to risks associated with the use of purchased options. However, warrants and rights often do not have standardized terms, and may have longer maturities and may be less liquid than exchange-traded options. In addition, the terms of warrants or rights may limit each Fund’s ability to exercise the warrants or rights at such times and in such quantities as each Fund would otherwise wish. Each Fund held no rights at the end of the year.
| | |
Clough Global Funds | | Notes to Financial Statements |
| | March 31, 2014 |
The effect of derivatives instruments on each Fund’s Statements of Assets and Liabilities as of March 31, 2014:
| | | | | | | | |
| | | Asset Derivatives | | | | | |
|
| Risk Exposure | | Statements of Assets and Liabilities Location | | Fair Value | | | |
|
Clough Global Allocation Fund | | | | | | | | |
Equity Contracts (Total Return Swap Contracts) | | Unrealized appreciation on total return swap contracts | | $ | 58,662 | | | |
Equity Contracts (Purchased Options) | | Investments, at value | | | 277,500 | | | |
Equity Contracts (Warrants) | | Investments, at value | | | 175,437 | | | |
|
Total | | | | $ | 511,599 | | | |
|
| | | |
Clough Global Equity Fund | | | | | | | | |
Equity Contracts (Total Return Swap Contracts) | | Unrealized appreciation on total return swap contracts | | $ | 98,363 | | | |
Equity Contracts (Purchased Options) | | Investments, at value | | | 462,500 | | | |
Equity Contracts (Warrants) | | Investments, at value | | | 293,580 | | | |
|
Total | | | | $ | 854,443 | | | |
|
| | | |
Clough Global Opportunities Fund | | | | | | | | |
Equity Contracts (Total Return Swap Contracts) | | Unrealized appreciation on total return swap contracts | | $ | 244,881 | | | |
Equity Contracts (Purchased Options) | | Investments, at value | | | 1,110,000 | | | |
Equity Contracts (Warrants) | | Investments, at value | | | 730,983 | | | |
|
Total | | | | $ | 2,085,864 | | | |
|
| | | |
| | | Liability Derivatives | | | | | |
|
| Risk Exposure | | Statements of Assets and Liabilities Location | | Fair Value | | | |
|
Clough Global Allocation Fund | | | | | | | | |
Equity Contracts (Written Options) | | Written Options, at value | | $ | (61,500) | | | |
Equity Contracts (Total Return Swap Contracts) | | Unrealized depreciation on total return swap contracts | | | (240,059) | | | |
|
Total | | | | $ | (301,559) | | | |
|
| | | |
Clough Global Equity Fund | | | | | | | | |
Equity Contracts (Written Options) | | Written Options, at value | | $ | (102,500) | | | |
Equity Contracts (Total Return Swap Contracts) | | Unrealized depreciation on total return swap contracts | | | (385,977) | | | |
|
Total | | | | $ | (488,477) | | | |
|
| | | |
Clough Global Opportunities Fund | | | | | | | | |
Equity Contracts (Written Options) | | Written Options, at value | | $ | (246,000) | | | |
Equity Contracts (Total Return Swap Contracts) | | Unrealized depreciation on total return swap contracts | | | (1,012,014) | | | |
|
Total | | | | $ | (1,258,014) | | | |
|
| | |
Annual Report | March 31, 2014 | | 41 |
| | |
Notes to Financial Statements | | Clough Global Funds |
| March 31, 2014 | | |
The effect of derivatives instruments on each Fund’s Statements of Operations for the year ended March 31, 2014:
| | | | | | | | | | | | |
| Risk Exposure | | Statements of Operations Location | | Realized Gain/(Loss)
on Derivatives
Recognized in Income | | | Change in Unrealized Appreciation/ (Depreciation) on Derivatives Recognized in Income | | | |
|
Clough Global Allocation Fund | | | | | | | | | | | | |
Equity Contracts
(Written Options) | | Net realized gain/(loss) on written options/Net change in unrealized appreciation/(depreciation) on written options | | $ | 1,157,134 | | | $ | 237,888 | | | |
Equity Contracts
(Total Return Swap Contracts) | | Net realized gain/(loss) on total return swap contracts/Net change in unrealized appreciation/(depreciation) on total return swap contracts | | | (397,065) | | | | 387,137 | | | |
Equity Contracts
(Purchased Options) | | Net realized gain/(loss) on investment securities/Net change in unrealized appreciation/(depreciation) on investment securities | | | (3,600,359) | | | | (503,112) | | | |
Equity Contracts
(Warrants) | | Net realized gain/(loss) on investment securities/ Net change in unrealized appreciation/(depreciation) on investment securities | | | – | | | | 174,267 | | | |
|
Total | | | | $ | (2,852,249) | | | $ | 296,180 | | | |
|
| | | | |
Clough Global Equity Fund | | | | | | | | | | | | |
Equity Contracts
(Written Options) | | Net realized gain/(loss) on written options/Net change in unrealized appreciation/(depreciation) on written options | | $ | 2,132,270 | | | $ | 396,480 | | | |
Equity Contracts
(Total Return Swap Contracts) | | Net realized gain/(loss) on total return swap contracts/Net change in unrealized appreciation/(depreciation) on total return swap contracts | | | (778,872) | | | | 912,341 | | | |
Equity Contracts
(Purchased Options) | | Net realized gain/(loss) on investment securities/Net change in unrealized appreciation/(depreciation) on investment securities | | | (6,000,598) | | | | (838,520) | | | |
Equity Contracts
(Warrants) | | Net realized gain/(loss) on investment securities/ Net change in unrealized appreciation/(depreciation) on investment securities | | | – | | | | 291,623 | | | |
|
Total | | | | $ | (4,667,040) | | | $ | 761,924 | | | |
|
| | | | |
Clough Global Opportunities Fund | | | | | | | | | | | | |
Equity Contracts
(Written Options) | | Net realized gain/(loss) on written options/Net change in unrealized appreciation/(depreciation) on written options | | $ | 2,518,366 | | | $ | 951,552 | | | |
Equity Contracts
(Total Return Swap Contracts) | | Net realized gain/(loss) on total return swap contracts/Net change in unrealized appreciation/(depreciation) on total return swap contracts | | | (1,681,206) | | | | 1,634,232 | | | |
Equity Contracts
(Purchased Options) | | Net realized gain/(loss) on investment securities/Net change in unrealized appreciation/(depreciation) on investment securities | | | (9,999,098) | | | | (2,078,544) | | | |
Equity Contracts
(Warrants) | | Net realized gain/(loss) on investment securities/ Net change in unrealized appreciation/(depreciation) on investment securities | | | – | | | | 726,110 | | | |
|
Total | | | | $ | (9,212,613) | | | $ | 1,233,350 | | | |
|
| | |
Clough Global Funds | | Notes to Financial Statements |
| | March 31, 2014 |
The average purchased and written option contracts volume during the year ended March 31, 2014, is noted below for each of the Funds.
| | | | |
| Fund | | Average Purchased Option Contract Volume | | Average Written Option Contract Volume |
|
Clough Global Allocation Fund | | 150 | | 577 |
Clough Global Equity Fund | | 250 | | 968 |
Clough Global Opportunities Fund | | 1,117 | | 2,797 |
|
The average total return swap contracts notional volume during the year ended March 31, 2014 is noted below for each of the Funds.
| | | | |
| Fund | | Average Swap Contract Notional Volume | |
| |
Clough Global Allocation Fund | | | $ 2,540,651 | |
Clough Global Equity Fund | | | $ 4,495,262 | |
Clough Global Opportunities Fund | | | $ 10,720,185 | |
The warrants held by the Funds at March 31, 2014, is representative of the activity during the year ended March 31, 2014.
Certain derivative contracts are executed under either standardized netting agreements or, for exchange-traded derivatives, the relevant contracts for a particular exchange which contain enforceable netting provisions. A derivative netting arrangement creates an enforceable right of set-off that becomes effective, and affects the realization of settlement on individual assets, liabilities and collateral amounts, only following a specified event of default or early termination. Default events may include the failure to make payments or deliver securities timely, material adverse changes in financial condition or insolvency, the breach of minimum regulatory capital requirements, or loss of license, charter or other legal authorization necessary to perform under the contract.
| | | | | | | | | | | | |
| Offsetting of Derivatives Assets | | | | | | | | | | |
|
| March 31, 2014 | | | | | | | | |
| | | | | | | | | | | Gross Amounts Not
Offset in the
Statements of
Assets and
Liabilities | | |
| | | | | | | | |
| Description | | Gross Amounts of
Recognized Assets | | Gross Amounts
Offset in the
Statements of
Assets and
Liabilities | | Net Amounts
Presented in the
Statements of
Assets and
Liabilities | | Financial
Instruments(a) | | Cash Collateral
Pledged(a) | | Net Amount |
|
Clough Global Allocation Fund | | | | | | | | | | | | |
Total Return Swap Contracts | | $58,662 | | $– | | $58,662 | | $– | | $– | | $– |
|
Total | | $58,662 | | $– | | $58,662 | | $– | | $– | | $– |
|
| | | | | | |
Clough Global Equity Fund | | | | | | | | | | | | |
Total Return Swap Contracts | | $98,363 | | $– | | $98,363 | | $– | | $– | | $– |
|
Total | | $98,363 | | $– | | $98,363 | | $– | | $– | | $– |
|
| | | | | | |
Clough Global Opportunities Fund | | | | | | | | | | | | |
Total Return Swap Contracts | | $244,881 | | $– | | $244,881 | | $– | | $– | | $– |
|
Total | | $244,881 | | $– | | $244,881 | | $– | | $– | | $– |
|
| | |
Annual Report | March 31, 2014 | | 43 |
| | |
Notes to Financial Statements | | Clough Global Funds |
| March 31, 2014 | | |
| | | | | | | | | | | | | | | | | | | | | | | | |
| Offsetting of Derivatives Liabilities | |
| |
| March 31, 2014 | | | | | | | | | | | | | |
| | | | | | | | | | | | | | | Gross Amounts Not
Offset in the
Statements of
Assets and
Liabilities | | | | |
| Description | | Gross Amounts of
Recognized
Liabilities | | | Gross Amounts
Offset in the
Statements of
Assets and
Liabilities | | | Net Amounts
Presented in the
Statements of
Assets and
Liabilities | | | Financial
Instruments(a) | | | Cash Collateral Pledged(a) | | | Net Amount | |
| |
Clough Global Allocation Fund | | | | | | | | | | | | | | | | | | | | | | | | |
Total Return Swap Contracts | | $ | (240,059 | ) | | $ | – | | | $ | (240,059 | ) | | $ | 58,662 | | | $ | 181,397 | | | $ | – | |
| |
Total | | $ | (240,059 | ) | | $ | – | | | $ | (240,059 | ) | | $ | 58,662 | | | $ | 181,397 | | | $ | – | |
| |
| | | | | | |
Clough Global Equity Fund | | | | | | | | | | | | | | | | | | | | | | | | |
Total Return Swap Contracts | | $ | (385,977 | ) | | $ | – | | | $ | (385,977 | ) | | $ | 98,363 | | | $ | 287,614 | | | $ | – | |
| |
Total | | $ | (385,977 | ) | | $ | – | | | $ | (385,977 | ) | | $ | 98,363 | | | $ | 287,614 | | | $ | – | |
| |
| | | | | | |
Clough Global Opportunities Fund | | | | | | | | | | | | | | | | | | | | | | | | |
Total Return Swap Contracts | | $ | (1,012,014 | ) | | $ | – | | | $ | (1,012,014 | ) | | $ | 244,881 | | | $ | 767,133 | | | $ | – | |
| |
Total | | $ | (1,012,014 | ) | | $ | – | | | $ | (1,012,014 | ) | | $ | 244,881 | | | $ | 767,133 | | | $ | – | |
| |
| (a) | These amounts are limited to the derivative asset/liability balance and, accordingly, do not include excess collateral received/pledged. |
Income Taxes: Each Fund’s policy is to comply with the provisions of the Internal Revenue Code applicable to regulated investment companies and to distribute all of its taxable income to its shareholders. Therefore, no federal income tax provision is required. As of and during the year ended March 31, 2014, the Funds did not have a liability for any unrecognized tax benefits. The Funds file U.S. federal, state, and local tax returns as required. The Funds’ tax returns are subject to examination by the relevant tax authorities until expiration of the applicable statute of limitations, which is generally three years after the filing of the tax return but which can be extended to six years in certain circumstances. Tax returns for open years have incorporated no uncertain tax positions that require a provision for income taxes.
Distributions to Shareholders: Each Fund intends to make a level dividend distribution each month to Common Shareholders after payment of interest on any outstanding borrowings. The level dividend rate may be modified by the Board of Trustees from time to time. Any net capital gains earned by a Fund are distributed at least annually to the extent necessary to avoid federal income and excise taxes. Distributions to shareholders are recorded by each Fund on the ex-dividend date. Each Fund has received approval from the Securities and Exchange Commission (the “Commission”) for exemption from Section 19(b) of the 1940 Act, and Rule 19b-1 there under permitting each Fund to make periodic distributions of long-term capital gains, provided that the distribution policy of a fund with respect to its Common Shares calls for periodic (e.g. quarterly/monthly) distributions in an amount equal to a fixed percentage of each Fund’s average net asset value over a specified period of time or market price per common share at or about the time of distributions or pay-out of a level dollar amount.
Securities Transactions and Investment Income: Investment security transactions are accounted for on a trade date basis. Dividend income and Dividend expense-short sales are recorded on the ex-dividend date. Certain dividend income from foreign securities will be recorded, in the exercise of reasonable diligence, as soon as a Fund is informed of the dividend if such information is obtained subsequent to the ex-dividend date and may be subject to withholding taxes in these jurisdictions. Interest income, which includes amortization of premium and accretion of discount, is recorded on the accrual basis. Realized gains and losses from securities transactions and unrealized appreciation and depreciation of securities are determined using the highest cost basis for both financial reporting and income tax purposes.
Counterparty Risk: Each of the Funds run the risk that the issuer or guarantor of a fixed income security, the counterparty to an over-the-counter derivatives contract, a borrower of each Fund’s securities or the obligor of an obligation underlying an asset-backed security will be unable or unwilling to make timely principal, interest, or settlement payments or otherwise honor its obligations. In addition, to the extent that each of the Funds use over-the-counter derivatives, and/or has significant exposure to a single counterparty, this risk will be particularly pronounced for each of the Funds.
| | |
Clough Global Funds | | Notes to Financial Statements |
| | March 31, 2014 |
Other Risk Factors: Investing in the Funds may involve certain risks including, but not limited to, the following:
Unforeseen developments in market conditions may result in the decline of prices of, and the income generated by, the securities held by the Funds. These events may have adverse effects on the Funds such as a decline in the value and liquidity of many securities held by the Funds, and a decrease in net asset value. Such unforeseen developments may limit or preclude the Funds’ ability to achieve their investment objective.
Investing in stocks may involve larger price fluctuation and greater potential for loss than other types of investments. This may cause the securities held by the Funds to be subject to larger short-term declines in value.
The Funds may have elements of risk due to concentrated investments in foreign issuers located in a specific country. Such concentrations may subject the Funds to additional risks resulting from future political or economic conditions and/or possible impositions of adverse foreign governmental laws or currency exchange restrictions. Investments in securities of non-U.S. issuers have unique risks not present in securities of U.S. issuers, such as greater price volatility and less liquidity. At March 31, 2014, Clough Global Allocation Fund, Clough Global Equity Fund and Clough Global Opportunities Fund each had a significant concentration of their investment securities (Investments, at value recorded on the Statements of Assets and Liabilities) in companies based in the United States – 104.96%, 101.89% and 104.88% of net assets, respectively.
Fixed income securities are subject to credit risk, which is the possibility that a security could have its credit rating downgraded or that the issuer of the security could fail to make timely payments or default on payments of interest or principal. Additionally, fixed income securities are subject to interest rate risk, meaning the decline in the price of debt securities that accompanies a rise in interest rates. Bonds with longer maturities are subject to greater price fluctuations than bonds with shorter maturities.
The Funds invest in bonds which are rated below investment grade. These high yield bonds may be more susceptible than higher grade bonds to real or perceived adverse economic or industry conditions. The secondary market, on which high yield bonds are traded, may also be less liquid than the market for higher grade bonds.
New Accounting Pronouncement: In June 2013, the Financial Accounting Standards Board (the “FASB”) issued Accounting Standards Update (“ASU”) No. 2013-08, Financial Services-Investment Companies (Topic 946): Amendments to the Scope, Measurement, and Disclosure Requirements. The FASB standard identifies characteristics a company must assess to determine whether is considered an investment company for financial reporting purposes. This ASU is effective for fiscal years beginning after December 15, 2013. The Funds believe the adoption of this ASU will not have a material impact on the financial statements.
2. TAXES
Classification of Distributions: Net investment income/(loss) and net realized gain/(loss) may differ for financial statement and tax purposes. The character of distributions made during the year from net investment income or net realized gains may differ from its ultimate characterization for federal income tax purposes. Also, due to the timing of dividend distributions, the fiscal year in which amounts are distributed may differ from the fiscal year in which the income or realized gain was recorded by the Funds.
The tax character of the distributions paid by the Funds during the years ended March 31, 2014 and March 31, 2013 were as follows:
| | | | | | | | | | | | | | | | | | | | | | | | |
| | | Clough Global Allocation Fund | | | Clough Global Equity Fund | | | Clough Global Opportunities Fund | |
| Distributions Paid From: | | 2014 | | | 2013 | | | 2014 | | | 2013 | | | 2014 | | | 2013 | |
Ordinary Income | | $ | 2,508,129 | | | $ | 9,391,145 | | | $ | 6,725,986 | | | $ | 15,521,413 | | | $ | 5,714,309 | | | $ | 55,875,807 | |
Long-Term Capital Gains | | | 13,300,299 | | | | 3,130,382 | | | | 19,589,053 | | | | 5,173,804 | | | | 64,906,503 | | | | – | |
| |
Total | | $ | 15,808,428 | | | $ | 12,521,527 | | | $ | 26,315,039 | | | $ | 20,695,217 | | | $ | 70,620,812 | | | $ | 55,875,807 | |
| |
Components of Earnings: Tax components of distributable earnings are determined in accordance with income tax regulations which may differ from composition of net assets reported under accounting principles generally accepted in the United States. Accordingly, for the year ended March 31, 2014, certain differences were reclassified. These differences relate primarily to the differing tax treatment of commodities, passive foreign investment companies (PFICs), foreign currencies and other investments.
The reclassifications were as follows:
| | | | | | | | | | | | |
| | | Undistributed Ordinary
Income | | | Accumulated Capital
Gain/(Loss) | | | Paid-in Capital | |
Clough Global Allocation Fund | | $ | 6,203,127 | | | $ | (6,203,127) | | | $ | – | |
Clough Global Equity Fund | | | 14,640,737 | | | | (14,640,737) | | | | – | |
Clough Global Opportunities Fund | | | 22,798,008 | | | | (3,713,030) | | | | (19,084,978) | |
| | | | | | | | | | | | |
| | |
Annual Report | March 31, 2014 | | 45 |
| | |
Notes to Financial Statements | | Clough Global Funds |
| March 31, 2014 | | |
Included in the amounts reclassified for Clough Global Opportunities Fund was $13,370,669 of net operating loss.
Capital Losses: As of March 31, 2014, the Funds had no capital loss carryforwards which may reduce the Funds’ taxable income arising from future net realized gains on investments, if any, to the extent permitted by the Code and thus may reduce the amount of the distributions to shareholders which would otherwise be necessary to relieve the Funds of any liability for federal tax.
During the year ended March 31, 2014, $30,946,429 of capital loss carryforwards were utilized by Clough Global Opportunities Fund.
Under the Regulated Investment Company Modernization Act of 2010 (the “Act”), net capital losses recognized in tax years beginning after December 22, 2010, may be carried forward indefinitely, and the character of the losses is retained as short-term and/or long-term. Under the law in effect prior to the Act, net capital losses were carried forward for eight years and treated as short-term. As a transition rule, the Act requires that post-enactment net capital losses be used before pre-enactment net capital losses.
The Funds elect to defer to the year ending March 31, 2015, late year ordinary losses in the amounts of:
| | | | |
| Fund | | Amount | |
Clough Global Opportunities Fund | | $ | 4,570,173 | |
Tax Basis of Distributable Earnings: Tax components of distributable earnings are determined in accordance with income tax regulations which may differ from composition of net assets reported under GAAP.
As of March 31, 2014, the components of distributable earnings on a tax basis were as follows:
| | | | | | | | | | | | |
| | | Clough Global
Allocation Fund | | | Clough Global Equity
Fund | | | Clough Global
Opportunities Fund | |
Accumulated net realized gain on investments | | $ | 6,885,029 | | | $ | 14,527,040 | | | $ | – | |
Net unrealized appreciation on investments | | | 9,316,780 | | | | 24,281,316 | | | | 47,341,248 | |
Other accumulated gains/(losses) | | | 446,748 | | | | 729,866 | | | | (2,741,615) | |
| |
Total | | $ | 16,648,557 | | | $ | 39,538,222 | | | $ | 44,599,633 | |
| |
Tax Basis of Investments: Net unrealized appreciation/(depreciation) of investments based on federal tax cost as of March 31, 2014, were as follows:
| | | | | | | | | | | | |
| | | Clough Global
Allocation Fund | | | Clough Global Equity
Fund | | | Clough Global
Opportunities Fund | |
Gross appreciation (excess of value over tax cost) | | $ | 21,046,225 | | | $ | 44,867,253 | | | $ | 95,948,974 | |
Gross depreciation (excess of tax cost over value) | | | (6,821,607) | | | | (12,329,783) | | | | (27,958,233) | |
Net depreciation (excess of value over tax cost) of foreign currency and derivatives | | | (4,907,838) | | | | (8,256,154) | | | | (20,649,493) | |
| |
Net unrealized appreciation | | $ | 9,316,780 | | | $ | 24,281,316 | | | $ | 47,341,248 | |
| |
Cost of investments for income tax purposes | | $ | 256,068,590 | | | $ | 419,873,351 | | | $ | 1,057,482,268 | |
| |
3. CAPITAL TRANSACTIONS
Common Shares: There are an unlimited number of no par value common shares of beneficial interest authorized for each Fund.
Transactions in common shares were as follows:
| | | | | | | | | | | | | | | | | | | | | | | | |
| | | Clough Global Allocation Fund | | | Clough Global Equity Fund | | | Clough Global Opportunities Fund | |
| | | For the
Year Ended
March 31, 2014 | | | For the
Year Ended
March 31, 2013 | | | For the Year Ended
March 31, 2014 | | | For the
Year Ended
March 31, 2013 | | | For the
Year Ended
March 31, 2014 | | | For the
Year Ended
March 31, 2013 | |
Common Shares Outstanding - beginning of period | | | 10,434,606 | | | | 10,434,606 | | | | 17,840,705 | | | | 17,840,705 | | | | 51,736,859 | | | | 51,736,859 | |
Common Shares Issued as reinvestment of dividends | | | – | | | | – | | | | – | | | | – | | | | – | | | | – | |
| |
Common Shares Outstanding - end of period | | | 10,434,606 | | | | 10,434,606 | | | | 17,840,705 | | | | 17,840,705 | | | | 51,736,859 | | | | 51,736,859 | |
| |
| | |
Clough Global Funds | | Notes to Financial Statements |
| | March 31, 2014 |
4. PORTFOLIO SECURITIES
Purchases and sales of investment securities, other than short-term securities, for the year ended March 31, 2014, are listed in the table below.
| | | | | | | | | | | | | | | | |
| Fund | | Cost of Investments
Purchased | | | Proceeds From
Investments Sold | | | Purchases of Long-Term
U.S. Government
Obligations | | | Proceeds from Sales of Long-Term U.S.
Government Obligations | |
Clough Global Allocation Fund | | $ | 403,790,148 | | | $ | 412,137,560 | | | $ | 39,336,039 | | | $ | 68,928,532 | |
Clough Global Equity Fund | | | 653,711,582 | | | | 680,357,927 | | | | 51,024,962 | | | | 82,736,905 | |
Clough Global Opportunities Fund | | | 1,677,757,842 | | | | 1,733,688,237 | | | | 169,710,920 | | | | 298,879,879 | |
5. INVESTMENT ADVISORY AND ADMINISTRATION AGREEMENTS
Clough serves as each Fund’s investment adviser pursuant to an Investment Advisory Agreement (each an “Advisory Agreement” and collectively, the “Advisory Agreements”) with each Fund. As compensation for its services to the Fund, Clough receives an annual investment advisory fee of 0.70%, 0.90% and 1.00% based on Clough Global Allocation Fund’s, Clough Global Equity Fund’s and Clough Global Opportunities Fund’s, respectively, average daily total assets, computed daily and payable monthly. ALPS Fund Services, Inc. (“ALPS”) serves as each Fund’s administrator pursuant to an Administration, Bookkeeping and Pricing Services Agreement with each Fund. As compensation for its services to each Fund, ALPS receives an annual administration fee of 0.285%, 0.32%, and 0.32% based on Clough Global Allocation Fund’s, Clough Global Equity Fund’s and Clough Global Opportunities Fund’s, respectively, average daily total assets, computed daily and payable monthly. ALPS will pay all expenses incurred by each Fund, with the exception of advisory fees, trustees’ fees, portfolio transaction expenses, litigation expenses, taxes, expenses of conducting repurchase offers for the purpose of repurchasing fund shares, interest on margin accounts, interest on loans, dividends on short sales, and extraordinary expenses.
Both Clough and ALPS are considered to be “affiliates” of the Funds as defined in the 1940 Act.
6. COMMITTED FACILITY AGREEMENT AND LENDING AGREEMENT
Each Fund entered into a financing package that includes a Committed Facility Agreement (the “Agreement”) dated January 16, 2009, as amended, between each Fund and BNP Paribas Prime Brokerage, Inc. (“BNP”) that allows each Fund to borrow funds from BNP. Each Fund is currently borrowing the maximum commitment covered by the agreement. Borrowings under the Agreement are secured by assets of each Fund that are held by a Fund’s custodian in a separate account (the “pledged collateral”) valued at $158,829,323, $281,304,707 and $667,632,524 for Clough Global Allocation Fund, Clough Global Equity Fund and Clough Global Opportunities Fund, respectively. Each Fund may, with 30 days notice, reduce the Maximum Commitment Financing (Initial Limit amount plus the increased borrowing amount in excess of the Initial Limit) to a lesser amount if drawing on the full amount would result in a violation of the applicable asset coverage requirement of Section 18 of the 1940 Act. Interest is charged at the three month LIBOR (London Inter-bank Offered Rate) plus 0.75% on the amount borrowed and 0.65% on the undrawn balance. Each Fund also pays a one-time arrangement fee of 0.25% on (i) the Initial Limit and (ii) any increased borrowing amount in the excess of the Initial Limit, paid in monthly installments for the six months immediately following the date on which borrowings were drawn by the Fund.
The Agreement was amended on December 31, 2013, to increase the Maximum Commitment Financing to $93,300,000 for the Clough Global Allocation Fund and $156,000,000 for the Clough Global Equity Fund.
For the year ended March 31, 2014 the average borrowings outstanding for Clough Global Allocation Fund, Clough Global Equity Fund and Clough Global Opportunities Fund under the agreement were $90,672,603, $149,243,836 and $388,900,000, respectively, and the average interest rate for the borrowings was 1.00%. As of March 31, 2014, the outstanding borrowings for Clough Global Allocation Fund, Clough Global Equity Fund and Clough Global Opportunities Fund were $93,300,000, $156,000,000 and $388,900,000, respectively. The interest rate applicable to the borrowings of Clough Global Allocation Fund, Clough Global Equity Fund and Clough Global Opportunities Fund on March 31, 2014, was 0.98%.
The Lending Agreement is a separate side-agreement between each Fund and BNP pursuant to which BNP may borrow a portion of the pledged collateral (the “Lent Securities”) in an amount not to exceed the outstanding borrowings owed by a Fund to BNP under the Agreement. The Lending Agreement is intended to permit each Fund to significantly reduce the cost of its borrowings under the Agreement. BNP has the ability to reregister the Lent Securities in its own name or in another name other than the Fund to pledge, re-pledge, sell, lend or otherwise transfer or use the collateral with all attendant rights of ownership. (It is each Fund’s understanding that BNP will perform due diligence to determine the creditworthiness of any party that borrows Lent Securities from BNP.) Each Fund may designate any security within the pledged collateral as ineligible to be a Lent Security, provided there are eligible securities within the pledged collateral in an amount equal to the outstanding borrowing owed by a Fund. During the period in which the Lent Securities are outstanding, BNP must remit payment to each Fund equal to the amount of all dividends, interest or other distributions earned or made by the Lent Securities.
| | |
Annual Report | March 31, 2014 | | 47 |
| | |
Notes to Financial Statements | | Clough Global Funds |
| March 31, 2014 | | |
Under the terms of the Lending Agreement, the Lent Securities are marked to market daily, and if the value of the Lent Securities exceeds the value of the then-outstanding borrowings owed by a Fund to BNP under the Agreement (the “Current Borrowings”), BNP must, on that day, either (1) return Lent Securities to each Fund’s custodian in an amount sufficient to cause the value of the outstanding Lent Securities to equal the Current Borrowings; or (2) post cash collateral with each Fund’s custodian equal to the difference between the value of the Lent Securities and the value of the Current Borrowings. If BNP fails to perform either of these actions as required, each Fund will recall securities, as discussed below, in an amount sufficient to cause the value of the outstanding Lent Securities to equal the Current Borrowings. Each Fund can recall any of the Lent Securities and BNP shall, to the extent commercially possible, return such security or equivalent security to each Fund’s custodian no later than three business days after such request. If a Fund recalls a Lent Security pursuant to the Lending Agreement, and BNP fails to return the Lent Securities or equivalent securities in a timely fashion, BNP shall remain liable for the ultimate delivery to each Fund’s custodian of such Lent Securities, or equivalent securities, and for any buy-in costs that the executing broker for the sales transaction may impose with respect to the failure to deliver. Under the terms of the Lending Agreement, each Fund shall have the right to apply and set-off an amount equal to one hundred percent (100%) of the then current fair market value of such Lent Securities against the Current Borrowings. As of March 31, 2014, the market value of the Lent Securities for Clough Global Allocation Fund, Clough Global Equity Fund and Clough Global Opportunities Fund were $17,656,495, $29,895,511 and $78,397,982, respectively.
The Board of Trustees has approved each Agreement and the Lending Agreement. No violations of the Agreement or the Lending Agreement have occurred during the year ended March 31, 2014.
Each Fund receives income from BNP based on the value of the Lent Securities. This income is recorded as Hypothecated securities income on the Statements of Operations. The interest incurred on borrowed amounts is recorded as Interest on loan in the Statements of Operations, a part of Total Expenses.
7. OTHER
The Independent Trustees of each Fund receive from each Fund a quarterly retainer of $3,500 and an additional $1,500 for each board meeting attended. The Chairman of the Board of Trustees of each Fund receives a quarterly retainer from each Fund of $4,200 and an additional $1,800 for each board meeting attended. The Chairman of the Audit Committee of each Fund receives a quarterly retainer from each Fund of $3,850 and an additional $1,650 for each board meeting attended.
| | |
Clough Global Funds | | Dividend Reinvestment Plan |
| | March 31, 2014 (Unaudited) |
Unless the registered owner of Common Shares elects to receive cash by contacting DST Sytems, Inc. (the “Plan Administrator”), all dividends declared on Common Shares will be automatically reinvested by the Plan Administrator for shareholders in each Fund’s Dividend Reinvestment Plan (the “Plan”), in additional Common Shares. Shareholders who elect not to participate in the Plan will receive all dividends and other distributions in cash paid by check mailed directly to the shareholder of record (or, if the Common Shares are held in street or other nominee name, then to such nominee) by the Plan Administrator as dividend disbursing agent. You may elect not to participate in the Plan and to receive all dividends in cash by contacting the Plan Administrator, as dividend disbursing agent, at the address set forth below. Participation in the Plan is completely voluntary and may be terminated or resumed at any time without penalty by notice if received and processed by the Plan Administrator prior to the dividend record date; otherwise such termination or resumption will be effective with respect to any subsequently declared dividend or other distribution. Some brokers may automatically elect to receive cash on your behalf and may re–invest that cash in additional Common Shares for you. If you wish for all dividends declared on your Common Shares to be automatically reinvested pursuant to the Plan, please contact your broker.
The Plan Administrator will open an account for each Common Shareholder under the Plan in the same name in which such Common Shareholder’s Common Shares are registered. Whenever a Fund declares a dividend or other distribution (together, a “Dividend”) payable in cash, non–participants in the Plan will receive cash and participants in the Plan will receive the equivalent in Common Shares. The Common Shares will be acquired by the Plan Administrator for the participants’ accounts, depending upon the circumstances described below, either (i) through receipt of additional unissued but authorized Common Shares from a Fund (“Newly Issued Common Shares”) or (ii) by purchase of outstanding Common Shares on the open market (“Open–Market Purchases”) on the American Stock Exchange or elsewhere. If, on the payment date for any Dividend, the closing market price plus estimated brokerage commissions per Common Share is equal to or greater than the net asset value per Common Share, the Plan Administrator will invest the Dividend amount in Newly Issued Common Shares on behalf of the participants. The number of Newly Issued Common Shares to be credited to each participant’s account will be determined by dividing the dollar amount of the Dividend by the net asset value per Common Share on the payment date; provided that, if the net asset value is less than or equal to 95% of the closing market value on the payment date, the dollar amount of the Dividend will be divided by 95% of the closing market price per Common Share on the payment date. If, on the payment date for any Dividend, the net asset value per Common Share is greater than the closing market value plus estimated brokerage commissions, the Plan Administrator will invest the Dividend amount in Common Shares acquired on behalf of the participants in Open–Market Purchases. In the event of a market discount on the payment date for any Dividend, the Plan Administrator will have until the last business day before the next date on which the Common Shares trade on an “ex–dividend” basis or 30 days after the payment date for such Dividend, whichever is sooner (the “Last Purchase Date”), to invest the Dividend amount in Common Shares acquired in Open–Market Purchases. If, before the Plan Administrator has completed its Open–Market Purchases, the market price per Common Share exceeds the net asset value per Common Share, the average per Common Share purchase price paid by the Plan Administrator may exceed the net asset value of the Common Shares, resulting in the acquisition of fewer Common Shares than if the Dividend had been paid in Newly Issued Common Shares on the Dividend payment date. Because of the foregoing difficulty with respect to Open–Market Purchases, the Plan provides that if the Plan Administrator is unable to invest the full Dividend amount in Open–Market Purchases during the purchase period or if the market discount shifts to a market premium during the purchase period, the Plan Administrator may cease making Open–Market Purchases and may invest the uninvested portion of the Dividend amount in Newly Issued Common Shares at the net asset value per Common Share at the close of business on the Last Purchase Date provided that, if the net asset value is less than or equal to 95% of the then current market price per Common Share; the dollar amount of the Dividend will be divided by 95% of the market price on the payment date.
The Plan Administrator maintains all shareholders’ accounts in the Plan and furnishes written confirmation of all transactions in the accounts, including information needed by shareholders for tax records. Common Shares in the account of each Plan participant will be held by the Plan Administrator on behalf of the Plan participant, and each shareholder proxy will include those shares purchased or received pursuant to the Plan. The Plan Administrator will forward all proxy solicitation materials to participants and vote proxies for shares held under the Plan in accordance with the instructions of the participants.
In the case of Common Shareholders such as banks, brokers or nominees which hold shares for others who are the beneficial owners, the Plan Administrator will administer the Plan on the basis of the number of Common Shares certified from time to time by the record shareholder’s name and held for the account of beneficial owners who participate in the Plan.
There will be no brokerage charges with respect to Common Shares issued directly by a Fund. However, each participant will pay a pro rata share of brokerage commissions incurred in connection with Open–Market Purchases. The automatic reinvestment of Dividends will not relieve participants of any federal, state or local income tax that may be payable (or required to be withheld) on such Dividends. Participants that request a sale of Common Shares through the Plan Administrator are subject to brokerage commissions.
Each Fund reserves the right to amend or terminate the Plan. There is no direct service charge to participants with regard to purchases in the Plan; however, each Fund reserves the right to amend the Plan to include a service charge payable by the participants.
All correspondence or questions concerning the Plan should be directed to the Plan Administrator, DST Systems, Inc., 333 West 11th Street, 5th Floor, Kansas City, Missouri 64105.
| | |
Annual Report | March 31, 2014 | | 49 |
| | |
Additional Information | | Clough Global Funds |
| March 31, 2014 (Unaudited) | | |
FUND PROXY VOTING POLICIES & PROCEDURES
Each Fund’s policies and procedures used in determining how to vote proxies relating to portfolio securities are available on the Funds’ website at http://www.cloughglobal.com. Information regarding how each Fund voted proxies relating to portfolio securities held by each Fund for the period ended June 30, are available without charge, upon request, by contacting the Funds at 1-877-256-8445 and on the Commission’s website at http://www.sec.gov.
PORTFOLIO HOLDINGS
The Funds file their complete schedule of portfolio holdings with the Commission for the first and third quarters of each fiscal year on Form N–Q within 60 days after the end of the period. Copies of the Funds’ Form N–Q are available without a charge, upon request, by contacting the Funds at 1–877–256–8445 and on the Commission’s website at http://www.sec.gov. You may also review and copy Form N–Q at the Commission’s Public Reference Room in Washington, D.C. For more information about the operation of the Public Reference Room, please call the Commission at 1–800–SEC–0330.
NOTICE
Notice is hereby given in accordance with Section 23(c) of the Investment Company Act of 1940 that each Fund may purchase at market prices from time to time shares of its common stock in the open market.
SECTION 19(A) NOTICES
The following table sets forth the estimated amount of the sources of distribution for purposes of Section 19 of the Investment Company Act of 1940, as amended, and the related rules adopted there under. Each Fund estimates the following percentages, of the total distribution amount per share, attributable to (i) current and prior fiscal year net investment income, (ii) net realized short-term capital gain, (iii) net realized long-term capital gain and (iv) return of capital or other capital source as a percentage of the total distribution amount. These percentages are disclosed for the fiscal year-to-date cumulative distribution amount per share for the Fund.
The amounts and sources of distributions reported in these 19(a) notices are only estimates and not for tax reporting purposes. The actual amounts and sources of the amounts for tax reporting purposes will depend upon the Fund’s investment experience during the remainder of its fiscal year and may be subject to changes based on tax regulations. The Fund will send you a Form 1099-DIV for the calendar year that will tell you how to report these distributions for federal income tax purposes.
| | | | | | | | | | | | | | | | | | | | | | | | | | | | | | | | |
| | | Total Cumulative Distributions for the
year ended March 31, 2014 | | | % Breakdown of the Total Cumulative Distributions
for the year ended March 31, 2014 | |
| | | Net
Investment
Income | | | Net
Realized
Capital
Gains | | | Return of
Capital | | | Total Per
Common
Share | | | Net
Investment
Income | | | Net
Realized
Capital
Gains | | | Return of
Capital | | | Total Per
Common
Share | |
Clough Global Allocation Fund | | $ | 0.0000 | | | $ | 1.2066 | | | $ | 0.3084 | | | $ | 1.5150 | | | | 0.00 | % | | | 79.64 | % | | | 20.36 | % | | | 100.00 | % |
Clough Global Equity Fund | | $ | 0.0000 | | | $ | 1.3383 | | | $ | 0.1367 | | | $ | 1.4750 | | | | 0.00 | % | | | 90.73 | % | | | 9.27 | % | | | 100.00 | % |
Clough Global Opportunities Fund | | $ | 0.0000 | | | $ | 0.5550 | | | $ | 0.8100 | | | $ | 1.3650 | | | | 0.00 | % | | | 40.66 | % | | | 59.34 | % | | | 100.00 | % |
Each Fund’s dividend policy is to distribute all or a portion of its net investment income to its shareholders on a monthly basis. In order to provide shareholders with a more stable level of dividend distributions, each Fund may at times pay out less than the entire amount of net investment income earned in any particular month and may at times in any particular month pay out such accumulated but undistributed income in addition to net investment income earned in that month. As a result, the dividends paid by each Fund for any particular month may be more or less than the amount of net investment income earned by the Fund during such month. Each Fund’s current accumulated but undistributed net investment income, if any, is disclosed in the Statements of Assets and Liabilities, which comprises part of the financial information included in this report.
TAX DESIGNATIONS
Pursuant to Section 852(b)(3) of the Internal Revenue Code, Clough Global Allocation Fund, Clough Global Equity Fund, and Clough Global Opportunities Fund designate $13,300,299, $19,589,053 and $64,906,503 respectively as a long-term capital gain distribution.
The Funds hereby designate the following as a percentage of taxable ordinary income distributions, or up to the maximum amount allowable, for the calendar year ended December 31, 2013:
| | | | | | |
| | | Clough Global Allocation Fund | | Clough Global Equity Fund | | Clough Global Opportunities Fund |
Corporate Dividends Received Deduction | | 10.11% | | 10.67% | | 9.05% |
Qualified Dividend Income | | 13.27% | | 14.94% | | 12.86% |
Please consult a tax advisor if you have questions about federal or state income tax laws, or how to prepare your tax returns.
| | |
Clough Global Funds | | Trustees & Officers |
| | March 31, 2014 (Unaudited) |
| | | | | | | | | | |
Name, Address1
and Year of Birth | | Position(s) Held with the Funds | | Term of
office and length of service with GLV2, GLQ3 & GLO4 | | Principal Occupation(s) During Past Five Years | | Number of Portfolios in Fund Complex Overseen by Trustee5 | | Other Directorships Held by Trustee During
the Past Five Years |
Non-Interested Trustees/Nominees |
| Robert L. Butler | | Chairman of the Board and Trustee | | Trustee since: | | Since 2001, Mr. Butler has been an independent consultant for businesses. Mr. Butler has over 45 years experience in the investment business, including 17 years as a senior executive with a global investment management/natural resources company and 20 years with a securities industry regulation organization, neither of which Mr. Butler has been employed by since 2001. | | 3 | | None |
| 1941 | | | GLV: 2004 | | | | | |
| | | GLQ: 2005 | | | | | |
| | | GLO: 2006 | | | | | |
| | | | | | | | |
| | | | Term expires: | | | | | |
| | | | GLV: 2015 | | | | | |
| | | | GLQ: 2016 | | | | | |
| | | | GLO: 2014 | | | | | |
| | | | | | | | | |
| | | | | | | | | | |
| Adam D. Crescenzi | | Trustee | | Trustee since: | | Mr. Crescenzi is a Trustee of Dean College. He has been a founder and investor of several start-up technology and service firms. He currently is the Founding Partner of Simply Tuscan Imports LLC since 2007. He also serves as a Director of two non-profit organizations. He retired from CSC Index as Executive Vice-President of Management Consulting Services. | | 3 | | None |
| 1942 | | | | GLV: 2004 | | | | | |
| | | | GLQ: 2005 | | | | | |
| | | | GLO: 2006 | | | | | |
| | | | | | | | | |
| | | | Term expires: | | | | | |
| | | | GLV: 2014 | | | | | |
| | | | GLQ: 2015 | | | | | |
| | | | GLO: 2016 | | | | | |
| | | | | | | | | | |
| John F. Mee | | Trustee | | Trustee since: | | Mr. Mee is an attorney practicing commercial law, family law, product liability and criminal law. Mr. Mee is currently a member of the Bar of the Commonwealth of Massachusetts. He serves on the Board of Directors of The College of the Holy Cross Alumni Association and Concord Carlisle Scholarship Fund, a Charitable Trust. Mr. Mee was from 1990 to 2009 an Advisor at the Harvard Law School Trial Advocacy Workshop. | | 3 | | None |
| 1943 | | | | GLV: 2004 | | | | | |
| | | | GLQ: 2005 | | | | | |
| | | | GLO: 2006 | | | | | |
| | | | | | | | | |
| | | | Term expires: | | | | | |
| | | | GLV: 2016 | | | | | |
| | | | GLQ: 2014 | | | | | |
| | | | GLO: 2015 | | | | | |
| | | | | | | | | |
| | | | | | | | | |
| | | | | | | | | | |
Richard C. Rantzow 1938 | | Trustee | | Trustee since:
GLV: 2004 GLQ: 2005 GLO: 2006 Term expires: GLV: 2015 GLQ: 2016 GLO: 2014 | | Mr. Rantzow has over 40 years experience in the financial industry. His professional experience includes serving as an audit partner with Ernst & Young which specifically involved auditing financial institutions. Mr. Rantzow has also served in several executive positions in both financial and non-financial industries. Mr. Rantzow’s educational background is in accounting and he is a Certified Public Accountant who has continued to serve on several audit committees of various financial organizations. | | 3 | | Mr. Rantzow is a Trustee and Chairman of the Audit Committee of the Liberty All-Star Equity Fund and Director and Chairman of the Audit Committee of the Liberty All-Star Growth Fund, Inc. |
| | | | | | | | |
| | | | | | | | |
| | | | | | | | |
| | | | | | | | |
| | | | | | | | |
| | | | | | | | |
| | | | | | | | |
| | | | | | | | |
| | | | | | | | |
| | | | | | | | | |
| | | | | | | | | |
| | | | | | | | | |
| | | | | | | | | |
| | |
Annual Report | March 31, 2014 | | 51 |
| | |
Trustees & Officers | | Clough Global Funds |
| March 31, 2014 (Unaudited) | | |
| | | | | | | | | | |
Name, Address1 and Year of Birth | | Position(s) Held
with the Funds | | Term of office
and length of
service with
GLV2, GLQ3 &
GLO4 | | Principal Occupation(s) During Past Five Years | | Number of
Portfolios in
Fund Complex
Overseen by
Trustee5 | | Other
Directorships
Held by
Trustee During
the Past Five Years |
Non-Interested Trustees/Nominees |
Jerry G. Rutledge 1944 | | Trustee | | Trustee since:
GLV: 2004 GLQ: 2005 GLO: 2006 Term expires: GLV: 2014 GLQ: 2015 GLO: 2016 | | Mr. Rutledge is the President and owner of Rutledge’s Inc., a retail clothing business. Mr. Rutledge was from 1994 to 2007 a Regent of the University of Colorado. In addition, Mr. Rutledge is currently serving as a Director of the University of Colorado Hospital. Mr. Rutledge also served as a Director of the American National Bank from 1985 to 2009. | | 4 | | Mr. Rutledge is currently a Trustee of the Financial Investor Trust and the Principal Real Estate Income Fund. |
| | | | | |
| | | | | |
| | | | | |
| | | | | |
| | | | | |
| | | | | |
| | | | | |
| | | | | |
| | | | | |
Hon. Vincent W. Versaci 1971 | | Trustee | | Trustee since:
GLV: 2013 GLQ: 2013 GLO: 2013 Term expires: GLV: 2014 GLQ: 2015 GLO: 2016 | | Judge Versaci has served as a Judge in the New York State Courts since January 2003. Currently, Judge Versaci is assigned as an Acting Supreme Court Justice and presides over the Surrogate’s Court for Schenectady County, New York. Previously, Judge Versaci has served as an Adjunct Professor at Schenectady County Community College and a practicing attorney with an emphasis on civil and criminal litigation primarily in New York State Courts. | | 3 | | None |
| | | | | |
| | | | | |
| | | | | |
| | | | | |
| | | | | |
| | | | | |
| | | | | |
| | | | | |
| | | | | |
| | | | | |
| | | | | |
Interested Trustees6 / Nominees |
Edmund J. Burke7 1961 | | Trustee and President | | Trustee since:
GLV: 2006 GLQ: 2006 GLO: 2006 Term expires: GLV: 2016 GLQ: 2014 GLO: 2015 President since: GLV: 2004 GLQ: 2005 GLO: 2006 | | Mr. Burke joined ALPS in 1991 and is currently the Chief Executive Officer and President of ALPS Holdings, Inc., and a Director of ALPS Advisors, Inc., ALPS Distributors, Inc., ALPS Fund Services, Inc., and ALPS Portfolio Solutions Distributor, Inc. Mr. Burke is also Director of Boston Financial Data Services. Mr. Burke is deemed an affiliate of each Fund as defined under the 1940 Act. | | 4 | | Mr. Burke is also Trustee, Chairman and President of Financial Investors Trust. Mr. Burke is a Trustee and Vice President of the Liberty All-Star Equity Fund and is a Director and Vice President of the Liberty All-Star Growth Fund, Inc. |
| | | | | |
| | | | | |
| | | | | |
| | | | | |
| | | | | |
| | | | | |
| | | | | |
| | | | | |
| | | | | |
| | | | | |
| | | | | |
| | | | | |
| | | | | |
James E. Canty8 1962 | | Trustee | | Trustee since:
GLV: 2004 GLQ: 2005 GLO: 2006 Term expires: GLV: 2015 GLQ: 2016 GLO: 2014 | | Mr. Canty is a founding partner and Portfolio Manager for Clough. Mr. Canty is deemed an affiliate of each Fund as defined under the 1940 Act. Mr. Canty is currently a member of the Board of Directors of Clough Offshore Fund, Ltd. and Clough Offshore Fund (QP), Ltd. Mr. Canty is also currently a Trustee of St. Bonaventure University. Mr. Canty is a Certified Public Accountant. | | 3 | | None |
| | | | | |
| | | | | |
| | | | | |
| | | | | |
Clough Capital Partners, LP One Post Office Square 40th Floor Boston, MA 02109 | | | | | |
| | | | | |
| | | | | |
| | | | | |
| | | | | |
| | | | | |
| | |
Clough Global Funds | | Trustees & Officers |
| | March 31, 2014 (Unaudited) |
| | | | | | | | | | |
Name, Address1 and
Year of Birth | | Position(s) Held
with the Funds | | Term of office
and length of
service with
GLV2, GLQ3 &
GLO4 | | Principal Occupation(s) During Past Five Years | | Number of
Portfolios in
Fund Complex
Overseen by
Trustee5 | | Other
Directorships
Held by
Trustee During
the Past
Five Years |
Officers | | | | | | | | | | |
Jeremy O. May 1970 | | Treasurer | | Officer since9:
GLV: 2004
GLQ: 2005
GLO: 2006 | | Mr. May joined ALPS in 1995 and is currently President of ALPS and ALPS Distributors, Inc., and Executive Vice President and Director of ALPS Advisors, Inc. and ALPS Holdings, Inc. Mr. May is also Director of ALPS Portfolio Solutions Distributor, Inc. Mr. May is deemed an affiliate of each Fund as defined under the 1940 Act. Mr. May is also President, Chairman and Trustee of the ALPS Series Trust. Mr. May is also President, Chairman and Trustee of the Reaves Utility Income Fund. Mr. May is currently on the Board of Directors of the University of Colorado Foundation. | | None | | None |
Erin D. Nelson, Esq. 1977 | | Secretary | | Officer since9:
GLV: 2004
GLQ: 2005
GLO: 2006 | | Ms. Nelson joined ALPS in 2003 and is currently Senior Vice-President and Chief Legal Officer of ALPS Advisors, Inc. and Senior Vice-President of ALPS Fund Services, Inc., ALPS Distributors, Inc., and ALPS Portfolio Solutions Distributor, Inc. Ms. Nelson is also Secretary of ALPS ETF Trust, Liberty All-Star Growth Fund, Inc., Liberty All-Star Equity Fund and Principal Real Estate Income Fund. Ms. Nelson is deemed an affiliate of each Fund as defined under the 1940 Act. | | None | | None |
Theodore J. Uhl 1974 | | Chief Compliance Officer | | Officer since9:
GLV: 2010
GLQ: 2010
GLO: 2010 | | Mr. Uhl joined ALPS in October 2006, and is currently Vice President and Deputy Compliance Officer of ALPS. Prior to his current role, Mr. Uhl served as Senior Risk Manager for ALPS from October 2006 until June 2010. Before joining ALPS, Mr. Uhl served as Sr. Analyst with Enenbach and Associates (RIA), and a Sr. Financial Analyst at Sprint. Because of his position with ALPS, Mr. Uhl is deemed an affiliate of the Trust as defined under the 1940 Act. Mr. Uhl is currently Chief Compliance Officer of Centre Funds, Financial Investors Trust, Reaves Utility Income Fund and Transparent Value Trust. | | None | | None |
| | |
Annual Report | March 31, 2014 | | 53 |
| | |
Trustees & Officers | | Clough Global Funds |
| March 31, 2014 (Unaudited) | | |
| | | | | | | | | | |
Name, Address1 and
Year of Birth | | Position(s) Held
with the Funds | | Term of office
and length of
service with
GLV2, GLQ3 &
GLO4 | | Principal Occupation(s) During Past Five Years | | Number of
Portfolios in
Fund Complex
Overseen by
Trustee5 | | Other
Directorships
Held by
Trustee During
the Past
Five Years |
Officers | | | | | | | | | | |
Jill Kerschen 1975 | | Assistant Treasurer | | Officer since9:
GLV: 2013
GLQ: 2013
GLO: 2013 | | Ms. Kerschen joined ALPS in July 2013 and is currently a Fund Controller at ALPS. Ms. Kerschen is deemed an affiliate of the Trust as defined under the 1940 Act. Ms. Kerschen also serves as Treasurer of Reaves Utility Income Fund and Assistant Treasurer of the Westcore Funds, ALPS Series Trust and the Macquarie Global Infrastructure Total Return Fund. Prior to joining ALPS, Ms. Kerschen was Senior Manager, Financial & Tax Reporting at Great-West Financial from 2007 to 2013. | | None | | None |
| 1 | Address: 1290 Broadway, Suite 1100, Denver, Colorado 80203, unless otherwise noted. |
| 2 | GLV commenced operations on July 28, 2004. |
| 3 | GLQ commenced operations on April 27, 2005. |
| 4 | GLO commenced operations on April 25, 2006. |
| 5 | The Fund Complex for all Trustees, except Mr. Rutledge and Mr. Burke, consists of the Clough Global Allocation Fund, Clough Global Equity Fund and Clough Global Opportunities Fund. The Fund Complex for Mr. Rutledge and Mr. Burke consists of Clough Global Allocation Fund, Clough Global Equity Fund, Clough Global Opportunities Fund and the Clough China Fund, a series of the Financial Investors Trust. |
| 6 | “Interested Trustees” refers to those Trustees who constitute “interested persons” of a Fund as defined in the 1940 Act. |
| 7 | Mr. Burke is considered to be an “Interested Trustee” because of his affiliation with ALPS, which acts as each Fund’s administrator. |
| 8 | Mr. Canty is considered to be an “Interested Trustee” because of his affiliation with Clough Capital Partners L.P., which acts as each Fund’s investment adviser. |
| 9 | Officers are elected annually and each officer will hold such office until a successor has been elected by the Board. |
| | |
| Notes | | Clough Global Funds |


| | |
 | | This Fund is neither insured nor guaranteed by the U.S. Government, the FDIC, the Federal Reserve Board or any other governmental agency or insurer. For more information about the Fund, including a prospectus, please visit www.cloughglobal.com or call 1–877–256–8445. 1290 Broadway, Suite 1100, Denver, CO 80203 |
Item 2. Code of Ethics.
| | (a) | The Registrant, as of the end of the period covered by the report, has adopted a Code of Ethics that applies to the Registrant’s Principal Executive Officer, Principal Financial Officer, Principal Accounting Officer or Controller or any persons performing similar functions on behalf of the Registrant. |
| | (c) | During the period covered, by this report, no amendments were made to the provisions of the Code of Ethics adopted in 2 (a) above. |
| | (d) | During the period covered by this report, no implicit or explicit waivers to the provision of the Code of Ethics adopted in 2 (a) above were granted. |
| | (f) | The Registrant’s Code of Ethics is attached as Exhibit 12.A.1 hereto. |
Item 3. Audit Committee Financial Expert.
The Registrant’s Board of Trustees has determined that the registrant has as least one audit committee financial expert serving on its Audit Committee. The Board of Trustees has designated Richard C. Rantzow as the Registrant’s “audit committee financial expert.” Mr. Rantzow is “independent” as defined in paragraph (a)(2) of Item 3 to Form N-CSR.
Mr. Rantzow was the Chief Financial Officer and a Director of Ron Miller Associates, Inc. Prior to that, Mr. Rantzow was managing partner of the Memphis office of Ernst & Young until 1990.
Item 4. Principal Accounting Fees and Services.
| | (a) | Audit Fees: The aggregate fees billed for each of the last two fiscal years for professional services rendered by Cohen Fund Audit Services, Ltd (“Cohen”) for fiscal year ended March 31, 2014 and for fiscal year ended March 31, 2013 for the audit of the Registrant’s annual financial statements or services that are normally provided by the accountant in connection with statutory and regulatory filings or engagements for fiscal years 2014 and 2013 were $20,500 and $20,000, respectively. |
| | (b) | Audit-Related Fees: The aggregate fees billed in each of the last two fiscal years for assurance and related services by Cohen that are reasonably related to the performance of the audit of the Registrant’s financial statements and are not reported under paragraph (a) of this Item were $0 in 2014 and $0 in 2013. |
| | (c) | Tax Fees: The aggregate fees billed in each of the last two fiscal years for professional services rendered by Cohen for tax compliance, tax advice, and tax planning for fiscal year ended March 31, 2014 and for fiscal year ended March 31, 2013 were $3,000 in 2014 and $3,000 in 2013. These fees are comprised of fees relating income tax return preparation fees, excise tax return preparation fees and review of dividend distribution calculation fees. |
| | (d) | All Other Fees: The aggregate fees billed in each of the last two fiscal years for products and services provided by Cohen, other than the services reported in paragraphs (a) through (c) of this Item were $0 in 2014 and $0 in 2013. These services include agreed upon procedures related to the ratings for the Auction Market Preferred Shares. |
| | (e)(1) | Audit Committee Pre-Approval Policies and Procedures: All services to be performed by the Registrant’s principal auditors must be pre-approved by the Registrant’s Audit Committee. |
| | (e)(2) | No services described in paragraphs (b) through (d) were approved pursuant to paragraph (c)(7)(i)(C) of Rule 2-01 of Regulation S-X. |
| | (g) | The aggregate non-audit fees billed by the Registrant’s accountant for services rendered to the registrant, and rendered to the registrant’s investment adviser, and any entity controlling, controlled by, or under common control with the investment adviser that provides ongoing services to the Registrant for each of the last two fiscal years of the registrant were $0 for 2014 and $0 for 2013. |
Item 5. Audit Committee of Listed Registrant.
The registrant has a separately designated standing Audit Committee established in accordance with Section 3 (a)(58)(A) of the Exchange Act and is comprised of the following members:
Robert L. Butler
Adam D. Crescenzi
John F. Mee
Richard C. Rantzow, Committee Chairman
Jerry G. Rutledge
Hon. Vincent W. Versaci
| Item 6. | Schedule of Investments. |
| (a) | Schedule of Investments is included as part of the Report to Stockholders filed under Item 1 of this form. |
| Item 7. | Disclosure of Proxy Voting Policies and Procedures for Closed-End Management Investment Companies. |
Attached, as Exhibit Item 7, is a copy of the policies and procedures of Clough Capital Partners L.P. (“Clough”), the investment adviser of the registrant.
| Item 8. | Portfolio Managers of Closed-End Management Investment Companies. |
(a)(1) As of: March 31, 2014
| | | | | | |
Portfolio Managers Name | | Title | | Length of Service | | Business Experience: 5 Years |
| Charles I. Clough, Jr. | | Partner and Portfolio Manager | | Since Inception | | Founding Partner Clough Capital Partners L.P. Portfolio Manager for pooled investment accounts, separately managed accounts, and investment companies for over ten years. |
| Eric A. Brock | | Partner and Portfolio Manager | | Since Inception | | Founding Partner Clough Capital Partners L.P. Portfolio Manager for pooled investment accounts, separately managed accounts, and investment companies for over ten years. |
| James E. Canty | | Partner and Portfolio Manager | | Since Inception | | Founding Partner of Clough Capital L.P. Portfolio Manager, Chief Financial Officer and General Counsel for pooled investment accounts, separately managed accounts, and investment companies for over ten years. Mr. Canty is currently a member of the Board of Directors of Clough Offshore Fund, Ltd and Clough Offshore Fund (QP), Ltd. and Board of Trustees of Clough Global Equity Fund and Clough Global |
| | | | | | |
| | | | | | | Opportunities Fund. Because of his affiliation with Clough, Mr. Canty is an ‘‘interested’’ Trustee of the Registrant. |
| Robert Zdunczyk | | Portfolio Manager & Fixed Income Analyst | | Since 12/21/11 | | Mr. Zdunczyk has over 18 years of industry experience which includes analysis of fixed income securities, fixed income trading, equity research, portfolio management, and accounting. He has been an Analyst at Clough Capital Partners L.P. since 2005, where he has been managing fixed income portfolios, specialty finance equity research and fixed income trading. |
(a)(2) As of March 31, 2014, the Portfolio Managers listed above are also responsible for the day-to-day management of the following:
| | | | | | | | |
Portfolio Managers Name | | Registered Investment Companies | | Other Pooled Investment Vehicles (1) | | Other Accounts(2) | | Material Conflicts If Any |
| Charles I. Clough, Jr. | | 4 Accounts $2,521.6 million Total Assets | | 5 Accounts $1,505.8 million Total Assets | | 4 Accounts $508.6 million Total Assets | | See below (3) |
| Eric A. Brock | | 4 Accounts $2,521.6 million Total Assets | | 5 Accounts $1,505.8 million Total Assets | | 4 Accounts $508.6 million Total Assets | | See below (3) |
| James E. Canty | | 4 Accounts $2,521.6 million Total Assets | | 5 Accounts $1,505.8 million Total Assets | | 4 Accounts $508.6 million Total Assets | | See below (3) |
| Robert Zdunczyk | | 2 Accounts $1,841.3 million Total Assets | | 5 Accounts $1,505.8 million Total Assets | | 4 Accounts $508.6 million Total Assets | | See below (3) |
| (1) | The advisory fees are based in part on the performance for each account. |
| (2) | The advisory fee is based in part on the performance for four accounts totaling $508.6 million in assets. |
(3)Material Conflicts:
Material conflicts of interest may arise as a result of the fact that the Portfolio Managers also have day-to-day management responsibilities with respect to both the Registrant and the various accounts listed above (collectively with the Registrant, the “Accounts”). These potential conflicts include:
Limited Resources. The Portfolio Managers cannot devote their full time and attention to the management of each of the Accounts. Accordingly, the Portfolio Managers may be limited in their ability to identify investment opportunities for each of the Accounts that are as attractive as might be the case if the Portfolio Managers were to devote substantially more attention to the management of a single Account. The effects of this potential conflict may be more pronounced where the Accounts have different investment strategies.
Limited Investment Opportunities. If the Portfolio Managers identify a limited investment opportunity that may be appropriate for more than one Account, the investment opportunity may be allocated among several Accounts. This could limit any single Account’s ability to take full advantage of an investment opportunity that might not be limited if the Portfolio Managers did not provide investment advice to other Accounts.
Different Investment Strategies. The Accounts managed by the Portfolio Managers have differing investment strategies. If the Portfolio Managers determine that an investment opportunity may be appropriate for only some of the Accounts or decide that certain of the Accounts should take different positions with respect to a particular security, the Portfolio Managers may effect transactions for one or more Accounts which may affect the market price of the security or the execution of the transaction, or both, to the detriment or benefit of one or more other Accounts.
Variation in Compensation. A conflict of interest may arise where Clough or Clough Associates, LLC, as applicable, is compensated differently by the Accounts that are managed by the Portfolio Managers. If certain Accounts pay higher management fees or performance-based incentive fees, the Portfolio Managers might be motivated to prefer certain Accounts over others. The Portfolio Managers might also be motivated to favor Accounts in which they have a greater ownership interest or Accounts that are more likely to enhance the Portfolio Managers’ performance record or to otherwise benefit the Portfolio Managers.
Selection of Brokers. The Portfolio Managers select the brokers that execute securities transactions for the Accounts that they supervise. In addition to executing trades, some brokers provide the Portfolio Managers with research and other services which may require the payment of higher brokerage fees than might otherwise be available. The Portfolio Managers’ decision as to the selection of brokers could yield disproportionate
costs and benefits among the Accounts that they manage, since the research and other services provided by brokers may be more beneficial to some Accounts than to others.
(a)(3) Portfolio Manager Compensation as of March 31, 2014.
The Portfolio Managers Charles Clough, James Canty and Eric Brock own 100% of Clough. They each receive a fixed base salary determined based on market factors. Additionally, Clough distributes substantially all of its annual net profits to those three Portfolio Managers, with Mr. Clough receiving a majority share and the remainder being divided between Mr. Brock and Mr. Canty, with an additional smaller share allocated to an income partner. Mr. Zdunczyk receives a fixed base salary and an annual bonus based on his individual performance and the overall profitability of the firm.
(a)(4) Dollar Range of Securities Owned as of March 31, 2014.
| | |
Portfolio Managers | | Dollar Range of the Registrant’s Securities Owned by the Portfolio Managers |
Charles I. Clough, Jr. | | $100,001 - $500,000 |
Eric A. Brock | | $10,001 - $50,000 |
James E. Canty | | $100,001 - $500,000 |
Robert Zdunczyk | | $10,001 - $50,000 |
| Item 9. | Purchases of Equity Securities by Closed-End Management Investment Companies and Affiliated Purchasers. |
None
| Item 10. | Submission of Matters to Vote of Security Holders. |
No material changes to the procedures by which the shareholders may recommend nominees to the Registrant’s Board of Trustees have been implemented after the registrant’s last provided disclosure in response to the requirements of Item 407(c)(2)(iv) of Regulation S-K (17 CFR 229.407) (as required by Item 22(b)(15) of Schedule 14A (17 CFR 240.14a-101)), or this Item.
| Item 11. | Controls and Procedures. |
| | (a) | The Registrant’s Principal Executive Officer and Principal Financial Officer have concluded that the Registrant’s disclosure controls and procedures (as defined in Rule 30a-3(c) under the Investment Company Act of 1940, as amended) are effective based on their evaluation of these controls and procedures as of a date within 90 days of the filing date of this document. |
| | (b) | There was no change in the Registrant’s internal control over financial reporting (as defined in Rule 30a-3(d) under the Investment Company Act of 1940, as amended) during the second fiscal quarter of the period covered by this report |
| | that has materially affected, or is reasonably likely to materially affect, the Registrant’s internal control over financial reporting. |
(a)(1) The Code of Ethics that applies to the Registrant’s Principal Executive Officer and Principal Financial Officer is attached hereto as Exhibit 12.A.1.
(a)(2) The certifications required by Rule 30a-2(a) of the Investment Company Act of 1940, as amended, and Section 302 of the Sarbanes-Oxley Act of 2002 are attached hereto as Ex-99.Cert.
(a)(3) Not applicable.
(b) A certification for the Registrant’s Principal Executive Officer and Principal Financial Officer, as required by Rule 30a-2(b) of the Investment Company Act of 1940, as amended, and Section 906 of the Sarbanes-Oxley Act of 2002 are attached hereto as Ex-99.906Cert.
(c) The Proxy Voting Policies and Procedures are attached hereto as Ex99. Item 7.
(d) Pursuant to the Securities and Exchange Commission’s Order granting relief from Section 19(b) of the Investment Company Act of 1940 dated September 21, 2009, the form of 19(a) Notices to Beneficial Owners are attached hereto as Exhibit 12(d).
SIGNATURES
Pursuant to the requirements of the Securities Exchange Act of 1934 and the Investment Company Act of 1940, the Registrant has duly caused this report to be signed on its behalf by the undersigned, thereunto duly authorized.
| | |
| CLOUGH GLOBAL ALLOCATION FUND |
| |
| By: | | /s/ Edmund J. Burke |
| | Edmund J. Burke |
| | President & Trustee |
| |
| Date: | | June 9, 2014 |
Pursuant to the requirements of the Securities Exchange Act of 1934 and the Investment Company Act of 1940, this report has been signed below by the following persons on behalf of the Registrant and in the capacities and on the dates indicated.
| | |
| CLOUGH GLOBAL ALLOCATION FUND |
| |
| By: | | /s/ Edmund J. Burke |
| | Edmund J. Burke |
| | President/Principal Executive Officer |
| |
| Date: | | June 9, 2014 |
| |
| By: | | /s/ Jeremy O. May |
| | Jeremy O. May |
| | Treasurer/Principal Financial Officer |
| |
| Date: | | June 9, 2014 |