UNITED STATES
SECURITIES AND EXCHANGE COMMISSION
Washington, D.C. 20549
FORM N-CSR
CERTIFIED SHAREHOLDER REPORT OF REGISTERED
MANAGEMENT INVESTMENT COMPANIES
Investment Company Act file number: 811-21583
Clough Global Dividend and Income Fund
(exact name of Registrant as specified in charter)
1290 Broadway, Suite 1000, Denver, Colorado 80203
(Address of principal executive offices) (Zip code)
Sareena Khwaja-Dixon, Secretary
Clough Global Dividend and Income Fund
1290 Broadway, Suite 1000
Denver, Colorado 80203
(Name and address of agent for service)
Registrant’s telephone number, including area code: 877-256-8445
Date of fiscal year end: October 31
Date of reporting period: November 1, 2021 – April 30, 2022
Item 1. Reports to Stockholders.

Section 19(b) Disclosure
April 30, 2022 (Unaudited)
Clough Global Dividend and Income Fund, Clough Global Equity Fund, and Clough Global Opportunities Fund (each a “Fund” and collectively, the “Funds”), acting pursuant to a Securities and Exchange Commission (“SEC”) exemptive order and with the approval of each Fund’s Board of Trustees (the “Board”), have adopted a plan, consistent with each Fund’s investment objectives and policies to support a level distribution of income, capital gains and/or return of capital (the “Plan”). In accordance with the Plan, the Funds’ managed distribution policy sets the monthly distribution rate at an amount equal to one twelfth of 10% of each Fund’s adjusted year-ending NAV, which is the average of the NAVs as of the last five business days of the prior calendar year.
Under the Plan, each Fund will distribute all available investment income to its shareholders, consistent with each Fund’s primary investment objectives and as required by the Internal Revenue Code of 1986, as amended (the “Code”). If sufficient investment income is not available on a monthly basis, each Fund will distribute long-term capital gains and/or return of capital to shareholders in order to maintain a level distribution.
Each monthly distribution to shareholders is expected to be at the fixed amount established by the Board, except for extraordinary distributions and potential distribution rate increases to enable each Fund to comply with the distribution requirements imposed by the Code.
Shareholders should not draw any conclusions about each Fund’s investment performance from the amount of these distributions or from the terms of the Plan. Each Fund’s total return performance on net asset value is presented in its financial highlights table.
Each Board may amend, suspend or terminate each Fund’s Plan without prior notice. The suspension or termination of the Plan could have the effect of creating a trading discount (if a Fund’s stock is trading at or above net asset value) or widening an existing trading discount. Each Fund is subject to risks that could have an adverse impact on its ability to maintain level distributions. Examples of potential risks include, but are not limited to, economic downturns impacting the markets, increased market volatility, companies suspending or decreasing corporate dividend distributions and changes in the Code. Please refer to the Notes to Financial Statements in the Annual Report to Shareholders for a more complete description of its risks.
Please refer to Additional Information for a cumulative summary of the Section 19(a) notices for each Fund’s current fiscal period. Section 19(a) notices for each Fund, as applicable, are available on the Clough Global Closed-End Funds website www.cloughglobal.com.
| Clough Global Funds | Table of Contents |
| Shareholder Letter & Portfolio Allocation | |
| Clough Global Dividend and Income Fund | 2 |
| Clough Global Equity Fund | 7 |
| Clough Global Opportunities Fund | 12 |
| Statement of Investments | |
| Clough Global Dividend and Income Fund | 17 |
| Clough Global Equity Fund | 22 |
| Clough Global Opportunities Fund | 26 |
| Statements of Assets and Liabilities | 30 |
| Statements of Operations | 31 |
| Statements of Changes in Net Assets | 32 |
| Statements of Cash Flows | 35 |
| Financial Highlights | |
| Clough Global Dividend and Income Fund | 38 |
| Clough Global Equity Fund | 42 |
| Clough Global Opportunities Fund | 46 |
| Notes to Financial Statements | 49 |
| Dividend Reinvestment Plan | 67 |
| Additional Information | |
| Fund Proxy Voting Policies & Procedures | 68 |
| Portfolio Holdings | 68 |
| Notice | 68 |
| Section 19(A) Notices | 68 |
| Investment Advisory Agreement Approval | 69 |
| Clough Global Dividend and Income Fund | Shareholder Letter |
April 30, 2022 (Unaudited)
To Our Investors,
For the semi-annual period ending April 30, 2022, the Clough Global Dividend and Income Fund (“GLV” or the “Fund”) had a total net return of -15.80% on net asset value (“NAV”) and -21.76% on market price, compared to -10.19% for the 50% MSCI World/50% Bloomberg U.S. Aggregate Bond Index and -11.65% for the Morningstar Global Allocation Index for the same period.
Top 5 Contributors and Detractors for the Fund’s First Fiscal Half of the Year
The two top contributors to performance for the first six months of the fiscal year were short positions in Rivian Automotive Inc., a fledgling produce of electric vehicle (“EV”) trucks, and Zscaler Inc., a security software company, whose lofty company valuations proved to be unsustainable as interest rates moved higher. Raytheon Technologies Corp., a leading aerospace and defense company, also contributed to performance (see comments below on aerospace and defense sector). Two healthcare companies, Eli Lilly & Co. and Pfizer Inc., round out the top five contributors. Eli Lilly gained on positive earnings momentum while Pfizer rallied as its estimated $36 billion in COVID vaccine revenues in 2021 exceeded Wall Street expectations.
Two of the weakest holdings to start the year were BYD Co Ltd. and Contemporary Amperex Technology Co Ltd. Both are leading battery makers for electric vehicles in China that struggled as continued COVID-related shutdowns in China lead to a decline in sales and production. Micron Technology Inc., the only U.S.-based producer of semiconductor memory, also declined in line with the technology sector during the first half of the year. The Fund has since exited these three positions. Finally, Microsoft Corp. and Redwood Trust Inc., a leading mortgage provider to prime jumbo borrowers, rounded out the bottom five. The Fund continues to hold these two positions.
New Themes Added in the Fund’s First Fiscal Half of the Year
DEFENSE AEROSPACE
During the period we added new positions in Northrop Grumman Corp. and Lockheed Martin Corp to the position in Raytheon Technologies Corp. we already held in the Fund. Defense stocks have been underperforming for years, reflecting a long period of underinvestment in our armed forces which began around the time of the fall of the former Soviet Union. One indication of our declining military proficiency is the number of hours per week flown by U.S. fighter pilots, which have fallen from the 60-70 norm to 10 hours per week according to a Wall Street Journal report. Few new aircraft have been developed over the past few decades. Only the F-35 fighter aircraft and an undetermined number of B-21 bombers are entering western fleets in large numbers. So, a defense investment cycle was perhaps inevitable, but Russia’s invasion of Ukraine likely brought it forward. Shortages of military platforms such as submarines, naval vessels, aircraft and land vehicles has become extreme at a time of growing geopolitical threats which can no longer be ignored. Demand comes not only from the need to supply U.S. forces, but those of Europe and Asian nations like Japan and Korea, as well.
Defense stocks tend to carry a premium multiple to the S&P 500 Index because they are backlogged businesses making operating results easier to predict, and they also typically have strong balance sheets and high cashflows. Free cash flow yields average 7-9% annually. We anticipate a move down to 5% or so as new programs are authorized.
Raytheon Technologies currently remains our largest holding in the sector. The company has a leading position in both commercial and military aerospace and space technologies. Its subsidiaries hold dominant and highly profitable positions in flight control systems (Collins Aerospace) and aircraft engines (Pratt and Whitney, whose engines hold the largest percentages on the A-320 neo). The company also sports a defense systems business with leading technologies in hyper sonics, as well as cyber missile defense systems. We also expect further synergies will continue to arise from the company’s 2020 merger with United Technologies.
ENERGY
Years of underinvestment in fossil fuel energy has caused global oil supplies to fall short of demand. That has taken inventories from the highest to the lowest level in over 30 years, according to Alpine Macro Research. So, the reality of actual shortages is only now becoming apparent. There have been little institutional capital flows into energy and despite the recent rally the sector only accounts for 4.2% of S&P 500 Index market capitalization. Since January 2020, domestic crude prices have increased by 50% while Henry Hub natural gas prices have tripled. Our focus is in the energy services and LNG sectors.
What is new in the present experience is the absence of any buffer of spare capacity in the energy system. During the energy crises of 1973 and 1979, the Organization of the Petroleum Exporting Countries (“OPEC”) maintained several million barrels per day of spare oil pumping capacity. That buffer fell to 2 million barrels a day in 2008, even as oil hit $145 per barrel. Now, that excess capacity is gone. For the past 15 years, nearly 90% of total non-OPEC oil production growth has come from U.S. shale operations. But that supply seems to be peaking and early signs of resource exhaustion are noticeable. The best drilling prospects have already been drilled and many fields are now declining. Since late 2019 production in the U.S. has declined by 1.5 million barrels a day. There is no other source of non-OPEC oil production available. Iran and Iraq may have a modest amount of excess capacity, but they have been producing close to as much as they can. Russia’s invasion of Ukraine simply brought these issues forward.
| Clough Global Dividend and Income Fund | Shareholder Letter |
April 30, 2022 (Unaudited)
It appears to us that a new cycle of energy exploration will be required and since the oil service and equipment industry has been consolidating for two decades pricing and profitability in this new cycle should be very strong.
The natural gas investment cycle could be even stronger. Global demand is strong, and a cold European 2020-2021 winter drove European inventories to dangerously low levels. Ample shale gas in the U.S. has already led to a U.S. liquid natural gas export boom and so far, this has occurred while leaving the U.S. market well supplied. But that could change since the best wells have been drilled and the two earliest gas shale basins (Barnett and Fayetteville) have rolled over and are now running 60% below their peak production levels. The Fund currently holds a position in Cheniere Energy, Inc. the largest LNG producer and transportation company.
FIXED INCOME
The Fund is currently conservatively positioned due to the extreme volatility in the markets. Rather than hold a significant amount in cash sweep vehicles that pay very little in interest, the Fund has invested in two to three-year investment grade corporate bonds that yield between three and four percent. We view this as an attractive return for taking very little interest rate risk while waiting out very choppy markets.
The year so far has been a challenge, but we believe that over the summer inflationary pressures may reverse, perhaps sharply, and the markets’ perception of central bank policies will shift towards a more bullish liquidity stance. However, there is no upside to trying to anticipate when that may occur so we will sustain a conservative stance until the backdrop has unquestionably turned more bullish.
As always, please don’t hesitate to reach out to us with any questions or comments.
Sincerely,

Charles I Clough, Jr.

Robert M. Zdunczyk
This letter is provided for informational purposes only and is not an offer to purchase or sell shares. Clough Global Dividend and Income Fund (the “Fund”) is a closed-end fund, which is traded on the NYSE American LLC, and does not continuously issue shares for sale as open-end mutual funds do. The market price of a closed-end fund is based on the market’s value.
Although not generally stated throughout, the information in this letter reflects the opinions of the individual portfolio managers, which opinion is subject to change, and is not intended to be a forecast of future events, a guarantee of future results or investment advice.
The Morningstar Global Allocation Index represents a multi-asset class portfolio of 60% global equities and 40% global bonds. The asset allocation within each class is driven by Morningstar asset allocation methodology. To maintain broad global exposure and diversification, the index consists of equities & fixed income and utilizes global, float-weighted index methodology to determine allocation to U.S. and non-U.S.
The MSCI World Index is a free float-adjusted market capitalization weighted index that is designed to measure the equity market performance of 23 developed markets countries. Both indices referenced herein reflect the reinvestment of dividends. Effective July 31, 2010, the MSCI World Index returns prior to January 1, 2002 were revised to reflect the total returns, with dividends reinvested, reported by MSCI. The MSCI information may only be used for your internal use, may not be reproduced or redisseminated in any form and may not be used as a basis for or a component of any financial instruments or products or indices. None of the MSCI information is intended to constitute investment advice or a recommendation to make (or refrain from making) any kind of investment decision and may not be relied on as such. Historical data and analysis should not be taken as an indication or guarantee of any future performance analysis, forecast or prediction. The MSCI information is provided on an “as is” basis and the user of this information assumes the entire risk of any use made of this information. MSCI, each of its affiliates and each other person involved in or related to compiling, computing or creating any MSCI information (collectively, the “MSCI Parties”) expressly disclaims all warranties (including, without limitation, any warranties of originality, accuracy, completeness, timeliness, non-infringement, merchantability and fitness for a particular purpose) with respect to this information. Without limiting any of the foregoing, in no event shall any MSCI Party have any liability for any direct, indirect, special, incidental, punitive, consequential (including, without limitation, lost profits) or any other damages (www.msci.com).
| Semi-Annual Report | April 30, 2022 | 3 |
| Clough Global Dividend and Income Fund | Shareholder Letter |
April 30, 2022 (Unaudited)
The Bloomberg U.S. Aggregate Bond Index measures the performance of the U.S. investment grade bond market. The Bloomberg U.S. Aggregate Bond index invests in a wide spectrum of public, investment-grade, taxable, fixed income securities in the United States, including government, corporate, and international dollar-denominated bonds, as well as mortgage-backed and asset-backed securities, all with maturities of more than 1 year.
The blended indices, 50% MSCI World/50% Bloomberg U.S. Aggregate Bond Index and 75% MSCI World/25% Bloomberg U.S. Aggregate Bond Index, have been calculated by Clough Capital Partners L.P. based on the sources listed above.
The performance of the indices referenced herein is used for informational purposes only. One cannot invest directly in an index. Indices are not subject to any of the fees or expenses to which the Fund is subject, and there are significant differences between the Fund’s investments and the components of the indices referenced.
The net asset value (“NAV”) of a closed-end fund is the market price of the underlying investments (i.e., stocks and bonds) in the Fund’s portfolio, minus liabilities, divided by the total number of fund shares outstanding. However, the Fund also has a market price; the value of which it trades on an exchange. This market price can be more or less than its NAV.
RISKS
An investor should consider investment objectives, risks, charges and expenses carefully before investing. To obtain an annual report or semiannual report which contains this and other information visit www.cloughglobal.com or call 1-855-425-6844. Read them carefully before investing.
The Fund’s distribution policy will, under certain circumstances, have certain adverse consequences to the Fund and its shareholders because it may result in a return of capital resulting in less of a shareholder’s assets being invested in the Fund and, over time, increase the Fund’s expense ratio.
Distributions may be paid from sources of income other than ordinary income, such as net realized short-term capital gains, net realized long-term capital gains and return of capital. Based on current estimates, we anticipate the most recent distribution has been paid from short-term and long-term capital gains. The actual amounts and sources of the amounts for tax reporting purposes will depend upon the Fund’s investment experience during the remainder of its fiscal year and may be subject to changes based on tax regulations. If a distribution includes anything other than net investment income, the Fund provides a Section 19(a) notice of the best estimate of its distribution sources at that time. These estimates may not match the final tax characterization (for the full year’s distributions) contained in shareholders’ 1099-DIV forms after the end of the year. For the fiscal year 2021, the Fund's distribution policy resulted in distributions of capital in the amount of $3,855,628.
The Fund’s investments in securities of foreign issuers are subject to risks not usually associated with owning securities of U.S. issuers. These risks can include fluctuations in foreign currencies, foreign currency exchange controls, social, political and economic instability, differences in securities regulation and trading, expropriation or nationalization of assets, and foreign taxation issues.
The Fund’s investments in preferred stocks and bonds of below investment grade quality (commonly referred to as “high yield” or “junk bonds”), if any, are predominately speculative because of the credit risk of their issuers.
An investment by the Fund in real estate investment trusts (“REITs”) will subject it to various risks. The first, real estate industry risk, is the risk that the REIT share prices will decline because of adverse developments affecting the real estate industry and real property values. In general, real estate values can be affected by a variety of factors, including supply and demand for properties, the economic health of the country or of different regions, and the strength of specific industries that rent properties. The second, investment style risk, is the risk that returns from REITs—which typically are small or medium capitalization stocks—will trail returns from the overall stock market. The third, interest rate risk, is the risk that changes in interest rates may hurt real estate values or make REIT shares less attractive than other income-producing investments. Credit risk is the risk that an issuer of a preferred or debt security will become unable to meet its obligation to make dividend, interest and principal payments.
Interest rate risk is the risk that preferred stocks paying fixed dividend rates and fixed-rate debt securities will decline in value because of changes in market interest rates. When interest rates rise the value of such securities generally will fall. Derivative transactions (such as futures contracts and options thereon, options, swaps, and short sales) subject the Fund to increased risk of principal loss due to imperfect correlation or unexpected price or interest rate movements. Compared to investment companies that focus only on large companies, the Fund’s share price may be more volatile because it also invests in small and medium capitalization companies.
Past performance is neither a guarantee, nor necessarily indicative, of future results, which may be significantly affected by changes in economic and other conditions.
| Clough Global Dividend and Income Fund | Portfolio Allocation |
April 30, 2022 (Unaudited)
| Top 10 Equity Holdings(a)(d) | % of Total Portfolio |
| 1. Visa, Inc. | 6.70% |
| 2. Raytheon Technologies Corp. | 6.66% |
| 3. Microsoft Corp. | 4.36% |
| 4. Apple, Inc. | 3.94% |
| 5. Starwood Property Trust, Inc. | 3.40% |
| 6. Eli Lilly & Co. | 2.62% |
| 7. TransDigm Group, Inc. | 2.25% |
| 8. First American Financial Corp. | 2.21% |
| 9. Exxon Mobil Corp. | 2.19% |
| 10. Kinder Morgan, Inc. | 2.10% |
| Global Securities Holdings(a) | % of Total Portfolio |
| United States | 82.15% |
| U.S. Multinationals(b) | 17.87% |
| France | 1.35% |
| Canada | 0.71% |
| Netherlands | 0.65% |
| Hong Kong | 0.16% |
| Other | -2.89% |
| TOTAL INVESTMENTS | 100.00% |
| Asset Allocation(a) | % of Total Portfolio |
| Common Stock - US | 24.02% |
| Common Stock - Foreign | 19.39% |
| Exchange Traded Funds | -3.26% |
| Total Equities | 40.15% |
| | |
| Government L/T | 36.00% |
| Corporate Debt | 20.73% |
| Preferred Stock | 0.80% |
| Asset-Backed Securities | 0.03% |
| Total Fixed Income | 57.56% |
| | |
| Short-Term Investments | 3.49% |
| Purchased & Written Options | 0.19% |
| Other (Cash) | -1.39% |
| | |
| TOTAL INVESTMENTS | 100.00% |
| Country Allocation(c) | Long
Exposure
%NAV | Short
Exposure
%NAV | Gross
Exposure
%NAV | Net
Exposure
%NAV |
| United States | 117.3% | -8.8% | 126.1% | 108.5% |
| U.S. Multinationals(b) | 34.5% | -10.9% | 45.4% | 23.6% |
| France | 1.8% | 0.0% | 1.8% | 1.8% |
| Canada | 0.9% | 0.0% | 0.9% | 0.9% |
| Netherlands | 0.9% | 0.0% | 0.9% | 0.9% |
| Hong Kong | 0.2% | 0.0% | 0.2% | 0.2% |
| Other | 0.0% | -3.8% | 3.8% | -3.8% |
| TOTAL INVESTMENTS | 155.6% | -23.5% | 179.1% | 132.1% |
| (a) | Percentages calculated based on total portfolio, including securities sold short, cash balances, market value of futures, and notional value of return swaps. |
| (b) | U.S. Multinationals includes companies organized or located in the United States that have more than 50% of revenues derived outside of the United States. |
| (c) | Percentages calculated based on the net asset value of the Fund. |
| (d) | Only long equity and equity-related positions are listed. |
| Semi-Annual Report | April 30, 2022 | 5 |
| Clough Global Dividend and Income Fund | Portfolio Allocation |
April 30, 2022 (Unaudited)
Total Return as of April 30, 2022(a)
| | 1 Year | 3 Year | 5 Year | Since Inception(b) |
| Clough Global Dividend and Income Fund - NAV(c) | -14.67% | 1.66% | 2.42% | 5.73% |
| Clough Global Dividend and Income Fund - Market Price(d) | -18.83% | 3.98% | 2.30% | 5.18% |
| Morningstar Global Allocation Index | -8.37% | 5.46% | 6.07% | 6.70% |
| 50% Bloomberg Barclays US Aggregate/ 50% MSCI World GR | -5.67% | 5.95% | 6.19% | 6.27% |
| (a) | Total returns assume reinvestment of all distributions. |
| (b) | The Fund commenced operation on July 28, 2004. |
| (c) | Performance returns are net of management fees and other Fund expenses. |
| (d) | Market price is the value at which the Fund trades on an exchange. This market price can be more or less than its NAV. |
Distribution to Common Stockholders
The Fund intends to make monthly distributions to common shareholders according to its managed distribution policy. The Fund’s managed distribution policy is to set the monthly distribution rate at an amount equal to one twelfth of 10% of the Fund’s adjusted year-ending net asset value per share (“NAV”), which will be the average of the NAVs as of the last five business days of the prior calendar year. The Board of Directors approve the distribution and may adjust it from time to time. The monthly distribution amount paid from October 1, 2021 to December 31, 2021 was $0.0967 per share and the Fund paid $0.0906 per share monthly between January 1, 2022 and April 30, 2022. At times, to maintain a stable level of distributions, the Fund may pay out less than all of its net investment income or pay out accumulated undistributed income, or return of capital, in addition to current net investment income.
Performance of $10,000 Initial Investment (as of April 30, 2022)
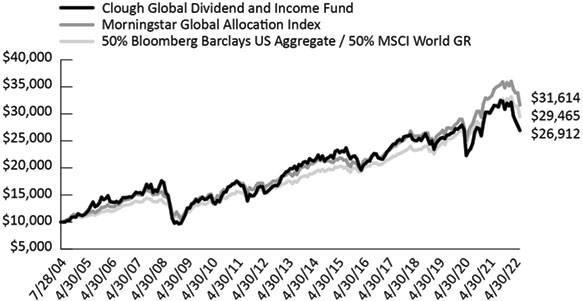
The graph shown above represents historical performance of a hypothetical investment of $10,000 in the Fund since inception. Past performance does not guarantee future results. All returns reflect reinvested dividends, but do not reflect the deduction of taxes that a shareholder would pay on Fund distributions or the redemption of Fund shares.
| Clough Global Equity Fund | Shareholder Letter |
April 30, 2022 (Unaudited)
To Our Investors,
For the semi-annual period ending April 30, 2022, the Clough Global Equity Fund (“GLQ” or the “Fund”) had a total net return of -28.08% on net asset value (“NAV”) and -28.41% on market price, compared to -11.09% for the MSCI World Index for the same period.
Top 5 Contributors and Detractors for the Fund’s First Fiscal Half of the Year
The top contributor to performance for the first six months of the fiscal year was a long position in iRhythm Technologies Inc., a medical device company focused on cardiac monitoring, that gained on positive reimbursement news. Checkmate Pharmaceuticals Inc., a clinical stage immunotherapy company, that announced it will be acquired by Regeneron Pharmaceuticals Inc. in a $250 million all cash deal. Two short positions in Rivian Automotive Inc., a fledgling produce of electric vehicle (“EV”) trucks, as well as Zscaler Inc., a security software company, contributed to performance, as interest rates moved higher and the lofty company valuations proved to be unsustainable. Finally, Vertex Pharmaceuticals Inc., a biotechnology company focused on cystic fibrosis, rallied as their earnings exceeded Wall Street expectations.
Two of the weakest holdings to start the year were BYD Co Ltd. and Contemporary Amperex Technology Co Ltd. Both are leading battery makers for electric vehicles in China that struggled as continued COVID-related shutdowns in China lead to a decline in sales and production. Amazon.com Inc. suffered sharp declines as concerns regarding investment in its retail operations trumped its strong results in Amazon Web Services. Micron Technology Inc., the only U.S.-based producer of semiconductor memory, also declined in line with the technology sector during the first half of the year. Finally, C4 Therapeutics Inc., a biotechnology company, rounded out the bottom five.
New Themes Added in the Fund’s First Fiscal Half of the Year
DEFENSE AEROSPACE
During the period we added new positions in Northrop Grumman Corp. and Lockheed Martin Corp to the position in Raytheon Technologies Corp. we already held in the Fund. Defense stocks have been underperforming for years, reflecting a long period of underinvestment in our armed forces which began around the time of the fall of the former Soviet Union. One indication of our declining military proficiency is the number of hours per week flown by U.S. fighter pilots, which have fallen from the 60-70 norm to 10 hours per week according to a Wall Street Journal report. Few new aircraft have been developed over the past few decades. Only the F-35 fighter aircraft and an undetermined number of B-21 bombers are entering western fleets in large numbers. So, a defense investment cycle was perhaps inevitable, but Russia’s invasion of Ukraine likely brought it forward. Shortages of military platforms such as submarines, naval vessels, aircraft and land vehicles has become extreme at a time of growing geopolitical threats which can no longer be ignored. Demand comes not only from the need to supply U.S. forces, but those of Europe and Asian nations like Japan and Korea, as well.
Defense stocks tend to carry a premium multiple to the S&P 500 Index because they are backlogged businesses making operating results easier to predict, and they also typically have strong balance sheets and high cashflows. Free cash flow yields average 7-9% annually. We anticipate a move down to 5% or so as new programs are authorized.
Raytheon Technologies currently remains our largest holding in the sector. The company has a leading position in both commercial and military aerospace and space technologies. Its subsidiaries hold dominant and highly profitable positions in flight control systems (Collins Aerospace) and aircraft engines (Pratt and Whitney, whose engines hold the largest percentages on the A-320 neo). The company also sports a defense systems business with leading technologies in hyper sonics, as well as cyber missile defense systems. We also expect further synergies will continue to arise from the company’s 2020 merger with United Technologies.
ENERGY
Years of underinvestment in fossil fuel energy has caused global oil supplies to fall short of demand. That has taken inventories from the highest to the lowest level in over 30 years, according to Alpine Macro Research. So, the reality of actual shortages is only now becoming apparent. There have been little institutional capital flows into energy and despite the recent rally the sector only accounts for 4.2% of S&P 500 Index market capitalization. Since January 2020, domestic crude prices have increased by 50% while Henry Hub natural gas prices have tripled. Our focus is in the energy services and LNG sectors.
What is new in the present experience is the absence of any buffer of spare capacity in the energy system. During the energy crises of 1973 and 1979, the Organization of the Petroleum Exporting Countries (“OPEC”) maintained several million barrels per day of spare oil pumping capacity. That buffer fell to 2 million barrels a day in 2008, even as oil hit $145 per barrel. Now, that excess capacity is gone. For the past 15 years, nearly 90% of total non-OPEC oil production growth has come from U.S. shale operations. But that supply seems to be peaking and early signs of resource exhaustion are noticeable. The best drilling prospects have already been drilled and many fields are now declining. Since late 2019 production in the U.S. has declined by 1.5 million barrels a day. There is no other source of non-OPEC oil production available. Iran and Iraq may have a modest amount of excess capacity, but they have been producing close to as much as they can. Russia’s invasion of Ukraine simply brought these issues forward.
| Semi-Annual Report | April 30, 2022 | 7 |
| Clough Global Equity Fund | Shareholder Letter |
April 30, 2022 (Unaudited)
It appears to us that a new cycle of energy exploration will be required and since the oil service and equipment industry has been consolidating for two decades pricing and profitability in this new cycle should be very strong.
The natural gas investment cycle could be even stronger. Global demand is strong, and a cold European 2020-2021 winter drove European inventories to dangerously low levels. Ample shale gas in the U.S. has already led to a U.S. liquid natural gas export boom and so far, this has occurred while leaving the U.S. market well supplied. But that could change since the best wells have been drilled and the two earliest gas shale basins (Barnett and Fayetteville) have rolled over and are now running 60% below their peak production levels. The Fund currently holds a position in Cheniere Energy, Inc. the largest LNG producer and transportation company.
The year so far has been a challenge, but we believe that over the summer inflationary pressures may reverse, perhaps sharply, and the markets’ perception of central bank policies will shift towards a more bullish liquidity stance. However, there is no upside to trying to anticipate when that may occur so we will sustain a conservative stance until the backdrop has unquestionably turned more bullish.
As always, please don’t hesitate to reach out to us with any questions or comments.
Sincerely,

Charles I Clough, Jr.

Robert M. Zdunczyk
This letter is provided for informational purposes only and is not an offer to purchase or sell shares. Clough Global Equity Fund (the “Fund”) is a closed-end fund, which is traded on the NYSE American LLC, and does not Equity Fund issue shares for sale as open-end mutual funds do. The market price of a closed-end fund is based on the market’s value.
Although not generally stated throughout, the information in this letter reflects the opinions of the individual portfolio managers, which opinion is subject to change, and is not intended to be a forecast of future events, a guarantee of future results or investment advice.
The Morningstar Global Allocation Index represents a multi-asset class portfolio of 60% global equities and 40% global bonds. The asset allocation within each class is driven by Morningstar asset allocation methodology. To maintain broad global exposure and diversification, the index consists of equities & fixed income and utilizes global, float-weighted index methodology to determine allocation to U.S. and non-U.S.
The MSCI World Index is a free float-adjusted market capitalization weighted index that is designed to measure the equity market performance of 23 developed markets countries. Both indices referenced herein reflect the reinvestment of dividends. Effective July 31, 2010, the MSCI World Index returns prior to January 1, 2002 were revised to reflect the total returns, with dividends reinvested, reported by MSCI. The MSCI information may only be used for your internal use, may not be reproduced or redisseminated in any form and may not be used as a basis for or a component of any financial instruments or products or indices. None of the MSCI information is intended to constitute investment advice or a recommendation to make (or refrain from making) any kind of investment decision and may not be relied on as such. Historical data and analysis should not be taken as an indication or guarantee of any future performance analysis, forecast or prediction. The MSCI information is provided on an “as is” basis and the user of this information assumes the entire risk of any use made of this information. MSCI, each of its affiliates and each other person involved in or related to compiling, computing or creating any MSCI information (collectively, the “MSCI Parties”) expressly disclaims all warranties (including, without limitation, any warranties of originality, accuracy, completeness, timeliness, non-infringement, merchantability and fitness for a particular purpose) with respect to this information. Without limiting any of the foregoing, in no event shall any MSCI Party have any liability for any direct, indirect, special, incidental, punitive, consequential (including, without limitation, lost profits) or any other damages (www.msci.com).
The Bloomberg U.S. Aggregate Bond Index measures the performance of the U.S. investment grade bond market. The Bloomberg U.S. Aggregate Bond index invests in a wide spectrum of public, investment-grade, taxable, fixed income securities in the United States, including government, corporate, and international dollar-denominated bonds, as well as mortgage-backed and asset-backed securities, all with maturities of more than 1 year.
| Clough Global Equity Fund | Shareholder Letter |
April 30, 2022 (Unaudited)
The blended indices, 50% MSCI World/50% Bloomberg U.S. Aggregate Bond Index and 75% MSCI World/25% Bloomberg U.S. Aggregate Bond Index, have been calculated by Clough Capital Partners L.P. based on the sources listed above.
The performance of the indices referenced herein is used for informational purposes only. One cannot invest directly in an index. Indices are not subject to any of the fees or expenses to which the Fund is subject, and there are significant differences between the Fund’s investments and the components of the indices referenced.
The net asset value (“NAV”) of a closed-end fund is the market price of the underlying investments (i.e., stocks and bonds) in the Fund’s portfolio, minus liabilities, divided by the total number of fund shares outstanding. However, the Fund also has a market price; the value of which it trades on an exchange. This market price can be more or less than its NAV.
RISKS
An investor should consider investment objectives, risks, charges and expenses carefully before investing. To obtain an annual report or semiannual report which contains this and other information visit www.cloughglobal.com or call 1-855-425-6844. Read them carefully before investing.
The Fund’s distribution policy will, under certain circumstances, have certain adverse consequences to the Fund and its shareholders because it may result in a return of capital resulting in less of a shareholder’s assets being invested in the Fund and, over time, increase the Fund’s expense ratio.
Distributions may be paid from sources of income other than ordinary income, such as net realized short-term capital gains, net realized long-term capital gains and return of capital. Based on current estimates, we anticipate the most recent distribution has been paid from short-term and long-term capital gains. The actual amounts and sources of the amounts for tax reporting purposes will depend upon the Fund’s investment experience during the remainder of its fiscal year and may be subject to changes based on tax regulations. If a distribution includes anything other than net investment income, the Fund provides a Section 19(a) notice of the best estimate of its distribution sources at that time. These estimates may not match the final tax characterization (for the full year’s distributions) contained in shareholders’ 1099-DIV forms after the end of the year. For the fiscal year 2021, the Fund's distribution policy resulted in distributions of capital in the amount of $23,035,803.
The Fund’s investments in securities of foreign issuers are subject to risks not usually associated with owning securities of U.S. issuers. These risks can include fluctuations in foreign currencies, foreign currency exchange controls, social, political and economic instability, differences in securities regulation and trading, expropriation or nationalization of assets, and foreign taxation issues.
The Fund’s investments in preferred stocks and bonds of below investment grade quality (commonly referred to as “high yield” or “junk bonds”), if any, are predominately speculative because of the credit risk of their issuers.
An investment by the Fund in real estate investment trusts (“REITs”) will subject it to various risks. The first, real estate industry risk, is the risk that the REIT share prices will decline because of adverse developments affecting the real estate industry and real property values. In general, real estate values can be affected by a variety of factors, including supply and demand for properties, the economic health of the country or of different regions, and the strength of specific industries that rent properties. The second, investment style risk, is the risk that returns from REITs—which typically are small or medium capitalization stocks—will trail returns from the overall stock market. The third, interest rate risk, is the risk that changes in interest rates may hurt real estate values or make REIT shares less attractive than other income-producing investments. Credit risk is the risk that an issuer of a preferred or debt security will become unable to meet its obligation to make dividend, interest and principal payments.
Interest rate risk is the risk that preferred stocks paying fixed dividend rates and fixed-rate debt securities will decline in value because of changes in market interest rates. When interest rates rise the value of such securities generally will fall. Derivative transactions (such as futures contracts and options thereon, options, swaps, and short sales) subject the Fund to increased risk of principal loss due to imperfect correlation or unexpected price or interest rate movements. Compared to investment companies that focus only on large companies, the Fund’s share price may be more volatile because it also invests in small and medium capitalization companies.
Past performance is neither a guarantee, nor necessarily indicative, of future results, which may be significantly affected by changes in economic and other conditions.
| Semi-Annual Report | April 30, 2022 | 9 |
| Clough Global Equity Fund | Portfolio Allocation |
April 30, 2022 (Unaudited)
| Top 10 Equity Holdings(a)(d) | % of Total Portfolio |
| 1. Microsoft Corp. | 4.69% |
| 2. Apple, Inc. | 4.13% |
| 3. Raytheon Technologies Corp. | 3.63% |
| 4. Starwood Property Trust, Inc. | 3.54% |
| 5. Visa, Inc. | 2.54% |
| 6. Exxon Mobil Corp. | 2.29% |
| 7. Booking Holdings, Inc. | 2.24% |
| 8. Kinder Morgan, Inc. | 2.19% |
| 9. The Boeing Co. | 2.10% |
| 10. Royal Caribbean Cruises Ltd. | 2.09% |
| Global Securities Holdings(a) | % of Total Portfolio |
| United States | 80.64% |
| U.S. Multinationals(b) | 19.70% |
| France | 1.71% |
| Switzerland | 0.98% |
| Other | -3.03% |
| TOTAL INVESTMENTS | 100.00% |
| Asset Allocation(a) | % of Total Portfolio |
| Common Stock - US | 37.94% |
| Common Stock - Foreign | 22.54% |
| Exchange Traded Funds | -3.39% |
| Total Equities | 57.11% |
| | |
| Government L/T | 28.62% |
| Corporate Debt | 0.04% |
| Total Fixed Income | 28.66% |
| | |
| Short-Term Investments | 12.17% |
| Other (Cash) | 0.97% |
| Warrant | 0.91% |
| Purchased & Written Options | 0.20% |
| | |
| TOTAL INVESTMENTS | 100.00% |
| Country Allocation(c) | Long
Exposure
%NAV | Short
Exposure
%NAV | Gross
Exposure
%NAV | Net
Exposure
%NAV |
| United States | 121.8% | -8.8% | 130.6% | 113.0% |
| U.S. Multinationals(b) | 39.9% | -12.4% | 52.3% | 27.5% |
| France | 2.4% | 0.0% | 2.4% | 2.4% |
| Switzerland | 1.4% | 0.0% | 1.4% | 1.4% |
| Other | 0.0% | -4.2% | 4.2% | -4.2% |
| TOTAL INVESTMENTS | 165.5% | -25.4% | 190.9% | 140.1% |
| (a) | Percentages calculated based on total portfolio, including securities sold short, cash balances, market value of futures, and notional value of return swaps. |
| (b) | U.S. Multinationals includes companies organized or located in the United States that have more than 50% of revenues derived outside of the United States. |
| (c) | Percentages calculated based on the net asset value of the Fund. |
| (d) | Only long equity and equity-related positions are listed. |
| Clough Global Equity Fund | Portfolio Allocation |
April 30, 2022 (Unaudited)
Total Return as of April 30, 2022(a)
| | 1 Year | 3 Year | 5 Year | Since Inception(b) |
| Clough Global Equity Fund - NAV(c) | -28.76% | 3.42% | 6.68% | 6.61% |
| Clough Global Equity Fund - Market Price(d) | -24.50% | 4.71% | 7.83% | 6.27% |
| MSCI World Index - GR | -3.10% | 10.95% | 10.74% | 8.17% |
| (a) | Total returns assume reinvestment of all distributions. |
| (b) | The Fund commenced operation on April 27, 2005. |
| (c) | Performance returns are net of management fees and other Fund expenses. |
| (d) | Market price is the value at which the Fund trades on an exchange. This market price can be more or less than its NAV. |
Distribution to Common Stockholders
The Fund intends to make monthly distributions to common shareholders according to its managed distribution policy. The Fund’s managed distribution policy is to set the monthly distribution rate at an amount equal to one twelfth of 10% of the Fund’s adjusted year-ending net asset value per share (“NAV”), which will be the average of the NAVs as of the last five business days of the prior calendar year. The Board of Directors approve the distribution and may adjust it from time to time. The monthly distribution amount paid from October 1, 2021 to December 31, 2021 was $0.1341 per share and the Fund paid $0.1162 per share monthly between January 1, 2022 and April 30, 2022. At times, to maintain a stable level of distributions, the Fund may pay out less than all of its net investment income or pay out accumulated undistributed income, or return of capital, in addition to current net investment income.
Performance of $10,000 Initial Investment (as of April 30, 2022)
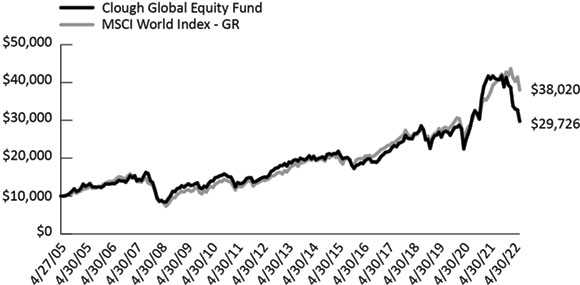
The graph shown above represents historical performance of a hypothetical investment of $10,000 in the Fund since inception. Past performance does not guarantee future results. All returns reflect reinvested dividends, but do not reflect the deduction of taxes that a shareholder would pay on Fund distributions or the redemption of Fund shares.
| Semi-Annual Report | April 30, 2022 | 11 |
| Clough Global Opportunities Fund | Shareholder Letter |
| | April 30, 2022 (Unaudited) |
To Our Investors,
For the semi-annual period ending April 30, 2022, the Clough Global Opportunities Fund (“GLO” or the “Fund”) had a total net return of -28.90% on net asset value (“NAV”) and -31.25% on market price compared to -10.62% for the 75% MSCI World Index/25% Bloomberg U.S. Aggregate Bond Index and -11.65% for the Morningstar Global Allocation Index for the same period.
Top 5 Contributors and Detractors for the Fund’s First Fiscal Half of the Year
The top contributor to performance for the first six months of the fiscal year was a long position in Checkmate Pharmaceuticals Inc., a clinical stage immunotherapy company, that announced it will be acquired by Regeneron Pharmaceuticals Inc. in a $250 million all cash deal. Two short positions in Rivian Automotive Inc., a fledgling produce of electric vehicle (“EV”) trucks, as well as Zscaler Inc., a security software company, contributed to performance as interest rates moved higher and the lofty company valuations proved to be unsustainable. Finally, long positions in two healthcare companies rounded out the top five contributors. McKesson Corp., a drug distributor and Vertex Pharmaceuticals Inc., a biotechnology company focused on cystic fibrosis, both rallied as their earnings exceeded Wall Street expectations.
Two of the weakest holdings to start the year were BYD Co Ltd. and Contemporary Amperex Technology Co Ltd. Both are leading battery makers for electric vehicles in China that struggled as continued COVID-related shutdowns in China lead to a decline in sales and production. Amazon.com Inc. suffered sharp declines as concerns regarding investment in its retail operations trumped its strong results in Amazon Web Services. Micron Technology Inc., the only U.S.-based producer of semiconductor memory, also declined in line with the technology sector during the first half of the year. Finally, C4 Therapeutics Inc., a biotechnology company, rounded out the bottom five.
New Themes Added in the Fund’s First Fiscal Half of the Year
DEFENSE AEROSPACE
During the period we added new positions in Northrop Grumman Corp. and Lockheed Martin Corp to the position in Raytheon Technologies Corp. we already held in the Fund. Defense stocks have been underperforming for years, reflecting a long period of underinvestment in our armed forces which began around the time of the fall of the former Soviet Union. One indication of our declining military proficiency is the number of hours per week flown by U.S. fighter pilots, which have fallen from the 60-70 norm to 10 hours per week according to a Wall Street Journal report. Few new aircraft have been developed over the past few decades. Only the F-35 fighter aircraft and an undetermined number of B-21 bombers are entering western fleets in large numbers. So, a defense investment cycle was perhaps inevitable, but Russia’s invasion of Ukraine likely brought it forward. Shortages of military platforms such as submarines, naval vessels, aircraft and land vehicles has become extreme at a time of growing geopolitical threats which can no longer be ignored. Demand comes not only from the need to supply U.S. forces, but those of Europe and Asian nations like Japan and Korea, as well.
Defense stocks tend to carry a premium multiple to the S&P 500 Index because they are backlogged businesses making operating results easier to predict, and they also typically have strong balance sheets and high cashflows. Free cash flow yields average 7-9% annually. We anticipate a move down to 5% or so as new programs are authorized.
Raytheon Technologies currently remains our largest holding in the sector. The company has a leading position in both commercial and military aerospace and space technologies. Its subsidiaries hold dominant and highly profitable positions in flight control systems (Collins Aerospace) and aircraft engines (Pratt and Whitney, whose engines hold the largest percentages on the A-320 neo). The company also sports a defense systems business with leading technologies in hyper sonics, as well as cyber missile defense systems. We also expect further synergies will continue to arise from the company’s 2020 merger with United Technologies.
ENERGY
Years of underinvestment in fossil fuel energy has caused global oil supplies to fall short of demand. That has taken inventories from the highest to the lowest level in over 30 years, according to Alpine Macro Research. So, the reality of actual shortages is only now becoming apparent. There have been little institutional capital flows into energy and despite the recent rally the sector only accounts for 4.2% of S&P 500 Index market capitalization. Since January 2020, domestic crude prices have increased by 50% while Henry Hub natural gas prices have tripled. Our focus is in the energy services and LNG sectors.
What is new in the present experience is the absence of any buffer of spare capacity in the energy system. During the energy crises of 1973 and 1979, the Organization of the Petroleum Exporting Countries (“OPEC”) maintained several million barrels per day of spare oil pumping capacity. That buffer fell to 2 million barrels a day in 2008, even as oil hit $145 per barrel. Now, that excess capacity is gone. For the past 15 years, nearly 90% of total non-OPEC oil production growth has come from U.S. shale operations. But that supply seems to be peaking and early signs of resource exhaustion are noticeable. The best drilling prospects have already been drilled and many fields are now declining. Since late 2019 production in the U.S. has declined by 1.5 million barrels a day. There is no other source of non-OPEC oil production available. Iran and Iraq may have a modest amount of excess capacity, but they have been producing close to as much as they can. Russia’s invasion of Ukraine simply brought these issues forward.
| Clough Global Opportunities Fund | Shareholder Letter |
| | April 30, 2022 (Unaudited) |
It appears to us that a new cycle of energy exploration will be required and since the oil service and equipment industry has been consolidating for two decades pricing and profitability in this new cycle should be very strong.
The natural gas investment cycle could be even stronger. Global demand is strong, and a cold European 2020-2021 winter drove European inventories to dangerously low levels. Ample shale gas in the U.S. has already led to a U.S. liquid natural gas export boom and so far, this has occurred while leaving the U.S. market well supplied. But that could change since the best wells have been drilled and the two earliest gas shale basins (Barnett and Fayetteville) have rolled over and are now running 60% below their peak production levels. The Fund currently holds a position in Cheniere Energy, Inc. the largest LNG producer and transportation company.
FIXED INCOME
The Fund is currently conservatively positioned due to the extreme volatility in the markets. Rather than hold a significant amount in cash sweep vehicles that pay very little in interest, the Fund has invested in two to three-year investment grade corporate bonds that yield between three and four percent. We view this as an attractive return for taking very little interest rate risk while waiting out very choppy markets.
The year so far has been a challenge, but we believe that over the summer inflationary pressures may reverse, perhaps sharply, and the markets’ perception of central bank policies will shift towards a more bullish liquidity stance. However, there is no upside to trying to anticipate when that may occur so we will sustain a conservative stance until the backdrop has unquestionably turned more bullish.
As always, please don’t hesitate to reach out to us with any questions or comments.
Sincerely,

Charles I Clough, Jr.

Robert M. Zdunczyk
This letter is provided for informational purposes only and is not an offer to purchase or sell shares. Clough Global Opportunities Fund (the “Fund”) is a closed- end fund, which is traded on the NYSE American LLC, and does not Equity Fund issue shares for sale as open-end mutual funds do. The market price of a closed-end fund is based on the market’s value.
Although not generally stated throughout, the information in this letter reflects the opinions of the individual portfolio managers, which opinion is subject to change, and is not intended to be a forecast of future events, a guarantee of future results or investment advice.
The Morningstar Global Allocation Index represents a multi-asset class portfolio of 60% global equities and 40% global bonds. The asset allocation within each class is driven by Morningstar asset allocation methodology. To maintain broad global exposure and diversification, the index consists of equities & fixed income and utilizes global, float-weighted index methodology to determine allocation to U.S. and non-U.S.
The MSCI World Index is a free float-adjusted market capitalization weighted index that is designed to measure the equity market performance of 23 developed markets countries. Both indices referenced herein reflect the reinvestment of dividends. Effective July 31, 2010, the MSCI World Index returns prior to January 1, 2002 were revised to reflect the total returns, with dividends reinvested, reported by MSCI. The MSCI information may only be used for your internal use, may not be reproduced or redisseminated in any form and may not be used as a basis for or a component of any financial instruments or products or indices. None of the MSCI information is intended to constitute investment advice or a recommendation to make (or refrain from making) any kind of investment decision and may not be relied on as such. Historical data and analysis should not be taken as an indication or guarantee of any future performance analysis, forecast or prediction. The MSCI information is provided on an “as is” basis and the user of this information assumes the entire risk of any use made of this information. MSCI, each of its affiliates and each other person involved in or related to compiling, computing or creating any MSCI information (collectively, the “MSCI Parties”) expressly disclaims all warranties (including, without limitation, any warranties of originality, accuracy, completeness, timeliness, non-infringement, merchantability and fitness for a particular purpose) with respect to this information. Without limiting any of the foregoing, in no event shall any MSCI Party have any liability for any direct, indirect, special, incidental, punitive, consequential (including, without limitation, lost profits) or any other damages (www.msci.com).
| Semi-Annual Report | April 30, 2022 | 13 |
| Clough Global Opportunities Fund | Shareholder Letter |
| | April 30, 2022 (Unaudited) |
The Bloomberg U.S. Aggregate Bond Index measures the performance of the U.S. investment grade bond market. The Bloomberg U.S. Aggregate Bond index invests in a wide spectrum of public, investment-grade, taxable, fixed income securities in the United States, including government, corporate, and international dollar-denominated bonds, as well as mortgage-backed and asset-backed securities, all with maturities of more than 1 year.
The blended indices, 50% MSCI World/50% Bloomberg U.S. Aggregate Bond Index and 75% MSCI World/25% Bloomberg U.S. Aggregate Bond Index, have been calculated by Clough Capital Partners L.P. based on the sources listed above.
The performance of the indices referenced herein is used for informational purposes only. One cannot invest directly in an index. Indices are not subject to any of the fees or expenses to which the Fund is subject, and there are significant differences between the Fund’s investments and the components of the indices referenced.
The net asset value (“NAV”) of a closed-end fund is the market price of the underlying investments (i.e., stocks and bonds) in the Fund’s portfolio, minus liabilities, divided by the total number of fund shares outstanding. However, the Fund also has a market price; the value of which it trades on an exchange. This market price can be more or less than its NAV.
RISKS
An investor should consider investment objectives, risks, charges and expenses carefully before investing. To obtain an annual report or semiannual report which contains this and other information visit www.cloughglobal.com or call 1-855-425-6844. Read them carefully before investing.
The Fund’s distribution policy will, under certain circumstances, have certain adverse consequences to the Fund and its shareholders because it may result in a return of capital resulting in less of a shareholder’s assets being invested in the Fund and, over time, increase the Fund’s expense ratio.
Distributions may be paid from sources of income other than ordinary income, such as net realized short-term capital gains, net realized long-term capital gains and return of capital. Based on current estimates, we anticipate the most recent distribution has been paid from short-term and long-term capital gains. The actual amounts and sources of the amounts for tax reporting purposes will depend upon the Fund’s investment experience during the remainder of its fiscal year and may be subject to changes based on tax regulations. If a distribution includes anything other than net investment income, the Fund provides a Section 19(a) notice of the best estimate of its distribution sources at that time. These estimates may not match the final tax characterization (for the full year’s distributions) contained in shareholders’ 1099-DIV forms after the end of the year. For the fiscal year 2021, the Fund’s distribution policy resulted in distributions of capital in the amount of $44,110,259.
The Fund’s investments in securities of foreign issuers are subject to risks not usually associated with owning securities of U.S. issuers. These risks can include fluctuations in foreign currencies, foreign currency exchange controls, social, political and economic instability, differences in securities regulation and trading, expropriation or nationalization of assets, and foreign taxation issues.
The Fund’s investments in preferred stocks and bonds of below investment grade quality (commonly referred to as “high yield” or “junk bonds”), if any, are predominately speculative because of the credit risk of their issuers.
An investment by the Fund in real estate investment trusts (“REITs”) will subject it to various risks. The first, real estate industry risk, is the risk that the REIT share prices will decline because of adverse developments affecting the real estate industry and real property values. In general, real estate values can be affected by a variety of factors, including supply and demand for properties, the economic health of the country or of different regions, and the strength of specific industries that rent properties. The second, investment style risk, is the risk that returns from REITs—which typically are small or medium capitalization stocks—will trail returns from the overall stock market. The third, interest rate risk, is the risk that changes in interest rates may hurt real estate values or make REIT shares less attractive than other income-producing investments. Credit risk is the risk that an issuer of a preferred or debt security will become unable to meet its obligation to make dividend, interest and principal payments.
Interest rate risk is the risk that preferred stocks paying fixed dividend rates and fixed-rate debt securities will decline in value because of changes in market interest rates. When interest rates rise the value of such securities generally will fall. Derivative transactions (such as futures contracts and options thereon, options, swaps, and short sales) subject the Fund to increased risk of principal loss due to imperfect correlation or unexpected price or interest rate movements. Compared to investment companies that focus only on large companies, the Fund’s share price may be more volatile because it also invests in small and medium capitalization companies.
Past performance is neither a guarantee, nor necessarily indicative, of future results, which may be significantly affected by changes in economic and other conditions.
| Clough Global Opportunities Fund | Portfolio Allocation |
| | April 30, 2022 (Unaudited) |
| Top 10 Equity Holdings(a)(d) | % of Total Portfolio |
| 1. | Microsoft Corp. | 4.92% |
| 2. | Apple, Inc. | 4.25% |
| 3. | Raytheon Technologies Corp. | 3.72% |
| 4. | Starwood Property Trust, Inc. | 3.62% |
| 5. | Visa, Inc. | 2.62% |
| 6. | Exxon Mobil Corp. | 2.34% |
| 7. | Booking Holdings, Inc. | 2.28% |
| 8. | Kinder Morgan, Inc. | 2.25% |
| 9. | The Boeing Co. | 2.20% |
| 10. | Royal Caribbean Cruises Ltd. | 2.17% |
| Global Securities Holdings(a) | % of Total Portfolio |
| United States | 79.83% |
| U.S. Multinationals(b) | 19.87% |
| France | 1.79% |
| Switzerland | 0.99% |
| Canada | 0.61% |
| Other | -3.09% |
| TOTAL INVESTMENTS | 100.00% |
| Asset Allocation(a) | % of Total Portfolio |
| Common Stock - US | 39.55% |
| Common Stock - Foreign | 22.80% |
| Exchange Traded Funds | -3.45% |
| Total Equities | 58.91% |
| | |
| Government L/T | 25.63% |
| Corporate Debt | 10.33% |
| Total Fixed Income | 35.96% |
| | |
| Short-Term Investments | 7.04% |
| Warrant | 0.95% |
| Purchased & Written Options | 0.21% |
| Other (Cash) | -3.06% |
| | |
| TOTAL INVESTMENTS | 100.00% |
| Country Allocation(c) | Long
Exposure
%NAV | Short
Exposure
%NAV | Gross
Exposure
%NAV | Net
Exposure
%NAV |
| United States | 122.2% | -12.4% | 134.6% | 109.8% |
| U.S. Multinationals(b) | 39.8% | -12.4% | 52.2% | 27.4% |
| France | 2.5% | 0.0% | 2.5% | 2.5% |
| Switzerland | 1.4% | 0.0% | 1.4% | 1.4% |
| Canada | 0.8% | 0.0% | 0.8% | 0.8% |
| Other | 0.0% | -4.3% | 4.3% | -4.3% |
| TOTAL INVESTMENTS | 166.7% | -29.1% | 195.8% | 137.6% |
| (a) | Percentages calculated based on total portfolio, including securities sold short, cash balances, market value of futures, and notional value of return swaps. |
| (b) | U.S. Multinationals includes companies organized or located in the United States that have more than 50% of revenues derived outside of the United States. |
| (c) | Percentages calculated based on the net asset value of the Fund. |
| (d) | Only long equity and equity-related positions are listed. |
| Semi-Annual Report | April 30, 2022 | 15 |
| Clough Global Opportunities Fund | Portfolio Allocation |
| | April 30, 2022 (Unaudited) |
Total Return as of April 30, 2022(a)
| | 1 Year | 3 Year | 5 Year | Since Inception(b) |
| Clough Global Opportunities Fund - NAV(c) | -29.08% | 3.14% | 5.28% | 4.84% |
| Clough Global Opportunities Fund - Market Price(d) | 25.84% | 7.32% | 7.15% | 4.62% |
| Morningstar Global Allocation Index | -8.37% | 5.46% | 6.07% | 5.66% |
| 25% Bloomberg Barclays US Aggregate / 75% MSCI World GR | -4.35% | 8.53% | 8.53% | 6.56% |
| (a) | Total returns assume reinvestment of all distributions. |
| (b) | The Fund commenced operation on April 25, 2006. |
| (c) | Performance returns are net of management fees and other Fund expenses. |
| (d) | Market price is the value at which the Fund trades on an exchange. This market price can be more or less than its NAV. |
Distribution to Common Stockholders
The Fund intends to make monthly distributions to common shareholders according to its managed distribution policy. The Fund’s managed distribution policy is to set the monthly distribution rate at an amount equal to one twelfth of 10% of the Fund’s adjusted year-ending net asset value per share (“NAV”), which will be the average of the NAVs as of the last five business days of the prior calendar year. The Board of Directors approve the distribution and may adjust it from time to time. The monthly distribution amount paid from October 1, 2021 to December 31, 2021 was $0.1087 per share and the Fund paid $0.0943 per share monthly between January 1, 2022 and April 30, 2022. At times, to maintain a stable level of distributions, the Fund may pay out less than all of its net investment income or pay out accumulated undistributed income, or return of capital, in addition to current net investment income.
Performance of $10,000 Initial Investment (as of April 2022)
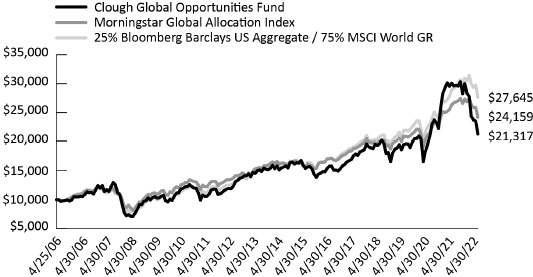
The graph shown above represents historical performance of a hypothetical investment of $10,000 in the Fund since inception. Past performance does not guarantee future results. All returns reflect reinvested dividends, but do not reflect the deduction of taxes that a shareholder would pay on Fund distributions or the redemption of Fund shares.
| Clough Global Dividend and Income Fund | Statement of Investments |
| | April 30, 2022 (Unaudited) |
| | | Shares | | | Value | |
| COMMON STOCKS 72.12% | | | | | | | | |
| Consumer Discretionary 2.86% | | | | | | | | |
| DR Horton, Inc.(a)(b) | | | 23,500 | | | $ | 1,635,365 | |
| Lennar Corp. - Class A(a)(b) | | | 16,640 | | | | 1,272,794 | |
| | | | | | | | 2,908,159 | |
| | | | | | | | | |
| Energy 7.58% | | | | | | | | |
| Cheniere Energy, Inc. | | | 14,300 | | | | 1,942,083 | |
| Exxon Mobil Corp.(a)(b) | | | 34,500 | | | | 2,941,125 | |
| Kinder Morgan, Inc. | | | 155,500 | | | | 2,822,324 | |
| | | | | | | | 7,705,532 | |
| | | | | | | | | |
| Financials 12.86% | | | | | | | | |
| Equitable Holdings, Inc.(a)(b) | | | 51,400 | | | | 1,481,862 | |
| First American Financial Corp.(a)(b) | | | 50,890 | | | | 2,967,396 | |
| Redwood Trust, Inc.(a)(b) | | | 234,700 | | | | 2,276,590 | |
| Starwood Property Trust, Inc.(a)(b) | | | 199,300 | | | | 4,559,984 | |
| Walker & Dunlop, Inc.(a)(b) | | | 14,870 | | | | 1,780,831 | |
| | | | | | | | 13,066,663 | |
| | | | | | | | | |
| Health Care 9.40% | | | | | | | | |
| Eli Lilly & Co.(a)(b) | | | 12,013 | | | | 3,509,358 | |
| McKesson Corp.(a) | | | 904 | | | | 279,887 | |
| Pfizer, Inc.(a)(b) | | | 48,100 | | | | 2,360,267 | |
| Stryker Corp. | | | 3,700 | | | | 892,662 | |
| UnitedHealth Group, Inc.(a)(b) | | | 2,740 | | | | 1,393,427 | |
| Zimmer Biomet Holdings, Inc. | | | 9,200 | | | | 1,110,900 | |
| | | | | | | | 9,546,501 | |
| | | | | | | | | |
| Industrials 17.44% | | | | | | | | |
| Airbus SE | | | 16,265 | | | | 1,810,940 | |
| Lockheed Martin Corp. | | | 3,380 | | | | 1,460,566 | |
| Northrop Grumman Corp. | | | 5,670 | | | | 2,491,398 | |
| Raytheon Technologies Corp.(a)(b) | | | 94,150 | | | | 8,935,776 | |
| TransDigm Group, Inc.(a)(b)(c) | | | 5,077 | | | | 3,019,850 | |
| | | | | | | | 17,718,530 | |
| | | | | | | | | |
| Information Technology 21.98% | | | | | | | | |
| Apple, Inc.(a)(b) | | | 33,520 | | | | 5,284,428 | |
| Microsoft Corp.(a)(b) | | | 21,065 | | | | 5,845,959 | |
| NVIDIA Corp.(a)(b) | | | 11,885 | | | | 2,204,311 | |
| Visa, Inc. - Class A(a)(b) | | | 42,190 | | | | 8,991,955 | |
| | | | | | | | 22,326,653 | |
| | | | | | | | | |
| TOTAL COMMON STOCKS | | | | | | | | |
| (Cost $70,745,112) | | | | | | | 73,272,038 | |
| | | Shares | | | Value | |
| EXCHANGE TRADED FUNDS 2.47% | | | | | |
| VanEck Vectors® Oil Services ETF(a)(b) | | | 9,510 | | | $ | 2,508,358 | |
| | | | | | | | | |
| TOTAL EXCHANGE TRADED FUNDS | | | | | |
| (Cost $2,470,208) | | | | | | | 2,508,358 | |
| | | | | | | | | |
| PREFERRED STOCKS 1.05% | | | | | | | | |
| Gabelli Equity Trust, Inc. | | | | | | | | |
| Series K, Perpetual Maturity 5.000%(d) | | | 21,200 | | | | 487,600 | |
| Trinity Capital, Inc., 01/16/2025 7.000%(a) | | | 22,400 | | | | 586,600 | |
| | | | | | | | | |
| TOTAL PREFERRED STOCKS | | | | | | | | |
| (Cost $1,090,000) | | | | | | | 1,074,200 | |
| Underlying Security/Expiration Date/Exercise Price/Notional Amount | | Contracts | | | Value | |
| PURCHASED OPTIONS 0.38% | | | | | | | | |
| Put Options Purchased 0.38% | | | | | | | | |
| S&P 500® Index 05/20/22, $4,150, $13,222,176 | | | 32 | | | | 383,200 | |
| | | | | | | | | |
| Total Put Options Purchased | | | | | | | | |
| (Cost $508,284) | | | | | | | 383,200 | |
| | | | | | | |
| Description/Maturity Date/Rate | | Principal
Amount | | | Value | |
| CORPORATE BONDS 24.56% | | | | | | | | |
| Consumer Discretionary | | | | | | | | |
| Carnival Corp. | | | | | | | | |
| 03/01/2026, 7.625%(e)(f) | | $ | 1,000,000 | | | | 979,890 | |
| Carvana Co. | | | | | | | | |
| 10/01/2025, 5.625%(e)(f) | | | 500,000 | | | | 434,015 | |
| Melco Resorts Finance, Ltd. | | | | | | | | |
| 07/21/2028, 5.750%(e)(f) | | | 250,000 | | | | 211,322 | |
| PulteGroup, Inc. | | | | | | | | |
| 01/15/2027, 5.000% | | | 500,000 | | | | 514,220 | |
| | | | | | | | 2,139,447 | |
| | | | | | | | | |
| Consumer Staples | | | | | | | | |
| JDE Peet's NV | | | | | | | | |
| 01/15/2027, 1.375%(e)(f) | | | 1,000,000 | | | | 873,523 | |
| | | | | | | | | |
| Financials | | | | | | | | |
| Bank of Montreal | | | | | | | | |
| 01/10/2025, 1.500% | | | 1,000,000 | | | | 949,136 | |
| Blackstone Secured Lending Fund | | | | | | | | |
| 01/15/2026, 3.625% | | | 500,000 | | | | 478,930 | |
| Capital One Financial Corp. | | | | | | | | |
| 12/06/2024, 1D US SOFR + 0.69%(g) | | | 1,000,000 | | | | 961,646 | |
See Notes to the Financial Statements.
| Semi-Annual Report | April 30, 2022 | 17 |
| Clough Global Dividend and Income Fund | Statement of Investments |
| | April 30, 2022 (Unaudited) |
| Description/Maturity Date/Rate | | Principal
Amount | | | Value | |
| CORPORATE BONDS (continued) | | | | | | | | |
| Golub Capital BDC, Inc. | | | | | | | | |
| 04/15/2024, 3.375% | | $ | 500,000 | | | $ | 491,034 | |
| 08/24/2026, 2.500%(a) | | | 1,035,000 | | | | 923,677 | |
| JPMorgan Chase & Co. | | | | | | | | |
| 04/26/2026, 1D US SOFR + 1.32%(g) | | | 1,000,000 | | | | 997,914 | |
| Main Street Capital Corp. | | | | | | | | |
| 12/01/2022, 4.500%(a) | | | 1,043,000 | | | | 1,054,073 | |
| 07/14/2026, 3.000%(a)(b) | | | 1,600,000 | | | | 1,457,562 | |
| Morgan Stanley | | | | | | | | |
| Series GMTN, 01/27/2026, 3.875% | | | 1,000,000 | | | | 992,059 | |
| Nationstar Mortgage Holdings, Inc. | | | | | | | | |
| 12/15/2030, 5.125%(a)(b)(e)(f) | | | 1,500,000 | | | | 1,306,717 | |
| 11/15/2031, 5.750%(e)(f) | | | 500,000 | | | | 444,428 | |
| Owl Rock Capital Corp. | | | | | | | | |
| 01/15/2027, 2.625%(a) | | | 1,260,000 | | | | 1,112,022 | |
| Owl Rock Technology Finance Corp. | | | | | | | | |
| 06/30/2025, 6.750%(a)(e)(f) | | | 1,000,000 | | | | 1,023,745 | |
| 12/15/2025, 4.750%(a)(e)(f) | | | 1,000,000 | | | | 970,290 | |
| Signature Bank | | | | | | | | |
| 11/01/2029, 3M US L + 2.559%(g) | | | 500,000 | | | | 496,135 | |
| Sixth Street Specialty Lending, Inc. | | | | | | | | |
| 11/01/2024, 3.875% | | | 1,000,000 | | | | 994,529 | |
| SLR Investment Corp. | | | | | | | | |
| 01/20/2023, 4.500% | | | 500,000 | | | | 500,131 | |
| SVB Financial Group | | | | | | | | |
| 01/29/2025, 3.500% | | | 510,000 | | | | 507,077 | |
| Trinity Capital, Inc. | | | | | | | | |
| 08/24/2026, 4.375% | | | 500,000 | | | | 464,666 | |
| | | | | | | | 16,125,771 | |
| | | | | | | | | |
| Industrials | | | | | | | | |
| Alaska Airlines 2020-1 Class B Pass Through Trust | | | | | | | | |
| 08/15/2025, 8.000%(a)(e)(f) | | | 1,443,688 | | | | 1,506,761 | |
| American Airlines 2014-1 Class A Pass Through Trust | | | | | | | | |
| 10/01/2026, 3.700% | | | 900,438 | | | | 858,558 | |
| Hexcel Corp. | | | | | | | | |
| 02/15/2027, 4.200%(a) | | | 1,000,000 | | | | 981,815 | |
| Raytheon Technologies Corp. | | | | | | | | |
| 08/16/2025, 3.950% | | | 1,000,000 | | | | 1,011,781 | |
| United Airlines 2018-1 Class AA Pass Through Trust | | | | | | | | |
| Series AA, 03/01/2030, 3.500% | | | 833,896 | | | | 774,681 | |
| US Airways 2012-2 Class A Pass Through Trust | | | | | | | | |
| 06/03/2025, 4.625% | | | 710,690 | | | | 682,887 | |
| | | | | | | | 5,816,483 | |
| | | | | | | | | |
| TOTAL CORPORATE BONDS | | | | | | | | |
| (Cost $26,513,994) | | | | | | | 24,955,224 | |
| Description/Maturity Date/Rate | | Principal
Amount | | | Value | |
| CONVERTIBLE CORPORATE BONDS 2.82% | |
| Financials | | | | | | | | |
| Starwood Property Trust, Inc. | | | | | | | | |
| 04/01/2023, 4.375%(a)(b) | | $ | 977,000 | | | $ | 980,664 | |
| | | | | | | | | |
| Health Care | | | | | | | | |
| Gossamer Bio, Inc. | | | | | | | | |
| 06/01/2027, 5.000%(a)(b) | | | 1,070,000 | | | | 762,375 | |
| Teladoc Health, Inc. | | | | | | | | |
| 06/01/2027, 1.250%(a)(b) | | | 1,500,000 | | | | 1,119,750 | |
| | | | | | | | 1,882,125 | |
| | |
| TOTAL CONVERTIBLE CORPORATE BONDS | |
| (Cost $3,483,144) | | | | | | | 2,862,789 | |
| | | | | | | | | |
| ASSET-BACKED SECURITIES 0.04% | | | | | |
| United States Small Business Administration | | | | | | | | |
| Series 2008-20L, Class 1, 12/01/2028, 6.220%(a)(b) | | | 37,993 | | | | 40,252 | |
| | | | | | | | | |
| TOTAL ASSET-BACKED SECURITIES | |
| (Cost $37,993) | | | | | | | 40,252 | |
| | | | | | | | | |
| GOVERNMENT & AGENCY OBLIGATIONS 47.53% | |
| U.S. Treasury Notes | | | | | | | | |
| 12/31/2023, 0.750%(a) | | | 16,000,000 | | | | 15,512,500 | |
| 01/31/2024, 0.875%(a) | | | 5,000,000 | | | | 4,848,828 | |
| 06/30/2024, 1.750%(a) | | | 2,000,000 | | | | 1,957,187 | |
| 02/28/2025, 1.125%(a) | | | 3,900,000 | | | | 3,715,969 | |
| 03/15/2025, 1.750%(a) | | | 8,000,000 | | | | 7,750,625 | |
| 01/31/2026, 2.625% | | | 2,500,000 | | | | 2,471,973 | |
| 02/28/2027, 1.125%(a) | | | 6,600,000 | | | | 6,062,461 | |
| 11/15/2027, 2.250%(a) | | | 6,200,000 | | | | 5,975,734 | |
| | | | | | | | | |
| TOTAL GOVERNMENT & AGENCY OBLIGATIONS | |
| (Cost $50,823,775) | | | | | | | 48,295,277 | |
| | | Shares | | | Value | |
| SHORT-TERM INVESTMENTS 4.60% | |
| Money Market Funds 4.60% | | | | | | | | |
| BlackRock Liquidity Funds, T-Fund Portfolio - Institutional Class (0.296% 7-day yield) | | | 4,676,335 | | | | 4,676,335 | |
| | | | | | | | | |
| TOTAL SHORT-TERM INVESTMENTS | | | | 4,676,335 | |
| (Cost $4,676,335) | | | | | | | | |
See Notes to the Financial Statements.
| Clough Global Dividend and Income Fund | Statement of Investments |
| | April 30, 2022 (Unaudited) |
| | | Shares | | | Value | |
| SHORT-TERM INVESTMENTS (continued) | | | |
| Total Investments - 155.57% | | | | | | | | |
| (Cost $160,348,845) | | | | | | $ | 158,067,673 | |
| | | | | | | | | |
| Other Assets in Excess of Liabilities - (55.57%)(h) | | | | | | | (56,464,870 | ) |
| | | | | | | | | |
| NET ASSETS - 100.00% | | | | | | $ | 101,602,803 | |
| | | | | | | | | |
| SCHEDULE OF SECURITIES SOLD SHORT | | Shares | | | Value | |
| COMMON STOCKS (14.80%) | | | | | | | | |
| Communication Services (0.69%) | | | | | | | | |
| Sea, Ltd. - ADR(c) | | | (8,420 | ) | | | (696,839 | ) |
| | | | | | | | | |
| Consumer Discretionary (3.76%) | | | | | | | | |
| CarMax, Inc.(c) | | | (22,100 | ) | | | (1,895,738 | ) |
| QuantumScape Corp.(c) | | | (62,600 | ) | | | (935,244 | ) |
| Rivian Automotive, Inc. - Class A(c) | | | (32,600 | ) | | | (985,824 | ) |
| | | | | | | | (3,816,806 | ) |
| | | | | | | | | |
| Financials (2.03%) | | | | | | | | |
| Deutsche Bank AG(c) | | | (144,300 | ) | | | (1,425,684 | ) |
| Rocket Cos., Inc.(c) | | | (46,600 | ) | | | (412,410 | ) |
| UWM Holdings Corp.(c) | | | (59,900 | ) | | | (222,229 | ) |
| | | | | | | | (2,060,323 | ) |
| | | | | | | |
| Health Care (1.60%) | | | | | | |
| ABIOMED, Inc.(c) | | | (1,600 | ) | | | (458,528 | ) |
| Envista Holdings Corp.(c) | | | (29,600 | ) | | | (1,172,752 | ) |
| | | | | | | | (1,631,280 | ) |
| | | | | | | | | |
| Industrials (1.06%) | | | | | | | | |
| Snap-on, Inc.(c) | | | (5,080 | ) | | | (1,079,449 | ) |
| | | | | | | | | |
| Information Technology (5.66%) | | | | | | | | |
| International Business Machines Corp.(c) | | | (14,310 | ) | | | (1,891,925 | ) |
| MongoDB, Inc.(c) | | | (1,160 | ) | | | (411,719 | ) |
| Monolithic Power Systems, Inc.(c) | | | (1,530 | ) | | | (600,127 | ) |
| RingCentral, Inc. - Class A(c) | | | (8,370 | ) | | | (710,195 | ) |
| United Microelectronics Corp. -Sponsored ADR(c) | | | (220,400 | ) | | | (1,754,384 | ) |
| Zscaler, Inc.(c) | | | (1,900 | ) | | | (385,206 | ) |
| | | | | | | | (5,753,556 | ) |
| | | | | | | | | |
| TOTAL COMMON STOCKS | | | | | | | | |
| (Proceeds $18,138,657) | | | | | | | (15,038,253 | ) |
| | | | | | | | | |
| EXCHANGE TRADED FUNDS (6.77%) | | | | | |
| Invesco QQQ ™ Trust Series 1(c) | | | (8,900 | ) | | | (2,787,925 | ) |
| iShares® U.S. Medical Devices ETF(c) | | | (26,400 | ) | | | (1,452,528 | ) |
| SCHEDULE OF SECURITIES SOLD | | | |
| SHORT (continued) | | Shares | | | Value | |
| EXCHANGE TRADED FUNDS (continued) | | | | | |
| SPDR S&P 500® ETF Trust(c) | | | (6,400 | ) | | $ | (2,636,800 | ) |
| | | | | | | | | |
| TOTAL EXCHANGE TRADED FUNDS | | | | | |
| (Proceeds $7,150,488) | | | | | | | (6,877,253 | ) |
| | | | | | | | | |
| TOTAL SECURITIES SOLD SHORT | | | | | |
| (Proceeds $25,289,145) | | | | | | $ | (21,915,506 | ) |
See Notes to the Financial Statements.
| Semi-Annual Report | April 30, 2022 | 19 |
| Clough Global Dividend and Income Fund | Statement of Investments |
| | April 30, 2022 (Unaudited) |
Investment Abbreviations:
SOFR - Secured Overnight Financing Rate
FEDEF Rates:
3M US L - 3 Month LIBOR as of April 30, 2022 was 1.36%
1D US SOFR-1 Day SOFR as of April 30, 2022 was 0.28%
| (a) | Pledged security; a portion or all of the security is pledged as collateral for securities sold short, or borrowings. As of April 30, 2022, the aggregate value of those securities was $112,454,525, representing 110.68% of net assets.
(See Note 1) |
| (b) | Loaned security; a portion or all of the security is on loan as of April 30, 2022. |
| (c) | Non-income producing security. |
| (d) | This security has no contractual maturity date, is not redeemable and contractually pays an indefinite stream of interest. |
| (e) | Security is exempt from registration of the Securities Act of 1933. These securities may be resold in transactions exempt from registration under Rule 144A, normally to qualified institutional buyers. As of April 30, 2022, these securities had an aggregate value of $7,750,691 or 7.63% of net assets. |
| (f) | Restricted Security (See Note 1). |
| (g) | Variable rate investment. Interest rates reset periodically. Interest rate shown reflects the rate in effect at April 30, 2022. For securities based on a published reference rate and spread, the reference rate and spread are indicated in the description above. |
| (h) | Includes cash which is being held as collateral for securities sold short. |
For Fund compliance purposes, the Fund’s sector classifications refer to any one of the sector sub-classifications used by one or more widely recognized market indexes, and/or as defined by Fund management. This definition may not apply for purposes of this report, which may combine sector sub-classifications for reporting ease. Sectors are shown as a percent of net assets. These sector classifications are unaudited.
See Notes to the Financial Statements.
| Clough Global Dividend and Income Fund | Statement of Investments |
| | April 30, 2022 (Unaudited) |
CALL OPTIONS WRITTEN
| Underlying Security | | Counterparty | | Expiration
Date | | Strike
Price | | | Contracts | | | Notional
Amount | | | Value | |
| S&P 500® Index | | Morgan Stanley | | 05/20/2022 | | $ | 3,850 | | | (32) | | | $ | 13,222,176 | | | $ | (124,160 | ) |
| | | | | | | | | | | | | | $ | 13,222,176 | | | $ | (124,160 | ) |
See Notes to the Financial Statements.
| Semi-Annual Report | April 30, 2022 | 21 |
| Clough Global Equity Fund | Statement of Investments |
| | April 30, 2022 (Unaudited) |
| | | Shares | | | Value | |
| COMMON STOCKS 102.56% | | | | | | | | |
| Communication Services 1.62% | | | | | | | | |
| Alphabet, Inc. - Class C(a)(b)(c) | | | 1,330 | | | $ | 3,058,109 | |
| | | | | | | | | |
| Consumer Discretionary 15.68% | | | | | | | | |
| Amazon.com, Inc.(a)(b)(c) | | | 2,173 | | | | 5,401,274 | |
| Booking Holdings, Inc.(a)(b)(c) | | | 2,681 | | | | 5,925,841 | |
| Carnival Corp.(a)(b)(c) | | | 275,200 | | | | 4,760,960 | |
| DR Horton, Inc.(b)(c) | | | 48,000 | | | | 3,340,320 | |
| Lennar Corp. - Class A(b)(c) | | | 33,980 | | | | 2,599,130 | |
| Royal Caribbean Cruises Ltd.(a)(b)(c) | | | 71,120 | | | | 5,528,158 | |
| Tesla, Inc.(a)(b)(c) | | | 2,352 | | | | 2,048,027 | |
| | | | | | | | 29,603,710 | |
| | | | | | | | | |
| Energy 8.38% | | | | | | | | |
| Cheniere Energy, Inc.(b) | | | 29,300 | | | | 3,979,233 | |
| Exxon Mobil Corp.(b)(c) | | | 70,900 | | | | 6,044,225 | |
| Kinder Morgan, Inc.(b)(c) | | | 319,500 | | | | 5,798,925 | |
| | | | | | | | 15,822,383 | |
| | | | | | | | | |
| Financials 9.45% | | | | | | | | |
| Equitable Holdings, Inc.(b)(c) | | | 108,200 | | | | 3,119,406 | |
| First American Financial Corp.(b)(c) | | | 92,290 | | | | 5,381,430 | |
| Starwood Property Trust, Inc.(b)(c) | | | 408,600 | | | | 9,348,768 | |
| | | | | | | | 17,849,604 | |
| | | | | | | | | |
| Health Care 21.72% | | | | | | | | |
| Amphivena Therapeutics, Inc. - Series C(a)(d)(e)(f)(g)(h) | | | 334,425 | | | | 1,337,366 | |
| Apellis Pharmaceuticals, Inc.(a)(b)(c) | | | 32,177 | | | | 1,400,665 | |
| Arcellx, Inc.(a)(b) | | | 189,127 | | | | 2,067,158 | |
| Arcellx, Inc.(a)(d)(f)(h) | | | 90,937 | | | | 967,712 | |
| Boston Scientific Corp.(a)(b) | | | 55,700 | | | | 2,345,527 | |
| C4 Therapeutics, Inc.(a)(b) | | | 88,500 | | | | 758,445 | |
| Centrexion Therapeutics Corp.(a)(d)(e)(g)(h) | | | 4,336 | | | | 52,331 | |
| Centrexion Therapeutics Corp. - Series D Preferred Shares(a)(d)(e)(f)(g)(h) | | | 66,719 | | | | 805,232 | |
| Community Health Systems, Inc.(a)(b)(c) | | | 126,712 | | | | 971,881 | |
| CRISPR Therapeutics AG(a)(b)(c) | | | 52,050 | | | | 2,582,721 | |
| Doximity, Inc. - Class A(a)(b)(c) | | | 54,990 | | | | 2,192,451 | |
| Hologic, Inc.(a)(b)(c) | | | 31,540 | | | | 2,270,565 | |
| Intuitive Surgical, Inc.(a) | | | 6,240 | | | | 1,493,232 | |
| iRhythm Technologies, Inc.(a)(b) | | | 11,045 | | | | 1,362,622 | |
| Legend Biotech Corp. - ADR(a)(b)(c) | | | 30,400 | | | | 1,220,560 | |
| McKesson Corp.(b)(c) | | | 1,956 | | | | 605,597 | |
| Pfizer, Inc.(b)(c) | | | 99,500 | | | | 4,882,465 | |
| Stryker Corp.(b) | | | 7,760 | | | | 1,872,178 | |
| Surgery Partners, Inc.(a)(b)(c) | | | 73,000 | | | | 3,734,680 | |
| Tenet Healthcare Corp.(a)(b)(c) | | | 39,650 | | | | 2,875,021 | |
| UnitedHealth Group, Inc.(b)(c) | | | 5,660 | | | | 2,878,393 | |
| | | Shares | | | Value | |
| Health Care (continued) | | | | | | | | |
| Zimmer Biomet Holdings, Inc.(b) | | | 19,310 | | | $ | 2,331,682 | |
| | | | | | | | 41,008,484 | |
| | | | | | | | | |
| Industrials 17.68% | | | | | | | | |
| Airbus SE | | | 40,545 | | | | 4,514,268 | |
| The Boeing Co.(a)(b) | | | 37,340 | | | | 5,557,685 | |
| Hertz Global Holdings, Inc.(a)(b)(c) | | | 43,000 | | | | 862,580 | |
| Lockheed Martin Corp.(b) | | | 6,930 | | | | 2,994,592 | |
| Northrop Grumman Corp.(b)(c) | | | 11,820 | | | | 5,193,708 | |
| Raytheon Technologies Corp.(b)(c) | | | 101,070 | | | | 9,592,554 | |
| TransDigm Group, Inc.(a)(b)(c) | | | 7,832 | | | | 4,658,552 | |
| | | | | | | | 33,373,939 | |
| | | | | | | | | |
| Information Technology 28.03%(i) | | | | | | | | |
| Apple, Inc.(b)(c) | | | 69,310 | | | | 10,926,722 | |
| Block, Inc. - Class A(a)(b) | | | 39,960 | | | | 3,977,618 | |
| GoDaddy, Inc. - Class A(a)(b)(c) | | | 47,700 | | | | 3,854,637 | |
| Lumentum Holdings, Inc.(a) | | | 19,600 | | | | 1,591,716 | |
| Microsoft Corp.(b)(c) | | | 44,715 | | | | 12,409,307 | |
| NVIDIA Corp.(b) | | | 23,940 | | | | 4,440,152 | |
| Palo Alto Networks, Inc.(a)(b)(c) | | | 9,705 | | | | 5,447,222 | |
| ServiceNow, Inc.(a)(b)(c) | | | 7,410 | | | | 3,542,721 | |
| Visa, Inc. - Class A(b)(c) | | | 31,540 | | | | 6,722,120 | |
| | | | | | | | 52,912,215 | |
| | | | | | | | | |
| TOTAL COMMON STOCKS | | | | | | | | |
| (Cost $200,278,976) | | | | | | | 193,628,444 | |
| | | | | | | | | |
| EXCHANGE TRADED FUNDS 2.70% | | | | | |
| VanEck Vectors® Oil Services ETF(b)(c) | | | 19,320 | | | | 5,095,843 | |
| | | | | | | | | |
| TOTAL EXCHANGE TRADED FUNDS | | | | | |
| (Cost $5,013,906) | | | | | | | 5,095,843 | |
| | | | | | | | | |
| WARRANTS 1.27%(a) | | | | | | | | |
| Hertz Global Holdings, Inc., Strike Price $13.80, Expires 6/30/2051(b) | | | 171,590 | | | | 2,402,260 | |
| | | | | | | | | |
| TOTAL WARRANTS | | | | | | | | |
| (Cost $2,854,844) | | | | | | | 2,402,260 | |
| | | | | | | | | |
| Underlying Security/Expiration Date/Exercise Price/Notional Amount | | | Contracts | | | | Value | |
| PURCHASED OPTIONS 0.40% | | | | | | | | |
| Put Options Purchased 0.40% | | | | | | | | |
| S&P 500® Index | | | | | | | | |
See Notes to the Financial Statements.
| Clough Global Equity Fund | Statement of Investments |
| | April 30, 2022 (Unaudited) |
| Underlying Security/Expiration Date/ | | | |
| Exercise Price/Notional Amount | | Contracts | | | Value | |
| Put Options Purchased (continued) | | | | | | | | |
| 05/20/22, $4,150, $26,444,352 | | | 64 | | | $ | 766,400 | |
| | | | | | | | | |
| Total Put Options Purchased | | | | | | | | |
| (Cost $1,017,842) | | | | | | | 766,400 | |
| Description/Maturity Date/Rate | | Principal Amount | | | Value | |
| CONVERTIBLE CORPORATE BONDS 0.06% | |
| Health Care | | | | | | | | |
| Amphivena Convertible Note PP | | | | | | | | |
| 08/25/2022 (d)(e)(f)(g)(h) | | $ | 108,750 | | | | 108,750 | |
| | | | | | | | | |
| TOTAL CONVERTIBLE CORPORATE BONDS | |
| (Cost $108,750) | | | | | | | 108,750 | |
| | | | | | | | | |
| GOVERNMENT & AGENCY OBLIGATIONS 40.07% | |
| U.S. Treasury Notes | | | | | | | | |
| 09/30/2023, 0.250%(b) | | | 10,000,000 | | | | 9,692,969 | |
| 12/31/2023, 0.750%(b) | | | 29,000,000 | | | | 28,116,406 | |
| 01/31/2024, 0.875%(b) | | | 7,000,000 | | | | 6,788,359 | |
| 03/15/2025, 1.750%(b) | | | 20,000,000 | | | | 19,376,563 | |
| 01/31/2026, 2.625%(b) | | | 9,000,000 | | | | 8,899,102 | |
| 11/30/2026, 1.250%(b) | | | 3,000,000 | | | | 2,783,320 | |
| | | | | | | | | |
| TOTAL GOVERNMENT & AGENCY OBLIGATIONS | |
| (Cost $77,425,562) | | | | | | | 75,656,719 | |
| | | Shares | | | Value | |
| SHORT-TERM INVESTMENTS 17.04% | |
| Money Market Funds 17.04% | |
| BlackRock Liquidity Funds, T-Fund Portfolio - Institutional Class (0.296% 7-day yield) | | | 32,164,692 | | | | 32,164,692 | |
| | | | | | | | | |
| TOTAL SHORT-TERM INVESTMENTS | |
| (Cost $32,164,692) | | | | | | | 32,164,692 | |
| | | | | | | | | |
| Total Investments - 164.10% | | | | | | | | |
| (Cost $318,864,572) | | | | | | | 309,823,108 | |
| | | | | | | | | |
| Other Assets in Excess of Liabilities - (64.10%)(j) | | | | | | | (121,024,749 | ) |
| | | | | | | | | |
| NET ASSETS - 100.00% | | | | | | $ | 188,798,359 | |
| SCHEDULE OF SECURITIES SOLD SHORT | | Shares | | | Value | |
| COMMON STOCKS (17.84%) | |
| Communication Services (0.77%) | |
| Sea, Ltd. - ADR(a) | | | (17,680 | ) | | $ | (1,463,197 | ) |
| | | | | | | | | |
| Consumer Discretionary (4.16%) | |
| CarMax, Inc.(a) | | | (45,600 | ) | | | (3,911,568 | ) |
| QuantumScape Corp.(a) | | | (129,000 | ) | | | (1,927,260 | ) |
| Rivian Automotive, Inc. - Class A(a) | | | (66,500 | ) | | | (2,010,960 | ) |
| | | | | | | | (7,849,788 | ) |
| Financials (2.93%) | | | | | | | | |
| Deutsche Bank AG(a) | | | (298,600 | ) | | | (2,950,168 | ) |
| Rocket Cos., Inc.(a) | | | (239,700 | ) | | | (2,121,345 | ) |
| UWM Holdings Corp.(a) | | | (124,100 | ) | | | (460,411 | ) |
| | | | | | | | (5,531,924 | ) |
| Health Care (2.51%) | | | | | | | | |
| ABIOMED, Inc.(a) | | | (3,300 | ) | | | (945,714 | ) |
| Atara Biotherapeutics, Inc.(a) | | | (43,400 | ) | | | (276,024 | ) |
| Bluebird Bio, Inc.(a) | | | (87,700 | ) | | | (318,351 | ) |
| Deciphera Pharmaceuticals, Inc.(a) | | | (74,600 | ) | | | (754,952 | ) |
| Envista Holdings Corp.(a) | | | (61,500 | ) | | | (2,436,630 | ) |
| | | | | | | | (4,731,671 | ) |
| Industrials (1.23%) | | | | | | | | |
| Snap-on, Inc.(a) | | | (10,920 | ) | | | (2,320,391 | ) |
| | | | | | | | | |
| Information Technology (6.24%) | |
| International Business Machines Corp.(a) | | | (29,100 | ) | | | (3,847,311 | ) |
| MongoDB, Inc.(a) | | | (2,380 | ) | | | (844,733 | ) |
| Monolithic Power Systems, Inc.(a) | | | (3,110 | ) | | | (1,219,866 | ) |
| RingCentral, Inc. - Class A(a) | | | (17,450 | ) | | | (1,480,633 | ) |
| United Microelectronics Corp. -Sponsored ADR(a) | | | (453,200 | ) | | | (3,607,472 | ) |
| Zscaler, Inc.(a) | | | (3,900 | ) | | | (790,686 | ) |
| | | | | | | | (11,790,701 | ) |
| | | | | | | | | |
| TOTAL COMMON STOCKS | | | | | | | | |
| (Proceeds $40,990,518) | | | | | | | (33,687,672 | ) |
| | | | | | | | | |
| EXCHANGE TRADED FUNDS (7.45%) | | | | | | | | |
| Invesco QQQ ™ Trust Series 1(a) | | | (18,000 | ) | | | (5,638,500 | ) |
| iShares® U.S. Medical Devices ETF(a) | | | (54,100 | ) | | | (2,976,582 | ) |
| SPDR S&P 500® ETF Trust(a) | | | (13,200 | ) | | | (5,438,400 | ) |
See Notes to the Financial Statements.
| Semi-Annual Report | April 30, 2022 | 23 |
| Clough Global Equity Fund | Statement of Investments |
| | April 30, 2022 (Unaudited) |
| SCHEDULE OF SECURITIES SOLD SHORT (continued) | | Shares | | | Value | |
| EXCHANGE TRADED FUNDS (continued) | |
| | |
| TOTAL EXCHANGE TRADED FUNDS | | | | | |
| (Proceeds $14,610,687) | | | | | | $ | (14,053,482 | ) |
| | | | | | | | | |
| TOTAL SECURITIES SOLD SHORT | | | | | |
| (Proceeds $55,601,205) | | | | | | $ | (47,741,154 | ) |
| (a) | Non-income producing security. |
| (b) | Pledged security; a portion or all of the security is pledged as collateral for securities sold short, or borrowings. As of April 30, 2022, the aggregate value of those securities was $237,979,058, representing 126.05% of net assets.
(See Note 1) |
| (c) | Loaned security; a portion or all of the security is on loan as of April 30, 2022. |
| (d) | Restricted Security (See Note 1). |
| (e) | As a result of the use of significant unobservable inputs to determine fair value, these investments have been classified as Level 3 assets. (See Note 1) |
| (f) | All or a portion of the security is exempt from registration of the Securities Act of 1933. These securities may be resold in transactions exempt from registration under Rule 144A, normally to qualified institutional buyers. As of April 30, 2022, these securities had an aggregate value of $3,219,060 or 1.71% of net assets. |
| (g) | Private Placement; these securities may only be resold in transactions exempt from registration under the Securities Act of 1933. As of April 30, 2022, these securities had an aggregate value of $2,303,679 or 1.22% of net assets. |
| (h) | Fair valued security; valued by management in accordance with procedures approved by the Board. As of April 30, 2022, these securities had an aggregate value of $2,303,679 or 1.22% of total net assets. |
| (i) | When sector categorization is categorized by industry, no industry exceeds the 25% maximum specified in the Statement of Additional Information. |
| (j) | Includes cash which is being held as collateral for securities sold short. |
For Fund compliance purposes, the Fund’s sector classifications refer to any one of the sector sub-classifications used by one or more widely recognized market indexes, and/or as defined by Fund management. This definition may not apply for purposes of this report, which may combine sector sub-classifications for reporting ease. Sectors are shown as a percent of net assets. These sector classifications are unaudited.
See Notes to the Financial Statements.
| Clough Global Equity Fund | Statement of Investments |
| | April 30, 2022 (Unaudited) |
| CALL OPTIONS WRITTEN |
| |
| Underlying Security | | Counterparty | | Expiration
Date | | | Strike
Price | | | Contracts | | | Notional
Amount | | | Value | |
| S&P 500® Index | | Morgan Stanley | | 05/20/2022 | | | $ | 3,850 | | | (64) | | | $ | 26,444,352 | | | $ | (248,320 | ) |
| | | | | | | | | | | | | | | $ | 26,444,352 | | | $ | (248,320 | ) |
See Notes to the Financial Statements.
| Semi-Annual Report | April 30, 2022 | 25 |
| Clough Global Opportunities Fund | Statement of Investments |
| | April 30, 2022 (Unaudited) |
| | | Shares | | | Value | |
| COMMON STOCKS 103.09% | | | | | | | | |
| Communication Services 1.67% | | | | | | | | |
| Alphabet, Inc. - Class C(a)(b)(c) | | | 2,482 | | | $ | 5,706,937 | |
| | | | | | | | | |
| Consumer Discretionary 15.91% | | | | | | | | |
| Amazon.com, Inc.(a)(b)(c) | | | 4,072 | | | | 10,121,485 | |
| Booking Holdings, Inc.(a)(b) | | | 4,854 | | | | 10,728,845 | |
| Carnival Corp.(a)(b)(c) | | | 507,670 | | | | 8,782,691 | |
| DR Horton, Inc.(b)(c) | | | 87,500 | | | | 6,089,125 | |
| Lennar Corp. - Class A(b)(c) | | | 61,979 | | | | 4,740,774 | |
| Royal Caribbean Cruises Ltd.(a)(b)(c) | | | 131,647 | | | | 10,232,921 | |
| Tesla, Inc.(a)(b)(c) | | | 4,275 | | | | 3,722,499 | |
| | | | | | | | 54,418,340 | |
| | | | | | | | | |
| Energy 8.43% | | | | | | | | |
| Cheniere Energy, Inc.(b)(c) | | | 53,400 | | | | 7,252,254 | |
| Exxon Mobil Corp.(b) | | | 129,100 | | | | 11,005,775 | |
| Kinder Morgan, Inc.(b)(c) | | | 582,034 | | | | 10,563,917 | |
| | | | | | | | 28,821,946 | |
| | | | | | | | | |
| Financials 9.58% | | | | | | | | |
| Equitable Holdings, Inc.(b)(c) | | | 195,900 | | | | 5,647,797 | |
| First American Financial Corp.(b)(c) | | | 172,470 | | | | 10,056,726 | |
| Starwood Property Trust, Inc.(b)(c) | | | 745,000 | | | | 17,045,600 | |
| | | | | | | | 32,750,123 | |
| | | | | | | | | |
| Health Care 21.85% | | | | | | | | |
| Amphivena Therapeutics, Inc. - Series C(a)(d)(e)(f)(g)(h) | | | 780,326 | | | | 3,120,524 | |
| Apellis Pharmaceuticals, Inc.(a)(b)(c) | | | 59,466 | | | | 2,588,555 | |
| Arcellx, Inc.(a)(b) | | | 328,113 | | | | 3,586,275 | |
| Arcellx, Inc.(a)(d)(e)(h) | | | 209,080 | | | | 2,224,939 | |
| Boston Scientific Corp.(a)(b) | | | 101,400 | | | | 4,269,954 | |
| C4 Therapeutics, Inc.(a)(b) | | | 161,281 | | | | 1,382,178 | |
| Centrexion Therapeutics Corp.(a)(d)(f)(g)(h) | | | 14,166 | | | | 170,969 | |
| Centrexion Therapeutics Corp. - Series D Preferred Shares(a)(d)(e)(f)(g)(h) | | | 217,952 | | | | 2,630,463 | |
| Community Health Systems, Inc.(a)(b)(c) | | | 234,387 | | | | 1,797,748 | |
| CRISPR Therapeutics AG(a)(b)(c) | | | 93,798 | | | | 4,654,257 | |
| Doximity, Inc. - Class A(a)(b)(c) | | | 101,840 | | | | 4,060,361 | |
| Hologic, Inc.(a)(b)(c) | | | 58,390 | | | | 4,203,496 | |
| Intuitive Surgical, Inc.(a)(b) | | | 11,280 | | | | 2,699,304 | |
| Legend Biotech Corp. - ADR(a)(b)(c) | | | 56,391 | | | | 2,264,099 | |
| McKesson Corp.(b)(c) | | | 3,616 | | | | 1,119,550 | |
| Pfizer, Inc.(b)(c) | | | 181,200 | | | | 8,891,484 | |
| Stryker Corp.(b) | | | 14,050 | | | | 3,389,703 | |
| Surgery Partners, Inc.(a)(b)(c) | | | 135,081 | | | | 6,910,744 | |
| Tenet Healthcare Corp.(a)(b)(c) | | | 73,540 | | | | 5,332,385 | |
| UnitedHealth Group, Inc.(b)(c) | | | 10,240 | | | | 5,207,552 | |
| | | Shares | | | Value | |
| Health Care (continued) | | | | | | | | |
| Zimmer Biomet Holdings, Inc.(b) | | | 35,020 | | | $ | 4,228,665 | |
| | | | | | | | 74,733,205 | |
| | | | | | | | | |
| Industrials 17.20% | | | | | | | | |
| Airbus SE | | | 75,828 | | | | 8,442,665 | |
| The Boeing Co.(a)(b)(c) | | | 69,585 | | | | 10,357,032 | |
| Hertz Global Holdings, Inc.(a)(b) | | | 79,600 | | | | 1,596,776 | |
| Lockheed Martin Corp.(b) | | | 12,610 | | | | 5,449,033 | |
| Northrop Grumman Corp.(b)(c) | | | 21,420 | | | | 9,411,948 | |
| Raytheon Technologies Corp.(b)(c) | | | 184,220 | | | | 17,484,320 | |
| TransDigm Group, Inc.(a)(b)(c) | | | 10,258 | | | | 6,101,561 | |
| | | | | | | | 58,843,335 | |
| | | | | | | | | |
| Information Technology 28.45%(i) | | | | | | | | |
| Apple, Inc.(b) | | | 126,720 | | | | 19,977,408 | |
| Block, Inc. - Class A(a)(b) | | | 72,670 | | | | 7,233,572 | |
| GoDaddy, Inc. - Class A(a)(b)(c) | | | 88,400 | | | | 7,143,604 | |
| Lumentum Holdings, Inc.(a)(b) | | | 35,900 | | | | 2,915,439 | |
| Microsoft Corp.(b)(c) | | | 83,390 | | | | 23,142,393 | |
| NVIDIA Corp.(b)(c) | | | 44,350 | | | | 8,225,595 | |
| Palo Alto Networks, Inc.(a)(b)(c) | | | 17,690 | | | | 9,929,043 | |
| ServiceNow, Inc.(a)(b)(c) | | | 13,440 | | | | 6,425,664 | |
| Visa, Inc. - Class A(b)(c) | | | 57,780 | | | | 12,314,651 | |
| | | | | | | | 97,307,369 | |
| | | | | | | | | |
| TOTAL COMMON STOCKS | | | | | | | | |
| (Cost $366,799,211) | | | | | | | 352,581,255 | |
| | | | | | | | | |
| EXCHANGE TRADED FUNDS 2.71% | | | | | | | | |
| VanEck Vectors® Oil Services ETF(b)(c) | | | 35,190 | | | | 9,281,714 | |
| | | | | | | | | |
| TOTAL EXCHANGE TRADED FUNDS | | | | | | | | |
| (Cost $9,131,756) | | | | | | | 9,281,714 | |
| | | | | | | | | |
| WARRANTS 1.30%(a) | | | | | | | | |
| Hertz Global Holdings, Inc., Strike Price $13.80, Expires 6/30/2051(b)(c) | | | 318,034 | | | | 4,452,476 | |
| | | | | | | | | |
| TOTAL WARRANTS | | | | | | | | |
| (Cost $5,290,776) | | | | | | | 4,452,476 | |
| Underlying Security/Expiration Date/Exercise Price/Notional Amount | | | Contracts | | | | Value | |
| PURCHASED OPTIONS 0.42% | | | | | | | | |
| Put Options Purchased 0.42% | | | | | | | | |
| S&P 500® Index | | | | | | | | |
See Notes to the Financial Statements.
| Clough Global Opportunities Fund | Statement of Investments |
| | April 30, 2022 (Unaudited) |
| Underlying Security/Expiration Date/Exercise Price/Notional Amount | | Contracts | | | Value | |
| Put Options Purchased (continued) | | | | | | | | |
| 05/20/22, $4,150, $49,583,160 | | | 120 | | | $ | 1,437,000 | |
| | | | | | | | | |
| Total Put Options Purchased | | | | | | | | |
| (Cost $1,907,658) | | | | | | | 1,437,000 | |
| | | | | | | | | |
| | | | | | | |
| Description/Maturity Date/Rate | | Principal
Amount | | | Value | |
| CORPORATE BONDS 13.79% | | | | | | | | |
| Financials | | | | | | | | |
| Bank of Montreal | | | | | | | | |
| 01/10/2025, 1.500% | | $ | 3,000,000 | | | | 2,847,408 | |
| Goldman Sachs Group, Inc. | | | | | | | | |
| 04/01/2025, 3.500% | | | 3,000,000 | | | | 2,958,450 | |
| Golub Capital BDC, Inc. | | | | | | | | |
| 08/24/2026, 2.500%(b) | | | 4,130,000 | | | | 3,685,786 | |
| JPMorgan Chase & Co. | | | | | | | | |
| 04/26/2026, 1D US SOFR + 1.32%(j) | | | 3,000,000 | | | | 2,993,742 | |
| Main Street Capital Corp. | | | | | | | | |
| 07/14/2026, 3.000%(b) | | | 1,500,000 | | | | 1,366,464 | |
| Morgan Stanley | | | | | | | | |
| Series GMTN, 01/27/2026, 3.875% | | | 3,000,000 | | | | 2,976,176 | |
| Nationstar Mortgage Holdings, Inc. | | | | | | | | |
| 12/15/2030, 5.125%(b)(d)(e) | | | 1,510,000 | | | | 1,315,429 | |
| 11/15/2031, 5.750%(d)(e) | | | 2,500,000 | | | | 2,222,138 | |
| Owl Rock Technology Finance Corp. | | | | | | | | |
| 12/15/2025, 4.750%(b)(d)(e) | | | 4,000,000 | | | | 3,881,161 | |
| Signature Bank | | | | | | | | |
| 11/01/2029, 3M US L + 2.559%(b)(j) | | | 2,000,000 | | | | 1,984,538 | |
| Sixth Street Specialty Lending, Inc. | | | | | | | | |
| 08/01/2026, 2.500% | | | 1,000,000 | | | | 903,932 | |
| SVB Financial Group | | | | | | | | |
| 01/29/2025, 3.500% | | | 3,050,000 | | | | 3,032,520 | |
| | | | | | | | 30,167,744 | |
| | | | | | | | | |
| Industrials | | | | | | | | |
| Alaska Airlines 2020-1 Class B Pass Through Trust | | | | | | | | |
| 08/15/2025, 8.000%(b)(c)(d)(e) | | | 4,331,064 | | | | 4,520,283 | |
| American Airlines 2014-1 Class A Pass Through Trust | | | | | | | | |
| 10/01/2026, 3.700% | | | 3,601,753 | | | | 3,434,232 | |
| American Airlines 2019-1 Class A Pass Through Trust | | | | | | | | |
| Series A, 02/15/2032, 3.500% | | | 3,566,291 | | | | 3,114,283 | |
| Hexcel Corp. | | | | | | | | |
| 08/15/2025, 4.950%(b) | | | 1,000,000 | | | | 1,013,319 | |
| Description/Maturity Date/Rate | | Principal
Amount | | | Value | |
| CORPORATE BONDS (continued) | | | | | | | | |
| 02/15/2027, 4.200%(b) | | $ | 5,000,000 | | | $ | 4,909,075 | |
| | | | | | | | 16,991,192 | |
| | | | | | | | | |
| TOTAL CORPORATE BONDS | | | | | | | | |
| (Cost $49,749,154) | | | | | | | 47,158,936 | |
| | | | | | | | | |
| CONVERTIBLE CORPORATE BONDS 0.43% |
| Financials | | | | | | | | |
| Starwood Property Trust, Inc. 04/01/2023, 4.375%(b) | | | 1,200,000 | | | | 1,204,500 | |
| | | | | | | | | |
| Health Care | | | | | | | | |
| Amphivena Convertible Note PP 08/25/2022 (e)(f)(g)(h) | | | 253,750 | | | | 253,750 | |
| | | | | | | | | |
| | | | | | | | | |
| TOTAL CONVERTIBLE CORPORATE BONDS | |
| (Cost $1,459,052) | | | | | | | 1,458,250 | |
| | | | | | | | | |
| GOVERNMENT & AGENCY OBLIGATIONS 35.25% |
| U.S. Treasury Notes | | | | | | | | |
| 09/30/2023, 0.250%(b) | | | 15,000,000 | | | | 14,539,453 | |
| 12/31/2023, 0.750%(b) | | | 40,000,000 | | | | 38,781,250 | |
| 01/31/2024, 0.875%(b) | | | 13,000,000 | | | | 12,606,953 | |
| 03/15/2025, 1.750%(b) | | | 36,000,000 | | | | 34,877,813 | |
| 01/31/2026, 2.625%(b) | | | 20,000,000 | | | | 19,775,781 | |
| | | | | | | | | |
| TOTAL GOVERNMENT & AGENCY OBLIGATIONS | |
| (Cost $122,868,590) | | | | | | | 120,581,250 | |
| | | | | | | | | |
| | | Shares | | | Value | |
| SHORT-TERM INVESTMENTS 9.68% | | | | | |
| Money Market Funds 9.68% | | | | | | | | |
| BlackRock Liquidity Funds, T-Fund Portfolio - Institutional Class (0.296% 7-day yield) | | | 33,104,033 | | | | 33,104,033 | |
| | | | | | | | | |
| TOTAL SHORT-TERM INVESTMENTS | | | | | |
| (Cost $33,104,033) | | | | | | | 33,104,033 | |
| | | | | | | | | |
| Total Investments - 166.67% | | | | | | | | |
| (Cost $590,310,230) | | | | | | | 570,054,914 | |
| | | | | | | | | |
| Other Assets in Excess of Liabilities - (66.67%)(k) | | | | | | | (228,036,822 | ) |
| | | | | | | | | |
| NET ASSETS - 100.00% | | | | | | $ | 342,018,092 | |
See Notes to the Financial Statements.
| Semi-Annual Report | April 30, 2022 | 27 |
| Clough Global Opportunities Fund | Statement of Investments |
| | April 30, 2022 (Unaudited) |
| SCHEDULE OF SECURITIES SOLD SHORT | | Shares | | | Value | |
| COMMON STOCKS (17.30%) | | | | | | | | |
| Communication Services (0.78%) | | | | | | | | |
| Sea, Ltd. - ADR(a) | | | (32,030 | ) | | $ | (2,650,803 | ) |
| | | | | | | | | |
| Consumer Discretionary (4.17%) | | | | | | | | |
| CarMax, Inc.(a) | | | (82,500 | ) | | | (7,076,850 | ) |
| QuantumScape Corp.(a) | | | (233,600 | ) | | | (3,489,984 | ) |
| Rivian Automotive, Inc. - Class A(a) | | | (122,300 | ) | | | (3,698,352 | ) |
| | | | | | | | (14,265,186 | ) |
| | | | | | | | | |
| Financials (2.25%) | | | | | | | | |
| Deutsche Bank AG(a) | | | (540,400 | ) | | | (5,339,152 | ) |
| Rocket Cos., Inc.(a) | | | (172,500 | ) | | | (1,526,625 | ) |
| UWM Holdings Corp.(a) | | | (226,507 | ) | | | (840,341 | ) |
| | | | | | | | (7,706,118 | ) |
| | | | | | | | | |
| Health Care (2.54%) | | | | | | | | |
| ABIOMED, Inc.(a) | | | (6,100 | ) | | | (1,748,138 | ) |
| Atara Biotherapeutics, Inc.(a) | | | (80,700 | ) | | | (513,252 | ) |
| Bluebird Bio, Inc.(a) | | | (163,300 | ) | | | (592,779 | ) |
| Deciphera Pharmaceuticals, Inc.(a) | | | (138,900 | ) | | | (1,405,668 | ) |
| Envista Holdings Corp.(a) | | | (111,800 | ) | | | (4,429,516 | ) |
| | | | | | | | (8,689,353 | ) |
| | | | | | | | | |
| Industrials (1.26%) | | | | | | | | |
| Snap-on, Inc.(a) | | | (20,200 | ) | | | (4,292,298 | ) |
| | | | | | | | | |
| Information Technology (6.30%) | | | | | | | | |
| International Business Machines Corp.(a) | | | (52,880 | ) | | | (6,991,265 | ) |
| MongoDB, Inc.(a) | | | (4,420 | ) | | | (1,568,790 | ) |
| Monolithic Power Systems, Inc.(a) | | | (5,750 | ) | | | (2,255,380 | ) |
| RingCentral, Inc. - Class A(a) | | | (31,690 | ) | | | (2,688,896 | ) |
| United Microelectronics Corp. - | | | | | | | | |
| Sponsored ADR(a) | | | (825,481 | ) | | | (6,570,829 | ) |
| Zscaler, Inc.(a) | | | (7,250 | ) | | | (1,469,865 | ) |
| | | | | | | | (21,545,025 | ) |
| | | | | | | | | |
| TOTAL COMMON STOCKS | | | | | | | | |
| (Proceeds $71,927,218) | | | | | | | (59,148,783 | ) |
| | | | | | | | | |
| EXCHANGE TRADED FUNDS (7.46%) | | | | | |
| Invesco QQQ ™ Trust Series 1(a) | | | (32,500 | ) | | | (10,180,625 | ) |
| iShares® U.S. Medical Devices ETF(a) | | | (98,400 | ) | | | (5,413,968 | ) |
| SPDR S&P 500® ETF Trust(a) | | | (24,100 | ) | | | (9,929,200 | ) |
| SCHEDULE OF SECURITIES SOLD SHORT (continued) | | Shares | | | Value | |
| EXCHANGE TRADED FUNDS (continued) | | | | | |
| | | | | | | | | |
| TOTAL EXCHANGE TRADED FUNDS | | | | | |
| (Proceeds $26,533,721) | | | | | | $ | (25,523,793 | ) |
| | | | | | | | | |
| TOTAL SECURITIES SOLD SHORT | | | | | |
| (Proceeds $98,460,939) | | | | | | $ | (84,672,576 | ) |
Investment Abbreviations:
FEDEF - Federal Funds Effective Rate
SOFR - Secured Overnight Financing Rate
Libor Rates:
3M US L - 3 Month LIBOR as of April 30, 2022 was 1.36%
1D US SOFR -1 Day SOFR as of April 30, 2022 was 0.28%
| (a) | Non-income producing security. |
| (b) | Pledged security; a portion or all of the security is pledged as collateral for securities sold short, or borrowings. As of April 30, 2022, the aggregate value of those securities was $463,484,584, representing 135.51% of net assets. (See Note 1) |
| (c) | Loaned security; a portion or all of the security is on loan as of April 30, 2022. |
| (d) | Restricted Security (See Note 1). |
| (e) | Security is exempt from registration of the Securities Act of 1933. These securities may be resold in transactions exempt from registration under Rule 144A, normally to qualified institutional buyers. As of April 30, 2022, these securities had an aggregate value of $20,168,687 or 5.90% of net assets. |
| (f) | Private Placement; these securities may only be resold in transactions exempt from registration under the Securities Act of 1933. As of April 30, 2022, these securities had an aggregate value of $6,175,706 or 1.81% of net assets. |
| (g) | As a result of the use of significant unobservable inputs to determine fair value, these investments have been classified as Level 3 assets. (See Note 1) |
| (h) | Fair valued security; valued by management in accordance with procedures approved by the Board. As of April 30, 2022, these securities had an aggregate value of $6,175,706 or 1.81% of total net assets. |
| (i) | When sector categorization is categorized by industry, no industry exceeds the 25% maximum specified in the Statement of Additional Information. |
| (j) | Variable rate investment. Interest rates reset periodically. Interest rate shown reflects the rate in effect at April 30, 2022. For securities based on a published reference rate and spread, the reference rate and spread are indicated in the description above. |
| (k) | Includes cash which is being held as collateral for securities sold short. |
See Notes to the Financial Statements.
| Clough Global Opportunities Fund | Statement of Investments |
| | April 30, 2022 (Unaudited) |
For Fund compliance purposes, the Fund’s sector classifications refer to any one of the sector sub-classifications used by one or more widely recognized market indexes, and/or as defined by Fund management. This definition may not apply for purposes of this report, which may combine sector sub-classifications for reporting ease. Sectors are shown as a percent of net assets. These sector classifications are unaudited.
CALL OPTIONS WRITTEN
| Underlying Security | | Counterparty | | Expiration
Date | | Strike
Price | | | Contracts | | | Notional
Amount | | | Value | |
| S&P 500® Index | | Morgan Stanley | | 05/20/2022 | | $ | 3,850 | | | (120) | | | $ | 49,583,160 | | | $ | (465,600 | ) |
| | | | | | | | | | | | | | $ | 49,583,160 | | | $ | (465,600 | ) |
See Notes to the Financial Statements.
| Semi-Annual Report | April 30, 2022 | 29 |
| Clough Global Funds | Statements of Assets and Liabilities |
April 30, 2022 (Unaudited)
| | | Clough Global
Dividend and
Income Fund | | | Clough Global
Equity Fund | | | Clough Global
Opportunities Fund | |
| ASSETS: | | | | | | | | | |
| | | | | | | | | | |
| Investments, at value (Cost - see below)* | | $ | 158,067,673 | | | $ | 309,823,108 | | | $ | 570,054,914 | |
| Cash | | | 3,262,666 | | | | 6,087,416 | | | | 10,545,699 | |
| Deposit with broker for securities sold short | | | 24,233,092 | | | | 53,233,421 | | | | 94,888,018 | |
| Deposit with broker for written options | | | 556,546 | | | | 1,048,147 | | | | 2,077,248 | |
| Dividends receivable | | | 91,460 | | | | 127,400 | | | | 235,842 | |
| Interest receivable | | | 483,275 | | | | 153,074 | | | | 757,828 | |
| Receivable for investments sold | | | 2,339,675 | | | | 11,307,329 | | | | 17,200,063 | |
| Total Assets | | | 189,034,387 | | | | 381,779,895 | | | | 695,759,612 | |
| | | | | | | | | | | | | |
| LIABILITIES: | | | | | | | | | | | | |
| | | | | | | | | | | | | |
| Notes payable and other debt | | | 63,393,800 | | | | 139,706,715 | | | | 257,380,829 | |
| Securities sold short, at value (Proceeds $25,289,145, $55,601,205 and $98,460,938) | | | 21,915,506 | | | | 47,741,154 | | | | 84,672,576 | |
| Written options, at value (Premiums received $292,095, $584,190 and $1,095,358) | | | 124,160 | | | | 248,320 | | | | 465,600 | |
| Payable for investments purchased | | | 1,712,617 | | | | 4,693,705 | | | | 10,178,443 | |
| Accrued investment advisory fee | | | 112,848 | | | | 302,243 | | | | 609,102 | |
| Accrued administration fee | | | 46,655 | | | | 107,123 | | | | 193,576 | |
| Accrued trustees fee | | | 4,846 | | | | 4,846 | | | | 4,846 | |
| Other payables and accrued expenses | | | 121,152 | | | | 177,430 | | | | 236,548 | |
| Total Liabilities | | | 87,431,584 | | | | 192,981,536 | | | | 353,741,520 | |
| Net Assets | | $ | 101,602,803 | | | $ | 188,798,359 | | | $ | 342,018,092 | |
| Cost of Investments | | $ | 160,348,845 | | | $ | 318,864,572 | | | $ | 590,310,230 | |
| | | | | | | | | | | | | |
| COMPOSITION OF NET ASSETS: | | | | | | | | | | | | |
| | | | | | | | | | | | | |
| Paid-in capital | | $ | 112,437,861 | | | $ | 226,979,927 | | | $ | 425,348,642 | |
| Distributable earnings/(Accumulated loss) | | | (10,835,058 | ) | | | (38,181,568 | ) | | | (83,330,550 | ) |
| Net Assets | | $ | 101,602,803 | | | $ | 188,798,359 | | | $ | 342,018,092 | |
| Shares of common stock outstanding of no par value, unlimited shares authorized | | | 11,595,622 | | | | 18,454,503 | | | | 41,318,153 | |
| Net asset value per share | | $ | 8.76 | | | $ | 10.23 | | | $ | 8.28 | |
| | | | | | | | | | | | | |
| * Securities Loaned, at value | | $ | 55,719,214 | | | $ | 118,131,383 | | | $ | 226,732,335 | |
| See Notes to the Financial Statements. | |
| Clough Global Funds | Statements of Operations |
For the six months ended April 30, 2022 (Unaudited)
| | | Clough Global
Dividend and
Income Fund | | | Clough Global
Equity Fund | | | Clough Global
Opportunities Fund | |
| INVESTMENT INCOME: | | | | | | | | | | | | |
| | | | | | | | | | | | | |
| Dividends (net of foreign withholding taxes of $8,326, $19,366 and $35,603) | | $ | 1,192,763 | | | $ | 1,709,828 | | | $ | 2,834,177 | |
| Interest on investment securities | | | 527,564 | | | | 113,749 | | | | 714,781 | |
| Interest income - margin account | | | – | | | | (846 | ) | | | (1,845 | ) |
| Hypothecated securities income (See Note 6) | | | 15,420 | | | | 35,539 | | | | 139,650 | |
| Total Income | | | 1,735,747 | | | | 1,858,270 | | | | 3,686,763 | |
| | | | | | | | | | | | | |
| EXPENSES: | | | | | | | | | | | | |
| | | | | | | | | | | | | |
| Investment advisory fee | | | 681,358 | | | | 1,830,402 | | | | 3,736,941 | |
| Administration fee | | | 283,174 | | | | 656,303 | | | | 1,201,579 | |
| Interest on loan | | | 401,758 | | | | 859,805 | | | | 1,605,079 | |
| Trustees fee | | | 75,566 | | | | 75,566 | | | | 75,566 | |
| Dividend expense - short sales | | | 156,599 | | | | 329,586 | | | | 603,708 | |
| Other expenses | | | 13,053 | | | | 28,281 | | | | 52,467 | |
| Total Expenses | | | 1,611,508 | | | | 3,779,943 | | | | 7,275,340 | |
| Net Investment Income/(Loss) | | | 124,239 | | | | (1,921,673 | ) | | | (3,588,577 | ) |
| | | | | | | | | | | | | |
| NET REALIZED GAIN/(LOSS) ON: | | | | | | | | | | | | |
| Investment securities | | | (2,332,135 | ) | | | (24,042,190 | ) | | | (48,562,212 | ) |
| Futures contracts | | | 197,839 | | | | 436,894 | | | | 849,059 | |
| Securities sold short | | | (799,024 | ) | | | (294,060 | ) | | | (655,030 | ) |
| Written options | | | 492,496 | | | | 1,210,505 | | | | 1,974,235 | |
| Total return swap contracts | | | (3,810,044 | ) | | | (6,614,748 | ) | | | (12,219,724 | ) |
| Foreign currency transactions | | | (22,962 | ) | | | (49,652 | ) | | | (93,670 | ) |
| Net realized loss | | | (6,273,830 | ) | | | (29,353,251 | ) | | | (58,707,342 | ) |
| NET CHANGE IN UNREALIZED APPRECIATION/(DEPRECIATION) ON: | | | | | | | | | | | | |
| Investment securities | | | (17,104,143 | ) | | | (48,387,437 | ) | | | (89,026,241 | ) |
| Futures contracts | | | (298,941 | ) | | | (660,160 | ) | | | (1,282,953 | ) |
| Securities sold short | | | 3,745,422 | | | | 8,119,886 | | | | 14,409,873 | |
| Written options | | | 167,935 | | | | 335,870 | | | | 629,758 | |
| Total return swap contracts | | | (7,476 | ) | | | (2,878,383 | ) | | | (5,405,035 | ) |
| Translation of assets and liabilities denominated in foreign currencies | | | (589 | ) | | | (1,183 | ) | | | (2,537 | ) |
| Net change in unrealized depreciation | | | (13,497,792 | ) | | | (43,471,407 | ) | | | (80,677,135 | ) |
| Net Realized and Unrealized Loss | | | (19,771,622 | ) | | | (72,824,658 | ) | | | (139,384,477 | ) |
| Net Decrease in Net Assets Attributable to Common Shares from Operations | | $ | (19,647,383 | ) | | $ | (74,746,331 | ) | | $ | (142,973,054 | ) |
| | | | | | | | | | | | | |
| See Notes to the Financial Statements. | |
| Semi-Annual Report | April 30, 2022 | 31 |
| Clough Global Dividend and Income Fund | Statements of Changes in Net Assets |
| | | For the
Six Months Ended
April 30, 2022
(Unaudited) | | | For the
Year Ended
October 31, 2021 | |
| COMMON SHAREHOLDERS OPERATIONS: | | | | | | | | |
| | | | | | | | | |
| Net investment income | | $ | 124,239 | | | $ | 530,346 | |
| Net realized gain/(loss) | | | (6,273,830 | ) | | | 17,770,103 | |
| Net change in unrealized appreciation/(depreciation) | | | (13,497,792 | ) | | | 1,886,791 | |
| Net Increase/(Decrease) in Net Assets From Operations | | | (19,647,383 | ) | | | 20,187,240 | |
| | | | | | | | | |
| DISTRIBUTIONS TO COMMON SHAREHOLDERS: | | | | | | | | |
| From distributable earnings | | | (6,380,927 | ) | | | (3,855,628 | ) |
| Tax return of capital | | | – | | | | (7,067,306 | ) |
| Net Decrease in Net Assets from Distributions | | | (6,380,927 | ) | | | (10,922,934 | ) |
| | | | | | | | | |
| CAPITAL SHARE TRANSACTIONS | | | | | | | | |
| Proceeds from sales of shares, net of offering costs | | | 2,680,669 | | | | 29,000,424 | |
| Reinvestment of dividends | | | 479,732 | | | | 466,418 | |
| Offering costs | | | (14,693 | ) | | | (261,801 | ) |
| Net Increase in Net Assets From Share Transactions | | | 3,145,708 | | | | 29,205,041 | |
| | | | | | | | | |
| Net Increase/(Decrease) in Net Assets Attributable to Common Shares | | | (22,882,602 | ) | | | 38,469,347 | |
| | | | | | | | | |
| NET ASSETS ATTRIBUABLE TO COMMON SHARES: | | | | | | | | |
| | | | | | | | | |
| Beginning of period | | | 124,485,405 | | | | 86,016,058 | |
| End of period | | $ | 101,602,803 | | | $ | 124,485,405 | |
| See Notes to the Financial Statements. | |
| Clough Global Equity Fund | Statements of Changes in Net Assets |
| | | For the
Six Months Ended
April 30, 2022
(Unaudited) | | | For the
Year Ended
October 31, 2021 | |
| COMMON SHAREHOLDERS OPERATIONS: | | | | | | | | |
| | | | | | | | | |
| Net investment loss | | $ | (1,921,673 | ) | | $ | (2,825,988 | ) |
| Net realized gain/(loss) | | | (29,353,251 | ) | | | 45,071,358 | |
| Net change in unrealized appreciation/(depreciation) | | | (43,471,407 | ) | | | 18,293,247 | |
| Net Increase/(Decrease) in Net Assets From Operations | | | (74,746,331 | ) | | | 60,538,617 | |
| | | | | | | | | |
| DISTRIBUTIONS TO COMMON SHAREHOLDERS: | | | | | | | | |
| From distributable earnings | | | (13,206,317 | ) | | | (23,035,803 | ) |
| Net Decrease in Net Assets from Distributions | | | (13,206,317 | ) | | | (23,035,803 | ) |
| | | | | | | | | |
| CAPITAL SHARE TRANSACTIONS | | | | | | | | |
| Proceeds from sales of shares, net of offering costs | | | 8,363,837 | | | | 60,403,350 | |
| Reinvestment of dividends | | | 745,355 | | | | 524,584 | |
| Offering costs | | | (32,842 | ) | | | (298,016 | ) |
| Net Increase in Net Assets From Share Transactions | | | 9,076,350 | | | | 60,629,918 | |
| | | | | | | | | |
| Net Increase/(Decrease) in Net Assets Attributable to Common Shares | | | (78,876,298 | ) | | | 98,132,732 | |
| | | | | | | | | |
| NET ASSETS ATTRIBUABLE TO COMMON SHARES: | | | | | | | | |
| | | | | | | | | |
| Beginning of period | | | 267,674,657 | | | | 169,541,925 | |
| End of period | | $ | 188,798,359 | | | $ | 267,674,657 | |
| See Notes to the Financial Statements. | |
| Semi-Annual Report | April 30, 2022 | 33 |
| Clough Global Opportunities Fund | Statements of Changes in Net Assets |
| | | For the
Six Months Ended
April 30, 2022
(Unaudited) | | | For the
Year Ended
October 31, 2021 | |
| COMMON SHAREHOLDERS OPERATIONS: | | | | | | | | |
| | | | | | | | | |
| Net investment loss | | $ | (3,588,577 | ) | | $ | (5,646,834 | ) |
| Net realized gain/(loss) | | | (58,707,342 | ) | | | 87,176,412 | |
| Net change in unrealized appreciation/(depreciation) | | | (80,677,135 | ) | | | 29,652,961 | |
| Net Increase/(Decrease) in Net Assets From Operations | | | (142,973,054 | ) | | | 111,182,539 | |
| | | | | | | | | |
| DISTRIBUTIONS TO COMMON SHAREHOLDERS: | | | | | | | | |
| From distributable earnings | | | (24,271,544 | ) | | | (44,110,259 | ) |
| Net Decrease in Net Assets from Distributions | | | (24,271,544 | ) | | | (44,110,259 | ) |
| | | | | | | | | |
| CAPITAL SHARE TRANSACTIONS | | | | | | | | |
| Proceeds from sales of shares, net of offering costs | | | 12,163,252 | | | | 90,421,624 | |
| Reinvestment of dividends | | | 1,394,268 | | | | 967,110 | |
| Offering costs | | | (28,869 | ) | | | (488,236 | ) |
| Net Increase in Net Assets From Share Transactions | | | 13,528,651 | | | | 90,900,498 | |
| | | | | | | | | |
| Net Increase/(Decrease) in Net Assets Attributable to Common Shares | | | (153,715,947 | ) | | | 157,972,778 | |
| | | | | | | | | |
| NET ASSETS ATTRIBUABLE TO COMMON SHARES: | | | | | | | | |
| | | | | | | | | |
| Beginning of period | | | 495,734,039 | | | | 337,761,261 | |
| End of period | | $ | 342,018,092 | | | $ | 495,734,039 | |
| See Notes to the Financial Statements. | |
| Clough Global Funds | Statements of Cash Flows |
For the six months ended April 30, 2022 (Unaudited)
| | | Clough Global
Dividend and
Income Fund | | | Clough Global
Equity Fund | | | Clough Global
Opportunities Fund | |
| CASH FLOWS FROM OPERATING ACTIVITIES: | | | | | | | | | | | | |
| Net decrease in net assets from operations | | $ | (19,647,383 | ) | | $ | (74,746,331 | ) | | $ | (142,973,054 | ) |
| Adjustments to reconcile net decrease in net assets from operations to net cash provided by operating activities: | | | | | | | | | | | | |
| Purchase of investment securities | | | (179,350,496 | ) | | | (450,810,749 | ) | | | (895,815,800 | ) |
| Proceeds from disposition of investment securities | | | 188,049,089 | | | | 476,311,938 | | | | 930,951,901 | |
| Proceeds from securities sold short transactions | | | 42,137,473 | | | | 97,793,774 | | | | 168,699,750 | |
| Cover securities sold short transactions | | | (28,996,878 | ) | | | (74,382,330 | ) | | | (130,814,475 | ) |
| Premiums received from written options transactions | | | 2,591,304 | | | | 5,309,749 | | | | 9,844,794 | |
| Premiums paid on closing written options transactions | | | (800,674 | ) | | | (1,629,779 | ) | | | (3,020,587 | ) |
| Purchased options transactions | | | (5,349,271 | ) | | | (10,993,326 | ) | | | (20,379,380 | ) |
| Proceeds from purchased options transactions | | | 2,437,065 | | | | 4,973,862 | | | | 9,217,843 | |
| Net purchases of short-term investment securities | | | (166,980 | ) | | | (14,213,539 | ) | | | (6,972,607 | ) |
| Net realized (gain)/loss on: | | | | | | | | | | | | |
| Investment securities | | | 2,332,135 | | | | 24,042,190 | | | | 48,562,212 | |
| Securities sold short | | | 799,024 | | | | 294,060 | | | | 655,030 | |
| Written options | | | (492,496 | ) | | | (1,210,505 | ) | | | (1,974,235 | ) |
| Net change in unrealized (appreciation)/depreciation on: | | | | | | | | | | | | |
| Investment securities | | | 17,104,143 | | | | 48,387,437 | | | | 89,026,241 | |
| Securities sold short | | | (3,745,422 | ) | | | (8,119,886 | ) | | | (14,409,873 | ) |
| Written options | | | (167,935 | ) | | | (335,870 | ) | | | (629,758 | ) |
| Total return swap contracts | | | 7,476 | | | | 2,878,383 | | | | 5,405,035 | |
| Net amortization/(accretion) of premiums/discounts | | | 170,251 | | | | 2,139 | | | | 194,087 | |
| (Increase)/Decrease in assets: | | | | | | | | | | | | |
| Dividends receivable | | | (87,383 | ) | | | (119,668 | ) | | | (218,183 | ) |
| Interest receivable | | | 90,187 | | | | (96,443 | ) | | | (327,763 | ) |
| Variation margin receivable | | | 720 | | | | 1,590 | | | | 3,090 | |
| Deferred/Prepaid offering costs | | | 61,037 | | | | 74,881 | | | | 160,312 | |
| Increase/(Decrease) in liabilities: | | | | | | | | | | | | |
| Interest due on loan payable | | | 50,012 | | | | 113,087 | | | | 206,033 | |
| Payable for total return swap contracts payments | | | (13,168 | ) | | | (106,377 | ) | | | (200,361 | ) |
| Dividends payable - short sales | | | (21,307 | ) | | | (46,059 | ) | | | (87,165 | ) |
| Accrued investment advisory fee | | | (9,932 | ) | | | (33,760 | ) | | | (85,885 | ) |
| Accrued administration fee | | | (53,798 | ) | | | (131,314 | ) | | | (248,258 | ) |
| Accrued trustees fee | | | 1,796 | | | | 1,796 | | | | 1,796 | |
| Other payables and accrued expenses | | | (67,722 | ) | | | (53,994 | ) | | | (124,506 | ) |
| Net cash provided by operating activities | | | 16,860,867 | | | | 23,154,956 | | | | 44,646,234 | |
| | | | | | | | | | | | | |
| CASH FLOWS FROM FINANCING ACTIVITIES: | | | | | | | | | | | | |
| Loan payable | | | 1,800,000 | | | | 8,000,000 | | | | 11,500,000 | |
| Proceeds from sales of shares, net of offering costs | | | 2,900,004 | | | | 8,774,572 | | | | 13,188,374 | |
| Reinvestment of dividends | | | 479,732 | | | | 745,355 | | | | 1,394,268 | |
| Cash distributions paid | | | (6,380,927 | ) | | | (13,206,317 | ) | | | (24,271,544 | ) |
| Payable due to custodian | | | (559,196 | ) | | | (2,006,870 | ) | | | (3,750,493 | ) |
| Net cash (used in) provided by financing activities | | | (1,760,387 | ) | | | 2,306,740 | | | | (1,939,395 | ) |
| | | | | | | | | | | | | |
| Net Change in Cash, Restricted Cash and Foreign Rates on Cash | | | 15,100,480 | | | | 25,461,696 | | | | 42,706,839 | |
| | | | | | | | | | | | | |
| Cash and restricted cash, beginning of year | | $ | 13,235,159 | | | $ | 35,577,970 | | | $ | 66,097,511 | |
| Cash and restricted cash, end of year | | $ | 28,335,639 | | | $ | 61,039,666 | | | $ | 108,804,350 | |
| See Notes to the Financial Statements. | |
| Semi-Annual Report | April 30, 2022 | 35 |
| Clough Global Funds | Statements of Cash Flows |
For the six months ended April 30, 2022 (Unaudited)
| | | Clough Global
Dividend and
Income Fund | | | Clough Global
Equity Fund | | | Clough Global
Opportunities Fund | |
| SUPPLEMENTAL DISCLOSURE OF CASH FLOW INFORMATION: | | | | | | | | | | | | |
| Non-cash financing activities not included herein consist of reinvestment of distributions of: | | $ | 479,732 | | | $ | 745,355 | | | $ | 1,394,268 | |
| Cash paid during the year for interest from loan payable: | | $ | 351,746 | | | $ | 746,718 | | | $ | 1,399,046 | |
| | | | | | | | | | | | | |
| RECONCILIATION OF RESTRICTED AND UNRESTRICTED CASH AT THE BEGINNING OF YEAR TO THE STATEMENT OF ASSETS AND LIABILITIES | | | | | | | | | | | | |
| Cash | | $ | 97,886 | �� | | $ | 773,159 | | | $ | 373,636 | |
| Deposit with broker | | | | | | | | | | | | |
| Futures | | | 658,818 | | | | 1,269,820 | | | | 2,507,576 | |
| Securities sold short | | | 10,183,606 | | | | 18,025,923 | | | | 33,994,780 | |
| Total return swaps | | | 2,294,849 | | | | 15,509,068 | | | | 29,221,519 | |
| | | | | | | | | | | | | |
| RECONCILIATION OF RESTRICTED AND UNRESTRICTED CASH AT THE END OF YEAR TO THE STATEMENT OF ASSETS AND LIABILITIES | | | | | | | | | | | | |
| Cash | | $ | 3,262,666 | | | $ | 6,087,416 | | | $ | 10,545,699 | |
| Deposit with broker | | | | | | | | | | | | |
| Securities sold short | | | 24,233,092 | | | | 53,233,421 | | | | 94,888,018 | |
| Written options | | | 556,546 | | | | 1,048,147 | | | | 2,077,248 | |
| See Notes to the Financial Statements. | |
Page Intentionally Left Blank
| Clough Global Dividend and Income Fund | Financial Highlights |
For a share outstanding throughout the years indicated
| | | For the
Six Months Ended
April 30, 2022
(Unaudited) | | | For the
Year Ended
October 31, 2021 | | | For the
Year Ended
October 31, 2020 | | | For the
Year Ended
October 31, 2019 | |
| PER COMMON SHARE OPERATING PERFORMANCE: | | | | | | | | | | | | | | | | |
| Net asset value - beginning of period | | $ | 11.02 | | | $ | 10.23 | | | $ | 12.21 | | | $ | 12.54 | |
| Income from investment operations: | | | | | | | | | | | | | | | | |
| Net investment income/(loss)* | | | 0.01 | | | | 0.06 | | | | 0.12 | | | | 0.16 | |
| Net realized and unrealized gain/(loss) on investments | | | (1.71 | ) | | | 2.28 | | | | (0.89 | ) | | | 1.08 | |
| Total Income/(Loss) from Investment Operations | | | (1.70 | ) | | | 2.34 | | | | (0.77 | ) | | | 1.24 | |
| | | | | | | | | | | | | | | | | |
| DISTRIBUTIONS TO COMMON SHAREHOLDERS FROM: | | | | | | | | | | | | | | | | |
| Net investment income | | | (0.56 | ) | | | – | | | | (0.20 | ) | | | (0.06 | ) |
| Net realized gains | | | – | | | | (0.41 | ) | | | – | | | | (0.53 | ) |
| Tax return of capital | | | – | | | | (0.76 | ) | | | (1.01 | ) | | | (0.64 | ) |
| Total Distributions to Common Shareholders | | | (0.56 | ) | | | (1.17 | ) | | | (1.21 | ) | | | (1.23 | ) |
| | | | | | | | | | | | | | | | | |
| CAPITAL SHARE TRANSACTIONS: | | | | | | | | | | | | | | | | |
| Accretive/(Dilutive) impact of capital share transactions | | | – | | | | (0.38 | ) | | | – | | | | (0.34 | ) |
| Total Capital Share Transactions | | | – | | | | (0.38 | ) | | | – | | | | (0.34 | ) |
| Net asset value - end of period | | $ | 8.76 | | | $ | 11.02 | | | $ | 10.23 | | | $ | 12.21 | |
| Market price - end of period | | $ | 8.45 | | | $ | 11.43 | | | $ | 8.73 | | | $ | 10.96 | |
| | | | | | | | | | | | | | | | | |
| Total Investment Return - Net Asset Value:(4) | | | (15.87 | )% | | | 23.34 | % | | | (4.91 | )% | | | 11.75 | % |
| Total Investment Return - Market Price:(5) | | | (21.76 | )% | | | 49.90 | % | | | (9.59 | )% | | | 11.51 | % |
| | | | | | | | | | | | | | | | | |
| RATIOS AND SUPPLEMENTAL DATA: | | | | | | | | | | | | | | | | |
| Net assets attributable to common shares, end of period (000s) | | $ | 101,603 | | | $ | 124,485 | | | $ | 86,016 | | | $ | 102,670 | |
| Ratios to average net assets attributable to common shareholders: | | | | | | | | | | | | | | | | |
| Total expenses | | | 2.82 | %(6) | | 2.38 | % | | | 2.98 | % | | | 3.66 | % |
| Total expenses excluding interest expense and dividends on short sales expense | | | 1.84 | %(6) | | 1.78 | % | | | 1.89 | % | | | 1.85 | % |
| Net investment income/(loss) | | | 0.22 | %(6) | | 0.49 | % | | | 1.10 | % | | | 1.30 | % |
| Portfolio turnover rate(7) | | | 104 | % | | | 147 | % | | | 229 | % | | | 253 | % |
| | | | | | | | | | | | | | | | | |
| Borrowings at End of Period | | | | | | | | | | | | | | | | |
| Aggregate Amount Outstanding (000s) | | $ | 63,300 | | | $ | 61,500 | | | $ | 50,500 | | | $ | 49,500 | |
| Asset Coverage Per $1,000 | | $ | 2,605 | | | $ | 3,024 | | | $ | 2,703 | | | $ | 3,074 | |
| See Notes to the Financial Statements. | |
| Clough Global Dividend and Income Fund | Financial Highlights |
For a share outstanding throughout the years indicated
For the
Year Ended
October 31, 2018 | | | For the
Year Ended
October 31, 2017 | | | For the
Year Ended
October 31, 2016(1) | | | For the
Year Ended
October 31, 2015 | | | For the
Period Ended
October 31, 2014(2) | | | For the
Year Ended
March 31, 2014 | |
| | | | | | | | | | | | | | | | | |
| $ | 14.76 | | | $ | 13.79 | | | $ | 15.65 | | | $ | 16.96 | | | $ | 17.51 | | | $ | 17.38 | |
| | | | | | | | | | | | | | | | | | | | | | | |
| | 0.22 | | | | 0.12 | | | | (0.01 | ) | | | (0.27 | ) | | | (0.12 | ) | | | (0.26 | ) |
| | | | | | | | | | | | | | | | | | | | | | | |
| | (1.15 | ) | | | 2.14 | | | | (0.46 | ) | | | 0.38 | | | | 0.31 | | | | 1.90 | |
| | (0.93 | ) | | | 2.26 | | | | (0.47 | ) | | | 0.11 | | | | 0.19 | | | | 1.64 | |
| | | | | | | | | | | | | | | | | | | | | | | |
| | – | | | | (0.37 | ) | | | – | | | | (0.07 | ) | | | (0.14 | ) | | | (0.24 | ) |
| | (0.17 | ) | | | – | | | | (0.59 | ) | | | (1.34 | ) | | | (0.60 | ) | | | (1.27 | ) |
| | (1.23 | ) | | | (0.92 | ) | | | (0.80 | ) | | | – | | | | – | | | | – | |
| | (1.40 | ) | | | (1.29 | ) | | | (1.39 | ) | | | (1.41 | ) | | | (0.74 | ) | | | (1.51 | ) |
| | | | | | | | | | | | | | | | | | | | | | | |
| | | | | | | | | | | | | | | | | | | | | | | |
| | 0.11 | | | | (0.00 | )(3) | | – | | | | (0.01 | ) | | | – | | | | – | |
| | 0.11 | | | | (0.00 | )(3) | | – | | | | (0.01 | ) | | | – | | | | – | |
| $ | 12.54 | | | $ | 14.76 | | | $ | 13.79 | | | $ | 15.65 | | | $ | 16.96 | | | $ | 17.51 | |
| $ | 11.28 | | | $ | 14.16 | | | $ | 11.62 | | | $ | 13.60 | | | $ | 14.60 | | | $ | 15.18 | |
| | (5.18 | )% | | | 17.89 | % | | | (1.14 | )% | | | 1.61 | % | | | 1.68 | % | | | 11.14 | % |
| | (11.10 | )% | | | 34.22 | % | | | (4.14 | )% | | | 2.57 | % | | | 0.97 | % | | | 11.12 | % |
| | | | | | | | | | | | | | | | | | | | | | | |
| | | | | | | | | | | | | | | | | | | | | | | |
| $ | 87,880 | | | $ | 153,233 | | | $ | 143,319 | | | $ | 162,651 | | | $ | 176,968 | | | $ | 182,737 | |
| | | | | | | | | | | | | | | | | | | | | | | |
| | | | | | | | | | | | | | | | | | | | | | | |
| | 3.48 | % | | | 2.94 | % | | | 3.65 | % | | | 3.95 | % | | | 3.25 | %(6) | | 3.34 | % |
| | | | | | | | | | | | | | | | | | | | | | | |
| | 1.84 | % | | | 1.99 | % | | | 2.09 | % | | | 2.17 | % | | | 2.00 | %(6) | | 1.94 | % |
| | 1.55 | % | | | 0.87 | % | | | (0.08 | )% | | | (1.58 | )% | | | (1.15 | )%(6) | | (1.47 | )% |
| | 109 | % | | | 149 | % | | | 205 | % | | | 172 | % | | | 110 | % | | | 179 | % |
| | | | | | | | | | | | | | | | | | | | | | | |
| $ | 55,000 | | | $ | 72,000 | | | $ | 72,000 | | | $ | 93,300 | | | $ | 93,300 | | | $ | 93,300 | |
| $ | 2,598 | | | $ | 3,128 | | | $ | 2,991 | | | $ | 2,743 | | | $ | 2,897 | | | $ | 2,959 | |
| See Notes to the Financial Statements. | |
| Semi-Annual Report | April 30, 2022 | 39 |
| Clough Global Dividend and Income Fund | Financial Highlights |
For a share outstanding throughout the years indicated
| * | Based on average shares outstanding. |
| (1) | Effective July 31, 2016, the Clough Global Allocation Fund name changed to Clough Global Dividend and Income Fund. |
| (2) | The Board announced, on September 12, 2014, approval to change the fiscal year-end of the Fund from March 31 to October 31. |
| (4) | Total investment return - Net Asset Value is calculated based on the funds calculated net asset value, assuming a purchase of a common share at the opening on the first day and a sale at the closing on the last day of each period reported and that all rights in the Fund's rights offering were exercised. Dividends and distributions, if any, are assumed for purposes of this calculation to be reinvested at price obtained under the Fund's dividend reinvestment plan. Total investment returns do not reflect brokerage commissions on the purchase or sale of the Fund's common shares. Past performance is not a guarantee of future results. Total returns for the period indicated are not annualized. Total returns include adjustments in accordance with accounting principles generally accepted in the United States of America for financial reporting purposes and may differ from those reported to the market. |
| (5) | Total investment return - Market Price is calculated based on where the fund is trading in the market, assuming a purchase of a common share at the opening on the first day and a sale at the closing on the last day of each period reported. Total investment returns do not reflect brokerage commissions on the purchase or sale of the Fund's common shares. Past performance is not a guarantee of future results. Total returns for the period indicated are not annualized. |
| (7) | Portfolio turnover rate for periods less than one full year have not been annualized. |
| See Notes to the Financial Statements. | |
Page Intentionally Left Blank
| Clough Global Equity Fund | Financial Highlights |
For a share outstanding throughout the years indicated
| | | For the
Six Months Ended
April 30, 2022
(Unaudited) | | | For the
Year Ended
October 31, 2021 | | | For the
Year Ended
October 31, 2020 | | | For the
Year Ended
October 31, 2019 | |
PER COMMON SHARE OPERATING
PERFORMANCE: | | | | | | | | | |
| Net asset value - beginning of period | | $ | 15.11 | | | $ | 12.81 | | | $ | 12.95 | | | $ | 13.55 | |
| Income from investment operations: | | | | | | | | | | | | | | | | |
| Net investment income/(loss)* | | | (0.11 | ) | | | (0.19 | ) | | | (0.09 | ) | | | (0.06 | ) |
| Net realized and unrealized gain/(loss) on investments | | | (4.04 | ) | | | 4.72 | | | | 1.27 | | | | 1.15 | |
| Total Income/(Loss) from Investment Operations | | | (4.15 | ) | | | 4.53 | | | | 1.18 | | | | 1.09 | |
| | | | | | | | | | | | | | | | | |
| DISTRIBUTIONS TO COMMON SHAREHOLDERS FROM: | | | | | | | | | | | | | | | | |
| Net investment income | | | (0.73 | ) | | | (0.12 | ) | | | (0.60 | ) | | | – | |
| Net realized gains | | | – | | | | (1.44 | ) | | | (0.72 | ) | | | (1.34 | ) |
| Tax return of capital | | | – | | | | – | | | | – | | | | – | |
| Total Distributions to Common Shareholders | | | (0.73 | ) | | | (1.56 | ) | | | (1.32 | ) | | | (1.34 | ) |
| | | | | | | | | | | | | | | | | |
| CAPITAL SHARE TRANSACTIONS: | | | | | | | | | | | | | | | | |
| Accretive/(Dilutive) impact of capital share transactions | | | – | | | | (0.67 | ) | | | – | | | | (0.35 | ) |
| Total Capital Share Transactions | | | – | | | | (0.67 | ) | | | – | | | | (0.35 | ) |
| Net asset value - end of period | | $ | 10.23 | | | $ | 15.11 | | | $ | 12.81 | | | $ | 12.95 | |
| Market price - end of period | | $ | 10.29 | | | $ | 15.27 | | | $ | 10.78 | | | $ | 11.77 | |
| | | | | | | | | | | | | | | | | |
| Total Investment Return - Net Asset Value:(3) | | | (28.08 | )% | | | 36.34 | % | | | 11.47 | % | | | 9.40 | % |
| Total Investment Return - Market Price:(5) | | | (28.41 | )% | | | 63.73 | % | | | 3.21 | % | | | 1.99 | % |
| | | | | | | | | | | | | | | | | |
| RATIOS AND SUPPLEMENTAL DATA: | | | | | | | | | | | | | | | | |
| Net assets attributable to common shares, end of period (000s) | | $ | 188,798 | | | $ | 267,675 | | | $ | 169,542 | | | $ | 171,337 | |
| Ratios to average net assets attributable to common shareholders: | | | | | | | | | | | | | | | | |
| Total expenses | | | 3.34 | %(6) | | 2.64 | % | | | 3.23 | % | | | 3.94 | % |
| Total expenses excluding interest expense and dividends on short sales expense | | | 2.29 | %(6) | | 2.07 | % | | | 2.20 | % | | | 2.18 | % |
| Net investment income/(loss) | | | (1.70 | )%(6) | | (1.21 | )% | | | (0.70 | )% | | | (0.45 | )% |
| Portfolio turnover rate(7) | | | 131 | % | | | 194 | % | | | 256 | % | | | 297 | % |
| | | | | | | | | | | | | | | | | |
| Borrowings at End of Period | | | | | | | | | | | | | | | | |
| Aggregate Amount Outstanding (000s) | | $ | 139,500 | | | $ | 131,500 | | | $ | 92,000 | | | $ | 84,500 | |
| Asset Coverage Per $1,000 | | $ | 2,353 | | | $ | 3,036 | | | $ | 2,843 | | | $ | 3,028 | |
| See Notes to the Financial Statements. | |
| Clough Global Equity Fund | Financial Highlights |
For a share outstanding throughout the years indicated
For the
Year Ended
October 31, 2018 | | | For the
Year Ended
October 31, 2017 | | | For the
Year Ended
October 31, 2016 | | | For the
Year Ended
October 31, 2015 | | | For the
Period Ended
October 31, 2014(1) | | | For the
Year Ended
March 31, 2014 | |
| | | | | | | | | | | | | | | | | |
| $ | 14.50 | | | $ | 12.70 | | | $ | 15.10 | | | $ | 16.47 | | | $ | 17.15 | | | $ | 16.63 | |
| | | | | | | | | | | | | | | | | | | | | | | |
| | 0.01 | | | | (0.02 | ) | | | (0.23 | ) | | | (0.45 | ) | | | (0.17 | ) | | | (0.33 | ) |
| | | | | | | | | | | | | | | | | | | | | | | |
| | 0.41 | | | | 3.06 | | | | (0.84 | ) | | | 0.46 | | | | 0.23 | | | | 2.33 | |
| | 0.42 | | | | 3.04 | | | | (1.07 | ) | | | (0.01 | ) | | | 0.06 | | | | 2.00 | |
| | | | | | | | | | | | | | | | | | | | | | | |
| | – | | | | (0.13 | ) | | | – | | | | (0.04 | ) | | | (0.08 | ) | | | (0.38 | ) |
| | (1.50 | ) | | | – | | | | (0.90 | ) | | | (1.32 | ) | | | (0.66 | ) | | | (1.10 | ) |
| | – | | | | (1.11 | ) | | | (0.43 | ) | | | – | | | | – | | | | – | |
| | (1.50 | ) | | | (1.24 | ) | | | (1.33 | ) | | | (1.36 | ) | | | (0.74 | ) | | | (1.48 | ) |
| | | | | | | | | | | | | | | | | | | | | | | |
| | | | | | | | | | | | | | | | | | | | | | | |
| | 0.13 | | | | (0.00 | )(2) | | | – | | | | (0.02 | ) | | | – | | | | – | |
| | 0.13 | | | | (0.00 | )(2) | | | – | | | | (0.02 | ) | | | – | | | | – | |
| $ | 13.55 | | | $ | 14.50 | | | $ | 12.70 | | | $ | 15.10 | | | $ | 16.47 | | | $ | 17.15 | |
| $ | 13.21 | | | $ | 13.66 | | | $ | 10.69 | | | $ | 12.92 | | | $ | 14.34 | | | $ | 15.42 | |
| | 3.99 | % | | | 25.99 | % | | | (5.36 | )%(4) | | 0.76 | % | | | 0.86 | % | | | 13.57 | % |
| | 7.62 | % | | | 41.01 | % | | | (6.90 | )% | | | (0.98 | )% | | | (2.33 | )% | | | 15.52 | % |
| | | | | | | | | | | | | | | | | | | | | | | |
| | | | | | | | | | | | | | | | | | | | | | | |
| $ | 149,379 | | | $ | 255,870 | | | $ | 224,187 | | | $ | 266,576 | | | $ | 293,829 | | | $ | 305,958 | |
| | | | | | | | | | | | | | | | | | | | | | | |
| | | | | | | | | | | | | | | | | | | | | | | |
| | 3.63 | % | | | 3.14 | % | | | 4.21 | % | | | 4.56 | % | | | 3.68 | %(6) | | 3.76 | % |
| | | | | | | | | | | | | | | | | | | | | | | |
| | 2.13 | % | | | 2.21 | % | | | 2.59 | % | | | 2.77 | % | | | 2.42 | %(6) | | 2.36 | % |
| | 0.06 | % | | | (0.14 | )% | | | (1.70 | )% | | | (27.30 | )% | | | (1.68 | )%(6) | | (1.95 | )% |
| | 115 | % | | | 141 | % | | | 182 | % | | | 154 | % | | | 102 | % | | | 166 | % |
| | | | | | | | | | | | | | | | | | | | | | | |
| $ | 85,000 | | | $ | 113,000 | | | $ | 113,000 | | | $ | 156,000 | | | $ | 156,000 | | | $ | 156,000 | |
| $ | 2,757 | | | $ | 3,264 | | | $ | 2,984 | | | $ | 2,709 | | | $ | 2,884 | | | $ | 2,961 | |
| See Notes to the Financial Statements. | |
| Semi-Annual Report | April 30, 2022 | 43 |
| Clough Global Equity Fund | Financial Highlights |
For a share outstanding throughout the years indicated
| * | Based on average shares outstanding. |
| (1) | The Board announced, on September 12, 2014, approval to change the fiscal year-end of the Fund from March 31 to October 31. |
| (3) | Total investment return - Net Asset Value is calculated based on the funds calculated net asset value, assuming a purchase of a common share at the opening on the first day and a sale at the closing on the last day of each period reported and that all rights in the Fund's rights offering were exercised. Dividends and distributions, if any, are assumed for purposes of this calculation to be reinvested at price obtained under the Fund's dividend reinvestment plan. Total investment returns do not reflect brokerage commissions on the purchase or sale of the Fund's common shares. Past performance is not a guarantee of future results. Total returns for the period indicated are not annualized. Total returns include adjustments in accordance with accounting principles generally accepted in the United States of America for financial reporting purposes and may differ from those reported to the market. |
| (4) | In 2016, 0.07% of the Fund's total return consists of a reimbursement by the Adviser for a realized investment loss. Excluding this item, total return would have been (5.43)%. |
| (5) | Total investment return - Market Price is calculated based on where the fund is trading in the market, assuming a purchase of a common share at the opening on the first day and a sale at the closing on the last day of each period reported. Total investment returns do not reflect brokerage commissions on the purchase or sale of the Fund's common shares. Past performance is not a guarantee of future results. Total returns for the period indicated are not annualized. |
| (7) | Portfolio turnover rate for periods less than one full year have not been annualized. |
| See Notes to the Financial Statements. | |
Page Intentionally Left Blank
| Clough Global Opportunities Fund | Financial Highlights |
For a share outstanding throughout the years indicated
| | | For the
Six Months Ended
April 30, 2022
(Unaudited) | | | For the
Year Ended
October 31, 2021 | | | For the
Year Ended
October 31, 2020 | | | For the
Year Ended
October 31, 2019 | |
| PER COMMON SHARE OPERATING PERFORMANCE: | | | | | | | | | | | | | | | | |
| Net asset value - beginning of period | | $ | 12.37 | | | $ | 10.48 | | | $ | 10.56 | | | $ | 10.63 | |
| Income from investment operations: | | | | | | | | | | | | | | | | |
| Net investment loss* | | | (0.09 | ) | | | (0.16 | ) | | | (0.08 | ) | | | (0.04 | ) |
| Net realized and unrealized gain/(loss) on investments | | | (3.41 | ) | | | 3.60 | | | | 1.07 | | | | 1.03 | |
| Total Income/(Loss) from Investment Operations | | | (3.50 | ) | | | 3.44 | | | | 0.99 | | | | 0.99 | |
| | | | | | | | | | | | | | | | | |
| DISTRIBUTIONS TO COMMON SHAREHOLDERS FROM: | | | | | | | | | | | | | | | | |
| Net investment income | | | (0.59 | ) | | | – | | | | (0.71 | ) | | | – | |
| Net realized gains | | | – | | | | (1.27 | ) | | | (0.14 | ) | | | (0.71 | ) |
| Tax return of capital | | | – | | | | – | | | | (0.22 | ) | | | (0.35 | ) |
| Total Distributions to Common Shareholders | | | (0.59 | ) | | | (1.27 | ) | | | (1.07 | ) | | | (1.06 | ) |
| | | | | | | | | | | | | | | | | |
| CAPITAL SHARE TRANSACTIONS: | | | | | | | | | | | | | | | | |
| Accretive/(Dilutive) impact of capital share transactions | | | – | | | | (0.28 | ) | | | – | | | | – | |
| Total Capital Share Transactions | | | – | | | | (0.28 | ) | | | – | | | | – | |
| Net asset value - end of period | | $ | 8.28 | | | $ | 12.37 | | | $ | 10.48 | | | $ | 10.56 | |
| Market price - end of period | | $ | 8.33 | | | $ | 12.87 | | | $ | 8.84 | | | $ | 9.19 | |
| | | | | | | | | | | | | | | | | |
| Total Investment Return - Net Asset Value:(3) | | | (28.90 | )% | | | 34.71 | % | | | 11.91 | % | | | 11.08 | % |
| Total Investment Return - Market Price:(4) | | | (31.25 | )% | | | 66.16 | % | | | 8.46 | % | | | 7.49 | % |
| | | | | | | | | | | | | | | | | |
| RATIOS AND SUPPLEMENTAL DATA: | | | | | | | | | | | | | | | | |
| Net assets attributable to common shares, end of period (000s) | | $ | 342,018 | | | $ | 495,734 | | | $ | 337,761 | | | $ | 340,278 | |
| Ratios to average net assets attributable to common shareholders: | | | | | | | | | | | | | | | | |
| Total expenses | | | 3.49 | %(5) | | 2.78 | % | | | 3.42 | % | | | 4.14 | % |
| Total expenses excluding interest expense and dividends on short sales expense | | | 2.43 | %(5) | | 2.20 | % | | | 2.35 | % | | | 2.33 | % |
| Net investment loss | | | (1.72 | )%(5) | | (1.26 | )% | | | (0.73 | )% | | | (0.39 | )% |
| Portfolio turnover rate(6) | | | 140 | % | | | 209 | % | | | 261 | % | | | 306 | % |
| | | | | | | | | | | | | | | | | |
| Borrowings at End of Period | | | | | | | | | | | | | | | | |
| Aggregate Amount Outstanding (000s) | | $ | 257,000 | | | $ | 245,500 | | | $ | 182,500 | | | $ | 178,000 | |
| Asset Coverage Per $1,000 | | $ | 2,331 | | | $ | 3,019 | | | $ | 2,851 | | | $ | 2,912 | |
| See Notes to the Financial Statements. | |
| Clough Global Opportunities Fund | Financial Highlights |
For a share outstanding throughout the years indicated
For the
Year Ended
October 31, 2018 | | | For the
Year Ended
October 31, 2017 | | | For the
Year Ended
October 31, 2016 | | | For the
Year Ended
October 31, 2015 | | | For the
Period Ended
October 31, 2014(1) | | | For the
Year Ended
March 31, 2014 | |
| | | | | | | | | | | | | | | | | |
| $ | 12.09 | | | $ | 11.07 | | | $ | 12.92 | | | $ | 14.11 | | | $ | 14.67 | | | $ | 14.64 | |
| | | | | | | | | | | | | | | | | | | | | | | |
| | (0.01 | ) | | | (0.02 | ) | | | (0.15 | ) | | | (0.35 | ) | | | (0.15 | ) | | | (0.32 | ) |
| | | | | | | | | | | | | | | | | | | | | | | |
| | (0.35 | ) | | | 2.11 | | | | (0.54 | ) | | | 0.36 | | | | 0.26 | | | | 1.72 | |
| | (0.36 | ) | | | 2.09 | | | | (0.69 | ) | | | 0.01 | | | | 0.11 | | | | 1.40 | |
| | | | | | | | | | | | | | | | | | | | | | | |
| | – | | | | (0.14 | ) | | | – | | | | – | | | | – | | | | (0.11 | ) |
| | (0.76 | ) | | | – | | | | (0.18 | ) | | | (1.19 | ) | | | (0.67 | ) | | | (1.26 | ) |
| | (0.45 | ) | | | (0.93 | ) | | | (0.98 | ) | | | – | | | | – | | | | – | |
| | (1.21 | ) | | | (1.07 | ) | | | (1.16 | ) | | | (1.19 | ) | | | (0.67 | ) | | | (1.37 | ) |
| | | | | | | | | | | | | | | | | | | | | | | |
| | | | | | | | | | | | | | | | | | | | | | | |
| | 0.11 | | | | (0.00 | )(2) | | – | | | | (0.01 | ) | | | – | | | | – | |
| | 0.11 | | | | (0.00 | )(2) | | – | | | | (0.01 | ) | | | – | | | | – | |
| $ | 10.63 | | | $ | 12.09 | | | $ | 11.07 | | | $ | 12.92 | | | $ | 14.11 | | | $ | 14.67 | |
| $ | 9.56 | | | $ | 11.42 | | | $ | 9.04 | | | $ | 11.25 | | | $ | 12.18 | | | $ | 12.75 | |
| | (1.78 | )% | | | 20.99 | % | | | (3.48 | )% | | | 1.13 | % | | | 1.39 | % | | | 11.26 | % |
| | (6.48 | )% | | | 39.95 | % | | | (9.49 | )% | | | 1.93 | % | | | 0.70 | % | | | 9.99 | % |
| | | | | | | | | | | | | | | | | | | | | | | |
| | | | | | | | | | | | | | | | | | | | | | | |
| $ | 342,584 | | | $ | 623,361 | | | $ | 570,931 | | | $ | 666,588 | | | $ | 729,855 | | | $ | 759,084 | |
| | | | | | | | | | | | | | | | | | | | | | | |
| | | | | | | | | | | | | | | | | | | | | | | |
| | 3.81 | % | | | 3.23 | % | | | 4.32 | % | | | 4.62 | % | | | 3.86 | %(5) | | 3.97 | % |
| | | | | | | | | | | | | | | | | | | | | | | |
| | 2.26 | % | | | 2.27 | % | | | 2.73 | % | | | 2.82 | % | | | 2.60 | %(5) | | 2.55 | % |
| | (0.05 | )% | | | (0.16 | )% | | | (1.33 | )% | | | (2.47 | )% | | | (1.76 | )%(5) | | (2.15 | )% |
| | 120 | % | | | 165 | % | | | 191 | % | | | 176 | % | | | 111 | % | | | 178 | % |
| | | | | | | | | | | | | | | | | | | | | | | |
| $ | 207,000 | | | $ | 292,000 | | | $ | 292,000 | | | $ | 388,900 | | | $ | 388,900 | | | $ | 388,900 | |
| $ | 2,655 | | | $ | 3,135 | | | $ | 2,955 | | | $ | 2,714 | | | $ | 2,877 | | | $ | 2,952 | |
| See Notes to the Financial Statements. | |
| Semi-Annual Report | April 30, 2022 | 47 |
| Clough Global Opportunities Fund | Financial Highlights |
For a share outstanding throughout the years indicated
| * | Based on average shares outstanding. |
| (1) | The Board announced, on September 12, 2014, approval to change the fiscal year-end of the Fund from March 31 to October 31. |
| (3) | Total investment return - Net Asset Value is calculated based on the funds calculated net asset value, assuming a purchase of a common share at the opening on the first day and a sale at the closing on the last day of each period reported and that all rights in the Fund's rights offering were exercised. Dividends and distributions, if any, are assumed for purposes of this calculation to be reinvested at price obtained under the Fund's dividend reinvestment plan. Total investment returns do not reflect brokerage commissions on the purchase or sale of the Fund's common shares. Past performance is not a guarantee of future results. Total returns for the period indicated are not annualized. Total returns include adjustments in accordance with accounting principles generally accepted in the United States of America for financial reporting purposes and may differ from those reported to the market. |
| (4) | Total investment return - Market Price is calculated based on where the fund is trading in the market, assuming a purchase of a common share at the opening on the first day and a sale at the closing on the last day of each period reported. Total investment returns do not reflect brokerage commissions on the purchase or sale of the Fund's common shares. Past performance is not a guarantee of future results. Total returns for the period indicated are not annualized. |
| (6) | Portfolio turnover rate for periods less than one full year have not been annualized. |
| See Notes to the Financial Statements. | |
| Clough Global Funds | Notes to Financial Statements |
April 30, 2022 (Unaudited)
1. ORGANIZATION AND SIGNIFICANT ACCOUNTING AND OPERATING POLICIES
Clough Global Dividend and Income Fund, Clough Global Equity Fund, and Clough Global Opportunities Fund (each a “Fund”, collectively the “Funds”), are closed-end management investment companies registered under the Investment Company Act of 1940 (the “1940 Act”). The Funds were organized under the laws of the state of Delaware on April 27, 2004, January 25, 2005, and January 12, 2006, respectively for Clough Global Dividend and Income Fund, Clough Global Equity Fund, and Clough Global Opportunities Fund. The Funds were previously registered as non-diversified investment companies. As a result of ongoing operations, each of the Funds became a diversified company. The Funds may not resume operating in a non-diversified manner without first obtaining shareholder approval. Each Fund’s investment objective is to provide a high level of total return. Each Declaration of Trust provides that the Board of Trustees (the “Board”) may authorize separate classes of shares of beneficial interest. The common shares of Clough Global Dividend and Income Fund, Clough Global Equity Fund, and Clough Global Opportunities Fund are listed on the NYSE American LLC and trade under the ticker symbols “GLV”, “GLQ” and “GLO” respectively.
The following is a summary of significant accounting policies followed by the Funds. These policies are in conformity with U.S. generally accepted accounting principles (“GAAP”). The preparation of financial statements in accordance with GAAP requires management to make estimates and assumptions that affect the reported amounts and disclosures, including the disclosure of contingent assets and liabilities, in the financial statements during the reporting period. Management believes the estimates and security valuations are appropriate; however, actual results may differ from those estimates, and the security valuations reflected in the financial statements may differ from the value the Funds ultimately realize upon sale of the securities. Each Fund is considered an investment company for financial reporting purposes under GAAP and follows the accounting and reporting guidance applicable to investment companies as codified in Accounting Standards Codification (“ASC”) Topic 946, Financial Services – Investment Companies.
The net asset value (“NAV”) per share of each Fund is determined no less frequently than daily, on each day that the New York Stock Exchange (“NYSE” or the “Exchange”) is open for trading, as of the close of regular trading on the Exchange (normally 4:00 p.m. New York time). Trading may take place in foreign issues held by a Fund at times when the Fund is not open for business. As a result, each Fund’s NAV may change at times when it is not possible to purchase or sell shares of that Fund.
Investment Valuation: Securities, held by each Fund, for which exchange quotations are readily available, are valued at the last sale price, or if no sale price or if traded on the over-the-counter market, at the mean of the bid and asked prices on such day. Money market funds are valued based on the closing NAV. Most securities listed on a foreign exchange are valued at the last sale price at the close of the exchange on which the security is primarily traded. In certain countries market maker prices are used since they are the most representative of the daily trading activity. Market maker prices are usually the mean between the bid and ask prices. Certain markets are not closed at the time that the Funds price their portfolio securities. In these situations, snapshot prices are provided by the individual pricing services or other alternate sources at the close of the NYSE as appropriate. Securities not traded on a particular day are valued at the mean between the last reported bid and the asked quotes, or the last sale price when appropriate; otherwise fair value will be determined by the Board-appointed fair valuation committee. Debt securities for which the over-the-counter market is the primary market are normally valued on the basis of prices furnished by one or more pricing services or dealers at the mean between the latest available bid and asked prices. As authorized by the Board, debt securities (including short-term obligations that will mature in 60 days or less) may be valued on the basis of valuations furnished by a pricing service which determines valuations based upon market transactions for normal, institutional-size trading units of securities or a matrix method which considers yield or price of comparable bonds provided by a pricing service. Over-the-counter options are valued at the mean between bid and asked prices provided by dealers. Exchange-traded options are valued at closing settlement prices. Total return swaps are priced based on valuations provided by a Board approved independent third party pricing agent. If a total return swap price cannot be obtained from an independent third party pricing agent the Fund shall seek to obtain a bid price from at least one independent and/or executing broker. Futures are valued at settlement prices.
If the price of a security is unavailable in accordance with the aforementioned pricing procedures, or the price of a security is unreliable, e.g., due to the occurrence of a significant event, the security may be valued at its fair value determined by management pursuant to procedures adopted by the Board. For this purpose, fair value is the price that a Fund reasonably expects to receive on a current sale of the security. Due to the number of variables affecting the price of a security, however; it is possible that the fair value of a security may not accurately reflect the price that a Fund could actually receive on a sale of the security.
A three-tier hierarchy has been established to classify fair value measurements for disclosure purposes. Inputs refer broadly to the assumptions that market participants would use in pricing the asset or liability, including assumptions about risk. Inputs may be observable or unobservable. Observable inputs are inputs that reflect the assumptions market participants would use in pricing the asset or liability that are developed based on market data obtained from sources independent of the reporting entity. Unobservable inputs are inputs that reflect the reporting entity’s own assumptions about the assumptions market participants would use in pricing the asset or liability that are developed based on the best information available.
| Semi-Annual Report | April 30, 2022 | 49 |
| Clough Global Funds | Notes to Financial Statements |
April 30, 2022 (Unaudited)
Various inputs are used in determining the value of each Fund’s investments as of the reporting period end. These inputs are categorized in the following hierarchy under applicable financial accounting standards:
| Level 1 – | Unadjusted quoted prices in active markets for identical, unrestricted assets or liabilities that a Fund has the ability to access at the measurement date; |
| Level 2 – | Quoted prices which are not active, quoted prices for similar assets or liabilities in active markets or inputs other than quoted prices that are observable (either directly or indirectly) for substantially the full term of the asset or liability; and |
| Level 3 – | Significant unobservable prices or inputs (including the Fund’s own assumptions in determining the fair value of investments) where there is little or no market activity for the asset or liability at the measurement date. |
The following is a summary of the inputs used as of April 30, 2022, in valuing each Fund’s investments carried at value.
Clough Global Dividend and Income Fund
| Investments in Securities at Value* | | Level 1 | | | Level 2 | | | Level 3 | | | Total | |
| Common Stocks | | $ | 73,272,038 | | | $ | – | | | $ | – | | | $ | 73,272,038 | |
| Exchange Traded Funds | | | 2,508,358 | | | | – | | | | – | | | | 2,508,358 | |
| Preferred Stocks | | | 487,600 | | | | 586,600 | | | | – | | | | 1,074,200 | |
| Purchased Options | | | 383,200 | | | | – | | | | – | | | | 383,200 | |
| Corporate Bonds | | | – | | | | 24,955,224 | | | | – | | | | 24,955,224 | |
| Convertible Corporate Bonds | | | – | | | | 2,862,789 | | | | – | | | | 2,862,789 | |
| Asset-Backed Securities | | | – | | | | 40,252 | | | | – | | | | 40,252 | |
| Government & Agency Obligations | | | – | | | | 48,295,277 | | | | – | | | | 48,295,277 | |
| Short-Term Investments | | | 4,676,335 | | | | – | | | | – | | | | 4,676,335 | |
| TOTAL | | $ | 81,327,531 | | | $ | 76,740,142 | | | $ | – | | | $ | 158,067,673 | |
| Other Financial Instruments | | Level 1 | | | Level 2 | | | Level 3 | | | Total | |
| Assets | | | | | | | | | | | | |
| Liabilities | | | | | | | | | | | | |
| Written Options | | | (124,160 | ) | | | – | | | | – | | | | (124,160 | ) |
| Securities Sold Short | | | | | | | | | | | | | | | | |
| Common Stocks | | | (15,038,253 | ) | | | – | | | | – | | | | (15,038,253 | ) |
| Exchange Traded Funds | | | (6,877,253 | ) | | | – | | | | – | | | | (6,877,253 | ) |
| TOTAL | | $ | (22,039,666 | ) | | $ | – | | | $ | – | | | $ | (22,039,666 | ) |
| Clough Global Funds | Notes to Financial Statements |
April 30, 2022 (Unaudited)
Clough Global Equity Fund
| Investments in Securities at Value* | | Level 1 | | | Level 2 | | | Level 3 | | | Total | |
| Common Stocks | | | | | | | | | | | | | | | | |
| Communication Services | | $ | 3,058,109 | | | $ | – | | | $ | – | | | $ | 3,058,109 | |
| Consumer Discretionary | | | 29,603,710 | | | | – | | | | – | | | | 29,603,710 | |
| Energy | | | 15,822,383 | | | | – | | | | – | | | | 15,822,383 | |
| Financials | | | 17,849,604 | | | | – | | | | – | | | | 17,849,604 | |
| Health Care | | | 37,845,843 | | | | 967,712 | | | | 2,194,929 | | | | 41,008,484 | |
| Industrials | | | 33,373,939 | | | | – | | | | – | | | | 33,373,939 | |
| Information Technology | | | 52,912,215 | | | | – | | | | – | | | | 52,912,215 | |
| Exchange Traded Funds | | | 5,095,843 | | | | – | | | | – | | | | 5,095,843 | |
| Warrants | | | 2,402,260 | | | | – | | | | – | | | | 2,402,260 | |
| Purchased Options | | | 766,400 | | | | – | | | | – | | | | 766,400 | |
| Convertible Corporate Bonds | | | – | | | | – | | | | 108,750 | | | | 108,750 | |
| Government & Agency Obligations | | | – | | | | 75,656,719 | | | | – | | | | 75,656,719 | |
| Short-Term Investments | | | 32,164,692 | | | | – | | | | – | | | | 32,164,692 | |
| TOTAL | | $ | 230,894,998 | | | $ | 76,624,431 | | | $ | 2,303,679 | | | $ | 309,823,108 | |
| Other Financial Instruments | | Level 1 | | | Level 2 | | | Level 3 | | | Total | |
| Assets | | | | | | | | | | | | |
| Liabilities | | | | | | | | | | | | |
| Written Options | | | (248,320 | ) | | | – | | | | – | | | | (248,320 | ) |
| Securities Sold Short | | | | | | | | | | | | | | | | |
| Common Stocks | | | (33,687,672 | ) | | | – | | | | – | | | | (33,687,672 | ) |
| Exchange Traded Funds | | | (14,053,482 | ) | | | – | | | | – | | | | (14,053,482 | ) |
| TOTAL | | $ | (47,989,474 | ) | | $ | – | | | $ | – | | | $ | (47,989,474 | ) |
| Semi-Annual Report | April 30, 2022 | 51 |
| Clough Global Funds | Notes to Financial Statements |
April 30, 2022 (Unaudited)
| Clough Global Opportunities Fund | | | | | | | | | | |
| | | | | | | | | | | |
| Investments in Securities at Value* | | Level 1 | | | Level 2 | | | Level 3 | | | Total | |
| Common Stocks | | | | | | | | | | | | | | | | |
| Communication Services | | $ | 5,706,937 | | | $ | – | | | $ | – | | | $ | 5,706,937 | |
| Consumer Discretionary | | | 54,418,340 | | | | – | | | | – | | | | 54,418,340 | |
| Energy | | | 28,821,946 | | | | – | | | | – | | | | 28,821,946 | |
| Financials | | | 32,750,123 | | | | – | | | | – | | | | 32,750,123 | |
| Health Care | | | 66,586,310 | | | | 2,224,939 | | | | 5,921,956 | | | | 74,733,205 | |
| Industrials | | | 58,843,335 | | | | – | | | | – | | | | 58,843,335 | |
| Information Technology | | | 97,307,369 | | | | – | | | | – | | | | 97,307,369 | |
| Exchange Traded Funds | | | 9,281,714 | | | | – | | | | – | | | | 9,281,714 | |
| Warrants | | | 4,452,476 | | | | – | | | | – | | | | 4,452,476 | |
| Purchased Options | | | 1,437,000 | | | | – | | | | – | | | | 1,437,000 | |
| Corporate Bonds | | | – | | | | 47,158,936 | | | | – | | | | 47,158,936 | |
| Convertible Corporate Bonds | | | – | | | | 1,204,500 | | | | 253,750 | | | | 1,458,250 | |
| Government & Agency Obligations | | | – | | | | 120,581,250 | | | | – | | | | 120,581,250 | |
| Short-Term Investments | | | 33,104,033 | | | | – | | | | – | | | | 33,104,033 | |
| TOTAL | | $ | 392,709,583 | | | $ | 171,169,625 | | | $ | 6,175,706 | | | $ | 570,054,914 | |
| Other Financial Instruments | | Level 1 | | | Level 2 | | | Level 3 | | | Total | |
| Assets | | | | | | | | | | | | |
| Liabilities | | | | | | | | | | | | |
| Written Options | | | (465,600 | ) | | | – | | | | – | | | | (465,600 | ) |
| Securities Sold Short | | | | | | | | | | | | | | | | |
| Common Stocks | | | (59,148,783 | ) | | | – | | | | – | | | | (59,148,783 | ) |
| Exchange Traded Funds | | | (25,523,793 | ) | | | – | | | | – | | | | (25,523,793 | ) |
| TOTAL | | $ | (85,138,176 | ) | | $ | – | | | $ | – | | | $ | (85,138,176 | ) |
| * | For detailed sector descriptions, see the accompanying Statements of Investments. |
| ** | Futures contracts and swap contracts are reported at their unrealized appreciation/(depreciation) at measurement date, which represents the change in the contract's value from trade date. |
In the event a Board approved independent pricing service is unable to provide an evaluated price for a security or Clough Capital Partners L.P. (the “Adviser” or “Clough”) believes the price provided is not reliable, securities of each Fund may be valued at fair value as described above. In these instances the Adviser may seek to find an alternative independent source, such as a broker/dealer to provide a price quote, or by using evaluated pricing models similar to the techniques and models used by the independent pricing service. These fair value measurement techniques may utilize unobservable inputs (Level 3).
On a monthly basis, the Fair Value Committee of each Fund meets and discusses securities that have been fair valued during the preceding month in accordance with the Funds’ Fair Value Procedures and reports quarterly to the Board on the results of those meetings.
| Clough Global Funds | Notes to Financial Statements |
April 30, 2022 (Unaudited)
The following is a reconciliation of the investments in which significant unobservable inputs (Level 3) were used in determining fair value:
Clough Global Equity Fund
| Asset Type | | Balance
as of
October
30, 2021 | | | Accrued
Discount/
premium | | | Return of
Capital | | | Realized
Gain/(Loss) | | | Change in
Unrealized
Appreciation/
Depreciation | | | Purchases | | | Sales
Proceeds | | | Transfer
into
Level 3 | | | Transfer
Out of
Level 3 | | | Balance
as of
April
30, 2022 | | Net change in
unrealized
appreciation/
(depreciation) included
in the Statements of
Operations attributable
to Level 3 investments
held at April 30, 2022 |
| Common Stocks | | $ | 3,365,735 | | | $ | – | | | $ | – | | | $ | – | | | $ | (274,165 | ) | | $ | – | | | $ | – | | | $ | – | | | $ | (896,642 | ) | | $ | 2,194,929 | | | $(88,644) |
| Convertible Corporate Bonds | | | 108,750 | | | | – | | | | – | | | | – | | | | – | | | | – | | | | – | | | | – | | | | – | | | | 108,750 | | | – |
| | | $ | 3,474,485 | | | $ | – | | | $ | – | | | $ | – | | | $ | (274,165 | ) | | $ | – | | | $ | – | | | $ | – | | | $ | (896,642 | ) | | $ | 2,303,679 | | | $(88,644) |
Clough Global Opportunities Fund
| Asset Type | | Balance
as of
October
30, 2021 | | | Accrued
Discount/
premium | | | Return of
Capital | | | Realized
Gain/(Loss) | | | Change in
Unrealized
Appreciation/
Depreciation | | | Purchases | | | Sales
Proceeds | | | Transfer
into
Level 3 | | | Transfer
Out of
Level 3 | | | Balance
as of
April
30, 2022 | | Net change in
unrealized
appreciation/
(depreciation) included
in the Statements of
Operations attributable
to Level 3 investments
held at April 30, 2022 |
| Common Stocks | | $ | 8,656,565 | | | $ | – | | | $ | – | | | $ | – | | | $ | (673,102 | ) | | $ | – | | | $ | – | | | $ | – | | | $ | (2,061,507 | ) | | $ | 5,921,956 | | | $(246,567) |
| Convertible Corporate Bonds | | | 253,750 | | | | – | | | | – | | | | – | | | | – | | | | – | | | | – | | | | – | | | | – | | | | 253,750 | | | – |
| | | $ | 8,910,315 | | | $ | – | | | $ | – | | | $ | – | | | $ | (673,102 | ) | | $ | – | | | $ | – | | | $ | – | | | $ | (2,061,507 | ) | | $ | 6,175,706 | | | $(246,567) |
The following is a summary of valuation techniques and quantitative information used in determining the fair value of each Fund’s Level 3 investments at April 30, 2022:
| Fund | | Sector | | | Fair Value | | Valuation Technique | | Unobservable Input(a) | | Premium/(Discount) |
| Clough Global Equity Fund | | Health Care | | | $ | 2,303,679 | | Accomplishment & Goals and Index Performance Methods | | Transaction Price | | N/A |
| | | | | | | | | | | | | |
| Clough Global Opportunities Fund | | Health Care | | | $ | 6,175,706 | | Accomplishment & Goals and Index Performance Methods | | Transaction Price | | N/A |
| (a) | A change to the unobservable input may result in a significant change to the value of the investment as follows: |
| Unobservable Input | Impact to Value if Input Increases | Impact to Value if Input Decreases |
| Transaction Price | Increase | Decrease |
| Semi-Annual Report | April 30, 2022 | 53 |
| Clough Global Funds | Notes to Financial Statements |
April 30, 2022 (Unaudited)
Foreign Securities: Each Fund may invest a portion of its assets in foreign securities. In the event that a Fund executes a foreign security transaction, the Fund will generally enter into a foreign currency spot contract to settle the foreign security transaction. Foreign securities may carry more risk than U.S. securities, such as political, market and currency risks.
The accounting records of each Fund are maintained in U.S. dollars. Prices of securities denominated in foreign currencies are translated into U.S. dollars at the closing rates of exchange at period end. Amounts related to the purchase and sale of foreign securities and investment income are translated at the rates of exchange prevailing on the respective dates of such transactions. Although the net assets and the values are presented at the foreign exchange rates at market close, the Funds do not isolate the portion of the results of operations resulting from changes in foreign exchange rates on investments from the fluctuations arising from changes in prices of securities held.
The effect of changes in foreign currency exchange rates on investments is reported with investment securities realized and unrealized gains and losses in the Funds’ Statements of Operations.
A foreign currency spot contract is a commitment to purchase or sell a foreign currency at a future date, at a negotiated rate. Each Fund may enter into foreign currency spot contracts to settle specific purchases or sales of securities denominated in a foreign currency and for protection from adverse exchange rate fluctuation. Risks to a Fund include the potential inability of the counterparty to meet the terms of the contract.
The net U.S. dollar value of foreign currency underlying all contractual commitments held by a Fund and the resulting unrealized appreciation or depreciation are determined using prevailing forward foreign currency exchange rates. Unrealized appreciation and depreciation on foreign currency spot contracts are reported in the Funds’ Statements of Assets and Liabilities as a receivable for investments sold or a payable for investments purchased and in the Funds’ Statements of Operations with the change in unrealized appreciation or depreciation on translation of assets and liabilities denominated in foreign currencies. These spot contracts are used by the broker to settle investments denominated in foreign currencies.
A Fund may realize a gain or loss upon the closing or settlement of the foreign transactions. Such realized gains and losses are reported with all other foreign currency gains and losses in the Statements of Operations.
Exchange Traded Funds: Each Fund may invest in Exchange Traded Funds (“ETFs”), which are funds whose shares are traded on a national exchange. ETFs may be based on underlying equity or fixed income securities, as well as commodities or currencies. ETFs do not sell individual shares directly to investors and only issue their shares in large blocks known as “creation units.” The investor purchasing a creation unit then sells the individual shares on a secondary market. Although similar diversification benefits may be achieved through an investment in another investment company, ETFs generally offer greater liquidity and lower expenses. Because an ETF incurs its own fees and expenses, shareholders of a Fund investing in an ETF will indirectly bear those costs. Such Funds will also incur brokerage commissions and related charges when purchasing or selling shares of an ETF. Unlike typical investment company shares, which are valued once daily, shares in an ETF may be purchased or sold on a securities exchange throughout the trading day at market prices that are generally close to the NAV of the ETF.
Short Sales: Each Fund may sell a security it does not own in anticipation of a decline in the fair value of that security. When a Fund sells a security short, it must borrow the security sold short and deliver it to the broker-dealer through which it made the short sale. A gain, limited to the price at which a Fund sold the security short, or a loss, unlimited in size, will be recognized upon the termination of the short sale.
Each Fund's obligation to replace the borrowed security will be secured by collateral deposited with the broker-dealer, usually cash, U.S. government securities or other liquid securities. Each Fund will also be required to designate on its books and records similar collateral with its custodian to the extent, if any, necessary so that the aggregate collateral value is at all times at least equal to the current value of the security sold short. The cash amount is reported on the Statements of Assets and Liabilities as Deposit with broker for securities sold short which is held with one counterparty. Each Fund is obligated to pay interest to the broker for any debit balance of the margin account relating to short sales. The interest incurred by the Funds is reported on the Statements of Operations as Interest expense – margin account. Interest amounts payable, if any, are reported on the Statements of Assets and Liabilities as Interest payable – margin account.
Each Fund may also sell a security short if it owns at least an equal amount of the security sold short or another security convertible or exchangeable for an equal amount of the security sold short without payment of further compensation (a short sale against-the-box). In a short sale against-the-box, the short seller is exposed to the risk of being forced to deliver stock that it holds to close the position if the borrowed stock is called in by the lender, which would cause gain or loss to be recognized on the delivered stock. Each Fund expects normally to close its short sales against-the-box by delivering newly acquired stock. Since the Funds intend to hold securities sold short for the short term, these securities are excluded from the purchases and sales of investment securities in Note 4 and each Fund’s Portfolio Turnover in the Financial Highlights.
| Clough Global Funds | Notes to Financial Statements |
April 30, 2022 (Unaudited)
Derivatives Instruments and Hedging Activities: The following discloses the Funds’ use of derivative instruments and hedging activities. The Funds’ investment objectives not only permit the Funds to purchase investment securities, they also allow the Funds to enter into various types of derivative contracts, including, but not limited to, purchased and written options, swaps, futures and warrants. In doing so, the Funds will employ strategies in differing combinations to permit them to increase, decrease, or change the level or types of exposure to market factors. Central to those strategies are features inherent to derivatives that make them more attractive for this purpose than equity securities; they require little or no initial cash investment, they can focus exposure on only certain selected risk factors, and they may not require the ultimate receipt or delivery of the underlying security (or securities) to the contract. This may allow the Funds to pursue their objectives more quickly and efficiently than if they were to make direct purchases or sales of securities capable of affecting a similar response to market factors.
Risk of Investing in Derivatives: The Funds’ use of derivatives can result in losses due to unanticipated changes in the market risk factors and the overall market. In instances where the Funds are using derivatives to decrease or hedge exposures to market risk factors for securities held by the Funds, there are also risks that those derivatives may not perform as expected, resulting in losses for the combined or hedged positions.
Derivatives may have little or no initial cash investment relative to their market value exposure and therefore can produce significant gains or losses in excess of their cost. This use of embedded leverage allows the Funds to increase their market value exposure relative to their net assets and can substantially increase the volatility of the Funds’ performance.
Additional associated risks from investing in derivatives also exist and potentially could have significant effects on the valuation of the derivative and the Funds. Typically, the associated risks are not the risks that the Funds are attempting to increase or decrease exposure to, per their investment objectives, but are the additional risks from investing in derivatives.
Examples of these associated risks are liquidity risk, which is the risk that the Funds will not be able to sell the derivative in the open market in a timely manner, and counterparty credit risk, which is the risk that the counterparty will not fulfill its obligation to the Funds. Associated risks can be different for each type of derivative and are discussed by each derivative type in the notes that follow.
Each Fund may acquire put and call options and options on stock indices and enter into stock index futures contracts, certain credit derivatives transactions and short sales in connection with its equity investments. In connection with a Fund's investments in debt securities, it may enter into related derivatives transactions such as interest rate futures, swaps and options thereon and certain credit derivatives transactions. Derivatives transactions of the types described above subject a Fund to increased risk of principal loss due to imperfect correlation or unexpected price or interest rate movements. Each Fund also will be subject to credit risk with respect to the counterparties to the derivatives contracts purchased by a Fund. If a counterparty becomes bankrupt or otherwise fails to perform its obligations under a derivatives contract due to financial difficulties, each Fund may experience significant delays in obtaining any recovery under the derivatives contract in a bankruptcy or other reorganization proceeding. Each Fund may obtain only a limited recovery or may obtain no recovery in such circumstances.
Market Risk Factors: In addition, in pursuit of their investment objectives, certain Funds may seek to use derivatives, which may increase or decrease exposure to the following market risk factors:
Equity Risk: Equity risk relates to the change in value of equity securities as they relate to increases or decreases in the general market.
Foreign Exchange Rate Risk: Foreign exchange rate risk relates to the change in the U.S. dollar value of a security held that is denominated in a foreign currency. The value of a foreign currency denominated security will decrease as the dollar appreciates against the currency, while the value of the foreign currency denominated security will increase as the dollar depreciates against the currency.
Option Writing/Purchasing: Each Fund may purchase or write (sell) put and call options. One of the risks associated with purchasing an option among others, is that a Fund pays a premium whether or not the option is exercised. Additionally, a Fund bears the risk of loss of premium and change in value should the counterparty not perform under the contract. The cost of securities acquired through the exercise of call options is increased by premiums paid. The proceeds from securities sold through the exercise of put options are decreased by the premiums paid. Each Fund is obligated to pay interest to the broker for any debit balance of the margin account relating to options. Each Fund pledges cash or liquid assets as collateral to satisfy the current obligations with respect to written options. The interest incurred, if any, on the Funds is reported on the Statements of Operations as Interest expense – margin account. Interest amounts payable by the Funds, if any, are reported on the Statements of Assets and Liabilities as Interest payable – margin account.
When a Fund writes an option, an amount equal to the premium received by a Fund is recorded as a liability and is subsequently adjusted to the current value of the option written. Premiums received from writing options that expire unexercised are treated by a Fund on the expiration date as realized gains. The difference between the premium received and the amount paid on effecting a closing purchase transaction, including brokerage commissions, is recorded as a realized gain or loss. If a call option is exercised, the premium is added to the proceeds from the sale of the underlying security or currency in determining whether a Fund has realized a gain or loss. If a put option is exercised, the premium reduces the cost basis of the securities purchased by a Fund. Each Fund, as writer of an option, bears the market risk of an unfavorable change in the price of the security underlying the written option. The Funds engaged in purchased and written options during the six months ended April 30, 2022.
| Semi-Annual Report | April 30, 2022 | 55 |
| Clough Global Funds | Notes to Financial Statements |
April 30, 2022 (Unaudited)
Futures Contracts: Each Fund may enter into futures contracts. A futures contract is an agreement to buy or sell a security or currency (or to deliver a final cash settlement price in the case of a contract relating to an index or otherwise not calling for physical delivery at the end of trading in the contract) for a set price at a future date. If a Fund buys a security futures contract, the Fund enters into a contract to purchase the underlying security and is said to be "long" under the contract. If a Fund sells a security futures contact, the Fund enters into a contract to sell the underlying security and is said to be "short" under the contract. The price at which the contract trades (the "contract price") is determined by relative buying and selling interest on a regulated exchange. Futures contracts are marked to market daily and an appropriate payable or receivable for the change in value (“variation margin”) is recorded by the Fund. Such payables or receivables, if any, are recorded for financial statement purposes as variation margin payable or variation margin receivable by each Fund. Each Fund pledges cash or liquid assets as collateral to satisfy the current obligations with respect to futures contracts. The cash amount, if any, is reported on the Statements of Assets and Liabilities as Deposit with broker for futures contracts which is held with one counterparty. Management has reviewed the futures agreement under which the futures contracts are traded and has determined that the Funds do not have the right to set-off, and therefore the futures contracts are not subject to enforceable netting arrangements.
The Funds enter into such transactions for hedging and other appropriate risk-management purposes or to increase return. While a Fund may enter into futures contracts for hedging purposes, the use of futures contracts might result in a poorer overall performance for the Fund than if it had not engaged in any such transactions. If, for example, the Fund had insufficient cash, it might have to sell a portion of its underlying portfolio of securities in order to meet daily variation margin requirements on its futures contracts or options on futures contracts at a time when it might be disadvantageous to do so. There may be an imperfect correlation between the Funds’ portfolio holdings and futures contracts entered into by the Fund, which may prevent the Fund from achieving the intended hedge or expose the Fund to risk of loss.
Futures contract transactions may result in losses substantially in excess of the variation margin. There can be no guarantee that there will be a correlation between price movements in the hedging vehicle and in the portfolio securities being hedged. An incorrect correlation could result in a loss on both the hedged securities in a Fund and the hedging vehicle so that the portfolio return might have been greater had hedging not been attempted. There can be no assurance that a liquid market will exist at a time when the Fund seeks to close out a futures contract. Lack of a liquid market for any reason may prevent a Fund from liquidating an unfavorable position, and the Fund would remain obligated to meet margin requirements until the position is closed. In addition, the Fund could be exposed to risk if the counterparties to the contracts are unable to meet the terms of their contracts. With exchange-traded futures contracts, there is minimal counterparty credit risk to the Funds since futures contracts are exchange-traded and the exchange’s clearinghouse, as counterparty to all exchange-traded futures contracts, guarantees the futures contracts against default. The Funds engaged in futures contracts during the six months ended April 30, 2022.
Swaps: A swap is an agreement that obligates two parties to exchange a series of cash flows at specified intervals based upon or calculated by reference to changes in specified prices or rates for a specified amount of an underlying asset. Each Fund may utilize swap agreements as a means to gain exposure to certain assets and/or to “hedge” or protect the Fund from adverse movements in securities prices or interest rates. Each Fund is subject to equity risk and interest rate risk in the normal course of pursuing its investment objective through investments in swap contracts. Swap agreements entail the risk that a party will default on its payment obligation to a Fund. If the other party to a swap defaults, a Fund would risk the loss of the net amount of the payments that it contractually is entitled to receive. If each Fund utilizes a swap at the wrong time or judges market conditions incorrectly, the swap may result in a loss to the Fund and reduce the Fund’s total return.
Total return swaps involve an exchange by two parties in which one party makes payments based on a set rate, either fixed or variable, while the other party makes payments based on the return of an underlying asset, which includes both the income it generates and any capital gains over the payment period. A Fund’s maximum risk of loss from counterparty risk or credit risk is the discounted value of the payments to be received from/paid to the counterparty over the contract’s remaining life, to the extent that the amount is positive. The risk is mitigated by having a netting arrangement between a Fund and the counterparty and by the posting of collateral to a Fund to cover the Fund’s exposure to the counterparty. Each Fund pledges cash or liquid assets as collateral to satisfy the current obligations with respect to swap contracts. The cash amount is reported on the Statements of Assets and Liabilities as Deposit with broker for total return swap contracts which is held with one counterparty.
International Swaps and Derivatives Association, Inc. Master Agreements (“ISDA Master Agreements”) govern OTC financial derivative transactions entered into by a Fund and those counterparties. The ISDA Master Agreements maintain provisions for general obligations, representations, agreements, collateral and events of default or termination. Events of termination include conditions that may entitle counterparties to elect to terminate early and cause settlement of all outstanding transactions under the applicable ISDA Master Agreement. Any election to early terminate could be material to the financial statements. During the six months ended April 30, 2022, the Funds invested in swap agreements consistent with the Funds’ investment strategies to gain exposure to certain markets or indices.
| Clough Global Funds | Notes to Financial Statements |
April 30, 2022 (Unaudited)
Warrants/Rights: Each Fund may purchase or otherwise receive warrants or rights. Warrants and rights generally give the holder the right to receive, upon exercise, a security of the issuer at a set price. Funds typically use warrants and rights in a manner similar to their use of purchased options on securities, as described in options above. Risks associated with the use of warrants and rights are generally similar to risks associated with the use of purchased options. However, warrants and rights often do not have standardized terms, and may have longer maturities and may be less liquid than exchange-traded options. In addition, the terms of warrants or rights may limit each Fund’s ability to exercise the warrants or rights at such times and in such quantities as each Fund would otherwise wish. As of and during the six months ended April 30, 2022, Clough Global Equity Fund and Clough Global Opportunities Fund held warrants, and Clough Global Dividend and Income Fund did not hold rights. Each Fund held no rights.
The effect of derivatives instruments on each Fund’s Statement of Assets and Liabilities as of April 30, 2022:
| | | Asset Derivatives | | | | |
| Risk Exposure | | Statements of Assets and Liabilities Location | | Fair Value | |
| Clough Global Dividend and Income Fund | | | | | | |
| Equity Contracts (Purchased Options) | | Investments, at value | | | 383,200 | |
| | | | | $ | 383,200 | |
| Clough Global Equity Fund | | | | | | |
| Equity Contracts (Purchased Options) | | Investments, at value | | | 766,400 | |
| | | | | $ | 766,400 | |
| Clough Global Opportunities Fund | | | | | | |
| Equity Contracts (Purchased Options) | | Investments, at value | | | 1,437,000 | |
| | | | | $ | 1,437,000 | |
| | | Liability Derivatives | | | | |
| | | Statements of Assets and Liabilities Location | | Fair Value | |
| Clough Global Dividend and Income Fund | | | | | | |
| Equity Contracts (Written Options) | | Written options, at value | | | (124,160 | ) |
| Total | | | | $ | (248,320 | ) |
| Clough Global Equity Fund | | | | | | |
| Equity Contracts (Written Options) | | Written options, at value | | | (248,320 | ) |
| Total | | | | $ | (496,640 | ) |
| Clough Global Opportunities Fund | | | | | | |
| Equity Contracts (Written Options) | | Written options, at value | | | (465,600) | |
| Total | | | | $ | (931,200) | |
| Semi-Annual Report | April 30, 2022 | 57 |
| Clough Global Funds | Notes to Financial Statements |
April 30, 2022 (Unaudited)
The effect of derivatives instruments on each Fund's Statement of Operations for the six months ended April 30, 2022:
| Risk Exposure | | Statements of Operations Location | | | Realized
Gain/(Loss)
on Derivatives
Recognized
in Income | | | Change in
Unrealized
Appreciation/
(Depreciation)
on Derivatives
Recognized
in Income | |
Clough Global Dividend and
Income Fund | | | | | | | |
Foreign Currency, Commodity Contracts
(Futures Contracts) | | Net realized gain/(loss) on futures contracts/Net change in unrealized appreciation/(depreciation) on futures contracts | | $ | 197,839 | | $ | (298,941 | ) |
Equity Contracts
(Purchased Options) | | Net realized gain/(loss) on investment securities/Net change in unrealized appreciation/(depreciation) on investment securities | | | (2,403,922 | ) | | 858,824 | |
Equity Contracts
(Total Return Swap Contracts) | | Net realized gain/(loss) on total return swap contracts/Net change in unrealized appreciation/(depreciation) on total return swap contracts | | | (3,810,044 | ) | | (7,476 | ) |
Equity Contracts
(Written Options) | | Net realized gain/(loss) on written options/Net change in unrealized appreciation/(depreciation) on written options | | | 492,496 | | | 167,935 | |
| Total | | | | $ | (5,523,631 | ) | $ | 720,342 | |
| | | | | | | | | | |
| Clough Global Equity Fund | | | | | | | | | |
Foreign Currency, Commodity Contracts
(Futures Contracts) | | Net realized gain/(loss) on futures contracts/Net change in unrealized appreciation/(depreciation) on futures contracts | | $ | 436,894 | | $ | (660,160 | ) |
Equity Contracts
(Purchased Options) | | Net realized gain/(loss) on investment securities/Net change in unrealized appreciation/(depreciation) on investment securities | | | (5,001,621 | ) | | 1,692,896 | |
Equity Contracts
(Total Return Swap Contracts) | | Net realized gain/(loss) on total return swap contracts/Net change in unrealized appreciation/(depreciation) on total return swap contracts | | | (6,614,748 | ) | | (2,878,383 | ) |
Equity Contracts
(Written Options) | | Net realized gain/(loss) on written options/Net change in unrealized appreciation/(depreciation) on written options | | | 1,210,505 | | | 335,870 | |
| Total | | | | $ | (9,968,970 | ) | $ | (1,509,777 | ) |
| | | | | | | | | | |
| Clough Global Opportunities Fund | | | | | | | | | |
Foreign Currency, Commodity Contracts
(Futures Contracts) | | Net realized gain/(loss) on futures contracts/Net change in unrealized appreciation/(depreciation) on futures contracts | | $ | 849,059 | | $ | (1,282,953 | ) |
Equity Contracts
(Purchased Options) | | Net realized gain/(loss) on investment securities/Net change in unrealized appreciation/(depreciation) on investment securities | | | (9,253,879 | ) | | 3,391,207 | |
Equity Contracts
(Total Return Swap Contracts) | | Net realized gain/(loss) on total return swap contracts/Net change in unrealized appreciation/(depreciation) on total return swap contracts | | | (12,219,724 | ) | | (5,405,035 | ) |
Equity Contracts
(Written Options) | | Net realized gain/(loss) on written options/Net change in unrealized appreciation/(depreciation) on written options | | | 1,974,235 | | | 629,758 | |
| Total | | | | $ | (18,650,309 | ) | $ | (2,667,023 | ) |
The average total return swap contracts notional amount during the six months ended April 30, 2022, is noted below for each of the Funds.
| Clough Global Funds | Notes to Financial Statements |
April 30, 2022 (Unaudited)
| Fund | | Average Total Return Swap Contracts Notional Amount | |
| Clough Global Dividend and Income Fund | | $ | 2,463,643 | |
| Clough Global Equity Fund | | | 7,901,387 | |
| Clough Global Opportunities Fund | | | 14,661,688 | |
The average monthly notional value of options contracts outstanding during the six months ended April 30, 2022, is noted below for each of the Funds.
| Fund | | Average Purchased Option Contract Notional Amount | | | Average Written Option Contract Notional Amount | |
| Clough Global Dividend and Income Fund | | $ | 173,940,966 | | | $ | (26,698,072 | ) |
| Clough Global Equity Fund | | | 329,566,600 | | | | (53,627,667 | ) |
| Clough Global Opportunities Fund | | | 649,670,168 | | | | (99,640,276 | ) |
The average monthly notional value of futures contracts outstanding during the six months ended April 30, 2022, is noted below for each of the Funds.
| Fund | | | Average Futures Contracts Notional Amount | |
| Clough Global Dividend and Income Fund | | $ | – | |
| Clough Global Equity Fund | | | – | |
| Clough Global Opportunities Fund | | | – | |
Certain derivative contracts are executed under either standardized netting agreements or, for exchange-traded derivatives, the relevant contracts for a particular exchange which contain enforceable netting provisions. A derivative netting arrangement creates an enforceable right of set-off that becomes effective, and affects the realization of settlement on individual assets, liabilities and collateral amounts, only following a specified event of default or early termination. Default events may include the failure to make payments or deliver securities timely, material adverse changes in financial condition or insolvency, the breach of minimum regulatory capital requirements, or loss of license, charter or other legal authorization necessary to perform under the contract.
| Semi-Annual Report | April 30, 2022 | 59 |
| Clough Global Funds | Notes to Financial Statements |
April 30, 2022 (Unaudited)
Restricted Securities: Although the Funds will invest primarily in publicly traded securities, they may invest a portion of their assets (up to 10% of its value) in restricted securities. Restricted securities are securities that may not be sold to the public without an effective registration statement under the Securities Act of 1933, as amended (the "Securities Act") or, if they are unregistered, may be sold only in a privately negotiated transaction or pursuant to an exemption from registration.
Restricted securities as of April 30, 2022 were as follows:
| | | | | % of Net | | | Acquisition | | | Principal | | | | | | | |
| Fund | | Security | | Assets | | | Date | | | Amount | | | Cost | | | Value | |
| Clough Global Dividend and Income Fund | | | | | | | | | | | | | | | |
| | | Alaska Airlines 2020-1 Class B Pass Through Trust | | | 1.48 | % | | | 2/1/2022 | | | | 1,443,688 | | | $ | 1,595,871 | | | $ | 1,506,761 | |
| | | Carnival Corp. | | | 0.96 | % | | | 4/27/2022 | | | | 1,000,000 | | | | 997,503 | | | | 979,890 | |
| | | Carvana Co. | | | 0.43 | % | | | 9/25/2022 - 11/6/2020 | | | | 500,000 | | | | 503,640 | | | | 434,015 | |
| | | JDE Peet's NV | | | 0.86 | % | | | 3/8/2022 | | | | 1,000,000 | | | | 929,195 | | | | 873,523 | |
| | | Melco Resorts Finance, Ltd. | | | 0.21 | % | | | 9/21/2020 | | | | 250,000 | | | | 258,876 | | | | 211,322 | |
| | | Nationstar Mortgage Holdings, Inc. | | | 1.29 | % | | | 3/16/2021 - 6/28/2021 | | | | 1,500,000 | | | | 1,498,815 | | | | 1,306,717 | |
| | | Nationstar Mortgage Holdings, Inc. | | | 0.44 | % | | | 11/16/2021 | | | | 500,000 | | | | 500,000 | | | | 444,428 | |
| | | Owl Rock Technology Finance Corp. | | | 1.01 | % | | | 5/14/2021 | | | | 1,000,000 | | | | 1,124,553 | | | | 1,023,745 | |
| | | Owl Rock Technology Finance Corp. | | | 0.95 | % | | | 12/13/2021 | | | | 1,000,000 | | | | 1,063,118 | | | | 970,290 | |
| Total | | | | | 7.63 | % | | | | | | | | | | $ | 8,471,571 | | | $ | 7,750,691 | |
| | | | | | | | | | | | | | | | | | | | | | | |
| Clough Global Equity Fund | | | | | | | | | | | | | | | | | | | | |
| | | Amphivena Convertible Note PP | | | 0.06 | % | | | 8/27/2021 | | | | 108,750 | | | $ | 108,750 | | | $ | 108,750 | |
| | | Amphivena Therapeutics, Inc., Series C | | | 0.71 | % | | | 4/8/2019 | | | | 334,425 | | | | 1,199,997 | | | | 1,337,366 | |
| | | Arcellx, Inc. | | | 0.51 | % | | | 8/8/2019 - 3/26/2021 | | | | 90,937 | | | | 896,631 | | | | 967,712 | |
| | | Centrexion Therapeutics Corp. | | | 0.03 | % | | | 3/19/2019 | | | | 4,336 | | | | 48,741 | | | | 52,331 | |
| | | Centrexion Therapeutics Corp., Series D Preferred Shares | | | 0.43 | % | | | 12/18/2017 | | | | 66,719 | | | | 701,250 | | | | 805,232 | |
| Total | | | | | 1.73 | % | | | | | | | | | | $ | 2,955,369 | | | $ | 3,271,391 | |
| | | | | | | | | | | | | | | | | | | | | | | |
| Clough Global Opportunities Fund | | | | | | | | | | | | | | | | | | | | |
| | | Alaska Airlines 2020-1 Class B Pass Through Trust | | | 1.32 | % | | | 2/1/2022 | | | | 4,331,064 | | | $ | 4,787,613 | | | $ | 4,520,283 | |
| | | Amphivena Convertible Note PP | | | 0.07 | % | | | 8/27/2021 | | | | 253,750 | | | | 253,750 | | | | 253,750 | |
| | | Amphivena Therapeutics, Inc., Series C | | | 0.91 | % | | | 4/8/2019 | | | | 780,326 | | | | 2,799,997 | | | | 3,120,524 | |
| | | Arcellx, Inc. | | | 0.65 | % | | | 8/8/2019 - 3/26/2021 | | | | 209,080 | | | | 2,061,502 | | | | 2,224,939 | |
| | | Centrexion Therapeutics Corp. | | | 0.05 | % | | | 3/19/2019 | | | | 14,166 | | | | 159,240 | | | | 170,969 | |
| | | Centrexion Therapeutics Corp., Series D Preferred Shares | | | 0.77 | % | | | 12/18/2017 | | | | 217,952 | | | | 2,290,758 | | | | 2,630,463 | |
| | | Nationstar Mortgage Holdings, Inc. | | | 0.38 | % | | | 6/28/2021 - 6/28/2021 | | | | 1,510,000 | | | | 1,510,000 | | | | 1,315,429 | |
| | | Nationstar Mortgage Holdings, Inc. | | | 0.65 | % | | | 11/22/2021 | | | | 2,500,000 | | | | 2,500,000 | | | | 2,222,138 | |
| | | Owl Rock Technology Finance Corp. | | | 1.13 | % | | | 12/13/2021 | | | | 4,000,000 | | | | 4,252,473 | | | | 3,881,161 | |
| Total | | | | | 5.95 | % | | | | | | | | | | $ | 20,615,333 | | | $ | 20,339,656 | |
Income Taxes: Each Fund’s policy is to comply with the provisions of the Internal Revenue Code applicable to regulated investment companies and to distribute all of its taxable income to its shareholders. Therefore, no federal income tax provision is required. As of and during the six months ended April 30, 2022, the Funds did not have a liability for any unrecognized tax benefits. The Funds recognize the interest and penalties, if any, related to the unrecognized tax benefits as income tax expense in the Statements of Operations. During the six months ended April 30, 2022, the Funds did not incur any interest or penalties.
| Clough Global Funds | Notes to Financial Statements |
April 30, 2022 (Unaudited)
The Funds file U.S. federal, state, and local tax returns as required. The Funds’ tax returns are subject to examination by the relevant tax authorities until expiration of the applicable statute of limitations, which is generally three years after the filing of the tax return but which can be extended to six years in certain circumstances. Tax returns for open years have incorporated no uncertain tax positions that require a provision for income taxes.
Distributions to Shareholders: Each Fund intends to make a dividend distribution each month to Common Shareholders after payment of interest on any outstanding borrowings. Any net capital gains earned by a Fund are distributed at least annually to the extent necessary to avoid federal income and excise taxes. Distributions to shareholders are recorded by each Fund on the ex-dividend date. Each Fund has received approval from the Securities and Exchange Commission (the “Commission”) for exemption from Section 19(b) of the 1940 Act, and Rule 19b-1 there under permitting each Fund to make periodic distributions of long-term capital gains, provided that the distribution policy of a Fund with respect to its Common Shares calls for periodic (e.g. quarterly/monthly) distributions in an amount equal to a fixed percentage of each Fund’s average NAV over a specified period of time or market price per common share at or about the time of distributions or pay-out of a level dollar amount.
Effective August 2017, each Fund’s Board approved a managed dividend distribution rate of 10% of each Fund’s prior month average NAV. Subject to certain conditions, these distribution policies remained in effect through July 2019. Effective August 2019, each Fund's Board agreed that the Fund would pay monthly distributions in an amount not less than the average distribution rate of a peer group of closed-end funds selected by the Board. Each Fund's current managed distribution policy is to set the monthly distribution rate at an amount equal to one twelfth of 10% of each Fund's adjusted year-ending NAV, which is the average of the NAVs as of the last five business days of the prior calendar year.
Securities Transactions and Investment Income: Investment security transactions are accounted for on a trade date basis. Dividend income and dividend expense-short sales are recorded on the ex-dividend date. Certain dividend income from foreign securities will be recorded, in the exercise of reasonable diligence, as soon as a Fund is informed of the dividend if such information is obtained subsequent to the ex-dividend date and may be subject to withholding taxes in these jurisdictions. Withholding taxes on foreign dividends are paid (a portion of which may be reclaimable) or provided for in accordance with the applicable country’s tax rules and rates and are disclosed in the Statements of Operations. Interest income, which includes amortization of premium and accretion of discount, is recorded on the accrual basis. Realized gains and losses from securities transactions and unrealized appreciation and depreciation of securities are determined using the identified cost basis for both financial reporting and income tax purposes.
Foreign Taxes: The Funds may be subject to foreign taxes related to foreign income received (a portion of which may be reclaimable), capital gains on the sale of securities and certain foreign currency transactions. All foreign taxes are recorded in accordance with the applicable regulations and rates that exist in the foreign jurisdictions in which the Funds invest.
Certain foreign countries impose a capital gains tax which is accrued by the Funds based on the unrealized appreciation, if any, on affected securities. Any accrual would reduce a Fund’s NAV. The tax is paid when the gain is realized and is included in capital gains tax in the Statements of Operations.
Counterparty Risk: Each of the Funds run the risk that the issuer or guarantor of a fixed income security, the counterparty to an over-the-counter derivatives contract, a borrower of each Fund’s securities or the obligor of an obligation underlying an asset-backed security will be unable or unwilling to make timely principal, interest, or settlement payments or otherwise honor its obligations. In addition, to the extent that each of the Funds use over-the-counter derivatives, and/or has significant exposure to a single counterparty, this risk will be particularly pronounced for each of the Funds.
Other Risk Factors: Investing in the Funds may involve certain risks including, but not limited to, the following:
Unforeseen developments in market conditions may result in the decline of prices of, and the income generated by, the securities held by the Funds. These events may have adverse effects on the Funds such as a decline in the value and liquidity of many securities held by the Funds, and a decrease in NAV. Such unforeseen developments may limit or preclude the Funds’ ability to achieve their investment objective.
Investing in stocks may involve larger price fluctuation and greater potential for loss than other types of investments. This may result in the securities held by the Funds being subject to larger short-term declines in value compared to other types of investments.
The Funds may have elements of risk due to their investments in foreign issuers located in various countries outside the U.S. Such investments may subject the Funds to additional risks resulting from future political or economic conditions and/or possible impositions of adverse foreign governmental laws or currency exchange restrictions. Investments in securities of non-U.S. issuers have unique risks not present in securities of U.S. issuers, such as greater price volatility and less liquidity.
| Semi-Annual Report | April 30, 2022 | 61 |
| Clough Global Funds | Notes to Financial Statements |
April 30, 2022 (Unaudited)
Fixed income securities are subject to credit risk, which is the possibility that a security could have its credit rating downgraded or that the issuer of the security could fail to make timely payments or default on payments of interest or principal. Additionally, fixed income securities are subject to interest rate risk, meaning the decline in the price of debt securities that accompanies a rise in interest rates. Bonds with longer maturities are subject to greater price fluctuations than bonds with shorter maturities.
The Funds invest in bonds which are rated below investment grade. These high yield bonds may be more susceptible than higher grade bonds to real or perceived adverse economic or industry conditions. The secondary market, on which high yield bonds are traded, may also be less liquid than the market for higher grade bonds.
A novel coronavirus and the resulting COVID-19 respiratory infection have resulted in a global pandemic and major disruption to economies and markets around the world. The pandemic has led to extreme short-term market volatility and may have adverse long-term effects on U.S. and world economies. Liquidity for many instruments has been reduced, and some sectors of the economy and individual issuers have experienced particularly large losses. The economic impacts of the global pandemic may adversely impact the Funds’ ability to reach their investment objectives and may adversely affect the value and liquidity of the Funds’ investments. Because of uncertainties in valuation, values reflected in these financial statements may differ from the value received upon sales of those investments. These circumstances may continue for an extended period of time, and may adversely affect the value and liquidity of the Funds’ investments.
2. FEDERAL INCOME TAXES
Classification of Distributions: Net investment income/(loss) and net realized gain/(loss) may differ for financial statement and tax purposes. The character of distributions made during the year from net investment income or net realized gains may differ from its ultimate characterization for federal income tax purposes. Also, due to the timing of dividend distributions, the fiscal year in which amounts are distributed may differ from the fiscal year in which the income or realized gain was recorded by the Funds.
The tax character of the distributions paid by the Funds during the year ended October 31, 2021, were as follows:
| | | Ordinary Income | | | Long-Term
Capital Gains | | | Return of Capital | | | Total | |
| Clough Global Dividend and Income Fund | | | | | | | | | | | | | | | | |
| October 31, 2021 | | $ | – | | | $ | 3,855,628 | | | $ | 7,067,306 | | | $ | 10,922,934 | |
| Clough Global Equity Fund | | | | | | | | | | | | | | | | |
| October 31, 2021 | | $ | 22,877,981 | | | $ | 157,822 | | | $ | – | | | $ | 23,035,803 | |
| Clough Global Opportunities Fund | | | | | | | | | | | | | | | | |
| October 31, 2021 | | $ | 40,050,333 | | | $ | 4,059,926 | | | $ | – | | | $ | 44,110,259 | |
Components of Net Assets: For the year ended October 31, 2021, permanent differences identified and reclassified among the components of net assets related to net operating losses. Any such reclassifications will have no effect on net assets, results of operations or net asset value (“NAV”) per share of the Fund.
Tax Basis of Investments: Net unrealized appreciation/(depreciation) of investments based on federal tax cost as of April 30, 2022, were as follows:
| | | Clough Global
Dividend and Income
Fund | | | Clough Global Equity
Fund | | | Clough Global
Opportunities Fund | |
| Gross appreciation (excess of value over tax cost)(a) | | $ | 9,118,328 | | | $ | 16,672,307 | | | $ | 28,619,534 | |
| Gross depreciation (excess of tax cost over value)(a) | | | (8,194,161 | ) | | | (19,806,318 | ) | | | (38,438,748 | ) |
| Net unrealized appreciation (depreciation) | | $ | 924,167 | | | $ | (3,134,011 | ) | | $ | (9,819,214 | ) |
| Cost of investments for income tax purposes | | $ | 135,103,841 | | | $ | 264,967,644 | | | $ | 494,735,951 | |
| (a) | Includes appreciation/(depreciation) on securities sold short. |
The difference between book and tax basis unrealized appreciation is attributable primarily to wash sales, passive foreign investment companies, notional principal contracts and accelerated recognition of unrealized gain or loss on certain derivatives.
| Clough Global Funds | Notes to Financial Statements |
April 30, 2022 (Unaudited)
3. CAPITAL TRANSACTIONS
Common Shares: There are an unlimited number of no par value common shares of beneficial interest authorized for each Fund.
The Board of each Fund announced, on April 20, 2015, that it had approved a share repurchase program in accordance with Section 23(c) of the 1940 Act. Under the share repurchase program, each Fund may purchase up to 5% of its outstanding common shares as of April 9, 2015, in the open market, through the Funds’ fiscal year end of October 31, 2015. The Board of each Fund approved, in October 2015, to extend the share repurchase program through the Funds’ fiscal year end of October 31, 2016. The Board of each Fund approved, in December 2016, to extend the share repurchase program through the Funds’ fiscal year end of October 31, 2017. In April 2017, the Board temporarily suspended the share repurchase program in light of prevailing discount rates.
On October 13, 2017, the Funds commenced tender offers which expired on November 10, 2017. Each Fund’s tender offer was oversubscribed, and as a result, Clough Global Equity Fund and Clough Global Opportunities Fund purchased 37.5% of its respective outstanding common shares of beneficial interest and Clough Global Dividend and Income Fund purchased 32.5% of its outstanding common shares of beneficial interest. A total of 4,998,066, 10,052,547 and 31,646,419 shares, for Clough Global Dividend and Income Fund, Clough Global Equity Fund and Clough Global Opportunities Fund, respectively, were properly tendered and not withdrawn. The Funds accepted 3,373,469, 6,615,414 and 19,334,647 shares, for Clough Global Dividend and Income Fund, Clough Global Equity Fund and Clough Global Opportunities Fund, respectively, for cash payment totaling $49,421,321, $95,394,270 and $232,209,110 at a purchase price of $14.65, $14.42 and $12.01 per common share for Clough Global Dividend and Income Fund, Clough Global Equity Fund and Clough Global Opportunities Fund, respectively, which is 98.5% of the net asset value per common share determined as of the close of the regular trading session of the NYSE on November 13, 2017. Accordingly, on a pro rata basis, Clough Global Dividend and Income Fund, Clough Global Equity Fund and Clough Global Opportunities Fund accepted approximately 67%, 66% and 61%, respectively, of the shares properly tendered.
In a rights offering that expired on August 23, 2019, Clough Global Dividend and Income Fund shareholders exercised rights to purchase 1,401,287 shares at $10.42 per share for proceeds, net of expenses of $176,000, of $14,425,411. The subscription price of $10.42 per share was established on August 23, 2019, which represented 85% of the reported net asset value on August 23, 2019.
In a rights offering that expired on August 23, 2019, Clough Global Equity Fund shareholders exercised rights to purchase 2,205,138 shares at $11.24 per share for proceeds, net of expenses of $203,000, of $24,582,751. The subscription price of $11.24 per share was established on August 23, 2019, which represented 95% of the reported market price per share, based on the average of the last reported sales price of a common share on the Exchange for the five trading days preceding August 23, 2019.
In a rights offering that expired on June 22, 2021, Clough Global Dividend and Income Fund shareholders exercised rights to purchase 2,807,451 shares at $10.15 per share for proceeds, net of expenses of $260,000, of $28,495,628. The subscription price of $10.15 per share was established on June 22, 2019, which represented 95% of the reported market price per share, based on the average of the last reported sales price of a common share on the Exchange for the five trading days preceding June 22, 2021.
In a rights offering that expired on June 22, 2021, Clough Global Equity Fund shareholders exercised rights to purchase 4,410,276 shares at $13.56 per share for proceeds, net of expenses of $297,000, of $59,803,343. The subscription price of $13.56 per share was established on June 22, 2019, which represented 85% of the reported market price per share, based on the average of the last reported sales price of a common share on the Exchange for the five trading days preceding June 22, 2021.
In a rights offering that expired on June 22, 2021, Clough Global Opportunities Fund shareholders exercised rights to purchase 7,573,005 shares at $11.59 per share for proceeds, net of expenses of $387,000, of $87,771,128. The subscription price of $11.59 per share was established on June 22, 2019, which represented 95% of the reported market price per share, based on the average of the last reported sales price of a common share on the Exchange for the five trading days preceding June 22, 2021.
The Fund has filed a registration statement with the SEC authorizing the Fund to issue additional common shares through one or more equity shelf programs (“Shelf Offering”).
Under this Shelf Offering, the Fund, subject to market conditions, may raise additional equity capital by issuing additional common shares from time to time in varying amounts and by different offering methods at a net price at or above the Fund’s NAV per common share. In the event the Fund’s Shelf Offering registration statement is no longer current, the Fund may not issue additional common shares until a post-effective amendment to the registration statement has been filed with the SEC.
| Semi-Annual Report | April 30, 2022 | 63 |
| Clough Global Funds | Notes to Financial Statements |
April 30, 2022 (Unaudited)
Transactions in common shares were as follows:
| | | | | Clough Global Dividend and Income Fund | |
| | | | | For the Six Months
Ended April 30,
2022 | | | | For the
Year Ended
October 31, 2021 | |
| Common Shares Outstanding - beginning of period | | | | 11,301,293 | | | | 8,407,724 | |
| Common Shares Issued as reinvestment of dividends | | | | 38,726 | | | | 41,429 | |
| Sale of Shares | | | | 255,603 | | | | 2,852,140 | |
| Common Shares Outstanding - end of period | | | | 11,595,622 | | | | 11,301,293 | |
Transactions in common shares were as follows:
| | | | | Clough Global Equity Fund | |
| | | | | For the Six Months
Ended April 30,
2022 | | | | For the
Year Ended
October 31, 2021 | |
| Common Shares Outstanding - beginning of period | | | | 17,716,078 | | | | 13,230,829 | |
| Common Shares Issued as reinvestment of dividends | | | | 46,485 | | | | 35,214 | |
| Sale of Shares | | | | 691,940 | | | | 4,450,035 | |
| Common Shares Outstanding - end of period | | | | 18,454,503 | | | | 17,716,078 | |
Transactions in common shares were as follows:
| | | | | Clough Global Opportunities Fund | |
| | | | | For the Six Months
Ended April 30,
2022 | | | | For the
Year Ended
October 31, 2021 | |
| Common Shares Outstanding - beginning of period | | | | 40,086,612 | | | | 32,224,412 | |
| Common Shares Issued as reinvestment of dividends | | | | 107,584 | | | | 78,733 | |
| Sale of Shares | | | | 1,123,957 | | | | 7,783,467 | |
| Common Shares Outstanding - end of period | | | | 41,318,153 | | | | 40,086,612 | |
4. PORTFOLIO SECURITIES
Purchases and sales of investment securities, excluding securities sold short intended to be held for less than one year and short-term securities, for the six months ended April 30, 2022, are listed in the table below.
| Fund | | Cost of Investments
Purchased | | | Proceeds From
Investments Sold | | | Purchases of Long-Term U.S. Government Obligations | | | Proceeds from Sales of Long-Term U.S. Government Obligations | |
| Clough Global Dividend and Income Fund | | $ | 121,813,502 | | | $ | 154,681,432 | | | $ | 55,181,762 | | | $ | 35,707,332 | |
| Clough Global Equity Fund | | | 333,773,536 | | | | 425,182,268 | | | | 113,021,602 | | | | 61,487,539 | |
| Clough Global Opportunities Fund | | | 659,526,192 | | | | 810,020,050 | | | | 232,291,719 | | | | 136,072,031 | |
5. INVESTMENT ADVISORY AND ADMINISTRATION AGREEMENTS
Clough serves as each Fund’s investment adviser pursuant to an Investment Advisory Agreement (each an “Advisory Agreement” and collectively, the “Advisory Agreements”) with each Fund. As compensation for its services to the Fund, Clough receives an annual investment advisory fee of 0.70%, 0.90% and 1.00% based on Clough Global Dividend and Income Fund’s, Clough Global Equity Fund’s and Clough Global Opportunities Fund’s, respectively, average daily total assets, computed daily and payable monthly. ALPS Fund Services, Inc. (“ALPS”) serves as each Fund’s administrator pursuant to an Administration, Bookkeeping and Pricing Services Agreement with each Fund. As compensation for its services to each Fund, ALPS receives an annual administration fee based on each Fund’s average daily total assets, computed daily and payable monthly. ALPS will pay all expenses incurred by each Fund, with the exception of advisory fees, interest, dividend expenses tied to short sales, trustees’ fees, portfolio transaction expenses, litigation expenses, taxes, expenses of conducting repurchase offers for the purpose of repurchasing fund shares, costs of preferred shares, certain expenses related to regulatory filings and extraordinary expenses.
| Clough Global Funds | Notes to Financial Statements |
April 30, 2022 (Unaudited)
Both Clough and ALPS are considered to be “affiliates” of the Funds as defined in the 1940 Act.
6. COMMITTED FACILITY AGREEMENT AND LENDING AGREEMENT
Each Fund entered into a financing package that includes a Committed Facility Agreement (the “Agreement”) dated January 16, 2009, as amended, between each Fund and BNP Paribas Prime Brokerage, Inc. (“BNP”) that allows each Fund to borrow funds from BNP. Each Fund entered a Special Custody and Pledge Agreement (the “Pledge Agreement”) dated December 9, 2013, as amended, between each Fund, the Funds’ custodian, and BNP. As of October 31, 2016, the Pledge Agreement was assigned from BNP to BNP Paribas Prime Brokerage International, Ltd. Per the Pledge Agreement, borrowings under the Agreement are secured by assets of each Fund that are held by the Fund’s custodian in a separate account (the “pledged collateral”). On April 30, 2022, the pledged collateral was valued at $112,454,525, $237,979,058 and $463,484,584 for the Clough Global Dividend and Income Fund, Clough Global Equity Fund and Clough Global Opportunities Fund, respectively. Each Fund may, with 30 days notice, reduce the Maximum Commitment Financing (Initial Limit amount plus the increased borrowing amount in excess of the Initial Limit) to a lesser amount if drawing on the full amount would result in a violation of the applicable asset coverage requirement of Section 18 of the 1940 Act. Interest is charged at the three month LIBOR (London Inter-bank Offered Rate) plus 0.70% on the amount borrowed and 0.65% on the undrawn balance. Each Fund also pays a one-time arrangement fee of 0.25% on (i) the Initial Limit and (ii) any increased borrowing amount in the excess of the Initial Limit, paid in monthly installments for the year immediately following the date on which borrowings were drawn by the Fund.
The Maximum Commitment Financing allowed under the Agreement is $63,300,000, $139,500,000 and $257,000,000 for the Clough Global Dividend and Income Fund, Clough Global Equity Fund and the Clough Global Opportunities Fund, respectively. For the six months ended April 30, 2022, the average borrowings outstanding for Clough Global Dividend and Income Fund, Clough Global Equity Fund and Clough Global Opportunities Fund under the agreement were $63,261,033, $139,323,744 and $256,249,682, respectively, and the average interest rate for the borrowings was 1.19%. As of April 30, 2022, the outstanding borrowings for Clough Global Dividend and Income Fund, Clough Global Equity Fund and Clough Global Opportunities Fund were $63,300,000, $139,500,000 and $257,000,000, respectively. The interest rate applicable to the borrowings of Clough Global Dividend and Income Fund, Clough Global Equity Fund and Clough Global Opportunities Fund on April 30, 2022, was 1.99%.
The Lending Agreement is a separate side-agreement between each Fund and BNP pursuant to which BNP may borrow a portion of the pledged collateral (the “Lent Securities”) in an amount not to exceed the outstanding borrowings owed by a Fund to BNP under the Agreement. The Lending Agreement is intended to permit each Fund to significantly reduce the cost of its borrowings under the Agreement. BNP has the ability to re-register the Lent Securities in its own name or in another name other than the Fund to pledge, re-pledge, sell, lend or otherwise transfer or use the collateral with all attendant rights of ownership. (It is each Fund’s understanding that BNP will perform due diligence to determine the creditworthiness of any party that borrows Lent Securities from BNP.) Each Fund may designate any security within the pledged collateral as ineligible to be a Lent Security, provided there are eligible securities within the pledged collateral in an amount equal to the outstanding borrowing owed by a Fund. During the year in which the Lent Securities are outstanding, BNP must remit payment to each Fund equal to the amount of all dividends, interest or other distributions earned or made by the Lent Securities.
Under the terms of the Lending Agreement, the Lent Securities are marked to market daily, and if the value of the Lent Securities exceeds the value of the then-outstanding borrowings owed by a Fund to BNP under the Agreement (the “Current Borrowings”), BNP must, on that day, either (1) return Lent Securities to each Fund’s custodian in an amount sufficient to cause the value of the outstanding Lent Securities to equal the Current Borrowings; or (2) post cash collateral with each Fund’s custodian equal to the difference between the value of the Lent Securities and the value of the Current Borrowings. If BNP fails to perform either of these actions as required, each Fund will recall securities, as discussed below, in an amount sufficient to cause the value of the outstanding Lent Securities to equal the Current Borrowings. Each Fund can recall any of the Lent Securities and BNP shall, to the extent commercially possible, return such security or equivalent security to each Fund’s custodian no later than three business days after such request. If a Fund recalls a Lent Security pursuant to the Lending Agreement, and BNP fails to return the Lent Securities or equivalent securities in a timely fashion, BNP shall remain liable for the ultimate delivery to each Fund’s custodian of such Lent Securities, or equivalent securities, and for any buy-in costs that the executing broker for the sales transaction may impose with respect to the failure to deliver. Should the borrower of the securities fail financially, the Funds have the right to reduce the outstanding amount of the Current Borrowings against which the pledged collateral has been secured. Although risk is mitigated by the collateral, the Funds could experience a delay in recovering their securities and possible loss of income or value if the borrower fails to return the borrowed securities. Under the terms of the Lending Agreement, each Fund shall have the right to apply and set-off an amount equal to one hundred percent (100%) of the then current fair value of such Lent Securities against the Current Borrowings. As of April 30, 2022, the value of the Lent Securities for Clough Global Dividend and Income Fund, Clough Global Equity Fund and Clough Global Opportunities Fund were $55,719,214, $118,131,383 and $226,732,335, respectively.
| Semi-Annual Report | April 30, 2022 | 65 |
| Clough Global Funds | Notes to Financial Statements |
April 30, 2022 (Unaudited)
The Board has approved each Agreement and the Lending Agreement. No violations of the Agreement or the Lending Agreement have occurred during the six months ended April 30, 2022.
Each Fund receives income from BNP based on the value of the Lent Securities. This income is recorded as Hypothecated securities income on the Statements of Operations. The interest incurred on borrowed amounts is recorded as Interest on loan in the Statements of Operations, a part of Total Expenses.
On July 27, 2017, the Chief Executive of the UK Financial Conduct Authority (“FCA”), which regulates LIBOR, announced that the FCA will no longer persuade nor require banks to submit rates for the calculation of LIBOR after 2021. Such announcement indicates that the continuation of LIBOR on the current basis cannot and will not be guaranteed after 2021. Prior to 2021, it is expected that market participants will focus on the transition mechanisms by which references to LIBOR in existing contracts or instruments may be amended. When LIBOR is discontinued, the successor reference rate may be lower or higher than market expectations. This may cause the Funds to pay more or less interest on borrowings and could impact the Funds’ performance or NAV.
7. SUBSEQUENT EVENTS
Subsequent events after the date of the Statement of Assets and Liabilities have been evaluated through the date the financial statements were issued. Management has determined that no events or transactions occurred requiring adjustment or disclosure in the financial statements.
| Clough Global Funds | Dividend Reinvestment Plan |
April 30, 2022 (Unaudited)
Unless the registered owner of Common Shares elects to receive cash by contacting DST Systems, Inc. (the “Plan Administrator”), all dividends declared on Common Shares will be automatically reinvested by the Plan Administrator for shareholders in each Fund’s Dividend Reinvestment Plan (the “Plan”), in additional Common Shares. Shareholders who elect not to participate in the Plan will receive all dividends and other distributions in cash paid by check mailed directly to the shareholder of record (or, if the Common Shares are held in street or other nominee name, then to such nominee) by the Plan Administrator as dividend disbursing agent. You may elect not to participate in the Plan and to receive all dividends in cash by contacting the Plan Administrator, as dividend disbursing agent, at the address set forth below. Participation in the Plan is completely voluntary and may be terminated or resumed at any time without penalty by notice if received and processed by the Plan Administrator prior to the dividend record date; otherwise such termination or resumption will be effective with respect to any subsequently declared dividend or other distribution. Some brokers may automatically elect to receive cash on your behalf and may re–invest that cash in additional Common Shares for you. If you wish for all dividends declared on your Common Shares to be automatically reinvested pursuant to the Plan, please contact your broker.
The Plan Administrator will open an account for each Common Shareholder under the Plan in the same name in which such Common Shareholder’s Common Shares are registered. Whenever a Fund declares a dividend or other distribution (together, a “Dividend”) payable in cash, non–participants in the Plan will receive cash and participants in the Plan will receive the equivalent in Common Shares. The Common Shares will be acquired by the Plan Administrator for the participants’ accounts, depending upon the circumstances described below, either (i) through receipt of additional unissued but authorized Common Shares from a Fund (“Newly Issued Common Shares”) or (ii) by purchase of outstanding Common Shares on the open market (“Open–Market Purchases”) on the American Stock Exchange or elsewhere. If, on the payment date for any Dividend, the closing market price plus estimated brokerage commissions per Common Share is equal to or greater than the net asset value per Common Share, the Plan Administrator will invest the Dividend amount in Newly Issued Common Shares on behalf of the participants. The number of Newly Issued Common Shares to be credited to each participant’s account will be determined by dividing the dollar amount of the Dividend by the net asset value per Common Share on the payment date; provided that, if the net asset value is less than or equal to 95% of the closing market value on the payment date, the dollar amount of the Dividend will be divided by 95% of the closing market price per Common Share on the payment date. If, on the payment date for any Dividend, the net asset value per Common Share is greater than the closing market value plus estimated brokerage commissions, the Plan Administrator will invest the Dividend amount in Common Shares acquired on behalf of the participants in Open–Market Purchases. In the event of a market discount on the payment date for any Dividend, the Plan Administrator will have until the last business day before the next date on which the Common Shares trade on an “ex–dividend” basis or 30 days after the payment date for such Dividend, whichever is sooner (the “Last Purchase Date”), to invest the Dividend amount in Common Shares acquired in Open–Market Purchases. If, before the Plan Administrator has completed its Open–Market Purchases, the market price per Common Share exceeds the net asset value per Common Share, the average per Common Share purchase price paid by the Plan Administrator may exceed the net asset value of the Common Shares, resulting in the acquisition of fewer Common Shares than if the Dividend had been paid in Newly Issued Common Shares on the Dividend payment date. Because of the foregoing difficulty with respect to Open–Market Purchases, the Plan provides that if the Plan Administrator is unable to invest the full Dividend amount in Open–Market Purchases during the purchase period or if the market discount shifts to a market premium during the purchase period, the Plan Administrator may cease making Open–Market Purchases and may invest the uninvested portion of the Dividend amount in Newly Issued Common Shares at the net asset value per Common Share at the close of business on the Last Purchase Date provided that, if the net asset value is less than or equal to 95% of the then current market price per Common Share; the dollar amount of the Dividend will be divided by 95% of the market price on the payment date.
The Plan Administrator maintains all shareholders’ accounts in the Plan and furnishes written confirmation of all transactions in the accounts, including information needed by shareholders for tax records. Common Shares in the account of each Plan participant will be held by the Plan Administrator on behalf of the Plan participant, and each shareholder proxy will include those shares purchased or received pursuant to the Plan. The Plan Administrator will forward all proxy solicitation materials to participants and vote proxies for shares held under the Plan in accordance with the instructions of the participants.
In the case of Common Shareholders such as banks, brokers or nominees which hold shares for others who are the beneficial owners, the Plan Administrator will administer the Plan on the basis of the number of Common Shares certified from time to time by the record shareholder’s name and held for the account of beneficial owners who participate in the Plan.
There will be no brokerage charges with respect to Common Shares issued directly by a Fund. However, each participant will pay a pro rata share of brokerage commissions incurred in connection with Open–Market Purchases. The automatic reinvestment of Dividends will not relieve participants of any federal, state or local income tax that may be payable (or required to be withheld) on such Dividends. Participants that request a sale of Common Shares through the Plan Administrator are subject to brokerage commissions.
Each Fund reserves the right to amend or terminate the Plan. There is no direct service charge to participants with regard to purchases in the Plan; however, each Fund reserves the right to amend the Plan to include a service charge payable by the participants.
All correspondence or questions concerning the Plan should be directed to the Plan Administrator, DST Systems, Inc., 333 West 11th Street, 5th Floor, Kansas City, Missouri 64105.
| Semi-Annual Report | April 30, 2022 | 67 |
| Clough Global Funds | Additional Information |
April 30, 2022 (Unaudited)
FUND PROXY VOTING POLICIES & PROCEDURES
Each Fund’s policies and procedures used in determining how to vote proxies relating to portfolio securities are available on the Funds’ website at http://www.cloughglobal.com. Information regarding how each Fund voted proxies relating to portfolio securities held by each Fund for the period ended June 30, are available without charge, upon request, by contacting the Funds at 1-855-425-6844 and on the Commission’s website at http://www.sec.gov.
PORTFOLIO HOLDINGS
The Funds file their complete schedule of portfolio holdings with the Commission for each fiscal quarter on Form N-PORT within 60 days after the end of the period. Copies of the Funds’ Form N-PORT are available without a charge, upon request, by contacting the Funds at 1-855-425-6844 and on the Commission’s website at http://www.sec.gov.
NOTICE
Notice is hereby given in accordance with Section 23(c) of the Investment Company Act of 1940 that each Fund may purchase at market prices from time to time shares of its common stock in the open market.
SECTION 19(A) NOTICES
The following table sets forth the estimated amount of the sources of distribution for purposes of Section 19 of the Investment Company Act of 1940, as amended, and the related rules adopted there under. Each Fund estimates the following percentages, of the total distribution amount per share, attributable to (i) current and prior fiscal year net investment income, (ii) net realized short-term capital gain, (iii) net realized long-term capital gain and (iv) return of capital or other capital source as a percentage of the total distribution amount. These percentages are disclosed for the fiscal year-to-date cumulative distribution amount per share for each Fund.
The amounts and sources of distributions reported in these 19(a) notices are only estimates and not for tax reporting purposes. The actual amounts and sources of the amounts for tax reporting purposes will depend upon the Fund’s investment experience during the remainder of its fiscal year and may be subject to changes based on tax regulations. The Fund will send you a Form 1099-DIV for the calendar year that will tell you how to report these distributions for federal income tax purposes.
| | | Total Cumulative Distributions for the period ended April 30, 2022 | | | % Breakdown of the Total Cumulative Distributions for the period ended April 30, 2022 | |
| | | Net
Investment
Income | | | Net
Realized
Capital
Gains | | | Return of
Capital | | | Total Per
Common
Share | | | Net
Investment
Income | | | Net
Realized
Capital
Gains | | | Return of
Capital | | | Total Per
Common
Share | |
| Clough Global Dividend and Income Fund | | $ | 0.0178 | | | $ | 0.0499 | | | $ | 0.4881 | | | $ | 0.5558 | | | | 3.17 | % | | | 8.88 | % | | | 87.95 | % | | | 100.00 | % |
| Clough Global Equity Fund | | $ | – | | | $ | 0.7330 | | | $ | – | | | $ | 0.7330 | | | | – | | | | 100.00 | % | | | – | | | | 100.00 | % |
| Clough Global Opportunities Fund | | $ | – | | | $ | 0.5946 | | | $ | – | | | $ | 0.5946 | | | | – | | | | 100.00 | % | | | – | | | | 100.00 | % |
Each Fund’s dividend policy is to distribute all or a portion of its net investment income to its shareholders on a monthly basis. In order to provide shareholders with a more stable level of dividend distributions, each Fund may at times pay out less than the entire amount of net investment income earned in any particular month and may at times in any particular month pay out such accumulated but undistributed income in addition to net investment income earned in that month. As a result, the dividends paid by each Fund for any particular month may be more or less than the amount of net investment income earned by the Fund during such month. Each Fund’s current accumulated but undistributed net investment income, if any, is disclosed in the Statements of Assets and Liabilities, which comprises part of the financial information included in this report.
| Clough Global Funds | Investment Advisory Agreement Approval |
April 30, 2022 (Unaudited)
On April 14, 2022, the Board of Trustees (the “Board” or the “Trustees”) of each of Clough Global Dividend and Income Fund (“GLV”), Clough Global Equity Fund (“GLQ”) and Clough Global Opportunities Fund (“GLO” and together with GLV and GLQ, each, a “Fund” and collectively, the “Funds”) met to, among other things, review and consider the renewal of the Investment Advisory Agreements between each Fund and Clough (each, an “Advisory Agreement” and collectively, the “Advisory Agreements”). During their review of each Advisory Agreement, the Trustees, including the Trustees who are not “interested persons” of the Fund (the “Independent Trustees”), as that term is defined in the Investment Company Act of 1940, as amended (the “1940 Act”), considered all factors that it believed to be relevant, including those discussed below. The Board did not identify any one factor as dispositive, and each Board member may have attributed different weights to the factors considered.
Prior to the beginning of their review of the Advisory Agreements, counsel to the Funds, who also serves as independent counsel to the Independent Trustees, discussed with the Trustees their role and fiduciary responsibilities in general and also specifically under the 1940 Act with respect to the renewal of each Advisory Agreement.
Representatives from Clough discussed Clough’s materials relating to the Trustees’ consideration of renewal of the Advisory Agreements. It was noted that included in the Board materials were responses by Clough to a request letter prepared by legal counsel on behalf of the Independent Trustees to the Funds to assist the Board in evaluating whether to renew the Advisory Agreements (the “15(c) Materials”). It was also noted that the 15(c) Materials were extensive, and included information relating to: each Fund’s investment results, portfolio composition, advisory fee and expense comparisons and profitability to Clough; financial information regarding Clough; descriptions of policies, including compliance monitoring and portfolio trading practices; information about the personnel providing investment management services to the Funds; and the nature of services provided under each Advisory Agreement. In addition, the Independent Trustees considered information provided to them at prior Board meetings in presentations from Clough Capital representatives.
The Board considered the organizational structure and business operations of Clough. The Board also considered the qualifications of Clough and its principals to act as each Fund’s investment adviser. The Board considered the professional experience of the portfolio managers, Charles I. Clough, Jr. and Robert M. Zdunczyk, (collectively, the “Portfolio Managers”), emphasizing that each of the Portfolio Managers had substantial experience as an investment professional. The Trustees acknowledged their familiarity with the expertise and standing in the investment community of the Portfolio Managers, and their satisfaction with the expertise of Clough and the services provided by Clough to the Funds. The Trustees concluded that the portfolio management team was well qualified to serve the Funds in those functions.
The Board considered various investment products managed by Clough other than the Funds. The Board also considered the adequacy of Clough’s facilities. The Trustees concluded that Clough appeared to have adequate procedures and personnel in place to ensure compliance by Clough with applicable law and with each Fund’s investment objectives and restrictions.
The Board considered the terms of the Advisory Agreements, pursuant to which Clough receives a fee of 0.70%, 0.90% and 1.00% based on the average daily total assets of Clough Global Dividend and Income Fund, Clough Global Equity Fund and Clough Global Opportunities Fund, respectively. The Trustees considered the fees charged by Clough to other clients for which it provides comparable service, Clough’s balance sheet for the year ended December 31, 2021, and a profit and loss analysis as it relates to Clough’s advisory business.
The Board considered Clough’s procedures relating to compliance and oversight, a copy of which was included in the Board materials. The Board further considered information provided by Clough on whether Clough has experienced or anticipates it may experience conflicts of interest in managing the Funds. The Board considered that the materials contained information regarding Clough’s business continuity and disaster recovery plans as well as steps Clough has undertaken to reasonably detect and prevent cybersecurity crimes. The Board also considered information related to Clough’s trading activities and how Clough monitors best execution. The Board considered the possible benefits Clough may accrue because of its relationship with the Funds as well as potential benefits that accrue to the Funds because of their relationship with Clough. The Board considered that, other than soft dollar arrangements, Clough does not realize any direct benefits due to the allocation of brokerage and related transactions on behalf of the Funds.
The Board considered materials regarding the comparability of the investment advisory fees of the Funds with the investment advisory fees of other investment companies (each, an “Expense Group”), which had been prepared by Strategic Insight, an Asset International Company (“Strategic Insight”). The Board also considered information in the Strategic Insight report regarding each Fund’s investment performance as well as comparisons of each Fund’s performance with the performance during similar periods of other funds in its Expense Group and comparisons of cost and expense structures of each Fund with the cost and expense structures of other funds in the relevant Expense Group, and related matters.
The Board took into consideration that the Funds may be unique in the registered fund marketplace and that Strategic Insight had a difficult time presenting a large peer group for comparison. For each Fund, the Board considered fees from other leveraged closed-end investment companies that Strategic Insight classified as “global funds” (as well as funds that Clough recommended be included) versus Clough Global Dividend and Income Fund’s, Clough Global Equity Fund’s and Clough Global Opportunities Fund’s fees as part of the expense group (the “Expense Group”). The Board considered the extent to which each Fund utilizes leverage and short sales, thereby increasing its investment-related expenses and concluded that the use of leverage and short sales is an important part of each Fund’s investment strategy to attempt to meet each Fund’s investment objective. The Board also considered that investment related expenses should be viewed as operational in nature and should not be considered a management expense. The Board further considered that Strategic Insight defined investment related expenses to include, but not be limited to, dividends on securities sold short, interest expense, reverse repurchase agreements, swaps, tender costs, and auction fees.
| Semi-Annual Report | April 30, 2022 | 69 |
| Clough Global Funds | Investment Advisory Agreement Approval |
April 30, 2022 (Unaudited)
For GLV, the Board considered that the investment advisory fee for managed assets in the Expense Group ranged from GLV’s low of 0.700% to 0.950%. For GLV, the Board also considered that as reported by Strategic Insight, the net total expense ratio for the Expense Group on managed assets, excluding investment related expenses, ranged from a low of 0.981% to 1.339%, with a median of 1.084% and GLV at 1.078%.
For GLQ, the Board considered that the investment advisory fee for managed assets in the Expense Group ranged from 0.395% to 1.000%, with GLQ at 0.900%. For GLQ, the Board also considered that as reported by Strategic Insight, the net total expense ratio for the Expense Group on managed assets, excluding investment related expenses, ranged from 0.712% to 1.557%, with a median of 1.119% and GLQ at 1.263%.
For GLO, the Board considered that the investment advisory fee for managed assets in the Expense Group ranged from 0.395% to 1.000%, with GLO at 1.000%. For GLO, the Board also considered that as reported by Strategic Insight, the net total expense ratio for the Expense Group on managed assets, excluding investment related expenses, ranged from 0.712% to 1.342%, with a median of 1.098% and GLO at 1.342%.
The Trustees took into consideration each Fund’s performance as compared to the performance of each Fund’s Expense Group for the one year ended February 22, 2022.
| • | For GLV, the one year net total return performance data for GLV’s Expense Group ranged from a high of 21.10% to a low of -7.72% with a median of 5.34%. GLV’s performance was -7.72%. |
| • | For GLQ, the one year net total return performance data for GLQ’s Expense Group ranged from a high of 31.95% to a low of -14.74% with a median of 9.84%. GLQ’s performance was -14.74%. |
| • | For GLO, the one year total return performance data for GLO’s Expense Group ranged from a high of 25.47% to a low of -23.61% with a median of 5.74%. GLO’s performance was -23.61%. |
The Trustees also considered each Fund’s performance as compared to the performance of each Fund’s Expense Group for the one year ended December 31, 2021.
| • | For GLV, the 2021 annual net total return performance data for GLV’s Expense Group ranged from a high of 20.66% to a low of 2.80% with a median of 13.69% and GLV at 2.80%. |
| • | For GLQ, the 2021 annual net total return performance data for GLQ’s Expense Group ranged from a high of 34.46% to a low of -5.01% with a median of 20.87% and GLQ at -5.01%. |
| • | For GLO, the 2021 annual net total return performance data for GLO’s Expense Group ranged from a high of 31.15% to a low of -4.93% with a median of 18.87% and GLO at -4.93%. |
The Trustees also considered the profit and loss information on each Fund provided by Clough.
The Independent Trustees met in executive session and with the assistance of legal counsel reviewed and discussed in more detail the information that had been presented relating to Clough, the Advisory Agreements and Clough’s profitability.
After executive session, the Board of Trustees of the Fund, present in person, with the Independent Trustees present in person voting separately, unanimously concluded that the investment advisory fee of 0.70% of Clough Global Dividend and Income Fund’s total assets, 0.90% of Clough Global Equity Fund’s total assets and 1.00% of Clough Global Opportunities Fund’s total assets are fair and reasonable for each respective Fund and that the renewal of each Advisory Agreement is in the best interests of each respective Fund and its shareholders.
Page Intentionally Left Blank

Item 2. Code of Ethics.
Not applicable to semi-annual report.
Item 3. Audit Committee Financial Expert.
Not applicable to semi-annual report.
Item 4. Principal Accountant Fees and Services.
Not applicable to semi-annual report.
Item 5. Audit Committee of Listed Registrants.
Not applicable to semi-annual report.
Item 6. Investments.
| (a) | Schedule I – Investments in securities of unaffiliated issuers is included as part of the Report to Stockholders filed under Item 1 of this form. |
| (b) | Not applicable to the Registrant. |
Item 7. Disclosure of Proxy Voting Policies and Procedures for Closed-End Management Investment Companies.
Not applicable to semi-annual report.
Item 8. Portfolio Managers of Closed-End Management Investment Companies.
| (a) | Not applicable to semi-annual report. |
Item 9. Purchases of Equity Securities by Closed-End Management Investment Companies and Affiliated Purchasers.
Not applicable.
Item 10. Submission of Matters to a Vote of Security Holders.
There have been no material changes by which shareholders may recommend nominees to the Board of Trustees.
Item 11. Controls and Procedures.
| (a) | The Registrant’s principal executive officer and principal financial officer have concluded that the Registrant’s disclosure controls and procedures (as defined in Rule 30a-3(c) under the Investment Company Act of 1940, as amended) are effective based on their evaluation of these controls and procedures as of a date within 90 days of the filing date of this document. |
| (b) | There was no change in the Registrant's internal control over financial reporting (as defined in Rule 30a-3(d) under the Investment Company Act of 1940, as amended) during the period covered by this report that has materially affected, or is reasonably likely to materially affect, the Registrant's internal control over financial reporting. |
Item 12. Disclosure of Securities Lending Activities for Closed-End Management Investment Companies.
Not applicable to semi-annual report.
Item 13. Exhibits.
(a)(1) Not applicable to semi-annual report.
(a)(2) The certifications required by Rule 30a-2(a) of the Investment Company Act of 1940, as amended are attached hereto as Ex-99.Cert.
(a)(3) Not applicable.
(a)(4) Not applicable.
SIGNATURES
Pursuant to the requirements of the Securities Exchange Act of 1934 and the Investment Company Act of 1940, the Registrant has duly caused this report to be signed on its behalf by the undersigned, thereunto duly authorized.
CLOUGH GLOBAL DIVIDEND AND INCOME FUND
| By: | /s/ Dawn Cotten | |
| | Dawn Cotten | |
| | President/Principal Executive Officer | |
Pursuant to the requirements of the Securities Exchange Act of 1934 and the Investment Company Act of 1940, this report has been signed below by the following persons on behalf of the Registrant and in the capacities and on the dates indicated.
CLOUGH GLOBAL DIVIDEND AND INCOME FUND
| By: | /s/ Dawn Cotten | |
| | Dawn Cotten | |
| | President/Principal Executive Officer | |
| By: | /s/ Ryan Johanson | |
| | Ryan Johanson | |
| | Treasurer/Principal Financial Officer | |