UNITED STATES
SECURITIES AND EXCHANGE COMMISSION
Washington, D.C. 20549
Form N-CSR
CERTIFIED SHAREHOLDER REPORT OF REGISTERED
MANAGEMENT INVESTMENT COMPANIES
Investment Company Act File Number: 811-21574
Eaton Vance Floating-Rate Income Trust
(Exact Name of Registrant as Specified in Charter)
Two International Place, Boston, Massachusetts 02110
(Address of Principal Executive Offices)
Deidre E. Walsh
Two International Place, Boston, Massachusetts 02110
(Name and Address of Agent for Services)
(617) 482-8260
(Registrant’s Telephone Number)
May 31
Date of Fiscal Year End
May 31, 2021
Date of Reporting Period
| Item 1. | Reports to Stockholders |

Eaton Vance
Floating-Rate Income Trust (EFT)
Annual Report
May 31, 2021

Commodity Futures Trading Commission Registration. The Commodity Futures Trading Commission (“CFTC”) has adopted regulations that subject registered investment companies and advisers to regulation by the CFTC if a fund invests more than a prescribed level of its assets in certain CFTC-regulated instruments (including futures, certain options and swap agreements) or markets itself as providing investment exposure to such instruments. The investment adviser has claimed an exclusion from the definition of “commodity pool operator” under the Commodity Exchange Act with respect to its management of the Fund. Accordingly, neither the Fund nor the adviser with respect to the operation of the Fund is subject to CFTC regulation. Because of its management of other strategies, the Fund’s adviser is registered with the CFTC as a commodity pool operator. The adviser is also registered as a commodity trading advisor.
Fund shares are not insured by the FDIC and are not deposits or other obligations of, or guaranteed by, any depository institution. Shares are subject to investment risks, including possible loss of principal invested.
Annual Report May 31, 2021
Eaton Vance
Floating-Rate Income Trust
Eaton Vance
Floating-Rate Income Trust
May 31, 2021
Management’s Discussion of Fund Performance1
Economic and Market Conditions
Amid a global recovery from the pandemic-induced sell-off that had engulfed equity and credit markets in March 2020, senior loans displayed their value as a portfolio diversifier by outperforming the majority of U.S. fixed-income asset classes for the 12-month period ended May 31, 2021 — including government debt and investment-grade corporate bonds.
As the period opened on June 1, 2020, senior loans were in the midst of a rally that had begun the last week of March, as central banks around the world stepped in to support capital markets. The U.S. Federal Reserve (the Fed) had cut its benchmark federal funds rate to 0.00%-0.25%, initiated a significant bond-buying program, and announced other policy measures to help credit markets worldwide.
The loan rally continued through the summer and fall of 2020, as senior loans offered attractive spreads versus other asset classes in a yield-starved environment. In the closing months of the year, the easing of political uncertainties with the election of Joe Biden as president, coupled with the emergency use approval and initial rollout of two COVID-19 vaccines, added further fuel to the rally.
Except for a pause in March 2021, when returns were flat, the loan rally continued into the new year. A massive fiscal stimulus package passed by the U.S. Congress, a still-accommodative set of monetary policies at the Fed, the ongoing rollout of vaccines, and the re-opening of U.S. businesses all provided tailwinds for the asset class through the end of the period.
Technical factors also bolstered loan performance as demand outpaced supply for much of the period. Contributing factors included an increase in institutional demand for structured loan products and a return to net monthly inflows for retail funds in December 2020, for the first time since the previous January. Retail funds continued to experience monthly net inflows from the beginning of 2021 through the end of the period on May 31.
Issuer fundamentals improved during the period as well, with the trailing 12-month default rate falling from 3.14% at the beginning of the period — approximately the market’s long-term average — to 1.73% at period-end. Reflecting the improved economic environment, the average price of loans rose over 10% during the one-year period, ending the period at $98.08 on May 31, 2021.
For the period as a whole, lower-quality loans outperformed higher-quality issues, with BBB, BB, B, CCC and D-rated (defaulted) loans in the S&P/LSTA Leveraged Loan Index (the Index), a broad measure of the asset class, returning 5.50%, 7.31%, 12.59%, 34.64% and 11.44%, respectively, and the Index overall returning 12.54% for the one-year period.
Fund Performance
For the 12-month period ended May 31, 2021, Eaton Vance Floating-Rate Income Trust (the Fund) returned 18.25% at net asset value of its common shares (NAV), outperforming the 12.54% return of the Index.
Under normal market conditions, the Fund invests at least 80% of its total assets in senior loans of domestic and foreign borrowers that are denominated in U.S. dollars and foreign currencies. The Fund has historically tended to underweight lower-quality loans relative to the Index — a strategy that may help the Fund experience limited credit losses over time, but may detract from relative performance versus the Index during periods when lower-quality issues outperform.
The Fund’s allocation to collateralized loan obligation (CLO) debt contributed to Fund performance versus the Index during the period, as CLO prices benefited from strong demand from institutional investors, particularly in the first quarter of 2021. Loan selections in the cable and satellite television, home furnishings, and drugs sectors helped relative performance as well, as did an underweight position, relative to the Index, in the weak-performing utilities sector. With regard to credit rating categories, loan selections within the BB category were an additional contributor to returns versus the Index.
The Fund’s employment of investment leverage also contributed to performance versus the Index. The use of leverage has the effect of achieving additional exposure to the loan market, and thus magnifying exposure to the Fund’s underlying investments in both up and down market environments. The use of leverage helped performance versus the Index, which does not employ leverage, as leverage amplified both the price appreciation and interest payments of loans in the Fund’s underlying portfolio during the period.
In contrast, the Fund’s higher-quality positioning detracted from performance versus the Index during a period when lower-quality loans in general outperformed higher-quality loans. In particular, the Fund’s underweight position relative to the Index in CCC rated loans — which were the best-performing credit rating in the Index during the period — hurt relative returns.
Loan selections in the oil and gas, business equipment and services, and retailers (except food and drug) sectors also detracted from relative Fund performance, as did underweight positions in the retailers (except food and drug) and air transport sectors. The retailers (except food and drug) and air transport sectors performed strongly in the latter half of the period, as pandemic restrictions eased and Americans began to shop and travel again. Loan selections within the B and CCC credit rating categories hurt relative performance during the period as well.
See Endnotes and Additional Disclosures in this report.
Past performance is no guarantee of future results. Returns are historical and are calculated net of management fees and other expenses by determining the percentage change in net asset value (NAV) or market price (as applicable) with all distributions reinvested in accordance with the Fund’s Dividend Reinvestment Plan. Performance at market price will differ from performance at NAV due to variations in the Fund’s market price versus NAV, which may reflect factors such as fluctuations in supply and demand for Fund shares, changes in Fund distributions, shifting market expectations for the Fund’s future returns and distribution rates, and other considerations affecting the trading prices of closed-end funds. Investment return and principal value will fluctuate so that shares, when sold, may be worth more or less than their original cost. Performance for periods less than or equal to one year is cumulative. Performance is for the stated time period only; due to market volatility, current Fund performance may be lower or higher than the quoted return. For performance as of the most recent month-end, please refer to eatonvance.com.
Eaton Vance
Floating-Rate Income Trust
May 31, 2021
Performance2,3
Portfolio Managers Ralph H. Hinckley, CFA, Andrew N. Sveen, CFA, Catherine C. McDermott, William E. Holt, CFA and Daniel P. McElaney, CFA
| | | | | | | | | | | | | | | | |
| % Average Annual Total Returns | | Inception Date | | | One Year | | | Five Years | | | Ten Years | |
| | | | |
Fund at NAV | | | 06/29/2004 | | | | 18.25 | % | | | 6.31 | % | | | 5.65 | % |
Fund at Market Price | | | — | | | | 34.36 | | | | 7.56 | | | | 5.12 | |
|
| |
| | | | |
S&P/LSTA Leveraged Loan Index | | | — | | | | 12.54 | % | | | 4.91 | % | | | 4.31 | % |
| | | | |
| % Premium/Discount to NAV4 | | | | | | | | | | | | |
| | | | |
| | | | | | | | | | | | | | | –1.99 | % |
| | | | |
| Distributions5 | | | | | | | | | | | | |
| | | | |
Total Distributions per share for the period | | | | | | | | | | | | | | $ | 0.733 | |
Distribution Rate at NAV | | | | | | | | | | | | | | | 5.02 | % |
Distribution Rate at Market Price | | | | | | | | | | | | | | | 5.13 | |
| | | | |
| % Total Leverage6 | | | | | | | | | | | | |
| | | | |
Borrowings | | | | | | | | | | | | | | | 27.45 | % |
Variable Rate Term Preferred Shares (VRTP Shares) | | | | | | | | | | | | | | | 8.79 | |
See Endnotes and Additional Disclosures in this report.
Past performance is no guarantee of future results. Returns are historical and are calculated net of management fees and other expenses by determining the percentage change in net asset value (NAV) or market price (as applicable) with all distributions reinvested in accordance with the Fund’s Dividend Reinvestment Plan. Performance at market price will differ from performance at NAV due to variations in the Fund’s market price versus NAV, which may reflect factors such as fluctuations in supply and demand for Fund shares, changes in Fund distributions, shifting market expectations for the Fund’s future returns and distribution rates, and other considerations affecting the trading prices of closed- end funds. Investment return and principal value will fluctuate so that shares, when sold, may be worth more or less than their original cost. Performance for periods less than or equal to one year is cumulative. Performance is for the stated time period only; due to market volatility, current Fund performance may be lower or higher than the quoted return. For performance as of the most recent month-end, please refer to eatonvance.com.
Eaton Vance
Floating-Rate Income Trust
May 31, 2021
Fund Profile
Top 10 Issuers (% of total investments)7
| | | | |
| |
TransDigm, Inc. | | | 1.2 | % |
| |
Hyland Software, Inc. | | | 1.1 | |
| |
Mallinckrodt International Finance S.A. | | | 0.9 | |
| |
Virgin Media SFA Finance Limited | | | 0.8 | |
| |
CenturyLink, Inc. | | | 0.8 | |
| |
Informatica, LLC | | | 0.8 | |
| |
Uber Technologies, Inc. | | | 0.8 | |
| |
Ziggo B.V. | | | 0.7 | |
| |
Tibco Software, Inc. | | | 0.7 | |
| |
Ultimate Software Group, Inc. (The) | | | 0.7 | |
| |
Total | | | 8.5 | % |
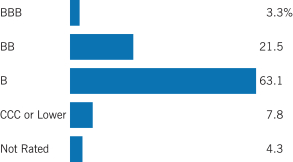
Credit Quality (% of bonds, loans and asset-backed securities)8
Top 10 Sectors (% of total investments)7
| | | | |
| |
Electronics/Electrical | | | 16.3 | % |
| |
Business Equipment and Services | | | 9.6 | |
| |
Health Care | | | 8.9 | |
| |
Chemicals and Plastics | | | 4.9 | |
| |
Industrial Equipment | | | 4.3 | |
| |
Drugs | | | 4.2 | |
| |
Building and Development | | | 4.1 | |
| |
Insurance | | | 4.0 | |
| |
Telecommunications | | | 3.7 | |
| |
Automotive | | | 3.7 | |
| |
Total | | | 63.7 | % |
See Endnotes and Additional Disclosures in this report.
Eaton Vance
Floating-Rate Income Trust
May 31, 2021
Endnotes and Additional Disclosures
| 1 | The views expressed in this report are those of the portfolio manager(s) and are current only through the date stated at the top of this page. These views are subject to change at any time based upon market or other conditions, and Eaton Vance and the Fund(s) disclaim any responsibility to update such views. These views may not be relied upon as investment advice and, because investment decisions are based on many factors, may not be relied upon as an indication of trading intent on behalf of any Eaton Vance fund. This commentary may contain statements that are not historical facts, referred to as “forward looking statements.” The Fund’s actual future results may differ significantly from those stated in any forward looking statement, depending on factors such as changes in securities or financial markets or general economic conditions, the volume of sales and purchases of Fund shares, the continuation of investment advisory, administrative and service contracts, and other risks discussed from time to time in the Fund’s filings with the Securities and Exchange Commission. |
| 2 | S&P/LSTA Leveraged Loan Index is an unmanaged index of the institutional leveraged loan market. S&P/LSTA Leveraged Loan indices are a product of S&P Dow Jones Indices LLC (“S&P DJI”) and have been licensed for use. S&P® is a registered trademark of S&P DJI; Dow Jones® is a registered trademark of Dow Jones Trademark Holdings LLC (“Dow Jones”); LSTA is a trademark of Loan Syndications and Trading Association, Inc. S&P DJI, Dow Jones, their respective affiliates and their third party licensors do not sponsor, endorse, sell or promote the Fund, will not have any liability with respect thereto and do not have any liability for any errors, omissions, or interruptions of the S&P Dow Jones Indices. Unless otherwise stated, index returns do not reflect the effect of any applicable sales charges, commissions, expenses, taxes or leverage, as applicable. It is not possible to invest directly in an index. |
| 3 | Performance results reflect the effects of leverage. Included in the average annual total return at NAV for the ten-year period is the impact of the 2013 tender and repurchase of a portion of the Fund’s Auction Preferred Shares (APS) at 98% of the Fund’s APS per share liquidation preference. Had this transaction not occurred, the total return at NAV would be lower for the Fund. The Fund’s performance for certain periods reflects the effects of expense reductions. Absent these reductions, performance would have been lower. |
| 4 | The shares of the Fund often trade at a discount or premium to their net asset value. The discount or premium may vary over time and may be higher or lower than what is quoted in this report. For up-to-date premium/discount information, please refer to https://funds.eatonvance.com/closed-end-fund-prices.php. |
| 5 | The Distribution Rate is based on the Fund’s last regular distribution per share in the period (annualized) divided by the Fund’s NAV or market price at the end of the period. The Fund’s distributions may be comprised of amounts characterized for federal income tax purposes as qualified and non-qualified ordinary dividends, capital gains and nondividend distributions, also known as return of capital. For additional information about nondividend distributions, please refer to Eaton Vance Closed-End Fund Distribution Notices (19a) posted on our website, eatonvance.com. The Fund will determine the federal income tax character of distributions paid to a shareholder after the end of the calendar year. This is reported on the IRS form 1099-DIV and provided to the shareholder shortly after each year-end. For information about the tax character of distributions made in prior calendar years, please refer to Performance-Tax Character of Distributions on the Fund’s webpage available at eatonvance. com. The Fund’s distributions are determined by the investment adviser based on its current assessment of the Fund’s long-term return potential. Fund distributions may be affected by numerous factors including changes in Fund performance, the cost of financing for leverage, portfolio holdings, realized and projected returns, and other factors. As portfolio and market conditions change, the rate of distributions paid by the Fund could change. |
| 6 | Leverage represents the liquidation value of the Fund’s VRTP Shares and borrowings outstanding as a percentage of Fund net assets applicable to common shares plus VRTP Shares and borrowings outstanding. Use of leverage creates an opportunity for income, but creates risks including greater price volatility. The cost of leverage rises and falls with changes in short-term interest rates. The Fund may be required to maintain prescribed asset coverage for its leverage and may be required to reduce its leverage at an inopportune time. |
| 7 | Excludes cash and cash equivalents. |
| 8 | Credit ratings are categorized using S&P Global Ratings (“S&P”). Ratings, which are subject to change, apply to the creditworthiness of the issuers of the underlying securities and not to the Fund or its shares. Credit ratings measure the quality of a bond based on the issuer’s creditworthiness, with ratings ranging from AAA, being the highest, to D, being the lowest based on S&P’s measures. Ratings of BBB or higher by S&P are considered to be investment-grade quality. Credit ratings are based largely on the ratings agency’s analysis at the time of rating. The rating assigned to any particular security is not necessarily a reflection of the issuer’s current financial condition and does not necessarily reflect its assessment of the volatility of a security’s market value or of the liquidity of an investment in the security. Holdings designated as “Not Rated” (if any) are not rated by S&P. |
Fund profile subject to change due to active management.
Eaton Vance
Floating-Rate Income Trust
May 31, 2021
Endnotes and Additional Disclosures — continued
Important Notice to Shareholders
On August 13, 2020, the Board of Trustees of the Fund amended and restated the Fund’s By-Laws (the “Amended and Restated By-Laws”). The Amended and Restated By-Laws include provisions (the “Control Share Provisions”) pursuant to which, in summary, a shareholder who obtains beneficial ownership of Fund shares in a “Control Share Acquisition” may exercise voting rights with respect to such shares only to the extent the authorization of such voting rights is approved by other shareholders of the Fund. The Control Share Provisions are primarily intended to protect the interests of the Fund and its shareholders by limiting the risk that the Fund will become subject to undue influence by opportunistic hedge funds or other activist investors. The Control Share Provisions do not eliminate voting rights for shares acquired in Control Share Acquisitions, but rather, they entrust the Fund’s other “non-interested” shareholders with determining whether to approve the authorization of voting rights for such shares. Subject to various conditions and exceptions, the Amended and Restated By-Laws define a “Control Share Acquisition” to include an acquisition of Fund shares that, but for the Control Share Provisions, would give the beneficial owner, upon the acquisition of such shares, the ability to exercise voting power in the election of Fund Trustees in any of the following ranges: (i) one-tenth or more, but less than one-fifth of all voting power; (ii) one-fifth or more, but less than one-third of all voting power; (iii) one-third or more, but less than a majority of all voting power; or (iv) a majority or more of all voting power. Share acquisitions prior to August 13, 2020 are excluded from the definition of Control Share Acquisition. This discussion is only a high-level summary of certain aspects of the Control Share Provisions, and is qualified in its entirety by reference to the full Amended and Restated By-Laws. The Amended and Restated By-Laws were filed by the Fund on Form 8-K with the Securities and Exchange Commission and are available at sec.gov.
Eaton Vance
Floating-Rate Income Trust
May 31, 2021
Portfolio of Investments
| | | | | | | | | | |
| Asset-Backed Securities — 6.0% | |
| Security | | | | Principal
Amount
(000’s omitted) | | | Value | |
| | | |
Allegany Park CLO, Ltd., Series 2019-1A, Class E, 6.963%, (3 mo. USD LIBOR + 6.78%), 1/20/33(1)(2) | | | | $ | 850 | | | $ | 853,222 | |
| | | |
Ares LII CLO, Ltd., Series 2019-52A, Class E, 6.734%, (3 mo. USD LIBOR + 6.55%),
4/22/31(1)(2) | | | | | 500 | | | | 500,261 | |
| | | |
Ares XXXIIR CLO, Ltd., Series 2014-32RA, Class D, 6.006%, (3 mo. USD LIBOR + 5.85%), 5/15/30(1)(2) | | | | | 2,000 | | | | 1,964,564 | |
| | | |
Ares XXXIV CLO, Ltd., Series 2015-2A, Class ER, 7.04%, (3 mo. USD LIBOR + 6.85%),
4/17/33(1)(2) | | | | | 1,300 | | | | 1,290,858 | |
| | | |
Bardot CLO, Ltd., Series 2019-2A, Class E, 7.134%, (3 mo. USD LIBOR + 6.95%),
10/22/32(1)(2) | | | | | 1,000 | | | | 1,002,629 | |
| | | |
Benefit Street Partners CLO XIX, Ltd., Series 2019-19A, Class E, 7.204%, (3 mo. USD LIBOR + 7.02%), 1/15/33(1)(2) | | | | | 750 | | | | 750,741 | |
| | | |
Benefit Street Partners CLO XVII, Ltd., Series 2019-17A, Class E, 6.784%, (3 mo. USD LIBOR + 6.60%), 7/15/32(1)(2) | | | | | 1,000 | | | | 1,000,600 | |
| | | |
Benefit Street Partners CLO XVIII, Ltd., Series 2019-18A, Class E, 7.084%, (3 mo. USD LIBOR + 6.90%), 10/15/32(1)(2) | | | | | 1,000 | | | | 1,000,879 | |
| | | |
BlueMountain CLO XXV, Ltd., Series 2019-25A, Class E, 6.884%, (3 mo. USD LIBOR + 6.70%), 7/15/32(1)(2) | | | | | 1,000 | | | | 1,001,024 | |
| | | |
BlueMountain CLO XXVI, Ltd., Series 2019-26A, Class E, 7.888%, (3 mo. USD LIBOR + 7.70%), 10/20/32(1)(2) | | | | | 1,500 | | | | 1,505,587 | |
| | | |
Canyon Capital CLO, Ltd., Series 2019-2A, Class E, 7.334%, (3 mo. USD LIBOR + 7.15%), 10/15/32(1)(2) | | | | | 400 | | | | 401,312 | |
| | | |
Carlyle Global Market Strategies CLO, Ltd.: | | | | | | | | | | |
| | | |
Series 2012-3A, Class DR2, 6.686%, (3 mo. USD LIBOR + 6.50%),
1/14/32(1)(2) | | | | | 1,200 | | | | 1,145,486 | |
| | | |
Series 2015-5A, Class DR, 6.888%, (3 mo. USD LIBOR + 6.70%), 1/20/32(1)(2) | | | | | 500 | | | | 480,872 | |
| | | |
Cedar Funding X CLO, Ltd., Series 2019-10A, Class E, 7.188%, (3 mo. USD LIBOR + 7.00%), 10/20/32(1)(2) | | | | | 1,000 | | | | 1,002,399 | |
| | | |
Fort Washington CLO, Ltd., Series 2019-1A, Class E, 7.438%, (3 mo. USD LIBOR + 7.25%), 10/20/32(1)(2) | | | | | 1,000 | | | | 1,001,996 | |
| | | |
Galaxy XV CLO, Ltd., Series 2013-15A, Class ER, 6.829%, (3 mo. USD LIBOR + 6.65%),
10/15/30(1)(2) | | | | | 1,000 | | | | 993,416 | |
| | | |
Galaxy XXI CLO, Ltd., Series 2015-21A, Class ER, 5.438%, (3 mo. USD LIBOR + 5.25%), 4/20/31(1)(2) | | | | | 1,000 | | | | 956,200 | |
| | | |
Galaxy XXV CLO, Ltd., Series 2018-25A, Class E, 6.126%, (3 mo. USD LIBOR + 5.95%), 10/25/31(1)(2) | | | | | 250 | | | | 243,206 | |
| | | |
Golub Capital Partners CLO 23M, Ltd., Series 2015-23A, Class ER, 5.938%, (3 mo. USD LIBOR + 5.75%), 1/20/31(1)(2) | | | | | 1,200 | | | | 1,118,716 | |
| | | |
Kayne CLO 5, Ltd., Series 2019-5A, Class E,
6.876%, (3 mo. USD LIBOR + 6.70%),
7/24/32(1)(2) | | | | | 1,000 | | | | 1,001,002 | |
| | | |
Kayne CLO 7, Ltd., Series 2020-7A, Class E, 6.69%, (3 mo. USD LIBOR + 6.50%), 4/17/33(1)(2) | | | | | 1,275 | | | | 1,280,556 | |
| | | | | | | | | | |
| Security | | | | Principal
Amount
(000’s omitted) | | | Value | |
| | | |
Madison Park Funding XXXVI, Ltd., Series 2019-36A, Class E, 7.434%, (3 mo. USD LIBOR + 7.25%), 1/15/33(1)(2) | | | | $ | 500 | | | $ | 500,904 | |
| | | |
Madison Park Funding XXXVII, Ltd., Series 2019-37A, Class E, 6.734%, (3 mo. USD LIBOR + 6.55%), 7/15/32(1)(2) | | | | | 1,000 | | | | 1,000,788 | |
| | | |
Neuberger Berman Loan Advisers CLO 33, Ltd., Series 2019-33A, Class E, 6.984%, (3 mo. USD LIBOR + 6.80%), 10/16/32(1)(2) | | | | | 1,000 | | | | 1,002,532 | |
| | | |
Oaktree CLO, Ltd., Series 2019-3A, Class E, 6.958%, (3 mo. USD LIBOR + 6.77%),
7/20/31(1)(2) | | | | | 1,000 | | | | 978,564 | |
| | | |
Palmer Square CLO, Ltd.: | | | | | | | | | | |
| | | |
Series 2013-2A, Class DRR, 6.04%, (3 mo. USD LIBOR + 5.85%), 10/17/31(1)(2) | | | | | 900 | | | | 887,124 | |
| | | |
Series 2019-1A, Class D, 7.154%, (3 mo. USD LIBOR + 7.00%), 11/14/32(1)(2) | | | | | 1,000 | | | | 1,003,338 | |
| | | |
Regatta XII Funding, Ltd., Series 2019-1A, Class E, 7.034%, (3 mo. USD LIBOR + 6.85%), 10/15/32(1)(2) | | | | | 500 | | | | 501,397 | |
| | | |
Regatta XIV Funding, Ltd., Series 2018-3A, Class E, 6.126%, (3 mo. USD LIBOR + 5.95%), 10/25/31(1)(2) | | | | | 700 | | | | 683,911 | |
| | | |
Regatta XVI Funding, Ltd., Series 2019-2A, Class E, 7.184%, (3 mo. USD LIBOR + 7.00%), 1/15/33(1)(2) | | | | | 750 | | | | 751,693 | |
| | | |
Southwick Park CLO, LLC, Series 2019-4A, Class E, 6.888%, (3 mo. USD LIBOR + 6.70%), 7/20/32(1)(2) | | | | | 2,000 | | | | 2,002,146 | |
| | | |
Vibrant CLO X, Ltd., Series 2018-10A, Class D, 6.378%, (3 mo. USD LIBOR + 6.19%), 10/20/31(1)(2) | | | | | 850 | | | | 799,504 | |
| | | |
Vibrant CLO XI, Ltd., Series 2019-11A, Class D, 6.958%, (3 mo. USD LIBOR + 6.77%),
7/20/32(1)(2) | | | | | 1,000 | | | | 970,018 | |
| | | |
Voya CLO, Ltd., Series 2013-1A, Class DR, 6.664%, (3 mo. USD LIBOR + 6.48%),
10/15/30(1)(2) | | | | | 2,000 | | | | 1,885,822 | |
| | | |
Wellfleet CLO, Ltd., Series 2020-1A, Class D, 7.424%, (3 mo. USD LIBOR + 7.24%),
4/15/33(1)(2) | | | | | 1,300 | | | | 1,304,679 | |
| |
Total Asset-Backed Securities
(identified cost $34,750,876) | | | $ | 34,767,946 | |
|
| Closed-End Funds — 1.7% | |
| Security | | | | Shares | | | Value | |
| | | |
BlackRock Floating Rate Income Strategies Fund, Inc. | | | | | 111,292 | | | $ | 1,441,232 | |
| | | |
Invesco Senior Income Trust | | | | | 402,161 | | | | 1,709,184 | |
| | | |
Nuveen Credit Strategies Income Fund | | | | | 406,731 | | | | 2,668,155 | |
| | | |
Nuveen Floating Rate Income Fund | | | | | 164,907 | | | | 1,584,756 | |
| | | |
Nuveen Floating Rate Income Opportunity Fund | | | | | 115,017 | | | | 1,091,511 | |
| | | |
Voya Prime Rate Trust | | | | | 333,948 | | | | 1,562,877 | |
| |
Total Closed-End Funds
(identified cost $12,294,751) | | | $ | 10,057,715 | |
| | | | |
| | 7 | | See Notes to Financial Statements. |
Eaton Vance
Floating-Rate Income Trust
May 31, 2021
Portfolio of Investments — continued
| | | | | | | | | | | | |
| Common Stocks — 0.9% | |
| Security | | | | | Shares | | | Value | |
|
| Aerospace and Defense — 0.1% | |
| | | |
IAP Global Services, LLC(3)(4)(5) | | | | | | | 58 | | | $ | 647,860 | |
| | | |
| | | | | | | | | | | $ | 647,860 | |
|
| Business Equipment and Services — 0.0%(6) | |
| | | |
Crossmark Holdings, Inc.(3)(5) | | | | | | | 3,740 | | | $ | 224,400 | |
| | | |
| | | | | | | | | | | $ | 224,400 | |
|
| Electronics / Electrical — 0.3% | |
| | | |
Software Luxembourg Holding S.A., Class A(3)(5) | | | | | | | 9,035 | | | $ | 1,558,537 | |
| | | |
| | | | | | | | | | | $ | 1,558,537 | |
|
| Oil and Gas — 0.0% | |
| | | |
Fieldwood Energy, Inc.(3)(4)(5) | | | | | | | 19,189 | | | $ | 0 | |
| | | |
Nine Point Energy Holdings, Inc.(4)(5)(7) | | | | | | | 758 | | | | 0 | |
| | | |
| | | | | | | | | | | $ | 0 | |
|
| Radio and Television — 0.3% | |
| | | |
Clear Channel Outdoor Holdings, Inc.(3)(5) | | | | | | | 86,335 | | | $ | 206,341 | |
| | | |
Cumulus Media, Inc., Class A(3)(5) | | | | | | | 42,499 | | | | 466,639 | |
| | | |
iHeartMedia, Inc., Class A(3)(5) | | | | | | | 36,714 | | | | 852,132 | |
| | | |
| | | | | | | | | | | $ | 1,525,112 | |
|
| Retailers (Except Food and Drug) — 0.0%(6) | |
| | | |
Phillips Pet Holding Corp.(3)(4)(5) | | | | | | | 613 | | | $ | 237,075 | |
| | | |
| | | | | | | | | | | $ | 237,075 | |
|
| Telecommunications — 0.2% | |
| | | |
Gee Acquisition Holdings Corp.(3)(4)(5) | | | | | | | 46,236 | | | $ | 933,967 | |
| | | |
| | | | | | | | | | | $ | 933,967 | |
| |
Total Common Stocks
(identified cost $4,898,231) | | | $ | 5,126,951 | |
|
| Convertible Preferred Stocks — 0.0% | |
| Security | | | | | Shares | | | Value | |
|
| Oil and Gas — 0.0% | |
| | | |
Nine Point Energy Holdings, Inc., Series A,
12.00%(4)(5)(7) | | | | | | | 14 | | | $ | 0 | |
| |
Total Convertible Preferred Stocks
(identified cost $14,000) | | | $ | 0 | |
| | | | | | | | | | | | |
| Corporate Bonds — 7.4% | |
| Security | | | | | Principal
Amount
(000’s omitted) | | | Value | |
|
| Aerospace and Defense — 0.3% | |
| | | |
Rolls-Royce PLC, 5.75%, 10/15/27(1) | | | | | | $ | 700 | | | $ | 754,250 | |
| | | |
TransDigm, Inc.: | | | | | | | | | | | | |
| | | |
4.625%, 1/15/29(1) | | | | | | | 691 | | | | 683,820 | |
| | | |
7.50%, 3/15/27 | | | | | | | 282 | | | | 301,134 | |
| | | |
| | | | | | | | | | | $ | 1,739,204 | |
|
| Automotive — 0.3% | |
| | | |
Clarios Global, L.P./Clarios US Finance Co., 8.50%, 5/15/27(1) | | | | | | $ | 856 | | | $ | 931,970 | |
| | | |
Ford Motor Co.: | | | | | | | | | | | | |
| | | |
4.75%, 1/15/43 | | | | | | | 250 | | | | 252,545 | |
| | | |
9.00%, 4/22/25 | | | | | | | 299 | | | | 365,692 | |
| | | |
| | | | | | | | | | | $ | 1,550,207 | |
|
| Building and Development — 0.5% | |
| | | |
Brookfield Residential Properties, Inc./Brookfield Residential U.S. Corp., 6.25%, 9/15/27(1) | | | | | | $ | 500 | | | $ | 527,215 | |
| | | |
Builders FirstSource, Inc.: | | | | | | | | | | | | |
| | | |
5.00%, 3/1/30(1) | | | | | | | 123 | | | | 128,246 | |
| | | |
6.75%, 6/1/27(1) | | | | | | | 932 | | | | 998,405 | |
| | | |
Standard Industries, Inc., 5.00%, 2/15/27(1) | | | | | | | 677 | | | | 701,650 | |
| | | |
White Cap Parent, LLC, 8.25%, (8.25% cash or 9.00% PIK), 3/15/26(1)(8) | | | | | | | 582 | | | | 602,975 | |
| | | |
| | | | | | | | | | | $ | 2,958,491 | |
|
| Business Equipment and Services — 0.5% | |
| | | |
GEMS MENASA Cayman, Ltd./GEMS Education Delaware, LLC, 7.125%,
7/31/26(1) | | | | | | $ | 550 | | | $ | 578,108 | |
| | | |
Prime Security Services Borrower, LLC/Prime Finance, Inc.: | | | | | | | | | | | | |
| | | |
5.25%, 4/15/24(1) | | | | | | | 750 | | | | 800,820 | |
| | | |
5.75%, 4/15/26(1) | | | | | | | 750 | | | | 821,475 | |
| | | |
Terminix Co., LLC (The), 7.45%, 8/15/27 | | | | | | | 427 | | | | 499,477 | |
| | | |
| | | | | | | | | | | $ | 2,699,880 | |
|
| Cable and Satellite Television — 0.4% | |
| | | |
Altice France S.A., 8.125%, 2/1/27(1) | | | | | | $ | 677 | | | $ | 738,776 | |
| | | |
CCO Holdings, LLC/CCO Holdings Capital Corp.: | | | | | | | | | | | | |
| | | |
4.25%, 2/1/31(1) | | | | | | | 229 | | | | 228,828 | |
| | | |
4.75%, 3/1/30(1) | | | | | | | 310 | | | | 321,916 | |
| | | |
5.75%, 2/15/26(1) | | | | | | | 22 | | | | 22,775 | |
| | | | |
| | 8 | | See Notes to Financial Statements. |
Eaton Vance
Floating-Rate Income Trust
May 31, 2021
Portfolio of Investments — continued
| | | | | | | | | | | | |
| Security | | | | | Principal
Amount
(000’s omitted) | | | Value | |
|
| Cable and Satellite Television (continued) | |
| | | |
CSC Holdings, LLC: | | | | | | | | | | | | |
| | | |
4.125%, 12/1/30(1) | | | | | | $ | 200 | | | $ | 195,710 | |
| | | |
5.25%, 6/1/24 | | | | | | | 10 | | | | 10,859 | |
| | | |
5.75%, 1/15/30(1) | | | | | | | 550 | | | | 574,797 | |
| | | |
5.875%, 9/15/22 | | | | | | | 15 | | | | 15,744 | |
| | | |
DISH DBS Corp., 6.75%, 6/1/21 | | | | | | | 14 | | | | 14,000 | |
| | | |
Ziggo Bond Co., B.V., 6.00%, 1/15/27(1) | | | | | | | 361 | | | | 377,960 | |
| | | |
| | | | | | | | | | | $ | 2,501,365 | |
|
| Commercial Services — 0.2% | |
| | | |
AMN Healthcare, Inc., 4.625%, 10/1/27(1) | | | | | | $ | 500 | | | $ | 518,917 | |
| | | |
Avis Budget Car Rental, LLC/Avis Budget Finance, Inc., 5.375%, 3/1/29(1) | | | | | | | 400 | | | | 416,502 | |
| | | |
| | | | | | | | | | | $ | 935,419 | |
|
| Conglomerates — 0.0%(6) | |
| | | |
Spectrum Brands, Inc.: | | | | | | | | | | | | |
| | | |
5.00%, 10/1/29(1) | | | | | | $ | 21 | | | $ | 22,243 | |
| | | |
5.75%, 7/15/25 | | | | | | | 5 | | | | 5,131 | |
| | | |
| | | | | | | | | | | $ | 27,374 | |
|
| Containers and Glass Products — 0.0%(6) | |
| | | |
Ardagh Packaging Finance PLC/Ardagh Holdings USA, Inc., 4.125%, 8/15/26(1) | | | | | | $ | 200 | | | $ | 205,000 | |
| | | |
| | | | | | | | | | | $ | 205,000 | |
|
| Distribution & Wholesale — 0.0%(6) | |
| | | |
Performance Food Group, Inc., 5.50%, 10/15/27(1) | | | | | | $ | 68 | | | $ | 71,083 | |
| | | |
| | | | | | | | | | | $ | 71,083 | |
|
| Drugs — 0.2% | |
| | | |
AdaptHealth, LLC, 6.125%, 8/1/28(1) | | | | | | $ | 125 | | | $ | 131,584 | |
| | | |
Bausch Health Americas, Inc., 8.50%,
1/31/27(1) | | | | | | | 146 | | | | 156,585 | |
| | | |
Bausch Health Companies, Inc., 7.00%, 1/15/28(1) | | | | | | | 752 | | | | 771,372 | |
| | | |
| | | | | | | | | | | $ | 1,059,541 | |
|
| Ecological Services and Equipment — 0.2% | |
| | | |
GFL Environmental, Inc.: | | | | | | | | | | | | |
| | | |
3.50%, 9/1/28(1) | | | | | | $ | 234 | | | $ | 228,069 | |
| | | |
8.50%, 5/1/27(1) | | | | | | | 575 | | | | 631,850 | |
| | | |
| | | | | | | | | | | $ | 859,919 | |
| | | | | | | | | | | | |
| Security | | | | | Principal
Amount
(000’s omitted) | | | Value | |
|
| Electronics / Electrical — 0.2% | |
| | | |
LogMeIn, Inc., 5.50%, 9/1/27(1) | | | | | | $ | 1,000 | | | $ | 1,032,285 | |
| | | |
Sensata Technologies, Inc., 4.375%, 2/15/30(1) | | | | | | | 45 | | | | 46,541 | |
| | | |
| | | | | | | | | | | $ | 1,078,826 | |
|
| Financial Intermediaries — 0.3% | |
| | | |
Ford Motor Credit Co., LLC, 5.125%, 6/16/25 | | | | | | $ | 977 | | | $ | 1,070,426 | |
| | | |
Icahn Enterprises, L.P./Icahn Enterprises Finance Corp., 6.25%, 5/15/26 | | | | | | | 677 | | | | 716,821 | |
| | | |
JPMorgan Chase & Co., Series S, 6.75% to 2/1/24(9)(10) | | | | | | | 80 | | | | 87,990 | |
| | | |
| | | | | | | | | | | $ | 1,875,237 | |
|
| Food Products — 0.2% | |
| | | |
Del Monte Foods, Inc., 11.875%, 5/15/25(1) | | | | | | $ | 1,075 | | | $ | 1,231,993 | |
| | | |
JBS USA LUX S.A./JBS USA Food Co./JBS USA Finance, Inc., 5.50%, 1/15/30(1) | | | | | | | 156 | | | | 171,797 | |
| | | |
| | | | | | | | | | | $ | 1,403,790 | |
|
| Food / Drug Retailers — 0.2% | |
| | | |
Fresh Market, Inc. (The), 9.75%, 5/1/23(1) | | | | | | $ | 1,300 | | | $ | 1,339,169 | |
| | | |
| | | | | | | | | | | $ | 1,339,169 | |
|
| Health Care — 0.3% | |
| | | |
Centene Corp.: | | | | | | | | | | | | |
| | | |
2.50%, 3/1/31 | | | | | | $ | 261 | | | $ | 250,418 | |
| | | |
3.00%, 10/15/30 | | | | | | | 491 | | | | 491,822 | |
| | | |
3.375%, 2/15/30 | | | | | | | 83 | | | | 83,940 | |
| | | |
HCA, Inc.: | | | | | | | | | | | | |
| | | |
5.625%, 9/1/28 | | | | | | | 300 | | | | 349,125 | |
| | | |
5.875%, 2/15/26 | | | | | | | 18 | | | | 20,588 | |
| | | |
Molina Healthcare, Inc., 3.875%, 11/15/30(1) | | | | | | | 246 | | | | 251,220 | |
| | | |
MPH Acquisition Holdings, LLC, 5.75%,
11/1/28(1) | | | | | | | 244 | | | | 243,140 | |
| | | |
Tenet Healthcare Corp., 6.75%, 6/15/23 | | | | | | | 244 | | | | 265,411 | |
| | | |
| | | | | | | | | | | $ | 1,955,664 | |
|
| Industrial Equipment — 0.0%(6) | |
| | | |
Hillman Group, Inc. (The), 6.375%, 7/15/22(1) | | | | | | $ | 37 | | | $ | 37,044 | |
| | | |
| | | | | | | | | | | $ | 37,044 | |
|
| Insurance — 0.2% | |
| | | |
AssuredPartners, Inc., 7.00%, 8/15/25(1) | | | | | | $ | 958 | | | $ | 980,590 | |
| | | |
| | | | | | | | | | | $ | 980,590 | |
| | | | |
| | 9 | | See Notes to Financial Statements. |
Eaton Vance
Floating-Rate Income Trust
May 31, 2021
Portfolio of Investments — continued
| | | | | | | | | | | | |
| Security | | | | | Principal
Amount
(000’s omitted) | | | Value | |
|
| Internet Software & Services — 0.1% | |
| | | |
Netflix, Inc., 5.375%, 11/15/29(1) | | | | | | $ | 475 | | | $ | 562,272 | |
| | | |
| | | | | | | | | | | $ | 562,272 | |
|
| Leisure Goods / Activities / Movies — 0.2% | |
| | | |
Carnival Corp., 6.65%, 1/15/28 | | | | | | $ | 114 | | | $ | 123,904 | |
| | | |
Viking Cruises, Ltd.: | | | | | | | | | | | | |
| | | |
5.875%, 9/15/27(1) | | | | | | | 971 | | | | 938,229 | |
| | | |
6.25%, 5/15/25(1) | | | | | | | 45 | | | | 44,714 | |
| | | |
| | | | | | | | | | | $ | 1,106,847 | |
|
| Lodging and Casinos — 0.4% | |
| | | |
Caesars Resort Collection, LLC/CRC Finco, Inc., 5.25%, 10/15/25(1) | | | | | | $ | 933 | | | $ | 941,919 | |
| | | |
MGM Resorts International, 7.75%, 3/15/22 | | | | | | | 18 | | | | 18,864 | |
| | | |
Stars Group Holdings B.V./Stars Group US Co-Borrower, LLC, 7.00%, 7/15/26(1) | | | | | | | 958 | | | | 997,767 | |
| | | |
Wynn Las Vegas, LLC/Wynn Las Vegas Capital Corp., 5.25%, 5/15/27(1) | | | | | | | 273 | | | | 289,039 | |
| | | |
| | | | | | | | | | | $ | 2,247,589 | |
|
| Metals / Mining — 0.0%(6) | |
| | | |
Cleveland-Cliffs, Inc., 6.75%, 3/15/26(1) | | | | | | $ | 206 | | | $ | 222,734 | |
| | | |
| | | | | | | | | | | $ | 222,734 | |
|
| Nonferrous Metals / Minerals — 0.1% | |
| | | |
New Gold, Inc.: | | | | | | | | | | | | |
| | | |
6.375%, 5/15/25(1) | | | | | | $ | 49 | | | $ | 50,531 | |
| | | |
7.50%, 7/15/27(1) | | | | | | | 685 | | | | 747,527 | |
| | | |
| | | | | | | | | | | $ | 798,058 | |
|
| Oil and Gas — 0.8% | |
| | | |
Centennial Resource Production, LLC, 6.875%, 4/1/27(1) | | | | | | $ | 409 | | | $ | 409,347 | |
| | | |
Colgate Energy Partners III, LLC, 7.75%, 2/15/26(1) | | | | | | | 346 | | | | 354,313 | |
| | | |
CVR Energy, Inc., 5.75%, 2/15/28(1) | | | | | | | 400 | | | | 402,242 | |
| | | |
Energy Transfer Operating, L.P., 5.875%, 1/15/24 | | | | | | | 35 | | | | 38,952 | |
| | | |
Neptune Energy Bondco PLC, 6.625%, 5/15/25(1) | | | | | | | 1,065 | | | | 1,092,685 | |
| | | |
Occidental Petroleum Corp., 6.625%, 9/1/30 | | | | | | | 936 | | | | 1,073,882 | |
| | | |
Ovintiv Exploration, Inc., 5.625%, 7/1/24 | | | | | | | 92 | | | | 102,399 | |
| | | |
Ovintiv, Inc., 6.50%, 2/1/38 | | | | | | | 698 | | | | 915,236 | |
| | | |
Tervita Corp., 11.00%, 12/1/25(1) | | | | | | | 229 | | | | 257,702 | |
| | | |
| | | | | | | | | | | $ | 4,646,758 | |
| | | | | | | | | | | | |
| Security | | | | | Principal
Amount
(000’s omitted) | | | Value | |
|
| Packaging & Containers — 0.1% | |
| | | |
ARD Finance S.A., 6.50%, (6.50% cash or
7.25% PIK), 6/30/27(1)(8) | | | | | | $ | 333 | | | $ | 348,002 | |
| | | |
| | | | | | | | | | | $ | 348,002 | |
|
| Radio and Television — 0.7% | |
| | | |
Diamond Sports Group, LLC/Diamond Sports Finance Co., 5.375%, 8/15/26(1) | | | | | | $ | 3,275 | | | $ | 2,427,561 | |
| | | |
iHeartCommunications, Inc.: | | | | | | | | | | | | |
| | | |
6.375%, 5/1/26 | | | | | | | 208 | | | | 222,051 | |
| | | |
8.375%, 5/1/27 | | | | | | | 960 | | | | 1,028,619 | |
| | | |
Sirius XM Radio, Inc., 4.125%, 7/1/30(1) | | | | | | | 91 | | | | 91,341 | |
| | | |
Terrier Media Buyer, Inc., 8.875%, 12/15/27(1) | | | | | | | 313 | | | | 335,301 | |
| | | |
| | | | | | | | | | | $ | 4,104,873 | |
|
| Real Estate Investment Trusts (REITs) — 0.2% | |
| | | |
Service Properties Trust, 3.95%, 1/15/28 | | | | | | $ | 1,023 | | | $ | 917,007 | |
| | | |
| | | | | | | | | | | $ | 917,007 | |
|
| Steel — 0.3% | |
| | | |
Allegheny Technologies, Inc., 7.875%, 8/15/23 | | | | | | $ | 690 | | | $ | 762,816 | |
| | | |
Infrabuild Australia Pty, Ltd., 12.00%,
10/1/24(1) | | | | | | | 1,017 | | | | 1,062,765 | |
| | | |
| | | | | | | | | | | $ | 1,825,581 | |
|
| Telecommunications — 0.3% | |
| | | |
Connect Finco S.a.r.l./Connect US Finco, LLC, 6.75%, 10/1/26(1) | | | | | | $ | 250 | | | $ | 258,758 | |
| | | |
Digicel International Finance, Ltd./Digicel International Holdings, Ltd., 8.75%, 5/25/24(1) | | | | | | | 600 | | | | 624,150 | |
| | | |
Lumen Technologies, Inc., Series W, 6.75%, 12/1/23 | | | | | | | 40 | | | | 44,176 | |
| | | |
Sprint Communications, Inc., 6.00%, 11/15/22 | | | | | | | 3 | | | | 3,190 | |
| | | |
Sprint Corp.: | | | | | | | | | | | | |
| | | |
7.25%, 9/15/21 | | | | | | | 230 | | | | 233,836 | |
| | | |
7.625%, 2/15/25 | | | | | | | 250 | | | | 295,905 | |
| | | |
| | | | | | | | | | | $ | 1,460,015 | |
|
| Utilities — 0.2% | |
| | | |
Calpine Corp., 5.125%, 3/15/28(1) | | | | | | $ | 1,000 | | | $ | 1,008,785 | |
| | | |
Vistra Operations Co., LLC: | | | | | | | | | | | | |
| | | |
4.30%, 7/15/29(1) | | | | | | | 32 | | | | 33,973 | |
| | | |
5.00%, 7/31/27(1) | | | | | | | 201 | | | | 205,523 | |
| | | |
| | | | | | | | | | | $ | 1,248,281 | |
| | | |
Total Corporate Bonds
(identified cost $41,923,114) | | | | | | | | | | $ | 42,765,820 | |
| | | | |
| | 10 | | See Notes to Financial Statements. |
Eaton Vance
Floating-Rate Income Trust
May 31, 2021
Portfolio of Investments — continued
| | | | | | | | | | | | |
| Senior Floating-Rate Loans — 140.8%(11) | |
| Borrower/Description | | | | | Principal
Amount*
(000’s omitted) | | | Value | |
|
| Aerospace and Defense — 3.3% | |
| | | |
Aernnova Aerospace S.A.U.: | | | | | | | | | | | | |
| | | |
Term Loan, 3.00%, (3 mo. EURIBOR + 3.00%), 2/22/27 | | | EUR | | | | 107 | | | $ | 124,758 | |
| | | |
Term Loan, 3.00%, (3 mo. EURIBOR + 3.00%), 2/26/27 | | | EUR | | | | 418 | | | | 486,558 | |
| | | |
AI Convoy (Luxembourg) S.a.r.l.: | | | | | | | | | | | | |
| | | |
Term Loan, 3.50%, (6 mo. EURIBOR + 3.50%), 1/18/27 | | | EUR | | | | 450 | | | | 548,204 | |
| | | |
Term Loan, 4.50%, (USD LIBOR + 3.50%, Floor 1.00%), 1/17/27(12) | | | | | | | 743 | | | | 743,544 | |
| | | |
Dynasty Acquisition Co., Inc.: | | | | | | | | | | | | |
| | | |
Term Loan, 3.703%, (3 mo. USD LIBOR + 3.50%), 4/6/26 | | | | | | | 1,055 | | | | 1,022,821 | |
| | | |
Term Loan, 3.703%, (3 mo. USD LIBOR + 3.50%), 4/6/26 | | | | | | | 1,961 | | | | 1,901,777 | |
| | | |
IAP Worldwide Services, Inc.: | | | | | | | | | | | | |
| | | |
Revolving Loan, 0.75%, (3 mo. USD LIBOR + 5.50%, Floor 1.50%), 7/18/23(13) | | | | | | | 325 | | | | 325,310 | |
| | | |
Term Loan - Second Lien, 8.00%, (3 mo. USD LIBOR + 6.50%, Floor 1.50%), 7/18/23(4) | | | | | | | 419 | | | | 343,598 | |
| | | |
Spirit Aerosystems, Inc., Term Loan, 6.00%, (1 mo. USD LIBOR + 5.25%, Floor 0.75%), 1/15/25 | | | | | | | 449 | | | | 453,551 | |
| | | |
TransDigm, Inc.: | | | | | | | | | | | | |
| | | |
Term Loan, 2.343%, (1 mo. USD LIBOR + 2.25%), 8/22/24 | | | | | | | 2,791 | | | | 2,761,164 | |
| | | |
Term Loan, 2.343%, (1 mo. USD LIBOR + 2.25%), 12/9/25 | | | | | | | 7,699 | | | | 7,606,465 | |
| | | |
WP CPP Holdings, LLC, Term Loan, 4.75%, (USD LIBOR + 3.75%, Floor 1.00%), 4/30/25(12) | | | | | | | 2,787 | | | | 2,719,042 | |
| | | |
| | | | | | | | | | | $ | 19,036,792 | |
|
| Air Transport — 1.1% | |
| | | |
JetBlue Airways Corporation, Term Loan, 6.25%, (3 mo. USD LIBOR + 5.25%, Floor 1.00%), 6/17/24 | | | | | | | 3,138 | | | $ | 3,213,796 | |
| | | |
Mileage Plus Holdings, LLC, Term Loan, 6.25%, (3 mo. USD LIBOR + 5.25%, Floor 1.00%), 6/21/27 | | | | | | | 800 | | | | 854,900 | |
| | | |
SkyMiles IP, Ltd., Term Loan, 4.75%, (3 mo. USD LIBOR + 3.75%, Floor 1.00%), 10/20/27 | | | | | | | 2,200 | | | | 2,309,237 | |
| | | |
| | | | | | | | | | | $ | 6,377,933 | |
|
| Automotive — 5.5% | |
| | | |
Adient US, LLC, Term Loan, 3.593%, (1 mo. USD LIBOR + 3.50%), 4/8/28 | | | | | | | 1,050 | | | $ | 1,053,445 | |
| | | |
American Axle and Manufacturing, Inc., Term Loan, 3.00%, (1 mo. USD LIBOR + 2.25%, Floor 0.75%), 4/6/24 | | | | | | | 2,531 | | | | 2,533,352 | |
| | | | | | | | | | | | |
| Borrower/Description | | | | | Principal
Amount*
(000’s omitted) | | | Value | |
|
| Automotive (continued) | |
| | | |
Autokiniton US Holdings, Inc., Term Loan, 5.00%, (3 mo. USD LIBOR + 4.50%, Floor 0.50%), 4/6/28 | | | | | | | 1,375 | | | $ | 1,385,598 | |
| | | |
Belron Finance US, LLC, Term Loan, 3.25%, (3 mo. USD LIBOR + 2.75%, Floor 0.50%), 4/13/28 | | | | | | | 1,000 | | | | 997,188 | |
| | | |
Bright Bidco B.V., Term Loan, 4.50%, (6 mo. USD LIBOR + 3.50%, Floor 1.00%), 6/30/24 | | | | | | | 1,638 | | | | 1,238,093 | |
| | | |
Chassix, Inc., Term Loan, 6.50%, (USD LIBOR + 5.50%, Floor 1.00%), 11/15/23(12) | | | | | | | 1,451 | | | | 1,442,180 | |
| | | |
Clarios Global, L.P., Term Loan, 3.343%, (1 mo. USD LIBOR + 3.25%), 4/30/26 | | | | | | | 3,629 | | | | 3,617,147 | |
| | | |
Dayco Products, LLC, Term Loan, 4.385%, (3 mo. USD LIBOR + 4.25%), 5/19/23 | | | | | | | 1,080 | | | | 1,031,400 | |
| | | |
Garrett LX I S.a.r.l.: | | | | | | | | | | | | |
| | | |
Term Loan, 3.50%, (3 mo. EURIBOR + 3.50%), 4/30/28 | | | EUR | | | | 1,625 | | | | 1,975,413 | |
| | | |
Term Loan, 3.75%, (3 mo. USD LIBOR + 3.25%, Floor 0.50%), 4/30/28 | | | | | | | 775 | | | | 775,000 | |
| | | |
Gates Global, LLC: | | | | | | | | | | | | |
| | | |
Term Loan, 3.00%, (3 mo. EURIBOR + 3.00%), 4/1/24 | | | EUR | | | | 912 | | | | 1,108,865 | |
| | | |
Term Loan, 3.50%, (1 mo. USD LIBOR + 2.75%, Floor 0.75%), 3/31/27 | | | | | | | 3,723 | | | | 3,716,461 | |
| | | |
Les Schwab Tire Centers, Term Loan, 4.25%, (6 mo. USD LIBOR + 3.50%, Floor 0.75%), 11/2/27 | | | | | | | 2,843 | | | | 2,849,982 | |
| | | |
MajorDrive Holdings IV, LLC, Term Loan, 5/12/28(14) | | | | | | | 675 | | | | 677,004 | |
| | | |
Tenneco, Inc., Term Loan, 3.093%, (1 mo. USD LIBOR + 3.00%), 10/1/25 | | | | | | | 3,739 | | | | 3,687,527 | |
| | | |
Thor Industries, Inc., Term Loan, 3.125%, (1 mo. USD LIBOR + 3.00%), 2/1/26 | | | | | | | 1,101 | | | | 1,105,643 | |
| | | |
TI Group Automotive Systems, LLC, Term Loan, 3.25%, (3 mo. EURIBOR + 3.25%), 12/16/26 | | | EUR | | | | 504 | | | | 618,194 | |
| | | |
Truck Hero, Inc., Term Loan, 4.50%, (1 mo. USD LIBOR + 3.75%, Floor 0.75%), 1/31/28 | | | | | | | 1,325 | | | | 1,328,037 | |
| | | |
Wheel Pros, LLC, Term Loan, 5.25%, (1 mo. USD LIBOR + 4.50%, Floor 0.75%), 4/23/28 | | | | | | | 900 | | | | 903,656 | |
| | | |
| | | | | | | | | | | $ | 32,044,185 | |
|
| Beverage and Tobacco — 0.6% | |
| | | |
Arterra Wines Canada, Inc., Term Loan, 4.25%, (3 mo. USD LIBOR + 3.50%, Floor 0.75%), 11/24/27 | | | | | | | 1,097 | | | $ | 1,100,679 | |
| | | |
City Brewing Company, LLC, Term Loan, 4.25%, (3 mo. USD LIBOR + 3.50%, Floor 0.75%), 4/5/28 | | | | | | | 925 | | | | 928,446 | |
| | | |
Triton Water Holdings, Inc., Term Loan, 4.00%, (2 mo. USD LIBOR + 3.50%, Floor 0.50%), 3/31/28 | | | | | | | 1,475 | | | | 1,475,790 | |
| | | |
| | | | | | | | | | | $ | 3,504,915 | |
| | | | |
| | 11 | | See Notes to Financial Statements. |
Eaton Vance
Floating-Rate Income Trust
May 31, 2021
Portfolio of Investments — continued
| | | | | | | | | | | | |
| Borrower/Description | | | | | Principal
Amount*
(000’s omitted) | | | Value | |
|
| Brokerage / Securities Dealers / Investment Houses — 1.0% | |
| | | |
Advisor Group, Inc., Term Loan, 4.593%, (1 mo. USD LIBOR + 4.50%), 7/31/26 | | | | | | | 3,439 | | | $ | 3,450,326 | |
| | | |
Hudson River Trading, LLC, Term Loan, 3.093%, (1 mo. USD LIBOR + 3.00%), 3/20/28 | | | | | | | 2,300 | | | | 2,292,813 | |
| | | |
| | | | | | | | | | | $ | 5,743,139 | |
|
| Building and Development — 5.9% | |
| | | |
ACProducts, Inc., Term Loan, 4.75%, (1 mo. USD LIBOR + 4.25%, Floor 0.50%), 5/5/28 | | | | | | | 2,125 | | | $ | 2,120,574 | |
| | | |
Advanced Drainage Systems, Inc., Term Loan, 2.375%, (1 mo. USD LIBOR + 2.25%), 7/31/26 | | | | | | | 220 | | | | 220,608 | |
| | | |
Aegion Corporation, Term Loan, 5.50%, (3 mo. USD LIBOR + 4.75%, Floor 0.75%), 5/17/28 | | | | | | | 550 | | | | 552,063 | |
| | | |
American Builders & Contractors Supply Co., Inc., Term Loan, 2.093%, (1 mo. USD LIBOR + 2.00%), 1/15/27 | | | | | | | 2,487 | | | | 2,473,998 | |
| | | |
American Residential Services, LLC, Term Loan, 4.25%, (2 mo. USD LIBOR + 3.50%, Floor 0.75%), 10/15/27 | | | | | | | 623 | | | | 624,996 | |
| | | |
APi Group DE, Inc.: | | | | | | | | | | | | |
| | | |
Term Loan, 2.593%, (1 mo. USD LIBOR + 2.50%), 10/1/26 | | | | | | | 1,531 | | | | 1,524,408 | |
| | | |
Term Loan, 2.843%, (1 mo. USD LIBOR + 2.75%), 10/1/26 | | | | | | | 324 | | | | 322,364 | |
| | | |
Brookfield Property REIT, Inc., Term Loan, 2.593%, (1 mo. USD LIBOR + 2.50%), 8/27/25 | | | | | | | 999 | | | | 967,965 | |
| | | |
Core & Main L.P., Term Loan, 3.75%, (USD LIBOR + 2.75%, Floor 1.00%), 8/1/24(12) | | | | | | | 1,164 | | | | 1,163,753 | |
| | | |
Cornerstone Building Brands, Inc., Term Loan, 3.75%, (1 mo. USD LIBOR + 3.25%, Floor 0.50%), 4/12/28 | | | | | | | 950 | | | | 951,306 | |
| | | |
CP Atlas Buyer, Inc., Term Loan, 4.25%, (6 mo. USD LIBOR + 3.75%, Floor 0.50%), 11/23/27 | | | | | | | 1,275 | | | | 1,274,602 | |
| | | |
CPG International, Inc., Term Loan, 3.25%, (12 mo. USD LIBOR + 2.50%, Floor 0.75%), 5/5/24 | | | | | | | 1,146 | | | | 1,145,297 | |
| | | |
Cushman & Wakefield U.S. Borrower, LLC, Term Loan, 2.843%, (1 mo. USD LIBOR + 2.75%), 8/21/25 | | | | | | | 5,817 | | | | 5,776,151 | |
| | | |
Foundation Building Materials Holding Company, LLC, Term Loan, 3.75%, (3 mo. USD LIBOR + 3.25%, Floor 0.50%), 2/3/28 | | | | | | | 1,350 | | | | 1,342,617 | |
| | | |
MI Windows and Doors, LLC, Term Loan, 4.50%, (1 mo. USD LIBOR + 3.75%, Floor 0.75%), 12/18/27 | | | | | | | 499 | | | | 500,807 | |
| | | |
Northstar Group Services, Inc., Term Loan, 6.50%, (3 mo. USD LIBOR + 5.50%, Floor 1.00%), 11/9/26 | | | | | | | 1,391 | | | | 1,403,424 | |
| | | |
Park River Holdings, Inc., Term Loan, 4.00%, (3 mo. USD LIBOR + 3.25%, Floor 0.75%), 12/28/27 | | | | | | | 725 | | | | 722,022 | |
| | | |
Quikrete Holdings, Inc., Term Loan, 2.593%, (1 mo. USD LIBOR + 2.50%), 2/1/27 | | | | | | | 2,210 | | | | 2,198,244 | |
| | | |
RE/MAX International, Inc., Term Loan, 3.50%, (3 mo. USD LIBOR + 2.75%, Floor 0.75%), 12/15/23 | | | | | | | 2,027 | | | | 2,026,921 | |
| | | | | | | | | | | | |
| Borrower/Description | | | | | Principal
Amount*
(000’s omitted) | | | Value | |
|
| Building and Development (continued) | |
| | | |
Realogy Group, LLC, Term Loan, 3.00%, (1 mo. USD LIBOR + 2.25%, Floor 0.75%), 2/8/25 | | | | | | | 203 | | | $ | 202,887 | |
| | | |
SRS Distribution, Inc., Term Loan,
6/4/28(14) | | | | | | | 1,175 | | | | 1,174,510 | |
| | | |
Werner FinCo L.P., Term Loan, 5.00%, (3 mo. USD LIBOR + 4.00%, Floor 1.00%), 7/24/24 | | | | | | | 1,110 | | | | 1,114,640 | |
| | | |
White Cap Buyer, LLC, Term Loan, 4.50%, (3 mo. USD LIBOR + 4.00%, Floor 0.50%), 10/19/27 | | | | | | | 2,363 | | | | 2,369,477 | |
| | | |
WireCo WorldGroup, Inc.: | | | | | | | | | | | | |
| | | |
Term Loan, 6.00%, (6 mo. USD LIBOR + 5.00%, Floor 1.00%), 9/30/23 | | | | | | | 913 | | | | 913,011 | |
| | | |
Term Loan - Second Lien, 10.00%, (6 mo. USD LIBOR + 9.00%, Floor 1.00%), 9/30/24 | | | | | | | 1,300 | | | | 1,248,000 | |
| | | |
| | | | | | | | | | | $ | 34,334,645 | |
|
| Business Equipment and Services — 14.7% | |
| | | |
Adtalem Global Education, Inc., Term Loan, 3.093%, (1 mo. USD LIBOR + 3.00%), 4/11/25 | | | | | | | 413 | | | $ | 411,590 | |
| | | |
AlixPartners, LLP: | | | | | | | | | | | | |
| | | |
Term Loan, 3.25%, (3 mo. EURIBOR + 3.25%), 2/4/28 | | | EUR | | | | 525 | | | | 640,411 | |
| | | |
Term Loan, 3.25%, (1 mo. USD LIBOR + 2.75%, Floor 0.50%), 2/4/28 | | | | | | | 1,700 | | | | 1,695,005 | |
| | | |
Allied Universal Holdco, LLC, Term Loan, 4.25%, (1 mo. USD LIBOR + 3.75%, Floor 0.50%), 5/12/28 | | | | | | | 3,559 | | | | 3,571,070 | |
| | | |
AppLovin Corporation, Term Loan, 3.343%, (1 mo. USD LIBOR + 3.25%), 8/15/25 | | | | | | | 4,510 | | | | 4,509,991 | |
| | | |
Asplundh Tree Expert, LLC, Term Loan, 1.843%, (1 mo. USD LIBOR + 1.75%), 9/7/27 | | | | | | | 1,244 | | | | 1,242,389 | |
| | | |
Belfor Holdings, Inc., Term Loan, 4.093%, (1 mo. USD LIBOR + 4.00%), 4/6/26 | | | | | | | 565 | | | | 567,762 | |
| | | |
Blitz 20-487 GmbH, Term Loan, 3.50%, (1 mo. EURIBOR + 3.50%), 2/12/28 | | | EUR | | | | 825 | | | | 1,007,094 | |
| | | |
Bracket Intermediate Holding Corp., Term Loan, 4.444%, (3 mo. USD LIBOR + 4.25%), 9/5/25 | | | | | | | 926 | | | | 926,250 | |
| | | |
Brand Energy & Infrastructure Services, Inc., Term Loan, 5.25%, (3 mo. USD LIBOR + 4.25%, Floor 1.00%), 6/21/24 | | | | | | | 1,667 | | | | 1,631,032 | |
| | | |
Camelot U.S. Acquisition 1 Co., Term Loan, 4.00%, (1 mo. USD LIBOR + 3.00%, Floor 1.00%), 10/30/26 | | | | | | | 1,222 | | | | 1,224,381 | |
| | | |
Cardtronics USA, Inc., Term Loan, 5.00%, (1 mo. USD LIBOR + 4.00%, Floor 1.00%), 6/29/27 | | | | | | | 596 | | | | 597,175 | |
| | | |
CCC Information Services, Inc., Term Loan, 4.00%, (1 mo. USD LIBOR + 3.00%, Floor 1.00%), 4/29/24 | | | | | | | 3,109 | | | | 3,113,871 | |
| | | |
Ceridian HCM Holding, Inc., Term Loan, 2.562%, (1 week USD LIBOR + 2.50%), 4/30/25 | | | | | | | 1,042 | | | | 1,031,535 | |
| | | |
CM Acquisition Co., Term Loan, 11.00%, (3 mo. USD LIBOR + 10.00%, Floor 1.00%), 7/26/23 | | | | | | | 198 | | | | 196,163 | |
| | | |
CoreLogic, Inc., Term Loan, 4/13/28(14) | | | | | | | 6,075 | | | | 6,062,850 | |
| | | | |
| | 12 | | See Notes to Financial Statements. |
Eaton Vance
Floating-Rate Income Trust
May 31, 2021
Portfolio of Investments — continued
| | | | | | | | | | |
| Borrower/Description | | | | Principal
Amount*
(000’s omitted) | | | Value | |
|
| Business Equipment and Services (continued) | |
| | | |
Deerfield Dakota Holding, LLC, Term Loan, 4.75%, (1 mo. USD LIBOR + 3.75%, Floor 1.00%), 4/9/27 | | | | | 2,208 | | | $ | 2,222,344 | |
| | | |
EAB Global, Inc., Term Loan, 4.75%, (3 mo. USD LIBOR + 3.75%, Floor 1.00%), 11/15/24 | | | | | 1,358 | | | | 1,359,697 | |
| | | |
Endure Digital, Inc., Term Loan, 4.25%, (6 mo. USD LIBOR + 3.50%, Floor 0.75%), 2/10/28 | | | | | 3,350 | | | | 3,336,392 | |
| | | |
First Advantage Holdings, LLC, Term Loan, 3.093%, (1 mo. USD LIBOR + 3.00%), 1/31/27 | | | | | 3,903 | | | | 3,893,949 | |
| | | |
Garda World Security Corporation, Term Loan, 4.35%, (1 mo. USD LIBOR + 4.25%), 10/30/26 | | | | | 1,426 | | | | 1,430,896 | |
| | | |
Grab Holdings, Inc., Term Loan, 5.50%, (6 mo. USD LIBOR + 4.50%, Floor 1.00%), 1/29/26 | | | | | 2,525 | | | | 2,575,500 | |
| | | |
Greeneden U.S. Holdings II, LLC, Term Loan, 4.75%, (1 mo. USD LIBOR + 4.00%, Floor 0.75%), 12/1/27 | | | | | 923 | | | | 926,052 | |
| | | |
IG Investment Holdings, LLC, Term Loan, 5.00%, (3 mo. USD LIBOR + 4.00%, Floor 1.00%), 5/23/25 | | | | | 2,582 | | | | 2,588,310 | |
| | | |
IRI Holdings, Inc., Term Loan, 4.343%, (1 mo. USD LIBOR + 4.25%), 12/1/25 | | | | | 2,199 | | | | 2,202,810 | |
| | | |
Ivanti Software, Inc.: | | | | | | | | | | |
| | | |
Term Loan, 4.75%, (3 mo. USD LIBOR + 4.00%, Floor 0.75%), 12/1/27 | | | | | 800 | | | | 798,750 | |
| | | |
Term Loan, 5.75%, (3 mo. USD LIBOR + 4.75%, Floor 1.00%), 12/1/27 | | | | | 2,900 | | | | 2,905,437 | |
| | | |
KAR Auction Services, Inc., Term Loan, 2.375%, (1 mo. USD LIBOR + 2.25%), 9/19/26 | | | | | 665 | | | | 654,625 | |
| | | |
KUEHG Corp.: | | | | | | | | | | |
| | | |
Term Loan, 4.75%, (3 mo. USD LIBOR + 3.75%, Floor 1.00%), 2/21/25 | | | | | 2,706 | | | | 2,670,381 | |
| | | |
Term Loan - Second Lien, 9.25%, (3 mo. USD LIBOR + 8.25%, Floor 1.00%), 8/22/25 | | | | | 425 | | | | 412,250 | |
| | | |
LGC Group Holdings, Ltd., Term Loan, 2.75%, (1 mo. EURIBOR + 2.75%), 4/21/27 | | EUR | | | 500 | | | | 603,924 | |
| | | |
Loire Finco Luxembourg S.a.r.l., Term Loan, 3.093%, (1 mo. USD LIBOR + 3.00%), 4/21/27 | | | | | 372 | | | | 369,480 | |
| | | |
Magnite, Inc., Term Loan, 5.75%, (3 mo. USD LIBOR + 5.00%, Floor 0.75%), 4/1/28 | | | | | 775 | | | | 773,062 | |
| | | |
MedAssets Software Intermediate Holdings, Inc., Term Loan, 4.50%, (6 mo. USD LIBOR + 3.75%, Floor 0.75%), 1/28/28 | | | | | 500 | | | | 499,063 | |
| | | |
Monitronics International, Inc., Term Loan, 7.75%, (1 mo. USD LIBOR + 6.50%, Floor 1.25%), 3/29/24 | | | | | 1,583 | | | | 1,546,024 | |
| | | |
Nielsen Consumer, Inc.: | | | | | | | | | | |
| | | |
Term Loan, 4.00%, (1 mo. EURIBOR + 4.00%), 3/6/28 | | EUR | | | 425 | | | | 519,724 | |
| | | |
Term Loan, 4.108%, (1 mo. USD LIBOR + 4.00%), 3/6/28 | | | | | 800 | | | | 803,400 | |
| | | |
Packaging Coordinators Midco, Inc., Term Loan, 4.25%, (USD LIBOR + 3.50%, Floor 0.75%), 11/30/27(12) | | | | | 1,250 | | | | 1,253,906 | |
| | | | | | | | | | | | |
| Borrower/Description | | | | | Principal
Amount*
(000’s omitted) | | | Value | |
|
| Business Equipment and Services (continued) | |
| | | |
PGX Holdings, Inc., Term Loan, 10.50%, (12 mo. USD LIBOR + 9.50%, Floor 1.00%), 6.25% cash, 4.25% PIK, 9/29/23 | | | | | | | 612 | | | $ | 584,434 | |
| | | |
Pike Corporation, Term Loan, 3.10%, (1 mo. USD LIBOR + 3.00%), 1/21/28 | | | | | | | 525 | | | | 524,877 | |
| | | |
Prime Security Services Borrower, LLC, Term Loan, 3.50%, (USD LIBOR + 2.75%, Floor 0.75%), 9/23/26(12) | | | | | | | 2,154 | | | | 2,157,080 | |
| | | |
Rockwood Service Corporation, Term Loan, 4.093%, (1 mo. USD LIBOR + 4.00%), 1/23/27 | | | | | | | 482 | | | | 484,547 | |
| | | |
Sabre GLBL, Inc.: | | | | | | | | | | | | |
| | | |
Term Loan, 2.093%, (1 mo. USD LIBOR + 2.00%), 2/22/24 | | | | | | | 1,016 | | | | 1,000,177 | |
| | | |
Term Loan, 4.75%, (1 mo. USD LIBOR + 4.00%, Floor 0.75%), 12/17/27 | | | | | | | 449 | | | | 452,663 | |
| | | |
Skopima Merger Sub, Inc., Term Loan, 4.50%, (3 mo. USD LIBOR + 4.00%, Floor 0.50%), 4/30/28 | | | | | | | 1,200 | | | | 1,190,750 | |
| | | |
SMG US Midco 2, Inc., Term Loan, 2.688%, (USD LIBOR + 2.50%), 1/23/25(12) | | | | | | | 243 | | | | 236,086 | |
| | | |
Sotheby’s, Term Loan, 5.50%, (3 mo. USD LIBOR + 4.75%, Floor 0.75%), 1/15/27 | | | | | | | 664 | | | | 672,601 | |
| | | |
Speedster Bidco GmbH, Term Loan, 3.25%, (6 mo. EURIBOR + 3.25%), 3/31/27 | | | EUR | | | | 2,325 | | | | 2,816,318 | |
| | | |
Spin Holdco, Inc., Term Loan, 4.75%, (3 mo. USD LIBOR + 4.00%, Floor 0.75%), 3/1/28 | | | | | | | 4,675 | | | | 4,670,456 | |
| | | |
team.blue Finco S.a.r.l.: | | | | | | | | | | | | |
| | | |
Term Loan, 3/27/28(14) | | | EUR | | | | 80 | | | | 96,959 | |
| | | |
Term Loan, 3/27/28(14) | | | EUR | | | | 1,395 | | | | 1,696,783 | |
| | | |
Techem Verwaltungsgesellschaft 675 mbH, Term Loan, 2.625%, (3 mo. EURIBOR + 2.625%), 7/15/25 | | | EUR | | | | 801 | | | | 973,236 | |
| | | |
Tempo Acquisition, LLC, Term Loan, 3.75%, (1 mo. USD LIBOR + 3.25%, Floor 0.50%), 11/2/26 | | | | | | | 1,657 | | | | 1,662,052 | |
| | | |
Vestcom Parent Holdings, Inc., Term Loan, 5.00%, (1 mo. USD LIBOR + 4.00%, Floor 1.00%), 12/19/23 | | | | | | | 824 | | | | 825,320 | |
| | | |
West Corporation: | | | | | | | | | | | | |
| | | |
Term Loan, 4.50%, (USD LIBOR + 3.50%, Floor 1.00%), 10/10/24(12) | | | | | | | 340 | | | | 330,495 | |
| | | |
Term Loan, 5.00%, (USD LIBOR + 4.00%, Floor 1.00%), 10/10/24(12) | | | | | | | 1,137 | | | | 1,108,629 | |
| | | |
Zephyr Bidco Limited, Term Loan, 4.803%, (1 mo. GBP LIBOR + 4.75%), 7/23/25 | | | GBP | | | | 775 | | | | 1,089,645 | |
| | | |
| | | | | | | | | | | $ | 85,347,653 | |
|
| Cable and Satellite Television — 5.0% | |
| | | |
Altice France S.A.: | | | | | | | | | | | | |
| | | |
Term Loan, 3.871%, (3 mo. USD LIBOR + 3.69%), 1/31/26 | | | | | | | 778 | | | $ | 773,215 | |
| | | |
Term Loan, 4.155%, (3 mo. USD LIBOR + 4.00%), 8/14/26 | | | | | | | 1,230 | | | | 1,231,465 | |
| | | | |
| | 13 | | See Notes to Financial Statements. |
Eaton Vance
Floating-Rate Income Trust
May 31, 2021
Portfolio of Investments — continued
| | | | | | | | | | | | |
| Borrower/Description | | | | | Principal
Amount*
(000’s omitted) | | | Value | |
|
| Cable and Satellite Television (continued) | |
| | | |
CSC Holdings, LLC: | | | | | | | | | | | | |
| | | |
Term Loan, 2.348%, (1 mo. USD LIBOR + 2.25%), 7/17/25 | | | | | | | 3,667 | | | $ | 3,633,600 | |
| | | |
Term Loan, 2.598%, (1 mo. USD LIBOR + 2.50%), 4/15/27 | | | | | | | 1,341 | | | | 1,336,147 | |
| | | |
Numericable Group S.A.: | | | | | | | | | | | | |
| | | |
Term Loan, 2.936%, (3 mo. USD LIBOR + 2.75%), 7/31/25 | | | | | | | 1,944 | | | | 1,919,457 | |
| | | |
Term Loan, 3.00%, (3 mo. EURIBOR + 3.00%), 7/31/25 | | | EUR | | | | 480 | | | | 578,244 | |
| | | |
Telenet Financing USD, LLC, Term Loan, 2.101%, (1 mo. USD LIBOR + 2.00%), 4/30/28 | | | | | | | 4,075 | | | | 4,035,521 | |
| | | |
UPC Broadband Holding B.V.: | | | | | | | | | | | | |
| | | |
Term Loan, 2.351%, (1 mo. USD LIBOR + 2.25%), 4/30/28 | | | | | | | 900 | | | | 891,000 | |
| | | |
Term Loan, 2.50%, (6 mo. EURIBOR + 2.50%), 4/30/29 | | | EUR | | | | 775 | | | | 938,650 | |
| | | |
UPC Financing Partnership, Term Loan, 3.105%, (1 mo. USD LIBOR + 3.00%), 1/31/29 | | | | | | | 3,550 | | | | 3,529,293 | |
| | | |
Virgin Media Bristol, LLC: | | | | | | | | | | | | |
| | | |
Term Loan, 2.601%, (1 mo. USD LIBOR + 2.50%), 1/31/28 | | | | | | | 4,625 | | | | 4,602,518 | |
| | | |
Term Loan, 1/31/29(14) | | | | | | | 1,275 | | | | 1,276,461 | |
| | | |
Virgin Media SFA Finance Limited, Term Loan, 2.50%, (6 mo. EURIBOR + 2.50%), 1/31/29 | | | EUR | | | | 1,325 | | | | 1,607,925 | |
| | | |
Ziggo B.V., Term Loan, 3.00%, (6 mo. EURIBOR + 3.00%), 1/31/29 | | | EUR | | | | 2,425 | | | | 2,947,641 | |
| | | |
| | | | | | | | | | | $ | 29,301,137 | |
|
| Chemicals and Plastics — 7.7% | |
| | | |
Aruba Investments, Inc.: | | | | | | | | | | | | |
| | | |
Term Loan, 4.00%, (6 mo. EURIBOR + 4.00%), 11/24/27 | | | EUR | | | | 525 | | | $ | 642,612 | |
| | | |
Term Loan, 4.75%, (6 mo. USD LIBOR + 4.00%, Floor 0.75%), 11/24/27 | | | | | | | 800 | | | | 804,500 | |
| | | |
Atotech B.V.: | | | | | | | | | | | | |
| | | |
Term Loan, 2.75%, (3 mo. EURIBOR + 2.75%), 3/18/28 | | | EUR | | | | 375 | | | | 455,150 | |
| | | |
Term Loan, 3.00%, (3 mo. USD LIBOR + 2.50%, Floor 0.50%), 3/18/28 | | | | | | | 1,125 | | | | 1,121,484 | |
| | | |
Axalta Coating Systems US Holdings, Inc., Term Loan, 1.953%, (3 mo. USD LIBOR + 1.75%), 6/1/24 | | | | | | | 2,296 | | | | 2,287,895 | |
| | | |
Azelis Finance S.A., Term Loan, 3.00%, (6 mo. EURIBOR + 3.00%), 11/7/25 | | | EUR | | | | 2,000 | | | | 2,426,324 | |
| | | |
Charter NEX US, Inc., Term Loan, 5.00%, (1 mo. USD LIBOR + 4.25%, Floor 0.75%), 12/1/27 | | | | | | | 499 | | | | 501,439 | |
| | | |
Chemours Company (The), Term Loan, 2.50%, (3 mo. EURIBOR + 2.00%, Floor 0.50%), 4/3/25 | | | EUR | | | | 628 | | | | 765,037 | |
| | | | | | | | | | |
| Borrower/Description | | | | Principal
Amount*
(000’s omitted) | | | Value | |
|
| Chemicals and Plastics (continued) | |
| | | |
CPC Acquisition Corp., Term Loan, 4.50%, (USD LIBOR + 3.75%, Floor 0.75%), 12/29/27(12) | | | | | 825 | | | $ | 822,937 | |
| | | |
Emerald Performance Materials, LLC, Term Loan, 5.00%, (1 mo. USD LIBOR + 4.00%, Floor 1.00%), 8/12/25 | | | | | 393 | | | | 394,263 | |
| | | |
Ferro Corporation: | | | | | | | | | | |
| | | |
Term Loan, 2.453%, (3 mo. USD LIBOR + 2.25%), 2/14/24 | | | | | 158 | | | | 157,314 | |
| | | |
Term Loan, 2.453%, (3 mo. USD LIBOR + 2.25%), 2/14/24 | | | | | 161 | | | | 160,735 | |
| | | |
Term Loan, 2.453%, (3 mo. USD LIBOR + 2.25%), 2/14/24 | | | | | 196 | | | | 195,436 | |
| | | |
Flint Group GmbH, Term Loan, 6.00%, (USD LIBOR + 5.00%, Floor 1.00%), 5.25% cash, 0.75% PIK, 9/21/23(12) | | | | | 157 | | | | 155,122 | |
| | | |
Flint Group US, LLC, Term Loan, 6.00%, (USD LIBOR + 5.00%, Floor 1.00%), 5.25% cash, 0.75% PIK, 9/21/23(12) | | | | | 947 | | | | 938,360 | |
| | | |
Gemini HDPE, LLC, Term Loan, 3.50%, (3 mo. USD LIBOR + 3.00%, Floor 0.50%), 12/31/27 | | | | | 814 | | | | 814,506 | |
| | | |
H.B. Fuller Company, Term Loan, 2.099%, (1 mo. USD LIBOR + 2.00%), 10/20/24 | | | | | 1,108 | | | | 1,108,135 | |
| | | |
Hexion, Inc.: | | | | | | | | | | |
| | | |
Term Loan, 3.71%, (3 mo. USD LIBOR + 3.50%), 7/1/26 | | | | | 761 | | | | 761,279 | |
| | | |
Term Loan, 4.00%, (3 mo. EURIBOR + 4.00%), 7/1/26 | | EUR | | | 1,129 | | | | 1,381,134 | |
| | | |
Illuminate Buyer, LLC, Term Loan, 3.593%, (1 mo. USD LIBOR + 3.50%), 6/30/27 | | | | | 848 | | | | 844,166 | |
| | | |
INEOS 226 Limited, Term Loan, 2.75%, (3 mo. EURIBOR + 2.75%), 1/29/26 | | EUR | | | 2,600 | | | | 3,151,150 | |
| | | |
INEOS Enterprises Holdings II Limited, Term Loan, 3.25%, (3 mo. EURIBOR + 3.25%), 8/31/26 | | EUR | | | 200 | | | | 243,783 | |
| | | |
INEOS Enterprises Holdings US Finco, LLC, Term Loan, 4.50%, (3 mo. USD LIBOR + 3.50%, Floor 1.00%), 8/28/26 | | | | | 223 | | | | 223,626 | |
| | | |
INEOS Finance PLC, Term Loan, 2.50%, (1 mo. EURIBOR + 2.00%, Floor 0.50%), 4/1/24 | | EUR | | | 1,669 | | | | 2,026,249 | |
| | | |
INEOS Styrolution US Holding, LLC, Term Loan, 3.25%, (3 mo. USD LIBOR + 2.75%, Floor 0.50%), 1/29/26 | | | | | 2,750 | | | | 2,742,437 | |
| | | |
Lonza Group AG, Term Loan, 4/29/28(14) | | | | | 1,500 | | | | 1,501,641 | |
| | | |
LSF11 Skyscraper Holdco S.a.r.l.: | | | | | | | | | | |
| | | |
Term Loan, 3.50%, (3 mo. EURIBOR + 3.50%), 9/29/27 | | EUR | | | 1,650 | | | | 2,008,498 | |
| | | |
Term Loan, 4.50%, (2 mo. USD LIBOR + 3.75%, Floor 0.75%), 9/29/27 | | | | | 675 | | | | 678,797 | |
| | | |
Messer Industries GmbH, Term Loan, 2.703%, (3 mo. USD LIBOR + 2.50%), 3/1/26 | | | | | 1,484 | | | | 1,474,760 | |
| | | |
Minerals Technologies, Inc., Term Loan, 3.00%, (1 mo. USD LIBOR + 2.25%, Floor 0.75%), 2/14/24 | | | | | 773 | | | | 775,719 | |
| | | | |
| | 14 | | See Notes to Financial Statements. |
Eaton Vance
Floating-Rate Income Trust
May 31, 2021
Portfolio of Investments — continued
| | | | | | | | | | | | |
| Borrower/Description | | | | | Principal
Amount*
(000’s omitted) | | | Value | |
|
| Chemicals and Plastics (continued) | |
| | | |
Momentive Performance Materials, Inc., Term Loan, 3.35%, (1 mo. USD LIBOR + 3.25%), 5/15/24 | | | | | | | 467 | | | $ | 464,500 | |
| | | |
PMHC II, Inc., Term Loan, 4.50%, (3 mo. USD LIBOR + 3.50%, Floor 1.00%), 3/31/25 | | | | | | | 1,668 | | | | 1,660,558 | |
| | | |
PQ Corporation: | | | | | | | | | | | | |
| | | |
Term Loan, 2.436%, (3 mo. USD LIBOR + 2.25%), 2/7/27 | | | | | | | 1,583 | | | | 1,576,057 | |
| | | |
Term Loan, 4.00%, (1 mo. USD LIBOR + 3.00%, Floor 1.00%), 2/7/27 | | | | | | | 1,565 | | | | 1,566,158 | |
| | | |
Pregis TopCo Corporation, Term Loan, 3.843%, (1 mo. USD LIBOR + 3.75%), 7/31/26 | | | | | | | 667 | | | | 665,896 | |
| | | |
Rohm Holding GmbH, Term Loan, 4.978%, (6 mo. USD LIBOR + 4.75%), 7/31/26 | | | | | | | 395 | | | | 395,234 | |
| | | |
Solenis Holdings, LLC, Term Loan, 4.00%, (EURIBOR + 4.00%),
6/26/25(12) | | | EUR | | | | 274 | | | | 335,738 | |
| | | |
Starfruit Finco B.V.: | | | | | | | | | | | | |
| | | |
Term Loan, 2.848%, (1 mo. USD LIBOR + 2.75%), 10/1/25 | | | | | | | 1,487 | | | | 1,476,558 | |
| | | |
Term Loan, 3.00%, (1 mo. EURIBOR + 3.00%), 10/1/25 | | | EUR | | | | 448 | | | | 545,740 | |
| | | |
Tronox Finance, LLC, Term Loan, 2.642%, (USD LIBOR + 2.50%), 3/13/28(12) | | | | | | | 2,256 | | | | 2,243,237 | |
| | | |
Univar, Inc., Term Loan, 2.343%, (1 mo. USD LIBOR + 2.25%), 7/1/24 | | | | | | | 1,953 | | | | 1,953,674 | |
| | | |
Venator Materials Corporation, Term Loan, 3.093%, (1 mo. USD LIBOR + 3.00%), 8/8/24 | | | | | | | 410 | | | | 407,562 | |
| | | |
| | | | | | | | | | | $ | 44,855,400 | |
|
| Conglomerates — 0.3% | |
| | | |
Conair Holdings, LLC, Term Loan, 5/17/28(14) | | | | | | | 1,825 | | | $ | 1,834,981 | |
| | | |
Penn Engineering & Manufacturing Corp., Term Loan, 3.75%, (1 mo. USD LIBOR + 2.75%, Floor 1.00%), 6/27/24 | | | | | | | 184 | | | | 184,046 | |
| | | |
| | | | | | | | | | | $ | 2,019,027 | |
|
| Containers and Glass Products — 2.4% | |
| | | |
BWAY Holding Company, Term Loan, 3.385%, (3 mo. USD LIBOR + 3.25%), 4/3/24 | | | | | | | 2,489 | | | $ | 2,432,670 | |
| | | |
Flex Acquisition Company, Inc.: | | | | | | | | | | | | |
| | | |
Term Loan, 3.452%, (3 mo. USD LIBOR + 3.25%), 6/29/25 | | | | | | | 1,499 | | | | 1,483,856 | |
| | | |
Term Loan, 4.00%, (3 mo. USD LIBOR + 3.50%, Floor 0.50%), 2/23/28 | | | | | | | 3,438 | | | | 3,426,198 | |
| | | |
Libbey Glass, Inc., Term Loan, 9.00%, (6 mo. USD LIBOR + 8.00%, Floor 1.00%), 11/12/25 | | | | | | | 823 | | | | 817,123 | |
| | | |
Proampac PG Borrower, LLC, Term Loan, 4.50%, (USD LIBOR + 3.75%, Floor 0.75%), 11/3/25(12) | | | | | | | 425 | | | | 425,974 | |
| | | | | | | | | | | | |
| Borrower/Description | | | | | Principal
Amount*
(000’s omitted) | | | Value | |
|
| Containers and Glass Products (continued) | |
| | | |
Reynolds Group Holdings, Inc.: | | | | | | | | | | | | |
| | | |
Term Loan, 2.843%, (1 mo. USD LIBOR + 2.75%), 2/5/23 | | | | | | | 2,146 | | | $ | 2,145,035 | |
| | | |
Term Loan, 3.343%, (1 mo. USD LIBOR + 3.25%), 2/5/26 | | | | | | | 1,546 | | | | 1,535,656 | |
| | | |
TricorBraun Holdings, Inc.: | | | | | | | | | | | | |
| | | |
Term Loan, 1.696%, (3 mo. USD LIBOR + 3.25%, Floor 0.50%), 3/3/28(13) | | | | | | | 124 | | | | 123,196 | |
| | | |
Term Loan, 3.75%, (3 mo. USD LIBOR + 3.25%, Floor 0.50%), 3/3/28 | | | | | | | 551 | | | | 547,711 | |
| | | |
Trident TPI Holdings, Inc., Term Loan, 4.00%, (3 mo. USD LIBOR + 3.00%, Floor 1.00%), 10/17/24 | | | | | | | 751 | | | | 750,032 | |
| | | |
| | | | | | | | | | | $ | 13,687,451 | |
|
| Cosmetics / Toiletries — 0.2% | |
| | | |
Kronos Acquisition Holdings, Inc., Term Loan, 4.25%, (3 mo. USD LIBOR + 3.75%, Floor 0.50%), 12/22/26 | | | | | | | 1,421 | | | $ | 1,411,813 | |
| | | |
| | | | | | | | | | | $ | 1,411,813 | |
|
| Drugs — 6.5% | |
| | | |
Aenova Holding GmbH, Term Loan, 5.00%, (3 mo. EURIBOR + 5.00%), 3/6/25 | | | EUR | | | | 200 | | | $ | 245,541 | |
| | | |
Akorn, Inc., Term Loan, 8.50%, (3 mo. USD LIBOR + 7.50%, Floor 1.00%), 10/1/25 | | | | | | | 864 | | | | 888,608 | |
| | | |
Albany Molecular Research, Inc.: | | | | | | | | | | | | |
| | | |
Term Loan, 4.25%, (USD LIBOR + 3.25%, Floor 1.00%), 8/30/24(12) | | | | | | | 820 | | | | 822,941 | |
| | | |
Term Loan, 4.50%, (USD LIBOR + 3.50%, Floor 1.00%), 8/30/24(12) | | | | | | | 274 | | | | 275,513 | |
| | | |
Alkermes, Inc., Term Loan, 3.00%, (3 mo. USD LIBOR + 2.50%, Floor 0.50%), 3/9/26 | | | | | | | 393 | | | | 391,614 | |
| | | |
Amneal Pharmaceuticals, LLC, Term Loan, 3.625%, (1 mo. USD LIBOR + 3.50%), 5/4/25 | | | | | | | 3,675 | | | | 3,622,473 | |
| | | |
Arbor Pharmaceuticals, Inc., Term Loan, 6.00%, (3 mo. USD LIBOR + 5.00%, Floor 1.00%), 7/5/23 | | | | | | | 878 | | | | 874,067 | |
| | | |
Bausch Health Companies, Inc., Term Loan, 3.093%, (1 mo. USD LIBOR + 3.00%), 6/2/25 | | | | | | | 4,947 | | | | 4,935,692 | |
| | | |
Cambrex Corporation, Term Loan, 4.25%, (1 mo. USD LIBOR + 3.50%, Floor 0.75%), 12/4/26 | | | | | | | 324 | | | | 325,849 | |
| | | |
Catalent Pharma Solutions, Inc., Term Loan, 2.50%, (1 mo. USD LIBOR + 2.00%, Floor 0.50%), 2/22/28 | | | | | | | 860 | | | | 863,315 | |
| | | |
Elanco Animal Health Incorporated, Term Loan, 1.86%, (1 mo. USD LIBOR + 1.75%), 8/2/27 | | | | | | | 636 | | | | 632,305 | |
| | | |
Grifols Worldwide Operations USA, Inc., Term Loan, 2.062%, (1 week USD LIBOR + 2.00%), 11/15/27 | | | | | | | 2,525 | | | | 2,505,452 | |
| | | | |
| | 15 | | See Notes to Financial Statements. |
Eaton Vance
Floating-Rate Income Trust
May 31, 2021
Portfolio of Investments — continued
| | | | | | | | | | | | |
| Borrower/Description | | | | | Principal
Amount*
(000’s omitted) | | | Value | |
|
| Drugs (continued) | |
| | | |
Horizon Therapeutics USA, Inc.: | | | | | | | | | | | | |
| | | |
Term Loan, 2.125%, (1 mo. USD LIBOR + 2.00%), 5/22/26 | | | | | | | 2,196 | | | $ | 2,190,859 | |
| | | |
Term Loan, 2.50%, (1 mo. USD LIBOR + 2.00%, Floor 0.50%), 3/15/28 | | | | | | | 2,350 | | | | 2,347,063 | |
| | | |
Jazz Financing Lux S.a.r.l., Term Loan, 4.00%, (1 mo. USD LIBOR + 3.50%, Floor 0.50%), 4/21/28 | | | | | | | 1,950 | | | | 1,960,795 | |
| | | |
Mallinckrodt International Finance S.A.: | | | | | | | | | | | | |
| | | |
Term Loan, 6.00%, (6 mo. USD LIBOR + 5.25%, Floor 0.75%), 9/24/24 | | | | | | | 5,346 | | | | 5,179,009 | |
| | | |
Term Loan, 6.25%, (6 mo. USD LIBOR + 5.50%, Floor 0.75%), 2/24/25 | | | | | | | 3,069 | | | | 2,965,858 | |
| | | |
Nidda Healthcare Holding AG, Term Loan, 3.50%, (3 mo. EURIBOR + 3.50%), 8/21/26 | | | EUR | | | | 625 | | | | 757,869 | |
| | | |
PPD, Inc., Term Loan, 2.75%, (1 mo. USD LIBOR + 2.25%, Floor 0.50%), 1/13/28 | | | | | | | 5,800 | | | | 5,798,794 | |
| | | |
| | | | | | | | | | | $ | 37,583,617 | |
|
| Ecological Services and Equipment — 0.5% | |
| | | |
EnergySolutions, LLC, Term Loan, 4.75%, (3 mo. USD LIBOR + 3.75%, Floor 1.00%), 5/9/25 | | | | | | | 1,854 | | | $ | 1,844,094 | |
| | | |
GFL Environmental, Inc., Term Loan, 3.50%, (1 mo. USD LIBOR + 3.00%, Floor 0.50%), 5/30/25 | | | | | | | 50 | | | | 50,034 | |
| | | |
TruGreen Limited Partnership, Term Loan, 4.75%, (1 mo. USD LIBOR + 4.00%, Floor 0.75%), 11/2/27 | | | | | | | 648 | | | | 651,313 | |
| | | |
US Ecology Holdings, Inc., Term Loan, 2.593%, (1 mo. USD LIBOR + 2.50%), 11/1/26 | | | | | | | 272 | | | | 272,208 | |
| | | |
| | | | | | | | | | | $ | 2,817,649 | |
|
| Electronics / Electrical — 25.2% | |
| | | |
Allegro Microsystems, Inc., Term Loan, 4.25%, (3 mo. USD LIBOR + 3.75%, Floor 0.50%), 9/30/27 | | | | | | | 48 | | | $ | 48,017 | |
| | | |
Applied Systems, Inc.: | | | | | | | | | | | | |
| | | |
Term Loan, 3.75%, (1 mo. USD LIBOR + 3.25%, Floor 0.50%), 9/19/24 | | | | | | | 2,175 | | | | 2,183,156 | |
| | | |
Term Loan - Second Lien, 6.25%, (3 mo. USD LIBOR + 5.50%, Floor 0.75%), 9/19/25 | | | | | | | 2,671 | | | | 2,707,564 | |
| | | |
Aptean, Inc., Term Loan, 4.343%, (1 mo. USD LIBOR + 4.25%), 4/23/26 | | | | | | | 761 | | | | 760,405 | |
| | | |
AQA Acquisition Holding, Inc., Term Loan, 4.75%, (3 mo. USD LIBOR + 4.25%, Floor 0.50%), 3/3/28 | | | | | | | 975 | | | | 978,656 | |
| | | |
Astra Acquisition Corp., Term Loan, 5.50%, (1 mo. USD LIBOR + 4.75%, Floor 0.75%), 3/1/27 | | | | | | | 868 | | | | 874,951 | |
| | | |
Banff Merger Sub, Inc.: | | | | | | | | | | | | |
| | | |
Term Loan, 3.843%, (1 mo. USD LIBOR + 3.75%), 10/2/25 | | | | | | | 3,770 | | | | 3,756,952 | |
| | | |
Term Loan, 4.00%, (3 mo. EURIBOR + 4.00%), 10/2/25 | | | EUR | | | | 293 | | | | 359,039 | |
| | | | | | | | | | |
| Borrower/Description | | | | Principal
Amount*
(000’s omitted) | | | Value | |
|
| Electronics / Electrical (continued) | |
| | | |
Barracuda Networks, Inc., Term Loan - Second Lien, 7.50%, (3 mo. USD LIBOR + 6.75%, Floor 0.75%), 10/30/28 | | | | | 450 | | | $ | 459,563 | |
| | | |
Buzz Merger Sub, Ltd.: | | | | | | | | | | |
| | | |
Term Loan, 2.843%, (1 mo. USD LIBOR + 2.75%), 1/29/27 | | | | | 594 | | | | 592,144 | |
| | | |
Term Loan, 3.75%, (1 mo. USD LIBOR + 3.25%, Floor 0.50%), 1/29/27 | | | | | 67 | | | | 66,974 | |
| | | |
Cambium Learning Group, Inc., Term Loan, 4.703%, (3 mo. USD LIBOR + 4.50%), 12/18/25 | | | | | 1,445 | | | | 1,451,961 | |
| | | |
Celestica, Inc., Term Loan, 2.59%, (1 mo. USD LIBOR + 2.50%), 6/27/25 | | | | | 218 | | | | 217,228 | |
| | | |
CentralSquare Technologies, LLC, Term Loan, 3.953%, (3 mo. USD LIBOR + 3.75%), 8/29/25 | | | | | 904 | | | | 858,978 | |
| | | |
Cloudera, Inc., Term Loan, 3.25%, (1 mo. USD LIBOR + 2.50%, Floor 0.75%), 12/22/27 | | | | | 673 | | | | 673,453 | |
| | | |
Cohu, Inc., Term Loan, 3.172%, (6 mo. USD LIBOR + 3.00%), 10/1/25 | | | | | 540 | | | | 539,131 | |
| | | |
CommScope, Inc., Term Loan, 3.343%, (1 mo. USD LIBOR + 3.25%), 4/6/26 | | | | | 1,822 | | | | 1,818,454 | |
| | | |
Concorde Midco, Ltd., Term Loan, 4.00%, (6 mo. EURIBOR + 4.00%), 3/1/28 | | EUR | | | 575 | | | | 701,512 | |
| | | |
Constant Contact, Inc.: | | | | | | | | | | |
| | | |
Term Loan, 4.50%, 2/10/28(13) | | | | | 434 | | | | 433,846 | |
| | | |
Term Loan, 4.75%, (6 mo. USD LIBOR + 4.00%, Floor 0.75%), 2/10/28 | | | | | 1,616 | | | | 1,614,872 | |
| | | |
Cornerstone OnDemand, Inc., Term Loan, 3.343%, (1 mo. USD LIBOR + 3.25%), 4/22/27 | | | | | 1,543 | | | | 1,545,978 | |
| | | |
CPI International, Inc., Term Loan, 4.50%, (1 mo. USD LIBOR + 3.50%, Floor 1.00%), 7/26/24 | | | | | 660 | | | | 660,588 | |
| | | |
Delta TopCo, Inc.: | | | | | | | | | | |
| | | |
Term Loan, 4.50%, (3 mo. USD LIBOR + 3.75%, Floor 0.75%), 12/1/27 | | | | | 1,575 | | | | 1,580,086 | |
| | | |
Term Loan - Second Lien, 8.00%, (3 mo. USD LIBOR + 7.25%, Floor 0.75%), 12/1/28 | | | | | 2,250 | | | | 2,295,000 | |
| | | |
E2open, LLC, Term Loan, 4.00%, (3 mo. USD LIBOR + 3.50%, Floor 0.50%), 2/4/28 | | | | | 975 | | | | 973,477 | |
| | | |
ECI Macola Max Holdings, LLC, Term Loan, 4.50%, (3 mo. USD LIBOR + 3.75%, Floor 0.75%), 11/9/27 | | | | | 1,222 | | | | 1,225,451 | |
| | | |
Electro Rent Corporation, Term Loan, 6.00%, (3 mo. USD LIBOR + 5.00%, Floor 1.00%), 1/31/24 | | | | | 1,736 | | | | 1,749,106 | |
| | | |
Energizer Holdings, Inc., Term Loan, 2.75%, (1 mo. USD LIBOR + 2.25%, Floor 0.50%), 12/22/27 | | | | | 1,200 | | | | 1,201,621 | |
| | | |
Epicor Software Corporation: | | | | | | | | | | |
| | | |
Term Loan, 4.00%, (1 mo. USD LIBOR + 3.25%, Floor 0.75%), 7/30/27 | | | | | 5,132 | | | | 5,134,531 | |
| | | |
Term Loan - Second Lien, 8.75%, (1 mo. USD LIBOR + 7.75%, Floor 1.00%), 7/31/28 | | | | | 925 | | | | 955,063 | |
| | | | |
| | 16 | | See Notes to Financial Statements. |
Eaton Vance
Floating-Rate Income Trust
May 31, 2021
Portfolio of Investments — continued
| | | | | | | | | | |
| Borrower/Description | | | | Principal
Amount*
(000’s omitted) | | | Value | |
|
| Electronics / Electrical (continued) | |
| | | |
EXC Holdings III Corp., Term Loan, 4.50%, (3 mo. USD LIBOR + 3.50%, Floor 1.00%), 12/2/24 | | | | | 1,646 | | | $ | 1,650,288 | |
| | | |
Finastra USA, Inc., Term Loan, 4.50%, (6 mo. USD LIBOR + 3.50%, Floor 1.00%), 6/13/24 | | | | | 5,693 | | | | 5,629,579 | |
| | | |
Fiserv Investment Solutions, Inc., Term Loan, 4.155%, (3 mo. USD LIBOR + 4.00%), 2/18/27 | | | | | 596 | | | | 597,454 | |
| | | |
Gainwell Acquisition Corp., Term Loan, 4.75%, (3 mo. USD LIBOR + 4.00%, Floor 0.75%), 10/1/27 | | | | | 6,442 | | | | 6,462,382 | |
| | | |
GlobalLogic Holdings, Inc.: | | | | | | | | | | |
| | | |
Term Loan, 2.843%, (1 mo. USD LIBOR + 2.75%), 8/1/25 | | | | | 449 | | | | 450,525 | |
| | | |
Term Loan, 4.50%, (1 mo. USD LIBOR + 3.75%, Floor 0.75%), 9/14/27 | | | | | 821 | | | | 824,081 | |
| | | |
Go Daddy Operating Company, LLC, Term Loan, 2.093%, (1 mo. USD LIBOR + 2.00%), 8/10/27 | | | | | 1,216 | | | | 1,211,760 | |
| | | |
Hyland Software, Inc.: | | | | | | | | | | |
| | | |
Term Loan, 4.25%, (1 mo. USD LIBOR + 3.50%, Floor 0.75%), 7/1/24 | | | | | 6,429 | | | | 6,457,460 | |
| | | |
Term Loan - Second Lien, 7.00%, (1 mo. USD LIBOR + 6.25%, Floor 0.75%), 7/7/25 | | | | | 3,806 | | | | 3,826,217 | |
| | | |
Imperva, Inc., Term Loan, 5.00%, (3 mo. USD LIBOR + 4.00%, Floor 1.00%), 1/12/26 | | | | | 647 | | | | 650,414 | |
| | | |
Imprivata, Inc., Term Loan, 4.25%, (1 mo. USD LIBOR + 3.75%, Floor 0.50%), 12/1/27 | | | | | 1,300 | | | | 1,303,714 | |
| | | |
Informatica, LLC: | | | | | | | | | | |
| | | |
Term Loan, 3.25%, (3 mo. EURIBOR + 3.25%), 2/25/27 | | EUR | | | 297 | | | | 360,275 | |
| | | |
Term Loan, 3.343%, (1 mo. USD LIBOR + 3.25%), 2/25/27 | | | | | 6,410 | | | | 6,383,705 | |
| | | |
Term Loan - Second Lien, 7.125%, 2/25/25(15) | | | | | 550 | | | | 563,521 | |
| | | |
Liftoff Mobile, Inc., Term Loan, 4.25%, (3 mo. USD LIBOR + 3.50%, Floor 0.75%), 3/17/28 | | | | | 549 | | | | 548,625 | |
| | | |
LogMeIn, Inc., Term Loan, 4.845%, (1 mo. USD LIBOR + 4.75%), 8/31/27 | | | | | 2,045 | | | | 2,047,856 | |
| | | |
MA FinanceCo., LLC: | | | | | | | | | | |
| | | |
Term Loan, 2.843%, (1 mo. USD LIBOR + 2.75%), 6/21/24 | | | | | 494 | | | | 489,478 | |
| | | |
Term Loan, 4.50%, (3 mo. EURIBOR + 4.50%), 6/5/25 | | EUR | | | 736 | | | | 910,714 | |
| | | |
Term Loan, 5.25%, (3 mo. USD LIBOR + 4.25%, Floor 1.00%), 6/5/25 | | | | | 1,864 | | | | 1,884,184 | |
| | | |
Magenta Buyer, LLC: | | | | | | | | | | |
| | | |
Term Loan, 5/3/28(14) | | | | | 4,650 | | | | 4,664,048 | |
| | | |
Term Loan - Second Lien, 5/3/29(14) | | | | | 1,250 | | | | 1,246,875 | |
| | | |
Marcel LUX IV S.a.r.l., Term Loan, 4.75%, (1 mo. USD LIBOR + 4.00%, Floor 0.75%), 12/31/27 | | | | | 112 | | | | 111,793 | |
| | | |
MaxLinear, Inc., Term Loan, 4.343%, (1 mo. USD LIBOR + 4.25%), 7/31/23 | | | | | 965 | | | | 964,955 | |
| | | | | | | | | | |
| Borrower/Description | | | | Principal
Amount*
(000’s omitted) | | | Value | |
|
| Electronics / Electrical (continued) | |
| | | |
Mirion Technologies, Inc., Term Loan, 4.203%, (3 mo. USD LIBOR + 4.00%), 3/6/26 | | | | | 1,361 | | | $ | 1,369,433 | |
| | | |
NCR Corporation, Term Loan, 2.69%, (3 mo. USD LIBOR + 2.50%), 8/28/26 | | | | | 1,541 | | | | 1,533,327 | |
| | | |
Panther Commercial Holdings L.P., Term Loan, 5.00%, (3 mo. USD LIBOR + 4.50%, Floor 0.50%), 1/7/28 | | | | | 650 | | | | 651,524 | |
| | | |
PointClickCare Technologies, Inc., Term Loan, 3.75%, (6 mo. USD LIBOR + 3.00%, Floor 0.75%), 12/29/27 | | | | | 675 | | | | 676,688 | |
| | | |
ProQuest, LLC, Term Loan, 3.343%, (1 mo. USD LIBOR + 3.25%), 10/23/26 | | | | | 2,131 | | | | 2,132,828 | |
| | | |
Rackspace Technology Global, Inc., Term Loan, 3.50%, (3 mo. USD LIBOR + 2.75%, Floor 0.75%), 2/15/28 | | | | | 1,600 | | | | 1,594,546 | |
| | | |
RealPage, Inc., Term Loan, 3.75%, (1 mo. USD LIBOR + 3.25%, Floor 0.50%), 4/24/28 | | | | | 2,550 | | | | 2,550,354 | |
| | | |
Recorded Books, Inc., Term Loan, 4.108%, (1 mo. USD LIBOR + 4.00%), 8/29/25 | | | | | 2,520 | | | | 2,525,080 | |
| | | |
Renaissance Holding Corp.: | | | | | | | | | | |
| | | |
Term Loan, 3.343%, (1 mo. USD LIBOR + 3.25%), 5/30/25 | | | | | 99 | | | | 98,598 | |
| | | |
Term Loan - Second Lien, 7.093%, (1 mo. USD LIBOR + 7.00%), 5/29/26 | | | | | 200 | | | | 201,250 | |
| | | |
Riverbed Technology, Inc., Term Loan - Second Lien, 12.00%, (3 mo. USD LIBOR + 11.00%, Floor 1.00%), 7.50% cash, 4.50% PIK, 12/31/26 | | | | | 23 | | | | 18,142 | |
| | | |
Seattle Spinco, Inc., Term Loan, 2.843%, (1 mo. USD LIBOR + 2.75%), 6/21/24 | | | | | 3,334 | | | | 3,305,564 | |
| | | |
SkillSoft Corporation: | | | | | | | | | | |
| | | |
Term Loan, 8.50%, (3 mo. USD LIBOR + 7.50%, Floor 1.00%), 12/27/24 | | | | | 451 | | | | 463,314 | |
| | | |
Term Loan - Second Lien, 8.50%, (3 mo. USD LIBOR + 7.50%, Floor 1.00%), 4/27/25 | | | | | 1,489 | | | | 1,492,244 | |
| | | |
SolarWinds Holdings, Inc., Term Loan, 2.843%, (1 mo. USD LIBOR + 2.75%), 2/5/24 | | | | | 3,394 | | | | 3,350,699 | |
| | | |
Solera, LLC, Term Loan, 2.843%, (1 mo. USD LIBOR + 2.75%), 3/3/23 | | | | | 2,772 | | | | 2,772,973 | |
| | | |
Sophia L.P., Term Loan, 4.50%, (3 mo. USD LIBOR + 3.75%, Floor 0.75%), 10/7/27 | | | | | 449 | | | | 450,605 | |
| | | |
SurveyMonkey, Inc., Term Loan, 3.82%, (1 week USD LIBOR + 3.75%), 10/10/25 | | | | | 1,037 | | | | 1,034,158 | |
| | | |
Symplr Software, Inc., Term Loan, 5.25%, (6 mo. USD LIBOR + 4.50%, Floor 0.75%), 12/22/27 | | | | | 875 | | | | 878,719 | |
| | | |
Tech Data Corporation, Term Loan, 3.593%, (1 mo. USD LIBOR + 3.50%), 6/30/25 | | | | | 1,194 | | | | 1,198,179 | |
| | | |
Thoughtworks, Inc., Term Loan, 3.75%, (1 mo. USD LIBOR + 3.25%, Floor 0.50%), 3/23/28 | | | | | 475 | | | | 475,000 | |
| | | |
Tibco Software, Inc.: | | | | | | | | | | |
| | | |
Term Loan, 3.85%, (1 mo. USD LIBOR + 3.75%), 6/30/26 | | | | | 5,319 | | | | 5,307,525 | |
| | | |
Term Loan - Second Lien, 7.35%, (1 mo. USD LIBOR + 7.25%), 3/3/28 | | | | | 1,350 | | | | 1,372,500 | |
| | | | |
| | 17 | | See Notes to Financial Statements. |
Eaton Vance
Floating-Rate Income Trust
May 31, 2021
Portfolio of Investments — continued
| | | | | | | | | | | | |
| Borrower/Description | | | | | Principal
Amount*
(000’s omitted) | | | Value | |
|
| Electronics / Electrical (continued) | |
| | | |
TTM Technologies, Inc., Term Loan, 2.607%, (1 mo. USD LIBOR + 2.50%), 9/28/24 | | | | | | | 150 | | | $ | 150,279 | |
| | | |
Uber Technologies, Inc.: | | | | | | | | | | | | |
| | | |
Term Loan, 3.593%, (1 mo. USD LIBOR + 3.50%), 4/4/25 | | | | | | | 2,703 | | | | 2,707,569 | |
| | | |
Term Loan, 3.593%, (1 mo. USD LIBOR + 3.50%), 2/16/27 | | | | | | | 4,206 | | | | 4,212,159 | |
| | | |
Ultimate Software Group, Inc. (The): | | | | | | | | | | | | |
| | | |
Term Loan, 3.843%, (1 mo. USD LIBOR + 3.75%), 5/4/26 | | | | | | | 1,748 | | | | 1,752,503 | |
| | | |
Term Loan, 4.00%, (3 mo. USD LIBOR + 3.25%, Floor 0.75%), 5/4/26 | | | | | | | 4,603 | | | | 4,617,160 | |
| | | |
Term Loan - Second Lien, 7.50%, (3 mo. USD LIBOR + 6.75%, Floor 0.75%), 5/3/27 | | | | | | | 275 | | | | 283,938 | |
| | | |
Ultra Clean Holdings, Inc., Term Loan, 3.843%, (1 mo. USD LIBOR + 3.75%), 8/27/25 | | | | | | | 1,407 | | | | 1,411,260 | |
| | | |
Valkyr Purchaser, LLC, Term Loan, 4.75%, (3 mo. USD LIBOR + 4.00%, Floor 0.75%), 10/29/27 | | | | | | | 800 | | | | 804,000 | |
| | | |
Verifone Systems, Inc., Term Loan, 4.147%, (3 mo. USD LIBOR + 4.00%), 8/20/25 | | | | | | | 1,244 | | | | 1,229,791 | |
| | | |
Verisure Holding AB, Term Loan, 3.50%, (3 mo. EURIBOR + 3.50%), 3/27/28 | | | EUR | | | | 850 | | | | 1,034,994 | |
| | | |
Veritas US, Inc.: | | | | | | | | | | | | |
| | | |
Term Loan, 5.75%, (3 mo. EURIBOR + 4.75%, Floor 1.00%), 9/1/25 | | | EUR | | | | 371 | | | | 456,545 | |
| | | |
Term Loan, 6.00%, (3 mo. USD LIBOR + 5.00%, Floor 1.00%), 9/1/25 | | | | | | | 2,736 | | | | 2,760,210 | |
| | | |
VS Buyer, LLC, Term Loan, 3.093%, (1 mo. USD LIBOR + 3.00%), 2/28/27 | | | | | | | 1,238 | | | | 1,233,890 | |
| | | |
Vungle, Inc., Term Loan, 5.593%, (1 mo. USD LIBOR + 5.50%), 9/30/26 | | | | | | | 714 | | | | 717,249 | |
| | | |
| | | | | | | | | | | $ | 146,482,457 | |
|
| Equipment Leasing — 0.7% | |
| | | |
Avolon TLB Borrower 1 (US), LLC, Term Loan, 3.25%, (1 mo. USD LIBOR + 2.50%, Floor 0.75%), 12/1/27 | | | | | | | 2,020 | | | $ | 2,026,125 | |
| | | |
Boels Topholding B.V., Term Loan, 4.00%, (3 mo. EURIBOR + 4.00%), 2/6/27 | | | EUR | | | | 600 | | | | 731,996 | |
| | | |
Fly Funding II S.a.r.l., Term Loan, 7.00%, (3 mo. USD LIBOR + 6.00%, Floor 1.00%), 10/8/25 | | | | | | | 1,292 | | | | 1,303,179 | |
| | | |
| | | | | | | | | | | $ | 4,061,300 | |
|
| Financial Intermediaries — 2.8% | |
| | | |
Aretec Group, Inc., Term Loan, 4.343%, (1 mo. USD LIBOR + 4.25%), 10/1/25 | | | | | | | 5,049 | | | $ | 5,045,541 | |
| | | |
Citco Funding, LLC, Term Loan, 2.703%, (6 mo. USD LIBOR + 2.50%), 9/28/23 | | | | | | | 2,763 | | | | 2,761,813 | |
| | | | | | | | | | | | |
| Borrower/Description | | | | | Principal
Amount*
(000’s omitted) | | | Value | |
|
| Financial Intermediaries (continued) | |
| | | |
EIG Management Company, LLC, Term Loan, 4.50%, (1 mo. USD LIBOR + 3.75%, Floor 0.75%), 2/22/25 | | | | | | | 267 | | | $ | 266,528 | |
| | | |
Focus Financial Partners, LLC, Term Loan, 2.094%, (1 mo. USD LIBOR + 2.00%), 7/3/24 | | | | | | | 3,026 | | | | 3,000,973 | |
| | | |
Greenhill & Co., Inc., Term Loan, 3.343%, (1 mo. USD LIBOR + 3.25%), 4/12/24 | | | | | | | 537 | | | | 536,409 | |
| | | |
GreenSky Holdings, LLC: | | | | | | | | | | | | |
| | | |
Term Loan, 3.375%, (1 mo. USD LIBOR + 3.25%), 3/31/25 | | | | | | | 1,455 | | | | 1,425,900 | |
| | | |
Term Loan, 5.50%, (1 mo. USD LIBOR + 4.50%, Floor 1.00%), 3/29/25 | | | | | | | 496 | | | | 495,009 | |
| | | |
LPL Holdings, Inc., Term Loan, 1.843%, (1 mo. USD LIBOR + 1.75%), 11/12/26 | | | | | | | 1,481 | | | | 1,476,066 | |
| | | |
Victory Capital Holdings, Inc., Term Loan, 2.444%, (3 mo. USD LIBOR + 2.25%), 7/1/26 | | | | | | | 998 | | | | 996,909 | |
| | | |
Virtus Investment Partners, Inc., Term Loan, 3.00%, (6 mo. USD LIBOR + 2.25%, Floor 0.75%), 6/1/24 | | | | | | | 416 | | | | 416,064 | |
| | | |
| | | | | | | | | | | $ | 16,421,212 | |
|
| Food Products — 3.7% | |
| | | |
Alphabet Holding Company, Inc., Term Loan, 3.593%, (1 mo. USD LIBOR + 3.50%), 9/26/24 | | | | | | | 2,509 | | | $ | 2,508,478 | |
| | | |
B&G Foods, Inc., Term Loan, 2.593%, (1 mo. USD LIBOR + 2.50%), 10/10/26 | | | | | | | 402 | | | | 402,565 | |
| | | |
Badger Buyer Corp., Term Loan, 4.50%, (1 mo. USD LIBOR + 3.50%, Floor 1.00%), 9/30/24 | | | | | | | 362 | | | | 353,280 | |
| | | |
CHG PPC Parent, LLC: | | | | | | | | | | | | |
| | | |
Term Loan, 2.843%, (1 mo. USD LIBOR + 2.75%), 3/31/25 | | | | | | | 511 | | | | 508,648 | |
| | | |
Term Loan, 3.50%, (1 mo. EURIBOR + 3.50%), 3/31/25 | | | EUR | | | | 3,125 | | | | 3,809,988 | |
| | | |
Froneri International, Ltd.: | | | | | | | | | | | | |
| | | |
Term Loan, 2.375%, (6 mo. EURIBOR + 2.375%), 1/29/27 | | | EUR | | | | 1,300 | | | | 1,561,956 | |
| | | |
Term Loan, 2.676%, (1 mo. USD LIBOR + 2.25%), 1/29/27 | | | | | | | 2,184 | | | | 2,156,615 | |
| | | |
H Food Holdings, LLC: | | | | | | | | | | | | |
| | | |
Term Loan, 3.78%, (1 mo. USD LIBOR + 3.69%), 5/23/25 | | | | | | | 1,731 | | | | 1,724,583 | |
| | | |
Term Loan, 4.093%, (1 mo. USD LIBOR + 4.00%), 5/23/25 | | | | | | | 489 | | | | 489,157 | |
| | | |
HLF Financing S.a.r.l., Term Loan, 2.593%, (1 mo. USD LIBOR + 2.50%), 8/18/25 | | | | | | | 801 | | | | 798,358 | |
| | | |
JBS USA LUX S.A., Term Loan, 2.093%, (1 mo. USD LIBOR + 2.00%), 5/1/26 | | | | | | | 4,361 | | | | 4,361,000 | |
| | | |
Nomad Foods Europe Midco Limited, Term Loan, 2.351%, (1 mo. USD LIBOR + 2.25%), 5/15/24 | | | | | | | 1,254 | | | | 1,246,248 | |
| | | |
Shearer’s Foods, Inc., Term Loan, 4.25%, (3 mo. USD LIBOR + 3.50%, Floor 0.75%), 9/23/27 | | | | | | | 448 | | | | 448,627 | |
| | | | |
| | 18 | | See Notes to Financial Statements. |
Eaton Vance
Floating-Rate Income Trust
May 31, 2021
Portfolio of Investments — continued
| | | | | | | | | | | | |
| Borrower/Description | | | | | Principal
Amount*
(000’s omitted) | | | Value | |
|
| Food Products (continued) | |
| | | |
Simply Good Foods USA, Inc., Term Loan, 4.75%, (1 mo. USD LIBOR + 3.75%, Floor 1.00%), 7/7/24 | | | | | | | 309 | | | $ | 310,848 | |
| | | |
UTZ Quality Foods, LLC, Term Loan, 3.093%, (1 mo. USD LIBOR + 3.00%), 1/20/28 | | | | | | | 175 | | | | 174,749 | |
| | | |
Wsof I New Finco B.V., Term Loan, 3.25%, (6 mo. EURIBOR + 3.25%), 3/19/28 | | | EUR | | | | 775 | | | | 943,892 | |
| | | |
| | | | | | | | | | | $ | 21,798,992 | |
|
| Food Service — 0.8% | |
| | | |
IRB Holding Corp.: | | | | | | | | | | | | |
| | | |
Term Loan, 3.75%, (USD LIBOR + 2.75%, Floor 1.00%), 2/5/25(12) | | | | | | | 2,514 | | | $ | 2,508,543 | |
| | | |
Term Loan, 4.25%, (3 mo. USD LIBOR + 3.25%, Floor 1.00%), 12/15/27 | | | | | | | 2,095 | | | | 2,093,964 | |
| | | |
| | | | | | | | | | | $ | 4,602,507 | |
|
| Food / Drug Retailers — 0.2% | |
| | | |
L1R HB Finance Limited: | | | | | | | | | | | | |
| | | |
Term Loan, 4.25%, (3 mo. EURIBOR + 4.25%), 8/9/24 | | | EUR | | | | 450 | | | $ | 535,292 | |
| | | |
Term Loan, 5.337%, (3 mo. GBP LIBOR + 5.25%), 9/2/24 | | | GBP | | | | 450 | | | | 621,655 | |
| | | |
| | | | | | | | | | | $ | 1,156,947 | |
|
| Forest Products — 0.5% | |
| | | |
Journey Personal Care Corp., Term Loan, 5.00%, (3 mo. USD LIBOR + 4.25%, Floor 0.75%), 3/1/28 | | | | | | | 1,275 | | | $ | 1,280,578 | |
| | | |
Neenah, Inc., Term Loan, 3.50%, (2 mo. USD LIBOR + 3.00%, Floor 0.50%), 4/6/28 | | | | | | | 1,468 | | | | 1,471,169 | |
| | | |
| | | | | | | | | | | $ | 2,751,747 | |
|
| Health Care — 13.7% | |
| | | |
Accelerated Health Systems, LLC, Term Loan, 3.593%, (1 mo. USD LIBOR + 3.50%), 10/31/25 | | | | | | | 562 | | | $ | 559,955 | |
| | | |
ADMI Corp., Term Loan, 2.843%, (1 mo. USD LIBOR + 2.75%), 4/30/25 | | | | | | | 1,799 | | | | 1,784,760 | |
| | | |
Alliance Healthcare Services, Inc., Term Loan, 5.50%, (1 mo. USD LIBOR + 4.50%, Floor 1.00%), 10/24/23 | | | | | | | 770 | | | | 732,686 | |
| | | |
athenahealth, Inc., Term Loan, 4.41%, (USD LIBOR + 4.25%), 2/11/26(12) | | | | | | | 2,640 | | | | 2,654,740 | |
| | | |
Avantor Funding, Inc.: | | | | | | | | | | | | |
| | | |
Term Loan, 3.00%, (1 mo. USD LIBOR + 2.00%, Floor 1.00%), 11/21/24 | | | | | | | 285 | | | | 285,657 | |
| | | |
Term Loan, 3.25%, (1 mo. USD LIBOR + 2.25%, Floor 1.00%), 11/8/27 | | | | | | | 449 | | | | 450,614 | |
| | | | | | | | | | |
| Borrower/Description | | | | Principal
Amount*
(000’s omitted) | | | Value | |
|
| Health Care (continued) | |
| | | |
Bayou Intermediate II, LLC, Term Loan, 5/13/28(14) | | | | | 875 | | | $ | 879,922 | |
| | | |
Biogroup-LCD, Term Loan, 3.50%, (6 mo. EURIBOR + 3.50%), 1/28/28 | | EUR | | | 250 | | | | 304,262 | |
| | | |
BW NHHC Holdco, Inc., Term Loan, 5.155%, (3 mo. USD LIBOR + 5.00%), 5/15/25 | | | | | 2,498 | | | | 2,318,486 | |
| | | |
Cano Health, LLC: | | | | | | | | | | |
| | | |
Term Loan, 5.344%, (6 mo. USD LIBOR + 4.75%, Floor 0.75%), 11/19/27(13) | | | | | 374 | | | | 374,572 | |
| | | |
Term Loan, 5.50%, (6 mo. USD LIBOR + 4.75%, Floor 0.75%), 11/19/27 | | | | | 1,023 | | | | 1,024,828 | |
| | | |
CCRR Parent, Inc., Term Loan, 5.00%, (3 mo. USD LIBOR + 4.25%, Floor 0.75%), 3/6/28 | | | | | 525 | | | | 527,297 | |
| | | |
CeramTec AcquiCo GmbH, Term Loan, 2.50%, (3 mo. EURIBOR + 2.50%), 3/7/25 | | EUR | | | 1,328 | | | | 1,584,645 | |
| | | |
Certara L.P., Term Loan, 3.703%, (3 mo. USD LIBOR + 3.50%), 8/15/24 | | | | | 962 | | | | 963,889 | |
| | | |
Change Healthcare Holdings, LLC, Term Loan, 3.50%, (USD LIBOR + 2.50%, Floor 1.00%), 3/1/24(12) | | | | | 4,915 | | | | 4,920,666 | |
| | | |
CHG Healthcare Services, Inc., Term Loan, 4.00%, (6 mo. USD LIBOR + 3.00%, Floor 1.00%), 6/7/23 | | | | | 3,431 | | | | 3,431,295 | |
| | | |
CryoLife, Inc., Term Loan, 4.25%, (3 mo. USD LIBOR + 3.25%, Floor 1.00%), 12/1/24 | | | | | 508 | | | | 509,630 | |
| | | |
Dedalus Finance GmbH: | | | | | | | | | | |
| | | |
Term Loan, 4.50%, (3 mo. EURIBOR + 4.50%), 5/4/27 | | EUR | | | 825 | | | | 1,011,076 | |
| | | |
Term Loan, 4.50%, (3 mo. EURIBOR + 4.50%), 8/16/27 | | EUR | | | 1,200 | | | | 1,470,656 | |
| | | |
DuPage Medical Group, Ltd., Term Loan, 4.00%, (3 mo. USD LIBOR + 3.25%, Floor 0.75%), 3/12/28 | | | | | 575 | | | | 575,103 | |
| | | |
Ensemble RCM, LLC, Term Loan, 3.936%, (3 mo. USD LIBOR + 3.75%), 8/3/26 | | | | | 1,490 | | | | 1,493,613 | |
| | | |
Envision Healthcare Corporation, Term Loan, 3.843%, (1 mo. USD LIBOR + 3.75%), 10/10/25 | | | | | 6,042 | | | | 5,181,189 | |
| | | |
eResearchTechnology, Inc., Term Loan, 5.50%, (1 mo. USD LIBOR + 4.50%, Floor 1.00%), 2/4/27 | | | | | 350 | | | | 351,695 | |
| | | |
Gentiva Health Services, Inc., Term Loan, 2.875%, (1 mo. USD LIBOR + 2.75%), 7/2/25 | | | | | 2,157 | | | | 2,154,819 | |
| | | |
GHX Ultimate Parent Corporation, Term Loan, 4.25%, (3 mo. USD LIBOR + 3.25%, Floor 1.00%), 6/28/24 | | | | | 965 | | | | 967,348 | |
| | | |
Greatbatch, Ltd., Term Loan, 3.50%, (1 mo. USD LIBOR + 2.50%, Floor 1.00%), 10/27/22 | | | | | 1,271 | | | | 1,274,381 | |
| | | |
Hanger, Inc., Term Loan, 3.593%, (1 mo. USD LIBOR + 3.50%), 3/6/25 | | | | | 1,116 | | | | 1,116,197 | |
| | | |
Inovalon Holdings, Inc., Term Loan, 2.875%, (1 mo. USD LIBOR + 2.75%), 4/2/25 | | | | | 1,244 | | | | 1,237,000 | |
| | | |
IQVIA, Inc., Term Loan, 1.843%, (1 mo. USD LIBOR + 1.75%), 3/7/24 | | | | | 551 | | | | 549,740 | |
| | | |
Medical Solutions, LLC, Term Loan, 5.50%, (1 mo. USD LIBOR + 4.50%, Floor 1.00%), 6/14/24 | | | | | 1,611 | | | | 1,615,524 | |
| | | | |
| | 19 | | See Notes to Financial Statements. |
Eaton Vance
Floating-Rate Income Trust
May 31, 2021
Portfolio of Investments — continued
| | | | | | | | | | |
| Borrower/Description | | | | Principal
Amount*
(000’s omitted) | | | Value | |
|
| Health Care (continued) | |
| | | |
MPH Acquisition Holdings, LLC, Term Loan, 3.75%, (3 mo. USD LIBOR + 2.75%, Floor 1.00%), 6/7/23 | | | | | 2,862 | | | $ | 2,862,342 | |
| | | |
National Mentor Holdings, Inc.: | | | | | | | | | | |
| | | |
Term Loan, 4.50%, (3 mo. USD LIBOR + 3.75%, Floor 0.75%), 2/18/28 | | | | | 71 | | | | 70,597 | |
| | | |
Term Loan, 4.50%, (USD LIBOR + 3.75%, Floor 0.75%), 2/18/28(12) | | | | | 2,121 | | | | 2,127,399 | |
| | | |
Term Loan, 4.165%, (1 mo. USD LIBOR + 3.75%, Floor 0.75%), 3/2/28(13) | | | | | 233 | | | | 234,014 | |
| | | |
Navicure, Inc., Term Loan, 4.093%, (1 mo. USD LIBOR + 4.00%), 10/22/26 | | | | | 1,562 | | | | 1,562,969 | |
| | | |
Ortho-Clinical Diagnostics S.A.: | | | | | | | | | | |
| | | |
Term Loan, 3.108%, (1 mo. USD LIBOR + 3.00%), 6/30/25 | | | | | 2,879 | | | | 2,883,884 | |
| | | |
Term Loan, 3.50%, (3 mo. EURIBOR + 3.50%), 6/30/25 | | EUR | | | 421 | | | | 513,832 | |
| | | |
Pacific Dental Services, LLC, Term Loan, 4.25%, (1 mo. USD LIBOR + 3.50%, Floor 0.75%), 4/20/28 | | | | | 600 | | | | 602,813 | |
| | | |
Parexel International Corporation, Term Loan, 2.843%, (1 mo. USD LIBOR + 2.75%), 9/27/24 | | | | | 1,566 | | | | 1,555,799 | |
| | | |
PetVet Care Centers, LLC, Term Loan, 4.25%, (1 mo. USD LIBOR + 3.50%, Floor 0.75%), 2/14/25 | | | | | 199 | | | | 199,899 | |
| | | |
Phoenix Guarantor, Inc.: | | | | | | | | | | |
| | | |
Term Loan, 3.343%, (1 mo. USD LIBOR + 3.25%), 3/5/26 | | | | | 1,941 | | | | 1,925,401 | |
| | | |
Term Loan, 3.598%, (1 mo. USD LIBOR + 3.50%), 3/5/26 | | | | | 1,548 | | | | 1,539,590 | |
| | | |
Project Ruby Ultimate Parent Corp., Term Loan, 4.00%, (1 mo. USD LIBOR + 3.25%, Floor 0.75%), 3/3/28 | | | | | 1,250 | | | | 1,248,884 | |
| | | |
Radiology Partners, Inc., Term Loan, 4.347%, (1 mo. USD LIBOR + 4.25%), 7/9/25 | | | | | 2,555 | | | | 2,558,811 | |
| | | |
RadNet, Inc., Term Loan, 3.75%, (3 mo. USD LIBOR + 3.00%, Floor 0.75%), 4/22/28 | | | | | 1,225 | | | | 1,225,255 | |
| | | |
Select Medical Corporation, Term Loan, 2.37%, (1 mo. USD LIBOR + 2.25%), 3/6/25 | | | | | 2,709 | | | | 2,697,359 | |
| | | |
Sotera Health Holdings, LLC, Term Loan, 3.25%, (3 mo. USD LIBOR + 2.75%, Floor 0.50%), 12/11/26 | | | | | 675 | | | | 673,172 | |
| | | |
Sound Inpatient Physicians, Term Loan, 2.863%, (1 mo. USD LIBOR + 2.75%), 6/27/25 | | | | | 486 | | | | 484,730 | |
| | | |
Sunshine Luxembourg VII S.a.r.l., Term Loan, 4.50%, (3 mo. USD LIBOR + 3.75%, Floor 0.75%), 10/1/26 | | | | | 1,250 | | | | 1,254,948 | |
| | | |
Surgery Center Holdings, Inc., Term Loan, 4.50%, (1 mo. USD LIBOR + 3.75%, Floor 0.75%), 8/31/26 | | | | | 3,413 | | | | 3,423,424 | |
| | | |
Synlab Bondco PLC, Term Loan, 3.25%, (6 mo. EURIBOR + 3.25%), 7/1/27 | | EUR | | | 325 | | | | 394,294 | |
| | | |
Team Health Holdings, Inc., Term Loan, 3.75%, (1 mo. USD LIBOR + 2.75%, Floor 1.00%), 2/6/24 | | | | | 1,982 | | | | 1,915,568 | |
| | | |
U.S. Anesthesia Partners, Inc., Term Loan, 4.00%, (6 mo. USD LIBOR + 3.00%, Floor 1.00%), 6/23/24 | | | | | 2,610 | | | | 2,588,191 | |
| | | | | | | | | | | | |
| Borrower/Description | | | | | Principal
Amount*
(000’s omitted) | | | Value | |
|
| Health Care (continued) | |
| | | |
US Radiology Specialists, Inc., Term Loan, 6.25%, (3 mo. USD LIBOR + 5.50%, Floor 0.75%), 12/10/27 | | | | | | | 898 | | | $ | 903,361 | |
| | | |
Verscend Holding Corp., Term Loan, 4.093%, (1 mo. USD LIBOR + 4.00%), 8/27/25 | | | | | | | 1,594 | | | | 1,599,481 | |
| | | |
| | | | | | | | | | | $ | 79,352,262 | |
|
| Home Furnishings — 1.0% | |
| | | |
Mattress Firm, Inc., Term Loan, 6.25%, (6 mo. USD LIBOR + 5.25%, Floor 1.00%), 11/26/27 | | | | | | | 902 | | | $ | 917,658 | |
| | | |
Serta Simmons Bedding, LLC: | | | | | | | | | | | | |
| | | |
Term Loan, 8.50%, (1 mo. USD LIBOR + 7.50%, Floor 1.00%), 8/10/23 | | | | | | | 1,168 | | | | 1,180,341 | |
| | | |
Term Loan - Second Lien, 8.50%, (1 mo. USD LIBOR + 7.50%, Floor 1.00%), 8/10/23 | | | | | | | 3,863 | | | | 3,706,622 | |
| | | |
| | | | | | | | | | | $ | 5,804,621 | |
|
| Industrial Equipment — 6.8% | |
| | | |
Alliance Laundry Systems, LLC, Term Loan, 4.25%, (3 mo. USD LIBOR + 3.50%, Floor 0.75%), 10/8/27 | | | | | | | 1,209 | | | $ | 1,212,873 | |
| | | |
Altra Industrial Motion Corp., Term Loan, 2.093%, (1 mo. USD LIBOR + 2.00%), 10/1/25 | | | | | | | 591 | | | | 589,937 | |
| | | |
American Trailer World Corp., Term Loan, 4.50%, (1 mo. USD LIBOR + 3.75%, Floor 0.75%), 3/3/28 | | | | | | | 650 | | | | 648,240 | |
| | | |
Apex Tool Group, LLC, Term Loan, 6.50%, (1 mo. USD LIBOR + 5.25%, Floor 1.25%), 8/1/24 | | | | | | | 2,933 | | | | 2,941,413 | |
| | | |
CFS Brands, LLC, Term Loan, 4.00%, (6 mo. USD LIBOR + 3.00%, Floor 1.00%), 3/20/25 | | | | | | | 267 | | | | 260,048 | |
| | | |
CPM Holdings, Inc., Term Loan, 3.61%, (1 mo. USD LIBOR + 3.50%), 11/17/25 | | | | | | | 2,203 | | | | 2,186,695 | |
| | | |
Delachaux Group S.A.: | | | | | | | | | | | | |
| | | |
Term Loan, 3.75%, (3 mo. EURIBOR + 3.75%), 4/16/26 | | | EUR | | | | 394 | | | | 480,569 | |
| | | |
Term Loan, 4.686%, (3 mo. USD LIBOR + 4.50%), 4/16/26 | | | | | | | 466 | | | | 464,336 | |
| | | |
DexKo Global, Inc.: | | | | | | | | | | | | |
| | | |
Term Loan, 3.75%, (3 mo. EURIBOR + 3.75%), 7/24/24 | | | EUR | | | | 320 | | | | 390,525 | |
| | | |
Term Loan, 3.75%, (3 mo. EURIBOR + 3.75%), 7/24/24 | | | EUR | | | | 801 | | | | 976,318 | |
| | | |
Term Loan, 4.50%, (3 mo. USD LIBOR + 3.50%, Floor 1.00%), 7/24/24 | | | | | | | 891 | | | | 891,300 | |
| | | |
DXP Enterprises, Inc., Term Loan, 5.75%, (1 mo. USD LIBOR + 4.75%, Floor 1.00%), 12/16/27 | | | | | | | 673 | | | | 676,679 | |
| | | |
Dynacast International, LLC: | | | | | | | | | | | | |
| | | |
Term Loan, 5.75%, (3 mo. USD LIBOR + 4.75%, Floor 1.00%), 7/19/25 | | | | | | | 962 | | | | 963,634 | |
| | | |
Term Loan, 10.25%, (3 mo. USD LIBOR + 9.25%, Floor 1.00%), 2/4/28 | | | | | | | 371 | | | | 387,271 | |
| | | | |
| | 20 | | See Notes to Financial Statements. |
Eaton Vance
Floating-Rate Income Trust
May 31, 2021
Portfolio of Investments — continued
| | | | | | | | | | | | |
| Borrower/Description | | | | | Principal
Amount*
(000’s omitted) | | | Value | |
|
| Industrial Equipment (continued) | |
| | | |
Engineered Machinery Holdings, Inc.: | | | | | | | | | | | | |
| | | |
Term Loan, 4.00%, (3 mo. USD LIBOR + 3.00%, Floor 1.00%), 7/19/24 | | | | | | | 1,792 | | | $ | 1,792,823 | |
| | | |
Term Loan, 5.25%, (3 mo. USD LIBOR + 4.25%, Floor 1.00%), 7/19/24 | | | | | | | 318 | | | | 318,780 | |
| | | |
Filtration Group Corporation: | | | | | | | | | | | | |
| | | |
Term Loan, 3.093%, (1 mo. USD LIBOR + 3.00%), 3/29/25 | | | | | | | 1,656 | | | | 1,643,091 | |
| | | |
Term Loan, 3.50%, (3 mo. EURIBOR + 3.50%), 3/29/25 | | | EUR | | | | 388 | | | | 471,954 | |
| | | |
Term Loan, 4.50%, (1 mo. USD LIBOR + 3.75%, Floor 0.75%), 3/29/25 | | | | | | | 398 | | | | 398,912 | |
| | | |
Gardner Denver, Inc., Term Loan, 1.843%, (1 mo. USD LIBOR + 1.75%), 3/1/27 | | | | | | | 1,290 | | | | 1,280,772 | |
| | | |
GrafTech Finance, Inc., Term Loan, 3.50%, (1 mo. USD LIBOR + 3.00%, Floor 0.50%), 2/12/25 | | | | | | | 1,117 | | | | 1,119,355 | |
| | | |
Granite Holdings US Acquisition Co., Term Loan, 4.203%, (3 mo. USD LIBOR + 4.00%), 9/30/26 | | | | | | | 1,197 | | | | 1,197,947 | |
| | | |
Harsco Corporation, Term Loan, 2.75%, (1 mo. USD LIBOR + 2.25%, Floor 0.50%), 3/5/28 | | | | | | | 475 | | | | 473,367 | |
| | | |
Hillman Group, Inc. (The): | | | | | | | | | | | | |
| | | |
Term Loan, 2/24/28(14) | | | | | | | 84 | | | | 84,375 | |
| | | |
Term Loan, 2/24/28(14) | | | | | | | 416 | | | | 415,547 | |
| | | |
Ingersoll-Rand Services Company, Term Loan, 1.843%, (1 mo. USD LIBOR + 1.75%), 3/1/27 | | | | | | | 1,411 | | | | 1,400,422 | |
| | | |
LTI Holdings, Inc.: | | | | | | | | | | | | |
| | | |
Term Loan, 3.593%, (1 mo. USD LIBOR + 3.50%), 9/6/25 | | | | | | | 1,574 | | | | 1,555,676 | |
| | | |
Term Loan, 4.843%, (1 mo. USD LIBOR + 4.75%), 7/24/26 | | | | | | | 197 | | | | 195,830 | |
| | | |
Pro Mach Group, Inc., Term Loan, 4.50%, (USD LIBOR + 3.50%, Floor 1.00%), 3/7/25(12) | | | | | | | 919 | | | | 920,932 | |
| | | |
Quimper AB, Term Loan, 3.50%, (3 mo. EURIBOR + 3.50%), 2/16/26 | | | EUR | | | | 2,225 | | | | 2,710,638 | |
| | | |
Robertshaw US Holding Corp., Term Loan, 4.50%, (1 mo. USD LIBOR + 3.50%, Floor 1.00%), 2/28/25 | | | | | | | 1,043 | | | | 1,006,254 | |
| | | |
Thermon Industries, Inc., Term Loan, 4.75%, (1 mo. USD LIBOR + 3.75%, Floor 1.00%), 10/30/24 | | | | | | | 237 | | | | 236,896 | |
| | | |
Tiger Acquisition, LLC, Term Loan, 5/24/28(14) | | | | | | | 600 | | | | 599,250 | |
| | | |
Titan Acquisition Limited, Term Loan, 3.203%, (6 mo. USD LIBOR + 3.00%), 3/28/25 | | | | | | | 3,080 | | | | 3,027,559 | |
| | | |
Vertical Midco GmbH, Term Loan, 4.478%, (6 mo. USD LIBOR + 4.25%), 7/30/27 | | | | | | | 1,343 | | | | 1,349,882 | |
| | | |
Welbilt, Inc., Term Loan, 2.593%, (1 mo. USD LIBOR + 2.50%), 10/23/25 | | | | | | | 3,484 | | | | 3,459,795 | |
| | | |
Zephyr German BidCo GmbH, Term Loan, 3.75%, (2 mo. EURIBOR + 3.75%), 3/10/28 | | | EUR | | | | 650 | | | | 797,211 | |
| | | |
| | | | | | | | | | | $ | 39,527,106 | |
| | | | | | | | | | | | |
| Borrower/Description | | | | | Principal
Amount*
(000’s omitted) | | | Value | |
|
| Insurance — 6.2% | |
| | | |
Alliant Holdings Intermediate, LLC: | | | | | | | | | | | | |
| | | |
Term Loan, 3.343%, (1 mo. USD LIBOR + 3.25%), 5/9/25 | | | | | | | 467 | | | $ | 463,479 | |
| | | |
Term Loan, 3.343%, (1 mo. USD LIBOR + 3.25%), 5/9/25 | | | | | | | 2,512 | | | | 2,496,494 | |
| | | |
Term Loan, 4.25%, (1 mo. USD LIBOR + 3.75%, Floor 0.50%), 10/8/27 | | | | | | | 472 | | | | 473,271 | |
| | | |
AmWINS Group, Inc., Term Loan, 3.00%, (1 mo. USD LIBOR + 2.25%, Floor 0.75%), 2/19/28 | | | | | | | 4,638 | | | | 4,622,066 | |
| | | |
AssuredPartners Capital, Inc., Term Loan, 5.50%, (1 mo. USD LIBOR + 4.50%, Floor 1.00%), 2/12/27 | | | | | | | 495 | | | | 496,908 | |
| | | |
AssuredPartners, Inc., Term Loan, 3.593%, (1 mo. USD LIBOR + 3.50%), 2/12/27 | | | | | | | 1,481 | | | | 1,474,241 | |
| | | |
Asurion, LLC: | | | | | | | | | | | | |
| | | |
Term Loan, 3.093%, (1 mo. USD LIBOR + 3.00%), 11/3/23 | | | | | | | 1,523 | | | | 1,521,356 | |
| | | |
Term Loan, 3.343%, (1 mo. USD LIBOR + 3.25%), 12/23/26 | | | | | | | 1,337 | | | | 1,331,950 | |
| | | |
Term Loan, 3.343%, (1 mo. USD LIBOR + 3.25%), 7/31/27 | | | | | | | 1,690 | | | | 1,683,838 | |
| | | |
Term Loan - Second Lien, 5.343%, (1 mo. USD LIBOR + 5.25%), 1/31/28 | | | | | | | 2,070 | | | | 2,096,090 | |
| | | |
Financiere CEP SAS, Term Loan, 4.00%, (3 mo. EURIBOR + 4.00%), 6/18/27 | | | EUR | | | | 550 | | | | 674,610 | |
| | | |
FrontDoor, Inc., Term Loan, 2.625%, (1 mo. USD LIBOR + 2.50%), 8/16/25 | | | | | | | 411 | | | | 410,064 | |
| | | |
Hub International Limited: | | | | | | | | | | | | |
| | | |
Term Loan, 2.926%, (3 mo. USD LIBOR + 2.75%), 4/25/25 | | | | | | | 4,414 | | | | 4,377,217 | |
| | | |
Term Loan, 4.00%, (6 mo. USD LIBOR + 3.25%, Floor 0.75%), 4/25/25 | | | | | | | 1,876 | | | | 1,880,403 | |
| | | |
NFP Corp., Term Loan, 3.343%, (1 mo. USD LIBOR + 3.25%), 2/15/27 | | | | | | | 3,675 | | | | 3,634,018 | |
| | | |
Ryan Specialty Group, LLC, Term Loan, 3.75%, (1 mo. USD LIBOR + 3.00%, Floor 0.75%), 9/1/27 | | | | | | | 1,915 | | | | 1,919,206 | |
| | | |
Sedgwick Claims Management Services, Inc., Term Loan, 3.343%, (1 mo. USD LIBOR + 3.25%), 12/31/25 | | | | | | | 1,246 | | | | 1,234,109 | |
| | | |
USI, Inc.: | | | | | | | | | | | | |
| | | |
Term Loan, 3.203%, (3 mo. USD LIBOR + 3.00%), 5/16/24 | | | | | | | 3,578 | | | | 3,555,468 | |
| | | |
Term Loan, 3.453%, (3 mo. USD LIBOR + 3.25%), 12/2/26 | | | | | | | 1,457 | | | | 1,447,204 | |
| | | |
| | | | | | | | | | | $ | 35,791,992 | |
|
| Leisure Goods / Activities / Movies — 5.5% | |
| | | |
Amer Sports Oyj, Term Loan, 4.50%, (3 mo. EURIBOR + 4.50%), 3/30/26 | | | EUR | | | | 3,625 | | | $ | 4,421,885 | |
| | | |
Bombardier Recreational Products, Inc., Term Loan, 2.093%, (1 mo. USD LIBOR + 2.00%), 5/24/27 | | | | | | | 5,176 | | | | 5,125,004 | |
| | | | |
| | 21 | | See Notes to Financial Statements. |
Eaton Vance
Floating-Rate Income Trust
May 31, 2021
Portfolio of Investments — continued
| | | | | | | | | | | | |
| Borrower/Description | | | | | Principal
Amount*
(000’s omitted) | | | Value | |
|
| Leisure Goods / Activities / Movies (continued) | |
| | | |
Carnival Corporation, Term Loan, 8.50%, (1 mo. USD LIBOR + 7.50%, Floor 1.00%), 6/30/25 | | | | | | | 1,390 | | | $ | 1,427,711 | |
| | | |
ClubCorp Holdings, Inc., Term Loan, 2.953%, (3 mo. USD LIBOR + 2.75%), 9/18/24 | | | | | | | 2,374 | | | | 2,288,061 | |
| | | |
Crown Finance US, Inc.: | | | | | | | | | | | | |
| | | |
Term Loan, 2.625%, (6 mo. EURIBOR + 2.625%), 2/28/25 | | | EUR | | | | 289 | | | | 306,674 | |
| | | |
Term Loan, 3.50%, (6 mo. USD LIBOR + 2.50%, Floor 1.00%), 2/28/25 | | | | | | | 1,754 | | | | 1,525,212 | |
| | | |
Term Loan, 3.75%, (6 mo. USD LIBOR + 2.75%, Floor 1.00%), 9/30/26 | | | | | | | 1,531 | | | | 1,313,160 | |
| | | |
Term Loan, 15.25%, (7.00% cash, 8.25% PIK), 5/23/24(15) | | | | | | | 495 | | | | 625,183 | |
| | | |
Delta 2 (LUX) S.a.r.l., Term Loan, 3.50%, (1 mo. USD LIBOR + 2.50%, Floor 1.00%), 2/1/24 | | | | | | | 1,930 | | | | 1,922,604 | |
| | | |
Etraveli Holding AB, Term Loan, 4.50%, (6 mo. EURIBOR + 4.50%), 8/2/24 | | | EUR | | | | 950 | | | | 1,129,515 | |
| | | |
Lindblad Expeditions, Inc.: | | | | | | | | | | | | |
| | | |
Term Loan, 7.25%, (1 mo. USD LIBOR + 6.50%, Floor 0.75%), 6.00% cash, 1.25% PIK, 3/27/25 | | | | | | | 341 | | | | 326,977 | |
| | | |
Term Loan, 7.25%, (1 mo. USD LIBOR + 6.50%, Floor 0.75%), 6.00% cash, 1.25% PIK, 3/27/25 | | | | | | | 1,362 | | | | 1,307,909 | |
| | | |
Match Group, Inc., Term Loan, 1.906%, (3 mo. USD LIBOR + 1.75%), 2/13/27 | | | | | | | 775 | | | | 770,802 | |
| | | |
Playtika Holding Corp., Term Loan, 2.843%, (1 mo. USD LIBOR + 2.75%), 3/13/28 | | | | | | | 2,246 | | | | 2,240,748 | |
| | | |
SeaWorld Parks & Entertainment, Inc., Term Loan, 3.75%, (1 mo. USD LIBOR + 3.00%, Floor 0.75%), 3/31/24 | | | | | | | 1,899 | | | | 1,888,969 | |
| | | |
Steinway Musical Instruments, Inc., Term Loan, 4.75%, (1 mo. USD LIBOR + 3.75%, Floor 1.00%), 2/14/25 | | | | | | | 307 | | | | 304,604 | |
| | | |
Travel Leaders Group, LLC, Term Loan, 4.093%, (1 mo. USD LIBOR + 4.00%), 1/25/24 | | | | | | | 1,717 | | | | 1,643,082 | |
| | | |
UFC Holdings, LLC, Term Loan, 3.75%, (6 mo. USD LIBOR + 3.00%, Floor 0.75%), 4/29/26 | | | | | | | 2,512 | | | | 2,513,202 | |
| | | |
Vue International Bidco PLC, Term Loan, 4.75%, (6 mo. EURIBOR + 4.75%), 7/3/26 | | | EUR | | | | 678 | | | | 772,786 | |
| | | |
| | | | | | | | | | | $ | 31,854,088 | |
|
| Lodging and Casinos — 2.9% | |
| | | |
Boyd Gaming Corporation, Term Loan, 2.312%, (1 week USD LIBOR + 2.25%), 9/15/23 | | | | | | | 673 | | | $ | 672,887 | |
| | | |
CityCenter Holdings, LLC, Term Loan, 3.00%, (1 mo. USD LIBOR + 2.25%, Floor 0.75%), 4/18/24 | | | | | | | 2,372 | | | | 2,357,424 | |
| | | |
Golden Nugget, Inc., Term Loan, 3.25%, (2 mo. USD LIBOR + 2.50%, Floor 0.75%), 10/4/23 | | | | | | | 4,940 | | | | 4,906,488 | |
| | | |
GVC Holdings (Gibraltar) Limited, Term Loan, 3.00%, (6 mo. USD LIBOR + 2.00%, Floor 1.00%), 3/29/24 | | | | | | | 1,164 | | | | 1,161,526 | |
| | | | | | | | | | | | |
| Borrower/Description | | | | | Principal
Amount*
(000’s omitted) | | | Value | |
|
| Lodging and Casinos (continued) | |
| | | |
GVC Holdings PLC, Term Loan, 2.25%, (6 mo. EURIBOR + 2.25%), 3/29/24 | | | EUR | | | | 1,875 | | | $ | 2,280,039 | |
| | | |
Playa Resorts Holding B.V., Term Loan, 3.75%, (1 mo. USD LIBOR + 2.75%, Floor 1.00%), 4/29/24 | | | | | | | 2,556 | | | | 2,455,583 | |
| | | |
Sportradar Capital S.a.r.l., Term Loan, 4.25%, (6 mo. EURIBOR + 4.25%), 11/22/27 | | | EUR | | | | 550 | | | | 672,793 | |
| | | |
Stars Group Holdings B.V. (The): | | | | | | | | | | | | |
| | | |
Term Loan, 3.703%, (3 mo. USD LIBOR + 3.50%), 7/10/25 | | | | | | | 1,761 | | | | 1,769,183 | |
| | | |
Term Loan, 3.75%, (3 mo. EURIBOR + 3.75%), 7/10/25 | | | EUR | | | | 597 | | | | 730,082 | |
| | | |
| | | | | | | | | | | $ | 17,006,005 | |
|
| Nonferrous Metals / Minerals — 0.3% | |
| | | |
American Consolidated Natural Resources, Inc., Term Loan, 17.00%, (3 mo. USD LIBOR + 16.00%, Floor 1.00%), 14.00% cash, 3.00% PIK, 9/16/25 | | | | | | | 4 | | | $ | 3,714 | |
| | | |
Oxbow Carbon, LLC, Term Loan, 5.00%, (1 mo. USD LIBOR + 4.25%, Floor 0.75%), 10/13/25 | | | | | | | 756 | | | | 756,254 | |
| | | |
Rain Carbon GmbH, Term Loan, 3.00%, (6 mo. EURIBOR + 3.00%), 1/16/25 | | | EUR | | | | 1,025 | | | | 1,245,249 | |
| | | |
| | | | | | | | | | | $ | 2,005,217 | |
|
| Oil and Gas — 3.2% | |
| | | |
Ameriforge Group, Inc., Term Loan, 11.346%, (USD LIBOR + 13.00%, Floor 1.00%), 12/31/23(12)(13) | | | | | | | 0 | (16) | | $ | 106 | |
| | | |
Apergy Corporation: | | | | | | | | | | | | |
| | | |
Term Loan, 2.625%, (1 mo. USD LIBOR + 2.50%), 5/9/25 | | | | | | | 127 | | | | 126,058 | |
| | | |
Term Loan, 6.00%, (3 mo. USD LIBOR + 5.00%, Floor 1.00%), 6/3/27 | | | | | | | 217 | | | | 221,300 | |
| | | |
Blackstone CQP Holdco L.P., Term Loan, 3.687%, (3 mo. USD LIBOR + 3.50%), 9/30/24 | | | | | | | 1,032 | | | | 1,031,947 | |
| | | |
Centurion Pipeline Company, LLC: | | | | | | | | | | | | |
| | | |
Term Loan, 3.343%, (1 mo. USD LIBOR + 3.25%), 9/29/25 | | | | | | | 269 | | | | 267,133 | |
| | | |
Term Loan, 4.093%, (1 mo. USD LIBOR + 4.00%), 9/28/25 | | | | | | | 249 | | | | 247,193 | |
| | | |
CITGO Holding, Inc., Term Loan, 8.00%, (6 mo. USD LIBOR + 7.00%, Floor 1.00%), 8/1/23 | | | | | | | 2,082 | | | | 2,070,805 | |
| | | |
CITGO Petroleum Corporation, Term Loan, 7.25%, (6 mo. USD LIBOR + 6.25%, Floor 1.00%), 3/28/24 | | | | | | | 4,135 | | | | 4,158,318 | |
| | | |
Delek US Holdings, Inc., Term Loan, 6.50%, (1 mo. USD LIBOR + 5.50%, Floor 1.00%), 3/31/25 | | | | | | | 594 | | | | 597,960 | |
| | | |
Fieldwood Energy, LLC: | | | | | | | | | | | | |
| | | |
DIP Loan, 3.675%, (1 mo. USD LIBOR + 8.75%, Floor 1.00%), 8/4/21(13) | | | | | | | 410 | | | | 416,080 | |
| | | |
Term Loan, 0.00%, 4/11/22(17) | | | | | | | 2,775 | | | | 1,149,235 | |
| | | | |
| | 22 | | See Notes to Financial Statements. |
Eaton Vance
Floating-Rate Income Trust
May 31, 2021
Portfolio of Investments — continued
| | | | | | | | | | | | |
| Borrower/Description | | | | | Principal
Amount*
(000’s omitted) | | | Value | |
|
| Oil and Gas (continued) | |
| | | |
Matador Bidco S.a.r.l., Term Loan, 4.843%, (1 mo. USD LIBOR + 4.75%), 10/15/26 | | | | | | | 4,064 | | | $ | 4,070,725 | |
| | | |
Prairie ECI Acquiror L.P., Term Loan, 4.843%, (1 mo. USD LIBOR + 4.75%), 3/11/26 | | | | | | | 1,221 | | | | 1,188,234 | |
| | | |
PSC Industrial Holdings Corp., Term Loan, 4.75%, (1 mo. USD LIBOR + 3.75%, Floor 1.00%), 10/11/24 | | | | | | | 1,861 | | | | 1,836,186 | |
| | | |
UGI Energy Services, LLC, Term Loan, 3.843%, (1 mo. USD LIBOR + 3.75%), 8/13/26 | | | | | | | 1,081 | | | | 1,085,703 | |
| | | |
| | | | | | | | | | | $ | 18,466,983 | |
|
| Publishing — 1.0% | |
| | | |
Adevinta ASA: | | | | | | | | | | | | |
| | | |
Term Loan, 4/20/28(14) | | | | | | | 325 | | | $ | 325,965 | |
| | | |
Term Loan, 4/20/28(14) | | | EUR | | | | 1,250 | | | | 1,527,076 | |
| | | |
Alchemy Copyrights, LLC, Term Loan, 3.50%, (1 mo. USD LIBOR + 3.00%, Floor 0.50%), 3/10/28 | | | | | | | 522 | | | | 523,031 | |
| | | |
Ascend Learning, LLC: | | | | | | | | | | | | |
| | | |
Term Loan, 4.00%, (1 mo. USD LIBOR + 3.00%, Floor 1.00%), 7/12/24 | | | | | | | 1,182 | | | | 1,182,679 | |
| | | |
Term Loan, 4.75%, (1 mo. USD LIBOR + 3.75%, Floor 1.00%), 7/12/24 | | | | | | | 423 | | | | 424,549 | |
| | | |
Getty Images, Inc., Term Loan, 4.625%, (1 mo. USD LIBOR + 4.50%), 2/19/26 | | | | | | | 1,716 | | | | 1,715,753 | |
| | | |
| | | | | | | | | | | $ | 5,699,053 | |
|
| Radio and Television — 2.3% | |
| | | |
Cumulus Media New Holdings, Inc., Term Loan, 4.75%, (3 mo. USD LIBOR + 3.75%, Floor 1.00%), 3/31/26 | | | | | | | 416 | | | $ | 415,547 | |
| | | |
Gray Television, Inc.: | | | | | | | | | | | | |
| | | |
Term Loan, 2.36%, (1 mo. USD LIBOR + 2.25%), 2/7/24 | | | | | | | 255 | | | | 254,161 | |
| | | |
Term Loan, 2.61%, (1 mo. USD LIBOR + 2.50%), 1/2/26 | | | | | | | 637 | | | | 635,108 | |
| | | |
Hubbard Radio, LLC, Term Loan, 5.25%, (3 mo. USD LIBOR + 4.25%, Floor 1.00%), 3/28/25 | | | | | | | 728 | | | | 719,539 | |
| | | |
iHeartCommunications, Inc.: | | | | | | | | | | | | |
| | | |
Term Loan, 3.093%, (1 mo. USD LIBOR + 3.00%), 5/1/26 | | | | | | | 1,901 | | | | 1,883,829 | |
| | | |
Term Loan, 4.75%, (1 mo. USD LIBOR + 4.00%, Floor 0.75%), 5/1/26 | | | | | | | 422 | | | | 418,122 | |
| | | |
Nexstar Broadcasting, Inc.: | | | | | | | | | | | | |
| | | |
Term Loan, 2.341%, (1 mo. USD LIBOR + 2.25%), 1/17/24 | | | | | | | 1,267 | | | | 1,265,672 | |
| | | |
Term Loan, 2.61%, (1 mo. USD LIBOR + 2.50%), 9/18/26 | | | | | | | 453 | | | | 452,422 | |
| | | |
Sinclair Television Group, Inc.: | | | | | | | | | | | | |
| | | |
Term Loan, 2.60%, (1 mo. USD LIBOR + 2.50%), 9/30/26 | | | | | | | 665 | | | | 660,387 | |
| | | |
Term Loan, 3.10%, (1 mo. USD LIBOR + 3.00%), 4/1/28 | | | | | | | 452 | | | | 449,754 | |
| | | | | | | | | | | | |
| Borrower/Description | | | | | Principal
Amount*
(000’s omitted) | | | Value | |
|
| Radio and Television (continued) | |
| | | |
Terrier Media Buyer, Inc., Term Loan, 3.594%, (1 mo. USD LIBOR + 3.50%), 12/17/26 | | | | | | | 2,619 | | | $ | 2,610,614 | |
| | | |
Univision Communications, Inc., Term Loan, 4.75%, (1 mo. USD LIBOR + 3.75%, Floor 1.00%), 3/15/26 | | | | | | | 3,431 | | | | 3,446,311 | |
| | | |
| | | | | | | | | | | $ | 13,211,466 | |
|
| Retailers (Except Food and Drug) — 1.7% | |
| | | |
CNT Holdings I Corp., Term Loan, 4.50%, (6 mo. USD LIBOR + 3.75%, Floor 0.75%), 11/8/27 | | | | | | | 775 | | | $ | 776,877 | |
| | | |
Great Outdoors Group, LLC, Term Loan, 5.00%, (6 mo. USD LIBOR + 4.25%, Floor 0.75%), 3/6/28 | | | | | | | 2,943 | | | | 2,969,108 | |
| | | |
Harbor Freight Tools USA, Inc., Term Loan, 3.75%, (1 mo. USD LIBOR + 3.00%, Floor 0.75%), 10/19/27 | | | | | | | 1,592 | | | | 1,597,306 | |
| | | |
Hoya Midco, LLC, Term Loan, 4.50%, (1 mo. USD LIBOR + 3.50%, Floor 1.00%), 6/30/24 | | | | | | | 2,047 | | | | 2,039,746 | |
| | | |
PetSmart, Inc., Term Loan, 4.50%, (6 mo. USD LIBOR + 3.75%, Floor 0.75%), 2/12/28 | | | | | | | 1,575 | | | | 1,582,481 | |
| | | |
Phillips Feed Service, Inc., Term Loan, 8.00%, (6 mo. USD LIBOR + 7.00%, Floor 1.00%), 11/13/24(4) | | | | | | | 114 | | | | 91,443 | |
| | | |
Pier 1 Imports (U.S.), Inc., Term Loan, 0.00%, 4/30/22(4)(17) | | | | | | | 95 | | | | 76,249 | |
| | | |
Protective Industrial Products, Inc., Term Loan, 4.75%, (1 mo. USD LIBOR + 4.00%, Floor 0.75%), 1/20/28 | | | | | | | 600 | | | | 600,375 | |
| | | |
| | | | | | | | | | | $ | 9,733,585 | |
|
| Steel — 0.5% | |
| | | |
Neenah Foundry Company, Term Loan, 10.00%, (2 mo. USD LIBOR + 9.00%, Floor 1.00%), 12/13/22 | | | | | | | 660 | | | $ | 610,812 | |
| | | |
Phoenix Services International, LLC, Term Loan, 4.75%, (1 mo. USD LIBOR + 3.75%, Floor 1.00%), 3/1/25 | | | | | | | 873 | | | | 868,907 | |
| | | |
TMS International Corp., Term Loan, 3.75%, (USD LIBOR + 2.75%, Floor 1.00%), 8/14/24(12) | | | | | | | 274 | | | | 273,970 | |
| | | |
Zekelman Industries, Inc., Term Loan, 2.097%, (1 mo. USD LIBOR + 2.00%), 1/24/27 | | | | | | | 1,044 | | | | 1,035,756 | |
| | | |
| | | | | | | | | | | $ | 2,789,445 | |
|
| Surface Transport — 0.8% | |
| | | |
Hertz Corporation (The): | | | | | | | | | | | | |
| | | |
DIP Loan, 6.477%, (1 mo. USD LIBOR + 7.25%, Floor 1.00%), 12/31/21(13) | | | | | | | 917 | | | $ | 922,066 | |
| | | |
Term Loan, 3.50%, (1 mo. USD LIBOR + 2.75%, Floor 0.75%), 6/30/23 | | | | | | | 1,078 | | | | 1,085,942 | |
| | | |
Kenan Advantage Group, Inc., Term Loan, 4.50%, (1 mo. USD LIBOR + 3.75%, Floor 0.75%), 3/24/26 | | | | | | | 2,643 | | | | 2,648,331 | |
| | | |
| | | | | | | | | | | $ | 4,656,339 | |
| | | | |
| | 23 | | See Notes to Financial Statements. |
Eaton Vance
Floating-Rate Income Trust
May 31, 2021
Portfolio of Investments — continued
| | | | | | | | | | | | |
| Borrower/Description | | | | | Principal
Amount*
(000’s omitted) | | | Value | |
|
| Telecommunications — 5.4% | |
| | | |
Avaya, Inc., Term Loan, 4.101%, (1 mo. USD LIBOR + 4.00%), 12/15/27 | | | | | | | 225 | | | $ | 226,090 | |
| | | |
CenturyLink, Inc., Term Loan, 2.343%, (1 mo. USD LIBOR + 2.25%), 3/15/27 | | | | | | | 7,406 | | | | 7,352,088 | |
| | | |
Cyxtera DC Holdings, Inc., Term Loan, 4.00%, (6 mo. USD LIBOR + 3.00%, Floor 1.00%), 5/1/24 | | | | | | | 1,640 | | | | 1,591,428 | |
| | | |
Digicel International Finance Limited, Term Loan, 3.43%, (6 mo. USD LIBOR + 3.25%), 5/28/24 | | | | | | | 1,761 | | | | 1,694,547 | |
| | | |
eircom Finco S.a.r.l., Term Loan, 3.25%, (1 mo. EURIBOR + 3.25%), 5/15/26 | | | EUR | | | | 1,706 | | | | 2,083,266 | |
| | | |
Gamma Infrastructure III B.V., Term Loan, 3.50%, (6 mo. EURIBOR + 3.50%), 1/9/25 | | | EUR | | | | 2,000 | | | | 2,428,839 | |
| | | |
GEE Holdings 2, LLC: | | | | | | | | | | | | |
| | | |
Term Loan, 9.00%, (3 mo. USD LIBOR + 8.00%, Floor 1.00%), 3/24/25 | | | | | | | 408 | | | | 405,998 | |
| | | |
Term Loan - Second Lien, 9.25%, (3 mo. USD LIBOR + 8.25%, Floor 1.00%), 3/23/26 | | | | | | | 786 | | | | 734,917 | |
| | | |
Intelsat Jackson Holdings S.A.: | | | | | | | | | | | | |
| | | |
DIP Loan, 6.50%, (3 mo. USD LIBOR + 5.50%, Floor 1.00%), 7/13/22 | | | | | | | 1,037 | | | | 1,049,878 | |
| | | |
Term Loan, 8.00%, (USD Prime + 4.75%), 11/27/23 | | | | | | | 1,900 | | | | 1,935,965 | |
| | | |
Term Loan, 8.75%, (USD Prime + 5.50%), 1/2/24 | | | | | | | 1,600 | | | | 1,633,750 | |
| | | |
IPC Corp., Term Loan, 5.50%, (3 mo. USD LIBOR + 4.50%, Floor 1.00%), 8/6/21(4) | | | | | | | 1,230 | | | | 1,024,833 | |
| | | |
Onvoy, LLC, Term Loan, 5.50%, (1 mo. USD LIBOR + 4.50%, Floor 1.00%), 2/10/24 | | | | | | | 1,646 | | | | 1,646,524 | |
| | | |
Syniverse Holdings, Inc., Term Loan, 6.00%, (3 mo. USD LIBOR + 5.00%, Floor 1.00%), 3/9/23 | | | | | | | 1,019 | | | | 1,007,440 | |
| | | |
Zayo Group Holdings, Inc.: | | | | | | | | | | | | |
| | | |
Term Loan, 3.093%, (1 mo. USD LIBOR + 3.00%), 3/9/27 | | | | | | | 2,486 | | | | 2,470,723 | |
| | | |
Term Loan, 3.25%, (1 mo. EURIBOR + 3.25%), 3/9/27 | | | EUR | | | | 446 | | | | 541,713 | |
| | | |
Ziggo Financing Partnership, Term Loan, 2.601%, (1 mo. USD LIBOR + 2.50%), 4/30/28 | | | | | | | 3,825 | | | | 3,797,108 | |
| | | |
| | | | | | | | | | | $ | 31,625,107 | |
|
| Utilities — 0.9% | |
| | | |
Brookfield WEC Holdings, Inc., Term Loan, 3.25%, (1 mo. USD LIBOR + 2.75%, Floor 0.50%), 8/1/25 | | | | | | | 1,679 | | | $ | 1,670,731 | |
| | | |
Calpine Construction Finance Company L.P., Term Loan, 2.093%, (1 mo. USD LIBOR + 2.00%), 1/15/25 | | | | | | | 936 | | | | 929,457 | |
| | | |
Calpine Corporation, Term Loan, 2.60%, (1 mo. USD LIBOR + 2.50%), 12/16/27 | | | | | | | 2,198 | | | | 2,189,587 | |
| | | |
USIC Holdings, Inc., Term Loan, 4.25%, (3 mo. USD LIBOR + 3.50%, Floor 0.75%), 5/12/28 | | | | | | | 194 | | | | 193,880 | |
| | | |
| | | | | | | | | | | $ | 4,983,655 | |
| |
Total Senior Floating-Rate Loans
(identified cost $813,327,405) | | | $ | 817,847,442 | |
| | | | | | | | | | | | |
| Warrants — 0.0%(6) | |
| Security | | | | | Shares | | | Value | |
|
| Entertainment — 0.0%(6) | |
| | | |
Cineworld Group PLC, Exp. 11/23/25(3)(5) | | | | | | | 154,246 | | | $ | 112,185 | |
| | | |
| | | | | | | | | | | $ | 112,185 | |
|
| Health Care — 0.0% | |
| | | |
THAIHOT Investment Company US Limited, Exp. 10/13/27(3)(4)(5) | | | | | | | 24 | | | $ | 0 | |
| | | |
THAIHOT Investment Company US Limited, Exp. 10/13/27 (Contingent Warrants)(3)(4)(5) | | | | | | | 1,310 | | | | 0 | |
| | | |
| | | | | | | | | | | $ | 0 | |
| |
Total Warrants
(identified cost $0) | | | $ | 112,185 | |
|
| Miscellaneous — 0.0%(6) | |
| Security | | | | | Shares | | | Value | |
|
| Oil and Gas — 0.0%(6) | |
| | | |
Paragon Offshore Finance Company,
Class A(3)(4)(5) | | | | | | | 1,707 | | | $ | 0 | |
| | | |
Paragon Offshore Finance Company,
Class B(3)(5) | | | | | | | 854 | | | | 5,765 | |
| |
Total Miscellaneous
(identified cost $18,573) | | | $ | 5,765 | |
|
| Short-Term Investments — 1.1% | |
| Description | | | | | Units | | | Value | |
| | | |
Eaton Vance Cash Reserves Fund, LLC,
0.10%(18) | | | | | | | 6,274,548 | | | $ | 6,274,548 | |
| |
Total Short-Term Investments
(identified cost $6,274,548) | | | $ | 6,274,548 | |
| |
Total Investments — 157.9%
(identified cost $913,501,498) | | | $ | 916,958,372 | |
| |
Less Unfunded Loan Commitments — (0.3)% | | | $ | (1,802,106 | ) |
| |
Net Investments — 157.6%
(identified cost $911,699,392) | | | $ | 915,156,266 | |
| |
Notes Payable — (43.1)% | | | $ | (250,000,000 | ) |
| |
Variable Rate Term Preferred Shares, at Liquidation Value
(net of unamortized deferred debt issuance costs) — (13.8)% | | | $ | (79,914,079 | ) |
| |
Other Assets, Less Liabilities — (0.7)% | | | $ | (4,651,896 | ) |
| |
Net Assets Applicable to Common Shares — 100.0% | | | $ | 580,590,291 | |
| | | | |
| | 24 | | See Notes to Financial Statements. |
Eaton Vance
Floating-Rate Income Trust
May 31, 2021
Portfolio of Investments — continued
The percentage shown for each investment category in the Portfolio of Investments is based on net assets applicable to common shares.
| | * | In U.S. dollars unless otherwise indicated. |
| | (1) | Security exempt from registration under Rule 144A of the Securities Act of 1933, as amended. These securities may be sold in certain transactions in reliance on an exemption from registration (normally to qualified institutional buyers). At May 31, 2021, the aggregate value of these securities is $66,951,806 or 11.5% of the Trust’s net assets applicable to common shares. |
| | (2) | Variable rate security. The stated interest rate represents the rate in effect at May 31, 2021. |
| | (3) | Security was acquired in connection with a restructuring of a Senior Loan and may be subject to restrictions on resale. |
| | (4) | For fair value measurement disclosure purposes, security is categorized as Level 3 (see Note 11). |
| | (5) | Non-income producing security. |
| | (6) | Amount is less than 0.05%. |
| | (7) | Restricted security (see Note 7). |
| | (8) | Represents a payment-in-kind security which may pay interest in additional principal at the issuer’s discretion. |
| | (9) | Security converts to variable rate after the indicated fixed-rate coupon period. |
| | (10) | Perpetual security with no stated maturity date but may be subject to calls by the issuer. |
| | (11) | Senior floating-rate loans (Senior Loans) often require prepayments from excess cash flows or permit the borrowers to repay at their election. The degree to which borrowers repay, whether as a contractual requirement or at their election, cannot be predicted with accuracy. As a result, the actual |
| | remaining maturity may be substantially less than the stated maturities shown. However, Senior Loans will typically have an expected average life of approximately two to four years. Senior Loans typically have rates of interest which are redetermined periodically by reference to a base lending rate, plus a spread. These base lending rates are primarily the London Interbank Offered Rate (“LIBOR”) and secondarily, the prime rate offered by one or more major United States banks (the “Prime Rate”). Base lending rates may be subject to a floor, or a minimum rate. Senior Loans are generally subject to contractual restrictions that must be satisfied before they can be bought or sold. |
| | (12) | The stated interest rate represents the weighted average interest rate at May 31, 2021 of contracts within the senior loan facility. Interest rates on contracts are primarily redetermined either weekly, monthly or quarterly by reference to the indicated base lending rate and spread and the reset period. |
| | (13) | Unfunded or partially unfunded loan commitments. The stated interest rate reflects the weighted average of the reference rate and spread for the funded portion, if any, and the commitment fees on the portion of the loan that is unfunded. At May 31, 2021, the total value of unfunded loan commitments is $1,798,499. See Note 1F for description. |
| | (14) | This Senior Loan will settle after May 31, 2021, at which time the interest rate will be determined. |
| | (16) | Amount is less than $500. |
| | (17) | Issuer is in default with respect to interest and/or principal payments. For a variable rate security, interest rate has been adjusted to reflect non-accrual status. |
| | (18) | Affiliated investment company, available to Eaton Vance portfolios and funds, which invests in high quality, U.S. dollar denominated money market instruments. The rate shown is the annualized seven-day yield as of May 31, 2021. |
| | | | | | | | | | | | | | | | | | | | | | | | |
| Forward Foreign Currency Exchange Contracts | |
| | | | | |
| Currency Purchased | | | Currency Sold | | | Counterparty | | Settlement
Date | | | Unrealized
Appreciation | | | Unrealized
(Depreciation) | |
| | | | | | | |
| EUR | | | 19,866,910 | | | USD | | | 24,200,876 | | | Standard Chartered Bank | | | 6/2/21 | | | $ | 93,369 | | | $ | — | |
| | | | | | | |
| USD | | | 508,602 | | | EUR | | | 422,875 | | | HSBC Bank USA, N.A. | | | 6/2/21 | | | | — | | | | (7,073 | ) |
| | | | | | | |
| USD | | | 23,928,875 | | | EUR | | | 19,866,910 | | | Standard Chartered Bank | | | 6/2/21 | | | | — | | | | (365,370 | ) |
| | | | | | | |
| EUR | | | 4,258,734 | | | USD | | | 5,198,986 | | | Goldman Sachs International | | | 6/30/21 | | | | 11,626 | | | | — | |
| | | | | | | |
| USD | | | 24,701,012 | | | EUR | | | 20,950,105 | | | Goldman Sachs International | | | 6/30/21 | | | | — | | | | (931,690 | ) |
| | | | | | | |
| USD | | | 1,004,547 | | | EUR | | | 825,000 | | | HSBC Bank USA, N.A. | | | 6/30/21 | | | | — | | | | (4,851 | ) |
| | | | | | | |
| USD | | | 1,007,923 | | | EUR | | | 847,875 | | | HSBC Bank USA, N.A. | | | 6/30/21 | | | | — | | | | (29,462 | ) |
| | | | | | | |
| USD | | | 398,058 | | | EUR | | | 325,000 | | | State Street Bank and Trust Company | | | 6/30/21 | | | | 416 | | | | — | |
| | | | | | | |
| USD | | | 2,067,941 | | | EUR | | | 1,716,583 | | | State Street Bank and Trust Company | | | 6/30/21 | | | | — | | | | (32,318 | ) |
| | | | | | | |
| USD | | | 24,214,299 | | | EUR | | | 19,866,910 | | | Standard Chartered Bank | | | 7/2/21 | | | | — | | | | (94,051 | ) |
| | | | | | | |
| USD | | | 22,490,010 | | | EUR | | | 18,517,810 | | | HSBC Bank USA, N.A. | | | 7/30/21 | | | | — | | | | (179,678 | ) |
| | | | | | | |
| USD | | | 1,962,228 | | | EUR | | | 1,625,000 | | | State Street Bank and Trust Company | | | 7/30/21 | | | | — | | | | (27,113 | ) |
| | | | | | | |
| USD | | | 5,320,147 | | | EUR | | | 4,375,706 | | | State Street Bank and Trust Company | | | 7/30/21 | | | | — | | | | (36,635 | ) |
| | | | | | | |
| USD | | | 1,804,269 | | | GBP | | | 1,293,901 | | | State Street Bank and Trust Company | | | 7/30/21 | | | | — | | | | (34,078 | ) |
| | | | | | | |
| | | | | | | | | | | | | | | | | | | $ | 105,411 | | | $ | (1,742,319 | ) |
| | | | |
| | 25 | | See Notes to Financial Statements. |
Eaton Vance
Floating-Rate Income Trust
May 31, 2021
Portfolio of Investments — continued
Abbreviations:
| | | | |
| | |
| DIP | | – | | Debtor In Possession |
| | |
| EURIBOR | | – | | Euro Interbank Offered Rate |
| | |
| LIBOR | | – | | London Interbank Offered Rate |
| | |
| PIK | | – | | Payment In Kind |
Currency Abbreviations:
| | | | |
| | |
| EUR | | – | | Euro |
| | |
| GBP | | – | | British Pound Sterling |
| | |
| USD | | – | | United States Dollar |
| | | | |
| | 26 | | See Notes to Financial Statements. |
Eaton Vance
Floating-Rate Income Trust
May 31, 2021
Statement of Assets and Liabilities
| | | | |
| Assets | | May 31, 2021 | |
| |
Unaffiliated investments, at value (identified cost, $905,424,844) | | $ | 908,881,718 | |
| |
Affiliated investment, at value (identified cost, $6,274,548) | | | 6,274,548 | |
| |
Cash | | | 5,342,583 | |
| |
Cash — escrow deposits | | | 1,142,978 | |
| |
Deposits for derivatives collateral — forward foreign currency exchange contracts | | | 1,380,000 | |
| |
Foreign currency, at value (identified cost, $3,941,533) | | | 3,965,341 | |
| |
Interest and dividends receivable | | | 3,599,812 | |
| |
Dividends receivable from affiliated investment | | | 533 | |
| |
Receivable for investments sold | | | 7,528,579 | |
| |
Receivable for open forward foreign currency exchange contracts | | | 105,411 | |
| |
Prepaid upfront fees on notes payable and variable rate term preferred shares | | | 383,929 | |
| |
Prepaid expenses | | | 20,382 | |
| |
Total assets | | $ | 938,625,814 | |
| |
| Liabilities | | | | |
| |
Notes payable | | $ | 250,000,000 | |
| |
Variable rate term preferred shares, at liquidation value (net of unamortized deferred debt issuance costs of $85,921) | | | 79,914,079 | |
| |
Payable for investments purchased | | | 23,862,534 | |
| |
Payable for open forward foreign currency exchange contracts | | | 1,742,319 | |
| |
Payable to affiliates: | | | | |
| |
Investment adviser fee | | | 1,721,537 | |
| |
Trustees’ fees | | | 7,492 | |
| |
Interest expense and fees payable | | | 486,791 | |
| |
Accrued expenses | | | 300,771 | |
| |
Total liabilities | | $ | 358,035,523 | |
| |
Net assets applicable to common shares | | $ | 580,590,291 | |
|
| Sources of Net Assets | |
| |
Common shares, $0.01 par value, unlimited number of shares authorized, 39,863,690 shares issued and outstanding | | $ | 398,637 | |
| |
Additional paid-in capital | | | 624,337,774 | |
| |
Accumulated loss | | | (44,146,120 | ) |
| |
Net assets applicable to common shares | | $ | 580,590,291 | |
|
| Net Asset Value Per Common Share | |
| |
($580,590,291 ÷ 39,863,690 common shares issued and outstanding) | | $ | 14.56 | |
| | | | |
| | 27 | | See Notes to Financial Statements. |
Eaton Vance
Floating-Rate Income Trust
May 31, 2021
Statement of Operations
| | | | |
| Investment Income | | Year Ended May 31, 2021 | |
| |
Interest and other income | | $ | 40,104,379 | |
| |
Dividends | | | 1,109,291 | |
| |
Dividends from affiliated investment | | | 13,767 | |
| |
Total investment income | | $ | 41,227,437 | |
|
| Expenses | |
| |
Investment adviser fee | | $ | 6,602,754 | |
| |
Trustees’ fees and expenses | | | 44,690 | |
| |
Custodian fee | | | 218,974 | |
| |
Transfer and dividend disbursing agent fees | | | 19,199 | |
| |
Legal and accounting services | | | 428,296 | |
| |
Printing and postage | | | 101,628 | |
| |
Interest expense and fees | | | 5,092,430 | |
| |
Miscellaneous | | | 112,246 | |
| |
Total expenses | | $ | 12,620,217 | |
| |
Net investment income | | $ | 28,607,220 | |
|
| Realized and Unrealized Gain (Loss) | |
|
Net realized gain (loss) — | |
| |
Investment transactions | | $ | (18,113,989 | ) |
| |
Investment transactions — affiliated investment | | | 155 | |
| |
Foreign currency transactions | | | 70,380 | |
| |
Forward foreign currency exchange contracts | | | (4,913,762 | ) |
| |
Net realized loss | | $ | (22,957,216 | ) |
| |
Change in unrealized appreciation (depreciation) — | | | | |
| |
Investments | | $ | 85,416,956 | |
| |
Investments — affiliated investment | | | 710 | |
| |
Foreign currency | | | 76,038 | |
| |
Forward foreign currency exchange contracts | | | (797,915 | ) |
| |
Net change in unrealized appreciation (depreciation) | | $ | 84,695,789 | |
| |
Net realized and unrealized gain | | $ | 61,738,573 | |
| |
Net increase in net assets from operations | | $ | 90,345,793 | |
| | | | |
| | 28 | | See Notes to Financial Statements. |
Eaton Vance
Floating-Rate Income Trust
May 31, 2021
Statements of Changes in Net Assets
| | | | | | | | |
| | | Year Ended May 31, | |
| Increase (Decrease) in Net Assets | | 2021 | | | 2020 | |
| | |
From operations — | | | | | | | | |
| | |
Net investment income | | $ | 28,607,220 | | | $ | 33,594,529 | |
| | |
Net realized loss | | | (22,957,216 | ) | | | (20,580,181 | ) |
| | |
Net change in unrealized appreciation (depreciation) | | | 84,695,789 | | | | (59,806,577 | ) |
| | |
Net increase (decrease) in net assets from operations | | $ | 90,345,793 | | | $ | (46,792,229 | ) |
| | |
Distributions to common shareholders | | $ | (29,220,085 | ) | | $ | (40,150,709 | ) |
| | |
Net increase (decrease) in net assets | | $ | 61,125,708 | | | $ | (86,942,938 | ) |
|
| Net Assets Applicable to Common Shares | |
| | |
At beginning of year | | $ | 519,464,583 | | | $ | 606,407,521 | |
| | |
At end of year | | $ | 580,590,291 | | | $ | 519,464,583 | |
| | | | |
| | 29 | | See Notes to Financial Statements. |
Eaton Vance
Floating-Rate Income Trust
May 31, 2021
Statement of Cash Flows
| | | | |
| Cash Flows From Operating Activities | | Year Ended May 31, 2021 | |
| |
Net increase in net assets from operations | | $ | 90,345,793 | |
|
Adjustments to reconcile net increase in net assets from operations to net cash used in operating activities: | |
| |
Investments purchased | | | (325,828,721 | ) |
| |
Investments sold and principal repayments | | | 278,988,142 | |
| |
Decrease in short-term investments, net | | | 821,933 | |
| |
Net amortization/accretion of premium (discount) | | | (2,760,825 | ) |
| |
Amortization of deferred debt issuance costs on variable rate term preferred shares | | | 32,117 | |
| |
Amortization of prepaid upfront fees on notes payable and variable rate term preferred shares | | | 638,464 | |
| |
Increase in interest and dividends receivable | | | (95,404 | ) |
| |
Decrease in dividends receivable from affiliated investment | | | 980 | |
| |
Increase in receivable for open forward foreign currency exchange contracts | | | (73,428 | ) |
| |
Decrease in prepaid expenses | | | 30,343 | |
| |
Decrease in cash collateral due to broker | | | (120,000 | ) |
| |
Increase in payable for open forward foreign currency exchange contracts | | | 871,343 | |
| |
Increase in payable to affiliate for investment adviser fee | | | 1,234,094 | |
| |
Decrease in payable to affiliate for Trustees’ fees | | | (32 | ) |
| |
Decrease in interest expense and fees payable | | | (248,844 | ) |
| |
Decrease in accrued expenses | | | (91,315 | ) |
| |
Increase in unfunded loan commitments | | | 1,509,386 | |
| |
Net change in unrealized (appreciation) depreciation from investments | | | (85,417,666 | ) |
| |
Net realized loss from investments | | | 18,113,834 | |
| |
Net cash used in operating activities | | $ | (22,049,806 | ) |
| |
| Cash Flows From Financing Activities | | | | |
| |
Cash distributions paid to common shareholders | | $ | (29,220,085 | ) |
| |
Proceeds from notes payable | | | 109,000,000 | |
| |
Repayments of notes payable | | | (49,000,000 | ) |
| |
Payment of upfront fees on notes payable | | | (435,000 | ) |
| |
Net cash provided by financing activities | | $ | 30,344,915 | |
| |
Net increase in cash and restricted cash* | | $ | 8,295,109 | |
| |
Cash and restricted cash at beginning of year (including foreign currency) | | $ | 3,535,793 | |
| |
Cash and restricted cash at end of year (including foreign currency) | | $ | 11,830,902 | |
|
| Supplemental disclosure of cash flow information: | |
| |
Cash paid for interest and fees on borrowings and variable rate term preferred shares | | $ | 5,105,693 | |
| * | Includes net change in unrealized appreciation (depreciation) on foreign currency of $23,858. |
| | | | |
| | 30 | | See Notes to Financial Statements. |
Eaton Vance
Floating-Rate Income Trust
May 31, 2021
Statement of Cash Flows — continued
The following table provides a reconciliation of cash and restricted cash reported within the Statement of Assets and Liabilities that sum to the total of such amounts shown on the Statement of Cash Flows.
| | | | |
| | | May 31, 2021 | |
| |
Cash | | $ | 5,342,583 | |
| |
Cash — escrow deposits | | | 1,142,978 | |
| |
Deposits for derivatives collateral — forward foreign currency exchange contracts | | | 1,380,000 | |
| |
Foreign currency | | | 3,965,341 | |
| |
Total cash and restricted cash as shown on the Statement of Cash Flows | | $ | 11,830,902 | |
| | | | |
| | 31 | | See Notes to Financial Statements. |
Eaton Vance
Floating-Rate Income Trust
May 31, 2021
Financial Highlights
Selected data for a common share outstanding during the periods stated
| | | | | | | | | | | | | | | | | | | | |
| | | Year Ended May 31, | |
| | | 2021 | | | 2020 | | | 2019 | | | 2018 | | | 2017 | |
| | | | | |
Net asset value — Beginning of year (Common shares) | | $ | 13.030 | | | $ | 15.210 | | | $ | 15.610 | | | $ | 15.570 | | | $ | 14.680 | |
| | | | | |
| Income (Loss) From Operations | | | | | | | | | | | | | | | | | | | | |
| | | | | |
Net investment income(1) | | $ | 0.718 | | | $ | 0.843 | | | $ | 0.847 | | | $ | 0.792 | | | $ | 0.864 | |
| | | | | |
Net realized and unrealized gain (loss) | | | 1.545 | | | | (2.016 | ) | | | (0.373 | ) | | | 0.076 | | | | 0.899 | |
| | | | | |
Total income (loss) from operations | | $ | 2.263 | | | $ | (1.173 | ) | | $ | 0.474 | | | $ | 0.868 | | | $ | 1.763 | |
| | | | | |
| Less Distributions to Common Shareholders | | | | | | | | | | | | | | | | | | | | |
| | | | | |
From net investment income | | $ | (0.733 | ) | | $ | (1.007 | ) | | $ | (0.874 | ) | | $ | (0.828 | ) | | $ | (0.873 | ) |
| | | | | |
Total distributions to common shareholders | | $ | (0.733 | ) | | $ | (1.007 | ) | | $ | (0.874 | ) | | $ | (0.828 | ) | | $ | (0.873 | ) |
| | | | | |
Net asset value — End of year (Common shares) | | $ | 14.560 | | | $ | 13.030 | | | $ | 15.210 | | | $ | 15.610 | | | $ | 15.570 | |
| | | | | |
Market value — End of year (Common shares) | | $ | 14.280 | | | $ | 11.240 | | | $ | 13.480 | | | $ | 14.850 | | | $ | 15.150 | |
| | | | | |
Total Investment Return on Net Asset Value(2) | | | 18.25 | % | | | (7.36 | )% | | | 3.77 | % | | | 6.03 | % | | | 12.65 | % |
| | | | | |
Total Investment Return on Market Value(2) | | | 34.36 | % | | | (9.83 | )% | | | (3.32 | )% | | | 3.67 | % | | | 18.58 | % |
| | | | |
| | 32 | | See Notes to Financial Statements. |
Eaton Vance
Floating-Rate Income Trust
May 31, 2021
Financial Highlights — continued
Selected data for a common share outstanding during the periods stated
| | | | | | | | | | | | | | | | | | | | |
| | | Year Ended May 31, | |
| Ratios/Supplemental Data | | 2021 | | | 2020 | | | 2019 | | | 2018 | | | 2017 | |
| | | | | |
Net assets applicable to common shares, end of year (000’s omitted) | | $ | 580,590 | | | $ | 519,465 | | | $ | 606,408 | | | $ | 622,241 | | | $ | 620,772 | |
| | | | | |
Ratios (as a percentage of average daily net assets applicable to common shares):† | | | | | | | | | | | | | | | | | | | | |
| | | | | |
Expenses excluding interest and fees | | | 1.33 | % | | | 1.26 | % | | | 1.28 | % | | | 1.28 | % | | | 1.32 | % |
| | | | | |
Interest and fee expense(3) | | | 0.91 | % | | | 1.79 | % | | | 2.00 | % | | | 1.52 | % | | | 1.16 | % |
| | | | | |
Total expenses | | | 2.24 | % | | | 3.05 | % | | | 3.28 | % | | | 2.80 | % | | | 2.48 | % |
| | | | | |
Net investment income | | | 5.08 | % | | | 5.85 | % | | | 5.49 | % | | | 5.09 | % | | | 5.68 | % |
| | | | | |
Portfolio Turnover | | | 32 | % | | | 34 | % | | | 24 | % | | | 34 | % | | | 47 | % |
| | | | | |
Senior Securities: | | | | | | | | | | | | | | | | | | | | |
| | | | | |
Total notes payable outstanding (in 000’s) | | $ | 250,000 | | | $ | 190,000 | | | $ | 248,000 | | | $ | 254,000 | | | $ | 246,000 | |
| | | | | |
Asset coverage per $1,000 of notes payable(4) | | $ | 3,642 | | | $ | 4,155 | | | $ | 3,768 | | | $ | 3,765 | | | $ | 3,849 | |
| | | | | |
Total preferred shares outstanding | | | 800 | | | | 800 | | | | 800 | | | | 800 | | | | 800 | |
| | | | | |
Asset coverage per preferred share(5) | | $ | 275,936 | | | $ | 292,394 | | | $ | 284,880 | | | $ | 286,300 | | | $ | 290,421 | |
| | | | | |
Involuntary liquidation preference per preferred share(6) | | $ | 100,000 | | | $ | 100,000 | | | $ | 100,000 | | | $ | 100,000 | | | $ | 100,000 | |
| | | | | |
Approximate market value per preferred share(6) | | $ | 100,000 | | | $ | 100,000 | | | $ | 100,000 | | | $ | 100,000 | | | $ | 100,000 | |
| (1) | Computed using average common shares outstanding. |
| (2) | Returns are historical and are calculated by determining the percentage change in net asset value or market value with all distributions reinvested. Distributions are assumed to be reinvested at prices obtained under the Trust’s dividend reinvestment plan. |
| (3) | Interest and fee expense relates to variable rate term preferred shares (see Note 2) and the notes payable (see Note 9). |
| (4) | Calculated by subtracting the Trust’s total liabilities (not including the notes payable and preferred shares) from the Trust’s total assets, and dividing the result by the notes payable balance in thousands. |
| (5) | Calculated by subtracting the Trust’s total liabilities (not including the notes payable and preferred shares) from the Trust’s total assets, dividing the result by the sum of the value of the notes payable and liquidation value of the preferred shares, and multiplying the result by the liquidation value of one preferred share. Such amount equates to 276%, 292%, 285%, 286% and 290% at May 31, 2021, 2020, 2019, 2018 and 2017, respectively. |
| (6) | Plus accumulated and unpaid dividends. |
| † | Ratios based on net assets applicable to common shares plus preferred shares and borrowings are presented below. |
| | | | | | | | | | | | | | | | | | | | |
| | | Year Ended May 31, | |
| | | 2021 | | | 2020 | | | 2019 | | | 2018 | | | 2017 | |
| | | | | | |
Expenses excluding interest and fees | | | 0.85 | % | | | 0.81 | % | | | 0.83 | % | | | 0.83 | % | | | 0.86 | % |
| | | | | |
Interest and fee expense | | | 0.58 | % | | | 1.16 | % | | | 1.31 | % | | | 1.00 | % | | | 0.76 | % |
| | | | | |
Total expenses | | | 1.43 | % | | | 1.97 | % | | | 2.14 | % | | | 1.83 | % | | | 1.62 | % |
| | | | | |
Net investment income | | | 3.25 | % | | | 3.79 | % | | | 3.58 | % | | | 3.33 | % | | | 3.72 | % |
| | | | |
| | 33 | | See Notes to Financial Statements. |
Eaton Vance
Floating-Rate Income Trust
May 31, 2021
Notes to Financial Statements
1 Significant Accounting Policies
Eaton Vance Floating-Rate Income Trust (the Trust) is a Massachusetts business trust registered under the Investment Company Act of 1940, as amended (the 1940 Act), as a diversified, closed-end management investment company. The Trust’s investment objective is to provide a high level of current income. The Trust will, as a secondary objective, also seek preservation of capital to the extent consistent with its primary goal of high current income.
The following is a summary of significant accounting policies of the Trust. The policies are in conformity with accounting principles generally accepted in the United States of America (U.S. GAAP). The Trust is an investment company and follows accounting and reporting guidance in the Financial Accounting Standards Board (FASB) Accounting Standards Codification Topic 946.
A Investment Valuation — The following methodologies are used to determine the market value or fair value of investments.
Senior Floating-Rate Loans. Interests in senior floating-rate loans (Senior Loans) for which reliable market quotations are readily available are valued generally at the average mean of bid and ask quotations obtained from a third party pricing service. Other Senior Loans are valued at fair value by the investment adviser under procedures approved by the Trustees. In fair valuing a Senior Loan, the investment adviser utilizes one or more of the valuation techniques described in (i) through (iii) below to assess the likelihood that the borrower will make a full repayment of the loan underlying such Senior Loan relative to yields on other Senior Loans issued by companies of comparable credit quality. If the investment adviser believes that there is a reasonable likelihood of full repayment, the investment adviser will determine fair value using a matrix pricing approach that considers the yield on the Senior Loan. If the investment adviser believes there is not a reasonable likelihood of full repayment, the investment adviser will determine fair value using analyses that include, but are not limited to: (i) a comparison of the value of the borrower’s outstanding equity and debt to that of comparable public companies; (ii) a discounted cash flow analysis; or (iii) when the investment adviser believes it is likely that a borrower will be liquidated or sold, an analysis of the terms of such liquidation or sale. In certain cases, the investment adviser will use a combination of analytical methods to determine fair value, such as when only a portion of a borrower’s assets are likely to be sold. In conducting its assessment and analyses for purposes of determining fair value of a Senior Loan, the investment adviser will use its discretion and judgment in considering and appraising relevant factors. Fair value determinations are made by the portfolio managers of the Trust based on information available to such managers. The portfolio managers of other funds managed by the investment adviser that invest in Senior Loans may not possess the same information about a Senior Loan borrower as the portfolio managers of the Trust. At times, the fair value of a Senior Loan determined by the portfolio managers of other funds managed by the investment adviser that invest in Senior Loans may vary from the fair value of the same Senior Loan determined by the portfolio managers of the Trust. The fair value of each Senior Loan is periodically reviewed and approved by the investment adviser’s Valuation Committee and by the Trustees based upon procedures approved by the Trustees. Junior Loans (i.e., subordinated loans and second lien loans) are valued in the same manner as Senior Loans.
Debt Obligations. Debt obligations are generally valued on the basis of valuations provided by third party pricing services, as derived from such services’ pricing models. Inputs to the models may include, but are not limited to, reported trades, executable bid and ask prices, broker/dealer quotations, prices or yields of securities with similar characteristics, interest rates, anticipated prepayments, benchmark curves or information pertaining to the issuer, as well as industry and economic events. The pricing services may use a matrix approach, which considers information regarding securities with similar characteristics to determine the valuation for a security. Short-term debt obligations purchased with a remaining maturity of sixty days or less for which a valuation from a third party pricing service is not readily available may be valued at amortized cost, which approximates fair value.
Equity Securities. Equity securities listed on a U.S. securities exchange generally are valued at the last sale or closing price on the day of valuation or, if no sales took place on such date, at the mean between the closing bid and ask prices on the exchange where such securities are principally traded. Equity securities listed on the NASDAQ Global or Global Select Market generally are valued at the NASDAQ official closing price. Unlisted or listed securities for which closing sales prices or closing quotations are not available are valued at the mean between the latest available bid and ask prices or, in the case of preferred equity securities that are not listed or traded in the over-the-counter market, by a third party pricing service that uses various techniques that consider factors including, but not limited to, prices or yields of securities with similar characteristics, benchmark yields, broker/dealer quotes, quotes of underlying common stock, issuer spreads, as well as industry and economic events.
Derivatives. Forward foreign currency exchange contracts are generally valued at the mean of the average bid and average ask prices that are reported by currency dealers to a third party pricing service at the valuation time. Such third party pricing service valuations are supplied for specific settlement periods and the Trust’s forward foreign currency exchange contracts are valued at an interpolated rate between the closest preceding and subsequent settlement period reported by the third party pricing service.
Foreign Securities and Currencies. Foreign securities and currencies are valued in U.S. dollars, based on foreign currency exchange rate quotations supplied by a third party pricing service. The pricing service uses a proprietary model to determine the exchange rate. Inputs to the model include reported trades and implied bid/ask spreads.
Affiliated Fund. The Trust may invest in Eaton Vance Cash Reserves Fund, LLC (Cash Reserves Fund), an affiliated investment company managed by Eaton Vance Management (EVM). While Cash Reserves Fund is not a registered money market mutual fund, it conducts all of its investment activities in accordance with the requirements of Rule 2a-7 under the 1940 Act. Investments in Cash Reserves Fund are valued at the closing net asset value per unit on the valuation day. Cash Reserves Fund generally values its investment securities based on available market quotations provided by a third party pricing service.
Fair Valuation. Investments for which valuations or market quotations are not readily available or are deemed unreliable are valued at fair value using methods determined in good faith by or at the direction of the Trustees of the Trust in a manner that most fairly reflects the security’s “fair value”, which is the amount that the Trust might reasonably expect to receive for the security upon its current sale in the ordinary course. Each such determination is based
Eaton Vance
Floating-Rate Income Trust
May 31, 2021
Notes to Financial Statements — continued
on a consideration of relevant factors, which are likely to vary from one pricing context to another. These factors may include, but are not limited to, the type of security, the existence of any contractual restrictions on the security’s disposition, the price and extent of public trading in similar securities of the issuer or of comparable companies or entities, quotations or relevant information obtained from broker/dealers or other market participants, information obtained from the issuer, analysts, and/or the appropriate stock exchange (for exchange-traded securities), an analysis of the company’s or entity’s financial statements, and an evaluation of the forces that influence the issuer and the market(s) in which the security is purchased and sold.
B Investment Transactions — Investment transactions for financial statement purposes are accounted for on a trade date basis. Realized gains and losses on investments sold are determined on the basis of identified cost.
C Income — Interest income is recorded on the basis of interest accrued, adjusted for amortization of premium or accretion of discount. Fees associated with loan amendments are recognized immediately. Dividend income is recorded on the ex-dividend date for dividends received in cash and/or securities. Distributions from investment companies are recorded as dividend income, capital gains or return of capital based on the nature of the distribution.
D Federal Taxes — The Trust’s policy is to comply with the provisions of the Internal Revenue Code applicable to regulated investment companies and to distribute to shareholders each year substantially all of its net investment income, and all or substantially all of its net realized capital gains. Accordingly, no provision for federal income or excise tax is necessary.
As of May 31, 2021, the Trust had no uncertain tax positions that would require financial statement recognition, de-recognition, or disclosure. The Trust files a U.S. federal income tax return annually after its fiscal year-end, which is subject to examination by the Internal Revenue Service for a period of three years from the date of filing.
E Foreign Currency Translation — Investment valuations, other assets, and liabilities initially expressed in foreign currencies are translated each business day into U.S. dollars based upon current exchange rates. Purchases and sales of foreign investment securities and income and expenses denominated in foreign currencies are translated into U.S. dollars based upon currency exchange rates in effect on the respective dates of such transactions. Recognized gains or losses on investment transactions attributable to changes in foreign currency exchange rates are recorded for financial statement purposes as net realized gains and losses on investments. That portion of unrealized gains and losses on investments that results from fluctuations in foreign currency exchange rates is not separately disclosed.
F Unfunded Loan Commitments — The Trust may enter into certain loan agreements all or a portion of which may be unfunded. The Trust is obligated to fund these commitments at the borrower’s discretion. These commitments are disclosed in the accompanying Portfolio of Investments. At May 31, 2021, the Trust had sufficient cash and/or securities to cover these commitments.
G Use of Estimates — The preparation of the financial statements in conformity with U.S. GAAP requires management to make estimates and assumptions that affect the reported amounts of assets and liabilities at the date of the financial statements and the reported amounts of income and expense during the reporting period. Actual results could differ from those estimates.
H Indemnifications — Under the Trust’s organizational documents, its officers and Trustees may be indemnified against certain liabilities and expenses arising out of the performance of their duties to the Trust. Under Massachusetts law, if certain conditions prevail, shareholders of a Massachusetts business trust (such as the Trust) could be deemed to have personal liability for the obligations of the Trust. However, the Trust’s Declaration of Trust contains an express disclaimer of liability on the part of Trust shareholders and the By-laws provide that the Trust shall assume, upon request by the shareholder, the defense on behalf of any Trust shareholders. Moreover, the By-laws also provide for indemnification out of Trust property of any shareholder held personally liable solely by reason of being or having been a shareholder for all loss or expense arising from such liability. Additionally, in the normal course of business, the Trust enters into agreements with service providers that may contain indemnification clauses. The Trust’s maximum exposure under these arrangements is unknown as this would involve future claims that may be made against the Trust that have not yet occurred.
I Forward Foreign Currency Exchange Contracts — The Trust may enter into forward foreign currency exchange contracts for the purchase or sale of a specific foreign currency at a fixed price on a future date. The forward foreign currency exchange contracts are adjusted by the daily exchange rate of the underlying currency and any gains or losses are recorded as unrealized until such time as the contracts have been closed. Risks may arise upon entering these contracts from the potential inability of counterparties to meet the terms of their contracts and from movements in the value of a foreign currency relative to the U.S. dollar.
2 Variable Rate Term Preferred Shares
Variable rate term preferred shares are a form of preferred shares that represent stock of the Trust. They have a par value of $0.01 per share and a liquidation preference of $100,000 per share.
On December 18, 2012, the Trust issued 800 shares of Series C-1 Variable Rate Term Preferred Shares (Series C-1 VRTP Shares) in a private offering to a commercial paper conduit sponsored by a large financial institution. The Trust used the net proceeds from the issuance to enter into a series of transactions which resulted in a redemption and/or repurchase of its Auction Preferred Shares.
Eaton Vance
Floating-Rate Income Trust
May 31, 2021
Notes to Financial Statements — continued
On September 30, 2016, the Series C-1 VRTP Shares were transferred to another large financial institution (the Assignee) as permitted by the Trust’s By-laws. The transferred Series C-1 VRTP Shares were then exchanged for an equal number of Series L-2 Variable Rate Term Preferred Shares (Series L-2 VRTP Shares), and the mandatory redemption date was extended to three years from the date of transfer. Effective January 24, 2019, the mandatory redemption date of the Series L-2 VRTP Shares was extended to January 24, 2024. Dividends on the Series L-2 VRTP Shares are determined each day based on a spread of 1.75% to three-month LIBOR. Such spread is determined based on the current credit rating of the Series L-2 VRTP Shares, which is provided by Moody’s Investors Service.
The Series L-2 VRTP Shares are redeemable at the option of the Trust at a redemption price equal to $100,000 per share, plus accumulated and unpaid dividends, on any business day and solely for the purpose of reducing the leverage of the Trust. The Series L-2 VRTP Shares are also subject to mandatory redemption at a redemption price equal to $100,000 per share, plus accumulated and unpaid dividends, if the Trust is in default for an extended period on its asset maintenance or leverage ratio requirements with respect to the Series L-2 VRTP Shares. Six months prior to the mandatory redemption date, the Trust is required to segregate in a liquidity account with its custodian investments equal to 110% of the Series L-2 VRTP Shares’ redemption price, and over the six-month period execute a series of liquidation transactions to assure sufficient liquidity to redeem the Series L-2 VRTP Shares. The holders of the Series L-2 VRTP Shares, voting as a class, are entitled to elect two Trustees of the Trust. If the dividends on the Series L-2 VRTP Shares remain unpaid in an amount equal to two full years’ dividends, the holders of the Series L-2 VRTP Shares as a class have the right to elect a majority of the Board of Trustees.
For financial reporting purposes, the liquidation value of the Series L-2 VRTP Shares (net of unamortized deferred debt issuance costs) is presented as a liability on the Statement of Assets and Liabilities and unpaid dividends are included in interest expense and fees payable. Dividends accrued on Series L-2 VRTP Shares are treated as interest payments for financial reporting purposes and are included in interest expense and fees on the Statement of Operations.
In connection with the transfer of the Series C-1 VRTP Shares to the Assignee on September 30, 2016, the Trust paid an upfront fee of $400,000 and debt issuance costs of $458,267. The Trust paid additional debt issuance costs of $52,580 in connection with the extension of the mandatory redemption date of the Series L-2 VRTP Shares. These amounts are being amortized to interest expense and fees through January 24, 2024. The unamortized amount of the debt issuance costs as of May 31, 2021 is presented as a reduction of the liability for variable rate term preferred shares on the Statement of Assets and Liabilities.
The carrying amount of the Series L-2 VRTP Shares at May 31, 2021 represents its liquidation value, which approximates fair value. If measured at fair value, the Series L-2 VRTP Shares would have been considered as Level 2 in the fair value hierarchy (see Note 11) at May 31, 2021. The average liquidation preference of the Series L-2 VRTP Shares during the year ended May 31, 2021 was $80,000,000.
3 Distributions to Shareholders and Income Tax Information
The Trust intends to make monthly distributions of net investment income to common shareholders, after payment of any dividends on any outstanding variable rate term preferred shares. In addition, at least annually, the Trust intends to distribute all or substantially all of its net realized capital gains. Distributions to common shareholders are recorded on the ex-dividend date. Dividends to variable rate term preferred shareholders are accrued daily and payable quarterly. The dividend rate on the Series L-2 VRTP Shares at May 31, 2021 was 1.95%. The amount of dividends accrued and the average dividend rate of the Series L-2 VRTP Shares during the year ended May 31, 2021 were $1,697,392 and 2.12%, respectively.
Distributions to shareholders are determined in accordance with income tax regulations, which may differ from U.S. GAAP. As required by U.S. GAAP, only distributions in excess of tax basis earnings and profits are reported in the financial statements as a return of capital. Permanent differences between book and tax accounting relating to distributions are reclassified to paid-in capital. For tax purposes, distributions from short-term capital gains are considered to be from ordinary income.
The tax character of distributions declared, including distributions on variable rate term preferred shares that are treated as interest expense for financial reporting purposes, for the years ended May 31, 2021 and May 31, 2020 was as follows:
| | | | | | | | |
| | | Year Ended May 31, | |
| | | 2021 | | | 2020 | |
| | |
Ordinary income | | $ | 30,917,477 | | | $ | 43,249,800 | |
During the year ended May 31, 2021, accumulated loss was decreased by $50,370 and paid-in capital was decreased by $50,370 due to differences between book and tax accounting, primarily for non-deductible expenses. These reclassifications had no effect on the net assets or net asset value per share of the Trust.
Eaton Vance
Floating-Rate Income Trust
May 31, 2021
Notes to Financial Statements — continued
As of May 31, 2021, the components of distributable earnings (accumulated loss) on a tax basis were as follows:
| | | | |
| | |
Undistributed ordinary income | | $ | 2,239,424 | |
| |
Deferred capital losses | | | (44,744,452 | ) |
| |
Net unrealized depreciation | | | (1,375,467 | ) |
| |
Distributions payable | | | (265,625 | ) |
| |
Accumulated loss | | $ | (44,146,120 | ) |
At May 31, 2021, the Trust, for federal income tax purposes, had deferred capital losses of $44,744,452 which would reduce its taxable income arising from future net realized gains on investment transactions, if any, to the extent permitted by the Internal Revenue Code, and thus would reduce the amount of distributions to shareholders, which would otherwise be necessary to relieve the Trust of any liability for federal income or excise tax. The deferred capital losses are treated as arising on the first day of the Trust’s next taxable year and retain the same short-term or long-term character as when originally deferred. Of the deferred capital losses at May 31, 2021, $5,304,684 are short-term and $39,439,768 are long-term.
The cost and unrealized appreciation (depreciation) of investments, including open derivative contracts, of the Trust at May 31, 2021, as determined on a federal income tax basis, were as follows:
| | | | |
| |
Aggregate cost | | $ | 916,507,558 | |
| |
Gross unrealized appreciation | | $ | 10,585,147 | |
| |
Gross unrealized depreciation | | | (11,936,439 | ) |
| |
Net unrealized depreciation | | $ | (1,351,292 | ) |
4 Investment Adviser Fee and Other Transactions with Affiliates
The investment adviser fee is earned by EVM as compensation for investment advisory services rendered to the Trust. On March 1, 2021, Morgan Stanley acquired Eaton Vance Corp. (the “Transaction”) and EVM became an indirect, wholly-owned subsidiary of Morgan Stanley. In connection with the closing of the Transaction, the Trust entered into an interim investment advisory agreement (the “Interim Agreement”) with EVM, which took effect on March 1, 2021. The Interim Agreement allowed EVM to continue to manage the Trust for up to an additional 150 days following the Transaction to provide more time for further proxy solicitation in connection with shareholder approval of a new investment advisory agreement (the “New Agreement”). Compensation payable to EVM pursuant to the Interim Agreement was required to be held in an interest-bearing escrow account with the Trust’s custodian. The New Agreement was approved by Trust shareholders on April 16, 2021. Pursuant to the New Agreement (and the Trust’s Interim Agreement and investment advisory agreement with EVM in effect prior to March 1, 2021), the investment adviser fee is computed at an annual rate of 0.75% of the Trust’s average daily gross assets and is payable monthly. Gross assets as referred to herein represent net assets plus obligations attributable to investment leverage. For the year ended May 31, 2021, the Trust’s investment adviser fee amounted to $6,602,754. The Trust may invest its cash in Cash Reserves Fund. EVM does not currently receive a fee for advisory services provided to Cash Reserves Fund. EVM also serves as administrator of the Trust, but receives no compensation.
Trustees and officers of the Trust who are members of EVM’s organization receive remuneration for their services to the Trust out of the investment adviser fee. Trustees of the Trust who are not affiliated with EVM may elect to defer receipt of all or a percentage of their annual fees in accordance with the terms of the Trustees Deferred Compensation Plan. For the year ended May 31, 2021, no significant amounts have been deferred. Certain officers and Trustees of the Trust are officers of EVM.
5 Purchases and Sales of Investments
Purchases and sales of investments, other than short-term obligations and including maturities, paydowns and principal repayments on Senior Loans, aggregated $331,641,044 and $278,192,562, respectively, for the year ended May 31, 2021.
6 Common Shares of Beneficial Interest and Shelf Offering
The Trust may issue common shares pursuant to its dividend reinvestment plan. There were no common shares issued by the Trust for the years ended May 31, 2021 and May 31, 2020.
In November 2013, the Board of Trustees initially approved a share repurchase program for the Trust. Pursuant to the reauthorization of the share repurchase program by the Board of Trustees in March 2019, the Trust is authorized to repurchase up to 10% of its common shares outstanding as of the last day of the
Eaton Vance
Floating-Rate Income Trust
May 31, 2021
Notes to Financial Statements — continued
prior calendar year at market prices when shares are trading at a discount to net asset value. The share repurchase program does not obligate the Trust to purchase a specific amount of shares. There were no repurchases of common shares by the Trust for the years ended May 31, 2021 and May 31, 2020.
Pursuant to a registration statement filed with the SEC, the Trust is authorized to issue up to an additional 5,495,789 common shares through an equity shelf offering program (the “shelf offering”). Under the shelf offering, the Trust, subject to market conditions, may raise additional capital from time to time and in varying amounts and offering methods at a net price at or above the Trust’s net asset value per common share. During the years ended May 31, 2021 and May 31, 2020, there were no shares sold by the Trust pursuant to its shelf offering.
As announced on March 16, 2021 and further updated on May 12, 2021, conditioned on shareholder approval of the New Agreement (which occurred on April 16, 2021), the Trust’s Board of Trustees authorized 1) an initial conditional cash tender offer (the “Initial Cash Tender Offer”) by the Trust of up to 50% of its outstanding common shares at a price per share equal to 99% of the Trust’s net asset value (“NAV”) per share as of the close of regular trading on the New York Stock Exchange on the date the Initial Cash Tender Offer expires and 2) a conditional increase in the Trust’s regular monthly distribution on common shares of approximately 25% from the Trust’s March 2021 distribution.
In addition to the Initial Cash Tender Offer, the Trust announced on May 12, 2021 that it will conduct cash tender offers in the fourth quarter of each of 2022, 2023 and 2024 (each, a “Conditional Tender Offer”) for up to 10% of the Trust’s then-outstanding common shares if, from January to August of the relevant year, the Trust’s shares trade at an average daily discount to NAV of more than 10%, based upon the Trust’s volume-weighted average market price and NAV on each business day during the period. If triggered, common shares tendered and accepted in a Conditional Tender Offer would be repurchased at a price per share equal to 98% of the Trust’s NAV as of the close of regular trading on the New York Stock Exchange on the date such Conditional Tender Offer expires.
According to filings made on Schedule 13D and 13G pursuant to Sections 13(d) and 13(g) of the Securities Exchange Act of 1934, as amended, one entity and one individual affiliated with such entity together owned 15.6% of the Trust’s common shares.
7 Restricted Securities
At May 31, 2021, the Trust owned the following securities which were restricted as to public resale and not registered under the Securities Act of 1933 (excluding Rule 144A securities). The Trust has various registration rights (exercisable under a variety of circumstances) with respect to these securities. The value of these securities is determined based on valuations provided by brokers when available, or if not available, they are valued at fair value using methods determined in good faith by or at the direction of the Trustees.
| | | | | | | | | | | | | | | | |
| Description | | Date of Acquisition | | | Shares | | | Cost | | | Value | |
| | | | |
Common Stocks | | | | | | | | | | | | | | | | |
| | | | |
Nine Point Energy Holdings, Inc. | | | 7/15/14, 10/21/14 | | | | 758 | | | $ | 34,724 | | | $ | 0 | |
| | | | |
Convertible Preferred Stocks | | | | | | | | | | | | | | | | |
| | | | |
Nine Point Energy Holdings, Inc., Series A, 12.00% | | | 5/26/17 | | | | 14 | | | | 14,000 | | | | 0 | |
| | | | |
Total Restricted Securities | | | | | | | | | | $ | 48,724 | | | $ | 0 | |
8 Financial Instruments
The Trust may trade in financial instruments with off-balance sheet risk in the normal course of its investing activities. These financial instruments may include forward foreign currency exchange contracts and may involve, to a varying degree, elements of risk in excess of the amounts recognized for financial statement purposes. The notional or contractual amounts of these instruments represent the investment the Trust has in particular classes of financial instruments and do not necessarily represent the amounts potentially subject to risk. The measurement of the risks associated with these instruments is meaningful only when all related and offsetting transactions are considered. A summary of obligations under these financial instruments at May 31, 2021 is included in the Portfolio of Investments. At May 31, 2021, the Trust had sufficient cash and/or securities to cover commitments under these contracts.
The Trust is subject to foreign exchange risk in the normal course of pursuing its investment objectives. Because the Trust holds foreign currency denominated investments, the value of these investments and related receivables and payables may change due to future changes in foreign currency exchange rates. To hedge against this risk, the Trust enters into forward foreign currency exchange contracts.
The Trust enters into forward foreign currency exchange contracts that may contain provisions whereby the counterparty may terminate the contract under certain conditions, including but not limited to a decline in the Trust’s net assets below a certain level over a certain period of time, which would trigger a payment by the Trust for those derivatives in a liability position. At May 31, 2021, the fair value of derivatives with credit-related contingent features in a net liability position was $1,742,319. The aggregate fair value of assets pledged as collateral by the Trust for such liability was $1,380,000 at May 31, 2021.
Eaton Vance
Floating-Rate Income Trust
May 31, 2021
Notes to Financial Statements — continued
The over-the-counter (OTC) derivatives in which the Trust invests are subject to the risk that the counterparty to the contract fails to perform its obligations under the contract. To mitigate this risk, the Trust has entered into an International Swaps and Derivatives Association, Inc. Master Agreement (“ISDA Master Agreement”) or similar agreement with substantially all its derivative counterparties. An ISDA Master Agreement is a bilateral agreement between the Trust and a counterparty that governs certain OTC derivatives and typically contains, among other things, set-off provisions in the event of a default and/or termination event as defined under the relevant ISDA Master Agreement. Under an ISDA Master Agreement, the Trust may, under certain circumstances, offset with the counterparty certain derivative financial instruments’ payables and/or receivables with collateral held and/or posted and create one single net payment. The provisions of the ISDA Master Agreement typically permit a single net payment in the event of default including the bankruptcy or insolvency of the counterparty. However, bankruptcy or insolvency laws of a particular jurisdiction may impose restrictions on or prohibitions against the right of offset in bankruptcy or insolvency. Certain ISDA Master Agreements allow counterparties to OTC derivatives to terminate derivative contracts prior to maturity in the event the Trust’s net assets decline by a stated percentage or the Trust fails to meet the terms of its ISDA Master Agreements, which would cause the counterparty to accelerate payment by the Trust of any net liability owed to it.
The collateral requirements for derivatives traded under an ISDA Master Agreement are governed by a Credit Support Annex to the ISDA Master Agreement. Collateral requirements are determined at the close of business each day and are typically based on changes in market values for each transaction under an ISDA Master Agreement and netted into one amount for such agreement. Generally, the amount of collateral due from or to a counterparty is subject to a minimum transfer threshold amount before a transfer is required, which may vary by counterparty. Collateral pledged for the benefit of the Trust and/or counterparty is held in segregated accounts by the Trust’s custodian and cannot be sold, re-pledged, assigned or otherwise used while pledged. The portion of such collateral representing cash, if any, is reflected as deposits for derivatives collateral and, in the case of cash pledged by a counterparty for the benefit of the Trust, a corresponding liability on the Statement of Assets and Liabilities. Securities pledged by the Trust as collateral, if any, are identified as such in the Portfolio of Investments.
The fair value of open derivative instruments (not considered to be hedging instruments for accounting disclosure purposes) and whose primary underlying risk exposure is foreign exchange risk at May 31, 2021 was as follows:
| | | | | | | | |
| | | Fair Value | |
| Derivative | | Asset Derivative(1) | | | Liability Derivative(2) | |
| | |
Forward foreign currency exchange contracts | | $ | 105,411 | | | $ | (1,742,319 | ) |
| (1) | Statement of Assets and Liabilities location: Receivable for open forward foreign currency exchange contracts. |
| (2) | Statement of Assets and Liabilities location: Payable for open forward foreign currency exchange contracts. |
The Trust’s derivative assets and liabilities at fair value by type, which are reported gross in the Statement of Assets and Liabilities, are presented in the table above. The following tables present the Trust’s derivative assets and liabilities by counterparty, net of amounts available for offset under a master netting agreement and net of the related collateral received by the Trust for such assets and pledged by the Trust for such liabilities as of May 31, 2021.
| | | | | | | | | | | | | | | | | | | | |
| Counterparty | | Derivative Assets
Subject to
Master Netting
Agreement | | | Derivatives
Available
for Offset | | | Non-cash
Collateral
Received(a) | | | Cash
Collateral
Received(a) | | | Net Amount
of Derivative
Assets(b) | |
| | | | | |
Goldman Sachs International | | $ | 11,626 | | | $ | (11,626 | ) | | $ | — | | | $ | — | | | $ | — | |
| | | | | |
Standard Chartered Bank | | | 93,369 | | | | (93,369 | ) | | | — | | | | — | | | | — | |
| | | | | |
State Street Bank and Trust Company | | | 416 | | | | (416 | ) | | | — | | | | — | | | | — | |
| | | | | |
| | | $ | 105,411 | | | $ | (105,411 | ) | | $ | — | | | $ | — | | | $ | — | |
Eaton Vance
Floating-Rate Income Trust
May 31, 2021
Notes to Financial Statements — continued
| | | | | | | | | | | | | | | | | | | | |
| Counterparty | | Derivative Liabilities
Subject to
Master Netting
Agreement | | | Derivatives
Available
for Offset | | | Non-cash
Collateral
Pledged(a) | | | Cash
Collateral
Pledged(a) | | | Net Amount
of Derivative
Liabilities(c) | |
| | | | | |
Goldman Sachs International | | $ | (931,690 | ) | | $ | 11,626 | | | $ | — | | | $ | 870,000 | | | $ | (50,064 | ) |
| | | | | |
HSBC Bank USA, N.A. | | | (221,064 | ) | | | — | | | | — | | | | 160,000 | | | | (61,064 | ) |
| | | | | |
Standard Chartered Bank | | | (459,421 | ) | | | 93,369 | | | | — | | | | 350,000 | | | | (16,052 | ) |
| | | | | |
State Street Bank and Trust Company | | | (130,144 | ) | | | 416 | | | | — | | | | — | | | | (129,728 | ) |
| | | | | |
| | | $ | (1,742,319 | ) | | $ | 105,411 | | | $ | — | | | $ | 1,380,000 | | | $ | (256,908 | ) |
| (a) | In some instances, the total collateral received and/or pledged may be more than the amount shown due to overcollateralization. |
| (b) | Net amount represents the net amount due from the counterparty in the event of default. |
| (c) | Net amount represents the net amount payable to the counterparty in the event of default. |
The effect of derivative instruments (not considered to be hedging instruments for accounting disclosure purposes) on the Statement of Operations and whose primary underlying risk exposure is foreign exchange risk for the year ended May 31, 2021 was as follows:
| | | | | | | | |
| Derivative | | Realized Gain (Loss) on Derivatives Recognized in Income(1) | | | Change in Unrealized Appreciation (Depreciation) on
Derivatives Recognized in Income(2) | |
| | |
Forward foreign currency exchange contracts | | $ | (4,913,762 | ) | | $ | (797,915 | ) |
| (1) | Statement of Operations location: Net realized gain (loss) – Forward foreign currency exchange contracts. |
| (2) | Statement of Operations location: Change in unrealized appreciation (depreciation) – Forward foreign currency exchange contracts. |
The average notional amount of forward foreign currency exchange contracts (based on the absolute value of notional amounts of currency purchased and currency sold) outstanding during the year ended May 31, 2021, which is indicative of the volume of this derivative type, was approximately $88,402,000.
9 Revolving Credit and Security Agreement
The Trust has entered into a Revolving Credit and Security Agreement, as amended (the Agreement) with conduit lenders and a bank to borrow up to $290 million. Borrowings under the Agreement are secured by the assets of the Trust. Interest is charged at a rate above the conduits’ commercial paper issuance rate and is payable monthly. Under the terms of the Agreement, in effect through March 7, 2022, the Trust also pays a program fee of 0.90% (0.85% prior to March 8, 2021) per annum on its outstanding borrowings to administer the facility and a liquidity fee of 0.15% (0.25% if the outstanding loan amount is less than or equal to 60% of the total facility size) per annum on the unused portion of the total commitment under the Agreement. Program and liquidity fees for the year ended May 31, 2021 totaled $2,152,050 and are included in interest expense and fees on the Statement of Operations. In connection with the renewal of the Agreement on March 8, 2021, the Trust paid an upfront fee of $435,000, which is being amortized to interest expense over a period of one year through March 7, 2022. The unamortized balance at May 31, 2021 is approximately $335,000 and is included in prepaid upfront fees on notes payable and variable rate term preferred shares on the Statement of Assets and Liabilities. At May 31, 2021, the Trust had borrowings outstanding under the Agreement of $250,000,000 at an interest rate of 0.15%. Based on the short-term nature of the borrowings under the Agreement and the variable interest rate, the carrying amount of the borrowings at May 31, 2021 approximated its fair value. If measured at fair value, borrowings under the Agreement would have been considered as Level 2 in the fair value hierarchy (see Note 11) at May 31, 2021. For the year ended May 31, 2021, the average borrowings under the Agreement and the average interest rate (excluding fees) were $238,243,836 and 0.23%, respectively.
Eaton Vance
Floating-Rate Income Trust
May 31, 2021
Notes to Financial Statements — continued
10 Investments in Affiliated Funds
At May 31, 2021, the value of the Trust’s investment in affiliated funds was $6,274,548, which represents 1.1% of the Trust’s net assets applicable to common shares. Transactions in affiliated funds by the Trust for the year ended May 31, 2021 were as follows:
| | | | | | | | | | | | | | | | | | | | | | | | | | | | | | | | |
| Name of affiliated fund | | Value,
beginning
of period | | | Purchases | | | Sales
proceeds | | | Net
realized
gain (loss) | | | Change in
unrealized
appreciation
(depreciation) | | | Value, end
of period | | | Dividend
income | | | Units, end
of period | |
| | | | | | | | |
Short-Term Investments | | | | | | | | | | | | | | | | | | | | | | | | | | | | | | | | |
| | | | | | | | |
Eaton Vance Cash Reserves Fund, LLC | | $ | 7,095,616 | | | $ | 264,457,279 | | | $ | (265,279,212 | ) | | $ | 155 | | | $ | 710 | | | $ | 6,274,548 | | | $ | 13,767 | | | | 6,274,548 | |
11 Fair Value Measurements
Under generally accepted accounting principles for fair value measurements, a three-tier hierarchy to prioritize the assumptions, referred to as inputs, is used in valuation techniques to measure fair value. The three-tier hierarchy of inputs is summarized in the three broad levels listed below.
| • | | Level 1 – quoted prices in active markets for identical investments |
| • | | Level 2 – other significant observable inputs (including quoted prices for similar investments, interest rates, prepayment speeds, credit risk, etc.) |
| • | | Level 3 – significant unobservable inputs (including a fund’s own assumptions in determining the fair value of investments) |
In cases where the inputs used to measure fair value fall in different levels of the fair value hierarchy, the level disclosed is determined based on the lowest level input that is significant to the fair value measurement in its entirety. The inputs or methodology used for valuing securities are not necessarily an indication of the risk associated with investing in those securities.
At May 31, 2021, the hierarchy of inputs used in valuing the Trust’s investments and open derivative instruments, which are carried at value, were as follows:
| | | | | | | | | | | | | | | | |
| Asset Description | | Level 1 | | | Level 2 | | | Level 3* | | | Total | |
| | | | |
Asset-Backed Securities | | $ | — | | | $ | 34,767,946 | | | $ | — | | | $ | 34,767,946 | |
| | | | |
Closed-End Funds | | | 10,057,715 | | | | — | | | | — | | | | 10,057,715 | |
| | | | |
Common Stocks | | | 1,525,112 | | | | 1,782,937 | | | | 1,818,902 | | | | 5,126,951 | |
| | | | |
Convertible Preferred Stocks | | | — | | | | — | | | | 0 | | | | 0 | |
| | | | |
Corporate Bonds | | | — | | | | 42,765,820 | | | | — | | | | 42,765,820 | |
| | | | |
Senior Floating-Rate Loans (Less Unfunded Loan Commitments) | | | — | | | | 814,509,213 | | | | 1,536,123 | | | | 816,045,336 | |
| | | | |
Warrants | | | — | | | | 112,185 | | | | 0 | | | | 112,185 | |
| | | | |
Miscellaneous | | | — | | | | 5,765 | | | | 0 | | | | 5,765 | |
| | | | |
Short-Term Investments | | | — | | | | 6,274,548 | | | | — | | | | 6,274,548 | |
| | | | |
Total Investments | | $ | 11,582,827 | | | $ | 900,218,414 | | | $ | 3,355,025 | | | $ | 915,156,266 | |
| | | | |
Forward Foreign Currency Exchange Contracts | | $ | — | | | $ | 105,411 | | | $ | — | | | $ | 105,411 | |
| | | | |
Total | | $ | 11,582,827 | | | $ | 900,323,825 | | | $ | 3,355,025 | | | $ | 915,261,677 | |
| | | | |
Liability Description | | | | | | | | | | | | | | | | |
| | | | |
Forward Foreign Currency Exchange Contracts | | $ | — | | | $ | (1,742,319 | ) | | $ | — | | | $ | (1,742,319 | ) |
| | | | |
Total | | $ | — | | | $ | (1,742,319 | ) | | $ | — | | | $ | (1,742,319 | ) |
| * | None of the unobservable inputs for Level 3 assets, individually or collectively, had a material impact on the Trust. |
Eaton Vance
Floating-Rate Income Trust
May 31, 2021
Notes to Financial Statements — continued
Level 3 investments at the beginning and/or end of the period in relation to net assets were not significant and accordingly, a reconciliation of Level 3 assets for the year ended May 31, 2021 is not presented.
12 Risks and Uncertainties
Risks Associated with Foreign Investments
Foreign investments can be adversely affected by political, economic and market developments abroad, including the imposition of economic and other sanctions by the United States or another country. There may be less publicly available information about foreign issuers because they may not be subject to reporting practices, requirements or regulations comparable to those to which United States companies are subject. Foreign markets may be smaller, less liquid and more volatile than the major markets in the United States. Trading in foreign markets typically involves higher expense than trading in the United States. The Trust may have difficulties enforcing its legal or contractual rights in a foreign country. Securities that trade or are denominated in currencies other than the U.S. dollar may be adversely affected by fluctuations in currency exchange rates.
Credit Risk
The Trust invests primarily in below investment grade floating-rate loans, which are considered speculative because of the credit risk of their issuers. Changes in economic conditions or other circumstances are more likely to reduce the capacity of issuers of these securities to make principal and interest payments. Such companies are more likely to default on their payments of interest and principal owed than issuers of investment grade bonds. An economic downturn generally leads to a higher non-payment rate, and a loan or other debt obligation may lose significant value before a default occurs. Lower rated investments also may be subject to greater price volatility than higher rated investments. Moreover, the specific collateral used to secure a loan may decline in value or become illiquid, which would adversely affect the loan’s value.
LIBOR Transition Risk
Certain instruments held by the Trust may pay an interest rate based on the London Interbank Offered Rate (“LIBOR”), which is the average offered rate for various maturities of short-term loans between certain major international banks. LIBOR is used throughout global banking and financial industries to determine interest rates for a variety of financial instruments (such as debt instruments and derivatives) and borrowing arrangements. The ICE Benchmark Administration Limited, the administrator of LIBOR, is expected to cease publishing certain LIBOR settings on December 31, 2021, and the remaining LIBOR settings on June 30, 2023. Although the transition process away from LIBOR is expected to be defined in advance of the anticipated discontinuation, there remains uncertainty regarding the future utilization of LIBOR and the nature of any replacement rate or rates. The phase-out of LIBOR may result in, among other things, increased volatility or illiquidity in markets for instruments based on LIBOR and changes in the value of such instruments.
Pandemic Risk
An outbreak of respiratory disease caused by a novel coronavirus was first detected in China in late 2019 and subsequently spread internationally. This coronavirus has resulted in closing borders, enhanced health screenings, changes to healthcare service preparation and delivery, quarantines, cancellations, disruptions to supply chains and customer activity, as well as general concern and uncertainty. Health crises caused by outbreaks, such as the coronavirus outbreak, may exacerbate other pre-existing political, social and economic risks and disrupt normal market conditions and operations. The impact of this outbreak has negatively affected the worldwide economy, the economies of individual countries, individual companies, and the market in general, and may continue to do so in significant and unforeseen ways, as may other epidemics and pandemics that may arise in the future. Any such impact could adversely affect the Trust’s performance, or the performance of the securities in which the Trust invests.
13 Subsequent Events
On June 29, 2021, the Trust announced the commencement of its Initial Cash Tender Offer of up to 50% or 19,931,845 of the Trust’s outstanding common shares. The Initial Cash Tender Offer will expire at 5:00 P.M. Eastern Time on July 30, 2021 or on such later date to which it is extended. The pricing date will also be July 30, 2021, unless extended. If the number of shares tendered exceeds the maximum amount of the Initial Cash Tender Offer, the Trust will purchase shares from tendering shareholders on a pro-rata basis (disregarding fractional shares). Accordingly, there is no assurance that the Trust will purchase all of a shareholder’s tendered common shares in connection with the Initial Cash Tender Offer.
Beginning in June 2021, the Trust increased its regular monthly distribution on common shares as conditioned on shareholder approval of the New Agreement.
Eaton Vance
Floating-Rate Income Trust
May 31, 2021
Report of Independent Registered Public Accounting Firm
To the Trustees and Shareholders of Eaton Vance Floating-Rate Income Trust:
Opinion on the Financial Statements and Financial Highlights
We have audited the accompanying statement of assets and liabilities of Eaton Vance Floating-Rate Income Trust (the “Trust”), including the portfolio of investments, as of May 31, 2021, the related statements of operations and cash flows for the year then ended, the statements of changes in net assets for each of the two years in the period then ended, the financial highlights for each of the five years in the period then ended, and the related notes. In our opinion, the financial statements and financial highlights present fairly, in all material respects, the financial position of the Trust as of May 31, 2021, and the results of its operations and its cash flows for the year then ended, the changes in its net assets for each of the two years in the period then ended, and the financial highlights for each of the five years in the period then ended, in conformity with accounting principles generally accepted in the United States of America.
Basis for Opinion
These financial statements and financial highlights are the responsibility of the Trust’s management. Our responsibility is to express an opinion on the Trust’s financial statements and financial highlights based on our audits. We are a public accounting firm registered with the Public Company Accounting Oversight Board (United States) (PCAOB) and are required to be independent with respect to the Trust in accordance with the U.S. federal securities laws and the applicable rules and regulations of the Securities and Exchange Commission and the PCAOB.
We conducted our audits in accordance with the standards of the PCAOB. Those standards require that we plan and perform the audit to obtain reasonable assurance about whether the financial statements and financial highlights are free of material misstatement, whether due to error or fraud. The Trust is not required to have, nor were we engaged to perform, an audit of its internal control over financial reporting. As part of our audits we are required to obtain an understanding of internal control over financial reporting but not for the purpose of expressing an opinion on the effectiveness of the Trust’s internal control over financial reporting. Accordingly, we express no such opinion.
Our audits included performing procedures to assess the risks of material misstatement of the financial statements and financial highlights, whether due to error or fraud, and performing procedures that respond to those risks. Such procedures included examining, on a test basis, evidence regarding the amounts and disclosures in the financial statements and financial highlights. Our audits also included evaluating the accounting principles used and significant estimates made by management, as well as evaluating the overall presentation of the financial statements and financial highlights. Our procedures included confirmation of securities and senior loans owned as of May 31, 2021, by correspondence with the custodian, brokers and selling or agent banks; when replies were not received from brokers and selling or agent banks, we performed other auditing procedures. We believe that our audits provide a reasonable basis for our opinion.
/s/ Deloitte & Touche LLP
Boston, Massachusetts
July 20, 2021
We have served as the auditor of one or more Eaton Vance investment companies since 1959.
Eaton Vance
Floating-Rate Income Trust
May 31, 2021
Federal Tax Information (Unaudited)
The Form 1099-DIV you receive in February 2022 will show the tax status of all distributions paid to your account in calendar year 2021. Shareholders are advised to consult their own tax adviser with respect to the tax consequences of their investment in the Trust. As required by the Internal Revenue Code and/or regulations, shareholders must be notified regarding the status of qualified dividend income for individuals and 163(j) interest dividends.
Qualified Dividend Income. For the fiscal year ended May 31, 2021, the Trust designates approximately $393,167, or up to the maximum amount of such dividends allowable pursuant to the Internal Revenue Code, as qualified dividend income eligible for the reduced tax rate of 15%.
163(j) Interest Dividends. For the fiscal year ended May 31, 2021, the Trust designates 97.21% of distributions from net investment income as a 163(j) interest dividend.
Eaton Vance
Floating-Rate Income Trust
May 31, 2021
Joint Special Meeting of Shareholders (Unaudited)
The Fund held a Joint Special Meeting of Shareholders (the “Special Meeting”) with certain other Eaton Vance closed-end funds on January 12, 2021. In order to solicit additional votes to achieve a required quorum, the Special Meeting was adjourned several times, with the vote being taken on April 16, 2021 for the following purpose: approval of a new investment advisory agreement with EVM (“Proposal 1”). The shareholder meeting results are as follows:
| | | | | | | | | | | | | | | | |
| | | Number of Shares(1) | |
| | | For | | | Against | | | Abstain(2) | | | Broker
Non-Votes(2) | |
| | | | |
Proposal 1 | | | 16,912,429 | | | | 2,159,719 | | | | 413,602 | | | | 0 | |
| (1) | Fractional shares were voted proportionately. |
| (2) | All shares that were voted and votes to abstain were counted towards establishing a quorum, as were broker non-votes. (Broker non-votes are shares for which a broker returns a proxy but for which (i) the beneficial owner has not voted and (ii) the broker holding the shares does not have discretionary authority to vote on the particular matter.) Abstentions and broker non-votes had the effect of a negative vote on the Proposal. Broker non-votes were not expected with respect to the Proposal because brokers are required to receive instructions from the beneficial owners or persons entitled to vote in order to submit proxies. |
Eaton Vance
Floating-Rate Income Trust
May 31, 2021
Annual Meeting of Shareholders (Unaudited)
The Trust held its Annual Meeting of Shareholders on April 16, 2021. The following actions were taken by the shareholders.
Proposal 1a: The election of William H. Park, Keith Quinton and Susan J. Sutherland as Class II Trustees of the Trust, each for a three-year term ending in 2024.
The following votes were cast by the Trust’s common and VRTP shareholders, voting together as a single class:
| | | | | | | | |
| | | Number of Shares | |
| Nominees for Trustee | | For | | | Withheld | |
| | |
William H. Park | | | 20,477,549 | | | | 11,257,568 | |
| | |
Keith Quinton | | | 20,983,490 | | | | 10,751,627 | |
| | |
Susan J. Sutherland | | | 20,870,643 | | | | 10,864,474 | |
Proposal 1b: The election of George J. Gorman as a Class II Trustee of the Trust, for a three-year term ending in 2024.
The following votes were cast by the Trust’s VRTP shareholders, voting separately as a single class:
| | | | | | | | |
| Nominee for Trustee | | Number of Shares | |
| | For | | | Withheld | |
| | |
George J. Gorman | | | 01 | | | | 800 | |
| 1 | Pursuant to the Trust’s Declaration of Trust and Amended and Restated By-Laws, Mr. Gorman will continue to serve on the Board of Trustees for a three-year term ending in 2024 and until a successor has been elected and qualified. |
Eaton Vance
Floating-Rate Income Trust
May 31, 2021
Dividend Reinvestment Plan
The Trust offers a dividend reinvestment plan (Plan) pursuant to which shareholders may elect to have distributions automatically reinvested in common shares (Shares) of the Trust. You may elect to participate in the Plan by completing the Dividend Reinvestment Plan Application Form. If you do not participate, you will receive all distributions in cash paid by check mailed directly to you by American Stock Transfer & Trust Company, LLC (AST) as dividend paying agent. On the distribution payment date, if the NAV per Share is equal to or less than the market price per Share plus estimated brokerage commissions, then new Shares will be issued. The number of Shares shall be determined by the greater of the NAV per Share or 95% of the market price. Otherwise, Shares generally will be purchased on the open market by AST, the Plan agent (Agent). Distributions subject to income tax (if any) are taxable whether or not Shares are reinvested.
If your Shares are in the name of a brokerage firm, bank, or other nominee, you can ask the firm or nominee to participate in the Plan on your behalf. If the nominee does not offer the Plan, you will need to request that the Trust’s transfer agent re-register your Shares in your name or you will not be able to participate.
The Agent’s service fee for handling distributions will be paid by the Trust. Plan participants will be charged their pro rata share of brokerage commissions on all open-market purchases.
Plan participants may withdraw from the Plan at any time by writing to the Agent at the address noted on the following page. If you withdraw, you will receive Shares in your name for all Shares credited to your account under the Plan. If a participant elects by written notice to the Agent to sell part or all of his or her Shares and remit the proceeds, the Agent is authorized to deduct a $5.00 fee plus brokerage commissions from the proceeds.
If you wish to participate in the Plan and your Shares are held in your own name, you may complete the form on the following page and deliver it to the Agent. Any inquiries regarding the Plan can be directed to the Agent at 1-866-439-6787.
Eaton Vance
Floating-Rate Income Trust
May 31, 2021
Application for Participation in Dividend Reinvestment Plan
This form is for shareholders who hold their common shares in their own names. If your common shares are held in the name of a brokerage firm, bank, or other nominee, you should contact your nominee to see if it will participate in the Plan on your behalf. If you wish to participate in the Plan, but your brokerage firm, bank, or nominee is unable to participate on your behalf, you should request that your common shares be re-registered in your own name which will enable your participation in the Plan.
The following authorization and appointment is given with the understanding that I may terminate it at any time by terminating my participation in the Plan as provided in the terms and conditions of the Plan.
Please print exact name on account
Shareholder signature Date
Shareholder signature Date
Please sign exactly as your common shares are registered. All persons whose names appear on the share certificate must sign.
YOU SHOULD NOT RETURN THIS FORM IF YOU WISH TO RECEIVE YOUR DISTRIBUTIONS IN CASH. THIS IS NOT A PROXY.
This authorization form, when signed, should be mailed to the following address:
Eaton Vance Floating-Rate Income Trust
c/o American Stock Transfer & Trust Company, LLC
P.O. Box 922
Wall Street Station
New York, NY 10269-0560
Eaton Vance
Floating-Rate Income Trust
May 31, 2021
Management and Organization
Fund Management. The Trustees of Eaton Vance Floating-Rate Income Trust (the Trust) are responsible for the overall management and supervision of the Trust’s affairs. The Trustees and officers of the Trust are listed below. Except as indicated, each individual has held the office shown or other offices in the same company for the last five years. The “Noninterested Trustees” consist of those Trustees who are not “interested persons” of the Trust, as that term is defined under the 1940 Act. The business address of each Trustee and officer is Two International Place, Boston, Massachusetts 02110. As used below, “EVC” refers to Eaton Vance Corp., “EV” refers to EV LLC, “EVM” refers to Eaton Vance Management, “BMR” refers to Boston Management and Research and “EVD” refers to Eaton Vance Distributors, Inc. EV is the trustee of each of EVM and BMR. Effective March 1, 2021, each of EVM, BMR, EVD and EV are indirect, wholly-owned subsidiaries of Morgan Stanley. Each officer affiliated with EVM may hold a position with other EVM affiliates that is comparable to his or her position with EVM listed below. Each Trustee oversees 139 portfolios (with the exception of Messrs. Faust and Wennerholm and Ms. Frost who oversee 138 portfolios) in the Eaton Vance Complex (including all master and feeder funds in a master feeder structure). Each officer serves as an officer of certain other Eaton Vance funds.
| | | | | | |
| Name and Year of Birth | | Position(s) with the
Trust | | Term Expiring. Trustee Since(1) | | Principal Occupation(s) and Other Directorships During Past Five Years and Other Relevant Experience |
|
| Interested Trustee |
| | | |
Thomas E. Faust Jr. 1958 | | Class I
Trustee | | Until 2023.
Trustee since 2007. | | Chairman of Morgan Stanley Investment Management, Inc. (MSIM), member of the Board of Managers and President of EV, Chief Executive Officer of EVM and BMR, and Director of EVD. Formerly, Chairman, Chief Executive Officer and President of EVC. Trustee and/or officer of 138 registered investment companies. Mr. Faust is an interested person because of his positions with MSIM, BMR, EVM, EVD, and EV, which are affiliates of the Trust, and his former position with EVC, which was an affiliate of the Trust prior to March 1, 2021. Directorships in the Last Five Years. Formerly, Director of EVC (2007-2021) and Hexavest Inc. (2012-2021) (investment management firm (2012-2021). |
| |
| Noninterested Trustees | | |
| | | |
Mark R. Fetting 1954 | | Class III
Trustee | | Until 2022.
Trustee since 2016. | | Private investor. Formerly held various positions at Legg Mason, Inc. (investment management firm) (2000-2012), including President, Chief Executive Officer, Director and Chairman (2008-2012), Senior Executive Vice President (2004-2008) and Executive Vice President (2001-2004). Formerly, President of Legg Mason family of funds (2001-2008). Formerly, Division President and Senior Officer of Prudential Financial Group, Inc. and related companies (investment management firm) (1991-2000). Other Directorships in the Last Five Years. None. |
| | | |
Cynthia E. Frost 1961 | | Class I
Trustee | | Until 2023.
Trustee since 2014. | | Private investor. Formerly, Chief Investment Officer of Brown University (university endowment) (2000-2012). Formerly, Portfolio Strategist for Duke Management Company (university endowment manager) (1995-2000). Formerly, Managing Director, Cambridge Associates (investment consulting company) (1989-1995). Formerly, Consultant, Bain and Company (management consulting firm) (1987-1989). Formerly, Senior Equity Analyst, BA Investment Management Company (1983-1985). Other Directorships in the Last Five Years. None. |
| | | |
George J. Gorman 1952 | | Chairperson of the Board and Class II Trustee | | Until 2024.
Chairperson of the Board since 2021 and Trustee since 2014. | | Principal at George J. Gorman LLC (consulting firm). Formerly, Senior Partner at Ernst & Young LLP (a registered public accounting firm) (1974-2009). Other Directorships in the Last Five Years. None. |
| | | |
Valerie A. Mosley 1960 | | Class III Trustee | | Until 2022.
Trustee since 2014. | | Chairwoman and Chief Executive Officer of Valmo Ventures (a consulting and investment firm). Founder of Upward Wealth, Inc., dba BrightUP, a fintech platform. Formerly, Partner and Senior Vice President, Portfolio Manager and Investment Strategist at Wellington Management Company, LLP (investment management firm) (1992-2012). Formerly, Chief Investment Officer, PG Corbin Asset Management (1990-1992). Formerly worked in institutional corporate bond sales at Kidder Peabody (1986-1990). Other Directorships in the Last Five Years. Director of DraftKings, Inc. (digital sports entertainment and gaming company) (since September 2020). Director of Groupon, Inc. (e-commerce provider) (since April 2020). Director of Envestnet, Inc. (provider of intelligent systems for wealth management and financial wellness) (since 2018). Formerly, Director of Dynex Capital, Inc. (mortgage REIT) (2013-2020). |
Eaton Vance
Floating-Rate Income Trust
May 31, 2021
Management and Organization — continued
| | | | | | |
| Name and Year of Birth | | Position(s) with the
Trust | | Term Expiring. Trustee Since(1) | | Principal Occupation(s) and Other Directorships During Past Five Years and Other Relevant Experience |
| |
| Noninterested Trustees (continued) | | |
| | | |
William H. Park 1947 | | Class II
Trustee | | Until 2024.
Trustee since 2003. | | Private investor. Formerly, Consultant (management and transactional) (2012-2014). Formerly, Chief Financial Officer, Aveon Group L.P. (investment management firm) (2010-2011). Formerly, Vice Chairman, Commercial Industrial Finance Corp. (specialty finance company) (2006-2010). Formerly, President and Chief Executive Officer, Prizm Capital Management, LLC (investment management firm) (2002-2005). Formerly, Executive Vice President and Chief Financial Officer, United Asset Management Corporation (investment management firm) (1982-2001). Formerly, Senior Manager, Price Waterhouse (now PricewaterhouseCoopers) (a registered public accounting firm) (1972-1981). Other Directorships in the Last Five Years. None. |
| | | |
Helen Frame Peters 1948 | | Class III
Trustee | | Until 2022.
Trustee since 2008. | | Professor of Finance, Carroll School of Management, Boston College. Formerly, Dean, Carroll School of Management, Boston College (2000-2002). Formerly, Chief Investment Officer, Fixed Income, Scudder Kemper Investments (investment management firm) (1998-1999). Formerly, Chief Investment Officer, Equity and Fixed Income, Colonial Management Associates (investment management firm) (1991-1998). Other Directorships in the Last Five Years. None. |
| | | |
Keith Quinton 1958 | | Class II
Trustee | | Until 2024.
Trustee since 2018. | | Private investor, researcher and lecturer. Formerly, Independent Investment Committee Member at New Hampshire Retirement System (2017-2021). Formerly, Portfolio Manager and Senior Quantitative Analyst at Fidelity Investments (investment management firm) (2001-2014). Other Directorships in the Last Five Years. Formerly, Director (2016-2021) and Chairman (2019-2021) of New Hampshire Municipal Bond Bank. |
| | | |
Marcus L. Smith 1966 | | Class III
Trustee | | Until 2022. Trustee since 2018. | | Private investor. Member of Posse Boston Advisory Board (foundation) (since 2015). Formerly, Portfolio Manager at MFS Investment Management (investment management firm) (1994-2017). Other Directorships in the Last Five Years. Director of First Industrial Realty Trust, Inc. (an industrial REIT) (since 2021). Director of MSCI Inc. (global provider of investment decision support tools) (since 2017). Formerly, Director of DCT Industrial Trust Inc. (logistics real estate company) (2017-2018). |
| | | |
Susan J. Sutherland 1957 | | Class II
Trustee | | Until 2024.
Trustee since 2015. | | Private investor. Director of Ascot Group Limited and certain of its subsidiaries (insurance and reinsurance) (since 2017). Formerly, Director of Hagerty Holding Corp. (insurance) (2015-2018) and Montpelier Re Holdings Ltd. (insurance and reinsurance) (2013-2015). Formerly, Associate, Counsel and Partner at Skadden, Arps, Slate, Meagher & Flom LLP (law firm) (1982-2013). Other Directorships in the Last Five Years. Director of Kairos Acquisition Corp. (insurance/InsurTech acquisition company) (since 2021). |
| | | |
Scott E. Wennerholm 1959 | | Class I
Trustee | | Until 2023.
Trustee since 2016. | | Private investor. Formerly, Trustee at Wheelock College (postsecondary institution) (2012-2018). Formerly, Consultant at GF Parish Group (executive recruiting firm) (2016-2017). Formerly, Chief Operating Officer and Executive Vice President at BNY Mellon Asset Management (investment management firm) (2005-2011). Formerly, Chief Operating Officer and Chief Financial Officer at Natixis Global Asset Management (investment management firm) (1997-2004). Formerly, Vice President at Fidelity Investments Institutional Services (investment management firm) (1994-1997). Other Directorships in the Last Five Years. None. |
| | | | | | |
| | | |
| Name and Year of Birth | | Position(s)
with the
Trust | | Officer
Since(2) | | Principal Occupation(s) During Past Five Years |
|
| Principal Officers who are not Trustees |
| | | |
Eric A. Stein 1980 | | President | | 2020 | | Vice President and Chief Investment Officer, Fixed Income of EVM and BMR. Prior to November 1, 2020, Mr. Stein was a co-Director of Eaton Vance’s Global Income Investments. Also Vice President of Calvert Research and Management (“CRM”). |
Eaton Vance
Floating-Rate Income Trust
May 31, 2021
Management and Organization — continued
| | | | | | |
| | | |
| Name and Year of Birth | | Position(s)
with the
Trust | | Officer
Since(2) | | Principal Occupation(s) During Past Five Years |
|
| Principal Officers who are not Trustees (continued) |
| | | |
Deidre E. Walsh 1971 | | Vice President and Chief Legal Officer | | 2009 | | Vice President of EVM and BMR. Also Vice President of CRM. |
| | | |
Kimberly M. Roessiger 1985 | | Secretary | | 2021 | | Vice President of EVM and BMR. |
| | | |
James F. Kirchner 1967 | | Treasurer | | 2007 | | Vice President of EVM and BMR. Also Vice President of CRM. |
| | | |
Richard F. Froio 1968 | | Chief Compliance Officer | | 2017 | | Vice President of EVM and BMR since 2017. Formerly, Deputy Chief Compliance Officer (Adviser/Funds) and Chief Compliance Officer (Distribution) at PIMCO (2012-2017) and Managing Director at BlackRock/Barclays Global Investors (2009-2012). |
| (1) | Year first appointed to serve as Trustee for a fund in the Eaton Vance family of funds. Each Trustee has served continuously since appointment unless indicated otherwise. |
| (2) | Year first elected to serve as officer of a fund in the Eaton Vance family of funds when the officer has served continuously. Otherwise, year of most recent election as an officer of a fund in the Eaton Vance family of funds. Titles may have changed since initial election. Each officer serves until his or her successor is elected. |
Eaton Vance Funds
| | |
| Privacy Notice | | April 2021 |
| | |
| |
| FACTS | | WHAT DOES EATON VANCE DO WITH YOUR
PERSONAL INFORMATION? |
| | | |
| |
| | |
| Why? | | Financial companies choose how they share your personal information. Federal law gives consumers the right to limit some but not all sharing. Federal law also requires us to tell you how we collect, share, and protect your personal information. Please read this notice carefully to understand what we do. |
| | |
| | | |
| What? | | The types of personal information we collect and share depend on the product or service you have with us. This information can include: ∎ Social Security number and income ∎ investment experience and risk tolerance ∎ checking account number and wire transfer instructions |
| | |
| | | |
| How? | | All financial companies need to share customers’ personal information to run their everyday business. In the section below, we list the reasons financial companies can share their customers’ personal information; the reasons Eaton Vance chooses to share; and whether you can limit this sharing. |
| | |
| | | |
| | | | |
Reasons we can share your
personal information | | Does Eaton Vance share? | | Can you limit this sharing? |
| For our everyday business purposes — such as to process your transactions, maintain your account(s), respond to court orders and legal investigations, or report to credit bureaus | | Yes | | No |
| For our marketing purposes — to offer our products and services to you | | Yes | | No |
| For joint marketing with other financial companies | | No | | We don’t share |
| For our investment management affiliates’ everyday business purposes — information about your transactions, experiences, and creditworthiness | | Yes | | Yes |
| For our affiliates’ everyday business purposes — information about your transactions and experiences | | Yes | | No |
| For our affiliates’ everyday business purposes — information about your creditworthiness | | No | | We don’t share |
| For our investment management affiliates to market to you | | Yes | | Yes |
| For our affiliates to market to you | | No | | We don’t share |
| For nonaffiliates to market to you | | No | | We don’t share |
| | |
| To limit our sharing | | Call toll-free 1-800-262-1122 or email: EVPrivacy@eatonvance.com Please note: If you are a new customer, we can begin sharing your information 30 days from the date we sent this notice. When you are no longer our customer, we continue to share your information as described in this notice. However, you can contact us at any time to limit our sharing. |
| | |
| | | |
| | |
| Questions? | | Call toll-free 1-800-262-1122 or email: EVPrivacy@eatonvance.com |
| | |
| | | |
Eaton Vance Funds
| | |
| Privacy Notice — continued | | April 2021 |
| | |
| Who we are |
| Who is providing this notice? | | Eaton Vance Management, Eaton Vance Distributors, Inc., Eaton Vance Trust Company, Eaton Vance Management (International) Limited, Eaton Vance Advisers International Ltd., Eaton Vance Global Advisors Limited, Eaton Vance Management’s Real Estate Investment Group, Boston Management and Research, Calvert Research and Management, Eaton Vance and Calvert Fund Families and our investment advisory affiliates (“Eaton Vance”) (see Investment Management Affiliates definition below) |
| What we do |
| How does Eaton Vance protect my personal information? | | To protect your personal information from unauthorized access and use, we use security measures that comply with federal law. These measures include computer safeguards and secured files and buildings. We have policies governing the proper handling of customer information by personnel and requiring third parties that provide support to adhere to appropriate security standards with respect to such information. |
| How does Eaton Vance collect my personal information? | | We collect your personal information, for example, when you ∎ open an account or make deposits or withdrawals from your account ∎ buy securities from us or make a wire transfer ∎ give us your contact information We also collect your personal information from others, such as credit bureaus, affiliates, or other companies. |
| Why can’t I limit all sharing? | | Federal law gives you the right to limit only ∎ sharing for affiliates’ everyday business purposes — information about your creditworthiness ∎ affiliates from using your information to market to you ∎ sharing for nonaffiliates to market to you State laws and individual companies may give you additional rights to limit sharing. See below for more on your rights under state law. |
| Definitions |
| Investment Management Affiliates | | Eaton Vance Investment Management Affiliates include registered investment advisers, registered broker-dealers, and registered and unregistered funds. Investment Management Affiliates does not include entities associated with Morgan Stanley Wealth Management, such as Morgan Stanley Smith Barney LLC and Morgan Stanley & Co. |
| Affiliates | | Companies related by common ownership or control. They can be financial and nonfinancial companies. ∎ Our affiliates include companies with a Morgan Stanley name and financial companies such as Morgan Stanley Smith Barney LLC and Morgan Stanley & Co. |
| Nonaffiliates | | Companies not related by common ownership or control. They can be financial and nonfinancial companies. ∎ Eaton Vance does not share with nonaffiliates so they can market to you. |
| Joint marketing | | A formal agreement between nonaffiliated financial companies that together market financial products or services to you. ∎ Eaton Vance doesn’t jointly market. |
| Other important information |
Vermont: Except as permitted by law, we will not share personal information we collect about Vermont residents with Nonaffiliates unless you provide us with your written consent to share such information. California: Except as permitted by law, we will not share personal information we collect about California residents with Nonaffiliates and we will limit sharing such personal information with our Affiliates to comply with California privacy laws that apply to us. |
Eaton Vance Funds
IMPORTANT NOTICES
Delivery of Shareholder Documents. The Securities and Exchange Commission (SEC) permits funds to deliver only one copy of shareholder documents, including prospectuses, proxy statements and shareholder reports, to fund investors with multiple accounts at the same residential or post office box address. This practice is often called “householding” and it helps eliminate duplicate mailings to shareholders. American Stock Transfer & Trust Company, LLC (“AST”), the closed-end funds transfer agent, or your financial intermediary, may household the mailing of your documents indefinitely unless you instruct AST, or your financial intermediary, otherwise. If you would prefer that your Eaton Vance documents not be householded, please contact AST or your financial intermediary. Your instructions that householding not apply to delivery of your Eaton Vance documents will typically be effective within 30 days of receipt by AST or your financial intermediary.
Portfolio Holdings. Each Eaton Vance Fund and its underlying Portfolio(s) (if applicable) files a schedule of portfolio holdings on Part F to Form N-PORT with the SEC. Certain information filed on Form N-PORT may be viewed on the Eaton Vance website at www.eatonvance.com, by calling Eaton Vance at 1-800-262-1122 or in the EDGAR database on the SEC’s website at www.sec.gov.
Proxy Voting. From time to time, funds are required to vote proxies related to the securities held by the funds. The Eaton Vance Funds or their underlying Portfolios (if applicable) vote proxies according to a set of policies and procedures approved by the Funds’ and Portfolios’ Boards. You may obtain a description of these policies and procedures and information on how the Funds or Portfolios voted proxies relating to portfolio securities during the most recent 12-month period ended June 30, without charge, upon request, by calling 1-800-262-1122 and by accessing the SEC’s website at www.sec.gov.
Share Repurchase Program. The Fund’s Board of Trustees has approved a share repurchase program authorizing the Fund to repurchase up to 10% of its common shares outstanding as of the last day of the prior calendar year in open-market transactions at a discount to net asset value. The repurchase program does not obligate the Fund to purchase a specific amount of shares. The Fund’s repurchase activity, including the number of shares purchased, average price and average discount to net asset value, is disclosed in the Fund’s annual and semi-annual reports to shareholders.
Additional Notice to Shareholders. If applicable, a Fund may also redeem or purchase its outstanding preferred shares in order to maintain compliance with regulatory requirements, borrowing or rating agency requirements or for other purposes as it deems appropriate or necessary.
Closed-End Fund Information. Eaton Vance closed-end funds make fund performance data and certain information about portfolio characteristics available on the Eaton Vance website shortly after the end of each month. Other information about the funds is available on the website. The funds’ net asset value per share is readily accessible on the Eaton Vance website. Portfolio holdings for the most recent month-end are also posted to the website approximately 30 days following the end of the month. This information is available at www.eatonvance.com on the fund information pages under “Individual Investors — Closed-End Funds”.
This Page Intentionally Left Blank
This Page Intentionally Left Blank
Investment Adviser and Administrator
Eaton Vance Management
Two International Place
Boston, MA 02110
Custodian
State Street Bank and Trust Company
State Street Financial Center, One Lincoln Street
Boston, MA 02111
Transfer Agent
American Stock Transfer & Trust Company, LLC
6201 15th Avenue
Brooklyn, NY 11219
Independent Registered Public Accounting Firm
Deloitte & Touche LLP
200 Berkeley Street
Boston, MA 02116-5022
Fund Offices
Two International Place
Boston, MA 02110

2224 5.31.21
The registrant (sometimes referred to as the “Fund”) has adopted a code of ethics applicable to its Principal Executive Officer, Principal Financial Officer and Principal Accounting Officer. The registrant undertakes to provide a copy of such code of ethics to any person upon request, without charge, by calling 1-800-262-1122. The registrant has not amended the code of ethics as described in Form N-CSR during the period covered by this report. The registrant has not granted any waiver, including an implicit waiver, from a provision of the code of ethics as described in Form N-CSR during the period covered by this report.
| Item 3. | Audit Committee Financial Expert |
The registrant’s Board of Trustees (the “Board”) has designated George J. Gorman and William H. Park, each an independent trustee, as audit committee financial experts. Mr. Gorman is a certified public accountant who is the Principal at George J. Gorman LLC (a consulting firm). Previously, Mr. Gorman served in various capacities at Ernst & Young LLP (a registered public accounting firm), including as Senior Partner. Mr. Gorman also has experience serving as an independent trustee and audit committee financial expert of other
mutual fund complexes. Mr. Park is a certified public accountant who is a private investor. Previously, he served as a consultant, as the Chief Financial Officer of Aveon Group, L.P. (an investment management firm), as the Vice Chairman of Commercial Industrial Finance Corp. (specialty finance company), as President and Chief Executive Officer of Prizm Capital Management, LLC (investment management firm), as Executive Vice President and Chief Financial Officer of United Asset Management Corporation (an institutional investment management firm) and as a Senior Manager at Price Waterhouse (now PricewaterhouseCoopers) (a registered public accounting firm).
| Item 4. | Principal Accountant Fees and Services |
(a) –(d)
The following table presents the aggregate fees billed to the registrant for the registrant’s fiscal years ended May 31, 2020 and May 31, 2021 by the registrant’s principal accountant, Deloitte & Touche LLP (“D&T”), for professional services rendered for the audit of the registrant’s annual financial statements and fees billed for other services rendered by D&T during such periods
Eaton Vance Floating-Rate Trust Income
| | | | | | | | |
Fiscal Years Ended | | 5/31/20 | | | 5/31/21 | |
Audit Fees | | $ | 109,525 | | | $ | 105,875 | |
Audit-Related Fees(1) | | $ | 18,000 | | | $ | 0 | |
Tax Fees(2) | | $ | 19,914 | | | $ | 18,904 | |
All Other Fees(3) | | $ | 0 | | | $ | 0 | |
| | | | | | | | |
Total | | $ | 147,439 | | | $ | 124,779 | |
| | | | | | | | |
| (1) | Audit-related fees consist of the aggregate fees billed for assurance and related services that are reasonably related to the performance of the audit of financial statements and are not reported under the category of audit fees and specifically include fees for the performance of certain agreed-upon procedures relating to the registrant’s Revolving Credit and Security Agreement. |
| (2) | Tax fees consist of the aggregate fees billed for professional services rendered by the principal accountant relating to tax compliance, tax advice, and tax planning and specifically include fees for tax return preparation and other related tax compliance/planning matters. |
| (3) | All other fees consist of the aggregate fees billed for products and services provided by the principal accountant other than audit, audit-related, and tax services. |
(e)(1) The registrant’s audit committee has adopted policies and procedures relating to the pre-approval of services provided by the registrant’s principal accountant (the “Pre-Approval Policies”). The Pre-Approval Policies establish a framework intended to assist the audit committee in the proper discharge of its pre-approval responsibilities. As a general matter, the Pre-Approval Policies (i) specify certain types of audit, audit-related, tax, and other services determined to be pre-approved by the audit committee; and (ii) delineate specific procedures governing the mechanics of the pre-approval process, including the approval and monitoring of audit and non-audit service fees. Unless a service is specifically pre-approved under the Pre-Approval Policies, it must be separately pre-approved by the audit committee.
The Pre-Approval Policies and the types of audit and non-audit services pre-approved therein must be reviewed and ratified by the registrant’s audit committee at least annually. The registrant’s audit committee maintains full responsibility for the appointment, compensation, and oversight of the work of the registrant’s principal accountant.
(e)(2) No services described in paragraphs (b)-(d) above were approved by the registrant’s audit committee pursuant to the “de minimis exception” set forth in Rule 2-01(c)(7)(i)(C) of Regulation S-X.
(f) Not applicable.
(g) The following table presents (i) the aggregate non-audit fees (i.e., fees for audit-related, tax, and other services) billed to the registrant by D&T for the registrant’s fiscal years ended May 31, 2020 and May 31, 2021; and (ii) the aggregate non-audit fees (i.e., fees for audit-related, tax, and other services) billed to the Eaton Vance organization by D&T for the same time periods.
| | | | | | | | |
Fiscal Years Ended | | 5/31/20 | | | 5/31/21 | |
Registrant | | $ | 37,914 | | | $ | 18,904 | |
Eaton Vance(1) | | $ | 51,903 | | | $ | 150,300 | |
| (1) | The investment adviser to the registrant, as well as any of its affiliates that provide ongoing services to the registrant, are subsidiaries of Morgan Stanley. |
(h) The registrant’s audit committee has considered whether the provision by the registrant’s principal accountant of non-audit services to the registrant’s investment adviser and any entity controlling, controlled by, or under common control with the adviser that provides ongoing services to the registrant that were not pre-approved pursuant to Rule 2-01(c)(7)(ii) of Regulation S-X is compatible with maintaining the principal accountant’s independence.
| Item 5. | Audit Committee of Listed Registrants |
The registrant has a separately-designated standing audit committee established in accordance with Section 3(a)(58)(A) of the Securities and Exchange Act of 1934, as amended. George J. Gorman (Chair), William H. Park, Helen Frame Peters and Scott E. Wennerholm are the members of the registrant’s audit committee.
| Item 6. | Schedule of Investments |
Please see schedule of investments contained in the Report to Stockholders included under Item 1 of this Form N-CSR.
| Item 7. | Disclosure of Proxy Voting Policies and Procedures for Closed-End Management Investment Companies |
The Board of the Fund has adopted a proxy voting policy and procedure (the “Fund Policy”), pursuant to which the trustees have delegated proxy voting responsibility to the Fund’s investment adviser and adopted the investment adviser’s proxy voting policies and procedures (the “Policies”) which are described below. The trustees will review the Policies annually. In the event that a conflict of interest arises between the Fund’s shareholders and the investment adviser, the administrator, or any of their affiliates or any affiliate of the Fund, the investment adviser will generally refrain from voting the proxies related to the companies giving rise to such conflict until it consults with the Board, or any committee, sub-committee or group of independent trustees identified by the Board, which will instruct the investment adviser on the appropriate course of action. If the Board Members are unable to meet and the failure to vote a proxy would have a material adverse impact on the Fund, the investment adviser may vote such proxy, provided that it discloses the existence of the material conflict to the Chairperson of the Fund’s Board as soon as practicable and to the Board at its next meeting.
The Policies are designed to promote accountability of a company’s management to its shareholders and to align the interests of management with those shareholders. An independent proxy voting service (“Agent”), currently Institutional Shareholder Services, Inc., has been retained to assist in the voting of proxies through the
provision of vote analysis, implementation and recordkeeping and disclosure services. The investment adviser will generally vote proxies through the Agent. The Agent is required to vote all proxies in accordance with customized proxy voting guidelines (the “Guidelines”) and/or refer them back to the investment adviser pursuant to the Policies.
The Agent is required to establish and maintain adequate internal controls and policies in connection with the provision of proxy voting services, including methods to reasonably ensure that its analysis and recommendations are not influenced by a conflict of interest. The Guidelines include voting guidelines for matters relating to, among other things, the election of directors, approval of independent auditors, executive compensation, corporate structure and anti-takeover defenses. The investment adviser may cause the Fund to abstain from voting from time to time where it determines that the costs associated with voting a proxy outweigh the benefits derived from exercising the right to vote or it is unable to access or access timely ballots or other proxy information, among other stated reasons. The Agent will refer Fund proxies to the investment adviser for instructions under circumstances where, among others: (1) the application of the Guidelines is unclear; (2) a particular proxy question is not covered by the Guidelines; or (3) the Guidelines require input from the investment adviser. When a proxy voting issue has been referred to the investment adviser, the analyst (or portfolio manager if applicable) covering the company subject to the proxy proposal determines the final vote (or decision not to vote) and the investment adviser’s Proxy Administrator (described below) instructs the Agent to vote accordingly for securities held by the Fund. Where more than one analyst covers a particular company and the recommendations of such analysts voting a proposal conflict, the investment adviser’s Global Proxy Group (described below) will review such recommendations and any other available information related to the proposal and determine the manner in which it should be voted, which may result in different recommendations for the Fund that may differ from other clients of the investment adviser.
The investment adviser has appointed a Proxy Administrator to assist in the coordination of the voting of client proxies (including the Fund’s) in accordance with the Guidelines and the Policies. The investment adviser and its affiliates have also established a Global Proxy Group. The Global Proxy Group develops the investment adviser’s positions on all major corporate issues, creates the Guidelines and oversees the proxy voting process. The Proxy Administrator maintains a record of all proxy questions that have been referred by the Agent, all applicable recommendations, analysis and research received and any resolution of the matter. Before instructing the Agent to vote contrary to the Guidelines or the recommendation of the Agent, the Proxy Administrator will provide the Global Proxy Group with the Agent’s recommendation for the proposal along with any other relevant materials, including the basis for the analyst’s recommendation. The Proxy Administrator will then instruct the Agent to vote the proxy in the manner determined by the Global Proxy Group. A similar process will be followed if the Agent has a conflict of interest with respect to a proxy. The investment adviser will report to the Fund’s Board any votes cast contrary to the Guidelines or Agent recommendations, as applicable, no less than annually.
The investment adviser’s Global Proxy Group is responsible for monitoring and resolving possible material conflicts with respect to proxy voting. Because the Guidelines are predetermined and designed to be in the best interests of shareholders, application of the Guidelines to vote client proxies should, in most cases, adequately address any possible conflict of interest. The investment adviser will monitor situations that may result in a conflict of interest between any of its clients and the investment adviser or any of its affiliates by maintaining a list of significant existing and prospective corporate clients. The Proxy Administrator will compare such list with the names of companies of which he or she has been referred a proxy statement (the “Proxy Companies”). If a company on the list is also a Proxy Company, the Proxy Administrator will report that fact to the Global Proxy Group. If the Proxy Administrator intends to instruct the Agent to vote in a manner inconsistent with the Guidelines, the Global Proxy Group will first determine, in consultation with legal counsel if necessary, whether a material conflict exists. If it is determined that a material conflict exists, the investment adviser will seek instruction on how the proxy should be voted from the Fund’s Board, or any committee or subcommittee identified by the Board. If a matter is referred to the Global Proxy Group, the decision made and basis for the decision will be documented by the Proxy Administrator and/or Global Proxy Group.
Information on how the Fund voted proxies relating to portfolio securities during the most recent 12 month period ended June 30 is available (1) without charge, upon request, by calling 1-800-262-1122, and (2) on the Securities and Exchange Commission’s website at http://www.sec.gov.
| Item 8. | Portfolio Managers of Closed-End Management Investment Companies |
Eaton Vance Management (“EVM” or “Eaton Vance”) is the investment adviser of the Fund. Ralph H. Hinckley, Jr., William E. Holt, Catherine C. McDermott, Daniel P. McElaney and Andrew N. Sveen comprise the investment team responsible for the overall and day-to-day management of the Fund’s investments.
Mr. Hinckley is a Vice President of EVM and has been a portfolio manager of the Fund since January 2008. Messrs. Holt, McElaney and Sveen and Ms. McDermott are Vice Presidents of EVM and have been portfolio managers of the Fund since March 2019. Messrs. Hinckley and Sveen and Ms. McDermott have managed other Eaton Vance portfolios for more than five years. This information is provided as of the date of filing this report.
The following table shows, as of the Fund’s most recent fiscal year end, the number of accounts each portfolio manager managed in each of the listed categories and the total assets (in millions of dollars) in the accounts managed within each category. The table also shows the number of accounts with respect to which the advisory fee is based on the performance of the account, if any, and the total assets (in millions of dollars) in those accounts.
| | | | | | | | | | | | |
| | | Number of All Accounts | | Total Assets of All
Accounts | | | Number of Accounts Paying a Performance Fee | | Total Assets of
Accounts Paying a
Performance Fee | |
Ralph H. Hinckley, Jr. | | | | | | | | | | | | |
Registered Investment Companies | | 1 | | $ | 938.1 | | | 0 | | $ | 0 | |
Other Pooled Investment Vehicles | | 3 | | $ | 5,920.9 | | | 0 | | $ | 0 | |
Other Accounts | | 2 | | $ | 1,110.5 | | | 0 | | $ | 0 | |
| | | | |
William E. Holt | | | | | | | | | | | | |
Registered Investment Companies | | 5 | | $ | 2,713.5 | | | 0 | | $ | 0 | |
Other Pooled Investment Vehicles | | 0 | | $ | 0 | | | 0 | | $ | 0 | |
Other Accounts | | 0 | | $ | 0 | | | 0 | | $ | 0 | |
| | | | |
Catherine C. McDermott | | | | | | | | | | | | |
Registered Investment Companies | | 8 | | $ | 5,723.5 | | | 0 | | $ | 0 | |
Other Pooled Investment Vehicles | | 0 | | $ | 0 | | | 0 | | $ | 0 | |
Other Accounts | | 0 | | $ | 0 | | | 0 | | $ | 0 | |
| | | | |
Daniel P. McElaney | | | | | | | | | | | | |
Registered Investment Companies | | 5 | | $ | 2,713.5 | | | 0 | | $ | 0 | |
Other Pooled Investment Vehicles | | 0 | | $ | 0 | | | 0 | | $ | 0 | |
Other Accounts | | 0 | | $ | 0 | | | 0 | | $ | 0 | |
| | | | |
Andrew N. Sveen | | | | | | | | | | | | |
Registered Investment Companies | | 13 | | $ | 36,558.5 | | | 0 | | $ | 0 | |
Other Pooled Investment Vehicles | | 0 | | $ | 0 | | | 0 | | $ | 0 | |
Other Accounts | | 0 | | $ | 0 | | | 0 | | $ | 0 | |
The following table shows the dollar range of Fund shares beneficially owned by each portfolio manager as of the Fund’s most recent fiscal year end.
| | |
Portfolio Manager | | Dollar Range of Equity Securities
Beneficially Owned in the Fund |
Ralph H. Hinckley, Jr. | | $10,001 – $50,000 |
William E. Holt | | None |
Catherine C. McDermott | | None |
Daniel P. McElaney | | None |
Andrew N. Sveen | | None |
Potential for Conflicts of Interest. It is possible that conflicts of interest may arise in connection with a portfolio manager’s management of the Fund’s investments on the one hand and the investments of other accounts for which a portfolio manager is responsible on the other. For example, a portfolio manager may have conflicts of interest in allocating management time, resources and investment opportunities among the Fund and other accounts he or she advises. In addition, due to differences in the investment strategies or restrictions between the Fund and the other accounts, the portfolio manager may take action with respect to another account that differs from the action taken with respect to the Fund. In some cases, another account managed by a portfolio manager may compensate the investment adviser based on the performance of the securities held by that account. The existence of such a performance based fee may create additional conflicts of interest for the portfolio manager in the allocation of management time, resources and investment opportunities. Whenever conflicts of interest arise, the portfolio manager will endeavor to exercise his or her discretion in a manner that he or she believes is equitable to all interested persons. EVM has adopted several policies and procedures designed to address these potential conflicts including a code of ethics and policies that govern the investment adviser’s trading practices, including among other things the aggregation and allocation of trades among clients, brokerage allocations, cross trades and best execution.
Compensation Structure for EVM
Compensation of EVM’s portfolio managers and other investment professionals has the following primary components: (1) a base salary, (2) an annual cash bonus, and (3) annual non-cash compensation consisting of restricted shares of Morgan Stanley stock that are subject to a fixed vesting and distribution schedule. EVM’s investment professionals also receive certain retirement, insurance and other benefits that are broadly available to EVM’s employees. Compensation of EVM’s investment professionals is reviewed primarily on an annual basis. Cash bonuses, stock-based compensation awards, and adjustments in base salary are typically paid or put into effect at or shortly after the December 31st fiscal year end of Morgan Stanley.
Method to Determine Compensation. EVM compensates its portfolio managers based primarily on the scale and complexity of their portfolio responsibilities and the total return performance of managed funds and accounts versus the benchmark(s) stated in the prospectus, as well as an appropriate peer group (as described below). In addition to rankings within peer groups of funds on the basis of absolute performance, consideration may also be given to relative risk-adjusted performance. Risk-adjusted performance measures include, but are not limited to the Sharpe ratio, which uses standard deviation and excess return to determine reward per unit of risk. Performance is normally based on periods ending on the September 30th preceding fiscal year end. Fund performance is normally evaluated primarily versus peer groups of funds as determined by Lipper Inc. and/or Morningstar, Inc. When a fund’s peer group as determined by Lipper or Morningstar is deemed by EVM’s management not to provide a fair comparison, performance may instead be evaluated primarily against a custom peer group or market index. In evaluating the performance of a fund and its manager, primary emphasis is normally placed on three-year performance, with secondary consideration of performance over longer and shorter periods. For funds that are tax-managed or otherwise have an objective of after-tax returns, performance is measured net of taxes. For other funds, performance is evaluated on a pre-tax basis. For funds with an investment objective other than total return (such as current income), consideration will also be given to the fund’s success in achieving its objective. For managers responsible for multiple funds and accounts, investment
performance is evaluated on an aggregate basis, based on averages or weighted averages among managed funds and accounts. Funds and accounts that have performance-based advisory fees are not accorded disproportionate weightings in measuring aggregate portfolio manager performance.
The compensation of portfolio managers with other job responsibilities (such as heading an investment group or providing analytical support to other portfolios) will include consideration of the scope of such responsibilities and the managers’ performance in meeting them.
EVM seeks to compensate portfolio managers commensurate with their responsibilities and performance, and competitive with other firms within the investment management industry. EVM participates in investment-industry compensation surveys and utilizes survey data as a factor in determining salary, bonus and stock-based compensation levels for portfolio managers and other investment professionals. Salaries, bonuses and stock-based compensation are also influenced by the operating performance of EVM and its parent company. The overall annual cash bonus pool is generally based on a substantially fixed percentage of pre-bonus adjusted operating income. While the salaries of EVM’s portfolio managers are comparatively fixed, cash bonuses and stock-based compensation may fluctuate significantly from year to year, based on changes in manager performance and other factors as described herein. For a high performing portfolio manager, cash bonuses and stock-based compensation may represent a substantial portion of total compensation
| Item 9. | Purchases of Equity Securities by Closed-End Management Investment Company and Affiliated Purchasers |
No such purchases this period.
| Item 10. | Submission of Matters to a Vote of Security Holders |
No material changes.
| Item 11. | Controls and Procedures |
(a) It is the conclusion of the registrant’s principal executive officer and principal financial officer that the effectiveness of the registrant’s current disclosure controls and procedures (such disclosure controls and procedures having been evaluated within 90 days of the date of this filing) provide reasonable assurance that the information required to be disclosed by the registrant has been recorded, processed, summarized and reported within the time period specified in the Commission’s rules and forms and that the information required to be disclosed by the registrant has been accumulated and communicated to the registrant’s principal executive officer and principal financial officer in order to allow timely decisions regarding required disclosure.
(b) There have been no changes in the registrant’s internal controls over financial reporting during the period covered by this report that has materially affected, or is reasonably likely to materially affect, the registrant’s internal control over financial reporting.
| Item 12. | Disclosure of Securities Lending Activities for Closed-End Management Investment Companies |
No activity to report for the registrant’s most recent fiscal year end.
Signatures
Pursuant to the requirements of the Securities Exchange Act of 1934 and the Investment Company Act of 1940, the registrant has duly caused this report to be signed on its behalf by the undersigned, thereunto duly authorized.
Eaton Vance Floating-Rate Income Trust
| | |
| By: | | /s/ Eric A. Stein |
| | Eric A. Stein |
| | President |
| |
| Date: | | July 22, 2021 |
Pursuant to the requirements of the Securities Exchange Act of 1934 and the Investment Company Act of 1940, this report has been signed below by the following persons on behalf of the registrant and in the capacities and on the dates indicated.
| | |
| By: | | /s/ James F. Kirchner |
| | James F. Kirchner |
| | Treasurer |
| |
| Date: | | July 22, 2021 |
| |
| By: | | /s/ Eric A. Stein |
| | Eric A. Stein |
| | President |
| |
| Date: | | July 22, 2021 |