Exhibit 99.2

SUPPLEMENTAL OPERATING AND FINANCIAL DATA
SEPTEMBER 30, 2012
BioMed Realty Trust, Inc.
17190 Bernardo Center Drive San Diego, CA 92128
Corporate Communications Contact
Rick Howe
Senior Director, Corporate Communications richard.howe@biomedrealty.com
www.biomedrealty.com
(858) 485-9840 phone (858) 485-9843 fax
TABLE OF CONTENTS
SEPTEMBER 30, 2012
Page
Third Quarter Highlights 3
Investor Information 4
Equity Research Coverage 5
Financial and Operating Highlights 6
Capitalization Summary 7
Portfolio Summary 8
Consolidated Balance Sheets 9
Consolidated Statements of Operations 10
Balance Sheet / Operations Statement Detail 11
FFO, CFFO and AFFO 12
FFO, CFFO and AFFO per Share 13
Reconciliation of EBITDA and Adjusted EBITDA 14
Reconciliation of Net Operating Income 15
Interest Expense 16
Coverage Ratios 17
Debt Summary 18
Debt Maturities 19
Page
Common and Preferred Stock Data 20
Market Summary 21
Property Listing—Consolidated Portfolio 22-23
Redevelopment, Pre-development and Other
Capital Improvements 24
Property Listing—Unconsolidated Partnerships 25
Lease Expirations 26
Expirations by Market 27
10 Largest Tenants 28
Same Property Analysis 29
Acquisitions / Dispositions 30
Leasing Activity 31
Tenant Improvements, Leasing Commissions,
and Tenant Concessions 32
Non-GAAP Financial Measure Definitions 33
Definitions 34
This Supplemental Operating and Financial Data package contains forward-looking statements within the meaning of the Private Securities Litigation Reform Act of 1995 based on current expectations, forecasts and assumptions that involve risks and uncertainties that could cause actual outcomes and results to differ materially. These risks and uncertainties include, without limitation: general risks affecting the real estate industry (including, without limitation, the inability to enter into or renew leases, dependence on tenants’ financial condition, and competition from other developers, owners and operators of real estate); adverse economic or real estate developments in the life science industry or the company’s target markets; risks associated with the availability and terms of financing, the use of debt to fund acquisitions, developments and other investments, and the ability to refinance indebtedness as it comes due; failure to maintain the company’s investment grade credit ratings with the ratings agencies; failure to manage effectively the company’s growth and expansion into new markets, or to complete or integrate acquisitions and developments successfully; reductions in asset valuations and related impairment charges; risks and uncertainties affecting property development and construction; risks associated with downturns in foreign, domestic and local economies, changes in interest rates and foreign currency exchange rates, and volatility in the securities markets; ownership of properties outside of the United States that subject the company to different and potentially greater risks than those associated with the company’s domestic operations; risks associated with the company’s investments in loans, including borrower defaults and potential principal losses; potential liability for uninsured losses and environmental contamination; risks associated with the company’s potential failure to qualify as a REIT under the Internal Revenue Code of 1986, as amended, and possible adverse changes in tax and environmental laws; and risks associated with the company’s dependence on key personnel whose continued service is not guaranteed. For a further list and description of such risks and uncertainties, see the reports filed by the company with the Securities and Exchange Commission, including the company’s most recent annual report on Form 10-K and quarterly reports on Form 10-Q. The company disclaims any intention or obligation to update or revise any forward-looking statements, whether as a result of new information, future events or otherwise. All amounts shown in this report are unaudited. This Supplemental Operating and Financial Data package is not an offer to sell or solicitation to buy securities of BioMed Realty Trust, Inc. Any offers to sell or solicitations to buy securities of BioMed Realty Trust, Inc. shall be made only by means of a prospectus approved for that purpose.
THIRD QUARTER HIGHLIGHTS
SEPTEMBER 30, 2012
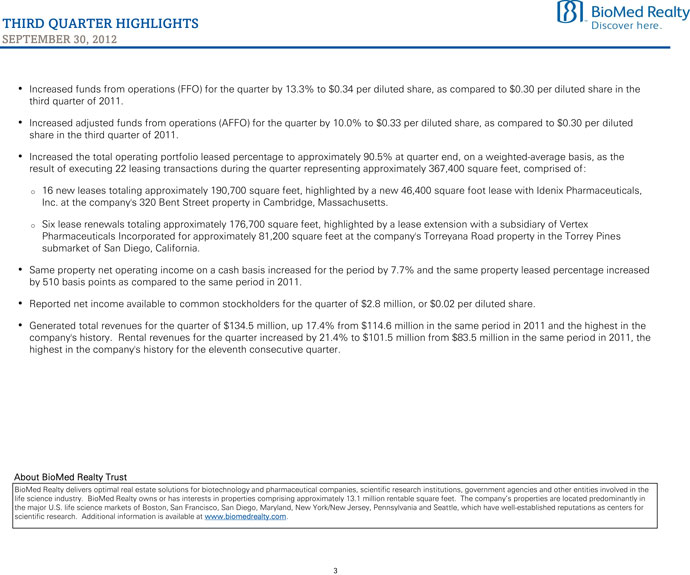
Increased funds from operations (FFO) for the quarter by 13.3% to $0.34 per diluted share, as compared to $0.30 per diluted share in the third quarter of 2011.
Increased adjusted funds from operations (AFFO) for the quarter by 10.0% to $0.33 per diluted share, as compared to $0.30 per diluted share in the third quarter of 2011.
Increased the total operating portfolio leased percentage to approximately 90.5% at quarter end, on a weighted-average basis, as the result of executing 22 leasing transactions during the quarter representing approximately 367,400 square feet, comprised of:
16 new leases totaling approximately 190,700 square feet, highlighted by a new 46,400 square foot lease with Idenix Pharmaceuticals, Inc. at the company’s 320 Bent Street property in Cambridge, Massachusetts.
Six lease renewals totaling approximately 176,700 square feet, highlighted by a lease extension with a subsidiary of Vertex
Pharmaceuticals Incorporated for approximately 81,200 square feet at the company’s Torreyana Road property in the Torrey Pines submarket of San Diego, California.
Same property net operating income on a cash basis increased for the period by 7.7% and the same property leased percentage increased by 510 basis points as compared to the same period in 2011.
Reported net income available to common stockholders for the quarter of $2.8 million, or $0.02 per diluted share.
Generated total revenues for the quarter of $134.5 million, up 17.4% from $114.6 million in the same period in 2011 and the highest in the company’s history. Rental revenues for the quarter increased by 21.4% to $101.5 million from $83.5 million in the same period in 2011, the highest in the company’s history for the eleventh consecutive quarter.
About BioMed Realty Trust
BioMed Realty delivers optimal real estate solutions for biotechnology and pharmaceutical companies, scientific research institutions, government agencies and other entities involved in the life science industry. BioMed Realty owns or has interests in properties comprising approximately properties are located predominantly 13.1 million inrentable the major U.S. life science markets of Boston, San Francisco, San Diego, Maryland, New York/New Jersey, Pennsylvania and Seattle, which have well-established reputations as centers for scientific research. Additional information is available at www.biomedrealty.com.

INVESTOR INFORMATION
SEPTEMBER 30, 2012
Company Information
Corporate Headquarters 17190 Bernardo Center Drive San Diego, CA 92128 (858) 485-9840 (858) 485-9843 (fax)
Trading Symbols BMR
BMR PrA
Transfer Agent
Computershare Shareowner Services LLC 480 Washington Boulevard Jersey City, NJ 07310-1900 (877) 296-3711
Stock Exchange Listing New York Stock Exchange
Please visit our corporate website at: www.biomedrealty.com
Board of Directors
Alan D. Gold Chairman Barbara R. Cambon Edward A. Dennis, Ph.D. Richard I. Gilchrist Gary A. Kreitzer Theodore D. Roth M. Faye Wilson
Senior Management
Alan D. Gold Chairman and
Chief Executive Officer R. Kent Griffin, Jr.
President and
Chief Operating Officer Gary A. Kreitzer Executive Vice President, Director Matthew G. McDevitt Executive Vice President, Real Estate Greg N. Lubushkin Chief Financial Officer
Karen A. Sztraicher
Executive Vice President, Asset Management Jonathan P. Klassen Senior Vice President,
General Counsel and Secretary John P. Bonanno Senior Vice President, Leasing & Development Kevin M. Simonsen Vice President, Real Estate Counsel
Bruce D. Steel Managing Director, BioMed Ventures Stephen A. Willey Vice President, ChiefAccounting Officer Janice L. Kameir
Vice President, Human Resources Robert M. Sistek Vice President, Finance William F. X. Kane Vice President, Leasing & Development
Tentative Schedule for Quarterly Results
Fourth Quarter 2012 February 14, 2013
First Quarter 2013 May 2, 2013
Second Quarter 2013 August 1, 2013
Third Quarter 2013 October 31, 2013

EQUITY RESEARCH COVERAGE
SEPTEMBER 30, 2012
BMO Capital Markets Richard C. Anderson (212) 885-4180 richard.anderson@bmo.com
Joshua Patinkin (212) 883-5102 joshua.patinkin@bmo.com
Cantor Fitzgerald David Toti (212) 915-1219 dtoti@cantor.com
Evan Smith (212) 915-1220 evan.smith@cantor.com
Cowen and Company James Sullivan (646) 562-1380 james.sullivan@cowen.com
Michael Gorman (646) 562-1381 michael.gorman@cowen.com
Green Street Advisors John Stewart (949) 640-8780 jstewart@greenst.com
John Hornbeak jhornbeak@greenst.com
Jefferies & Co. Omotayo Okusanya (212) 336-7076 tokusanya@jefferies.com
David Shamis (212) 284-1796 dshamis@jefferies.com
KeyBanc Capital Markets Jordan Sadler (917) 368-2280 jsadler@keybanccm.com
Craig Mailman (917) 368-2316 cmailman@keybanccm.com
Macquarie Capital (USA) Robert Stevenson (212) 231-8068 rob.stevenson@macquarie.com
Nicholas Yulico (212) 231-8028 nicholas.yulico@macquarie.com
Morgan Stanley Paul Morgan (415) 576-2627 paul.b.morgan@morganstanley.com
Chris Caton (415) 576-2637 chris.caton@morganstanley.com
Raymond James Paul D. Puryear (727) 567-2253 paul.puryear@raymondjames.com
William A. Crow (727) 567-5294 bill.crow@raymondjames.com
Robert W. Baird & Co. Mathew R. Spencer (414) 298-5053 mspencer@rwbaird.com
David Rodgers (216) 737-7341 drodgers@rwbaird.com
Stifel, Nicolaus & Company, Inc. Daniel Bernstein (443) 224-1351 bernsted@stifel.com
Seth P. Cohn (443) 224-1354 cohns@stifel.com
UBS Securities Ross T. Nussbaum (212) 713-4760 ross.nussbaum@ubs.com
Wells Fargo Securities Brendan Maiorana (443) 263-6516 brendan.maiorana@wachovia.com
Young Ku (443) 263-6564 young.ku@wachovia.com

FINANCIAL AND OPERATING HIGHLIGHTS
SEPTEMBER 30, 2012
(In thousands, except per share and ratio amounts)
Three Months Ended
Selected Operating Data 9/30/12 6/30/12 3/31/12 12/31/11 9/30/11
Total revenues $ 134,537 $ 124,848 $ 120,012 $ 111,958 $ 114,639
EBITDA (1) 81,773 63,302 66,485 71,980 65,530
Adjusted EBITDA (1) 85,646 79,571 75,291 72,011 73,640
Net operating income—cash basis (2) 92,032 86,800 83,432 75,140 72,484
General and administrative expense 10,226 8,576 8,614 9,169 7,682
Acquisition-related expenses 176 12,245 633 309 136
Capitalized interest 1,926 2,090 2,360 2,260 1,996
Interest expense, net 26,817 23,825 22,219 21,725 22,887
Operating margin (3) 70.8% 70.3% 69.4% 71.2% 69.2%
General and administrative expense / Total revenues 7.6% 6.9% 7.2% 8.2% 6.7%
Change in same property net operating income—cash basis (4) 7.7% 6.4% 4.3% 2.2% 5.7%
Net income/(loss) available to common stockholders 2,758 (8,713) (1,339) 12,058 4,765
Net income/(loss) per share—diluted $ 0.02 $ (0.06) $ (0.01) $ 0.08 $ 0.03
FFO—diluted (5) 56,166 40,680 50,197 46,880 43,778
FFO per share—diluted (5) $ 0.34 $ 0.24 $ 0.30 $ 0.30 $ 0.30
CFFO—diluted (5) 56,342 52,925 50,830 47,189 43,914
CFFO per share—diluted (5) $ 0.34 $ 0.32 $ 0.30 $ 0.30 $ 0.30
AFFO—diluted (5) 55,641 55,334 50,756 44,247 42,683
AFFO per share—diluted (5) $ 0.33 $ 0.33 $ 0.30 $ 0.28 $ 0.30
Dividend per share—common stock $ 0.215 $ 0.215 $ 0.215 $ 0.20 $ 0.20
CFFO payout ratio (6) 63.2% 67.2% 71.7% 66.7% 66.7%
AFFO payout ratio (6) 65.2% 65.2% 71.7% 71.4% 66.7%
Funds from Operations (in thousands) (5)
$60,000 $55,000 $50,000 CFFO $45,000 AFFO $40,000 $35,000
3Q11 4Q11 1Q12 2Q12 3Q12
Change in Same Property NOI—Cash Basis (4)
7.7% 8.0% 5.7% 6.4% 6.0% 4.3%
4.0% 2.2% 2.0%
0.0%
3Q11 4Q11 1Q12 2Q12 3Q12
(1) For definitions and discussion of EBITDA and adjusted EBITDA, see page 33. For a quantitative reconciliation of the differences between adjusted EBITDA, EBITDA and net income available to common stockholders, see page 14.
(2) | | For definitions and discussion of net operating income—cash basis, see page 15. (3) See page 15 for detail. |
(4) | | Compared to the same period in the prior year. See page 29 for detail. |
(5) For definitions and discussion of FFO, CFFO and AFFO, see page 33. For a quantitative reconciliation of the differences between FFO, CFFO, AFFO and net income available to common stockholders, see pages 12 and 13.
(6) | | See page 13 for detail of the CFFO and AFFO payout ratios. |
CAPITALIZATION SUMMARY
SEPTEMBER 30, 2012
(In thousands, except per share and ratio amounts)
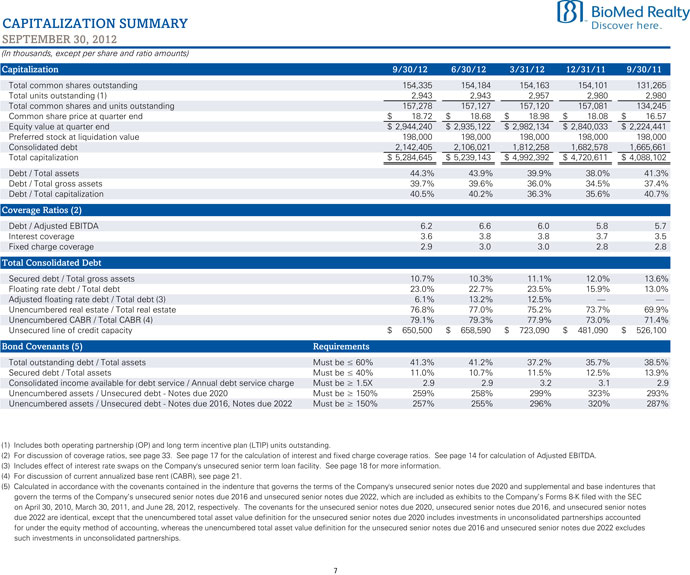
Capitalization 9/30/12 6/30/12 3/31/12 12/31/11 9/30/11
Total common shares outstanding 154,335 154,184 154,163 154,101 131,265
Total units outstanding (1) 2,943 2,943 2,957 2,980 2,980
Total common shares and units outstanding 157,278 157,127 157,120 157,081 134,245
Common share price at quarter end $ 18.72 $ 18.68 $ 18.98 $ 18.08 $ 16.57
Equity value at quarter end $ 2,944,240 $ 2,935,122 $ 2,982,134 $ 2,840,033 $ 2,224,441
Preferred stock at liquidation value 198,000 198,000 198,000 198,000 198,000
Consolidated debt 2,142,405 2,106,021 1,812,258 1,682,578 1,665,661
Total capitalization $ 5,284,645 $ 5,239,143 $ 4,992,392 $ 4,720,611 $ 4,088,102
Debt / Total assets 44.3% 43.9% 39.9% 38.0% 41.3%
Debt / Total gross assets 39.7% 39.6% 36.0% 34.5% 37.4%
Debt / Total capitalization 40.5% 40.2% 36.3% 35.6% 40.7%
Coverage Ratios (2)
Debt / Adjusted EBITDA 6.2 6.6 6.0 5.8 5.7
Interest coverage 3.6 3.8 3.8 3.7 3.5
Fixed charge coverage 2.9 3.0 3.0 2.8 2.8
Total Consolidated Debt
Secured debt / Total gross assets 10.7% 10.3% 11.1% 12.0% 13.6%
Floating rate debt / Total debt 23.0% 22.7% 23.5% 15.9% 13.0%
Adjusted floating rate debt / Total debt (3) 6.1% 13.2% 12.5%
Unencumbered real estate / Total real estate 76.8% 77.0% 75.2% 73.7% 69.9%
Unencumbered CABR / Total CABR (4) 79.1% 79.3% 77.9% 73.0% 71.4%
Unsecured line of credit capacity $ 650,500 $ 658,590 $ 723,090 $ 481,090 $ 526,100
Bond Covenants (5) Requirements
Total outstanding debt / Total assets Must be 60%41.3% 41.2% 37.2% 35.7% 38.5%
Secured debt / Total assets Must be 40%11.0% 10.7% 11.5% 12.5% 13.9%
Consolidated income available for debt service / Annual debt service charge Must be 1.5X2.9 2.9 3.2 3.1 2.9
Unencumbered assets / Unsecured debt—Notes due 2020 Must be 150%259% 258% 299% 323% 293%
Unencumbered assets / Unsecured debt—Notes due 2016, Notes due 2022 Must be 150%257% 255% 296% 320% 287%
(1) | | Includes both operating partnership (OP) and long term incentive plan (LTIP) units outstanding. |
(2) For discussion of coverage ratios, see page 33. See page 17 for the calculation of interest and fixed charge coverage ratios. See page 14 for calculation of Adjusted EBITDA. (3) Includes effect
of interest rate swaps on the Company’s unsecured senior term loan facility. See page 18 for more information.
(4) | | For discussion of current annualized base rent (CABR), see page 21. |
(5) Calculated in accordance with the covenants contained in the indenture that governs the terms of the Company’s unsecured senior notes due 2020 and supplemental and base indentures that govern the terms of the Company’s unsecured senior notes due 2016 and unsecured senior on April 30, 2010, March 30, 2011, and June 28, 2012, respectively. The covenants for the unsecured senior notes due 2020, unsecured senior notes due 2016, and unsecured senior notes due 2022 are identical, except that the unencumbered total asset value definition for the unsecured senior notes due 2020 includes investments in unconsolidated partnerships accounted for under the equity method of accounting, whereas the unencumbered total asset value definition for the unsecured senior notes due 2016 and unsecured senior notes due 2022 excludes such investments in unconsolidated partnerships.

PORTFOLIO SUMMARY
SEPTEMBER 30, 2012
Weighted
Gross Rentable Average
Book Value Buildings Square Feet Leased % (1)
(In thousands)
Stabilized (2) $ 3,350,610 113 8,083,726 99.6%
Lease up (2) 1,287,372 48 4,442,179 66.8%
Total operating portfolio $ 4,637,982 161 12,525,905 90.5%
Redevelopment (3) $ 46,263 4 196,867 34.1%
Unconsolidated partnership portfolio (4) 31,955 3 352,863 56.4%
Development potential (3) 206,037 3,964,000
Total portfolio $ 4,922,237 168 17,039,635
Total Operating Portfolio Leased % (1)
90.5% 92.0% 89.8%
90.0% 88.2%
87.2% 86.9%
88.0%
86.0%
84.0%
3Q11 4Q11 1Q12 2Q12 3Q12
(1) Calculated based on gross book value for each asset multiplied by the percentage leased. (2) See pages 22-23 for detail of consolidated portfolio and page 34 for definitions of terms. (3) See page 24 for detail of the consolidated portfolio and page 34 for definitions of terms. (4) See page 25 for detail of the unconsolidated partnership portfolio.
CONSOLIDATED BALANCE SHEETS
SEPTEMBER 30, 2012
(In thousands)
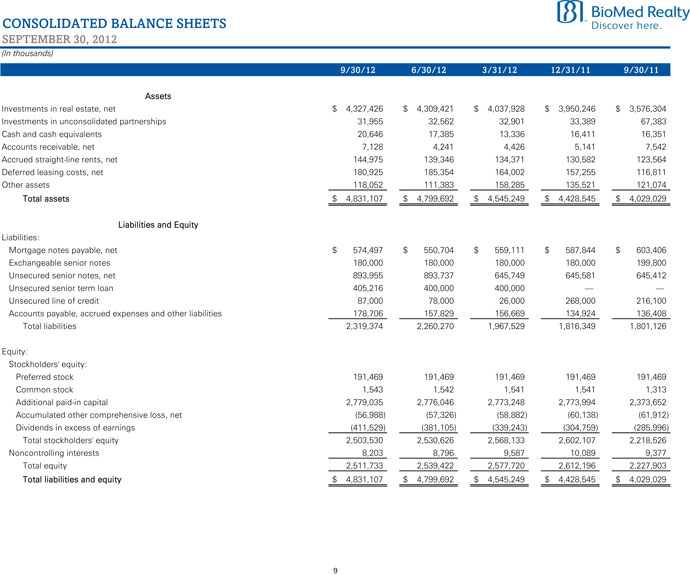
9/30/12 6/30/12 3/31/12 12/31/11 9/30/11
Assets
Investments in real estate, net $ 4,327,426 $ 4,309,421 $ 4,037,928 $ 3,950,246 $ 3,576,304
Investments in unconsolidated partnerships 31,955 32,562 32,901 33,389 67,383
Cash and cash equivalents 20,646 17,385 13,336 16,411 16,351
Accounts receivable, net 7,128 4,241 4,426 5,141 7,542
Accrued straight-line rents, net 144,975 139,346 134,371 130,582 123,564
Deferred leasing costs, net 180,925 185,354 164,002 157,255 116,811
Other assets 118,052 111,383 158,285 135,521 121,074
Total assets $ 4,831,107 $ 4,799,692 $ 4,545,249 $ 4,428,545 $ 4,029,029
Liabilities and Equity
Liabilities:
Mortgage notes payable, net $ 574,497 $ 550,704 $ 559,111 $ 587,844 $ 603,406
Exchangeable senior notes 180,000 180,000 180,000 180,000 199,800
Unsecured senior notes, net 893,955 893,737 645,749 645,581 645,412
Unsecured senior term loan 405,216 400,000 400,000
Unsecured line of credit 87,000 78,000 26,000 268,000 216,100
Accounts payable, accrued expenses and other liabilities 178,706 157,829 156,669 134,924 136,408
Total liabilities 2,319,374 2,260,270 1,967,529 1,816,349 1,801,126
Equity:
Stockholders’ equity:
Preferred stock 191,469 191,469 191,469 191,469 191,469
Common stock 1,543 1,542 1,541 1,541 1,313
Additional paid-in capital 2,779,035 2,776,046 2,773,248 2,773,994 2,373,652
Accumulated other comprehensive loss, net (56,988) (57,326) (58,882) (60,138) (61,912)
Dividends in excess of earnings (411,529) (381,105) (339,243) (304,759) (285,996)
Total stockholders’ equity 2,503,530 2,530,626 2,568,133 2,602,107 2,218,526
Noncontrolling interests 8,203 8,796 9,587 10,089 9,377
Total equity 2,511,733 2,539,422 2,577,720 2,612,196 2,227,903
Total liabilities and equity $ 4,831,107 $ 4,799,692 $ 4,545,249 $ 4,428,545 $ 4,029,029
9

CONSOLIDATED STATEMENTS OF OPERATIONS
SEPTEMBER 30, 2012
(In thousands, except share and per share data)
Three Months Ended
9/30/12 6/30/12 3/31/12 12/31/11 9/30/11
Revenues:
Rental $ 101,467 $ 95,708 $ 91,475 $ 84,854 $ 83,549
Tenant recoveries 31,765 28,939 28,453 26,098 26,603
Other revenue 1,305 201 84 1,006 4,487
Total revenues 134,537 124,848 120,012 111,958 114,639
Expenses:
Rental operations 38,944 37,044 36,729 31,899 33,876
Depreciation and amortization 51,372 47,575 44,934 36,670 36,203
General and administrative 10,226 8,576 8,614 9,169 7,682
Acquisition-related expenses 176 12,245 633 309 136
Total expenses 100,718 105,440 90,910 78,047 77,897
Income from operations 33,819 19,408 29,102 33,911 36,742
Equity in net loss of unconsolidated partnerships (339) (317) (355) (640) (735)
Interest expense, net (26,817) (23,825) (22,219) (21,725) (22,887)
Other (expense)/income (208) (549) 174 4,244 (4,259)
Income/(loss) from continuing operations 6,455 (5,283) 6,702 15,790 8,861
Income/(loss) from discontinued operations 49 (4,420) 163 76
Net income/(loss) 6,455 (5,234) 2,282 15,953 8,937
Net (income)/loss attributable to noncontrolling interests (46) 172 30 (244) (106)
Net income/(loss) attributable to the Company 6,409 (5,062) 2,312 15,709 8,831
Preferred stock dividends (3,651) (3,651) (3,651) (3,651) (3,901)
Cost on redemption of preferred stock (165)
Net income/(loss) available to common stockholders $ 2,758 $ (8,713) $ (1,339) $ 12,058 $ 4,765
Income/(loss) from continuing operations per share available to common stockholders:
Basic and diluted earnings per share $ 0.02 $ (0.06) $ 0.02 $ 0.08 $ 0.03
Income/(loss) from discontinued operations per share available to common stockholders:
Basic and diluted earnings per share $ 0.00 $ 0.00 $ (0.03) $ 0.00 $ 0.00
Net income/(loss) per share available to common stockholders:
Basic and diluted earnings per share $ 0.02 $ (0.06) $ (0.01) $ 0.08 $ 0.03
Weighted-average common shares outstanding:
Basic 152,785,451 152,775,422 152,659,258 140,909,345 129,872,349
Diluted 155,728,209 152,775,422 155,625,204 143,889,324 132,852,328
10
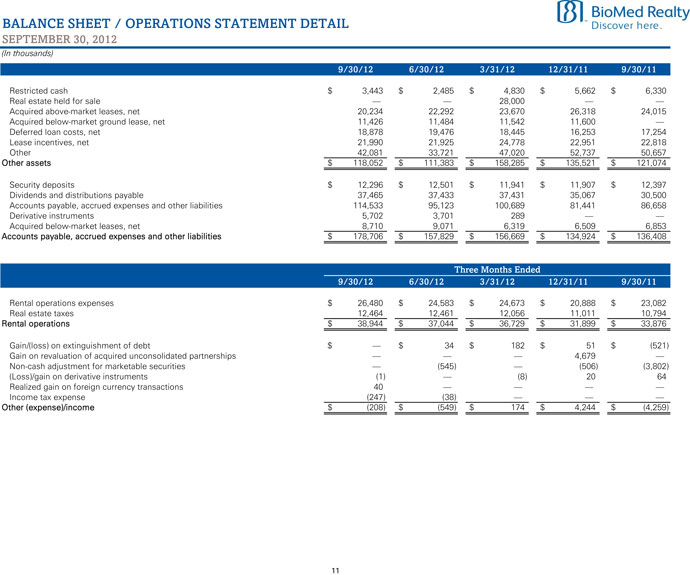
BALANCE SHEET / OPERATIONS STATEMENT DETAIL
SEPTEMBER 30, 2012
(In thousands)
9/30/12 6/30/12 3/31/12 12/31/11 9/30/11
Restricted cash $ 3,443 $ 2,485 $ 4,830 $ 5,662 $ 6,330
Real estate held for sale 28,000
Acquired above-market leases, net 20,234 22,292 23,670 26,318 24,015
Acquired below-market ground lease, net 11,426 11,484 11,542 11,600
Deferred loan costs, net 18,878 19,476 18,445 16,253 17,254
Lease incentives, net 21,990 21,925 24,778 22,951 22,818
Other 42,081 33,721 47,020 52,737 50,657
Other assets $ 118,052 $ 111,383 $ 158,285 $ 135,521 $ 121,074
Security deposits $ 12,296 $ 12,501 $ 11,941 $ 11,907 $ 12,397
Dividends and distributions payable 37,465 37,433 37,431 35,067 30,500
Accounts payable, accrued expenses and other liabilities 114,533 95,123 100,689 81,441 86,658
Derivative instruments 5,702 3,701 289
Acquired below-market leases, net 8,710 9,071 6,319 6,509 6,853
Accounts payable, accrued expenses and other liabilities $ 178,706 $ 157,829 $ 156,669 $ 134,924 $ 136,408
Three Months Ended
9/30/12 6/30/12 3/31/12 12/31/11 9/30/11
Rental operations expenses $ 26,480 $ 24,583 $ 24,673 $ 20,888 $ 23,082
Real estate taxes 12,464 12,461 12,056 11,011 10,794
Rental operations $ 38,944 $ 37,044 $ 36,729 $ 31,899 $ 33,876
Gain/(loss) on extinguishment of debt $ $ 34 $ 182 $ 51 $ (521)
Gain on revaluation of acquired unconsolidated partnerships 4,679
Non-cash adjustment for marketable securities (545) (506) (3,802)
(Loss)/gain on derivative instruments (1) (8) 20 64
Realized gain on foreign currency transactions 40
Income tax expense (247) (38)
Other (expense)/income $ (208) $ (549) $ 174 $ 4,244 $ (4,259)
11
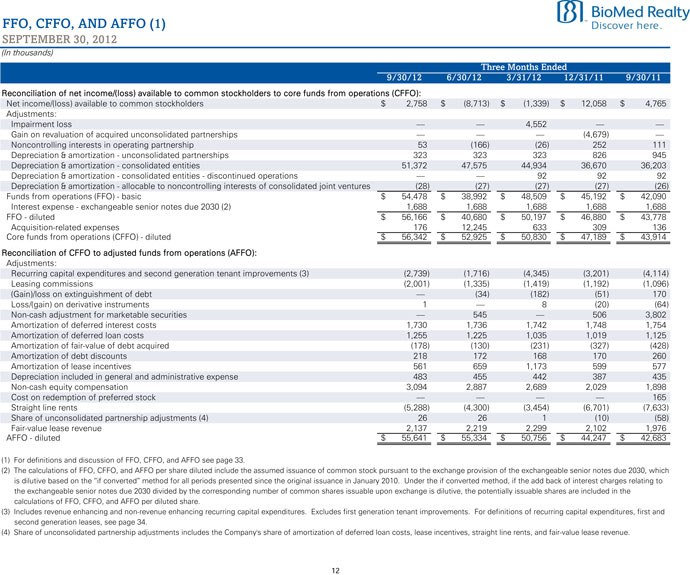
FFO, CFFO, AND AFFO (1)
SEPTEMBER 30, 2012
(In thousands)
Three Months Ended
9/30/12 6/30/12 3/31/12 12/31/11 9/30/11
Reconciliation of net income/(loss) available to common stockholders to core funds from operations (CFFO):
Net income/(loss) available to common stockholders $ 2,758 $ (8,713) $ (1,339) $ 12,058 $ 4,765
Adjustments:
Impairment loss 4,552
Gain on revaluation of acquired unconsolidated partnerships (4,679)
Noncontrolling interests in operating partnership 53 (166) (26) 252 111
Depreciation & amortization—unconsolidated partnerships 323 323 323 826 945
Depreciation & amortization—consolidated entities 51,372 47,575 44,934 36,670 36,203
Depreciation & amortization—consolidated entities—discontinued operations 92 92 92
Depreciation & amortization—allocable to noncontrolling interests of consolidated joint ventures (28) (27) (27) (27) (26)
Funds from operations (FFO)—basic $ 54,478 $ 38,992 $ 48,509 $ 45,192 $ 42,090
Interest expense—exchangeable senior notes due 2030 (2) 1,688 1,688 1,688 1,688 1,688
FFO—diluted $ 56,166 $ 40,680 $ 50,197 $ 46,880 $ 43,778
Acquisition-related expenses 176 12,245 633 309 136
Core funds from operations (CFFO)—diluted $ 56,342 $ 52,925 $ 50,830 $ 47,189 $ 43,914
Reconciliation of CFFO to adjusted funds from operations (AFFO):
Adjustments:
Recurring capital expenditures and second generation tenant improvements (3) (2,739) (1,716) (4,345) (3,201) (4,114)
Leasing commissions (2,001) (1,335) (1,419) (1,192) (1,096)
(Gain)/loss on extinguishment of debt (34) (182) (51) 170
Loss/(gain) on derivative instruments 1 8 (20) (64)
Non-cash adjustment for marketable securities 545 506 3,802
Amortization of deferred interest costs 1,730 1,736 1,742 1,748 1,754
Amortization of deferred loan costs 1,255 1,225 1,035 1,019 1,125
Amortization of fair-value of debt acquired (178) (130) (231) (327) (428)
Amortization of debt discounts 218 172 168 170 260
Amortization of lease incentives 561 659 1,173 599 577
Depreciation included in general and administrative expense 483 455 442 387 435
Non-cash equity compensation 3,094 2,887 2,689 2,029 1,898
Cost on redemption of preferred stock 165
Straight line rents (5,288) (4,300) (3,454) (6,701) (7,633)
Share of unconsolidated partnership adjustments (4) 26 26 1 (10) (58)
Fair-value lease revenue 2,137 2,219 2,299 2,102 1,976
AFFO—diluted $ 55,641 $ 55,334 $ 50,756 $ 44,247 $ 42,683
(1) | | For definitions and discussion of FFO, CFFO, and AFFO see page 33. |
(2) The calculations of FFO, CFFO, and AFFO per share diluted include the assumed issuanceofcommon stock pursuant to the exchange provision of the exchangeable senior notes due 2030,which is dilutive based on the “if converted” method for all periods presented since the the exchangeable senior notes due 2030 divided by the corresponding number of common shares issuable upon exchange is dilutive, the potentially issuable shares are included in the calculations of FFO, CFFO, and AFFO per diluted share.
(3) Includes revenue enhancing and non-revenue enhancing recurring capital expenditures. Excludes first generation tenant improvements. For definitions of recurring capital expenditures, first and second generation leases, see page 34.
(4) Share of unconsolidated partnership adjustments includes the Company’s share of amortization of deferred loan costs, lease incentives, straight line rents, and fair-value lease revenue.
12

FFO, CFFO, AND AFFO PER SHARE (1)
SEPTEMBER 30, 2012
(In thousands, except share, per share and ratio amounts)
Three Months Ended
9/30/12 6/30/12 3/31/12 12/31/11 9/30/11
FFO—basic $ 54,478 $ 38,992 $ 48,509 $ 45,192 $ 42,090
FFO—diluted 56,166 40,680 50,197 46,880 43,778
CFFO—diluted 56,342 52,925 50,830 47,189 43,914
AFFO—diluted 55,641 55,334 50,756 44,247 42,683
FFO per share—basic $ 0.35 $ 0.25 $ 0.31 $ 0.31 $ 0.31
FFO per share—diluted (2) 0.34 0.24 0.30 0.30 0.30
CFFO per share—diluted (2) 0.34 0.32 0.30 0.30 0.30
AFFO per share—diluted (2) 0.33 0.33 0.30 0.28 0.30
Dividends and distributions declared per common share $ 0.215 $ 0.215 $ 0.215 $ 0.20 $ 0.20
CFFO payout ratio 63.2% 67.2% 71.7% 66.7% 66.7%
AFFO payout ratio 65.2% 65.2% 71.7% 71.4% 66.7%
Weighted-average common shares and units outstanding diluted (3) 157,223,682 157,111,463 157,108,910 145,350,296 134,242,201
Dilutive effect of exchangeable senior notes due 2030 (2) 10,127,232 10,127,232 10,127,232 10,017,858 10,017,858
Weighted-average common shares and units outstanding diluted—FFO, CFFO, and AFFO 167,350,914 167,238,695 167,236,142 155,368,154 144,260,059
CFFO and AFFO Per Share—Diluted (2)
$0.34 $0.33 $0.33 $0.35 $0.32 $0.33 $0.30 $0.30 $0.30 $0.30 $0.30 $0.31 CFFO $0.28 AFFO $0.29
$0.27
$0.25
3Q11 4Q11 1Q12 2Q12 3Q12
(1) | | For definitions and discussion of FFO, CFFO, and AFFO see page 33. |
(2) The calculations of FFO, CFFO, and AFFO per share diluted include the assumed issuanceofcommon stock pursuant to the exchange provision of the exchangeable senior notes due 2030,which is dilutive based on the “if converted” method for all periods presented since the the exchangeable senior notes due 2030 divided by the corresponding number of common shares issuable upon exchange is dilutive, the potentially issuable shares are included in the calculations of FFO, CFFO, and AFFO per diluted share.
(3) The three months ended June 30, 2012 includes 2,947,140 shares of OP and LTIP units, which are considered anti-dilutive for purposes of calculating diluted earnings per share. The three months ended September 30, 2012, June 30, 2012, March 31, 2012, December 31, 2011, and September 30, 2011, include 1,495,473, 1,388,901, 1,483,706, 1,460,972, and 1,389,873 shares of unvested restricted stock, respectively, which are considered anti-dilutive for purposes of calculating diluted earnings per share.
13
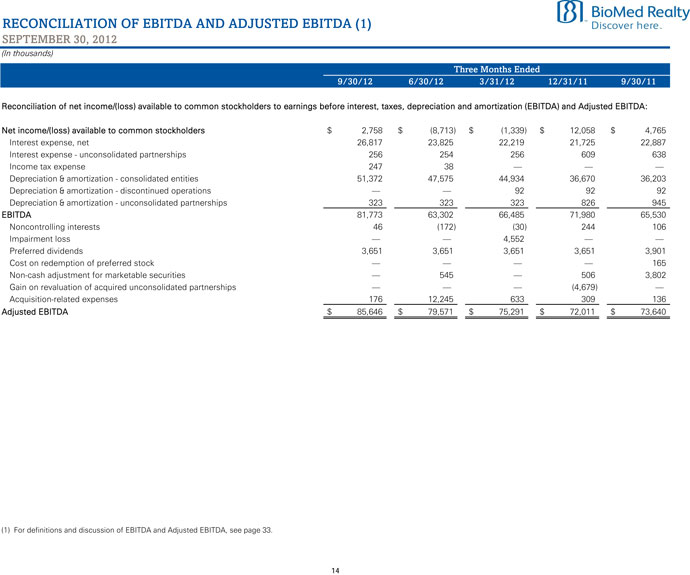
RECONCILIATION OF EBITDA AND ADJUSTED EBITDA (1)
SEPTEMBER 30, 2012
(In thousands)
Three Months Ended
9/30/12 6/30/12 3/31/12 12/31/11 9/30/11
Reconciliation of net income/(loss) available to common stockholders to earnings before interest, taxes, depreciation and amortization (EBITDA) and Adjusted EBITDA:
Net income/(loss) available to common stockholders $ 2,758 $ (8,713) $ (1,339) $ 12,058 $ 4,765
Interest expense, net 26,817 23,825 22,219 21,725 22,887
Interest expense—unconsolidated partnerships 256 254 256 609 638
Income tax expense 247 38
Depreciation & amortization—consolidated entities 51,372 47,575 44,934 36,670 36,203
Depreciation & amortization—discontinued operations 92 92 92
Depreciation & amortization—unconsolidated partnerships 323 323 323 826 945
EBITDA 81,773 63,302 66,485 71,980 65,530
Noncontrolling interests 46 (172) (30) 244 106
Impairment loss 4,552
Preferred dividends 3,651 3,651 3,651 3,651 3,901
Cost on redemption of preferred stock 165
Non-cash adjustment for marketable securities 545 506 3,802
Gain on revaluation of acquired unconsolidated partnerships (4,679)
Acquisition-related expenses 176 12,245 633 309 136
Adjusted EBITDA $ 85,646 $ 79,571 $ 75,291 $ 72,011 $ 73,640
(1) | | For definitions and discussion of EBITDA and Adjusted EBITDA, see page 33. |
14

RECONCILIATION OF NET OPERATING INCOME (1)
SEPTEMBER 30, 2012
(In thousands, except ratio amounts)
Three Months Ended
9/30/12 6/30/12 3/31/12 12/31/11 9/30/11
Net income/(loss) $ 6,455 $ (5,234) $ 2,282 $ 15,953 $ 8,937
(Income)/loss from discontinued operations (49) 4,420 (163) (76)
Equity in net loss of unconsolidated partnerships 339 317 355 640 735
Interest expense, net 26,817 23,825 22,219 21,725 22,887
Other expense/(income) 208 549 (174) (4,244) 4,259
Income from operations 33,819 19,408 29,102 33,911 36,742
Depreciation and amortization 51,372 47,575 44,934 36,670 36,203
General and administrative 10,226 8,576 8,614 9,169 7,682
Acquisition-related expenses 176 12,245 633 309 136
Consolidated net operating income $ 95,593 $ 87,804 $ 83,283 $ 80,059 $ 80,763
Revenues:
Rental $ 101,467 $ 95,708 $ 91,475 $ 84,854 $ 83,549
Tenant recoveries 31,765 28,939 28,453 26,098 26,603
Other revenue (2) 1,305 201 84 1,006 4,487
Total revenues 134,537 124,848 120,012 111,958 114,639
Expenses:
Rental operations 38,944 37,044 36,729 31,899 33,876
Consolidated net operating income $ 95,593 $ 87,804 $ 83,283 $ 80,059 $ 80,763
Consolidated net operating income—cash basis (3) $ 92,032 $ 86,800 $ 83,432 $ 75,140 $ 72,484
Operating margin (4) 70.8% 70.3% 69.4% 71.2% 69.2%
Operating expense recovery (5) 81.6% 78.1% 77.5% 81.8% 78.5%
(1) | | For a definition and discussion of net operating income, see page 33. (2) Includes lease termination income. |
(3) Consolidated net operating income—cash basis is calculated as (consolidated net operating income—straight line rents—fair value lease revenue—lease incentive revenue—bad debt expense -other revenue).
(4) Operating margin is calculated as ((rental revenues + tenant recovery revenues—rental operations) / (rental revenues + tenant recovery revenues)). (5) Operating expense recovery is calculated as (tenant recovery revenues / rental operations).
15
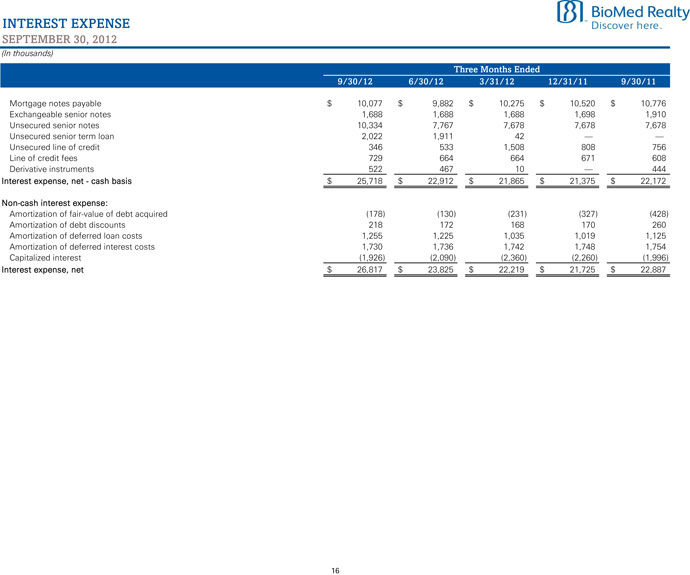
INTEREST EXPENSE
SEPTEMBER 30, 2012
(In thousands)
Three Months Ended
9/30/12 6/30/12 3/31/12 12/31/11 9/30/11
Mortgage notes payable $ 10,077 $ 9,882 $ 10,275 $ 10,520 $ 10,776
Exchangeable senior notes 1,688 1,688 1,688 1,698 1,910
Unsecured senior notes 10,334 7,767 7,678 7,678 7,678
Unsecured senior term loan 2,022 1,911 42
Unsecured line of credit 346 533 1,508 808 756
Line of credit fees 729 664 664 671 608
Derivative instruments 522 467 10 444
Interest expense, net—cash basis $ 25,718 $ 22,912 $ 21,865 $ 21,375 $ 22,172
Non-cash interest expense:
Amortization of fair-value of debt acquired (178) (130) (231) (327) (428)
Amortization of debt discounts 218 172 168 170 260
Amortization of deferred loan costs 1,255 1,225 1,035 1,019 1,125
Amortization of deferred interest costs 1,730 1,736 1,742 1,748 1,754
Capitalized interest (1,926) (2,090) (2,360) (2,260) (1,996)
Interest expense, net $ 26,817 $ 23,825 $ 22,219 $ 21,725 $ 22,887
16
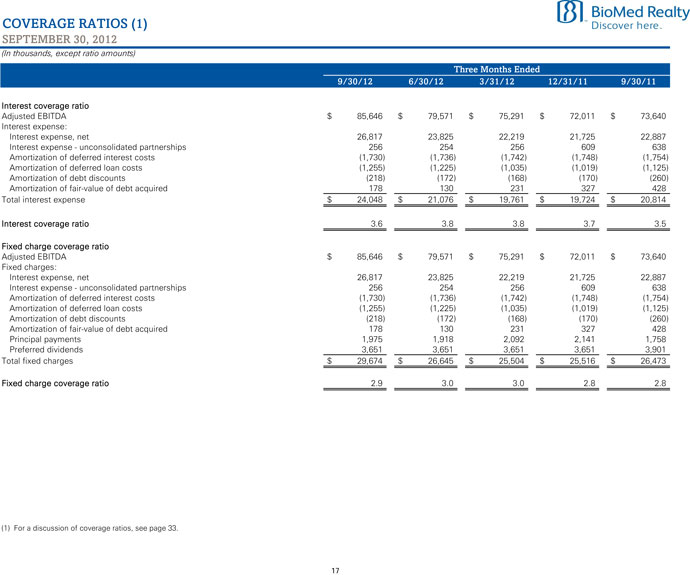
COVERAGE RATIOS (1)
SEPTEMBER 30, 2012
(In thousands, except ratio amounts)
Three Months Ended
9/30/12 6/30/12 3/31/12 12/31/11 9/30/11
Interest coverage ratio
Adjusted EBITDA $ 85,646 $ 79,571 $ 75,291 $ 72,011 $ 73,640
Interest expense:
Interest expense, net 26,817 23,825 22,219 21,725 22,887
Interest expense—unconsolidated partnerships 256 254 256 609 638
Amortization of deferred interest costs (1,730) (1,736) (1,742) (1,748) (1,754)
Amortization of deferred loan costs (1,255) (1,225) (1,035) (1,019) (1,125)
Amortization of debt discounts (218) (172) (168) (170) (260)
Amortization of fair-value of debt acquired 178 130 231 327 428
Total interest expense $ 24,048 $ 21,076 $ 19,761 $ 19,724 $ 20,814
Interest coverage ratio 3.6 3.8 3.8 3.7 3.5
Fixed charge coverage ratio
Adjusted EBITDA $ 85,646 $ 79,571 $ 75,291 $ 72,011 $ 73,640
Fixed charges:
Interest expense, net 26,817 23,825 22,219 21,725 22,887
Interest expense—unconsolidated partnerships 256 254 256 609 638
Amortization of deferred interest costs (1,730) (1,736) (1,742) (1,748) (1,754)
Amortization of deferred loan costs (1,255) (1,225) (1,035) (1,019) (1,125)
Amortization of debt discounts (218) (172) (168) (170) (260)
Amortization of fair-value of debt acquired 178 130 231 327 428
Principal payments 1,975 1,918 2,092 2,141 1,758
Preferred dividends 3,651 3,651 3,651 3,651 3,901
Total fixed charges $ 29,674 $ 26,645 $ 25,504 $ 25,516 $ 26,473
Fixed charge coverage ratio 2.9 3.0 3.0 2.8 2.8
(1) | | For a discussion of coverage ratios, see page 33. |
17

DEBT SUMMARY
SEPTEMBER 30, 2012
(Dollars in thousands)
Unamortized
Stated Effective Principal Premium / Carrying Maturity
Rate Rate Balance (Discount) Value Date
Consolidated Debt:
Fixed Rate Mortgages:
9900 Belward Campus Drive 5.64% 3.99% $ 10,800 $ 780 $ 11,580 07/17
9901 Belward Campus Drive 5.64% 3.99% 13,301 955 14,256 07/17
Center for Life Science | Boston 7.75% 7.75% 339,399 339,399 06/14
500 Kendall Street (Kendall D) 6.38% 5.45% 60,700 2,546 63,246 12/18
Shady Grove Road 5.97% 5.97% 145,334 145,334 09/16
900 Uniqema Boulevard 8.61% 5.61% 655 27 682 05/15
Total / Weighted-Average on Fixed Rate Mortgages 7.06% 6.89% 570,189 4,308 574,497
Fixed Rate Debt:
Unsecured Exchangeable Senior Notes Due 2030 3.75% 3.75% 180,000 180,000 01/30
Unsecured Senior Notes Due 2016 3.85% 3.99% 400,000 (1,834) 398,166 04/16
Unsecured Senior Notes Due 2020 6.13% 6.27% 250,000 (2,071) 247,929 04/20
Unsecured Senior Notes Due 2022 4.25% 4.36% 250,000 (2,140) 247,860 07/22
Subtotal / Weighted-Average on Unsecured Senior Notes 4.59% 4.73% 900,000 (6,045) 893,955
Total / Weighted-Average on Fixed Rate Debt 5.36% 5.37% 1,650,189 (1,737) 1,648,452
Variable Rate Debt:
Unsecured Senior Term Loan—U.S. Dollar (1) 1.87% 2.64% 243,596 243,596 03/17
Unsecured Senior Term Loan—GBP (2) 2.18% 2.39% 161,620 161,620 03/17
Unsecured Line of Credit (3) 1.77% 1.77% 87,000 87,000 07/15
Total / Weighted-Average on Variable Rate Debt 1.95% 2.40% 492,216 492,216
Total / Weighted-Average on Unsecured Debt 3.67% 3.89% 1,572,216 (6,045) 1,566,171
Total / Weighted-Average on Consolidated Debt 4.57% 4.69% $ 2,142,405 $ (1,737) $ 2,140,668
Share of Unconsolidated Partnership Debt:
PREI Secured Construction Loan (20%) (variable) 3.23% 3.23% 27,795 27,795 08/13
Total / Weighted-Average on Share of Unconsolidated Partnership Debt 3.23% 3.23% 27,795 27,795
Total / Weighted-Average on Consolidated and Share of Unconsolidated Partnership Debt 4.56% 4.67% $ 2,170,200 $ (1,737) $ 2,168,463
(1) The Company entered into interest rate swap agreements that effectively fix the interest rate on $200 million of the unsecured senior term loan facility at 2.81% for five years, subject to adjustments based on the Company’s credit ratings. Including the effect of these swaps, the
weighted-average effective interest rate for the $243.6 million outstanding under the unsecured senior term loan facility was 2.64% at September 30, 2012.
(2) During the quarter, the Company amended the unsecured senior term loan facility and converted $156.4 million of outstanding borrowings into British pounds sterling equal to £100 million. The principal balance represents the dollar amount based on the exchange rate of $1.62 to £1.00 at the end of the quarter. The Company entered into interest rate swap agreements that effectively fix the interest rate on £100 million at 2.39% for five years, subject to adjustments based on the Company’s credit ratings.
(3) Effective rate excludes facility fee of 35 bps on the entire capacity of the unsecured line of credit, or $750.0 million, which equals approximately $664,000 per quarter.
18

DEBT MATURITIES
SEPTEMBER 30, 2012
(In thousands)
Weighted-average debt maturity is 5.9 years for consolidated debt (excluding extension options).
2012 2013 2014 2015 2016 Thereafter Total
Consolidated debt:
Fixed rate debt:
Fixed rate mortgages $ 2,064 $ 8,595 $ 339,342 $ 6,595 $ 143,784 $ 69,809 $ 570,189
Unsecured exchangeable senior notes due 2030 (1) 180,000 180,000
Unsecured senior notes due 2016 400,000 400,000
Unsecured senior notes due 2020 250,000 250,000
Unsecured senior notes due 2022 250,000 250,000
Total fixed rate debt 2,064 8,595 339,342 6,595 543,784 749,809 1,650,189
Variable rate debt:
Unsecured senior term loan—U.S. Dollar 243,596 243,596
Unsecured senior term loan—GBP 161,620 161,620
Unsecured line of credit 87,000 87,000
Total variable rate debt 87,000 405,216 492,216
Total consolidated debt $ 2,064 $ 8,595 $ 339,342 $ 93,595 $ 543,784 $ 1,155,025 $ 2,142,405
Share of unconsolidated partnership debt:
PREI secured construction loan (20%) (variable) 27,795 27,795
Share of total unconsolidated partnership debt $ $ 27,795 $ $ $ $ $ 27,795
Total consolidated and share of unconsolidated partnership debt $ 2,064 $ 36,390 $ 339,342 $ 93,595 $ 543,784 $ 1,155,025 $ 2,170,200
Consolidated Debt Maturity Schedule (in thousands)
$1,155,025
$1,200,000
$1,000,000
$800,000 $543,784
$600,000 $339,342
$400,000 $2,064 $8,595 $93,595 $200,000
$0
2012 2013 2014 2015 2016 Thereafter
(1) The holders of the unsecured exchangeable senior notes due 2030 (the “2030 Notes”) have the right to require the Company to repurchase the 2030 Notes, in whole or in part, for cash on each of January 15, 2015, January 15, 2020 and January 15, 2025, or upon the occurrence of a designated event, in each case for a repurchase price equal to 100% of the principal amount of the 2030 Notes plus accrued and unpaid interest.
19

COMMON AND PREFERRED STOCK DATA
SEPTEMBER 30, 2012
(Shares in thousands)
Three Months Ended
Summary of Common Shares 09/30/12 06/30/12 03/31/12 12/31/11 09/30/11
Earnings per share
Weighted-average common shares outstanding 152,785 152,775 152,659 140,909 129,872
Weighted-average OP and LTIP units outstanding 2,943 2,966 2,980 2,980
Diluted common shares—EPS 155,728 152,775 155,625 143,889 132,852
Funds from operations
Weighted-average common shares outstanding 152,785 152,775 152,659 140,909 129,872
Weighted-average OP and LTIP units outstanding 2,943 2,948 2,966 2,980 2,980
Dilutive effect of restricted stock 1,496 1,389 1,484 1,461 1,390
Dilutive effect of exchangeable senior notes due 2030 10,127 10,127 10,127 10,018 10,018
Diluted common shares—FFO 167,351 167,239 167,236 155,368 144,260
Closing common shares, OP and LTIP units outstanding 157,278 157,127 157,120 157,081 134,245
Preferred shares outstanding 7,920 7,920 7,920 7,920 7,920
High price $ 19.94 $ 20.30 $ 19.65 $ 18.95 $ 21.03
Low price $ 18.10 $ 17.52 $ 17.72 $ 15.44 $ 14.94
Average closing price $ 18.81 $ 18.71 $ 18.65 $ 17.68 $ 18.16
Closing price $ 18.72 $ 18.68 $ 18.98 $ 18.08 $ 16.57
Dividends per share—annualized $ 0.86 $ 0.86 $ 0.86 $ 0.80 $ 0.80
Closing dividend yield—annualized 4.6% 4.6% 4.5% 4.4% 4.8%
Dividends per Share 09/30/12 06/30/12 03/31/12 12/31/11 09/30/11
Common Stock—BMR
Amount $ 0.215 $ 0.215 $ 0.215 $ 0.20 $ 0.20
Declared September 14, 2012 June 15, 2012 March 15, 2012 December 14, 2011 September 15, 2011
Record September 28, 2012 June 29, 2012 March 30, 2012 December 30, 2011 September 30, 2011
Paid October 15, 2012 July 16, 2012 April 16, 2012 January 17, 2012 October 17, 2011
Preferred Stock—BMR PrA
Amount $ 0.46094 $ 0.46094 $ 0.46094 $ 0.46094 $ 0.46094
Declared September 14, 2012 June 15, 2012 March 15, 2012 December 14, 2011 September 15, 2011
Record September 28, 2012 June 29, 2012 March 30, 2012 December 30, 2011 September 30, 2011
Paid October 15, 2012 July 16, 2012 April 16, 2012 January 17, 2012 October 17, 2011
20

MARKET SUMMARY
SEPTEMBER 30, 2012
Current (1) Expiration (2)
Annualized Annualized
Leased Percent of Base Rent Percent of Base Rent
Square Annualized Annualized per Leased Annualized Annualized per Leased
Market Feet Base Rent Base Rent Sq Ft Base Rent Base Rent Sq Ft
(In thousands) (In thousands)
Boston 2,858,978 $ 154,840 35.6% $ 54.16 $ 166,781 33.1% $ 58.34
San Francisco 2,244,257 65,718 15.1% 29.28 79,293 15.8% 35.33
San Diego 1,835,736 60,420 13.9% 32.91 75,283 15.0% 41.01
Maryland 1,578,549 59,934 13.8% 37.97 75,119 14.9% 47.59
New York / New Jersey 1,161,249 39,410 9.1% 33.94 48,558 9.7% 41.82
Pennsylvania 652,009 15,181 3.5% 23.28 16,083 3.2% 24.67
Seattle 244,737 11,710 2.7% 47.85 13,375 2.7% 54.65
University Related—Other 829,576 28,015 6.3% 33.77 28,674 5.6% 34.56
Total portfolio / weighted-average 11,405,091 $ 435,228 100.0% $ 38.16 $ 503,166 100.0% $ 44.12
Percent Leased
Total Unconsolidated
Operating Redevelopment Partnership
Market Portfolio (3) Portfolio (4)
Boston 93.9% 45.0%
San Francisco 79.7%
San Diego 91.8% 100.0%
Maryland 97.0% 55.9%
New York / New Jersey 82.3%
Pennsylvania 89.8%
Seattle 63.0%
University Related—Other 98.7%
Total portfolio (5) 88.6% 55.9% 56.4%
Total portfolio weighted-average leased % (6) 90.5% 34.1% 56.4%
(1) Current annualized base rent is the monthly contractual rent as of the current quarter ended, or if rent has not yet commenced, the first monthly rent payment due at each rent commencement date, multiplied by 12 months.
(2) Annualized base rent at expiration is the monthly contractual rent as of date of expiration of the applicable lease (not including any extension option(s)), multiplied by 12 months. (3) See page 24 for detail of the consolidated portfolio and page 34 for definitions of terms.
(4) See page 25 for detail of the unconsolidated partnership portfolio. (5) Calculated based on leased square feet divided by total square feet.
(6) | | Calculated based on gross book value for each asset multiplied by the percentage leased. |
21

PROPERTY LISTING—CONSOLIDATED PORTFOLIO
SEPTEMBER 30, 2012
Rentable Percent of Leased
Property Square Rentable Square Percent Leased
Property Acquisition Date Status (1) Buildings Feet Sq Ft Feet 9/30/12 6/30/12
Boston
1 | | Albany Street May 31, 2005 Stabilized 2 75,003 0.6% 75,003 100.0% 100.0% |
2 | | 320 Bent Street (2) December 14, 2011 Stabilized 1 195,198 1.5% 191,576 98.1% 78.8% |
3 | | 301 Binney Street (2) December 14, 2011 Lease Up 1 417,290 3.3% 310,381 74.4% 74.4% |
4 | | 301 Binney Street Garage (2) December 14, 2011 Stabilized 1 503 Stalls n/a 503 Stalls 100.0% 100.0% |
5 | | 210 Broadway February 9, 2012 Lease Up 1 64,812 0.5% 19,242 29.7% 26.1% |
6 | | Center for Life Science¦Boston November 17, 2006 Stabilized 1 704,159 6.0% 696,383 98.9% 98.9% |
7 | | Charles Street April 7, 2006 Stabilized 1 47,912 0.4% 47,912 100.0% 100.0% |
8 | | Coolidge Avenue April 5, 2005 Lease Up 1 37,684 0.3% 29,490 78.3% 86.5% |
9 21 Erie Street May 31, 2005 Stabilized 1 48,627 0.4% 48,627 100.0% 100.0%
10 40 Erie Street May 31, 2005 Stabilized 1 100,854 0.8% 100,854 100.0% 100.0%
11 47 Erie Street Parking Structure May 31, 2005 Stabilized 1 447 Stalls n/a 447 Stalls 100.0% 100.0%
12 Fresh Pond Research Park April 5, 2005 Stabilized 6 90,702 0.7% 89,176 98.3% 51.5%
13 50 Hampshire Street February 9, 2012 Stabilized 1 183,052 1.4% 183,052 100.0% 99.4%
14 60 Hampshire Street February 9, 2012 Stabilized 1 39,014 0.3% 39,014 100.0% 100.0%
15 500 Kendall Street (Kendall D) May 31, 2005 Stabilized 1 349,325 2.7% 346,535 99.2% 99.2%
16 675 W. Kendall Street (Kendall A) May 31, 2005 Stabilized 1 302,919 2.4% 302,919 100.0% 100.0%
17 Kendall Crossing Apartments (2) December 14, 2011 Stabilized 1 37 Apts. n/a 37 Apts. 100.0% 94.4%
18 Sidney Street May 31, 2005 Stabilized 1 191,904 1.5% 191,904 100.0% 100.0%
19 Vassar Street May 31, 2005 Stabilized 1 60,845 0.5% 60,845 100.0% 100.0%
Total Boston 25 2,909,300 23.3% 2,732,913 93.9% 91.2%
San Francisco
20 Ardentech Court November 18, 2004 Stabilized 1 55,588 0.4% 55,588 100.0% 100.0%
21 Ardenwood Venture (3) June 14, 2006 Lease Up 1 72,500 0.6% 56,257 77.6% 77.6%
22 Bayshore Boulevard August 17, 2004 Stabilized 3 183,344 1.4% 183,344 100.0% 100.0%
23 Bridgeview Technology Park I September 10, 2004 Lease Up 2 201,567 1.6% 176,616 87.6% 87.6%
24 Bridgeview Technology Park II March 16, 2005 Lease Up 1 50,400 0.4% 28,714 57.0% 57.0%
25 550 Broadway Street April 27, 2012 Stabilized 1 71,239 0.6% 71,239 100.0% 100.0%
26 Dumbarton Circle May 27, 2005 Stabilized 3 44,000 0.3% 44,000 100.0% 100.0%
27 Gateway Business Park October 26, 2010 Stabilized 6 284,013 2.2% 283,164 99.7% 99.7%
28 Industrial Road August 17, 2004 Stabilized 1 171,344 1.3% 171,344 100.0% 100.0%
29 Kaiser Drive August 25, 2005 Lease Up 1 87,953 0.7% 49,915 56.8% 56.8%
30 Pacific Industrial Center July 11, 2006 Lease Up 1 305,026 2.4% 219,255 71.9% 71.9%
31 Pacific Research Center North July 11, 2006 Lease Up 6 661,245 5.2% 436,391 66.0% 62.8%
32 Pacific Research Center South July 11, 2006 Lease Up 3 423,246 3.3% 263,543 62.3% 62.3%
33 Science Center at Oyster Point October 26, 2010 Stabilized 2 204,887 1.6% 204,887 100.0% 100.0%
Total San Francisco 32 2,816,352 22.0% 2,244,257 79.7% 78.9%
San Diego
34 Balboa Avenue August 13, 2004 Stabilized 1 35,344 0.3% 35,344 100.0% 100.0%
35 Bernardo Center Drive August 13, 2004 Stabilized 1 61,286 0.5% 61,286 100.0% 100.0%
36 Coast 9 October 15, 2010 Lease Up 8 164,074 1.3% 136,031 82.9% 73.7%
37 4570 Executive Drive September 17, 2010 Lease Up 1 125,219 1.0% 106,757 85.3% 85.3%
38 Faraday Avenue September 19, 2005 Stabilized 1 28,704 0.2% 28,704 100.0% 100.0%
39 Gazelle Court March 30, 2010 Stabilized 1 176,000 1.4% 176,000 100.0% 100.0%
40 3525 John Hopkins Court December 28, 2010 Stabilized 1 48,306 0.4% 48,306 100.0% 100.0%
41 3545-3575 John Hopkins Court August 16, 2006 Lease Up 1 72,192 0.6% 54,126 75.0% 75.0%
42 6114-6154 Nancy Ridge Drive May 2, 2007 Stabilized 3 196,557 1.5% 196,557 100.0% 100.0%
43 6122-6126 Nancy Ridge Drive April 25, 2012 Stabilized 1 68,000 0.5% 68,000 100.0% 100.0%
44 6828 Nancy Ridge Drive April 21, 2005 Stabilized 1 42,138 0.3% 42,138 100.0% 100.0%
45 Pacific Center Boulevard August 24, 2007 Stabilized 2 66,745 0.5% 66,745 100.0% 100.0%
46 Road to the Cure December 14, 2006 Lease Up 1 67,998 0.5% 37,219 54.7% 54.7%
47 San Diego Science Center October 21, 2004 Lease Up 1 105,364 0.8% 66,994 63.6% 63.4%
48 10240 Science Center Drive September 23, 2010 Stabilized 1 49,347 0.4% 49,347 100.0% 100.0%
49 10255 Science Center Drive September 24, 2004 Stabilized 1 53,740 0.4% 53,740 100.0% 100.0%
50 Sorrento Plaza December 18, 2010 Stabilized 2 31,184 0.2% 31,184 100.0% 100.0%
51 Sorrento Valley Boulevard December 7, 2006 Stabilized 1 54,924 0.4% 54,924 100.0% 100.0%
52 11388 Sorrento Valley Road September 10, 2010 Stabilized 1 35,940 0.3% 35,940 100.0% 100.0%
53 Summers Ridge June 8, 2012 Stabilized n/a 100.0% 100.0%
22
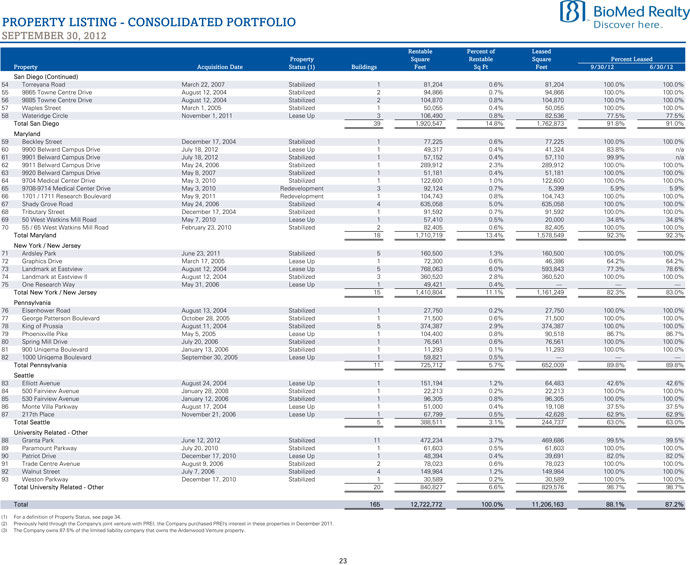
PROPERTY LISTING—CONSOLIDATED PORTFOLIO
SEPTEMBER 30, 2012
Rentable Percent of Leased
Property Square Rentable Square Percent Leased
Property Acquisition Date Status (1) Buildings Feet Sq Ft Feet 9/30/12 6/30/12
San Diego (Continued)
54 Torreyana Road March 22, 2007 Stabilized 1 81,204 0.6% 81,204 100.0% 100.0%
55 9865 Towne Centre Drive August 12, 2004 Stabilized 2 94,866 0.7% 94,866 100.0% 100.0%
56 9885 Towne Centre Drive August 12, 2004 Stabilized 2 104,870 0.8% 104,870 100.0% 100.0%
57 Waples Street March 1, 2005 Stabilized 1 50,055 0.4% 50,055 100.0% 100.0%
58 Wateridge Circle November 1, 2011 Lease Up 3 106,490 0.8% 82,536 77.5% 77.5%
Total San Diego 39 1,920,547 14.8% 1,762,873 91.8% 91.0%
Maryland
59 Beckley Street December 17, 2004 Stabilized 1 77,225 0.6% 77,225 100.0% 100.0%
60 9900 Belward Campus Drive July 18, 2012 Lease Up 1 49,317 0.4% 41,324 83.8% n/a
61 9901 Belward Campus Drive July 18, 2012 Stabilized 1 57,152 0.4% 57,110 99.9% n/a
62 9911 Belward Campus Drive May 24, 2006 Stabilized 1 289,912 2.3% 289,912 100.0% 100.0%
63 9920 Belward Campus Drive May 8, 2007 Stabilized 1 51,181 0.4% 51,181 100.0% 100.0%
64 9704 Medical Center Drive May 3, 2010 Stabilized 1 122,600 1.0% 122,600 100.0% 100.0%
65 9708-9714 Medical Center Drive May 3, 2010 Redevelopment 3 92,124 0.7% 5,399 5.9% 5.9%
66 1701 / 1711 Research Boulevard May 9, 2011 Redevelopment 1 104,743 0.8% 104,743 100.0% 100.0%
67 Shady Grove Road May 24, 2006 Stabilized 4 635,058 5.0% 635,058 100.0% 100.0%
68 Tributary Street December 17, 2004 Stabilized 1 91,592 0.7% 91,592 100.0% 100.0%
69 50 West Watkins Mill Road May 7, 2010 Lease Up 1 57,410 0.5% 20,000 34.8% 34.8%
70 55 / 65 West Watkins Mill Road February 23, 2010 Stabilized 2 82,405 0.6% 82,405 100.0% 100.0%
Total Maryland 18 1,710,719 13.4% 1,578,549 92.3% 92.3%
New York / New Jersey
71 Ardsley Park June 23, 2011 Stabilized 5 160,500 1.3% 160,500 100.0% 100.0%
72 Graphics Drive March 17, 2005 Lease Up 1 72,300 0.6% 46,386 64.2% 64.2%
73 Landmark at Eastview August 12, 2004 Lease Up 5 768,063 6.0% 593,843 77.3% 78.6%
74 Landmark at Eastview II August 12, 2004 Stabilized 3 360,520 2.8% 360,520 100.0% 100.0%
75 One Research Way May 31, 2006 Lease Up 1 49,421 0.4%
Total New York / New Jersey 15 1,410,804 11.1% 1,161,249 82.3% 83.0%
Pennsylvania
76 Eisenhower Road August 13, 2004 Stabilized 1 27,750 0.2% 27,750 100.0% 100.0%
77 George Patterson Boulevard October 28, 2005 Stabilized 1 71,500 0.6% 71,500 100.0% 100.0%
78 King of Prussia August 11, 2004 Stabilized 5 374,387 2.9% 374,387 100.0% 100.0%
79 Phoenixville Pike May 5, 2005 Lease Up 1 104,400 0.8% 90,518 86.7% 86.7%
80 Spring Mill Drive July 20, 2006 Stabilized 1 76,561 0.6% 76,561 100.0% 100.0%
81 900 Uniqema Boulevard January 13, 2006 Stabilized 1 11,293 0.1% 11,293 100.0% 100.0%
82 1000 Uniqema Boulevard September 30, 2005 Lease Up 1 59,821 0.5%
Total Pennsylvania 11 725,712 5.7% 652,009 89.8% 89.8%
Seattle
83 Elliott Avenue August 24, 2004 Lease Up 1 151,194 1.2% 64,483 42.6% 42.6%
84 500 Fairview Avenue January 28, 2008 Stabilized 1 22,213 0.2% 22,213 100.0% 100.0%
85 530 Fairview Avenue January 12, 2006 Stabilized 1 96,305 0.8% 96,305 100.0% 100.0%
86 Monte Villa Parkway August 17, 2004 Lease Up 1 51,000 0.4% 19,108 37.5% 37.5%
87 217th Place November 21, 2006 Lease Up 1 67,799 0.5% 42,628 62.9% 62.9%
Total Seattle 5 388,511 3.1% 244,737 63.0% 63.0%
University Related—Other
88—Granta Park June 12, 2012 Stabilized 11 472,234 3.7% 469,686 99.5% 99.5%
89 Paramount Parkway July 20, 2010 Stabilized 1 61,603 0.5% 61,603 100.0% 100.0%
90—Patriot Drive December 17, 2010 Lease Up 1 48,394 0.4% 39,691 82.0% 82.0%
91 Trade Centre Avenue August 9, 2006 Stabilized 2 78,023 0.6% 78,023 100.0% 100.0%
92 Walnut Street—July 7, 2006 Stabilized 4 149,984 1.2% 149,984 100.0% 100.0%
93 Weston Parkway December 17, 2010 Stabilized 1 30,589 0.2% 30,589 100.0% 100.0%
Total University Related—Other 20 840,827 6.6% 829,576 98.7% 98.7%
Total 165 12,722,772 100.0% 11,206,163 88.1% 87.2%
(1) | | For a definition of Property Status, see page 34. |
(2) Previously held through the Company’s joint venture with PREI; the Company purchased PREI’s interest in these properties in December 2011. (3) The Company owns 87.5% of the limited liability company that owns the Ardenwood Venture property.
23
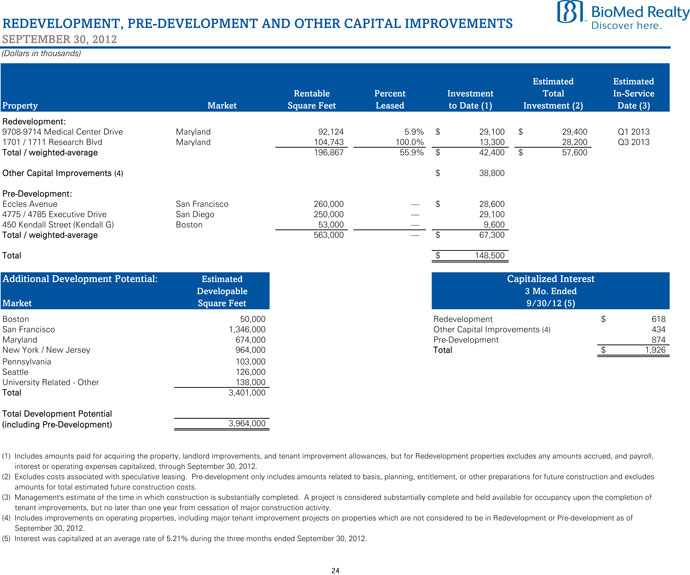
REDEVELOPMENT, PRE-DEVELOPMENT AND OTHER CAPITAL IMPROVEMENTS
SEPTEMBER 30, 2012
(Dollars in thousands)
Estimated Estimated
Rentable Percent Investment Total In-Service
Property Market Square Feet Leased to Date (1) Investment (2) Date (3)
Redevelopment:
9708-9714 Medical Center Drive Maryland 92,124 5.9% $ 29,100 $ 29,400 Q1 2013
1701 / 1711 Research Blvd Maryland 104,743 100.0% 13,300 28,200 Q3 2013
Total / weighted-average 196,867 55.9% $ 42,400 $ 57,600
Other Capital Improvements (4) $ 38,800
Pre-Development:
Eccles Avenue San Francisco 260,000 $ 28,600
4775 / 4785 Executive Drive San Diego 250,000 29,100
450 Kendall Street (Kendall G) Boston 53,000 9,600
Total / weighted-average 563,000 $ 67,300
Total $ 148,500
Additional Development Potential: Estimated
Developable
Market Square Feet
Boston 50,000
San Francisco 1,346,000
Maryland 674,000
New York / New Jersey 964,000
Pennsylvania 103,000
Seattle 126,000
University Related—Other 138,000
Total 3,401,000
Total Development Potential
(including Pre-Development) 3,964,000
Capitalized Interest
9/30/12 (5)
Redevelopment $ 618
Other Capital Improvements (4) 434
Pre-Development 874
Total $ 1,926
(1) Includes amounts paid for acquiring the property, landlord improvements, and tenant improvement allowances, but for Redevelopment properties excludes any amounts accrued, and payroll, interest or operating expenses capitalized, through September 30, 2012.
(2) Excludes costs associated with speculative leasing. Pre-development only includes amounts related to basis, planning, entitlement, or other preparations for future construction and excludes amounts for total estimated future construction costs.
(3) Management’s estimate of the time in which construction is substantially completed. A project is considered substantially complete and held available for occupancy upon the completion of tenant improvements, but no later than one year from cessation of major construction activity.
(4) Includes improvements on operating properties, including major tenant improvement projects on properties which are not considered to be in Redevelopment or Pre-development as of September 30, 2012.
(5) | | Interest was capitalized at an average rate of 5.21% during the three months ended September 30, 2012. |
24
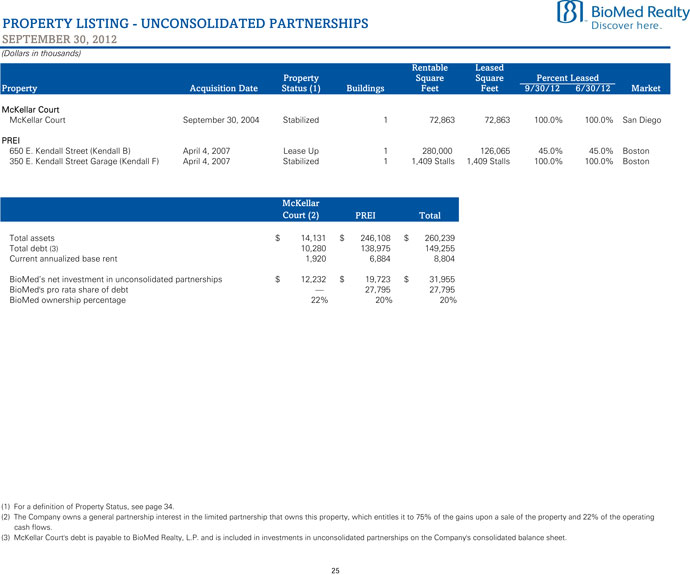
PROPERTY LISTING—UNCONSOLIDATED PARTNERSHIPS
SEPTEMBER 30, 2012
(Dollars in thousands)
Rentable Leased
Property Square Square Percent Leased
Property Acquisition Date Status (1) Buildings Feet Feet 9/30/12 6/30/12 Market
McKellar Court
McKellar Court September 30, 2004 Stabilized 1 72,863 72,863 100.0% 100.0% San Diego
PREI
650 E. Kendall Street (Kendall B) April 4, 2007 Lease Up 1 280,000 126,065 45.0% 45.0% Boston
350 E. Kendall Street Garage (Kendall F) April 4, 2007 Stabilized 1 1,409 Stalls 1,409 Stalls 100.0% 100.0% Boston
McKellar
Court (2) PREI Total
Total assets $ 14,131 $ 246,108 $ 260,239
Total debt (3) 10,280 138,975 149,255
Current annualized base rent 1,920 6,884 8,804
BioMed’s net investment in unconsolidated $ 12,232 $ partnerships 19,723 $ 31,955
BioMed’s pro rata share of debt 27,795 27,795
BioMed ownership percentage 22% 20% 20%
(1) | | For a definition of Property Status, see page 34. |
(2) The Company owns a general partnership interest in the limited partnership that owns this property, which entitles it to 75% of the gains upon a sale of the property and 22% of the operating cash flows.
(3) McKellar Court’s debt is payable to BioMed Realty, L.P. and is included in investments in unconsolidated partnerships on the Company’s consolidated balance sheet.
25
LEASE EXPIRATIONS
SEPTEMBER 30, 2012
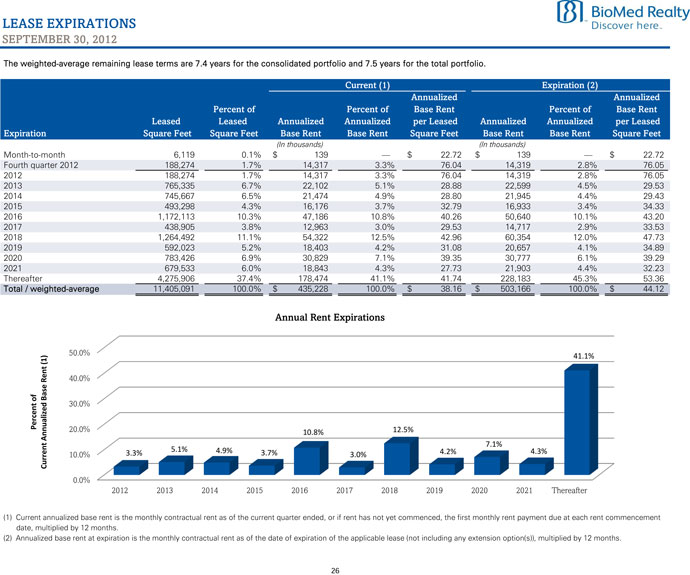
The weighted-average remaining lease terms are 7.4 years for the consolidated portfolio and 7.5 years for the total portfolio.
Current (1) Expiration (2)
Annualized Annualized
Percent of Percent of Base Rent Percent of Base Rent
Leased Leased Annualized Annualized per Leased Annualized Annualized per Leased
Expiration Square Feet Square Feet Base Rent Base Rent Square Feet Base Rent Base Rent Square Feet
(In thousands) (In thousands)
Month-to-month 6,119 0.1% $ 139 $ 22.72 $ 139 $ 22.72
Fourth quarter 2012 188,274 1.7% 14,317 3.3% 76.04 14,319 2.8% 76.05
2012 188,274 1.7% 14,317 3.3% 76.04 14,319 2.8% 76.05
2013 765,335 6.7% 22,102 5.1% 28.88 22,599 4.5% 29.53
2014 745,667 6.5% 21,474 4.9% 28.80 21,945 4.4% 29.43
2015 493,298 4.3% 16,176 3.7% 32.79 16,933 3.4% 34.33
2016 1,172,113 10.3% 47,186 10.8% 40.26 50,640 10.1% 43.20
2017 438,905 3.8% 12,963 3.0% 29.53 14,717 2.9% 33.53
2018 1,264,492 11.1% 54,322 12.5% 42.96 60,354 12.0% 47.73
2019 592,023 5.2% 18,403 4.2% 31.08 20,657 4.1% 34.89
2020 783,426 6.9% 30,829 7.1% 39.35 30,777 6.1% 39.29
2021 679,533 6.0% 18,843 4.3% 27.73 21,903 4.4% 32.23
Thereafter 4,275,906 37.4% 178,474 41.1% 41.74 228,183 45.3% 53.36
Total / weighted-average 11,405,091 100.0% $ 435,228 100.0% $ 38.16 $ 503,166 100.0% $ 44.12
Annual Rent Expirations
50.0% 41.1%
40.0%
30.0%
20.0% 10.8% 12.5%
7.1%
5.1% 4.9% 4.2% 4.3%
10.0% 3.3% 3.7% 3.0%
0.0%
2012 2013 2014 2015 2016 2017 2018 2019 2020 2021 Thereafter
(1) Current annualized base rent is the monthly contractual rent as of the current quarter ended, or if rent has not yet commenced, the first monthly rent payment due at each rent commencement date, multiplied by 12 months.
(2) Annualized base rent at expiration is the monthly contractual rent as of the date of expiration of the applicable lease (not including any extension option(s)), multiplied by 12 months.
26
EXPIRATIONS BY MARKET
SEPTEMBER 30, 2012
Leased Square Feet
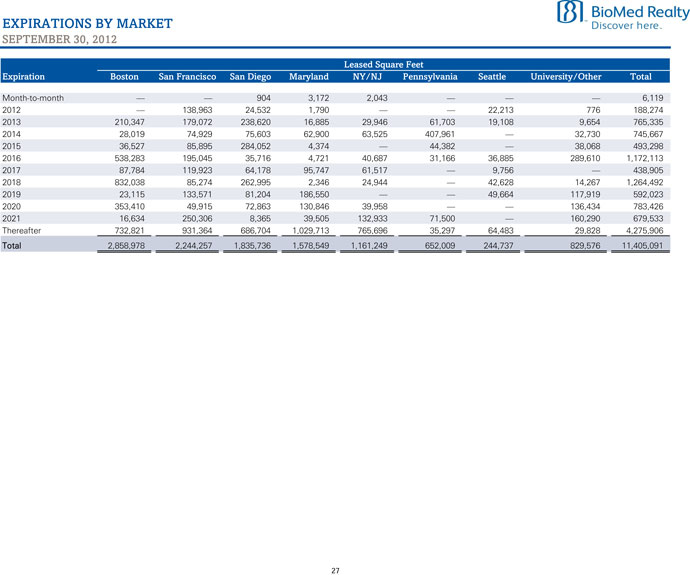
Expiration Boston San Francisco San Diego Maryland NY/NJ Pennsylvania Seattle University/Other Total
Month-to-month 904 3,172 2,043 6,119
2012 138,963 24,532 1,790 22,213 776 188,274
2013 210,347 179,072 238,620 16,885 29,946 61,703 19,108 9,654 765,335
2014 28,019 74,929 75,603 62,900 63,525 407,961 32,730 745,667
2015 36,527 85,895 284,052 4,374 44,382 38,068 493,298
2016 538,283 195,045 35,716 4,721 40,687 31,166 36,885 289,610 1,172,113
2017 87,784 119,923 64,178 95,747 61,517 9,756 438,905
2018 832,038 85,274 262,995 2,346 24,944 42,628 14,267 1,264,492
2019 23,115 133,571 81,204 186,550 49,664 117,919 592,023
2020 353,410 49,915 72,863 130,846 39,958 136,434 783,426
2021 16,634 250,306 8,365 39,505 132,933 71,500 160,290 679,533
Thereafter 732,821 931,364 686,704 1,029,713 765,696 35,297 64,483 29,828 4,275,906
Total 2,858,978 2,244,257 1,835,736 1,578,549 1,161,249 652,009 244,737 829,576 11,405,091
27
10 LARGEST TENANTS
SEPTEMBER 30, 2012
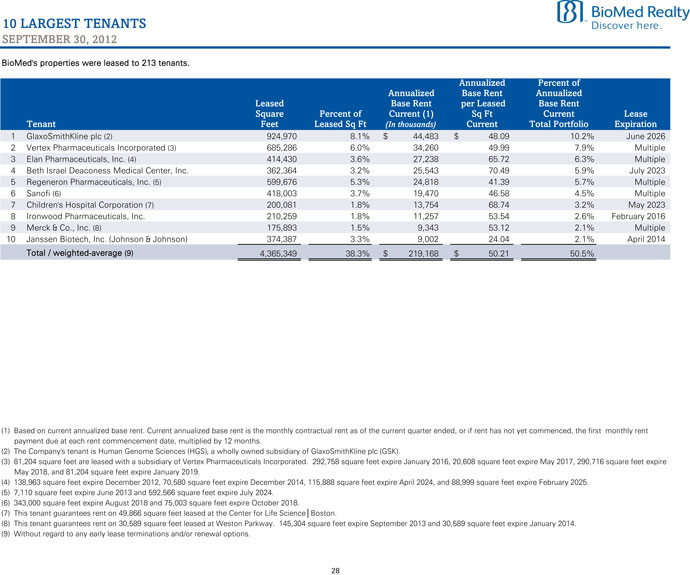
BioMed’s properties were leased to 213 tenants.
Annualized Percent of
Annualized Base Rent Annualized
Leased Base Rent per Leased Base Rent
Square Percent of Current (1) Sq Ft Current Lease
Tenant Feet Leased Sq Ft (In thousands) Current Total Portfolio Expiration
1 | | GlaxoSmithKline plc (2) 924,970 8.1% $ 44,483 $ 48.09 10.2% June 2026 |
2 | | Vertex Pharmaceuticals Incorporated (3) 685,286 6.0% 34,260 49.99 7.9% Multiple |
3 | | Elan Pharmaceuticals, Inc. (4) 414,430 3.6% 27,238 65.72 6.3% Multiple |
4 | | Beth Israel Deaconess Medical Center, Inc. 362,364 3.2% 25,543 70.49 5.9% July 2023 |
5 | | Regeneron Pharmaceuticals, Inc. (5) 599,676 5.3% 24,818 41.39 5.7% Multiple |
6 | | Sanofi (6) 418,003 3.7% 19,470 46.58 4.5% Multiple |
7 | | Children’s Hospital Corporation (7) 200,081 1.8% 13,754 68.74 3.2% May 2023 |
8 | | Ironwood Pharmaceuticals, Inc. 210,259 1.8% 11,257 53.54 2.6% February 2016 |
9 Merck & Co., Inc. (8) 175,893 1.5% 9,343 53.12 2.1% Multiple
10 Janssen Biotech, Inc. (Johnson & Johnson) 374,387 3.3% 9,002 24.04 2.1% April 2014
Total / weighted-average (9) 4,365,349 38.3% $ 219,168 $ 50.21 50.5%
(1) Based on current annualized base rent. Current annualized base rent is the monthly contractual rent as of the current quarter ended, or if rent has not yet commenced, the first monthly rent payment due at each rent commencement date, multiplied by 12 months.
(2) | | The Company’s tenant is Human Genome Sciences (HGS), a wholly owned subsidiary of GlaxoSmithKline plc (GSK). |
(3) 81,204 square feet are leased with a subsidiary of Vertex Pharmaceuticals Incorporated. 292,758 square feet expire January 2016, 20,608 square feet expire May 2017, 290,716 square feet expire May 2018, and 81,204 square feet expire January 2019.
(4) 138,963 square feet expire December 2012, 70,580 square feet expire December 2014, 115,888 square feet expire April 2024, and 88,999 square feet expire February 2025. (5) 7,110 square feet expire June 2013 and 592,566 square feet expire July 2024.
(6) | | 343,000 square feet expire August 2018 and 75,003 square feet expire October 2018. |
(7) | | This tenant guarantees rent on 49,866 square feet leased at the Center for Life Science? Boston. |
(8) This tenant guarantees rent on 30,589 square feet leased at Weston Parkway. 145,304 square feet expire September 2013 and 30,589 square feet expire January 2014. (9) Without regard to any early lease terminations and/or renewal options.
28
SAME PROPERTY ANALYSIS
SEPTEMBER 30, 2012
(Dollars in thousands)
Three Months Ended
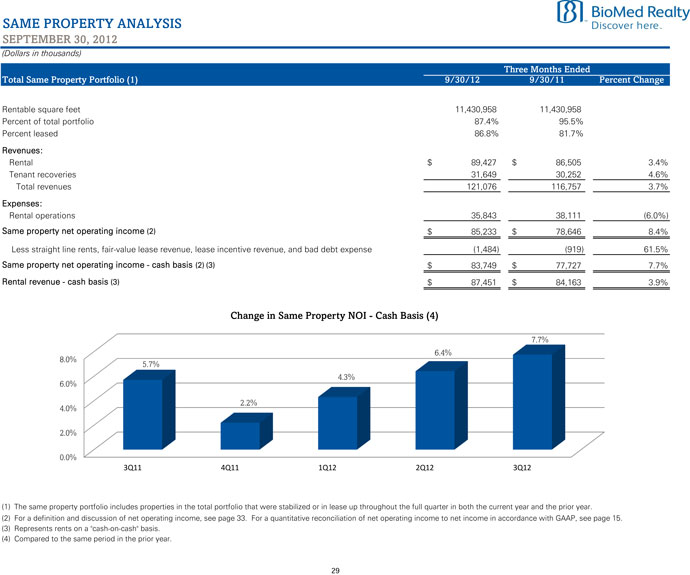
Total Same Property Portfolio (1) 9/30/12 9/30/11 Percent Change
Rentable square feet 11,430,958 11,430,958
Percent of total portfolio 87.4% 95.5%
Percent leased 86.8% 81.7%
Revenues:
Rental $ 89,427 $ 86,505 3.4%
Tenant recoveries 31,649 30,252 4.6%
Total revenues 121,076 116,757 3.7%
Expenses:
Rental operations 35,843 38,111 (6.0%)
Same property net operating income (2) $ 85,233 $ 78,646 8.4%
Less straight line rents, fair-value lease revenue, lease incentive revenue, and bad debt expense (1,484) (919) 61.5%
Same property net operating income—cash basis (2) (3) $ 83,749 $ 77,727 7.7%
Rental revenue—cash basis (3) $ 87,451 $ 84,163 3.9%
Change in Same Property NOI—Cash Basis (4)
7.7%
6.4%
8.0%
5.7%
4.3%
6.0%
2.2%
4.0%
2.0%
0.0%
3Q11 4Q11 1Q12 2Q12 3Q12
(1) The same property portfolio includes properties in the total portfolio that were stabilized or in lease up throughout the full quarter in both the current year and the prior year.
(2) For a definition and discussion of net operating income, see page 33. For a quantitative reconciliation of net operating income to net income in accordance with GAAP, see page 15. (3) Represents rents on a “cash-on-cash” basis.
(4) | | Compared to the same period in the prior year. |
29
ACQUISITIONS / DISPOSITIONS
SEPTEMBER 30, 2012
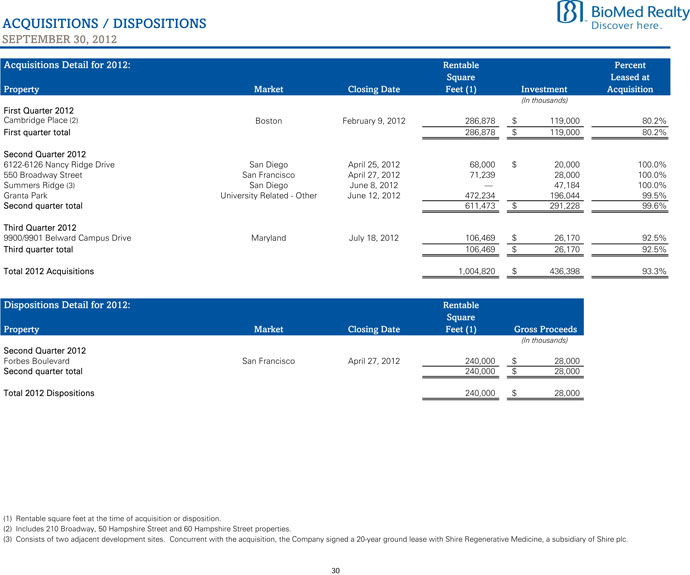
Acquisitions Detail for 2012: Rentable Percent
Square Leased at
Property Market Closing Date Feet (1) Investment Acquisition
(In thousands)
First Quarter 2012
Cambridge Place (2) Boston February 9, 2012 286,878 $ 119,000 80.2%
First quarter total 286,878 $ 119,000 80.2%
Second Quarter 2012
6122-6126 Nancy Ridge Drive San Diego April 25, 2012 68,000 $ 20,000 100.0%
550 Broadway Street San Francisco April 27, 2012 71,239 28,000 100.0%
Summers Ridge (3) San Diego June 8, 2012 47,184 100.0%
Granta Park University Related—Other June 12, 2012 472,234 196,044 99.5%
Second quarter total 611,473 $ 291,228 99.6%
Third Quarter 2012
9900/9901 Belward Campus Drive Maryland July 18, 2012 106,469 $ 26,170 92.5%
Third quarter total 106,469 $ 26,170 92.5%
Total 2012 Acquisitions 1,004,820 $ 436,398 93.3%
Dispositions Detail for 2012: Rentable
Square
Property Market Closing Date Feet (1) Gross Proceeds
(In thousands)
Second Quarter 2012
Forbes Boulevard San Francisco April 27, 2012 240,000 $ 28,000
Second quarter total 240,000 $ 28,000
Total 2012 Dispositions 240,000 $ 28,000
(1) | | Rentable square feet at the time of acquisition or disposition. |
(2) | | Includes 210 Broadway, 50 Hampshire Street and 60 Hampshire Street properties. |
(3) Consists of two adjacent development sites. Concurrent with the acquisition, the Company signed a 20-year ground lease with Shire Regenerative Medicine, a subsidiary of Shire plc.
30

LEASING ACTIVITY (1)
SEPTEMBER 30, 2012
Current Current
Leased Annualized Pre-Leased Annualized
Square Base Rent per Square Base Rent per
Feet Leased Sq Ft Feet Pre-Leased Sq Ft
Leased Square Feet as of June 30, 2012 11,191,164 79,876
Acquisitions 98,434 $ 27.40
Expirations (276,178) 32.75
Pre-leased delivery 33,169 31.13 (33,169) $ 31.13
Renewals, amendments, and extensions 176,655 25.57
New leases—1st generation (2) 92,280 29.46 8,712
New leases—2nd generation (2) 89,567 44.16 146 56.00
Leased Square Feet as of September 30, 2012 11,405,091 55,565
Three Months Ended
9/30/12 6/30/12 3/31/12 12/31/11 9/30/11
New leases 190,705 263,432 395,365 141,147 232,462
Renewals, amendments, and extensions 176,655 87,383 70,894 112,795 94,506
Gross Leasing Activity 367,360 350,815 466,259 253,942 326,968
Net Absorption 115,493 186,911 210,313 66,673 2,316
Gross Leasing Activity
600,000
466,259
500,000
367,360
350,815
326,968
400,000
253,942
300,000
200,000
100,000
3Q11 4Q11 1Q12 2Q12 3Q12&p
Net Absorption
210,313
186,911
115,493
66,673
2,316
3Q11 4Q11 1Q12 2Q12 3Q12
&p(1) Leasing activity for leases signed during the periods presented, which may be different than the period of actual occupancy. (2) For definitions of first and second generation leases, see page 34.
31
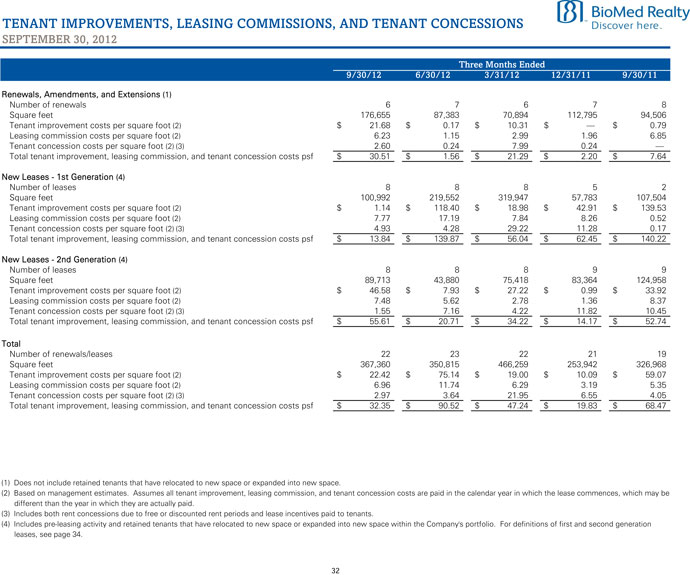
TENANT IMPROVEMENTS, LEASING COMMISSIONS, AND TENANT CONCESSIONS
SEPTEMBER 30, 2012&p
Three Months Ended
9/30/12 6/30/12 3/31/12 12/31/11 9/30/11
Renewals, Amendments, and Extensions (1)
Number of renewals 6 7 6 7 8
Square feet 176,655 87,383 70,894 112,795 94,506
Tenant improvement costs per square foot (2) $ 21.68 $ 0.17 $ 10.31 $ $ 0.79
Leasing commission costs per square foot (2) 6.23 1.15 2.99 1.96 6.85
Tenant concession costs per square foot (2) (3) 2.60 0.24 7.99 0.24
Total tenant improvement, leasing commission, and tenant concession costs psf $ 30.51 $ 1.56 $ 21.29 $ 2.20 $ 7.64
New Leases—1st Generation (4)
Number of leases 8 8 8 5 2
Square feet 100,992 219,552 319,947 57,783 107,504
Tenant improvement costs per square foot (2) $ 1.14 $ 118.40 $ 18.98 $ 42.91 $ 139.53
Leasing commission costs per square foot (2) 7.77 17.19 7.84 8.26 0.52
Tenant concession costs per square foot (2) (3) 4.93 4.28 29.22 11.28 0.17
Total tenant improvement, leasing commission, and tenant concession costs psf $ 13.84 $ 139.87 $ 56.04 $ 62.45 $ 140.22
New Leases—2nd Generation (4)
Number of leases 8 8 8 9 9
Square feet 89,713 43,880 75,418 83,364 124,958
Tenant improvement costs per square foot (2) $ 46.58 $ 7.93 $ 27.22 $ 0.99 $ 33.92
Leasing commission costs per square foot (2) 7.48 5.62 2.78 1.36 8.37
Tenant concession costs per square foot (2) (3) 1.55 7.16 4.22 11.82 10.45
Total tenant improvement, leasing commission, and tenant concession costs psf $ 55.61 $ 20.71 $ 34.22 $ 14.17 $ 52.74
Total
Number of renewals/leases 22 23 22 21 19
Square feet 367,360 350,815 466,259 253,942 326,968
Tenant improvement costs per square foot (2) $ 22.42 $ 75.14 $ 19.00 $ 10.09 $ 59.07
Leasing commission costs per square foot (2) 6.96 11.74 6.29 3.19 5.35
Tenant concession costs per square foot (2) (3) 2.97 3.64 21.95 6.55 4.05
Total tenant improvement, leasing commission, and tenant concession costs psf $ 32.35 $ 90.52 $ 47.24 $ 19.83 $ 68.47
(1) | | Does not include retained tenants that have relocated to new space or expanded into new space. |
(2) Based on management estimates. Assumes all tenant improvement, leasing commission, and tenant concession costs are paid in the calendar year in which the lease commences, which may be different than the year in which they are actually paid.
(3) | | Includes both rent concessions due to free or discounted rent periods and lease incentives paid to tenants. |
(4) Includes pre-leasing activity and retained tenants that have relocated to new space or expanded into new space within the Company’s portfolio. For definitions of first and second generation leases, see page 34.
32
NON-GAAP FINANCIAL MEASURE DEFINITIONS
SEPTEMBER 30, 2012
This document includes certain non-GAAP financial measures that management believes are helpful in understanding our business, as further described below. Our definition and calculation of non-GAAP financial measures may differ from those of other REITs, and therefore, may not be comparable. The non-GAAP measures should not be considered an alternative to net income as an indicator of our performance and should be considered only a supplement to cash flows from operating, investing or financing activities as a measure of liquidity, computed in accordance with GAAP.
Funds from Operations (FFO), Core Funds from Operations (CFFO), and Adjusted Funds from Operations (AFFO)
We present funds from operations, or FFO, core funds from operations, or CFFO, and adjusted funds from operations, or AFFO, available to common shares and partnership and LTIP units because we consider them important supplemental measures of our operating performance and believe they are frequently used by securities analysts, investors and other interested parties in the evaluation of REITs, many of which present FFO, CFFO, and AFFO when reporting their results.
FFO is intended to exclude GAAP historical cost depreciation and amortization of real estate and related assets, which assumes that the value of real estate assets diminishes ratably over time. Historically, however, real estate values have risen or fallen with market conditions. Because FFO excludes depreciation and amortization unique to real estate, gains and losses from property dispositions and extraordinary items, it provides a performance measure that, when compared year over year, reflects the impact to operations from trends in occupancy rates, rental rates, operating costs, development activities and interest costs, providing perspective not immediately apparent from net income. We compute FFO in accordance with standards established by the Board of Governors of the National Association of Real Estate Investment Trusts, or NAREIT. As defined by NAREIT, FFO represents net income (computed in accordance with GAAP), excluding gains (or losses) from sales of property, impairment charges on depreciable real estate, real estate related depreciation and amortization (excluding amortization of loan origination costs) and after adjustments for unconsolidated partnerships and joint ventures.
We calculate CFFO by adding acquisition-related expenses to FFO. We calculate AFFO by adding to CFFO: (a) non-cash revenues and expenses, (b) recurring capital expenditures and second generation tenant improvements, and (c) leasing commissions.
Our computation of FFO, CFFO and AFFO may differ from the methodology for calculating FFO, CFFO and AFFO utilized by other equity REITs and, accordingly, may not be comparable to such other REITs. Further, FFO, CFFO and AFFO do not represent amounts available for
management’s discretionary use because of needed capital replacement or expansion, debt service obligations, or other commitments and uncertainties. FFO, CFFO and AFFO should not be considered as an alternative to net income (loss) (computed in accordance with GAAP) as an indicator of our financial performance or to cash flow from operating activities (computed in accordance with GAAP) as an indicator of our liquidity, nor is it indicative of funds available to fund our cash needs, including our ability to pay dividends or make distributions. FFO, CFFO and AFFO should be considered only as supplements to net income computed in accordance with GAAP as measures of our operations.
Earnings before Interest, Taxes, Depreciation and Amortization (EBITDA) and Adjusted EBITDA
EBITDA is defined as earnings before interest, taxes, depreciation and amortization. We calculate adjusted EBITDA by adding to EBITDA: (a) noncontrolling interests in our operating partnership, (b) impairments, (c) dividends payable on and cost on redemption of our series A preferred stock, (d) non-cash adjustments for marketable securities, (e) gains or losses from sales of real estate, and (f) acquisition-related expenses. Management uses EBITDA and adjusted EBITDA as indicators of our ability to incur and service debt. In addition, we consider EBITDA and adjusted EBITDA to be appropriate supplemental measures of our performance because they eliminate depreciation and interest, which permits investors to view income from operations without the impact of non-cash depreciation or the cost of debt. However, because EBITDA and adjusted EBITDA are calculated before recurring cash charges including interest expense and taxes, and are not adjusted for capital expenditures or other recurring cash requirements of our business, their utility is limited.
Coverage Ratios
We present interest and fixed charge ratios as supplemental liquidity measures. Management uses these ratios as indicators of our financial flexibility to service current interest expense and debt amortization from current cash net operating income. In addition, we believe that these coverage ratios represent common metrics used by securities analysts, investors and other interested parties to evaluate our ability to service fixed cash payments. However, because these ratios are derived from adjusted EBITDA, their utility is limited by the same factors that limit the usefulness of adjusted EBITDA as a liquidity measure.
Net Operating Income (NOI)
We use net operating income, or NOI, as a performance measure and believe NOI provides useful information to investors regarding our financial condition and results of operations because it reflects only those income and expense items that are incurred at the property level. We compute NOI by adding or subtracting certain items from net income, noncontrolling interest in the operating partnership, gains/losses from investment in unconsolidated partnerships, interest expense, interest income, depreciation and amortization, and general and
administrative expenses. NOI presented by us may not be comparable to NOI reported by other REITs that define NOI differently. NOI should not be considered as an alternative to net income as an indication of our performance or to cash flows as a measure of liquidity or ability to make distributions.
33
DEFINITIONS
SEPTEMBER 30, 2012
Property Status Stabilized
Represents operating properties that are more than 90% leased.
Lease up
Represents operating properties that are less than 90% leased.
Redevelopment
Represents properties that we are currently preparing for their intended use, and accordingly are capitalizing interest and other costs as of the end of the quarter.
Pre-development
Represents development properties that are engaged in activities related to planning, entitlement, or other preparations for future construction.
Development
Represents properties that we are currently developing through ground up construction.
Development Potential
Represents estimates of the additional rentable square footage that we could put into service if management made the strategic election to pursue additional development.
Lease Type First Generation
Leases on space which, in management’s evaluation, require significant improvements to prepare or condition the premises for its intended purpose or enhance the value of the property. This generally includes capital expenditures for development, redevelopment or repositioning a property.
Second Generation
Leases which are not considered by management to be first generation leases.
Recurring Capital Expenditures
Recurring capital expenditures exclude (1) capital improvements that were taken into consideration when underwriting the purchase of a building, (2) items associated with the expansion of a building or its improvements, (3) renovations to a building which change the underlying classification of the building, incurred to prepare or condition the premises for its intended purpose (for example, from office to laboratory) or (4) capital improvements that represent an addition to the property rather than the replacement of property, plant, or equipment.
34