UNITED STATES
SECURITIES AND EXCHANGE COMMISSION
Washington D.C. 20549
FORM 10-K
ý | ANNUAL REPORT PURSUANT TO SECTION 13 OR 15(d) OF THE SECURITIES EXCHANGE ACT OF 1934 |
FOR THE FISCAL YEAR ENDED DECEMBER 31, 2005
OR
o | TRANSITION REPORT PURSUANT TO SECTION 13 OR 15(d) OF THE SECURITIES EXCHANGE ACT OF 1934 |
For the transition period from to
Commission File Number: 000-51280
MORNINGSTAR, INC.
(Exact Name of Registrant as Specified in its Charter)
Illinois | | 36-3297908 |
(State or Other Jurisdiction of
Incorporation or Organization) | | (I.R.S. Employer
Identification Number) |
225 West Wacker Drive
Chicago, Illinois
60606-6303
(Address of Principal Executive Offices)
(312) 696-6000
(Registrant’s Telephone Number, Including Area Code)
Securities registered pursuant to Section 12(b) of the Act:
None
Securities registered pursuant to Section 12(g) of the Act:
Common stock, no par value
Indicate by check mark if the Registrant is a well-known seasoned issuer, as defined in Rule 405 of the Securities Act. Yes o No ý
Indicate by check mark if the Registrant is not required to file reports pursuant to Section 13 or Section 15(d) of the Act. Yes o No ý
Indicate by check mark whether the Registrant (1) has filed all reports required to be filed by Section 13 or 15(d) of the Securities Exchange Act of 1934 during the preceding 12 months (or for such shorter period that the Registrant was required to file such reports), and (2) has been subject to such filing requirements for the past 90 days. Yes ý No o
Indicate by check mark if disclosure of delinquent filers pursuant to Item 405 of Regulation S-K is not contained herein, and will not be contained, to the best of Registrant’s knowledge, in definitive proxy or information statements incorporated by reference in Part III of this Form 10-K or any amendment to this Form 10-K. o
Indicate by check mark whether the Registrant is a large accelerated filer, accelerated filer, or a non-accelerated filer. See definition of “accelerated filer and large accelerated filer in Rule 12b-2 of the Exchange Act.
Large accelerated filer | o | | | Accelerated filer o | | Non-accelerated filer ý |
Indicate by check mark whether the Registrant is a shell company (as defined in Rule 12b-2 of the Exchange Act). Yes o No ý
The aggregate market value of shares of common stock held by non-affiliates of the Registrant as of June 30, 2005 was $255,104,055.
As of March 2, 2006, there were 40,371,921 shares of the Registrant’s common stock, no par value, outstanding.
DOCUMENTS INCORPORATED BY REFERENCE
Certain parts of the Registrant’s Definitive Proxy Statement for the 2006 Annual Meeting of Shareholders are incorporated into Part III of this Form 10-K.
Part I
Item 1. Business
We are a leading provider of independent investment research to investors around the world. Since our founding in 1984, our mission has been to create great products that help investors reach their financial goals. We offer an extensive line of Internet, software, and print-based products for individual investors, financial advisors, and institutional clients. We also provide asset management services to advisors and institutions. In addition to our U.S.-based products and services, we offer local versions of our products designed for investors in Asia, Australia, Canada, and Europe. We serve more than 4.9 million individual investors, 185,000 financial advisors, and 750 institutional clients. We have operations in 12 countries and hold minority ownership positions in companies located in four other countries.
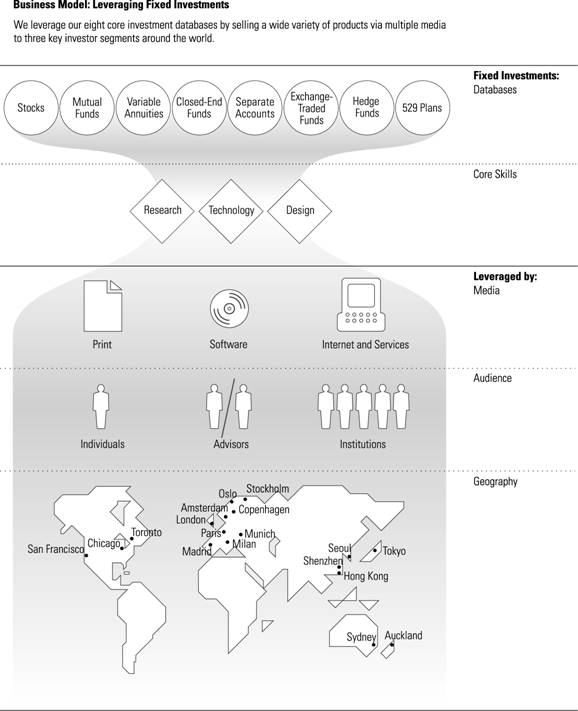
We maintain a series of comprehensive databases on eight key types of investments that are widely used by investors both in the United States and in non-U.S. markets. After establishing these databases, we add additional value and insight to the raw data by investing in our core skills of research, technology, and design. As of December 31, 2005, we provided extensive data on more than:
• 17,800 mutual fund share classes in the United States;
• 43,000 mutual funds and similar vehicles in international markets;
• 7,100 stocks;
• 2,600 hedge funds;
• 4,800 separate accounts;
• 50,200 variable annuity/life subaccounts;
• 200 exchange-traded funds;
• 600 closed-end funds; and
• 80 state-sponsored college savings plans (commonly known as Section 529 College Savings Plans).
Morningstar’s business model is based on leveraging our investments in the databases we maintain, as well as our core skills of research, technology, and design. We leverage these investments by selling a wide variety of products via multiple media to three key market segments around the world.
2
3
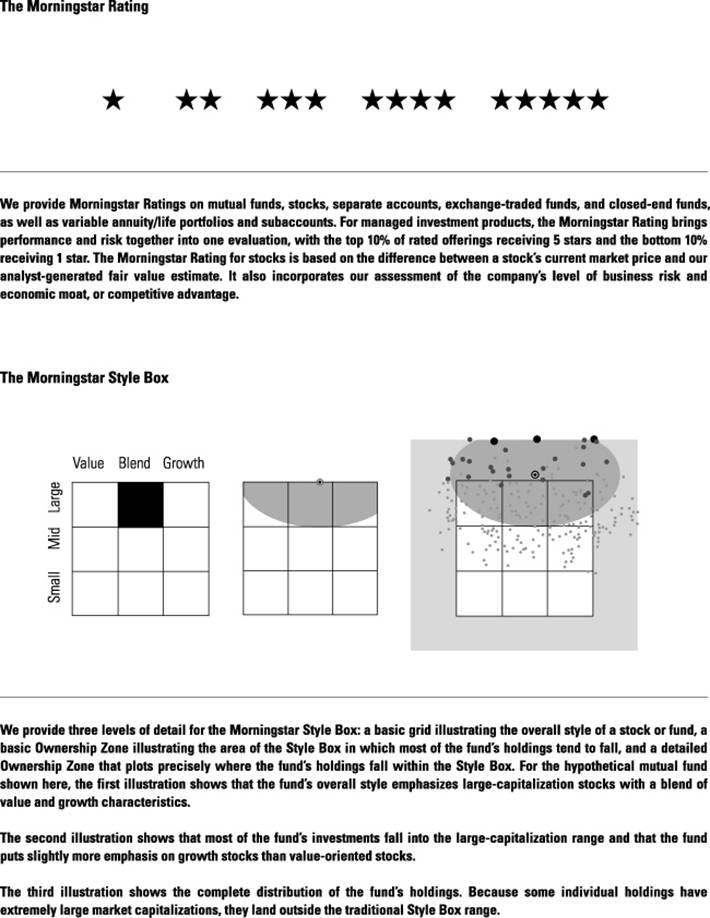
Our data and proprietary analytical tools such as the Morningstar Rating for mutual funds, which rates past performance based on risk- and cost-adjusted returns, and the Morningstar Style Box, which provides a visual summary of a mutual fund’s underlying investment style, have become important tools that millions of investors and advisors use in making investment decisions. We’ve created other tools such as the Ownership Zones, Sector Deltas, and Market Barometer, which allow investors to see how different investments work together to form a portfolio and to track its progress. We developed a Portfolio X-Ray tool that helps investors reduce risk and understand the key characteristics of their portfolios based on nine different factors.
More recently, we’ve expanded our research efforts to individual stocks and have worked to popularize the concepts of economic moat and margin of safety. The Morningstar Rating for stocks is based on our analyst-generated fair value estimates, as well as the company’s level of business risk and economic moat, or competitive advantage. We offer a variety of qualitative measures such as Stewardship Grades, which help investors identify stocks and funds that have demonstrated a high level of commitment to shareholders and stewardship of investors’ capital.
We’ve also developed in-depth advice on security selection and portfolio building to meet the needs of investors looking for integrated portfolio solutions. We believe many investors rely on these tools because they offer a useful framework for comparing potential investments and making decisions. Our independence and our history of innovation also make us a trusted resource for investors.
4
5
Growth Strategies
We operate our business in three global segments—Individual, Advisor, and Institutional. Our mission is to create great products that help investors reach their financial goals, and this mission guides all of our operations and product offerings. In keeping with our mission, we are pursuing four key growth strategies, which we describe below. We review our growth strategies on a regular basis and make refinements as necessary to guide our business. Since becoming a public company, we no longer consider strategic acquisitions to be a core growth strategy because we only expect to make acquisitions in support of our other objectives. And, we have added a new growth strategy of becoming a global leader in funds-of-funds investment management, as described in greater detail below.
Enhance our position in each of our three market segments by focusing on our four major Internet-based platforms.
We believe that individual investors, financial advisors, and institutional clients increasingly want integrated solutions as opposed to having to use different research tools for different parts of their portfolios. To help meet the market need for integrated solutions, one of our key strategies is to focus our product offerings on four of our major platforms:
• Morningstar.com for individual investors;
• Morningstar Advisor Workstation for financial advisors;
• Morningstar Direct for institutional investment research professionals; and
• Morningstar Retirement Manager for the retirement market.
These products all include integrated research and portfolio tools, allowing investors to use our proprietary information and advice across multiple security types. We believe we can achieve deeper penetration of our current audiences with each of these platforms, as well as extend their reach to new segments. With Morningstar.com, we’re focusing on expanding beyond our core audience of mutual fund investors by adding more stock investors and continuing to expand our reach with our core audience of experienced and engaged investors. With Advisor Workstation, we’re adding functionality that will help us reach more advisors in the United States and globally. With Morningstar Direct, we’re focusing on expanding functionality and reaching a broader audience. For the Retirement Manager platform, we’re focusing on our managed account offering as more plan providers have been adopting managed accounts. We recently added Advice by Ibbotson to our retirement advice platform following our recent acquisition of Ibbotson Associates.
Become a global leader in funds-of-funds investment management.
The large number of managed investment products available has made assembling them into well-constructed portfolios a difficult task for many investors. Consequently, funds-of-funds offerings have seen strong growth within the mutual fund, variable annuity, and hedge fund industries. We believe assembling and evaluating funds of funds is a natural extension of our expertise in understanding managed investment products.
Our investment management programs combine managed investment vehicles—typically mutual funds—in portfolios designed to help investors and financial advisors meet their specific financial goals. Morningstar Managed Portfolios, which we introduced in 2001, is a fee-based discretionary asset management service that includes a series of mutual fund and exchange-traded fund portfolios tailored to meet specific investment time horizons and risk levels. We also offer a managed account service as part of our Morningstar Retirement Manager platform for the retirement market, which we introduced in 2003. We offer these managed accounts for plan participants who choose to delegate management of their portfolios to Morningstar’s investment professionals, who select investment options and make retirement planning choices for the
6
participant. We believe that retirement plan participants will continue to adopt managed accounts because of the complexity involved in retirement planning.
In addition to the assets we manage directly, we had a total of $22.1 billion in assets under advisement in our Investment Consulting business as of December 31, 2005. This total includes consulting relationships as well as agreements where we act as a portfolio construction manager for a mutual fund or variable annuity and receive a basis point fee. We see continued potential to expand this part of our business, including in our operations outside the United States.
Expand the range of services we offer investors, financial advisors, and institutional clients.
We plan to expand our product offerings to better meet the needs of investors. We plan to continue building new databases for additional types of investment offerings, including hedge funds, various types of managed investment pools in international markets, and other widely used investment products. We expect to continue expanding our product offerings in two primary areas:
• Expand our stock-research capabilities. Our equity research builds on our approach to mutual fund analysis, which has historically focused on analyzing the individual stocks that make up each fund’s portfolio. In addition to the agreements we have in place with six major investment banks to provide research under the terms of the Global Analyst Research Settlement, we are continuing to pursue opportunities to distribute our equity research in the United States and in major international markets. We also believe that investors’ increasing awareness of the value of independent research will strengthen our business over the long term; and
• Expand our capabilities in hedge fund research. We plan to continue expanding our research and data on hedge funds to help investors analyze this alternative asset class, with the goal of making the hedge fund industry more transparent to investors. Hedge funds worldwide now represent more than $2 trillion in investor assets, according to the December 2005 Hedge Fund Manager/Advent survey of hedge fund administrators. Offering data on hedge funds is a natural extension of our work on other managed investment vehicles. We introduced our hedge fund database in early 2005 and now have comprehensive data on more than 2,600 hedge funds. We plan to add our hedge fund data to additional Morningstar products and begin offering analyst reports on hedge funds during 2006.
Expand our international brand presence, products, and services.
Over the past several years, we have expanded our product offerings internationally. Our international operations generated $29.4 million in revenue in 2005, compared with $25.4 million in 2004. We plan to continue expanding our international operations to meet the increasing demand for wide-ranging, independent investment insight by investors around the globe. Because approximately half of the world’s investable assets are located outside of the United States, we believe there are significant opportunities for us in non-U.S. markets.
Acquisitions
Historically, we have focused primarily on organic growth by introducing new products and services and expanding our marketing efforts for existing products. However, we have made and expect to continue making selective acquisitions that support our four key growth strategies. In reviewing potential acquisitions, we plan to focus on transactions that:
• offer a good strategic fit with our mission of creating great products that help investors reach their financial goals;
7
• help us build our proprietary investment databases, research capabilities, technical expertise, or customer base faster and more cost effectively than we could if we built them ourselves; and
• offer a good cultural fit with our entrepreneurial spirit and brand leadership.
Ibbotson Associates
On March 1, 2006, we completed our acquisition of Ibbotson Associates, a privately held firm specializing in asset allocation research and services, for approximately $83 million in cash, subject to adjustments for working capital and other items. Ibbotson had $37.2 million in revenue for its fiscal year ended June 30, 2005. Ibbotson’s key products and services include:
• a well-established investment consulting practice that provides asset allocation and fund research to institutions;
• a portfolio and asset management business that constructs actively managed funds-of-funds offerings for financial institutions;
• managed retirement accounts for participants in 401(k) and other defined contribution plans;
• the EnCorr software for investment management and strategic asset allocation;
• asset allocation, forecasting, and optimization software widely used in broker-dealer advisor platforms;
• a long-term database of capital markets returns;
• training and educational services; and
• the Stocks, Bonds, Bills, and Inflation annual reference guides.
We believe the Ibbotson acquisition complements our growth strategies in several key areas, including investment consulting, managed retirement accounts, and institutional and advisor software.
Variable Annuity Research and Data Service (VARDS)
In January 2005, we acquired the VARDS unit from Finetre Corporation for $8.2 million in cash. VARDS provides research and data on variable annuities and is used by many firms that offer variable annuities. The service is also used by many brokerage firms for research, due diligence, and suitability determination. We believe this acquisition strengthens our investment database and will enhance our efforts to provide investors with the information they need to make well-informed decisions when investing in variable annuities. The acquisition contributed approximately $2.4 million of revenue in 2005.
We have also made other acquisitions over the past several years. For more information, refer to Note 7 of the Notes to our Consolidated Financial Statements.
Business Segments, Products, and Services
We divide our business operations into three segments:
• Individual, which focuses on products and services for individual investors;
• Advisor, which focuses on products and services for financial advisors; and
• Institutional, which focuses on products and services for institutional clients, including banks, brokerage firms, insurance companies, mutual fund companies, media outlets, and retirement plan providers and sponsors.
8
The table below shows our revenue by business segment for each of the past three years:
| | 2005 | | | | 2004 | | | | 2003 | | | |
| | | | | | | | | | | | | |
Revenue by Segment | | $000 | | % | | $000 | | % | | $000 | | % | |
Individual | | $63,448 | | 27.9 | % | $46,996 | | 26.2 | % | $35,406 | | 25.4 | % |
Advisor | | 72,689 | | 32.0 | | 60,880 | | 33.9 | | 49,161 | | 35.2 | |
Institutional | | 95,947 | | 42.2 | | 78,402 | | 43.6 | | 59,745 | | 42.8 | |
Elimination of intersegment revenue | | (4,970 | ) | (2.1 | ) | (6,620 | ) | (3.7 | ) | (4,816 | ) | (3.4 | ) |
Consolidated revenue | | $227,114 | | 100.0 | % | $179,658 | | 100.0 | % | $139,496 | | 100.0 | % |
For information on segment operating income (loss), refer to Note 5 of the Notes to our Consolidated Financial Statements.
Individual Segment
For individual investors, our largest product is our U.S.-based Web site, Morningstar.com, which includes our Premium Membership service and Internet advertising sales. Morningstar is a leader in broad-based, innovative investment research, and Morningstar.com has consistently received positive reviews from major business publications such as Barron’s, Forbes, and The Wall Street Journal. Our Individual business segment also includes Morningstar Equity Research, which we distribute through several channels. Investors can access our equity research through our Premium Membership service on Morningstar.com. In addition, our independent equity research is currently distributed through six major investment banks to meet the requirement for independent research under the Global Analyst Research Settlement, as well as to several other companies who provide our research to their affiliated financial advisors or to individual investors. We also offer several print and online publications focusing on stocks, mutual funds, personal finance, and other investing topics. We offer free local Web sites for individual investors in Australia, Belgium, Canada, Denmark, Finland, France, Germany, Hong Kong, Italy, Japan, Korea, the Netherlands, New Zealand, Norway, People’s Republic of China, Spain, Sweden, Switzerland, and the United Kingdom. Our Web sites and individual investor publications reach more than 4.9 million investors worldwide.
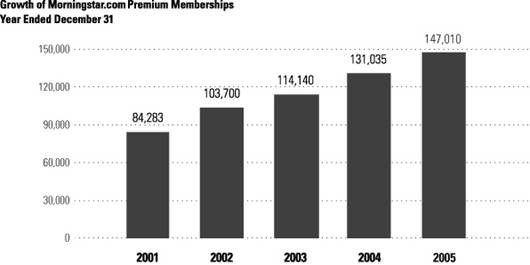
Within the Individual business segment, most of our products target experienced investors who are actively involved in the investing process and want to take charge of their own investment decisions. We also reach individuals who want to learn more about investing and investors who seek out third-party sources to validate the advice they receive from brokers or financial planners. Our client base in this segment consists of more than 230,000 paying customers, including 147,010 Premium members of Morningstar.com and 84,000 subscribers who purchase our investment newsletters designed for individual investors. In addition to this customer base, approximately 4,300 public and private libraries in the United States subscribe to our services. We also offer a series of books and workbooks about investing, as well as formatted printable reports on individual securities.
We promote our individual investor products primarily through traditional direct mail, e-mail, promotions on our 20 investor Web sites worldwide, public relations, and advertising on related Web sites.
Our strategy is to increase the number of investors who sign up for Morningstar.com Premium Membership by continuing to develop and promote Premium content such as analyst reports, Fund Analyst Picks and Pans, and value-added portfolio tools, which we market to registered users and other investors. As a core marketing strategy for Morningstar.com, we use search marketing, which includes working to optimize our site’s ranking in organic search results along with purchasing advertisements on third-party sites such as Yahoo! and Google based on investment-related key words that can bring interested investors to relevant content on Morningstar.com.
9
In our Individual business segment, we compete with the personal finance Web sites of AOL Money & Finance, CNN Money, MarketWatch, MSN Money, The Motley Fool, SmartMoney.com, The Street.com, The Wall Street Journal Online, and Yahoo! Finance. Our print publications compete with Agora Publishing, Forbes, The Motley Fool, Phillips Investment Resources, and Value Line.
We believe our Individual segment has a modest amount of seasonality. The first quarter tends to show more sales activity for Premium Membership on Morningstar.com and other products such as the Morningstar Stocks 500 and Morningstar Funds 500, which are reference guides that we publish once a year. Sales in our Individual segment tend to be slightly lower over the spring and summer months. However, the impact of this seasonality tends to be moderated by our diversified product base and the fact that we recognize revenue ratably over the term of each subscription.
Our largest customer in the Individual segment made up less than 10% of segment revenue in 2005.
Morningstar.com
Our largest Web site for individual investors is Morningstar.com in the United States. As of December 31, 2005, the free membership services offered through Morningstar.com had more than 4.6 million registered users worldwide, who have access to comprehensive data on individual stocks, mutual funds, and other investments to help them conduct research and track performance. In addition, Morningstar.com features extensive market data, Morningstar articles, proprietary portfolio tools, and educational content to help investors of all levels access timely, relevant investment information. Morningstar.com also includes Portfolio X-Ray, which helps investors reduce risk and understand key characteristics of their portfolios, and a variety of other portfolio tools.
We use our free content as a gateway into paid Premium Membership, which includes access to written analyst reports on more than 1,700 stocks, 2,000 mutual funds, and 100 exchange-traded funds, as well as Analyst Picks and Pans, Stewardship Grades, and Premium Stock and Fund Screeners. We currently offer Premium Membership services only in the United States.
In 2005, we launched the Morningstar Stewardship Grade for stocks on Morningstar.com to help individual investors evaluate a company’s financial transparency, shareholder friendliness, management incentives and ownership, and overall corporate stewardship of investors’ capital. The Morningstar Stewardship Grade for stocks follows a similar grading system for mutual funds that we introduced in 2004.
In 2005, we responded to greater investor demand for information on exchange-traded funds by expanding our coverage on these funds. Our analysts covered more than 100 exchange-traded funds as of December 31, 2005, compared with about 35 as of December 31, 2004. We introduced a new rating for exchange-traded funds in March 2006. To help draw investors deeper into Morningstar.com and highlight the full range of information available on the site, in 2005 we launched a new home page for free and registered users. The new home page highlights more of the most popular content on the site, including articles written by our analyst staff and links to our stock and fund data pages. We developed and introduced a similar home page for Premium members in early 2006.
As of December 31, 2005, we had 147,010 paid Premium subscribers for Morningstar.com in the United States. We currently charge $14.95 for a monthly subscription, $135 for an annual subscription, $225 for a two-year subscription, and $320 for a three-year subscription for Morningstar.com’s Premium service. We also sell advertising space on Morningstar.com.
Morningstar.com is one of our five largest products and was our largest product in the Individual segment in 2005. This product accounted for 11.2%, 11.5%, and 11.7% of our consolidated revenue in 2005, 2004, and 2003, respectively.
10
Morningstar Equity Research
As of December 31, 2005, we offered independent equity research on more than 1,700 companies. Our approach to stock analysis focuses on long-term fundamentals. Our analysts evaluate companies by assessing each firm’s competitive advantage, analyzing the level of business risk, and completing an in-depth projection of future cash flows. For the companies we cover, we create an analyst-generated fair value estimate, a Morningstar Rating for stocks, a rating for business risk, and an assessment of the company’s economic moat. Economic moat is a concept originally developed by Warren Buffett that describes a company’s competitive advantage relative to other companies. For the remaining 5,400 stocks included in our database, we offer quantitatively generated grades for growth, profitability, and financial health, as well as descriptive text that explains the company’s business operations. We currently deliver our equity research to individual investors as part of our Premium Membership service on Morningstar.com and to six major investment banks under the terms of the Global Analyst Research Settlement, as well as to several other companies who provide our research to their affiliated financial advisors or to individual investors.
We have significantly expanded our equity research coverage over the past several years. We currently provide analyst reports on more than 99% of the market capitalization of the stocks included in the S&P 500 index. We continue to expand our analyst staff to support these research efforts and had 87 stock analysts in the United States as of December 31, 2005, compared with 73 as of December 31, 2004.
We also introduced a new discounted cash-flow (DCF) model for valuing real estate investment trusts (REITs) in 2005, replacing the net asset value model we previously used. We believe that Morningstar is the first independent research firm to use a DCF approach as a primary tool for valuing REITs.
Pricing for Morningstar Equity Research that we deliver related to the Global Analyst Research Settlement or for other institutional clients varies based on the level of distribution, the number of securities covered, the amount of custom coverage required, and the length of the contract term. Morningstar Equity Research, which primarily consists of research related to the Global Analyst Research Settlement, was the second largest product in the Individual segment based on revenue in 2005, following Morningstar.com.
Morningstar Mutual Funds
Morningstar Mutual Funds is a reference publication that features our signature one-page reports on approximately 1,500 mutual funds. These reports contain historical performance data, portfolio statistics, proprietary measurement tools, and analyst reports. Twice a month, subscribers receive updated reports for approximately 150 of the covered funds, along with news, analyst commentary, industry research, and summary performance data for all 1,500 funds. Subscribers can also access a Web-based version for the most current information. We charge $549 for a one-year subscription to Morningstar Mutual Funds.
Morningstar FundInvestor
Morningstar FundInvestor is a monthly newsletter that provides information and insight on 500 of the most popular mutual funds. It also includes a list of 150 Analyst Picks—hand-selected funds that our analysts think are the most compelling for long-term investors. Each monthly issue contains extensive data, ideas on building better portfolios, news on current developments and changes within the fund industry, and proprietary research and ratings. Morningstar FundInvestor also features three mutual fund portfolios constructed and updated by Morningstar’s senior analyst team. We charge $99 for a one-year subscription to Morningstar FundInvestor.
Morningstar StockInvestor
Morningstar StockInvestor is a monthly newsletter that includes updates on two model portfolios (a Tortoise portfolio designed for conservative investors and a Hare portfolio designed for more risk-tolerant investors), a Red Flags column that cautions investors about stocks to avoid, and the Morningstar Bellwether 50, a watchlist of 50 dominant companies with wide economic moats, or competitive advantages.
11
Each issue also offers ideas about how investors can improve their stock selection and learn from leading portfolio managers. We charge $109 for a one-year subscription to Morningstar StockInvestor.
In addition to the products mentioned above, we offer several other investment newsletters and a series of books about investing in stocks and mutual funds, which are available directly from us and in bookstores. We launched three new print newsletters in 2005, Morningstar Practical Finance, Morningstar DividendInvestor, and Morningstar GrowthInvestor, as well as a new series of investing workbooks about stocks and mutual funds. In early 2006, we introduced a new annual softcover reference guide on exchange-traded funds, the Morningstar ETFs 100.
Advisor Segment
For financial advisors, our largest products are Morningstar Advisor Workstation, a comprehensive Web-based investment planning system, and Principia, our leading CD-ROM-based investment research and planning software. We also offer Morningstar Managed Portfolios, a fee-based discretionary asset management program distributed exclusively through financial advisors. Our advisor products are integrated into the daily operations and research processes of many financial advisors who use our research and tools to provide guidance for individual investors. According to the most recent report published in June 2003 by the consulting firm Tiburon Strategic Advisors, Morningstar was ranked as the leading provider of investment research and data, financial planning software, and asset allocation software among 1,476 independent financial advisors surveyed. Morningstar has also received the CPA Wealth Provider Financial Planning Award in the Financial Planning Software Vendors category for each of the past three years for Principia and Morningstar Advisor Workstation. This award recognizes companies that have taken the lead through innovation, efficiency, initiative, or growth in the financial planning area.
We sell our advisor-related products both directly to independent financial advisors and through enterprise licenses, which allow financial advisors associated with the licensing enterprise to use our products. Most of our license agreements in the Advisor segment have terms ranging from one to three years. As of December 31, 2005, we had established relationships with more than 130,000 financial advisors in the United States and approximately 55,000 financial advisors in international markets. Approximately 13% of our Advisor segment revenue was from international sales in 2005. In addition to the U.S. versions of our Advisor products, we offer products for financial advisors in a variety of international markets. For example, we have international versions of Advisor Workstation tailored to markets in Asia, Australia, Canada, and Europe, and we offer products similar to Principia in Canada and Australia.
Our products for advisors are sold primarily through our sales force and direct mail, with promotional support from online and print advertising, public relations, and conference exhibits. We also use the annual Morningstar Investment Conference to promote our offerings for advisors. We believe that there are substantial opportunities to increase Advisor Workstation sales by attracting additional brokerage firms and investment advisors to sign up as clients. We also expect to expand our offerings to financial advisors in international markets. Our primary competitors in the Advisor segment include Standard & Poor’s, SunGard, and Thomson Financial Services. For Morningstar Managed Portfolios, our primary competitors are AssetMark, Brinker Capital, Envestnet PMC, SEI Investments, and Standard & Poor’s.
In the Advisor segment, sequential revenue growth tends to be higher in the second quarter because our annual investment conference is held once per year in June. Other products in this segment generally have not shown marked seasonality.
Our largest customer in this segment accounted for less than 10% of segment revenue in 2005.
12
Morningstar Advisor Workstation
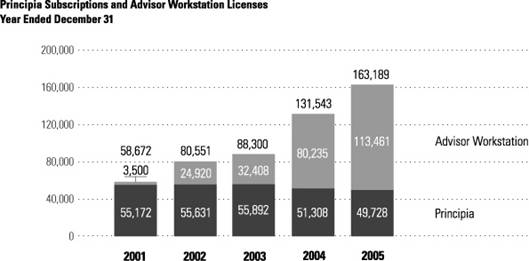
Morningstar Advisor Workstation, a Web-based investment planning system, provides financial advisors with a comprehensive set of tools for conducting their core business—including investment research, planning, and presentation tools. It also allows advisors to build and maintain a client portfolio database that can be fully integrated with the firm’s back-office technology and resources. Moreover, it helps advisors create customized reports for client portfolios that combine mutual funds, stocks, separate accounts, variable annuity/life subaccounts, exchange-traded funds, and closed-end funds. As of December 31, 2005, more than 113,000 advisors in the United States were licensed to use Advisor Workstation, which is available in two editions: the Office Edition for independent financial advisors and the Enterprise Edition for financial advisors affiliated with larger firms. We generally charge $5,000 per year for the Office Edition. Pricing for the Enterprise Edition varies based on the number of users, as well as the level of functionality offered and generally ranges between $80 and $2,500 per licensed user.
In 2005, we added a series of Advisor Compliance Tools to the Enterprise Edition of Advisor Workstation, including our Compliance Data Digest to help institutions manage compliance issues related to point-of-sale requirements for financial advisors. The Compliance Data Digest tool allows advisors to view information about mutual fund breakpoints, rights of accumulation linkage rules, and letter of intent policies commonly contained in the mutual fund prospectus or Statement of Additional Information. We also introduced a new Share Class Analyzer report that helps advisors select the most appropriate, cost-effective share class and present a comprehensive cost analysis to their clients. We created a Virtual Training Center to allow users to participate in self-directed tutorials on all Advisor Workstation functionality. In addition, we expanded the range of data universes covered by our hypothetical illustrator and other reporting tools. We also made a number of improvements to the account management and reporting functionality included in Advisor Workstation Office Edition. For example, we now offer a batch reporting feature that allows advisors to automatically generate professional-quality reports for an entire practice.
Morningstar Advisor Workstation is one of our five largest products and made up 12.9%, 10.8%, and 7.7% of our consolidated revenue in 2005, 2004, and 2003, respectively.
Morningstar Principia
Principia is our CD-ROM-based investment research and planning software for financial planners and had 49,728 subscriptions as of December 31, 2005. The modules offered in Principia provide data on mutual funds, stocks, hedge funds, separate accounts, variable annuity/life subaccounts, and closed-end funds. Each module is available separately or together in a CD-ROM format and features searching, screening, and ranking tools. Principia allows advisors to create integrated portfolios for clients and offers three-page Portfolio Snapshot reports that provide a comprehensive picture of the client’s portfolio. The Snapshot report shows overall style and sector weightings as well as the cumulative exposure to individual stocks. The Snapshot report is among those approved by the National Association of Securities Dealers for financial advisors to distribute and review with their clients. Principia prices generally range from approximately $635 per year for monthly updates on one investment database to $2,725 per year for monthly updates on the complete package spanning all investment universes. Pricing for Principia Enterprise licenses varies based on the investment universes selected, level of functionality, and number of users and generally starts at about $635 per user.
During 2005, we added a Defined Contribution Plans module to Principia, which is designed to help financial advisors evaluate an organization’s 401(k) or 403(b) plan lineup and build a recommended list of investment selections. It allows advisors to analyze 401(k) and 403(b) plans by highlighting several characteristics of mutual funds offered through a given plan, including diversification across asset classes, styles, and regions; quality of the investment options; and fees associated with the plan and its investment options. This module is designed to be used in tandem with the other mutual fund modules offered through Principia. The price for the new module is $1,990 per year.
Principia is one of our five largest products and accounted for 12.7%, 16.3%, and 20.7% of our consolidated revenue in 2005, 2004, and 2003, respectively.
13
Morningstar Managed Portfolios
Morningstar Managed Portfolios is a fee-based discretionary asset management service that includes a series of mutual fund and exchange-traded fund portfolios tailored to meet specific investment time horizons and risk levels. This program is only available through financial advisors. Our team of investment professionals uses a disciplined process for asset allocation, fund selection, and portfolio construction. They actively monitor the portfolios and make adjustments as needed. We complement these asset management services with online client-management functions such as risk profiling and access to client statements, transaction capabilities, and performance reports.
We introduced the Morningstar Managed Portfolios program in 2001 and had approximately $1.4 billion in assets under management as of December 31, 2005. We charge asset-based fees for Morningstar Managed Portfolios. The management fee is based on a tiered schedule that depends on the client’s average daily portfolio balance and generally ranges from 0.20% to 0.40% of assets.
The Morningstar Managed Portfolios program is offered through Morningstar Investment Services, Inc., a registered investment advisor, registered broker-dealer, NASD member, and wholly owned subsidiary of Morningstar.
Institutional Segment
For institutional clients, our key products and services include Licensed Data, a set of investment data spanning eight core databases, available through electronic data feeds; Investment Profiles & Guides, which are designed for institutions to use in communicating investment information to individual investors; Morningstar Direct, a Web-based institutional research platform that provides advanced research and tools on the complete range of securities in Morningstar’s global database; Investment Consulting, which focuses on investment monitoring and asset allocation for funds of funds, including mutual funds and variable annuities; and Morningstar Retirement Manager, a suite of advice and guidance services for retirement plan participants.
As of December 31, 2005, we served approximately 750 clients through our Institutional segment, including banks, brokerage firms, insurance companies, mutual fund companies, media outlets, and retirement plan sponsors and providers. We believe our institutional clients value our independence, breadth of information, and customized services; in addition, we believe our research, tools, and advice reach many individual investors through this channel. Across the Institutional segment, we’ve established relationships with many of the largest companies in the financial services industry, including Fidelity, MetLife, Nationwide, and Prudential. Approximately 21% of our institutional sales are to clients located outside of the United States—primarily in Australia, Canada, and various countries in Europe. We typically sell our institutional products based on a contract term of one to three years.
We market our products for institutional clients almost exclusively through our sales team. We provide marketing support for our sales team in the form of online and print advertising, public relations, direct mail, and conference exhibits. We also have data reselling agreements with third-party providers of investment tools and applications, allowing us to increase the distribution of our data with minimal additional cost.
For Licensed Data and Investment Profiles & Guides, our primary competitors are Bowne, FactSet Research Systems, Lipper, and Standard & Poor’s. For Morningstar Direct, our primary competitors are Informa, Lipper, Markov, Mobius Data Subscriptions, Strategic Insight, and Zephyr Management. Our Investment Consulting business competes primarily with Lipper, Standard & Poor’s, and Wilshire, as well as some smaller competitors in the retirement consulting business. In the retirement advice market, we compete primarily with Financial Engines and Promanage.
Most products within our Institutional segment have not shown pronounced seasonality over the past three years.
14
Our largest customer in the Institutional segment accounted for less than 10% of segment revenue in 2005.
Licensed Data
Our Licensed Data service offers a set of investment data spanning eight core databases, available through electronic data feeds. Available data packages include proprietary statistics such as the Morningstar Style Box and Morningstar Rating and a wide range of other data, including information on investment performance, portfolio composition, operations data, fees and expenses, cash flows, and ownership. Institutions can use Licensed Data in a variety of investor communications, including Web sites, print publications, and marketing fact sheets, as well as for internal research and product development. We deliver Licensed Data as an electronic data feed using XML technology for rapid transmission and ease of use. Pricing for Licensed Data is based on the number of funds or other securities covered, the amount of information provided for each security, and the level of distribution.
Licensed Data is one of our five largest products and accounted for 14.3%, 15.1%, and 16.1% of our consolidated revenue in 2005, 2004, and 2003, respectively.
Investment Consulting
Our Investment Consulting services focus on investment monitoring and asset allocation for funds of funds, including mutual funds and variable annuities. Our investment professionals evaluate portfolios, recommend strategies, help set investment policies, design asset allocations, and monitor ongoing performance. We offer these consulting services to clients in the United States, Asia, Australia, Canada, and Europe, including insurance companies, investment management companies, mutual fund companies, and broker-dealers. We also provide services for retirement plan sponsors and providers, including developing plan lineups, creating investment policy statements, and monitoring investment performance.
Our team of investment consultants draws on both quantitative research tools and qualitative expertise to assess investment vehicles, provide detailed analysis of performance and portfolio characteristics, and make comprehensive recommendations for improvement. We also offer investment manager search services. Our staff combines the depth of Morningstar’s historical fundamental databases with detailed investment knowledge and investment experience to recommend qualified candidates for subadvisory firms, mutual fund managers, variable insurance trust managers, and separate account managers. Our investment monitoring services include analyst reports, customizable board reports, select lists, watchlists, and in-depth attribution analysis. Pricing for our consulting services is based on the scope of work and the level of service required. For agreements where we act as a portfolio construction manager for a mutual fund or variable annuity, we receive asset-based fees.
We offer our Investment Consulting services through Morningstar Associates, LLC, a registered investment advisor and wholly owned subsidiary of Morningstar. Investment Consulting is one of our five largest products and accounted for 9.6%, 7.7%, and 6.5% of our consolidated revenue in 2005, 2004, and 2003, respectively.
Morningstar Retirement Manager
Morningstar Retirement Manager is a suite of advice and guidance services that helps retirement plan participants plan and invest for retirement. It gives clear guidance explaining whether participants’ suggested plans are on target to meet their retirement goals. As part of this service, we also offer specific suggestions for contribution rates, asset mix, investment style, and sector exposure to help participants maximize their retirement portfolios, as well as specific recommendations for funds to invest in. Morningstar Retirement Manager includes a managed account service designed for plan participants who choose to delegate management of their portfolios to Morningstar’s investment professionals. We offer these services primarily through retirement plan providers—typically third-party asset management companies or companies that offer administrative services to retirement plans. These providers often supply investment offerings to retirement plan sponsors and their participants. As of December 31, 2005, more than 9 million plan participants had
15
access to Morningstar Retirement Manager through approximately 69,000 plan sponsors and 30 plan providers. Pricing for Morningstar Retirement Manager depends on the number of participants, as well as the level of service we provide.
Morningstar Retirement Manager is offered through Morningstar Associates, LLC, a registered investment advisor and wholly owned subsidiary of Morningstar.
Licensed Tools and Content
We offer an extensive set of online tools and editorial content that institutional clients can license to use in their Web sites and software products. Clients can select from among more than 40 different tools and content offerings or purchase modular packages focusing on screening and performance tools, editorial commentary and educational articles, as well as goal planning and portfolio analysis. Our online tools and content can be customized to meet the needs of international audiences, and can also be modified to analyze a set of investments, focus on client-defined data points, or perform calculations required by specific products or services. We also offer a fully integrated set of tools and applications to provide portfolio answers and analysis in context. Pricing for Licensed Tools and Content depends on the audience, the level of distribution, and the scope of information and functionality licensed.
Investment Profiles & Guides
Our Investment Profiles & Guides are designed for institutions to use as an alternative to creating their own materials for use in communicating with clients, or for companies to use in communicating with retirement plan participants. Investment Profiles are single-page reports that combine key elements from our data, design, and editorial content to clearly present the essential facts about an investment. They cover mutual funds, stocks, exchange-traded funds, hedge funds, variable annuity/life subaccounts, separate accounts, custom funds, offshore funds, pension and life funds, and Section 529 College Savings Plans. We also offer Investment Guides, which are a collection of Investment Profiles combined with summary information and educational articles. Morningstar handles all of the document production, including data collection, design, and delivery. Pricing for Investment Profiles and Investment Guides is based on the number of securities covered, the amount of information we provide, and the level of distribution.
Morningstar Direct
Morningstar Direct is a Web-based institutional research platform that provides advanced research on the complete range of securities in Morningstar’s global database. This comprehensive research platform allows research and marketing professionals to conduct advanced performance comparisons and in-depth analyses of a portfolio’s underlying investment style. Morningstar Direct includes access to numerous investment universes, including U.S. mutual funds; European and offshore funds; funds based in Australia, Canada, China, and Hong Kong; stocks; separate accounts; global hedge funds; closed-end funds; exchange-traded funds; Section 529 College Savings Plans; and market indexes. Pricing for Morningstar Direct is based on the number of licenses purchased: $15,000 for the first user, $10,000 for the second user, and $7,500 for each additional user.
During 2005, we launched the next generation of Morningstar Direct, expanding the range of data universes to allow institutions to conduct research across global markets and adding the full range of Morningstar’s available data on stocks, hedge funds, and Section 529 College Savings Plans. We also expanded our sales efforts outside the United States.
Morningstar Indexes
Based on the same methodology as the Morningstar Style Box, our 16 real-time indexes track the U.S. equity market by capitalization and investment style. They include a broad market index, three capitalization-based indexes, three composite style indexes, and nine indexes based on both investment style and market capitalization. The Morningstar Indexes cover approximately 97% of the market capitalization of
16
the U.S. equity market. We charge licensing fees for the Morningstar Indexes, with fee levels generally customized by client.
Barclays Global Investors is licensing our 16 style-based indexes and has introduced nine exchange-traded funds (ETFs) based on the Morningstar Indexes.
During 2005, we introduced the Morningstar China Index Series, a series of 10 market indexes tracking China’s entire stock market since its inception. In early 2006, we created the Morningstar Dividend Leaders Index, a broadly diversified portfolio of 100 stocks that have strong potential for sustaining and increasing dividend payouts. First Trust Advisors L.P. is licensing the Dividend Leaders Index from Morningstar and introduced an exchange-traded fund based on this index in February 2006.
Marketing and Sales
We promote our print, software, Web-based products and services, and consulting services with a staff of sales and marketing professionals, as well as public relations. Our marketing staff includes both product specialists and a corporate marketing group that manages company initiatives. As part of these groups, we have several strategic account managers who oversee all aspects of our largest institutional client relationships. We also have a sales operations staff, which focuses on tracking revenue, forecasting sales, and other tasks to support our sales team. Across all three of our segments, we emphasize high levels of product support to help our customers use our products effectively and provide our product managers with feedback from customers. We had approximately 170 sales and marketing professionals on staff as of December 31, 2005.
International Operations
We conduct our business operations outside of the United States through a variety of subsidiaries and other operating companies. We have wholly owned or majority-owned operating subsidiaries doing business in each of the following markets: Australia, Canada, France, Germany, Italy, the Netherlands, New Zealand, Norway, People’s Republic of China (both Hong Kong and the mainland), Spain, and the United Kingdom. See Note 5 of the Notes to our Consolidated Financial Statements for additional information concerning revenue from customers and long-lived assets from our business operations outside the United States. See Note 17 of the Notes to our Consolidated Financial Statements for information on a legal proceeding that may, if decided adversely to us, affect our ownership of our Australian and New Zealand subsidiaries.
In addition, we hold minority ownership positions in operating companies based in Denmark, Japan, Korea, and Sweden. Our ownership in these companies is either held directly by us or indirectly through separate non-U.S. subsidiaries that we control. As of December 31, 2005, we owned approximately 35% of the outstanding shares in Morningstar Japan K.K. (Morningstar Japan); our share had a market value of approximately $82.1 million. Morningstar Japan is publicly traded under ticker 4765 on the Osaka Stock Exchange “Hercules Market.” See Note 8 of the Notes to our Consolidated Financial Statements for information on investments in unconsolidated entities.
To enable these companies to do business in their designated territories, we provide them with the rights to the Morningstar name and logo and with access to certain of our products and technology. Each company operating within a particular country is responsible for developing marketing plans tailored to meet the specific needs of investors within its own market and working with Morningstar’s data collection and development centers to create and maintain databases, develop new products, and enhance existing products.
See Item 1A—Risk Factors for a discussion of the risks related to our business operations outside of the United States.
Intellectual Property and Other Proprietary Rights
We treat our brand, product names and logos, software, technology, databases, and other products as proprietary. We try to protect this property by using trademark, copyright, patent and trade secrets laws,
17
licensing and nondisclosure arrangements, and other security measures. For example, in the normal course of business, we only provide our intellectual property to third parties through standard licensing agreements. The purposes of these agreements are to both define the extent and duration of any third party usage rights and to provide for our continued ownership in any intellectual property furnished.
Because of the value of our brand name and logo, we have tried to register one or both of them in all of the relevant international classes under the trademark laws of most of the jurisdictions in which we do business. As we move into new markets, we are continuing to effect these registrations and, in some jurisdictions, the registration of certain product identifiers as well. To date, we have registered our name and/or logo in 12 countries and the European Union and have applied for registrations in several other countries.
We currently hold two U.S. patents, one U.K. patent, and one Canadian patent. We do not rely on our patents and do not believe patents are important to our business.
From time to time, we encounter jurisdictions in which one or more third parties have a pre-existing trademark registration in certain relevant international classes that may prevent us from registering our own marks in those jurisdictions. It is possible that our continued ability to use the “Morningstar” name or logo, either on a stand-alone basis or in association with certain products or services, could be compromised in such jurisdictions because of these pre-existing registrations. Similarly, from time to time, we encounter situations in certain jurisdictions where one or more third parties are already using the Morningstar name, either as part of a registered corporate name, a registered domain name or otherwise. It is possible that our ability to continue to effectively market certain of our products and/or services could be adversely affected by these usages.
“Morningstar” and the Morningstar logo are registered marks of Morningstar in the United States and in certain other jurisdictions. The following are also trademarks or service marks of our company:
Morningstar® Advisor WorkstationSM | | Morningstar® Mutual FundsTM |
Morningstar.com® | | Morningstar® Ownership ZoneSM |
Morningstar DirectSM | | Morningstar® Principia® |
Morningstar® FundInvestorTM | | Morningstar RatingTM |
Morningstar® IndexesSM | | Morningstar® Retirement ManagerSM |
Morningstar® Investment GuidesTM | | Morningstar® Stewardship GradeSM |
Morningstar® Investment ProfilesTM | | Morningstar® StockInvestorTM |
Morningstar® Licensed DataSM | | Morningstar Style BoxTM |
Morningstar® Managed PortfoliosSM | | Portfolio X-Ray® |
License Agreements
In the majority of our licensing agreements, we license our products and/or other intellectual property to our customers for a fee. We generally use our own standard agreements, whether in paper or electronic form, and we do not provide our products and services to customers or other users without having an agreement in place.
We also maintain licensing agreements with each of our joint venture companies and with Morningstar Japan. We put these agreements in place so these companies can use our intellectual property, such as our products and trademarks, to develop and market similar products under our name in their operating territories.
18
We also license certain intellectual property from third parties, and in the ordinary course of our business, we incorporate and use intellectual property from a variety of third-party sources.
Seasonality
We believe our business has a modest amount of seasonality. Most of our products are sold with subscription or license terms of at least one year, and we recognize revenue ratably over the term of each subscription or license agreement. This tends to moderate seasonality in sales patterns for individual products. Over the past three years, sequential revenue growth on a company level in the first quarter has been slightly higher than in other quarters. Refer to the discussion in Business Segments, Products, and Services above for additional information on the seasonality of each segment.
Customers
In 2005, our largest customer accounted for less than 5% of our consolidated revenue.
19
Competitive Landscape
The economic and financial information market has been marked by increased consolidation over the past five years, with the strongest players generally gaining market share at the expense of smaller competitors. Our largest competitors are Lipper, Standard & Poor’s, and Thomson Financial Services. These companies have financial resources that are significantly greater than ours. We also have a number of smaller competitors in each of our three business segments; for more information, refer to the discussion in Business Segments, Products, and Services above. Most of our competitors compete with individual products or segments of our business; we are not aware of any company that offers substantially similar product solutions in all three of our segments.
Our international operations compete with a variety of other companies not named above, including Brain Power, IWL Limited, MoneyMate, and vanEyk Research.
We believe the most important competitive factors in our industry are brand and reputation, data quality and comprehensiveness, quality of investment analysis and analytics, design, reliability, product support capabilities, and value of the products and services provided.
Research and Development
A key aspect of our growth strategy is to expand our investment research capabilities and enhance our existing products and services. We strive to rapidly adopt new technology that can improve the products and services we deliver to our customers. We have also built a flexible technology platform that allows our products to work together across a full range of investment databases, delivery formats, and market segments. As a general practice, we manage our own Web sites and build our own software applications rather than relying on outside vendors. This allows us to control our development and better manage costs, enabling us to respond quickly to market changes and to meet customer needs efficiently. As of December 31, 2005, our technology team consisted of approximately 300 programmers and technology and infrastructure professionals.
In 2005, 2004, and 2003 our development expense represented 8.7%, 9.0%, and 10.5%, respectively, of our revenue. We expect that development expense will continue to represent a meaningful percentage of our revenue in the future.
Government Regulation
United States
Our investment advisory and broker-dealer businesses are subject to extensive regulation in the United States at both the federal and state level, as well as by self-regulatory organizations. Financial services companies are among the nation’s most extensively regulated. The Securities and Exchange Commission (SEC) is responsible for enforcing the federal securities laws and serves as a supervisory body for all federally registered investment advisors and broker-dealers.
As of December 31, 2005, three of our subsidiaries, Morningstar Investment Services, Inc., Morningstar Associates, LLC, and mPower Advisors, LLC are registered as investment advisors with the SEC under the Investment Advisers Act of 1940 (Advisers Act). As registered investment advisors, these companies are subject to the requirements and regulations of the Advisers Act. Such requirements relate to, among other things, record-keeping and reporting requirements, disclosure requirements, and limitations on principal transactions between an advisor and advisory clients, as well as general anti-fraud prohibitions.
Because Morningstar Associates provides investment advisory services to retirement plans and their participants, it may be acting as a fiduciary under the Employee Retirement and Investment Security Act of 1974 (ERISA). As a fiduciary under ERISA, Morningstar Associates has duties of loyalty and prudence, as well as duties to diversify investments and to follow plan documents to the extent that they comply with ERISA.
We provide each of our investment advisor companies with financial and operational support. However, each of them operates independently from other areas of Morningstar, using separate personnel and making independent investment decisions.
20
Morningstar Investment Services is a broker-dealer registered under the Securities Exchange Act of 1934 (Exchange Act) and a member of the National Association of Securities Dealers (NASD). The regulation of broker-dealers has, to a large extent, been delegated by the federal securities laws to self-regulatory organizations, including the NASD. Subject to approval by the SEC, the NASD adopts rules that govern its members. The NASD conducts periodic examinations of the operations of Morningstar Investment Services. Broker-dealers are subject to regulations that cover all aspects of the securities business, including sales practices, market making and trading among broker-dealers, use and safekeeping of clients’ funds and securities, capital structure, record-keeping, and the conduct of directors, officers, and employees. Violation of applicable regulations can result in the revocation of a broker-dealer license, the imposition of censures or fines, and the suspension or expulsion of a firm or its officers or employees. Morningstar Investment Services is subject to certain net capital requirements under the Exchange Act. The net capital requirements, which specify minimum net capital levels for registered broker-dealers, are designed to measure the financial soundness and liquidity of broker-dealers.
Additional legislation and regulations, including those relating to the activities of investment advisors and broker-dealers, changes in rules imposed by the SEC or other U.S. or non-U.S. regulatory authorities and self regulatory organizations, or changes in the interpretation or enforcement of existing laws and rules may adversely affect our business and profitability. Our businesses may be materially affected not only by regulations applicable to it as an investment advisor or broker-dealer, but also by regulations that apply to companies generally.
Australia
In order to provide financial information services in Australia, our Australian subsidiary, Morningstar Research Pty Limited (Morningstar Australia), must hold an Australian Financial Services License and submit to the jurisdiction of the Australian Securities and Investments Commission (ASIC). This license requires Morningstar Australia to maintain positive net asset levels and sufficient cash resources to cover three months of expenses and to comply with the audit requirements of the ASIC. The availability of this license may be adversely affected by the legal proceeding described in Note 17 of the Notes to our Consolidated Financial Statements.
Employees
We had approximately 1,130 employees as of December 31, 2005, including approximately 180 investment analysts, 140 data analysts, 300 programmers and technology staff, 40 designers, and 170 sales and marketing professionals. Our employees are not represented by any collective bargaining organizations and we have never experienced a work stoppage.
21
Executive Officers
As of December 31, 2005, we had 14 executive officers. The information below summarizes certain information about each of these officers.
Name | | Age | | Position |
Joe Mansueto | | 49 | | Chairman, Chief Executive Officer, and Director |
Tim Armour | | 57 | | Managing Director |
Chris Boruff | | 40 | | President, Advisor Business |
Bevin Desmond | | 39 | | President, International Business |
Martha Dustin Boudos | | 39 | | Chief Financial Officer |
Catherine Gillis Odelbo | | 43 | | President, Individual Business |
Tao Huang | | 43 | | Chief Operating Officer |
Elizabeth Kirscher | | 41 | | President, Data Services Business |
Art Lutschaunig | | 47 | | President and Chief Investment Officer, Morningstar Investment Services |
Don Phillips | | 43 | | Managing Director and Director |
Patrick Reinkemeyer | | 40 | | President, Morningstar Associates |
John Rekenthaler | | 45 | | Vice President, Research and New Product Development |
Richard E. Robbins | | 43 | | General Counsel and Corporate Secretary |
David W. Williams | | 45 | | Managing Director, Design |
| | | | |
Joe Mansueto
Joe Mansueto founded Morningstar in 1984. He has served as our chairman since our inception, and as our chief executive officer from inception to 1996 and from 2000 to the present. He holds a bachelor’s degree in business administration from The University of Chicago and a master’s degree in business administration from The University of Chicago Graduate School of Business.
Tim Armour
Tim Armour has been one of our managing directors since 2000. He is responsible for strategic relationships and business development. He joined us in 1998 as our chief operating officer and from 1999 to 2000 served as our president. He holds a bachelor’s degree in business administration from Gettysburg College and a master’s degree in business administration from the Columbia Business School at Columbia University.
Chris Boruff
Chris Boruff has been the president of our advisor business since 2000. He is responsible for overseeing strategy, development, and marketing associated with our products for financial advisors. He joined us in 1996 as product manager for Principia, and from 1997 to 1998, he served as senior product manager of advisor products. From 1999 to 2000, he served as vice president of advisor products, where he was responsible for all marketing related to financial advisors. He holds a bachelor’s degree in economics and psychology from Northwestern University.
Bevin Desmond
Bevin Desmond has been president of our international business since 2000. She is responsible for identifying and developing new markets, managing and directing operations, and launching new products. She joined us in 1993 and was one of three employees who started our international business. From 1998 to 2000, she served as manager of all international ventures. She holds a bachelor’s degree in psychology from St. Mary’s College.
22
Martha Dustin Boudos
Martha Dustin Boudos has been our chief financial officer since 2001. She oversees our finance, human resources, and accounting operations. She joined us in 1992 as a marketing manager. She also played a key role in the creation of our Web site for individual investors, Morningstar.com. From 1998 to 2000, she was responsible for our retirement advice service. During 2001, she served as our vice president of human resources. She holds a bachelor’s degree in political science from Wellesley College and a master’s degree in business administration from the Kellogg School of Management at Northwestern University.
Catherine Gillis Odelbo
Catherine Gillis Odelbo has been president of our Individual segment since 2000. She joined us in 1988 as a mutual fund analyst and from 1999 to 2000 served as senior vice president of content development for the company, as well as publisher and editor of our stock and closed-end fund research. She holds a bachelor’s degree in American history from The University of Chicago and a master’s degree in business administration from The University of Chicago Graduate School of Business.
Tao Huang
Tao Huang has been our chief operating officer since 2000. He is responsible for corporate strategy, oversight of all business units, and directing our day-to-day operations. He joined us in 1990 as a software developer and from 1996 to 1998 served as chief technology officer. From 1998 to 2000, he served as senior vice president of business development and head of international operations. He holds a bachelor’s degree in computer science from Hunan University in China, a master’s degree in computer science from Marquette University, and a master’s degree in business administration from The University of Chicago Graduate School of Business.
Elizabeth Kirscher
Elizabeth Kirscher has been president of our data services business since 2000. She is responsible for managing our investment databases and related products. She joined us in 1995 as a major accounts manager in our institutional sales area. From 1998 to 1999, she served as international product manager and worked on the launch of Morningstar Japan. From 1999 to 2000, she was director of sales and business development for Morningstar.com and marketed Morningstar.com data and tools to other Web sites. She holds a bachelor’s degree from Vassar College and a master’s degree in business administration from the Columbia Business School at Columbia University.
Art Lutschaunig
Art Lutschaunig has been president and chief investment officer for Morningstar Investment Services since August 2001. He is responsible for managing the investment services business, including oversight of the group’s investment research and portfolio management. Before joining us in May 2001, he was an independent consultant. From 2000 to 2001, he served as president of Giving Capital, Inc. He holds a bachelor’s degree in marketing from Villanova University.
Don Phillips
Don Phillips has been one of our managing directors since 2000. He is responsible for corporate strategy, research, and corporate communications. He joined us in 1986 as our first analyst. He served as our vice president and publisher from 1991 to 1996, as our president from 1996 to 1998, and as our chief executive officer from 1998 to 2000. He has served on our board of directors since August 1999. He also serves on the board of directors for Morningstar Japan. He holds a bachelor’s degree in English from the University of Texas and a master’s degree in American literature from The University of Chicago.
23
Patrick Reinkemeyer
Patrick Reinkemeyer has been president of Morningstar Associates since October 2004. He is responsible for Morningstar’s investment consulting and retirement businesses. From 2001 until October 2004, he served as president of Morningstar’s institutional investment consulting business. He joined us in 1996. From 1996 to 1997, he directed our print and software variable annuity/life products. He holds a bachelor’s degree in history from Middlebury College and a master’s degree in business administration from The University of Chicago Graduate School of Business.
John Rekenthaler
John Rekenthaler has been vice president of new product development since October 2004. In April 2005, he took on additional responsibilities as vice president of research. From 2001 until October 2004, he served as president of Morningstar Associates and head of the company’s retirement advice business. He joined us in 1988 as an assistant editor and from 1998 to 2000 he served as our director of research. From 1991 to 1995, he served as editor of Morningstar Mutual Funds and Morningstar FundInvestor. He holds a bachelor’s degree in English from the University of Pennsylvania and a master’s degree in business administration from The University of Chicago Graduate School of Business.
Richard E. Robbins
Richard E. Robbins has been our general counsel and corporate secretary since August 2005. He is responsible for directing Morningstar’s legal department and managing its relationships with outside counsel. From May 1999 until he joined Morningstar, he was a partner at Sidley Austin Brown & Wood LLP, which he joined as an associate in August 1991. He holds bachelor’s and master’s degrees in computer science and electrical engineering from the Massachusetts Institute of Technology and a juris doctor degree from The University of Chicago Law School.
David W. Williams
David W. Williams has been one of our managing directors since 2000. He is in charge of design and its application to brand identity, products, communications, and the workplace. He joined us in 1993 and has been instrumental in establishing design as one of our recognized core capabilities. He holds a bachelor’s degree in industrial design from The Ohio State University and a master’s degree in fine arts from the Yale University School of Art.
Company Information
We were incorporated in Illinois on May 16, 1984. Our corporate headquarters and U.S. operations are located at 225 West Wacker Drive, Chicago, Illinois, 60606.
We maintain a Web site at http://corporate.morningstar.com. Our Annual Report on Form 10-K, quarterly reports on Form 10-Q, current reports on Form 8-K, and amendments to any of these documents are available free of charge on this site as soon as reasonably practicable after the reports are filed with or furnished to the Securities and Exchange Commission. We also post quarterly press releases on our financial results and other documents containing additional information related to our company on this site. Our Web site and the information contained in or connected to our Web site are for informational purposes only and are not part of this Annual Report on Form 10-K.
24
Item 1A. Risk Factors
You should carefully consider the risks described below and all of the other information included in this Form 10-K when deciding whether to invest in our common stock or otherwise evaluating our business. If any of the following risks actually occur, our business, financial condition, or operating results could suffer. In this case, the trading price of our common stock could decline, and you may lose all or part of your investment.
Competition could reduce our share of the investment research market and hurt our financial performance.
We operate in a highly competitive market, with many investment research providers competing for business from individual investors, financial advisors, and institutional clients. We compete with many different types of companies that vary in size, product scope, and media focus including large and well-established distributors of financial information, such as Lipper, a division of Reuters, The McGraw-Hill Companies, through its Standard & Poor’s division, and Thomson Corporation, through its Thomson Financial Services division. In addition to these key competitors, we compete with a variety of other companies in different areas of our business, which we discuss in greater detail in the Business Segments, Products, and Services section in Item 1—Business above.
Many of our competitors have larger customer bases and significantly greater resources than we do. This may allow these competitors to respond more quickly to new technologies and changes in market demand, to devote greater resources to developing and promoting their services, and to make more attractive offers to potential clients, subscribers, and strategic partners. Industry consolidation may also lead to more intense competition. Increased competition could result in price reductions, reduced gross margins, or loss of market share, any of which could hurt our business, operating results, or financial condition.
If we do not maintain and increase the number of subscriptions and license agreements, our operating results could suffer.
A substantial portion of our revenue is generated from subscriptions and license agreements. In 2005, “walk-in” revenue, which we define as revenue from licenses or subscriptions that were in place at the beginning of the year adjusted for cancellations, currency translations, and other routine adjustments during the year, accounted for 53.8% of our revenue, and renewal revenue, which we define as revenue from renewals of licenses or subscriptions, accounted for 29.0% of our revenue. In general, our subscriptions are paid in advance, but may be canceled by the customer at any time. We may be obligated to refund a portion of prepaid subscription fees when a customer cancels. Cancellations may have a negative impact on our revenue and cash position. Our license agreements, which typically do not allow for cancellation, have terms ranging from one to three years. As of January 1, 2006, we had subscriptions and license agreements in place that were expected to generate $138.8 million of revenue in 2006. In 2005 and 2004, cancellations reduced “walk-in” revenue by between 2% and 4%. Our future success depends on our maintaining (through renewals) and increasing (through new subscriptions and license agreements) the number of customers who pay for our investment research and services. Further, if the market for our services develops more slowly than we expect, or declines, and the number of customers who pay for our services does not increase, or declines, our business, operating results, or financial condition could suffer.
The availability of free or low-cost investment information could lead to lower demand for our products and adversely affect our financial results.
Investment research and information relating to publicly traded companies and mutual funds is widely available for little or no cost from various sources, including the Internet and public libraries. Investors can also access information directly from publicly traded companies and mutual funds. The EDGAR database available through the Securities and Exchange Commission (SEC) Web site provides real-time access to SEC filings, including annual, semi-annual, and quarterly reports. Many brokerage firms also provide financial and investment research to their clients. The widespread availability of free or low-cost investment information may make it difficult for us to maintain or increase the prices we charge for our publications and services and
25
could lead to a lower demand for our products. A loss of a significant number of customers would adversely affect our financial results.
Certain products have historically made up a large percentage of our revenue base. Our business could suffer if sales of these products decline.
In 2005, Licensed Data, Morningstar Advisor Workstation, Principia, Morningstar.com, and Investment Consulting accounted for approximately 14.3%, 12.9%, 12.7%, 11.2%, and 9.6%, respectively, of our revenue. We believe that sales of these products will continue to have a material impact on our revenue for the foreseeable future. If we experience a significant decline in sales of any of these products for any reason, it would have a material adverse impact on our revenue and could harm our business. The independent equity research we’re providing to six investment banks under the terms of the Global Analyst Research Settlement accounted for a significant portion of our consolidated revenue in 2005. The period during which investment banks are required to provide independent equity research to their clients will expire in July 2009. We cannot guarantee that we will retain or replace this equity research revenue after that date. Because these contracts include both renewal and cancellation options and the firms named in the settlement are free to choose from a variety of research providers, we also cannot guarantee that we will retain this business for any period prior to July 2009.
Our reputation and business may be harmed by possible conflicts of interest.
We offer products and services to our institutional clients, which include banks, brokerage firms, insurance companies, mutual fund companies, media outlets, and retirement plan providers and sponsors. Our institutional business generated revenue, before intersegment eliminations, of $95.9 million, or 42.2% of our consolidated revenue in 2005 and $78.4 million, or 43.6% of our consolidated revenue, in 2004. We also provide ratings, analyst research, and investment recommendations on mutual funds and other investment products offered and securities issued by our institutional clients. The fact that our institutional clients pay us for certain products and services may create the perception that our ratings, research, and recommendations are not impartial. This perception may undermine the confidence of our customers and potential customers in our reputation as a provider of independent research. Any such loss of confidence or damage to our reputation could hurt our business.
Our failure to successfully integrate Ibbotson Associates and any other future acquisitions, investments, or joint ventures could strain our managerial, operational, and financial resources.
In March 2006, we completed our acquisition of Ibbotson Associates. This acquisition is substantially larger than any previous acquisition we have made and we cannot guarantee that we will successfully integrate Ibbotson’s employees, product lines, business systems, and operations. We expect to continue making acquisitions and establishing investments and joint ventures as part of our long-term business strategy. Acquisitions, investments, and joint ventures involve a number of risks, including the diversion of management’s attention from day-to-day operations. They could also result in dilution from equity securities issued, the incurrence of significant debt or other liabilities, or the loss of key employees. We may fail to successfully complete any acquisitions, investments, or joint ventures or fail to generate enough revenue from any acquired businesses, customer lists, products, services, or technologies to offset the associated costs.
We could face liability for the information we publish, including information based on data we obtain from other parties.
We may be subjected to claims for securities law violations, defamation (including libel and slander), negligence, or other claims relating to the information we publish. For example, investors may take legal action against us if they rely on published information that contains an error, or a company may claim that we have made a defamatory statement about it or its employees. We could also be subjected to claims based upon the content that is accessible from our Web site through links to other Web sites. We rely on a variety of outside parties as the original sources for information that is incorporated into our published data. These sources include securities exchanges, fund companies, and transfer agents. Accordingly, in addition to possible exposure for publishing incorrect information that results directly from our own errors, we could face
26
liability based on inaccurate data furnished to us by others. Defending claims based on the information we publish could be expensive and time-consuming and could adversely impact our business, operating results, and financial condition.
We could be subject to fines, penalties, or other sanctions as a result of investigations by the New York Attorney General’s Office, the SEC, and the Department of Labor related to the investment consulting services Morningstar Associates, LLC provides to retirement plan providers, including fund lineup recommendations for retirement plan sponsors.
On December 13, 2004, Morningstar Associates, LLC, a wholly owned subsidiary of Morningstar, Inc., received a request in the form of a subpoena from the New York Attorney General’s office, seeking information and documents from Morningstar Associates related to an investigation the New York Attorney General’s office is conducting. While the subpoena is very broad, it specifically asks for information and documents about the investment consulting services Morningstar Associates offers to retirement plan providers, including fund lineup recommendations for retirement plan sponsors. On December 16, 2004, shortly after the New York Attorney General’s office issued the subpoena, the SEC notified Morningstar Associates and Morningstar Investment Services, Inc. that it had begun an examination. In February 2005, the SEC issued a request to Morningstar Associates for the voluntary production of documents. The request is similar in scope to the New York Attorney General’s subpoena. In May 2005, Morningstar Associates received a subpoena from the United States Department of Labor, seeking information and documents from Morningstar Associates related to an investigation the Department of Labor is conducting. While the Department of Labor subpoena is very broad, it is substantially similar in scope to the New York Attorney General subpoena and the SEC request. In July 2005, the SEC issued a request in the form of a subpoena to Morningstar Associates. The subpoena is virtually identical to the SEC’s February 2005 request. Although we believe the focus of these investigations is on Morningstar Associates, information and documents pertaining to Morningstar, Inc. and Morningstar Investment Services also have been requested. See Item 3—Legal Proceedings for additional information. We cannot predict the scope, timing, or outcome of these matters, which may include the institution of administrative, civil injunctive, or criminal proceedings, the imposition of fines and penalties, and other remedies and sanctions, any of which could lead to an adverse impact on our stock price, the inability to attract or retain key employees, and the loss of customers.
We also cannot predict what impact, if any, these matters may have on our business, operating results, or financial condition. We have not established any reserves relating to these matters.
We could face liability as a result of a proceeding brought by Mr. Graham Rich, a former managing director, chief executive officer, and beneficial shareholder of Morningstar Research Pty Limited, and two companies controlled by Mr. Rich.
In 2001, Mr. Graham Rich, the then managing director and chief executive officer of Morningstar Research Pty Limited (Morningstar Australia), and two companies controlled by Mr. Rich, filed a suit in the Supreme Court of New South Wales, Australia against Morningstar and certain of its officers and nominee directors on the board of Morningstar Australia. The claims seek various forms of relief, including monetary damages in the amount of Australian $25.0 million, the setting aside of transactions which resulted in Morningstar obtaining control of Morningstar Australia, and an order either setting aside Morningstar’s acquisition of shares formerly beneficially owned by Mr. Rich and his companies or determining a different price for this acquisition. In the alternative, Mr. Rich and his companies seek an order that they be entitled to purchase the shares in Morningstar Australia at a price to be determined by the court or book value (as defined in the shareholders agreement of Morningstar Australia). The parties have discussed settling the claims but have been unable to reach an agreement. In the fourth quarter of 2003, we offered to settle all claims for Australian $1.3 million which then approximated U.S. $0.9 million, and, in accordance with SFAS No. 5, Accounting for Contingencies (SFAS No. 5), we recorded a reserve in this amount. In December 2005, we increased our offer to settle all claims to approximately Australian $2.5 million, which approximates U.S. $1.8 million, and, in accordance with SFAS No. 5, have a reserve recorded for this amount. While Morningstar is vigorously contesting the claims against it, we cannot predict the outcome of the proceeding. We cannot predict what impact, if any, this matter may have on our business, operating results, or financial condition.
27
A prolonged outage of our database and network facilities could result in reduced revenue and the loss of customers.
The success of our business depends upon our ability to deliver time-sensitive, up-to-date data and information. We rely on our computer equipment, database storage facilities, and other office equipment, which are located primarily in our Chicago headquarters or elsewhere in the Chicago area. Our operations and those of our suppliers and customers are vulnerable to interruption by fire, earthquake, power loss, telecommunications failure, terrorist attacks, wars, Internet failures, computer viruses, and other events beyond our control, including disasters affecting Chicago. Although we maintain off-site back-up facilities for our database and network equipment, these facilities may be subject to the same interruptions that may affect our headquarters. We do not currently have the capability to switch over all of our systems to a back-up facility immediately. In the event of a significant database or network facility outage, our business could experience some or complete disruption until we could fully implement our back-up systems. Any losses, service disruption, or damages incurred by us could have a material adverse effect on our business, operating results, or financial condition.
Our business relies heavily on electronic delivery systems and the Internet. Any failures or disruptions could result in reduced revenue and the loss of customers.
Many of our products and services depend heavily on our electronic delivery systems and the Internet. Our ability to deliver information using the Internet may be impaired because of infrastructure failures, service outages at third-party Internet providers, or increased government regulation. If disruptions, failures, or slowdowns of our electronic delivery systems or the Internet occur, our ability to distribute our products and services effectively and to serve our customers may be impaired.
We could face liability related to our storage of personal information about our users.
Customers routinely input personal investment and financial information, including portfolio holdings and credit card information, on our Web sites. We could be subject to liability if we were to inappropriately disclose any user’s personal information or if third parties were able to penetrate our network security or otherwise misappropriate any user’s name, address, portfolio holdings, or credit card information. Any such disclosure or breach could subject us to claims for unauthorized purchases with credit card information, impersonation, or other similar fraud claims, or claims for other misuses of personal information, such as unauthorized marketing or unauthorized access to personal portfolio information.
Our future success depends on our ability to recruit and retain qualified employees, including our executive officers.
Our success and future growth depend on our ability to recruit and retain qualified analysts, programmers, designers, product managers, sales staff, customer support representatives, and finance and accounting personnel. We experience competition for analysts and other qualified employees from financial institutions and financial services organizations. These organizations generally have greater resources than we do and therefore may be able to offer significantly more attractive compensation packages to potential employees. Competition for these employees is intense, and we may not be able to retain our existing employees or be able to recruit and retain other highly qualified personnel in the future.
Our future success also depends on the continued service of our executive officers, including Joe Mansueto, our chairman, chief executive officer, and controlling shareholder. The loss of one or more of our executive officers could hurt our business, operating results, or financial condition. We do not carry any life insurance on our executive officers. We do not have employment agreements or non-compete agreements in place with any of our executive officers. They may leave us and work for our competitors or start their own competing businesses.
28
Many of our business ventures are relatively new. Our new ventures (including any products yet to be launched) may not be successful.
A key aspect of our growth strategy is to expand our investment research capabilities and introduce new products and services. In 2005, 2004, and 2003 our development expense represented 8.7%, 9.0%, and 10.5%, respectively, of our revenue. We expect that development expense will continue to represent a meaningful percentage of our revenue in the future. A viable market for our new product offerings may not exist and may not develop, and our offerings may not be well received by potential customers. In addition, certain of our existing businesses, including our investment management operations, have limited operating histories and are not currently profitable. If these businesses do not develop, they could have an adverse impact on our business, operating results, or financial condition.
Changes in laws applicable to our investment advisory operations, compliance failures, or regulatory action could adversely affect our business.
Our investment advisory operations are relatively new and a growing part of our overall business. Our recent acquisition of Ibbotson Associates substantially increased our business in this area. The securities laws and other laws that govern our activities as a registered investment advisor are complex. The activities of our investment advisory operations are primarily subject to provisions of the Investment Advisers Act of 1940 (the Advisers Act) and the Employee Retirement and Investment Security Act of 1974 (ERISA). In addition, our investment management business is conducted through a broker-dealer registered under the Securities Exchange Act of 1934 (the Exchange Act) and is subject to the rules of the National Association of Securities Dealers, Inc. (NASD). It is difficult to predict the future impact of the broad and expanding legislative and regulatory requirements affecting our business. The laws, rules, and regulations applicable to our business may change in the future and we may not be able to comply with any such changes. If we fail to comply with any applicable law, rule, or regulation, we could be fined, sanctioned, or barred from providing investment advisory services in the future, which could materially adversely affect our business, operating results, or financial condition.
Our investment advisory operations may subject us to liability for any losses that result from a breach of our fiduciary duties.
Our investment advisory operations involve fiduciary obligations that require us to act in the best interests of our clients. We may face liabilities for actual or claimed breaches of our fiduciary duties. We may not be able to prevent clients from taking legal action against us for an actual or claimed breach of a fiduciary duty. Because we currently provide investment advisory services on substantial assets, we could face substantial liability to our clients if we breach our fiduciary duties. In addition, we may face other legal liabilities based on the quality and outcome of our investment advisory recommendations, even in the absence of an actual or claimed breach of fiduciary duty.
Our international operations are expanding and involve special challenges that we may not be able to meet.
Over the past three years, our international operations have generated an increasing amount of revenue, expanding from $20.1 million in 2003 to $25.4 million in 2004 to $29.4 million in 2005. There are certain risks inherent in doing business in some jurisdictions internationally, including difficulties in penetrating new markets due to established and entrenched competitors; difficulties in staffing, managing, and integrating foreign operations; differences in international laws and policies; exposure to varying legal standards, including intellectual property protection laws, in other jurisdictions; and foreign currency exchange rates and exchange controls. We do not currently hedge any of our international currency exposure, which may adversely impact our financial performance.
These risks could hamper our ability to expand successfully internationally, which may adversely affect our financial performance and ability to grow.
29
In addition, we now have approximately 130 programmers and data analysts working in our development center in China. Over the past several years, we have been moving a significant percentage of our data collection and development operations to this location. Because China has a restrictive government under centralized control, we cannot predict the level of political and regulatory risk that may impact our operations. Any difficulties that we face in successfully maintaining our development center in China may harm our business and have a negative impact on the products and services we provide.
Changes in market and economic conditions could lower demand for our products and services.
We provide our products and services to individual investors, financial advisors, and institutional clients. Conditions in the financial and securities markets may have an impact on our performance. For example, in the event that the U.S. or international financial markets suffers a downturn that results in a significant decline in investor activity, demand for our products and services may decline, and our revenue and profitability levels could be adversely affected. The financial markets and many businesses operating in the financial services industry are highly volatile and are affected by factors such as U.S. and foreign economic conditions and general trends in business and finance that are beyond our control.
Our results could suffer if the mutual fund industry experiences a downturn or a slowdown in growth.
A significant portion of our revenue is generated from products and services related to mutual funds. The mutual fund industry has experienced substantial growth over the past 20 years. Mutual fund assets may not continue to expand at the same rate in future years. Settlements and regulatory actions in the mutual fund industry following the market-timing scandal that emerged in 2003, downturns in the financial markets, or a relative increase in usage of other investment vehicles could cause a decline in investor interest in mutual funds. If the mutual fund industry experiences a downturn or a slower growth rate than in the past, it could negatively impact demand for our products.
Failure to protect our intellectual property rights could harm our brand-building efforts and ability to compete effectively.
The steps we have taken to protect our intellectual property may not be adequate to safeguard our proprietary information. Further, effective trademark, copyright, and trade secret protection may not be available in every country in which we offer our services. Our continued ability to market one or more of our products under their current names could be adversely affected in those jurisdictions where another person registers, or has a pre-existing registration on, one or more of them. Failure to adequately protect our intellectual property could harm our brand, devalue our proprietary content, and affect our ability to compete in the marketplace.
Control by a principal shareholder could adversely affect our other shareholders.
As of December 31, 2005, Joe Mansueto, our chairman and chief executive officer, owned approximately 75% of our outstanding common stock. As a result, he has the ability to control substantially all matters submitted to our shareholders for approval, including the election and removal of directors and any merger, consolidation, or sale of our assets. He also has the ability to control our management and affairs. This concentration of ownership may delay or prevent a change in control; impede a merger, consolidation, takeover, or other business combination involving us; discourage a potential acquirer from making a tender offer or otherwise attempting to obtain control of us; or result in actions that may be opposed by other shareholders.
Moreover, because of Joe Mansueto’s substantial ownership, we are a “controlled company” for purposes of the NASDAQ Marketplace Rules. This means that, if in the future we elect to be treated as a controlled company under the NASDAQ Marketplace Rules, we will not be required by NASDAQ to have a majority of independent directors or to maintain compensation and nominating and corporate governance committees composed entirely of independent directors to continue to list our shares on NASDAQ.
30
Fluctuations in our operating results may negatively impact our stock price.
We believe our business has relatively large fixed costs and low variable costs, which magnify the impact of revenue fluctuations on our operating results. As a result, a decline in our revenue may lead to a relatively larger impact on operating results. A substantial portion of our operating expense is related to personnel costs, marketing programs, and corporate overhead, none of which can be adjusted quickly. Our operating expense levels are based on our expectations for future revenue. If actual revenue is below management’s expectations, or if our expenses increase before revenues do, our operating results would be materially and adversely affected. In addition, we do not provide earnings guidance or hold one-on-one meetings with institutional investors and research analysts. Because of this policy and limited analyst coverage on our stock, our stock price may be volatile. If our operating results or other operating metrics fail to meet the expectations of outside research analysts and investors, the market price of our common stock may decline.
We have an accumulated deficit and have incurred net losses in the past. We may incur net losses in the future.
As of December 31, 2005, we had an accumulated deficit of $50.6 million. We incurred a net loss of $11.9 million in 2003, partly because of stock-based compensation expense of $29.0 million. We also incurred a net loss of $1.1 million in the fourth quarter of 2004, partly because of stock-based compensation expense of $8.0 million. We may incur net losses in the future.
The future sale of shares of our common stock may negatively impact our stock price.
If our shareholders sell substantial amounts of our common stock, the market price of our common stock could fall. A reduction in ownership by our controlling shareholder or any other large shareholders could cause the market price of our common stock to fall. In addition, the average daily trading volume in our stock is relatively low. The lack of trading activity in our stock may lead to greater fluctuations in our stock price. Low trading volume may also make it difficult for shareholders to make transactions in a timely fashion.
Our shareholders may experience dilution in their ownership positions.
Morningstar has historically granted options to employees as a significant part of our overall compensation package. As of December 31, 2005, our employees and non-employee directors held options to acquire 11,134,807 shares of common stock, 8,295,917 of which were exercisable at a weighted average exercise price of $10.16 per share and 2,838,890 were not exercisable and had an average exercise price of $15.49 per share. We granted options to acquire 1,077,084 shares of common stock in 2005. To the extent that option holders exercise outstanding options to purchase common stock, there may be further dilution. Future grants of stock-based compensation to employees may also result in dilution. We may raise additional funds through future sales of our common stock. Any such financing may result in additional dilution to our shareholders.
We may not be able to raise additional funds to meet operating and cash needs that may arise.
As of December 31, 2005, we had cash and cash equivalents of $92.4 million, plus an additional $60.8 million of investments, consisting primarily of fixed-income securities. In February 2006, we used $22.4 million to pay annual bonuses to our employees. On March 1, 2006, we completed our acquisition of Ibbotson Associates for approximately $83 million of cash and investments, subject to adjustments for working capital and other items. We believe that our available cash balances and investments, along with cash generated from operations, will be sufficient to meet our operating and cash needs for the foreseeable future. However, we cannot guarantee that we will be able to raise additional funds to meet other operating and cash needs that may arise. We do not currently have any lines of credit in place that would enable us to quickly borrow funds. We cannot guarantee that we would be able to establish bank loans, lines of credit, or issue debt securities if we needed to access additional cash.
31
Item 1B. Unresolved Staff Comments
We have not received any comments from the Staff of the Securities and Exchange Commission regarding our periodic or current reports under the Exchange Act.
32
Item 2. Properties
Our headquarters are located in Chicago, Illinois, and consist of approximately 133,000 square feet of leased space. Our lease on this space expires in January 2009. We also lease approximately 68,000 square feet of office space in 12 countries around the world. We believe that our headquarters and other offices are adequate for our immediate needs and that additional or substitute space is available if needed to accommodate growth and expansion.
In December 2005, we signed a 15-year lease for approximately 210,000 square feet of office space in an office tower being constructed at 108 North State Street in Chicago, Illinois. The office tower is expected to be completed by late 2007, and we are scheduled to move into the new space on the lease commencement date, which is in March 2008.
Item 3. Legal Proceedings
Morningstar Australia
In 2001, Mr. Graham Rich, the then managing director and chief executive officer of Morningstar Research Pty Limited (Morningstar Australia), and one of two companies controlled by Mr. Rich, filed a suit in the Supreme Court of New South Wales, Australia against Morningstar and certain of its officers and nominee directors on the board of Morningstar Australia. Mr. Rich also was a beneficial owner of shares in Morningstar Australia. Mr. Rich and his company originally sought an injunction which, if granted, would have precluded Morningstar Australia from terminating the services of Mr. Rich and from issuing additional shares to Morningstar in exchange for the provision of further funding by Morningstar to Morningstar Australia. Further, Mr. Rich and his company sought an order that a provisional liquidator be appointed for Morningstar Australia. The court rejected this injunction application, observing that Morningstar Australia would be insolvent without financial backing from Morningstar. The application for the appointment of a provisional liquidator also failed. The services of Mr. Rich were terminated in November 2001. Mr. Rich and his company were ordered to pay Morningstar’s costs of the injunction proceedings.
Mr. Rich and the two companies noted above have additional pending claims, alleging, among other things, breaches by Morningstar of contracts and statutory and general law duties, misleading, deceptive, and unconscionable conduct by Morningstar, oppression by Morningstar and its nominee directors, claims under the Industrial Relations Act of New South Wales, breaches of directors’ duties by Morningstar’s nominee directors, and conflict of interest. The claims seek various forms of relief, including monetary damages in the amount of Australian $25,000,000, the setting aside of transactions which resulted in Morningstar obtaining control of Morningstar Australia, and an order either setting aside Morningstar’s acquisition of the shares formerly beneficially owned by Mr. Rich and his companies or determining a different price for this acquisition. In the alternative, Mr. Rich and his companies seek an order that they be entitled to purchase the shares in Morningstar Australia at a price to be determined by the court or book value (as defined in the shareholders agreement of Morningstar Australia). Morningstar has denied the claims and filed counter-claims against Mr. Rich and certain of his companies, alleging breaches of statutory, general law, and contractual duties.
In July 2004, the court decided Morningstar’s application for security for its potential additional costs in the litigation by ordering the two companies controlled by Mr. Rich to provide approximately Australian $925,000 to the court as security for these potential costs. Morningstar will be entitled to be paid costs only if the court makes a determination to that effect. The court stayed the proceedings pending its receipt of the security and indicated that it would entertain an application by Morningstar for additional security at a later time in the proceedings.
In May 2005, Mr. Rich obtained conditional leave of the court to begin a proceeding in the name of Morningstar Australia against Morningstar and its nominee directors. The leave was, however, subject to the following conditions: (i) Mr. Rich must pay and bear, and indemnify Morningstar Australia against, all costs, charges, and expenses of and incidental to the bringing and continuation of the proceeding (except as
33
the court may otherwise direct or allow) and may not seek contribution or indemnity from Morningstar Australia for any of these costs, charges, or expenses; (ii) Morningstar Australia, or Mr. Rich on its behalf, together with the two companies controlled by Mr. Rich must provide to the court, as security for Morningstar’s costs, approximately Australian $925,000 as described in the preceding paragraph; and (iii) approximately Australian $100,000 in costs owed by Mr. Rich and one of his companies to Morningstar in respect of the 2001 injunction proceedings must also be paid to Morningstar.
In July 2005, Mr. Rich provided the indemnity and he and his companies paid Morningstar the costs in respect of the 2001 injunction proceedings in the amount of approximately Australian $116,000. Mr. Rich and his companies have satisfied the obligation to provide the court with security for Morningstar’s potential costs by arranging for two bank guarantees, one, as of July 12, 2005, in the amount of Australian $350,000, and a second, as of January 31, 2006, in the amount of Australian $300,000. Security for approximately Australian $275,000 is due to the court on June 30, 2006.
On September 20, 2005, Mr. Rich and his companies filed a Second Further Amended Statement of Claim, consolidating the claims. Morningstar filed a Defence to that pleading and an Amended Cross-Claim against Mr. Rich, both his companies, and a third Australian company controlled by Mr. Rich.
The parties have discussed settling the claims but have been unable to reach an agreement. In the fourth quarter of 2003, Morningstar offered to settle all claims for Australian $1,250,000, which then approximated U.S. $942,000, and, in accordance with Statement of Financial Accounting Standards (SFAS) No. 5, Accounting for Contingencies (SFAS No. 5), Morningstar recorded a reserve in this amount. In December 2005, we increased our offer to settle all claims to approximately Australian $2,500,000 million, which approximates U.S. $1,800,000 million, and, in accordance with SFAS No. 5, have a reserve recorded for this amount. While Morningstar is vigorously contesting the claims against it, we cannot predict the outcome of the proceeding.
Securities and Exchange Commission “Wells Notice”
The staff of the Securities and Exchange Commission (SEC) conducted an investigation related to incorrect total return data that Morningstar published with respect to a single mutual fund, the Rock Canyon Top Flight Fund, that overstated the fund’s returns. In May 2004, Morningstar received a “Wells Notice” from the staff of the Division of Enforcement of the SEC indicating that it intended to recommend that the SEC take legal action against Morningstar alleging that it violated Section 17(a) of the Securities Act of 1933 and Section 10(b) of the Securities Exchange Act of 1934 and Rule 10(b)-5 promulgated thereunder. On February 7, 2006, the SEC’s Division of Enforcement informed Morningstar that it had decided not to proceed with an action against Morningstar.
Morningstar Associates, LLC Subpoenas from New York Attorney General’s Office, Securities and Exchange Commission, and Department of Labor
In December 2004, Morningstar Associates, LLC, a wholly owned subsidiary of Morningstar, Inc., received a request in the form of a subpoena from the New York Attorney General’s office, seeking information and documents from Morningstar Associates related to an investigation the New York Attorney General’s office is conducting. While the subpoena is very broad, it specifically asks for information and documents about the investment consulting services Morningstar Associates offers to retirement plan providers, including fund lineup recommendations for retirement plan sponsors. On December 16, 2004, shortly after the New York Attorney General’s office issued the subpoena, the SEC notified Morningstar Associates and Morningstar Investment Services, Inc. that it had begun an examination. In February 2005, the SEC issued a request to Morningstar Associates for the voluntary production of documents. The request is similar in scope to the New York Attorney General’s subpoena. In May 2005, Morningstar Associates received a request in the form of a subpoena from the United States Department of Labor, seeking information and documents from Morningstar Associates related to an investigation the Department of Labor is conducting. While the Department of Labor subpoena is very broad, it is substantially similar in scope to the New York Attorney General subpoena and the SEC request. In July 2005, the SEC issued a subpoena to Morningstar Associates. The subpoena is virtually
34
identical to the SEC’s February 2005 request. We have been fully cooperating with the New York Attorney General’s office, the SEC, and the Department of Labor. Although we believe the focus of these investigations is on Morningstar Associates, information and documents pertaining to Morningstar, Inc. and Morningstar Investment Services have also been requested. We cannot predict the scope, timing, or outcome of these matters, which may include the institution of administrative, civil injunctive, or criminal proceedings, the imposition of fines and penalties, and other remedies and sanctions, any of which could lead to an adverse impact on our stock price, the inability to attract or retain key employees, and the loss of customers. We also cannot predict what impact, if any, these matters may have on our business, operating results, or financial condition.
In addition to these proceedings, we are involved in legal proceedings and litigation that have arisen in the normal course of our business. Although the outcome of a particular proceeding can never be predicted, we do not believe that the result of any of these matters will have a material adverse effect on our business, operating results, or financial condition.
Item 4. Submission of Matters to a Vote of Security Holders
No matters were submitted to a vote of our security holders, through the solicitation of proxies or otherwise, during the quarter ended December 31, 2005.
Part II
Item 5. Market for Registrant’s Common Equity, Related Stockholder Matters, and Issuer Purchases of Equity Securities
Our common stock is listed on the Nasdaq National Market under the symbol “MORN.”
The following table shows the high and low price per share of our common stock for the periods indicated, as reported on the Nasdaq National Market:
Year Ended December 31, 2005 | | High | | Low | |
| | | | | |
Second Quarter (our stock was first publicly traded on May 3, 2005) | | $ | 29.59 | | $ | 18.51 | |
| | | | | |
Third Quarter | | $ | 34.10 | | $ | 26.01 | |
| | | | | |
Fourth Quarter | | $ | 37.43 | | $ | 24.83 | |
As of March 2, 2006, the last reported price on the Nasdaq National Market for our common stock was $41.46 per share and there were approximately 70 shareholders of record of our common stock.
We do not currently pay cash dividends nor have we paid cash dividends during the period covered by the financial statements included in this Annual Report on Form 10-K. Any determination to pay dividends in the future will be at the discretion of our board of directors and will be dependent upon our results of operations, financial condition, contractual restrictions, restrictions imposed by applicable law, and other factors deemed relevant by the board of directors. Future indebtedness and loan facilities may also prohibit or restrict our ability to pay dividends and make distributions to our shareholders.
Our directors and executive officers may purchase or sell shares of our common stock from time to time. We encourage them to make these transactions through plans that comply with Exchange Act Rule 10b5-1(c). We intend to provide summary disclosure in our Form 10-Q and Form 10-K reports about plans adopted by our directors or executive officers that are then in effect.
Paul Sturm, who is a member of our board of directors but not employed by us, entered into a Rule 10b5-1 sales plan dated December 16, 2005 contemplating the sale of up to 120,000 shares during 2006 in monthly
35
increments of up to 10,000 shares. As of March 1, 2006, a total of 20,000 shares had been sold under this plan. As of March 1, 2006, none of our other directors or executive officers had Rule 10b5-1 plans in effect.
In May 2005, we completed our initial public offering of 7,612,500 shares of our common stock. These shares commenced trading on May 3, 2005 on the Nasdaq National Market under the symbol “MORN.” All of these shares were sold by affiliates of SOFTBANK Finance Corporation, a wholly owned subsidiary of SOFTBANK Corp. We did not receive any proceeds from the sale of these shares. We granted the underwriters the option to purchase up to an additional 1,141,875 shares at the initial public offering price of $18.50 per share to cover over-allotments. In May 2005, the underwriters exercised their over-allotment option in full. Our net proceeds from the exercise of the underwriters’ over-allotment option were $18.1 million, after deducting underwriting discounts and commissions and approximately $2.6 million of offering expenses. On March 1, 2006, we completed our acquisition of Ibbotson Associates for $83 million in cash, subject to adjustments for working capital and other items. We funded a portion of the purchase price with our net proceeds from the exercise of the underwriters’ over-allotment option.
Item 6. Selected Financial Data
The selected historical financial data shown below should be read in conjunction with “Management’s Discussion and Analysis of Financial Condition and Results of Operations” and our Consolidated Financial Statements and related notes included elsewhere in this Annual Report on Form 10-K. We have derived our Consolidated Statements of Operations Data and Other Consolidated Financial Data for the years ended December 31, 2005, 2004, and 2003 and Consolidated Balance Sheet Data as of December 31, 2005 and 2004 from our audited Consolidated Financial Statements included in this Annual Report on Form 10-K. The Consolidated Statements of Operations Data and Other Consolidated Financial Data for the years ended December 31, 2002 and 2001 and Consolidated Balance Sheet Data as of December 31, 2003, 2002, and 2001 were derived from our audited Consolidated Financial Statements that are not included in this Annual Report on Form 10-K.
Consolidated Statements of Operations Data
(in thousands except per share amounts) | | 2001 | | 2002 | | 2003 | | 2004 | | 2005 | |
Revenue | | $ | 91,230 | | $ | 109,619 | | $ | 139,496 | | $ | 179,658 | | $ | 227,114 | |
Operating expense | | 107,621 | | 117,959 | | 150,250 | | 161,923 | | 180,634 | |
Operating income (loss) | | (16,391 | ) | (8,340 | ) | (10,754 | ) | 17,735 | | 46,480 | |
Non-operating income, net | | 676 | | 4,463 | | 1,110 | | 1,805 | | 3,199 | |
Income (loss) before income taxes, equity in net income of unconsolidated entities, minority interest in net loss of consolidated entities, and extraordinary gain | | (15,715 | ) | (3,877 | ) | (9,644 | ) | 19,540 | | 49,679 | |
Income tax expense (benefit) | | (5,276 | ) | (311 | ) | 2,950 | | 11,574 | | 20,224 | |
Equity in net income of unconsolidated entities | | 359 | | 750 | | 697 | | 843 | | 1,662 | |
Minority interest in net loss of consolidated entities | | 785 | | 178 | | — | | — | | — | |
Income (loss) before extraordinary gain | | (9,295 | ) | (2,638 | ) | (11,897 | ) | 8,809 | | 31,117 | |
Extraordinary gain—acquisition | | — | | 3,084 | | — | | — | | — | |
Net income (loss) | | $ | (9,295 | ) | $ | 446 | | $ | (11,897 | ) | $ | 8,809 | | $ | 31,117 | |
Basic income (loss) per share: | | | | | | | | | | | |
Income (loss) before extraordinary gain | | $ | (0.24 | ) | $ | (0.07 | ) | $ | (0.31 | ) | $ | 0.23 | | $ | 0.79 | |
Extraordinary gain—acquisition | | — | | 0.08 | | — | | — | | — | |
Basic income (loss) per share | | $ | (0.24 | ) | $ | 0.01 | | $ | (0.31 | ) | $ | 0.23 | | $ | 0.79 | |
Weighted average common shares outstanding—basic | | 38,298 | | 38,345 | | 38,382 | | 38,418 | | 39,392 | |
Diluted income (loss) per share: | | | | | | | | | | | |
Income (loss) before extraordinary gain | | $ | (0.32 | ) | $ | (0.17 | ) | $ | (0.31 | ) | $ | 0.21 | | $ | 0.70 | |
Extraordinary gain—acquisition | | — | | 0.08 | | — | | — | | — | |
Diluted income (loss) per share | | $ | (0.32 | ) | $ | (0.09 | ) | $ | (0.31 | ) | $ | 0.21 | | $ | 0.70 | |
Weighted average common shares outstanding—diluted | | 41,364 | | 40,361 | | 38,382 | | 41,858 | | 44,459 | |
36
Other Consolidated Financial Data ($000) | | 2001 | | 2002 | | 2003 | | 2004 | | 2005 | |
Stock-based compensation expense (income) under the liability method | | $ | (3,336 | ) | $ | (3,283 | ) | $ | 17,796 | | $ | 8,963 | | $ | 2,810 | |
Stock-based compensation expense under the equity method | | 9,003 | | 10,575 | | 11,233 | | 7,760 | | 8,085 | |
Total stock-based compensation expense (1) | | $ | 5,667 | | $ | 7,292 | | $ | 29,029 | | $ | 16,723 | | $ | 10,895 | |
Operating income (loss) before stock-based compensation expense (2) | | $ | (10,724 | ) | $ | (1,048 | ) | $ | 18,275 | | $ | 34,458 | | 57,375 | |
Sales tax expense (income) (3) | | | 2,294 | | | 2,837 | | | 3,079 | | | — | | | (300 | ) |
Cash provided by (used for) investing activities | | | 2,777 | | | (6,068 | ) | | (29,634 | ) | | (22,750 | ) | | (16,913 | ) |
Cash provided by (used for) financing activities | | | (1,049 | ) | | (1,952 | ) | | (26 | ) | | (6,367 | ) | | 25,256 | |
| | | | | | | | | | | | | | | | |
Cash provided by (used for) operating activities | | $ | (5,183 | ) | $ | 16,542 | | $ | 29,705 | | $ | 32,862 | | $ | 48,445 | |
Capital expenditures | | (5,932 | ) | (5,989 | ) | (8,607 | ) | (7,730 | ) | (7,451 | ) |
Free cash flow (4) | | $ | (11,115 | ) | $ | 10,553 | | $ | 21,098 | | $ | 25,132 | | $ | 40,994 | |
Consolidated Balance Sheet Data
As of December 31 ($000) | | 2001 | | 2002 | | 2003 | | 2004 | | 2005 | |
Cash, cash equivalents, and investments | | $ | 47,650 | | $ | 64,796 | | $ | 76,158 | | $ | 95,463 | | $ | 153,190 | |
Working capital (deficit) (5) | | 1,165 | | 10,005 | | (5,206 | ) | 16,902 | | 90,374 | |
Total assets | | 128,735 | | 152,781 | | 180,265 | | 213,361 | | 296,311 | |
Long-term liabilities (6) | | 26,315 | | 21,243 | | 25,486 | | 30,128 | | 6,756 | |
Total shareholders’ equity (6) (7) | | 35,970 | | 48,132 | | 44,821 | | 64,381 | | 173,714 | |
| | | | | | | | | | | |
| | | | | | | | | | | | | | | | |
(1) We follow Statement of Financial Accounting Standards (SFAS) No. 123, Accounting for Stock-Based Compensation (SFAS No. 123), in all periods presented. The total expense for stock-based compensation is distributed with other employee compensation costs in the appropriate expense categories of our Consolidated Statements of Operations. Prior to our initial public offering in May 2005, in accordance with SFAS No. 123, we used two accounting methods. For options granted under plans that may have required us to settle the options in cash, we used the liability method. Under this method we recorded a liability for a vested option equal to the difference between the option exercise price and the fair value of the shares of common stock underlying the option at the end of the reporting period. If this fair value increased over the reporting period, we recorded an expense and, if it decreased, we recorded income. For options granted under plans that did not require us to settle the options in cash, we used the equity method. Under this method we calculated the fair value of the option at the time of grant
37
using a Black-Scholes model and recorded expense over the vesting period. In each year, our aggregate stock-based compensation expense reflects the impact of options granted in prior years.
Subsequent to our initial public offering, we no longer settle stock options for cash. As a result, all of our options are currently accounted for under the equity method of SFAS No. 123. Refer to Note 12 of the Notes to our Consolidated Financial Statements for more information on our stock-based compensation.
SFAS No. 123 (Revised 2004), Share-Based Payment (SFAS No. 123 (R)), requires all public companies to measure compensation cost for all share-based payments (including employee stock options) at fair value. We adopted SFAS No. 123 (R) in January 2006, and will record a cumulative effect of accounting change, net of tax, of approximately $0.3 million in the first quarter of 2006.
(2) “Operating income (loss) before stock-based compensation expense” is defined as operating income (loss) before the effect of our stock-based compensation expense as described in note (1) above. We expect stock-based compensation expense to be a recurring cost. We have presented operating income (loss) before stock-based compensation expense solely as a supplemental disclosure to help investors better understand the performance of our business, to enhance comparison of our performance from period to period, and to allow better comparison of our performance with that of our competitors. We use operating income (loss) before stock-based compensation expense to evaluate the performance of our business. Operating income (loss) before stock-based compensation should not be considered an alternative to any measure of performance as promulgated under U.S. generally accepted accounting principles (U.S. GAAP) (such as operating income (loss)), nor should this data be considered an indicator of our overall financial performance or liquidity. Also, the calculation of operating income (loss) before stock-based compensation expense used by us may not be comparable to similarly titled measures reported by other companies. The table below reconciles operating income (loss) to operating income (loss) before stock-based compensation expense:
($000) | | 2001 | | 2002 | | 2003 | | 2004 | | 2005 | |
Operating income (loss) | | $ | (16,391 | ) | $ | (8,340 | ) | $ | (10,754 | ) | $ | 17,735 | | $ | 46,480 | |
Add back: Stock-based compensation expense | | 5,667 | | 7,292 | | 29,029 | | 16,723 | | 10,895 | |
Operating income (loss) before stock-based compensation expense | | $ | (10,724 | ) | $ | (1,048 | ) | $ | 18,275 | | $ | 34,458 | | $ | 57,375 | |
(3) In 2003, we began participating in voluntary disclosure or similar programs related to state sales tax. Through these programs, we identified sales tax amounts due for prior years and negotiated or are in discussions with local tax authorities to settle these amounts. We recorded expense for these amounts in 2000, 2001, 2002, and 2003. During 2005, we decreased the liability related to these voluntary disclosure programs by $0.3 million due to changes in estimated liabilities.
(4) We define free cash flow as cash provided by (used for) operating activities less capital expenditures. We present free cash flow solely as supplemental disclosure to help investors better understand how much cash is available after we spend money to operate our business. Our management team uses free cash flow to evaluate the performance of our business. Free cash flow should not be considered an alternative to any measure of performance as promulgated under U.S. GAAP (such as cash provided by (used for) operating, investing, and financing activities), nor should this data be considered an indicator of our overall financial performance or liquidity. Also, the free cash flow definition we use may not be comparable to similarly titled measures reported by other companies.
(5) We frequently invoice or collect cash in advance of providing services or fulfilling subscriptions for our customers. These amounts, which are recorded as deferred revenue on our Consolidated Balance Sheets, totaled $71.2 million as of December 31, 2005. As a result of recording deferred revenue, our working capital may at times be negative.
38
(6) In the second quarter of 2005, upon completion of our initial public offering, we reclassified $24.9 million related to stock options accounted for as long-term liabilities, in accordance with SFAS No. 123, to additional paid-in capital.
(7) In May 2005, we completed our initial public offering of 7,612,500 shares of our common stock. These shares commenced trading on May 3, 2005 on the Nasdaq National Market under the symbol “MORN.” All of these shares were sold by affiliates of SOFTBANK Finance Corporation, a wholly owned subsidiary of SOFTBANK Corp. We did not receive any proceeds from the sale of these shares. In addition, we granted the underwriters the right to purchase up to an additional 1,141,875 shares at the initial public offering price to cover over-allotments. In May 2005, the underwriters exercised their over-allotment option in full. We received net proceeds of $18.1 million based on our initial public offering price of $18.50 per share, after deducting the underwriting discounts and commissions and $2.6 million of offering expenses.
39
Item 7. Management’s Discussion and Analysis of Financial Condition and Results of Operations
The discussion included in this section, as well as other sections of this Annual Report on Form 10-K, contains forward-looking statements within the meaning of the Private Securities Litigation Reform Act of 1995. These statements relate to future events or to our future financial performance and involve known and unknown risks, uncertainties, and other factors that may cause our actual results, levels of activity, performance, or achievements to be materially different from any future results, levels of activity, performance, or achievements expressed or implied by these forward-looking statements. In some cases, you can identify forward-looking statements by the use of words such as “may,” “could,” “expect,” “intend,” “plan,” “seek,” “anticipate,” “believe,” “estimate,” “predict,” “potential,” or “continue” or the negative of these terms or other comparable terminology. You should not place undue reliance on forward-looking statements because they involve known and unknown risks, uncertainties, and other factors that are, in some cases, beyond our control and that could materially affect actual results, levels of activity, performance, or achievements.
Other factors that could materially affect actual results, levels of activity, performance, or achievements can be found in Item 1A — Risk Factors of this Annual Report on Form 10-K. If any of these risks or uncertainties materialize, or if our underlying assumptions prove to be incorrect, actual results may vary significantly from what we projected. Any forward-looking statement you read in this Annual Report on Form 10-K reflects our current views with respect to future events and is subject to these and other risks, uncertainties, and assumptions relating to our operations, results of operations, growth strategy, and liquidity. We assume no obligation to publicly update or revise these forward-looking statements for any reason, whether as a result of new information, future events, or otherwise.
Understanding Our Company
Our mission is to create great products that help investors reach their financial goals. We offer an extensive line of Internet, software, and print-based products for individual investors, financial advisors, and institutional clients. We also offer asset management services to advisors and institutional clients. We have historically generated recurring revenue because many of our products are sold through subscriptions or license agreements. We believe that while the investments in our business are significant, the variable cost of adding customers is considerably lower, particularly as our products and services focus more on Internet-based platforms and assets under management. We strive to realize this operating leverage by selling a wide variety of products and services to multiple investor segments, through multiple media, and in many geographic markets.
We manage Morningstar to maximize our long-term results, while staying focused on our mission of helping investors and adhering to our company values. We invest significantly in new product development and in enhancements to our current offerings. It typically takes many years to recoup these investments, but we believe they are critical to building long-term value for our shareholders.
We emphasize a decentralized approach to running our business to empower our managers and to create a culture of responsibility and accountability. Our decentralized business structure includes three global business segments: Individual, Advisor, and Institutional. Early in our history, our product lineup emphasized products for individual investors. As a result, the Individual segment contributed a majority of our revenue. In the early 1990s, our Advisor segment became a more important part of our business. More recently, we’ve begun serving more investors through our Institutional segment, which was the largest of our three segments in terms of revenue in 2005, 2004, and 2003. In all three of these segments, we believe our work helps individual investors make better investment decisions.
In March 2006, we acquired Ibbotson Associates, a privately held firm that specializes in asset allocation research and services, for approximately $83 million in cash, subject to adjustments for working capital and other items. This acquisition fits several of our growth strategies and broadens our reach in the areas of investment consulting, managed retirement accounts, and institutional and advisor software.
Key Business Characteristics
We believe our business has the following characteristics:
Recurring Revenue
We have historically generated recurring revenue because many of our products are sold through subscriptions or license agreements. These subscriptions and licenses generally come up for renewal after one- to three-year terms. Many of the license agreements in our Advisor and Institutional segments span multiple years. Because of this recurring revenue, we generally have subscriptions and license agreements in place for a meaningful percentage of our total annual revenue at the beginning of each year. We think of this as our “walk-in” revenue.
We separate our annual revenue into three categories, defined as follows:
40
• New revenue. We define new revenue as revenue from selling additional products to current customers or from selling to new customers;
• Renewal revenue. We define renewal revenue as revenue from renewals of subscriptions or licenses; and
• “Walk-in” revenue. We define “walk-in” revenue as revenue we expect to recognize during the year from subscriptions and license agreements in place as of January 1 of each year adjusted for cancellations, currency translations, and other routine adjustments during the year. For example, as of January 1, 2005, we had agreements in place that were expected to generate $124.9 million of revenue in 2005. During 2005, cancellations and other routine adjustments subsequently reduced this revenue by approximately 2%. As we progress through the calendar year, we expect that walk-in revenue will represent a smaller part of each quarter’s revenue as subscriptions and license agreements in place at the beginning of the year expire or come up for renewal; similarly, we expect that revenue from new contracts and renewals will represent a greater share of each sequential quarter’s revenue.
In addition to looking at the mix of walk-in, renewal, and new revenue for each period, we calculate a retention rate to evaluate how successful we’ve been in maintaining existing business for products and services that have renewable revenue. We use two different methods for calculating retention. For subscription-based products (including our print newsletters, Morningstar.com Premium Membership service, and Principia), we track the number of subscriptions retained during the year. For products sold through contracts and licenses, we use the contract value method, which is based on tracking the dollar value of renewals compared with the total dollar value of contracts up for renewal during the period. We include changes in the contract value in the renewal amount, unless the change specifically results from adding a new product that we can identify. The retention rate excludes setup and customization fees, migrations to other Morningstar products, and contract renewals that were still pending as of January 31, 2006.
Significant Operating Leverage
Our business requires significant investments to create and maintain proprietary databases and content. We strive to leverage these costs by selling a wide variety of products and services to multiple investor segments, through multiple media, and in many geographic markets. We believe that while the investments in our business are significant, the variable cost of adding customers is considerably lower, particularly as our products and services focus more on Internet-based platforms and assets under management. Historically, we have made investments in building our databases and content that have adversely affected our short-term operating results for certain periods. In the past several years, our profitability has improved because we’ve been able to increase revenue without increasing our cost base at the same rate. We look for this operating leverage to be evident in our operations over the long term.
Deferred Revenue
We frequently collect cash in advance of providing services or fulfilling subscriptions for our customers. As a result, we can use some of this cash to fund our operations and invest in new product development. Although we may need to issue refunds for the unused portion of the subscription if a customer cancels, we generally have used cash collected in advance of providing services or fulfilling subscriptions to fund many of our other activities. The deferred revenue shown on our balance sheet totaled $71.2 million and $63.4 million as of December 31, 2005 and 2004, respectively.
How We Evaluate Our Business
When our analysts evaluate a stock, they focus on assessing the company’s estimated intrinsic value—the value of the company’s future cash flows, discounted to their worth in today’s dollars. Our approach to evaluating our own business works the same way. Our goal is to increase the intrinsic value of our business over time, which we believe is the best way to create value for our shareholders.
We do not make public financial forecasts for our business because they are, by their nature, subjective and could have an effect on our company’s stock price. We want to avoid creating any incentive within our company to alter behavior to “make the numbers.”
We provide three specific measures that can help investors generate their own assessment of how our intrinsic value has changed over time:
• Revenue;
• Operating income (loss); and
• Free cash flow.
41
We define free cash flow as cash provided by operating activities less capital expenditures. We present free cash flow solely as supplemental disclosure to help investors better understand how much cash is available after we spend money to operate our business. Our management team uses free cash flow to evaluate the performance of our business. Free cash flow should not be considered an alternative to any measure of performance as promulgated under U.S. generally accepted accounting principles (U.S. GAAP) (such as cash provided by (used for) operating, investing, and financing activities), nor should this data be considered an indicator of our overall financial performance or liquidity. Also, the free cash flow definition we use may not be comparable to similarly titled measures reported by other companies.
How Our Business Works
Revenue
We earn revenue by selling a variety of investment-related products and services. Many of our offerings, such as our newsletters, Principia software, and Premium service on Morningstar.com, are sold via subscriptions. These subscriptions are mainly offered for a one-year term, although we also offer terms over other periods ranging from one month to three years. We also sell advertising on our Web sites in the United States and internationally. Several of our other products are sold through license agreements, including Morningstar Advisor Workstation, Morningstar Equity Research, Morningstar Direct, Morningstar Retirement Manager, and Licensed Data. Our license agreements typically range from one to three years. For some of our other institutional services, mainly Investment Consulting, our fees are generally based on the scope of work and the level of service we provide. Finally, we collect fees relating to Morningstar Managed Portfolios, managed retirement account services, and Investment Consulting that are calculated as a percentage of total assets under management.
Operating Expense
We classify our expenses into separate categories for cost of goods sold, development, sales and marketing, general and administrative, and depreciation and amortization, as described below. We include stock-based compensation expense, as appropriate, in each of these categories.
• Cost of goods sold. This category includes the compensation expense for employees who produce the products we deliver to our customers. For example, this category covers the cost of production teams and analysts who write investment research reports. Cost of goods sold also includes other expenses such as postage, printing, and CD-ROM replication, as well as shareholder servicing fees for Morningstar Managed Portfolios.
• Development. This category mainly includes compensation expense for programmers, designers, and other employees who develop new products and make enhancements to existing products. In some cases, we capitalize the compensation costs associated with certain development projects. This reduces the expense that we would otherwise report in this category. We amortize these capitalized costs over the estimated economic life of the software, which is generally three years.
• Sales and marketing. This category includes compensation expense for our sales teams, product managers, and other marketing professionals. We also include the cost of advertising, direct mail campaigns, and other marketing programs to promote our products.
• General and administrative. This category consists mainly of compensation expense for each segment’s management team, as well as human resources, finance, and support employees for each segment. The category also includes compensation expense for senior management and corporate expenses, including corporate systems, accounting, legal, and facilities expense.
• Depreciation and amortization. Our capital expenditures consist mainly of computers, leasehold improvements, and capitalized product development costs related to certain software development projects. We recognize depreciation and amortization costs for these items over their estimated useful lives, generally ranging from three to seven years. We also include amortization related to intangible assets in this category.
International Operations
We consolidate the results of our majority-owned international operations. We account for our investments in Japan, Korea, Denmark, and Sweden using the equity method.
Industry Overview
We monitor developments in the economic and financial information industry on an ongoing basis and use these insights to help inform our company strategy, product development plans, and marketing initiatives.
42
Investment Landscape and Database Areas
Performance in the U.S. equity markets fell behind the double-digit gains shown in 2003 and 2004, but stocks continued to generate positive returns in 2005. Morningstar’s U.S. Market Index, a broad equity market benchmark, posted total returns of 6.5% for the year. With the investment climate generally favorable and all domestic equity-fund categories posting positive total returns for the year, mutual funds based in the United States enjoyed positive cash flows for the year, although cash flows into equity and hybrid funds were lower than in 2004. Net cash flows into taxable bond, municipal bond, and money market funds all increased over 2004 levels. Although the number of mutual funds declined slightly during 2005, total fund assets increased by about 9.4% to $8.9 trillion as of year-end. The Investment Company Institute estimates that approximately 53.7 million households in the United States, or 47.5% of all households, own mutual funds, which is down slightly from the peak level in 2001. We believe that continued asset growth and widespread usage of mutual funds is significant because a large portion of Morningstar’s business has historically focused on this area. We estimate that information and analysis related to mutual funds account for approximately two thirds of our total revenue, although this amount has been declining as we expand into equity research and other areas.
We continued to see debate about pricing models for securities research during 2005, which we think is significant because it has long-term implications for all independent equity research providers. During 2005, Fidelity announced a pilot program to unbundle its research and trade execution costs with Lehman Brothers and will pay for them separately going forward. Fidelity also announced an agreement with Deutsche Bank Securities to pay separately for its proprietary research instead of including it in trading costs. This follows a similar move by MFS Investment Management, which discontinued its use of soft dollar research payments in 2004. During 2005, the SEC issued more specific guidance on soft dollar research payments. We believe these developments will help enhance pricing transparency for mutual fund shareholders and others, as well as encouraging debate about the value of independent research.
We continued to see strong interest in alternative asset classes during 2005. Hedge funds, in particular, continued to enjoy strong growth. Based on the latest Hedge Fund Manager/Advent survey of hedge fund administrators, total hedge fund assets worldwide increased to $2.2 trillion as of November 2005, a 49% increase from $1.5 trillion in November 2004. Single-managed hedge funds now claim $1.4 trillion in total assets, while assets in hedge funds of funds total about $700 billion. The number of hedge funds and funds of funds continued to balloon, with more than 15,000 funds in existence as of November 2005, compared with about 12,000 as of November 2004. We continue to invest in developing our hedge fund database and plan to continue expanding our efforts in this area to meet investors’ need for information on this asset class.
Asset growth in separately managed accounts was also relatively strong in 2005. Based on data from the Money Management Institute, assets in separate accounts increased by about 21% to reach $646 billion as of September 30, 2005. The average account balance and number of separate accounts have also continued to expand. Until now, however, separate account performance and operations information has largely only been available from advisors or investment consultants. To help enhance investor understanding of separately managed accounts, we recently partnered with Barron’s to create a new Separate Accounts Quarterly Review. The new section, which will appear in Barron’s print and online editions on a regular basis, will include articles about the separate account industry accompanied by a series of data tables. We are providing several statistics such as total returns, fee information, and Morningstar Ratings for our entire database, which includes approximately 5,000 separate account strategies (including retail and institutional accounts) from about 1,000 money managers.
Assets in exchange-traded funds increased 30.8% to reach about $296 million as of December 2005, compared with $226 million as of December 2004, based on data from the Investment Company Institute. Exchange-traded funds continued to gain share from mutual funds in some specialized areas of the market thanks to their lower annual costs, particularly in passive investing strategies. To meet greater investor demand for information on exchange-traded funds, we have increased our analyst coverage in this area and recently introduced the Morningstar ETFs 100, an annual softcover reference guide. In March 2006, we introduced a new rating system for exchange-traded funds.
Individual Investor Market
With market conditions generally positive, the environment for advertising sales has been relatively healthy. A recent report from Credit Suisse First Boston increased previous estimates for online advertising in the fourth quarter of 2005, as well as projected spending for 2006. Based on a survey of online advertisers, the report forecasts total spending on online advertising to reach $16.6 billion in 2006, compared with a previous estimate of $14.9 billion, reflecting a shift from traditional print, radio, and television placements to online. Because of favorable conditions for Internet advertising, we plan to increase our prices for online advertising in 2006.
Based on research from Nielsen NetRatings, Yahoo! Finance maintained a dominant share of total page views and user visits compared with other retail investment Web sites in 2005. Page views to Morningstar.com remained lower than those of supersites
43
such as Yahoo! Finance, AOL Money & Finance, and MSN Money during 2005, but average monthly page views were about 30% higher in the second half of the year relative to the first half.
We continue to define Morningstar.com as a targeted site that appeals to experienced and engaged investors. Although total page views to our site are lower than those of larger supersites, the average number of pages per visit and length of time per visit is significantly higher. We believe this indicates that investors view our site as a place that is worth spending time with and that they find value in the information we provide. We also appeal to a highly qualified audience based on income levels and investable assets.
Financial Advisor Market
The aging of the American population and the corresponding need for more information and advice on retirement income planning has been an important trend in the advisor segment. Morningstar has been actively developing retirement income software to meet this emerging need, and we expect to launch these applications during 2006. Ibbotson Associates, which we acquired in March 2006, also offers several research tools and applications to help meet the growing need for information on retirement income management.
Many advisors have also sought to streamline and simplify their operations; to meet this need, some advisors have been outsourcing investment management so they can spend more time on planning-related issues and client management. We’ve also seen a continuing consolidation trend among broker-dealers and other firms in the advisor segment. We believe that this ongoing acquisition trend is being driven by the desire to offer comprehensive financial solutions and maximize cost efficiencies. Some studies suggest that smaller advisory firms are continuing to struggle amid higher costs and lower revenue growth. Independent financial advisors have continued to gain market share among high-net-worth investors, but larger institutions are benefiting from their lower cost structures and economies of scale. As the financial advisory landscape continues to evolve, we believe advisors will continue to demand comprehensive research platforms and integrated portfolio tools.
Institutional Market
Insurance companies and mutual fund companies continued to struggle to find unique ways to attract and serve the needs of aging baby boomers during 2005. We believe many companies are focusing resources on this growing trend, including creating tailored investment products and developing planning tools tailored to meet the needs of this market segment. The increased need for retirement income planning has also been an area of focus for brokers, investment advisors, and insurance companies.
The trend toward packaged/wrapped investment products, including mutual fund wrap programs, lifestyle funds, target maturity funds, and managed accounts, is another key trend in the institutional segment. Many of these programs match investors to an asset allocation and investment portfolio that automatically rebalances over time. These products simplify the investment process and help investors outsource the investment decision-making process.
A report published in July 2005 by Financial Research Corporation noted that the variable annuity industry has continued to increase its usage of funds of funds to address regulatory concerns that asset allocation programs offered through variable annuities constitute investment advice and therefore need to be offered by a registered investment advisor.
In the retirement market, the House and Senate passed two key pension reform bills, HR 2830 and S 1783, toward the end of 2005. While both bills primarily address pension issues, they also contain provisions related to defined contribution plans. Among other things, the House bill would allow large retirement plan administrators to offer their own investment advice to plan participants, including possible recommendations of proprietary funds being offered on their platforms. The Senate bill includes a provision granting employers and other retirement plan fiduciaries a safe harbor from liability arising from providing independent, third-party investment advice to plan participants. The two bills also include measures that would encourage companies to automatically enroll employees in 401(k) plans. We expect lawmakers to meet in 2006 to address the differences between the two bills.
International Markets
Overall, mutual funds outside of the United States continued to grow at a moderate pace during the year, with total worldwide fund assets increasing about 19.4% over the prior-year period to $17.3 trillion as of September 30, 2005 based on data from the Investment Company Institute. We continued to see a trend toward structured investment products, such as funds of funds and other packaged products, in major asset management markets worldwide during 2005.
Europe remained the largest fund market outside of the United States, with nearly $6 trillion in assets as of September 30, 2005. Mutual funds based in Luxembourg, which has emerged as a center of funds management in Europe, continued to enjoy strong net sales in 2005, as did funds in France, the second-largest fund market in Europe. Prominent U.S.-based asset managers such as
44
Fidelity and Franklin Templeton continued to gain market share in Europe versus local-market asset managers. In the United Kingdom, the Pensions Act of 2004 is slated to go into effect in April 2006 and represents a far-reaching reform of tax laws that govern pension contributions and benefits. We expect that this law will increase employee contributions into private pension funds. Also in the United Kingdom, regulators continue to demand more transparency from funds.
In Asia, funds based in Japan had strong net sales in each of the first three quarters, although performance in other Asian markets was mixed. Wrap account assets in Japan have also continued to increase following the government’s decision in 2004 to allow securities firms to offer them to high-end investors.
Funds based in Canada continued to enjoy strong net cash flows through September 2005. Fund companies in Canada have also been making a transition to new regulations introduced in 2005 that increased disclosure requirements for mutual funds, including publishing the top 25 holdings every quarter, including a narrative management report on fund performance, publishing a trading expense ratio in the annual report, and issuing disclosure documents within a shorter time after the end of the reporting period. We’ve also continued to see continued growth in funds of funds in Canada as financial advisors have been turning to these products to simplify their roles to focus more on client management.
Performance Summary
The list below summarizes the key accomplishments and disappointments that our management team has highlighted related to our 2005 performance:
Key Accomplishments
• We successfully completed our auction-based initial public offering in May 2005.
• We announced an agreement to acquire Ibbotson Associates, a Chicago-based firm that specializes in asset allocation research and services. We believe Ibbotson complements our growth strategies in several key areas, including investment consulting, managed retirement accounts, and institutional and advisor software. It also complements our international growth strategy. Ibbotson had $37.2 million in revenue for its fiscal year ending June 30, 2005. We completed the acquisition on March 1, 2006.
• We retained all five contracts for independent equity research associated with the Global Analyst Research Settlement for the second year of the five-year period covered under the settlement, and we entered into an agreement with a sixth investment bank to provide equity research. We now provide analyst coverage on more than 1,700 stocks.
• We launched the next generation of Morningstar Direct, expanding the range of data universes to allow institutions to conduct research across global markets and adding the full range of Morningstar’s available data on stocks, hedge funds, and Section 529 College Savings Plans.
• We expanded our variable annuity data and strengthened our investment database with the January 2005 acquisition of Variable Annuity Research and Data Service (VARDS).
• We began to build our investment consulting business outside the United States and entered into our first consulting agreements in France, Italy, and China.
• We continued to invest in our development center in China and now employ approximately 130 programmers and data analysts there.
Disappointments
• Even though we think online investment advice for retirement plan participants is a valuable service, it is less popular than we – and the industry – expected. As a result, revenue for the online advice service we offer through the Morningstar Retirement Manager platform has declined slightly. The most exciting part of this business is our managed retirement account service, which is growing, but from a small base. We expect our acquisition of Ibbotson Associates to provide greater opportunities in this market.
• All of our international operations experienced growth, but at a slower rate than we expected. To increase our international growth rate, we’re focusing more development and sales resources on global products, including Morningstar Direct, Advisor Workstation, and Investment Consulting, and adding more securities analysts overseas to further build our brand.
• While we announced in February 2006 that the Securities and Exchange Commission has decided not to proceed against Morningstar in its investigation related to incorrect total return data for the Rock Canyon Top Flight Fund, investigations into our Morningstar Associates subsidiary by the New York Attorney General’s office, the Securities and Exchange Commission, and the Department of Labor have not been resolved.
45
2005 vs. 2004
Consolidated Results
($000) | | 2005 | | 2004 | | Change | |
Revenue | | $ | 227,114 | | $ | 179,658 | | 26.4 | % |
Operating income (loss) | | 46,480 | | 17,735 | | 162.1 | % |
Operating margin (%) | | 20.5 | % | 9.9 | % | 10.6 | pp |
| | | | | | | |
Stock-based compensation expense | | 10,895 | | 16,723 | | (34.9 | )% |
| | | | | | | |
Cash used for investing activities | | (16,913 | ) | (22,750 | ) | (25.7 | )% |
Cash provided by (used for) financing activities | | 25,256 | | (6,367 | ) | NMF | |
| | | | | | | |
Cash provided by operating activities | | $ | 48,445 | | $ | 32,862 | | 47.4 | % |
Capital expenditures | | (7,451 | ) | (7,730 | ) | (3.6 | )% |
Free cash flow | | $ | 40,994 | | $ | 25,132 | | 63.1 | % |
NMF—not meaningful |
pp—percentage point(s) |
We define free cash flow as cash provided by operating activities less capital expenditures. We present free cash flow solely as supplemental disclosure to help investors better understand how much cash is available after we spend money to operate our business. Our management team uses free cash flow to evaluate the performance of our business. Free cash flow should not be considered an alternative to any measure of performance as promulgated under U.S. GAAP (such as cash provided by (used for) operating, investing, and financing activities), nor should this data be considered an indicator of our overall financial performance or liquidity. Also, the free cash flow definition we use may not be comparable to similarly titled measures reported by other companies.
Consolidated Revenue
In 2005, our consolidated revenue increased by 26.4% over 2004. We finished the year with $227.1 million in consolidated revenue. Consistent with the patterns we’ve reported in the past, we generated almost all of our revenue increases through organic growth in 2005. Our growth was also diversified by segment in 2005, with all three segments generating significant revenue growth for the year. We acquired VARDS from Finetre Corporation for $8.2 million in cash in January 2005. This acquisition contributed revenue of $2.4 million in 2005.
While all three segments contributed to our growth in 2005, the Institutional segment, which accounted for 42.2% (before intersegment eliminations) of our consolidated revenue, was the largest contributor to revenue growth, with segment revenue increasing $17.5 million, or 22.4%, for the year. Individual segment revenue increased by about $16.4 million, or 35.0%, over the previous year, which was mainly driven by newly generated business associated with the Global Analyst Research Settlement. We began recognizing revenue for our equity research related to the settlement in July 2004, which led to a favorable year-over-year comparison in 2005. The Advisor segment, which accounts for almost a third of total revenue, had revenue growth of $11.8 million, or 19.4%, for the year.
On a product level, revenue from Morningstar Advisor Workstation was the largest driver of the revenue increase in 2005. Growth in this product was mainly driven by the Enterprise Edition, which we offer to financial advisors affiliated with larger firms, but the Office Edition for independent financial advisors also experienced revenue growth for the year. During 2005, revenue from Advisor Workstation surpassed revenue from our Principia software, which has historically been our largest product. Total licenses for Advisor Workstation in the United States increased by about 40% during the year.
The second largest driver of consolidated revenue growth was our independent equity research, primarily associated with the Global Analyst Research Settlement. In July 2004, we began providing independent equity research under agreements with five major investment banks. We continued to provide this research to these five firms throughout 2005. In September 2005, we entered into an equity research agreement with a sixth investment bank involved in the settlement and began recognizing this new revenue in the fourth quarter of 2005. Our revenue in this area also benefited because we increased the number of stocks under coverage in 2005, leading to higher contract values for some of the equity research contracts related to the settlement.
46
Our Investment Consulting area was another key contributor to consolidated revenue growth in 2005, primarily reflecting expanded relationships and increased assets under management with existing clients for the asset allocation services we provide to funds of funds and variable annuities. Licensed Data and Morningstar.com were the fourth and fifth largest drivers of revenue growth in 2005. Principia was the only one of our top five products that didn’t generate a revenue increase in 2005 because many of our customers have been adopting Advisor Workstation, our newer Web-based investment planning system. Principia revenue declined approximately 2% compared with 2004.
Revenue from international operations increased $4.0 million, or 15.9%, to $29.4 million in 2005. International revenue made up about 13% of consolidated revenue in 2005, compared with about 14% in 2004. While expanding our international presence remains an important growth strategy, our U.S. revenue grew at a faster pace than non-U.S. revenue in 2005, partly because of the new revenue related to the Global Analyst Research Settlement and growth in our Investment Consulting business in the United States. Foreign currency translations contributed $0.7 million of the increase in international revenue for the year. Excluding the impact of foreign currency translations, our international revenue increased approximately 13% in 2005.
Without the impact of foreign currency translations and the VARDS acquisition, our consolidated revenue increased approximately 25% in 2005. Similar to 2004, acquisitions and foreign currency translations continued to have a minimal impact on our consolidated revenue growth in 2005. Because of our recent acquisition of Ibbotson Associates, we expect acquisitions to have a more significant impact on revenue growth in 2006.
Our top five products—Licensed Data, Morningstar Advisor Workstation, Principia, Morningstar.com, and Investment Consulting—represented 60.7% of our revenue base in 2005, compared with 61.5% in 2004. While the percentage of our revenue base made up by our top five products remained relatively consistent, the mix of the top five products changed compared with 2004. Principia, historically our largest product, was surpassed by Licensed Data and Advisor Workstation, which reported more revenue in 2005.
Top Five Products (Segment) 2005 | | Revenue
($000) | | %
Revenue | | Top Five Products (Segment) 2004 | | Revenue
($000) | | %
Revenue | |
Licensed Data (Institutional) | | $ | 32,435 | | 14.3 | % | Principia (Advisor) | | $ | 29,231 | | 16.3 | % |
Advisor Workstation (Advisor) | | 29,280 | | 12.9 | | Licensed Data (Institutional) | | 27,203 | | 15.1 | |
Principia (Advisor) | | 28,788 | | 12.7 | | Morningstar.com (Individual) | | 20,670 | | 11.5 | |
Morningstar.com (Individual) | | 25,502 | | 11.2 | | Advisor Workstation (Advisor) | | 19,464 | | 10.8 | |
Investment Consulting (Institutional) | | 21,904 | | 9.6 | | Investment Consulting (Institutional) | | 13,853 | | 7.7 | |
| | | | | | | | | | | | | |
Revenue Composition
As discussed in the Recurring Revenue section of Key Business Characteristics, to help investors evaluate our ongoing business results, we separate our revenue into three categories: new revenue, renewal revenue, and “walk-in” revenue.
The following graph illustrates the composition of our 2005, 2004, and 2003 revenue.
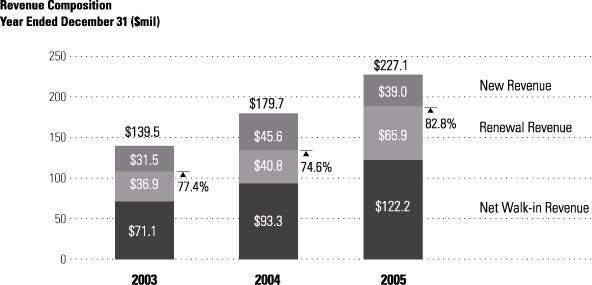
Our 2005 revenue consisted of $39.0 million in new revenue, or 17.2%, of our total revenue for the year. Renewal revenue accounted for $65.9 million, or 29.0%, of our total revenue for the year. Walk-in revenue accounted for $122.2 million, or 53.8%, of our total revenue for the year. In 2004, new revenue made up a greater percentage of our total annual revenue partly because of the equity research we began providing in July 2004 related to the Global Analyst Research Settlement.
As of January 1, 2006, our estimate of 2006 walk-in revenue is $138.8 million. This estimate is subject to change based on cancellations during the year, the impact of currency translations, and other routine adjustments. In comparison, our walk-in revenue as of January 1, 2005, was $124.9 million. In 2005, walk-in revenue benefited from newly generated equity research revenue associated with the Global Analyst Research Settlement. In addition, the walk-in revenue figure does not include variable revenue from asset-related services such as Morningstar Managed Portfolios, managed retirement account services, and Investment Consulting that are calculated as a percentage of total assets under management. These areas of our business have been increasing over the past several years.
In 2005, we estimate that our retention rate for subscription-based products such as Principia, Premium Membership service, and print and online newsletters averaged between 60% to 65%. For contract-based products and services, we estimate that our weighted average renewal rate generally ranged from 100% to 105% in 2005. The figure for contract-based products exceeds 100% because it includes
47
the impact of price changes and changes to the contract value upon renewal. While we’re satisfied with the retention and renewal rates we achieved in 2005, we constantly strive to improve these measures because the cost of maintaining existing customers is lower than the cost of acquiring new customers to replace business that doesn’t renew.
Consolidated Operating Expense
($000) | | 2005 | | 2004 | | Change | |
Total operating expense | | $ | 180,634 | | $ | 161,923 | | 11.6 | % |
% of revenue | | 79.5 | % | 90.1 | % | (10.6 | )pp |
| | | | | | | | | |
Our consolidated operating expense increased $18.7 million in 2005. Approximately half of this increase was from higher cost of goods sold; the remaining portion of the increase occurred across other operating expense categories, including development, sales and marketing, and general and administrative expense. The increase in consolidated operating expense was largely driven by a $15.6 million increase in compensation-related costs, including salaries, bonus, benefits, and sales commissions, stemming from higher headcount. We record these costs in the various operating expense categories as appropriate. We had approximately 1,130 employees worldwide as of December 31, 2005, compared with approximately 1,000 as of December 31, 2004. Approximately 60% of the increase in headcount was driven by technical staffing in our development center in China. Most of the remaining increase in headcount consists of additional stock analysts in our U.S. operations and increased staffing in our corporate departments to meet the requirements of being a public company. An increase in spending for corporate initiatives and legal fees and a decline in capitalized internal product development costs also contributed to the increase in operating expense. A decline in stock-based compensation of $5.8 million in 2005 partially offset the increase in compensation costs and other operating expenses.
Because our consolidated operating expense grew at a slower rate than our revenue, our consolidated operating expense as a percentage of revenue declined by more than 10 percentage points in 2005. This decline was primarily driven by the timing of revenue and expense associated with the Global Analyst Research Settlement and the decrease in stock-based compensation expense mentioned above, as well as the operating leverage inherent in our business. 2005 was the first full year of revenue from equity research related to the settlement; as a result, revenue in this area grew faster than expenses during the year. Similarly, as revenue from Institutional products such as Investment Consulting and Licensed Data rose during the year, our cost base for producing these products increased at a lower rate. Because consolidated operating expense declined as a percentage of revenue, operating margin showed a corresponding increase.
Cost of Goods Sold
($000) | | 2005 | | 2004 | | Change | |
Cost of goods sold | | $ | 64,408 | | $ | 54,709 | | 17.7 | % |
% of revenue | | 28.4 | % | 30.5 | % | (2.1 | )pp |
Gross profit | | $ | 162,706 | | $ | 124,949 | | 30.2 | % |
Gross margin | | 71.6 | % | 69.5 | % | 2.1 | pp |
Cost of goods sold has generally been our largest category of operating expense, and that pattern continued in 2005. Our business relies heavily on human capital, and cost of goods sold includes the compensation expense for employees who produce the products and services we deliver to our customers. Cost of goods sold increased $9.7 million in 2005. Compensation expense increased in all three segments, but mainly reflects additional costs for newly hired stock analysts in our Individual segment. Shareholder servicing fees related to Morningstar Managed Portfolios, which increased because of higher assets under management, contributed $1.5 million to the increase in cost of goods sold.
As a percentage of revenue, cost of goods sold declined by about 2 percentage points in 2005. This partly reflects the timing of hiring expenses for our independent equity research. We began incurring incremental compensation costs at the beginning of 2004 as we increased staffing in preparation for the ramp-up of our equity research efforts. We continued to increase staffing in 2005, but had already completed the majority of the staffing increase in 2004. As a result, cost of goods sold increased less dramatically in 2005.
Because cost of goods sold declined as a percentage of revenue in 2005, gross margin showed a corresponding increase. Gross margin has been steadily increasing over the past several years, from 68.8% in 2003 to 71.6% in 2005.
48
Development Expense
($000) | | 2005 | | 2004 | | Change | |
Development expense | | $ | 19,654 | | $ | 16,167 | | 21.6 | % |
% of revenue | | 8.7 | % | 9.0 | % | (0.3 | )pp |
| | | | | | | | | |
Development expense increased $3.5 million in 2005 because of increased hiring for programming and development staff primarily in our Advisor and Institutional segments and a reduction in the amount of expense capitalized related to development projects. We capitalize compensation costs associated with certain development projects, which reduces the costs included in development expense. Many of the projects for which we capitalized product development costs in 2004 have now been placed into service, and the ongoing costs are no longer capitalized. Instead, we now expense these costs as incurred. During 2005 we capitalized $0.4 million of development costs, compared with $2.8 million in 2004. As a percentage of revenue, development expense was slightly lower in 2005 compared with 2004.
Sales and Marketing Expense
($000) | | 2005 | | 2004 | | Change | |
Sales and marketing expense | | $ | 39,071 | | $ | 36,034 | | 8.4 | % |
% of revenue | | 17.2 | % | 20.1 | % | (2.9 | )pp |
| | | | | | | | | |
Sales and marketing expense increased $3.1 million because of higher commission costs, salaries, and benefits expense. We incurred additional commission costs because of both increased sales volume, primarily in our Advisor and Institutional segments, and changes to the incentive structure for certain products in the Advisor segment, including Principia and Advisor Workstation Office Edition. Salaries and benefits included in this expense category also increased, mainly because of an increase in headcount for the sales and marketing team in our Advisor segment. Because our revenue base increased at a faster pace than our sales and marketing expense, sales and marketing expense as a percentage of revenue declined by about 3 percentage points in 2005.
General and Administrative Expense
($000) | | 2005 | | 2004 | | Change | |
General and administrative expense | | $ | 49,235 | | $ | 46,788 | | 5.2 | % |
% of revenue | | 21.7 | % | 26.0 | % | (4.3 | )pp |
| | | | | | | | | |
General and administrative expense has generally been our second largest category of operating expense following cost of goods sold, and that pattern continued in 2005. The $2.4 million increase in general and administrative expense mainly includes higher compensation costs, which increased primarily because we added staff in our corporate departments to meet the requirements of being a public company. Higher incentive compensation also contributed to the increase in this category in 2005. We also incurred $2.0 million more for spending on corporate initiatives and legal fees related to regulatory investigations in 2005 than in 2004. In addition, we increased our offer to settle various claims related to Morningstar Research Pty Limited (Morningstar Australia). Refer to Note 17 of the Notes to our Consolidated Financial Statements for more information regarding this litigation. Stock-based compensation expense included in general and administrative expense decreased $4.3 million during 2005, which largely offset the increases in other areas. The decrease in stock-based compensation expense was driven by a decline in expense for options accounted for under the liability method, as described below. Because our general and administrative expense increased at a slower pace compared with our revenue growth, general and administrative expense as a percentage of revenue declined by about 4 percentage points in 2005.
Depreciation and Amortization Expense
($000) | | 2005 | | 2004 | | Change | |
Depreciation and amortization expense | | $ | 8,266 | | $ | 8,225 | | 0.5 | % |
% of revenue | | 3.6 | % | 4.6 | % | (1.0 | )pp |
| | | | | | | | | |
Depreciation and amortization expense increased slightly in 2005 primarily because of amortization of the intangible assets related to the VARDS acquisition. This increase was offset by a decrease in depreciation and amortization expense for capitalized software, computer equipment, and internal product development costs, as many of the assets in these categories are now fully depreciated.
Stock-Based Compensation Expense
We have historically used two different methods of accounting for stock-based compensation expense: the liability method, which involves recording a liability for vested options equal to the difference between the option exercise price and the fair value per share of the common stock, and the equity method, which is based on the Black-Scholes value of the option at the time of the grant and recorded over the vesting period of the option. Following our initial public offering in May 2005, we are no longer required to settle stock options in cash, and therefore are no longer required to record stock-based compensation expense under the liability method.
49
The following table summarizes our stock-based compensation expense:
($000) | | 2005 | | 2004 | | Change | |
Stock-based compensation expense– liability method | | $ | 2,810 | | $ | 8,963 | | (68.6 | )% |
Stock-based compensation expense– equity method | | 8,085 | | 7,760 | | 4.2 | % |
Total stock-based compensation expense | | $ | 10,895 | | $ | 16,723 | | (34.9 | )% |
% of revenue | | 4.8 | % | 9.3 | % | (4.5 | )pp |
Total stock-based compensation expense declined $5.8 million in 2005.
Stock-based compensation expense recorded under the liability method declined $6.2 million in 2005. The expense recorded under the liability method in 2005 reflects the expense recorded through the first quarter, when we adjusted the liability to reflect our initial public offering price of $18.50 per share compared with a fair value of $17.50 per share as of December 31, 2004. The expense recorded under the liability method in 2004 reflects a $2.80 increase in the fair value per share of our common stock to $17.50 per share as of December 31, 2004 from $14.70 per share as of December 31, 2003.
Stock-based compensation expense recorded under the equity method increased $0.3 million in 2005. This increase mainly reflects the impact of approximately 1.1 million options granted in 2005, as well as ongoing expense associated with options granted in 2004 and prior years. This increase was partially offset by lower expense for options granted in previous years, which are now fully vested and no longer require recording additional expense.
In 2006, we expect to record approximately $7.0 million of stock-based compensation expense for all options outstanding as of December 31, 2005.
Bonus Expense
($000) | | 2005 | | 2004 | | Change | |
Bonus expense | | $ | 22,511 | | $ | 21,037 | | 7.0 | % |
% of revenue | | 9.9 | % | 11.7 | % | (1.8 | )pp |
| | | | | | | | | |
Bonus expense increased $1.5 million in 2005. This category of expense increased primarily because our financial performance in 2005 exceeded our financial performance in 2004. The impact of this increase was partially offset because our bonus expense in 2004 included a special bonus for our analyst team that did not recur in 2005. Bonus expense is included in each of the operating expense categories.
Operating Income
($000) | | 2005 | | 2004 | | Change | |
Operating income | | $ | 46,480 | | $ | 17,735 | | 162.1 | % |
% of revenue | | 20.5 | % | 9.9 | % | 10.6 | pp |
| | | | | | | | | |
Because our consolidated revenue grew at a faster rate than our operating expense, our operating margin increased by more than 10 percentage points in 2005. This increase was primarily driven by the timing of revenue and expense associated with the Global Analyst Research Settlement and the $5.8 million decrease in stock-based compensation expense, as well as the operating leverage inherent in our business. 2005 was the first full year of revenue from equity research associated with the Global Analyst Research Settlement. During 2005, we were able to increase costs associated with this revenue at a lower rate because much of the cost increases occurred in 2004 as we built our staff in anticipation of this revenue. In addition, revenue growth for many of our Institutional products, such as Investment Consulting and Licensed Data, increased during the year. We were able to increase costs in most of the related expense categories at a lower rate than this revenue growth.
50
The table below provides a reconciliation from operating income to operating income before stock-based compensation expense:
($000) | | 2005 | | 2004 | | Change | |
Operating income | | $ | 46,480 | | $ | 17,735 | | 162.1 | % |
Stock-based compensation expense | | 10,895 | | 16,723 | | (34.9 | )% |
Operating income before stock-based compensation expense | | $ | 57,375 | | $ | 34,458 | | 66.5 | % |
The table below provides a reconciliation of operating margin to operating margin before stock-based compensation expense:
(percentage of revenue) | | 2005 | | 2004 | |
Operating margin | | 20.5 | % | 9.9 | % |
Stock-based compensation expense | | 4.8 | | 9.3 | |
Operating margin before stock-based compensation expense | | 25.3 | % | 19.2 | % |
Stock-based compensation expense had a larger impact on our operating margin in 2004 because of the expense recorded under the liability method, as discussed in the Stock-Based Compensation Expense section above.
We expect stock-based compensation expense to be a recurring cost. We have presented operating income before stock-based compensation expense and operating margin before stock-based compensation expense solely as supplemental disclosures to help investors better understand the performance of our business, to enhance comparison of our performance from period to period, and to allow better comparison of our performance with that of our competitors. We use operating income before stock-based compensation expense and operating margin before stock-based compensation expense to evaluate the performance of our business. Operating income before stock-based compensation expense and operating margin before stock-based compensation expense should not be considered alternatives to any measure of performance as promulgated under U.S. GAAP (such as operating income or operating margin), nor should this data be considered an indicator of our overall financial performance or liquidity. Also, the calculations of operating income before stock-based compensation expense and operating margin before stock-based compensation expense used by us may not be comparable to similarly titled measures reported by other companies.
Consolidated Free Cash Flow
We generated free cash flow of $41.0 million in 2005, reflecting cash provided by operating activities of $48.4 million and capital expenditures of $7.4 million. Free cash flow increased by $15.9 million in 2005, reflecting a $15.6 million increase in cash provided by operating activities, which was driven by an increase in net income, as well as approximately a $0.3 million reduction in capital expenditures. As a percentage of revenue, free cash flow was 18.0% of revenue in 2005, compared with 14.0% in 2004.
The decrease in capital expenditures in 2005 primarily reflects lower capitalized internal product development costs. Because several products for which costs were previously capitalized have now been put into service, we expense the ongoing costs as we incur them.
The table below presents a reconciliation between the increase in net income and the increase in cash flow provided by operating activities:
($000) | | 2005 | | 2004 | | Change | |
Net income | | $ | 31,117 | | $ | 8,809 | | $ | 22,308 | |
Adjustments to reconcile net income to net cash flows from operating activities: | | | | | | | |
Non-cash items included in net income | | 20,647 | | 23,899 | | (3,252 | ) |
Changes in operating assets and liabilities, net of effects of acquisitions: | | | | | | | |
Cash paid for bonuses | | (18,000 | ) | (12,252 | ) | (5,748 | ) |
Cash paid for income taxes | | (19,527 | ) | (6,613 | ) | (12,914 | ) |
Other | | 34,208 | | 19,019 | | 15,189 | |
Cash provided by operating activities | | $ | 48,445 | | $ | 32,862 | | $ | 15,583 | |
In 2005, the increase in cash provided by operating activities of $15.6 million lagged the $22.3 million increase in net income. There were several items that contributed to lower relative growth in cash provided by operating activities in 2005. Payments made for both income taxes and bonuses had the largest impact on the gap between cash provided by operating activities and net income. Income tax payments in 2005 increased $12.9 million compared with the previous year. In 2004, we used the majority of our U.S.
51
net operating losses, reducing the amount of taxes paid. Bonus payments in 2005 increased $5.7 million compared with 2004, reflecting strong business performance during 2004, as well as the last installment of a special bonus established for our analyst team in 2004. In addition, non-cash items included in net income decreased primarily because of lower deferred income tax expense. While income tax payments, bonus payments, and non-cash items included in net income lowered our cash flow provided by operating activities, they were largely offset by a greater cash flow benefit in 2005 arising from changes in operating assets and liabilities. Over half of this benefit reflects increases in accounts payable and accrued expenses; the remaining increase was driven by accrued income taxes and accrued compensation, excluding the payments discussed above.
52
Segment Results
($000) | | 2005 | | 2004 | | Change | |
Revenue | | | | | | | |
Individual | | $ | 63,448 | | $ | 46,996 | | 35.0 | % |
Advisor | | 72,689 | | 60,880 | | 19.4 | % |
Institutional | | 95,947 | | 78,402 | | 22.4 | % |
Eliminations | | (4,970 | ) | (6,620 | ) | (24.9 | )% |
Consolidated revenue | | $ | 227,114 | | $ | 179,658 | | 26.4 | % |
| | | | | | | |
Operating income | | | | | | | |
Individual | | 18,373 | | 7,825 | | 134.8 | % |
Advisor | | 17,892 | | 13,966 | | 28.1 | % |
Institutional | | 24,796 | | 13,667 | | 81.4 | % |
Corporate items and eliminations | | (14,581 | ) | (17,723 | ) | (17.7 | )% |
Consolidated operating income | | $ | 46,480 | | $ | 17,735 | | 162.1 | % |
| | | | | | | |
Operating margin | | | | | | | |
Individual | | 29.0 | % | 16.7 | % | 12.3 | pp |
Advisor | | 24.6 | % | 22.9 | % | 1.7 | pp |
Institutional | | 25.8 | % | 17.4 | % | 8.4 | pp |
Consolidated operating margin | | 20.5 | % | 9.9 | % | 10.6 | pp |
| | | | | | | |
| | | | | | | |
Individual Segment
Our Individual segment provides products and services for individual investors. The largest product in this segment is our U.S.-based Web site, Morningstar.com, which includes both paid Premium Membership service and sales of advertising space. Our Individual segment also includes Morningstar Equity Research, which we distribute through several channels. Investors can access our equity research through our Premium Membership offering on Morningstar.com. In addition, our equity research is distributed through six major investment banks to meet the requirements for independent research under the Global Analyst Research Settlement, as well as to several other companies who provide our research to their affiliated financial advisors or to individual investors. We also offer a variety of print publications on stocks and mutual funds, including our monthly newsletters, Morningstar FundInvestor and Morningstar StockInvestor, and our twice-monthly publication, Morningstar Mutual Funds. We currently generate all of the revenue from our Individual segment in the United States. In 2005 and 2004, this segment represented, before intersegment eliminations, 27.9% and 26.2%, respectively, of our consolidated revenue.
($000) | | 2005 | | 2004 | | Change | |
Revenue | | $ | 63,448 | | $ | 46,996 | | 35.0 | % |
Operating income | | $ | 18,373 | | $ | 7,825 | | 134.8 | % |
Operating margin (%) | | 29.0 | % | 16.7 | % | 12.3 | pp |
In 2005, revenue for the Individual segment increased $16.4 million compared with 2004. The increase primarily reflects revenue from the independent equity research we are providing under the Global Analyst Research Settlement. In the third quarter of 2004, we entered into agreements with five major investment banks to provide independent equity research to meet the terms of the settlement. These agreements are structured as annual contracts that include both renewal and cancellation options. Because we did not begin recognizing revenue under these contracts until the end of July 2004, the full year of revenue recognized in 2005 compared favorably with the partial year of revenue recognized in 2004. We retained these five contracts for the second year of the five-year period under the settlement. In September 2005, we entered into an agreement with a sixth investment bank to provide independent equity research as part of the terms of the settlement. Revenue also increased because we’re providing coverage on a larger number of stocks compared with the prior year. Growth in Morningstar.com Premium membership and Internet advertising sales accounted for the majority of the remaining increase in revenue. Subscriptions for Morningstar.com Premium Membership service increased to 147,010 as of December 31, 2005, compared with 131,035 as of December 31, 2004.
In 2005, operating income for the Individual segment increased $10.6 million compared with 2004. The significant increase in operating income reflects the impact of revenue growth against more moderate growth in operating expenses. Operating expense in 2005 increased $5.9 million, or 15.1%, compared with the prior year. This increase was driven primarily by increased compensation expense from hiring additional equity analysts. Our equity analyst team consisted of 87 analysts as of December 31, 2005, compared with 73 as of December 31, 2004. The improvement in operating income was also impacted by a difference in the timing between revenue and expense associated with the Global Analyst Research Settlement. Beginning in 2004, we invested heavily in the hiring
53
of our analyst team in anticipation of the revenue associated with the Global Analyst Research Settlement. We began recognizing revenue from the Global Analyst Research Settlement at the end of July 2004. This resulted in higher compensation-related costs with no corresponding increase in revenue for the first seven months of 2004. In 2005, however, we had a full year of revenue to cover costs. As a result, operating margin significantly improved in 2005 compared with 2004.
Advisor Segment
Our Advisor segment focuses on products and services for financial advisors. Key products in this segment are Morningstar Advisor Workstation and Principia. Advisor Workstation is a Web-based investment planning system that provides financial advisors with a comprehensive set of tools for conducting their core business – including investment research, planning, and presentation tools. Advisor Workstation is available in two editions: the Office Edition for independent financial advisors and the Enterprise Edition for financial advisors affiliated with larger firms. Principia is our CD-ROM-based investment research and planning software for financial advisors. In addition, we offer Morningstar Managed Portfolios, a fee-based discretionary asset management service that includes a series of mutual fund and exchange-traded fund portfolios tailored to meet a range of investment time horizons and risk levels that financial advisors can use for their clients’ taxable and tax-deferred accounts. In 2005 and 2004, this segment represented, before intersegment eliminations, 32.0% and 33.9%, respectively, of our consolidated revenue.
($000) | | 2005 | | 2004 | | Change | |
Revenue | | $ | 72,689 | | $ | 60,880 | | 19.4 | % |
Operating income | | $ | 17,892 | | $ | 13,966 | | 28.1 | % |
Operating margin (%) | | 24.6 | % | 22.9 | % | 1.7 | pp |
In 2005, revenue for the Advisor segment increased $11.8 million compared with 2004. The increase was primarily driven by Morningstar Advisor Workstation. We continue to see strong growth in licenses of the Enterprise Edition of Morningstar Advisor Workstation, and we entered into numerous new agreements in 2005. In addition, we also experienced strong renewals for the product during 2005, and several contracts that were scheduled to expire during 2005 renewed at significantly higher price points, reflecting both higher user counts and an increase in the amount of functionality licensed. During 2005, revenue from Advisor Workstation surpassed revenue from Principia, which has historically been our largest product. The number of U.S. licenses for Morningstar Advisor Workstation increased to 113,461 as of December 31, 2005, compared with 80,235 as of December 31, 2004. Morningstar Managed Portfolios also contributed to revenue growth in the segment, but to a lesser degree. Assets under management for Morningstar Managed Portfolios increased to $1.4 billion as of December 31, 2005, compared with $936.0 million as of December 31, 2004. Principia revenue declined slightly during 2005. The number of subscriptions for Principia declined to 49,728 as of December 31, 2005 compared with 51,308 as of December 31, 2004. While the number of subscriptions declined slightly, average revenue per subscription increased primarily because of previous price increases and reductions in certain discount programs. The VARDS acquisition contributed $0.4 million to revenue in this segment during 2005.
In 2005, we refined the way we count Principia subscriptions. We now count subscriptions to each of the six modules in the Principia suite as separate subscriptions. We also refined the way we count U.S. licenses for Advisor Workstation to more consistently include only financial advisors licensed to use the product and to exclude support staff. If the license agreement allows access by users not employed by the licensing enterprise, we only include actual users within the past 12 months. We believe these changes provide better information regarding our market penetration within the financial advisor market. The following table shows historical quarterly data adjusted to reflect these changes.
| | December 31,
2003 | | March 31,
2004 | | June 30,
2004 | | September 30,
2004 | | December 31,
2004 | | March 31,
2005 | | June 30,
2005 | | September 30,
2005 | |
Number of
U.S. Advisor Workstation Licenses | | 32,408 | | 57,166 | | 75,810 | | 72,190 | | 80,235 | | 90,323 | | 101,318 | | 102,606 | |
Number of
Principia Subscriptions | | 55,892 | | 55,493 | | 54,824 | | 52,366 | | 51,308 | | 53,048 | | 50,797 | | 50,484 | |
In 2005, operating income for the Advisor segment increased $3.9 million compared with 2004, reflecting an increase in revenue partially offset by higher operating expense in all categories. Operating expense increased $7.9 million, or 16.8%, compared with the prior year. A little over one-third of the increase in expense was driven by an increase in cost of goods sold because of increased compensation costs related to additional headcount and shareholder servicing fees related to higher levels of assets under management for Morningstar Managed Portfolios. An increase in general and administrative expense, driven by higher corporate overhead expense, also contributed approximately one-third of the increase in operating expense for this segment. The remaining
54
increase in operating expense primarily reflects increased sales and marketing expense, which was driven by higher compensation-related expense and commissions for sales of Advisor Workstation and Principia. The higher sales commissions reflect increased sales volume in Advisor Workstation and changes to the incentive structure for both products. Operating margin improved slightly in 2005, reflecting the impact of higher revenue against the operating cost structure.
Institutional Segment
Our Institutional segment focuses on products and services for institutions, including banks, insurance companies, mutual fund companies, brokerage firms, media outlets, and retirement plan providers and sponsors. Key products and services in this segment are Morningstar Direct, a Web-based institutional research platform that provides advanced research and tools on the complete range of securities in Morningstar’s global database; Licensed Data, a set of investment data spanning eight core databases, available through electronic data feeds; Investment Consulting, which focuses on investment monitoring and asset allocation for funds of funds, including mutual funds and variable annuities; Investment Profiles & Guides, which are designed for institutions to use in communicating investment information to individual investors; and Morningstar Retirement Manager, a suite of advice and guidance services for retirement plan participants. In 2005 and 2004, this segment represented, before intersegment eliminations, 42.2% and 43.6%, respectively, of our consolidated revenue. We expect that the Institutional segment will continue to account for the largest portion of our consolidated revenue for the foreseeable future.
($000) | | 2005 | | 2004 | | Change | |
Revenue | | $ | 95,947 | | $ | 78,402 | | 22.4 | % |
Operating income | | $ | 24,796 | | $ | 13,667 | | 81.4 | % |
Operating margin (%) | | 25.8 | % | 17.4 | % | 8.4 | pp |
In 2005, revenue for the Institutional segment increased $17.5 million compared with 2004. More than 40% of the increase was driven by increased revenue for Investment Consulting services. During 2005, we expanded existing relationships and our scope of responsibilities with two major clients. Revenue also increased because we receive asset-based fees for our services, and assets under advisement in this area significantly increased compared with the prior year. Morningstar provided advisory services on approximately $22.1 billion in assets as of December 31, 2005, compared with approximately $12.6 billion as of December 31, 2004. These totals include consulting relationships as well as agreements where we act as a portfolio construction manager for a mutual fund or variable annuity and receive a basis point fee. Licensed Data, and to a lesser extent, Morningstar Direct, also contributed to revenue growth during 2005. The VARDS acquisition contributed $2.0 million to revenue in this segment during 2005. The number of licenses for Morningstar Direct was 985 as of December 31, 2005, compared with 775 as of December 31, 2004. Beginning in the second quarter of 2005, we began selling Morningstar Direct licenses in international markets. The number of licenses as of December 31, 2005 includes both U.S. and non-U.S. users. The number of global licenses as of June 30, 2005 and September 30, 2005 was 843 and 931, respectively. Revenue growth in Morningstar Direct exceeded growth in the number of licenses because of the impact of a new pricing model implemented during 2004. Several key contracts whose terms ended during 2005 renewed for a smaller number of licenses, but at a greater price per license.
As mentioned in the Key Accomplishments and Disappointments section included in the Performance Summary above, revenue for the online advice service we offer through the Morningstar Retirement Manager platform declined slightly in 2005. We continue to enhance our online advice services and have been transitioning clients to our new user interface, which is more streamlined and simpler to use. Based on industry research, however, we believe online retirement advice appeals to a relatively small segment of self-directed investors within the large population of 401(k) plan participants. We see greater growth potential in managed retirement accounts, which may appeal to a broader segment of retirement plan participants. We had $285.0 million in assets under management in the managed retirement accounts offered through Morningstar Retirement Manager as of December 31, 2005, compared with $123.9 million as of December 31, 2004. As of December 31, 2005, more than 9 million retirement plan participants had access to Morningstar Retirement Manager through approximately 69,000 plan sponsors and 30 plan providers. The number of plan participants decreased from prior periods because we received revised participant counts from certain plan providers.
In 2005, operating income for the Institutional segment increased $11.1 million compared with 2004. The increase in operating income was primarily driven by revenue growth in our Investment Consulting and Licensed Data services. Contract values in both areas and asset-based fees in Investment Consulting have increased, while the cost base for these services has remained relatively stable. Operating expense in 2005 increased $6.4 million, or 9.9%, compared with 2004. More than half of the growth in operating expense was driven by an increase in cost of goods sold, reflecting higher compensation expense, including bonus expense and costs relating to the VARDS acquisition. The remaining increase in operating expense was driven by growth in sales and marketing expense, reflecting higher compensation and sales commission expense, and an increase in general and administrative expense, reflecting higher corporate overhead. Operating margin significantly improved compared with 2004, reflecting the impact of revenue growth that exceeded the increase in operating expense.
Corporate and Eliminations
Corporate items and eliminations primarily include stock-based compensation expense, capitalized internal product
55
development costs and related amortization, and amortization related to intangible assets. The following table shows the components of corporate and eliminations expense (income) that impacted our consolidated operating income:
($000) | | 2005 | | 2004 | | Change | |
Stock-based compensation expense | | $ | 10,895 | | $ | 16,723 | | (34.9 | )% |
Capitalized internal product development costs | | (375 | ) | (2,802 | ) | (86.6 | )% |
Depreciation and amortization | | 3,576 | | 3,342 | | 7.0 | % |
Other | | 485 | | 460 | | 5.4 | % |
Corporate items and eliminations | | $ | 14,581 | | $ | 17,723 | | (17.7 | )% |
In 2005, corporate items and eliminations decreased $3.1 million, primarily reflecting a decline of $5.8 million in stock-based compensation expense. This decrease was partially offset by a decrease of $2.4 million in capitalized internal product development costs and a $0.3 million increase in depreciation and amortization.
56
2004 vs. 2003
Consolidated Results
($000) | | 2004 | | 2003 | | Change | |
Revenue | | $ | 179,658 | | $ | 139,496 | | 28.8 | % |
Operating income (loss) | | 17,735 | | (10,754 | ) | NMF | |
Operating margin (%) | | 9.9 | % | NMF | | NMF | |
| | | | | | | |
Stock-based compensation expense | | 16,723 | | 29,029 | | (42.4 | )% |
| | | | | | | |
Cash used for investing activities | | (22,750 | ) | (29,634 | ) | (23.2 | )% |
Cash used for financing activities | | (6,367 | ) | (26 | ) | NMF | |
| | | | | | | |
Cash provided by operating activities | | $ | 32,862 | | $ | 29,705 | | 10.6 | % |
Capital expenditures | | (7,730 | ) | (8,607 | ) | (10.2 | )% |
Free cash flow | | $ | 25,132 | | $ | 21,098 | | 19.1 | % |
Consolidated Revenue
In 2004, our revenue increased $40.2 million, or 28.8%, to $179.7 million from $139.5 million in 2003, reflecting strong demand for the products and services in each of our business segments. Price adjustments had minimal impact on revenue growth. Revenue in our Individual segment increased $11.6 million; revenue in our Advisor segment increased $11.7 million; and revenue in our Institutional segment increased $18.7 million. The consolidated revenue increase was driven mainly by our independent equity research associated with the Global Analyst Research Settlement; Morningstar.com Premium service; Internet advertising sales; Morningstar Advisor Workstation; Morningstar Managed Portfolios; Morningstar Retirement Manager (primarily resulting from the acquisition of mPower.com, Inc.); Licensed Data; Morningstar Direct; and Investment Consulting. The revenue increase in these products and services was partially offset by lower revenue from some of our more mature products such as Reprints, Morningstar Mutual Funds, and Morningstar FundInvestor.
Revenue from international operations increased $5.3 million, or 26.3%, to $25.4 million in 2004 compared with $20.1 million in 2003. Currency translations contributed $1.9 million; excluding the impact of currency translations, our international revenue increased approximately 17%. Revenue from mPower.com, Inc. (mPower), which we acquired in July 2003, was $4.6 million in 2004, or approximately $2.5 million more than the revenue we recognized from this business during the six months following the acquisition in 2003. Excluding the impact of currency translations and the mPower revenue in the first six months of 2004, our revenue increased approximately 26% in 2004.
The following table summarizes our top five revenue-generating products:
Top Five Products (Segment) 2004 | | Revenue
($000) | | %
Revenue | | Top Five Products (Segment) 2003 | | Revenue
($000) | | %
Revenue | |
Principia (Advisor) | | $ | 29,231 | | 16.3 | % | Principia (Advisor) | | $ | 28,856 | | 20.7 | % |
Licensed Data (Institutional) | | 27,203 | | 15.1 | | Licensed Data (Institutional) | | 22,453 | | 16.1 | |
Morningstar.com (Individual) | | 20,670 | | 11.5 | | Morningstar.com (Individual) | | 16,312 | | 11.7 | |
Advisor Workstation (Advisor) | | 19,464 | | 10.8 | | Advisor Workstation (Advisor) | | 10,799 | | 7.7 | |
Investment Consulting (Institutional) | | 13,853 | | 7.7 | | Licensed Tools and Content (Institutional) | | 9,222 | | 6.6 | |
| | | | | | | | | | | | | |
57
Consolidated Operating Expense
($000) | | 2004 | | 2003 | | Change | |
Total operating expense | | $ | 161,923 | | $ | 150,250 | | 7.8 | % |
% of revenue | | 90.1 | % | 107.7 | % | (17.6 | )pp |
| | | | | | | | | |
Consolidated operating expense increased $11.6 million, or 7.8%, to $161.9 million in 2004 from $150.3 million in 2003. The increase primarily reflects an $11.2 million increase in cost of goods sold and a $5.2 million increase in sales and marketing expense. These increases were partially offset by a $7.3 million reduction in general and administrative expense, mainly because of a reduction in stock-based compensation expense.
Cost of Goods Sold
($000) | | 2004 | | 2003 | | Change | |
Cost of goods sold | | $ | 54,709 | | $ | 43,521 | | 25.7 | % |
% of revenue | | 30.5 | % | 31.2 | % | (0.7 | )pp |
Gross profit | | $ | 124,949 | | $ | 95,975 | | 30.2 | % |
Gross margin | | 69.5 | % | 68.8 | % | 0.7 | pp |
Cost of goods sold increased $11.2 million, or 25.7%, to $54.7 million in 2004 from $43.5 million in 2003. The increase in cost of goods sold mainly reflects higher compensation costs relating to expanded staffing across all of our business segments, higher incentive compensation driven by financial performance that exceeded internal estimates, and incentive compensation for our analyst team. These increases were partially offset by a reduction in stock-based compensation expense.
Development Expense
($000) | | 2004 | | 2003 | | Change | |
Development expense | | $ | 16,167 | | $ | 14,663 | | 10.3 | % |
% of revenue | | 9.0 | % | 10.5 | % | (1.5 | )pp |
| | | | | | | | | |
Development expense increased $1.5 million, or 10.3%, to $16.2 million in 2004 from $14.7 million in 2003. The increase mainly stems from higher compensation expense (including incentive compensation) and a reduction in capitalized internal product development costs, partially offset by lower stock-based compensation expense. Capitalized internal product development costs in 2004 primarily relates to ongoing development of products such as Morningstar Direct, Morningstar Retirement Manager, and Morningstar Advisor Workstation.
Sales and Marketing Expense
($000) | | 2004 | | 2003 | | Change | |
Sales and marketing expense | | $ | 36,034 | | $ | 30,798 | | 17.0 | % |
% of revenue | | 20.1 | % | 22.1 | % | (2.0 | )pp |
| | | | | | | | | |
Sales and marketing expense increased $5.2 million, or 17.0%, to $36.0 million in 2004 from $30.8 million in 2003, largely because of higher compensation expense (including sales commissions and incentive compensation) primarily for our Advisor and Institutional businesses and increased marketing expense for our Individual business. These increases were partially offset by a reduction in stock-based compensation expense.
General and Administrative Expense
($000) | | 2004 | | 2003 | | Change | |
General and administrative expense | | $ | 46,788 | | $ | 54,145 | | (13.6 | )% |
% of revenue | | 26.0 | % | 38.8 | % | (12.8 | )pp |
| | | | | | | | | |
General and administrative expense decreased $7.3 million, or 13.6%, to $46.8 million in 2004 from $54.1 million in 2003. A $9.3 million reduction in stock-based compensation expense and lower sales tax expense in 2004 were partially offset by an increase in incentive compensation expense and corporate overhead.
58
Depreciation and Amortization Expense
($000) | | 2004 | | 2003 | | Change | |
Depreciation and amortization expense | | $ | 8,225 | | $ | 7,123 | | 15.5 | % |
% of revenue | | 4.6 | % | 5.1 | % | (0.5 | )pp |
| | | | | | | | | |
Depreciation and amortization expense increased $1.1 million, or 15.5%, to $8.2 million in 2004 from $7.1 million in 2003. This increase was mainly driven by depreciation and amortization expense for computer equipment, leasehold improvements, and capitalized internal product development costs.
Stock-Based Compensation Expense
The following table summarizes stock-based compensation expense recorded under the liability and the equity methods:
($000) | | 2004 | | 2003 | | Change | |
Stock-based compensation expense – liability method | | $ | 8,963 | | $ | 17,796 | | (49.6 | )% |
Stock-based compensation expense – equity method | | 7,760 | | 11,233 | | (30.9 | )% |
Total stock-based compensation expense | | $ | 16,723 | | $ | 29,029 | | (42.4 | )% |
% of revenue | | 9.3 | % | 20.8 | % | (11.5 | )pp |
Stock-based compensation expense decreased $12.3 million, or 42.4%, to $16.7 million in 2004 from $29.0 million in 2003. The decrease reflects the fact that certain stock options granted in previous years were fully vested and as a result no longer required recording additional expense. In addition, for options accounted for under the liability method, the $2.80 per share increase in the fair value of our common stock in 2004 was lower than the $6.13 per share increase in the fair value of our common stock in 2003.
Bonus Expense
($000) | | 2004 | | 2003 | | Change | |
Bonus expense | | $ | 21,037 | | $ | 12,620 | | 66.7 | % |
% of revenue | | 11.7 | % | 9.0 | % | 2.7 | pp |
| | | | | | | | | |
Bonus expense increased $8.4 million, or 66.7%, to $21.0 million in 2004 from $12.6 million in 2003, primarily because of financial performance that exceeded internal estimates. The increase in 2004 also reflects accruals for a special bonus established for our analyst team. Bonus expense is reflected in each of the appropriate operating expense categories.
Consolidated Operating Income
($000) | | 2004 | | 2003 | | Change | |
Operating income (loss) | | $ | 17,735 | | $ | (10,754 | ) | NMF | |
% of revenue | | 9.9 | % | NMF | | NMF | |
| | | | | | | | | |
Operating income increased $28.5 million to $17.7 million in 2004 from an operating loss of $10.8 million in 2003, reflecting the impact of our operating leverage (the relatively low level of variable cost of adding new customers) and lower stock-based compensation expense impacting all expense categories. The revenue increase of $40.2 million was partially offset by operating expense growth of approximately $11.7 million.
The table below provides a reconciliation from operating income to operating income before stock-based compensation expense:
($000) | | 2004 | | 2003 | | Change | |
Operating income (loss) | | $ | 17,735 | | $ | (10,754 | ) | NMF | |
Stock-based compensation expense | | 16,723 | | 29,029 | | (42.4 | )% |
Operating income before stock-based compensation expense | | $ | 34,458 | | $ | 18,275 | | 88.6 | % |
59
The table below provides a reconciliation of operating margin to operating margin before stock-based compensation expense:
(percentage of revenue) | | 2004 | | 2003 | |
Operating margin | | 9.9 | % | NMF | |
Stock-based compensation expense | | 9.3 | | 20.8 | |
Operating margin before stock-based compensation expense | | 19.2 | % | 13.1 | % |
Consolidated Free Cash Flow
We generated approximately $25.2 million in free cash flow in 2004, reflecting cash provided by operating activities of $32.9 million and capital expenditures of $7.7 million. Free cash flow increased by approximately $4.1 million from $21.1 million in 2003, due to a $3.2 million improvement in cash provided by operating activities and a $0.9 million reduction in capital expenditures.
The increase in cash provided by operations in 2004 reflects an improvement in our net income adjusted for non-cash items, partially offset by higher working capital. The working capital increase primarily reflects a $10.9 million increase in receivables from clients as a result of additional billings, offset by a $7.0 million increase in deferred revenue and a $3.8 million increase in income taxes payable.
60
Segment Results
($000) | | 2004 | | 2003 | | Change | |
Revenue | | | | | | | |
Individual | | $ | 46,996 | | $ | 35,406 | | 32.7 | % |
Advisor | | 60,880 | | 49,161 | | 23.8 | % |
Institutional | | 78,402 | | 59,745 | | 31.2 | % |
Eliminations | | (6,620 | ) | (4,816 | ) | 37.5 | % |
Consolidated revenue | | $ | 179,658 | | $ | 139,496 | | 28.8 | % |
| | | | | | | |
Operating income (loss) | | | | | | | |
Individual | | 7,825 | | 7,391 | | 5.9 | % |
Advisor | | 13,966 | | 9,521 | | 46.7 | % |
Institutional | | 13,667 | | 4,160 | | 228.5 | % |
Corporate items and eliminations | | (17,723 | ) | (31,826 | ) | (44.3 | )% |
Consolidated operating income (loss) | | $ | 17,735 | | $ | (10,754 | ) | NMF | |
| | | | | | | |
Operating margin | | | | | | | |
Individual | | 16.7 | % | 20.9 | % | (4.2 | )pp |
Advisor | | 22.9 | % | 19.4 | % | 3.5 | pp |
Institutional | | 17.4 | % | 7.0 | % | 10.4 | pp |
Consolidated operating margin | | 9.9 | % | NMF | | NMF | |
| | | | | | | |
| | | | | | | |
Individual Segment
($000) | | 2004 | | 2003 | | Change | |
Revenue | | $ | 46,996 | | $ | 35,406 | | 32.7 | % |
Operating income | | $ | 7,825 | | $ | 7,391 | | 5.9 | % |
Operating margin (%) | | 16.7 | % | 20.9 | % | (4.2 | )pp |
Revenue for the Individual segment increased $11.6 million in 2004 compared with 2003. The main contributors to revenue growth were revenue relating to the Global Analyst Research Settlement and Morningstar.com, partially offset by lower revenue from some of our more mature products such as Reprints, Morningstar Mutual Funds, and Morningstar FundInvestor. Subscriptions for Morningstar.com Premium service increased to 131,035 as of December 31, 2004, compared with 114,140 as of December 31, 2003.
Operating income for the Individual segment increased $0.4 million, or 5.9%, in 2004 compared with 2003. The revenue increase of $11.6 million exceeded the increase in operating expense of $11.2 million. Expense related to the expansion of our stock research capabilities, including the hiring of additional stock analysts, preceded revenue from the services we are providing under the Global Analyst Research Settlement. Cost of goods sold accounted for most of the expense increase and was driven by higher compensation costs, including special incentive compensation for our analyst team. Sales and marketing expense increased primarily as a result of marketing efforts for Morningstar.com Premium service. General and administrative expense increased due to higher corporate overhead. Depreciation and amortization expense increased slightly, reflecting refurbishment costs and network equipment additions.
Advisor Segment
($000) | | 2004 | | 2003 | | Change | |
Revenue | | $ | 60,880 | | $ | 49,161 | | 23.8 | % |
Operating income | | $ | 13,966 | | $ | 9,521 | | 46.7 | % |
Operating margin (%) | | 22.9 | % | 19.4 | % | 3.5 | pp |
Advisor Workstation and Morningstar Managed Portfolios made the largest contribution to the Advisor segment’s revenue growth of $11.7 million in 2004. Principia revenue was relatively unchanged compared with 2003. The increase in Advisor Workstation revenue is mainly from sales of the Enterprise Edition. The number of licenses and subscriptions for Advisor Workstation and Principia combined increased to 131,543 as of December 31, 2004, compared with 88,300 as of December 31, 2003. The increase in revenue for Morningstar Managed Portfolios was driven by an increase in the amount of assets under management compared with 2003.
61
Operating income increased $4.5 million to $14.0 million in 2004, compared with $9.5 million in 2003. The $11.7 million increase in revenue was partially offset by approximately a $7.2 million increase in operating expense. Cost of goods sold increased primarily as a result of higher compensation-related expense, including higher incentive compensation expense associated with favorable segment performance. Development expense increased primarily due to higher incentive compensation expense. Sales and marketing expense increased primarily due to higher sales commissions expense for products such as Advisor Workstation. General and administrative expense increased primarily because of higher corporate overhead.
Institutional Segment
($000) | | 2004 | | 2003 | | Change | |
Revenue | | $ | 78,402 | | $ | 59,745 | | 31.2 | % |
Operating income | | $ | 13,667 | | $ | 4,160 | | 228.5 | % |
Operating margin (%) | | 17.4 | % | 7.0 | % | 10.4 | pp |
Revenue increased $18.7 million in 2004 compared with 2003, driven primarily by Investment Consulting, Licensed Data, Morningstar Direct, Licensed Tools and Content, and Morningstar Retirement Manager. The number of licenses and subscriptions for Morningstar Direct increased to 775 as of December 31, 2004, compared with 601 as of December 31, 2003. In 2004, we recognized a full year of revenue from the acquisition of mPower, compared with six months in 2003. We acquired mPower in July 2003.
Operating income increased $9.5 million in 2004 compared with 2003. The increase was primarily due to revenue growth of $18.7 million. Operating expense increased approximately $9.2 million, or 16.5%, primarily reflecting increases in cost of goods sold, sales and marketing expense, and general and administrative expense. The increase in these categories was mainly driven by compensation-related expense, including incentive compensation and sales commissions, increased operating expense in our international operations, primarily in Europe, and our acquisition of mPower.
Corporate and Eliminations
Corporate items and eliminations include stock-based compensation expense, capitalized internal product development costs and related amortization, and amortization related to intangible assets. The following table shows the components of corporate and eliminations expense (income) that impacted our consolidated operating income:
($000) | | 2004 | | 2003 | | Change | |
Stock-based compensation expense | | $ | 16,723 | | $ | 29,029 | | (42.4 | )% |
Capitalized internal product development costs | | (2,802 | ) | (3,662 | ) | (23.5 | )% |
Depreciation and amortization | | 3,342 | | 2,250 | | 48.5 | % |
Sales tax expense | | — | | 3,079 | | (100.0 | )% |
Other | | 460 | | 1,130 | | (59.3 | )% |
Corporate items and eliminations | | $ | 17,723 | | $ | 31,826 | | (44.3 | )% |
In 2004, corporate items and eliminations decreased $14.1 million reflecting a decline of $12.3 million in stock-based compensation expense. In addition, in 2003, we participated in voluntary disclosure or similar programs related to state sales tax. Through these programs we identified sales tax amounts due for prior years and have negotiated or are in discussions with local tax authorities to settle these amounts. We estimated our total liability for these taxes to be approximately $9.0 million, of which $5.9 million was recorded in years prior to 2003, and $3.1 million was recorded in 2003.
Non-Operating Income and Income Tax Expense
Non-Operating Income
The following table presents the components of net non-operating income:
($000) | | 2005 | | 2004 | | 2003 | |
Gain on sale of investment in unconsolidated entity | | $ | — | | $ | 19 | | $ | 510 | |
Interest income, net | | 3,078 | | 1,211 | | 279 | |
Other income, net | | 121 | | 575 | | 321 | |
Non-operating income | | $ | 3,199 | | $ | 1,805 | | $ | 1,110 | |
Net interest income primarily reflects interest from our investment portfolio. Net interest income increased $1.9 million and $0.9 million during 2005 and 2004, respectively, because of increases in cash, cash equivalents, and investments, as well as higher returns
62
on invested cash balances. During 2006, we expect interest income to decline because our cash and investment balances declined to fund the March 2006 purchase of Ibbotson Associates.
Net other income primarily represents royalty income from Morningstar Japan K.K., unrealized and realized gains and losses from our investment portfolio, and foreign currency exchange gains and losses arising from the ordinary course of business related to our international operations.
In March 2000, we entered into a stock purchase agreement with Techfi Corporation (Techfi), a provider of portfolio management and accounting software, training, and support to investment advisors and financial planners. On June 7, 2002, Techfi Corporation and Advent Software, Inc. entered into an Agreement and Plan of Merger, whereby all of the issued and outstanding shares of Techfi common stock and vested options were converted into the right to receive cash. Our share of the total proceeds was $4.8 million, resulting in a gain of $3.4 million in 2002. In 2004 and 2003, less than $0.1 million and $0.5 million, respectively, were released from escrow and recorded as additional gains. The gains recorded in 2004 and 2003 are included as “Gain on sale of investment in unconsolidated entity.” There were no gains recorded in 2005.
Income Tax Expense
The following table summarizes the components of our effective income tax expense rate:
($000) | | 2005 | | 2004 | | 2003 | |
Income (loss) before income taxes and equity in net income of unconsolidated entities | | $ | 49,679 | | $ | 19,540 | | $ | (9,644 | ) |
Equity in net income of unconsolidated entities | | 1,662 | | 843 | | 697 | |
Total | | $ | 51,341 | | $ | 20,383 | | $ | (8,947 | ) |
Income tax expense | | $ | 20,224 | | $ | 11,574 | | $ | 2,950 | |
Effective income tax expense rate | | 39.4 | % | 56.8 | % | 33.0 | % |
For a reconciliation of the U.S. federal tax rate to our effective tax rate, refer to Note 16 in the Notes to our Consolidated Financial Statements. Our effective income tax rate is influenced by three primary factors: incentive stock options; the reported income or loss of our non-U.S. entities and our evaluation of the realizability of our net operating losses; and the impact of specific tax planning strategies.
In 2005, our effective income tax expense rate decreased compared with prior years, primarily due to a reduction in the tax impact related to incentive stock options. For incentive stock options, we record stock-based compensation expense but we do not record a corresponding tax benefit. This has the impact of increasing our effective income tax rate above the U.S. Federal rate of 35%. The amount of incentive stock option expense recorded in 2005 was lower than the amounts recorded in 2004 and 2003, reflecting the fact that, subsequent to our initial public offering, incentive stock options are no longer accounted for under the liability method, and because they are fully vested, no stock-based compensation expense was recorded for these options during the last nine months of the 2005. Our 2005 effective tax rate also reflects an increase in the number of disqualifying dispositions related to incentive stock options. A disqualifying disposition occurs when the option holder sells shares within one year of exercising an incentive stock option. We receive a tax benefit in the period that the disqualifying disposition occurs.
Our effective income tax expense rate also reflects the fact that we are not recording an income tax benefit related to losses recorded by certain of our non-U.S. operations. The foreign net operating losses may become deductible in certain international tax jurisdictions to the extent these international operations become profitable. In the year the non-U.S. entity records a loss, we do not record a corresponding tax benefit, thus increasing our effective tax rate. For each of our entities, we evaluate whether it is more likely than not that the tax benefits related to net operating losses will be realized. As part of this evaluation, we consider evidence such as tax planning strategies, historical operating results, forecasted taxable income, and recent financial performance. In 2004, based on the evidence related to one of our non-U.S. entities, we concluded it was more likely than not that we would be able to use the accumulated net operating losses. We therefore reduced the valuation reserve and recorded a tax benefit of $0.6 million in 2004.
In the second quarter of 2005, we recorded a deferred income tax benefit of $0.7 million related to research and development expenses due to a change in U.S. income tax regulations, which resulted in a one-time reduction of our effective income tax expense rate. In the fourth quarter of 2005, we formalized cost-sharing agreements among our operations to more accurately reflect the economic sharing arrangements that benefit our subsidiaries. This also had the effect of lowering our taxes in certain jurisdictions.
Liquidity and Capital Resources
We believe that our available cash balances and investments, along with cash generated from operations, will be sufficient
63
to meet our operating and cash needs for the foreseeable future. We invest our cash reserves in cash equivalents and investments, consisting primarily of fixed-income securities. We intend to use our cash, cash equivalents, and investments for general corporate purposes, including working capital, and for funding future growth.
Cash and Cash Equivalents
As of December 31, 2005, we had cash and cash equivalents of $92.4 million, an increase of $56.5 million compared with December 31, 2004. The increase primarily reflects $48.4 million in cash provided by operating activities and $25.3 million in cash provided by financing activities, partially offset by $16.9 million in cash used for investing activities. In addition to the $92.4 million of cash and cash equivalents as of December 31, 2005, we had $60.8 million of investments, consisting primarily of fixed-income securities, an increase of $1.2 million from December 31, 2004. In February 2006, we paid $22.4 million of annual bonuses to our employees, and in March 2006, we acquired Ibbotson Associates for approximately $83 million in cash, subject to adjustments for working capital and certain other items.
In March 2005, the SEC issued guidance concerning the financial statement presentation of auction-rate securities. Auction-rate securities are long-term variable rate bonds tied to short-term interest rates that are reset through an auction process that occurs approximately every seven to 35 days. Holders of auction-rate securities may liquidate their holdings to prospective buyers by participating in the auctions. Because of their long-term maturity dates and because there is no guarantee that holders of auction-rate securities will be able to liquidate their holdings through the auction process, the SEC stated that auction-rate securities do not qualify as cash equivalents. Accordingly, in 2005, we reclassified our investments in auction-rate securities from cash and cash equivalents to investments in our Consolidated Balance Sheets. The amount of auction-rate securities reclassified from cash and cash equivalents to investments as of December 31, 2004, December 31, 2003, and December 31, 2002 was $23.6 million, $21.7 million, and $12.5 million, respectively. We also made related adjustments to the Consolidated Statements of Cash Flows to reflect the gross purchases and sales of these securities as investing activities. The change in classification had no effect on the amount of total current assets, total assets, net income, income per share, or cash flow from operations as previously reported.
Cash Provided by Operating Activities
Our main source of capital is cash generated from operating activities. In 2005, cash provided by operating activities increased approximately $15.6 million, or 47.4%, to $48.4 million compared with $32.9 million in 2004. The increase in operating cash flows during 2005 primarily reflects an increase in net income and a decrease in net operating assets and liabilities, excluding income tax and bonus payments. In 2005, we made income tax payments of $19.5 million. In 2004, we made only $6.6 million of income tax payments because of the U.S. net operating loss carryforwards available from prior years. In 2005 and 2004, we paid bonuses of approximately $18.0 million and $12.3 million, respectively. The higher bonuses paid in 2005 were the result of strong 2004 operating performance and the last installment of a special bonus paid to our analyst team in connection with the ramp-up of our independent equity research business. Excluding the impact of income tax and bonus payments, our net operating assets and liabilities decreased primarily because of increases in accounts payable and accrued liabilities, accrued bonuses related to the current year’s performance, and accrued income taxes. The increase in accounts receivable, resulting primarily from higher client billings, was partially offset by the related increase in deferred revenue.
In 2004, cash provided by operating activities increased $3.2 million, or 10.6%, to $32.9 million compared with $29.7 million in 2003. The increase in cash provided by operations reflects an improvement in our net income adjusted for non-cash items, partially offset by an increase in working capital. The change in working capital primarily reflects a $10.9 million increase in receivables from clients as a result of increased billings, offset by a $7.0 million increase in deferred revenue and a $3.8 million increase in income tax payable.
Because we frequently invoice our customers and collect cash in advance of providing services or fulfilling subscriptions, we often have significant deferred revenue, which is shown as a liability on our Consolidated Balance Sheets. As of December 31, 2005 and December 31, 2004, our deferred revenue was $71.2 million and $63.4 million, respectively.
In 2003, we began participating in voluntary disclosure or similar programs related to state sales tax. We estimated our total liability for these taxes to be approximately $9.0 million. Beginning in 2003 through the end of 2005, we made total cash payments of $6.7 million in conjunction with these voluntary disclosure programs. Additionally, we decreased our liability by $0.3 million in 2005 due to changes in the estimated liabilities. The remaining $2.0 million expected to be due in connection with these voluntary disclosure programs is recorded as an accrued liability in our Consolidated Balance Sheet as of December 31, 2005. We anticipate that the majority of this amount will be paid in 2006.
In February 2006, we paid annual cash bonuses of $22.4 million related to prior years’ performance. These payments will reduce our cash provided by operating activities during the first quarter of 2006.
64
Cash Used for Investing Activities
Cash used for investing activities consists primarily of purchases of investments, net of proceeds from the sale of investments; capital expenditures; and cash used for acquisitions. In 2005, cash used for investing activities decreased $5.9 million from 2004 primarily reflecting a decrease in purchases of investments, net of proceeds from the sale of investments. This decrease in cash used was partially offset by cash outflows related to the January 2005 acquisition of VARDS. In 2004, cash used for investing activities decreased $6.8 million from 2003, primarily reflecting lower levels of cash used for acquisitions and cash used for capital expenditures, partially offset by an increase in cash transferred to our investment portfolio.
Purchases of investments, net of proceeds from the sale of investments, were $1.3 million, $14.9 million, and $10.8 million in 2005, 2004, and 2003, respectively. As of December 31, 2005 and 2004, we had investments, consisting primarily of fixed-income securities, of $60.8 million and $59.6 million, respectively. As of December 31, 2005, our investments represented approximately 40% of our total cash, cash equivalents, and investments compared with approximately 62% as of December 31, 2004. The change in mix from investments to cash and cash equivalents reflected the need for cash to fund our acquisition of Ibbotson Associates and annual bonus payments in the first quarter of 2006.
Capital expenditures were $7.5 million, $7.7 million, and $8.6 million in 2005, 2004, and 2003, respectively. Capital expenditures are primarily for leasehold improvements, computer hardware, and capitalized internal product development costs. In 2006, we expect that our capital expenditures will be approximately $5.3 million. This amount is less than the capital expenditures made in 2005 because in 2005 we substantially completed the capital spending for new office space in London, as well as additional buildouts for our development center in China.
Cash used for acquisitions was $8.2 million in 2005, related to our January 2005 acquisition of VARDS. In 2004, cash used for acquisitions was $0.2 million, related to our February 2004 purchase of the remaining 51% of Morningstar Norge AS (Morningstar Norway) that we did not previously own. In 2003, cash used for acquisitions, net of cash acquired, was $10.8 million, related to our acquisitions of Morningstar Research Inc. (Morningstar Canada) and mPower.
Cash Provided by (Used for) Financing Activities
In 2005, cash provided by financing activities increased $31.7 million, reflecting net proceeds of $18.1 million from our initial public offering in May 2005. These proceeds resulted from the underwriters’ exercise of their over-allotment option based on our initial public offering price of $18.50 per share, after deducting the underwriting discounts and commissions and approximately $2.6 million of offering expenses. We also received proceeds of $7.2 million from stock option exercises in 2005, compared with only $0.2 million in 2004. Stock option exercises increased in 2005 following our initial public offering.
In March 2004, we repaid a $6.5 million promissory note payable to Joe Mansueto, our chairman, chief executive officer, and controlling shareholder. The obligation and related interest were paid in full. See Note 13 of the Notes to our Consolidated Financial Statements.
Under the 1993 Morningstar Stock Option Plan, subject to certain conditions, holders of vested options were permitted, prior to completion of our initial public offering, to exercise their options and immediately resell to us the shares of common stock obtained from the exercise at a price equal to the fair value of the shares, as determined by our board of directors. We have the right to pay this balance in equal installments over a period of five years, with the deferred balance accruing interest at a floating rate based on the U.S. Treasury bill. As of December 31, 2005, we had less than $0.1 million of deferred obligations relating to such repurchases, which are included in Other Liabilities in our Consolidated Balance Sheets. We expect to satisfy these obligations in the first quarter of 2006.
Acquisitions
Variable Annuity Research and Data Service (VARDS)
In January 2005, we acquired the VARDS unit from Finetre Corporation for $8.2 million in cash. VARDS provides research and data on variable annuities and is used by many firms that offer variable annuities. The service is also used by many brokerage firms for research, due diligence, and suitability determination. We believe this acquisition strengthens our investment database and will enhance our efforts to provide investors with the information they need to make well-informed decisions when investing in variable annuities. The acquisition contributed approximately $2.4 million of revenue in 2005.
Morningstar Norway
In February 2004, we purchased the remaining 51% of Morningstar Norway that we did not previously own. The purchase price consisted of $0.2 million in cash and approximately $0.1 million of other consideration. Prior to this transaction, we accounted for our investment in Morningstar Norway using the equity method.
65
mPower
In July 2003, we acquired all of the outstanding stock of mPower for $4.9 million. mPower contributed $2.1 million to our revenue in 2003. This transaction is accounted for as a “bargain purchase” because the purchase price was less than the total fair value of the assets acquired. Therefore, certain long-term assets were assigned values that were lower than their fair value at the date of acquisition.
Morningstar Canada
In January 2003, we purchased the remaining half of Morningstar Canada that we did not previously own for $6.3 million. We have always consolidated the results of Morningstar Canada for all periods presented in the financial statements because we have always controlled its day-to-day operations.
Initial Public Offering
In May 2005, we completed our initial public offering of 7,612,500 shares of our common stock. These shares commenced trading on May 3, 2005 on the Nasdaq National Market under the symbol “MORN.” All of these shares were sold by affiliates of SOFTBANK Finance Corporation, a wholly owned subsidiary of SOFTBANK Corp. We did not receive any proceeds from the sale of these shares.
We granted the underwriters the right to purchase up to an additional 1,141,875 shares at the initial public offering price to cover over-allotments. In May 2005, the underwriters exercised their over-allotment option in full. The net proceeds to us from the exercise of the underwriters’ over-allotment option were $18.1 million, based on our initial public offering price of $18.50 per share, after deducting the underwriting discounts and commissions and $2.6 million of offering expenses.
Reclassification of Stock Options Accounted for as Liabilities to Additional Paid-in Capital
As a result of our initial public offering in May 2005, we are no longer required to settle any options in cash. As a result, current liabilities of $16.7 million and long-term liabilities of $24.9 million associated with these options were reclassified to additional paid-in capital in the second quarter of 2005.
Subsequent Event
On March 1, 2006, we acquired Ibbotson Associates, a privately held firm that specializes in asset allocation research and services for approximately $83 million in cash, subject to adjustments for working capital and other items. This acquisition fits several of Morningstar’s growth strategies and broadens our reach in the areas of investment consulting, managed retirement accounts, and institutional and advisor software. Related to this acquisition, we anticipate realizing approximately $10 million in cash tax benefits in 2006 related to payment for the cancellation of Ibbotson’s stock options.
Application of Critical Accounting Policies and Estimates
Our discussion and analysis of our financial condition and results of operations are based on our Consolidated Financial Statements, which have been prepared in accordance with U.S. GAAP. Our significant accounting policies are discussed in Note 2 of the Notes to our Consolidated Financial Statements. The preparation of financial statements in accordance with U.S. GAAP requires management to make estimates and assumptions that affect the reported amounts of assets, liabilities, revenue, expense, and related disclosures included in our Consolidated Financial Statements.
We evaluate our estimates on an ongoing basis. We base our estimates on historical experience and on various other assumptions that we believe are reasonable under the circumstances. The results of these assumptions are the basis for judgments about the carrying values of assets and liabilities that are not readily apparent from other sources. Actual results could vary from the estimates and assumptions used in the preparation of our Consolidated Financial Statements. If actual amounts are ultimately different from previous estimates, the revisions are included in our results of operations for the period in which the actual amounts become known.
We believe the following critical accounting policies reflect the significant judgments and estimates used in the preparation of our Consolidated Financial Statements:
Revenue Recognition
Much of our revenue comes from the sale of subscriptions or licenses for print publications, software, and Internet-based products and services. We recognize this revenue in equal amounts over the term of the subscription or license, which generally ranges from one to three years. We also provide analysis, consulting, retirement advice, and other services. We recognize this revenue when the service is provided or during the service obligation period defined in the contract. Deferred revenue is the amount invoiced or
66
collected in advance for subscriptions, licenses, or services that has not yet been recognized as revenue. At December 31, 2005 our deferred revenue was $71.2 million. We expect to recognize this deferred revenue in future periods as we fulfill our service obligations. The amount of deferred revenue may increase or decrease primarily based on the mix of contracted products and services and the volume of new and renewal subscriptions. The timing of future revenue recognition may change depending on the terms of the license agreements and timing of fulfilling of our service obligations. We believe that the estimate related to revenue recognition is a critical accounting estimate, and to the extent that there are material differences between our determination of deferred revenue and actual results, our financial condition or results of operations may be affected.
Purchase Price Allocation
Over the past several years, we have acquired companies that complement our business operations. In 2005, we acquired VARDS for $8.2 million in cash. In 2004, we acquired the remaining 51% of Morningstar Norway that we did not previously own for $0.2 million in cash and $0.1 million in other consideration. In 2003, we acquired mPower for $4.9 million in cash and the remaining 50% of Morningstar Canada that we did not previously own for $6.3 million. For each of these acquisitions, the purchase price was allocated to the assets acquired, liabilities assumed, and goodwill, in accordance with SFAS No. 141, Business Combinations. We recognized the assets and liabilities acquired related to these acquisitions at their estimated fair values including $8.4 million of value assigned to intangible assets such as customer lists, intellectual property, supplier lists, and technology. For these intangible assets, the estimated useful lives range from 3 to 20 years. We also recorded $11.8 million in goodwill related to these acquisitions.
Management judgment is required in allocating the purchase price to the acquired assets and liabilities. We use judgment to:
• identify the acquired assets,
• estimate the fair value of these assets,
• estimate the useful life of the assets; and
• assess the appropriate method for recognizing depreciation or amortization expense over the asset’s useful life.
We believe that the accounting estimates related to purchase price allocations are critical accounting estimates because the assumptions impact the amounts and classifications of assets and liabilities presented in our Consolidated Balance Sheets, the amount of amortization and depreciation expense, if any, recorded in our Consolidated Statements of Operations, and the impairment testing performed in subsequent periods.
Goodwill
Goodwill recorded on our Consolidated Balance Sheets was $17.5 million as of December 31, 2005. In accordance with SFAS No. 142, Goodwill and Other Intangible Assets, we do not amortize goodwill. Instead, it is subject to at least an annual test for impairment, or whenever indicators of impairment exist, based on a discounted cash flow model. An impairment would occur if the carrying amount of a reporting unit, including goodwill, exceeded the fair value of that reporting unit.
The process of evaluating the potential impairment of goodwill is subjective and requires significant judgment. In estimating the fair value of the reporting units, we make estimates and judgments about the future cash flows of the reporting unit. These estimates include assumptions about future market growth and trends, forecasted revenue and costs, capital investments, appropriate discount rates, and other variables that can significantly affect the value of the reporting unit.
Although our cash flow forecasts are based on assumptions that are consistent with plans and estimates we use to manage the underlying business, there is significant judgment in determining the cash flows attributable to these businesses over a long-term horizon. We update these assumptions and cash flow estimates annually, at a minimum.
We believe that the accounting estimate related to goodwill impairment is a critical accounting estimate because the assumptions used are highly susceptible to changes in the operating results and cash flows of the reporting units included in our segments. If actual results differ from our estimates, future tests may indicate an impairment of goodwill. This would result in a non-cash charge, adversely affecting our results of operations.
Impairment of Long-Lived Assets
Our Consolidated Balance Sheet includes property, equipment, and capitalized software of $17.4 million and $7.3 million of intangible assets at December 31, 2005. In accordance with SFAS No. 144, Accounting for the Impairment or Disposal of Long-Lived Assets, we review our property, equipment, capitalized software, and intangible assets for impairment whenever events or changes in circumstances indicate that the carrying value may not be recoverable. Such events or changes may include a deterioration in the business climate for a specific product or service. If the total of projected future undiscounted cash flows is less
67
than the carrying amount of an asset, we may need to record an impairment loss based on the excess of the carrying amount over the fair value of the assets.
Estimates of future cash flows and the estimated useful lives associated with these assets are critical to the assessment of recoverability and fair values. They are susceptible to change from period to period due to the requirement to make assumptions about future cash flows generated over extended periods of time. Changes in these estimates could result in a determination of asset impairment, which would result in a reduction to the carrying value and could adversely affect our operating results in the related period.
Stock-Based Compensation
We account for stock option grants made to employees and non-employee directors in accordance with SFAS No. 123, Accounting for Stock-Based Compensation. Following our initial public offering in May 2005, we use the equity method to account for all outstanding stock options. In 2005, stock-based compensation expense recorded under the equity method was $8.1 million, representing 4.5% of our 2005 operating expense. We calculate this expense based on the fair value of the option at the time of the grant. We determine the fair value using a Black-Scholes option pricing model.
Determining the fair value of our options requires that we make several estimates, including the volatility of our stock price, the expected life of the option, and the expected strike price at the time of exercise. As a new public company, we estimate stock-price volatility with reference to a peer group of companies. Determining the companies to include in this peer group involves judgment. Our current estimate of volatility used in the Black-Scholes model is 50%. In making our estimates, we have used historical data as well as management judgment to arrive at the data inputs. A 1% change in the Black-Scholes value would have resulted in a corresponding change of approximately $0.1 million in stock-based compensation expense in 2005 for options accounted for using the equity method.
We believe that the estimates related to stock-based compensation expense are critical accounting estimates because the assumptions used could significantly impact the amount of stock-based compensation expense recorded in our Consolidated Statement of Operations.
Income Taxes
Our annual effective income tax expense rate is based on the mix of income and losses in our U.S. and non-U.S. entities which are part of our Consolidated Financial Statements, statutory tax rates, and tax planning opportunities available to us in the various jurisdictions in which we operate. Significant judgment is required in evaluating our tax positions.
Tax law requires items to be included in the tax return at different times than when these items are reflected in our Consolidated Financial Statements. As a result, the effective tax rate reflected in our consolidated financial statements is different from the tax rate reported on our tax return (our cash tax rate). Some of these differences are permanent, such as expenses that are not deductible in our tax return, and some differences reverse over time, such as depreciation expense. These timing differences create deferred tax assets and liabilities. Deferred tax assets and liabilities are determined based on temporary differences between the financial reporting and the tax basis of assets and liabilities.
As of December 31, 2005, we had $0.8 million of net current deferred tax liabilities and $29.7 million of net long-term deferred tax assets. In addition, we have net operating loss (NOL) carryforwards of $26.3 million related to our non-U.S. operations. Of these NOLs, $6.5 million will begin to expire in 2008 through 2020 and $19.8 million have no expiration. Due to the historical operating losses of certain of the non-U.S. operations that generated these NOLs, we have recorded a valuation allowance against all but $0.4 million of the NOLs, reflecting the likelihood that the benefit of the NOLs will not be realized. In assessing the realizability of our deferred tax assets and NOLs, we consider whether it is more likely than not that some portion or all of the deferred tax assets will not be realized. The ultimate realization of deferred tax assets is dependent upon the generation of future taxable income during the periods in which those temporary differences become deductible. In assessing the need for a valuation allowance, we consider both positive and negative evidence, including tax-planning strategies, projected future taxable income, and recent financial performance. If after future assessments of the realizability of the deferred tax assets we determine a lesser allowance is required, we would record a reduction to the income tax expense and to the valuation allowance in the period this determination was made. This would cause our income tax expense, effective tax rate, and net income to fluctuate.
In addition, we establish reserves at the time that we determine that it is more likely than not that we will need to pay additional taxes related to certain matters. We adjust these reserves, including any impact of the related interest and penalties, in light of changing facts and circumstances such as the progress of a tax audit. A number of years may elapse before a particular matter for which we have established a reserve is audited and finally resolved. The number of years with open tax audits varies depending on the tax jurisdiction. While it is often difficult to predict the final outcome or the timing of resolution of any particular tax matter, we record a reserve when we determine the likelihood of loss is more likely than not. Such liabilities are recorded as income taxes
68
payable in our Consolidated Balance Sheets. Settlement of any particular issue would usually require the use of cash. Favorable resolutions of tax matters for which we have previously established reserves are recognized as a reduction to our income tax expense when the amounts involved become known.
Assessing the future tax consequences of events that have been recognized in our financial statements or tax returns requires judgment. Variations in the actual outcome of these future tax consequences could materially impact our financial position, results of operations, or cash flows.
Contingencies
We are subject to various claims and contingencies related to legal proceedings and investigations. Refer to Note 17 of the Notes to our Consolidated Financial Statements. Due to their nature, such legal proceedings involve inherent uncertainties including, but not limited, to court rulings, negotiations between affected parties, and government actions. Judgment is required as we assess the probability of loss for such contingencies and either accrue a liability or disclose the relevant circumstances, as appropriate. If actual results differ from our assessments, our financial position, results of operations, or cash flows would be impacted.
Recently Issued Accounting Pronouncements
In December 2004, the Financial Accounting Standards Board (FASB) issued SFAS No. 123 (Revised 2004), Share-Based Payment (SFAS No. 123 (R)), which requires all companies to measure compensation cost for all share-based payments (including employee stock options) at fair value. In April 2005, the SEC announced the adoption of a rule that defers the required effective date of SFAS No. 123 (R) until the beginning of the first fiscal year beginning after June 15, 2005, instead of at the beginning of the first quarter after June 15, 2005 (as prescribed originally by SFAS 123 (R)). Therefore, we will adopt the provisions of SFAS No. 123 (R) in the first quarter of 2006; we will adopt SFAS 123 (R) prospectively.
We currently measure and record compensation expense related to stock option grants in accordance with the provisions of SFAS No. 123, Accounting for Stock-Based Compensation. We use a Black-Scholes model to estimate the fair value of stock options granted to employees and expect to continue to use this acceptable option valuation model upon the adoption of SFAS No. 123 (R). We currently account for forfeitures of stock options as they occur. SFAS 123 (R) eliminates this alternative and requires us to estimate expected forfeitures at the grant date and recognize compensation cost only for those awards expected to vest. Accordingly, in the first quarter of 2006, we will record a cumulative effect of accounting change, net of tax, of approximately $0.3 million to reverse the impact of stock-based compensation expense recorded in prior years related to outstanding stock options that we estimate will not vest. Other than this cumulative effect of accounting change, we do not anticipate that adoption of SFAS 123 (R) will have a material impact on our Consolidated Statements of Operations or our Consolidated Balance Sheets. Concerning our Consolidated Statements of Cash Flows, SFAS 123 (R) requires that the benefits of tax deductions in excess of recognized compensation expense be reported as a financing cash flow, rather than as an operating cash flow. This requirement will reduce net operating cash flows and increase net financing cash flows in periods after adoption. While we cannot estimate what those amounts will be in the future because they depend on employee stock option exercises and other factors, the amount of operating cash flows recognized in 2005 for such excess tax deductions was $2.5 million.
In March 2005, the FASB issued FASB Interpretation (FIN) No. 47, Accounting for Conditional Asset Retirement Obligations, an Interpretation of FASB Statement No. 143. A conditional asset retirement obligation refers to a legal obligation to retire assets where the timing and/or method of settlement are conditioned on future events. FIN No. 47 requires an entity to recognize a liability for the fair value of a conditional asset retirement obligation when incurred if the liability’s fair value can be reasonably estimated. FIN No. 47 is effective for companies no later than the end of the first fiscal year ending after December 15, 2005. The adoption of FIN No. 47 did not have a material impact on our results of operations, financial position, or cash flows.
In May 2005, the FASB issued SFAS No. 154, Accounting Changes and Error Corrections – replacement of APB Opinion No. 20 and FASB Statement No. 3 (SFAS No. 154). SFAS No. 154 changes the accounting for and reporting of a change in accounting principle by requiring retrospective application to prior periods’ financial statements of changes in accounting principle unless impracticable. SFAS No. 154 is effective for accounting changes and corrections of errors made in fiscal years beginning after December 15, 2005. Companies are permitted to adopt the standard earlier than the required date for accounting changes and corrections of errors made in fiscal years beginning after the date that SFAS No. 154 was issued. We do not expect the adoption of SFAS No. 154 to have a material impact on our results of operations, financial position, or cash flows.
69
Selected Quarterly Financial Data
(in thousands except per share
amounts) | | Q1 | | Q2 | | Q3 | | Q4 | | Q1 | | Q2 | | Q3 | | Q4 | |
Revenue | | $ | 41,127 | | $ | 43,244 | | $ | 46,573 | | $ | 48,714 | | $ | 53,204 | | $ | 56,243 | | $ | 56,927 | | $ | 60,740 | |
Operating expense (1): | | | | | | | | | | | | | | | | | |
Cost of goods sold | | 12,266 | | 14,908 | | 13,858 | | 13,677 | | 15,912 | | 15,674 | | 16,261 | | 16,561 | |
Development | | 3,361 | | 3,664 | | 4,057 | | 5,085 | | 5,149 | | 4,593 | | 4,749 | | 5,163 | |
Sales and marketing | | 8,365 | | 8,284 | | 9,367 | | 10,018 | | 9,785 | | 9,845 | | 9,499 | | 9,942 | |
General and administrative | | 8,688 | | 11,176 | | 10,930 | | 15,994 | | 13,084 | | 11,135 | | 11,849 | | 13,167 | |
Depreciation and amortization | | 1,811 | | 1,788 | | 1,755 | | 2,871 | | 2,396 | | 1,852 | | 2,222 | | 1,796 | |
Total operating expense | | 34,491 | | 39,820 | | 39,967 | | 47,645 | | 46,326 | | 43,099 | | 44,580 | | 46,629 | |
Operating income | | 6,636 | | 3,424 | | 6,606 | | 1,069 | | 6,878 | | 13,144 | | 12,347 | | 14,111 | |
Non-operating income (expense): | | | | | | | | | | | | | | | | | |
Gain on sale of investment in unconsolidated entity | | — | | — | | — | | 19 | | — | | — | | — | | — | |
Interest income, net | | 224 | | 210 | | 260 | | 517 | | 449 | | 605 | | 892 | | 1,132 | |
Other income (expense), net | | 38 | | 58 | | 250 | | 229 | | 260 | | (200 | ) | (46 | ) | 107 | |
Non-operating income, net | | 262 | | 268 | | 510 | | 765 | | 709 | | 405 | | 846 | | 1,239 | |
Income before income taxes and equity in net income of unconsolidated entities | | 6,898 | | 3,692 | | 7,116 | | 1,834 | | 7,587 | | 13,549 | | 13,193 | | 15,350 | |
Income tax expense | | 2,674 | | 2,440 | | 3,235 | | 3,225 | | 4,060 | | 4,600 | | 5,857 | | 5,707 | |
Equity in net income of unconsolidated entities | | 282 | | 97 | | 212 | | 252 | | 480 | | 549 | | 183 | | 450 | |
Net income (loss) | | $ | 4,506 | | $ | 1,349 | | $ | 4,093 | | $ | (1,139 | ) | $ | 4,007 | | $ | 9,498 | | $ | 7,519 | | $ | 10,093 | |
Basic income (loss) per share | | $ | 0.12 | | $ | 0.04 | | $ | 0.11 | | $ | (0.03 | ) | $ | 0.10 | | $ | 0.24 | | $ | 0.19 | | $ | 0.25 | |
Weighted average common shares outstanding—basic | | 38,395 | | 38,397 | | 38,438 | | 38,442 | | 38,448 | | 39,064 | | 39,922 | | 40,109 | |
Diluted income (loss) per share | | $ | 0.09 | | $ | 0.03 | | $ | 0.10 | | $ | (0.03 | ) | $ | 0.09 | | $ | 0.22 | | $ | 0.17 | | $ | 0.22 | |
Weighted average common shares outstanding—diluted | | 41,546 | | 41,528 | | 41,819 | | 38,442 | | 42,944 | | 43,742 | | 45,354 | | 45,730 | |
(1) Includes stock-based compensation expense of:
| | Q1 | | Q2 | | Q3 | | Q4 | | Q1 | | Q2 | | Q3 | | Q4 | |
Cost of goods sold | | $ | 258 | | $ | 526 | | $ | 336 | | $ | 1,023 | | $ | 664 | | $ | 264 | | $ | 274 | | $ | 271 | |
Development | | 147 | | 267 | | 157 | | 449 | | 275 | | 105 | | 112 | | 111 | |
Sales and marketing | | 156 | | 306 | | 180 | | 542 | | 325 | | 128 | | 129 | | 128 | |
General and administrative | | 1,522 | | 3,017 | | 1,897 | | 5,940 | | 3,623 | | 1,441 | | 1,515 | | 1,530 | |
Total stock-based compensation expense | | $ | 2,083 | | $ | 4,116 | | $ | 2,570 | | $ | 7,954 | | $ | 4,887 | | $ | 1,938 | | $ | 2,030 | | $ | 2,040 | |
| | | | | | | | | | | | | | | | | |
Stock-based compensation expense (income) under the liability method | | $ | (424 | ) | $ | 2,381 | | $ | 1,142 | | $ | 5,864 | | $ | 2,810 | | $ | — | | $ | — | | $ | — | |
Stock-based compensation expense under the equity method | | 2,507 | | 1,735 | | 1,428 | | 2,090 | | 2,077 | | 1,938 | | 2,030 | | 2,040 | |
Total stock-based compensation expense | | $ | 2,083 | | $ | 4,116 | | $ | 2,570 | | $ | 7,954 | | $ | 4,887 | | $ | 1,938 | | $ | 2,030 | | 2,040 | |
70
Contractual Obligations
The following table presents our known contractual obligations as of December 31, 2005 and the expected timing of cash payments related to these contractual obligations:
($000) | | 2006 | | 2007 | | 2008 | | 2009 | | 2010 | | Thereafter | | Total | |
Minimum commitments on non-cancelable operating lease obligations (1) | | $ | 2,511 | | $ | 1,978 | | $ | 3,019 | | $ | 4,314 | | $ | 4,806 | | $ | 68,144 | | $ | 84,772 | |
Asset retirement obligation (2) | | | — | | | — | | | 98 | | | — | | | — | | | — | | | 98 | |
Obligations related to stock options (3) | | | 45 | | | — | | | — | | | — | | | — | | | — | | | 45 | |
Total | | $ | 2,556 | | $ | 1,978 | | $ | 3,117 | | $ | 4,314 | | $ | 4,806 | | $ | 68,144 | | $ | 84,915 | |
|
(1) The non-cancelable lease obligations relate primarily to lease commitments on office space. In December 2005, we signed an agreement with the Mills Corporation to lease approximately 210,000 square feet of new office space for our corporate headquarters in Chicago, Illinois. The lease begins in March 2008 and has a term of 15 years. The minimum future lease payments are included in the table presented above. |
(2) The asset retirement obligation relates to costs that will be incurred to return office space modified by leasehold improvements to its original condition in accordance with the lease agreement.
(3) These obligations relate to stock option exercises. See Note 13 of the Notes to our Consolidated Financial Statements.
In addition, we have an obligation to pay up to approximately $2.3 million under a deferred compensation agreement with an executive officer, discussed in Note 13 of the Notes to our Consolidated Financial Statements. As of December 31, 2005, $2.1 million is classified as current and $0.2 million is classified as long-term. We are required to make these payments as the officer exercises certain stock options granted to him under the 1999 Stock Option Plan. Because the timing of these payments is uncertain, we have not included this obligation in the above table.
There are no purchase commitments as of December 31, 2005 that we believe would have a significant impact on our Consolidated Balance Sheet or Consolidated Statement of Cash Flows.
Item 7A. Quantitative and Qualitative Disclosures about Market Risk
We may be subject to risk from fluctuating interest rates. Our investment portfolio is actively managed and may suffer losses due to fluctuating interest rates, market prices, or adverse security selection. At December 31, 2005, we held $60.8 million of investments, consisting primarily of fixed-income securities. Based on our estimates, a 100 basis point change in interest rates would have increased or decreased the fair value of our investment portfolio by approximately $0.3 million.
As our non-U.S. revenue increases, fluctuation in foreign currencies is an increasing potential risk. To date, we have not engaged in currency hedging, and we do not currently have any positions in derivative instruments to hedge our currency risk. Our results could suffer if certain foreign currencies decline relative to the U.S. dollar. In addition, because we use the local currency of our subsidiaries as the functional currency, we are affected by the translation of foreign currencies into U.S. dollars.
71
Item 8. Financial Statements and Supplementary Data
Report of Independent Registered Public Accounting Firm
To the Board of Directors and Shareholders of Morningstar, Inc.
Chicago, Illinois
We have audited the accompanying consolidated balance sheets of Morningstar, Inc. and subsidiaries (the Company) as of December 31, 2005 and 2004, and the related consolidated statements of operations, shareholders' equity and comprehensive income (loss), and cash flows for each of the three years in the period ended December 31, 2005. These financial statements are the responsibility of the Company's management. Our responsibility is to express an opinion on these financial statements based on our audits.
We conducted our audits in accordance with the standards of the Public Company Accounting Oversight Board (United States). Those standards require that we plan and perform the audit to obtain reasonable assurance about whether the financial statements are free of material misstatement. The Company is not required to have, nor were we engaged to perform, an audit of its internal control over financial reporting. Our audits included consideration of internal control over financial reporting as a basis for designing audit procedures that are appropriate in the circumstances, but not for the purpose of expressing an opinion on the effectiveness of the Company's internal control over financial reporting. Accordingly, we express no such opinion. An audit also includes examining, on a test basis, evidence supporting the amounts and disclosures in the financial statements, assessing the accounting principles used and significant estimates made by management, as well as evaluating the overall financial statement presentation. We believe that our audits provide a reasonable basis for our opinion.
In our opinion, such consolidated financial statements present fairly, in all material respects, the financial position of the Company as of December 31, 2005 and 2004, and the results of its operations and its cash flows for each of the three years in the period ended December 31, 2005, in conformity with accounting principles generally accepted in the United States of America.
/s/ Deloitte & Touche LLP | |
Deloitte & Touche LLP |
Chicago, Illinois |
March 3, 2006 |
72
Morningstar, Inc. and Subsidiaries
Consolidated Balance Sheets
As of December 31 (in thousands except share amounts) | | 2005 | | 2004 | |
Assets | | | | | |
Current assets: | | | | | |
Cash and cash equivalents | | $ | 92,367 | | $ | 35,907 | |
Investments | | 60,823 | | 59,556 | |
Accounts receivable, less allowance of $418 and $256, respectively | | 47,530 | | 33,668 | |
Deferred tax asset, net | | — | | 2,373 | |
Other | | 5,495 | | 4,250 | |
Total current assets | | 206,215 | | 135,754 | |
Property, equipment, and capitalized software, net | | 17,355 | | 17,521 | |
Investments in unconsolidated entities | | 16,355 | | 14,704 | |
Goodwill | | 17,500 | | 14,408 | |
Intangible assets, net | | 7,251 | | 1,573 | |
Deferred tax asset, net | | 29,729 | | 27,105 | |
Other assets | | 1,906 | | 2,296 | |
Total assets | | $ | 296,311 | | $ | 213,361 | |
| | | | | |
Liabilities and shareholders’ equity | | | | | |
Current liabilities: | | | | | |
Accounts payable and accrued liabilities | | $ | 13,664 | | $ | 12,085 | |
Accrued compensation | | 26,463 | | 20,204 | |
Income tax payable | | 1,259 | | 3,763 | |
Deferred revenue | | 71,155 | | 63,363 | |
Deferred tax liability, net | | 833 | | — | |
Accrued stock-based compensation | | — | | 15,874 | |
Long-term debt—current portion | | — | | 18 | |
Other | | 2,467 | | 3,545 | |
Total current liabilities | | 115,841 | | 118,852 | |
Accrued compensation | | 4,458 | | 3,567 | |
Accrued stock-based compensation | | — | | 23,943 | |
Other long-term liabilities | | 2,298 | | 2,618 | |
Total liabilities | | 122,597 | | 148,980 | |
| | | | | |
Shareholders’ equity: | | | | | |
Common stock, no par value, 200,000,000 shares authorized, of which 40,284,513 and 38,446,614 shares were outstanding as of December 31, 2005 and 2004, respectively | | 4 | | 4 | |
Treasury stock at cost, 233,332 shares as of December 31, 2005 and 2004 | | (3,280 | ) | (3,280 | ) |
Additional paid-in capital | | 226,593 | | 148,144 | |
Accumulated deficit | | (50,608 | ) | (81,725 | ) |
Accumulated other comprehensive income (loss): | | | | | |
Currency translation adjustment | | 1,130 | | 1,340 | |
Unrealized losses on available for sale securities | | (125 | ) | (102 | ) |
Total accumulated other comprehensive income | | 1,005 | | 1,238 | |
Total shareholders’ equity | | 173,714 | | 64,381 | |
Total liabilities and shareholders’ equity | | $ | 296,311 | | $ | 213,361 | |
See notes to consolidated financial statements.
73
Morningstar, Inc. and Subsidiaries
Consolidated Statements of Operations
Year ended December 31 (in thousands except per share amounts) | | 2005 | | 2004 | | 2003 | |
Revenue | | $ | 227,114 | | $ | 179,658 | | $ | 139,496 | |
Operating expenses: (1) | | | | | | | |
Cost of goods sold | | 64,408 | | 54,709 | | 43,521 | |
Development | | 19,654 | | 16,167 | | 14,663 | |
Sales and marketing | | 39,071 | | 36,034 | | 30,798 | |
General and administrative | | 49,235 | | 46,788 | | 54,145 | |
Depreciation and amortization | | 8,266 | | 8,225 | | 7,123 | |
Total operating expense | | 180,634 | | 161,923 | | 150,250 | |
Operating income (loss) | | 46,480 | | 17,735 | | (10,754 | ) |
Non-operating income: | | | | | | | |
Gain on sale of investment in unconsolidated entity | | — | | 19 | | 510 | |
Interest income, net | | 3,078 | | 1,211 | | 279 | |
Other income, net | | 121 | | 575 | | 321 | |
Non-operating income, net | | 3,199 | | 1,805 | | 1,110 | |
| | | | | | | |
Income (loss) before income taxes and equity in net income of unconsolidated entities | | 49,679 | | 19,540 | | (9,644 | ) |
Income tax expense | | 20,224 | | 11,574 | | 2,950 | |
Equity in net income of unconsolidated entities | | 1,662 | | 843 | | 697 | |
Net income (loss) | | $ | 31,117 | | $ | 8,809 | | $ | (11,897 | ) |
| | | | | | | |
Basic income (loss) per share | | $ | 0.79 | | $ | 0.23 | | $ | (0.31 | ) |
Diluted income (loss) per share | | $ | 0.70 | | $ | 0.21 | | $ | (0.31 | ) |
| | | | | | | |
Weighted average shares outstanding: | | | | | | | |
Basic | | 39,392 | | 38,418 | | 38,382 | |
Diluted | | 44,459 | | 41,858 | | 38,382 | |
|
| | | |
| | 2005 | | 2004 | | 2003 | |
(1) Includes stock-based compensation expense of: | | | | | | | |
Cost of goods sold | | $ | 1,473 | | $ | 2,143 | | $ | 3,091 | |
Development | | 603 | | 1,020 | | 2,090 | |
Sales and marketing | | 710 | | 1,184 | | 2,107 | |
General and administrative | | 8,109 | | 12,376 | | 21,741 | |
Total stock-based compensation expense | | $ | 10,895 | | $ | 16,723 | | $ | 29,029 | |
| | | | | | | | | | | | | |
See notes to consolidated financial statements.
74
Morningstar, Inc. and Subsidiaries
Consolidated Statements of Shareholders’ Equity and Comprehensive Income (Loss)
| | Common | | Common | | | | | | | | Accumulated | | | |
| | Stock | | Stock | | | | Additional | | | | Other | | Total | |
| | Shares | | Par | | Treasury | | Paid-In | | Accumulated | | Comprehensive | | Shareholders’ | |
(in thousands except share amounts) | | Outstanding | | Value | | Stock | | Capital | | Deficit | | Income (Loss) | | Equity | |
| | | | | | | | | | | | | | | |
Balance January 1, 2003 | | 38,366,415 | | $ | 4 | | $ | (3,280 | ) | $ | 127,790 | | $ | (78,637 | ) | $ | 2,255 | | $ | 48,132 | |
Comprehensive loss: | | | | | | | | | | | | | | | |
Net loss | | | | — | | — | | — | | (11,897 | ) | — | | (11,897 | ) |
Reclassification adjustment for realized gains included in net loss | | | | — | | — | | — | | — | | 88 | | 88 | |
Unrealized gain on investments, net of tax of $16 | | | | — | | — | | — | | — | | 96 | | 96 | |
Foreign currency translation adjustment | | | | — | | — | | — | | — | | (2,969 | ) | (2,969 | ) |
Total comprehensive loss | | | | — | | — | | — | | (11,897 | ) | (2,785 | ) | (14,682 | ) |
Issuance of common stock related to stock option exercises, net | | 29,065 | | — | | — | | 127 | | — | | — | | 127 | |
Stock-based compensation | | | | — | | — | | 11,244 | | — | | — | | 11,244 | |
Balance, December 31, 2003 | | 38,395,480 | | 4 | | (3,280 | ) | 139,161 | | (90,534 | ) | (530 | ) | 44,821 | |
Comprehensive income: | | | | | | | | | | | | | | | |
Net income | | | | — | | — | | — | | 8,809 | | — | | 8,809 | |
Reclassification adjustment for realized gains included in net income | | | | — | | — | | — | | — | | (8 | ) | (8 | ) |
Unrealized loss on investments, net of tax of $69 | | | | — | | — | | — | | — | | (97 | ) | (97 | ) |
Foreign currency translation adjustment | | | | — | | — | | — | | — | | 1,873 | | 1,873 | |
Total comprehensive income | | | | — | | — | | — | | 8,809 | | 1,768 | | 10,577 | |
Issuance of common stock related to stock option exercises, net | | 51,134 | | — | | — | | 692 | | — | | — | | 692 | |
Reclassification related to conversion of Morningstar Europe options to Morningstar, Inc. options | | | | — | | — | | 531 | | — | | — | | 531 | |
Stock-based compensation | | | | — | | — | | 7,760 | | — | | — | | 7,760 | |
Balance December 31, 2004 | | 38,446,614 | | 4 | | (3,280 | ) | 148,144 | | (81,725 | ) | 1,238 | | 64,381 | |
Comprehensive income: | | | | | | | | | | | | | | | |
Net income | | | | — | | — | | — | | 31,117 | | — | | 31,117 | |
Reclassification adjustment for realized gains included in net income | | | | — | | — | | — | | — | | (3 | ) | (3 | ) |
Unrealized loss on investments, net of tax of $16 | | | | — | | — | | — | | — | | (20 | ) | (20 | ) |
Foreign currency translation adjustment | | | | — | | — | | — | | — | | (210 | ) | (210 | ) |
Total comprehensive income | | | | — | | — | | — | | 31,117 | | (233 | ) | 30,884 | |
Issuance of common stock related to initial public offering, net of related costs | | 1,141,875 | | — | | — | | 18,108 | | — | | — | | 18,108 | |
Issuance of common stock related to stock option exercises, net | | 696,024 | | — | | — | | 8,221 | | — | | — | | 8,221 | |
Reclassification of stock-based compensation liabilities | | | | — | | — | | 41,589 | | — | | — | | 41,589 | |
Stock-based compensation | | | | — | | — | | 8,085 | | — | | — | | 8,085 | |
Tax benefit derived from stock option exercises | | | | — | | — | | 2,446 | | — | | — | | 2,446 | |
Balance December 31, 2005 | | 40,284,513 | | 4 | | (3,280 | ) | 226,593 | | (50,608 | ) | 1,005 | | 173,714 | |
| | | | | | | | | | | | | | | | | | | | | |
See notes to consolidated financial statements.
75
Morningstar, Inc. and Subsidiaries
Consolidated Statements of Cash Flows
Year ended December 31 (in thousands except per share amounts) | | 2005 | | 2004 | | 2003 | |
Operating activities | | | | | | | |
Net income (loss) | | $ | 31,117 | | $ | 8,809 | | $ | (11,897 | ) |
Adjustments to reconcile net income (loss) to net cash flows from operating activities: | | | | | | | |
Depreciation and amortization | | 8,266 | | 8,225 | | 7,123 | |
Deferred income taxes | | 583 | | 830 | | 2,457 | |
Stock-based compensation | | 10,895 | | 16,723 | | 29,029 | |
Provision for (recovery of) bad debt | | 223 | | (55 | ) | 855 | |
Gain on sale of investment in unconsolidated entity | | — | | (19 | ) | (510 | ) |
Equity in net income of unconsolidated entities | | (1,662 | ) | (843 | ) | (697 | ) |
Foreign exchange (gain) loss | | 146 | | (333 | ) | — | |
(Gain) loss on sale of fixed assets | | 19 | | (73 | ) | — | |
Stock option income tax benefits | | 2,446 | | — | | — | |
Other, net | | (269 | ) | (556 | ) | (325 | ) |
Changes in operating assets and liabilities, net of effect of acquisitions | | | | | | | |
Accounts receivable | | (14,989 | ) | (10,866 | ) | (2,218 | ) |
Other assets | | (1,076 | ) | (2,358 | ) | 36 | |
Accounts payable and accrued liabilities | | 2,167 | | 2,489 | | 3,696 | |
Accrued compensation | | 6,997 | | — | | — | |
Deferred revenue | | 7,364 | | 7,038 | | 4,435 | |
Accrued stock-based compensation | | — | | (303 | ) | (320 | ) |
Income taxes payable | | (2,438 | ) | 3,763 | | — | |
Other liabilities | | (1,344 | ) | 391 | | (1,959 | ) |
Cash provided by operating activities | | 48,445 | | 32,862 | | 29,705 | |
| | | | | | | |
Investing activities | | | | | | | |
Purchases of investments | | (78,798 | ) | (79,126 | ) | (47,200 | ) |
Proceeds from sale of investments | | 77,510 | | 64,180 | | 36,427 | |
Proceeds from sale of investments in unconsolidated entity | | — | | 19 | | 510 | |
Proceeds from sale of fixed assets | | 3 | | 73 | | — | |
Capital expenditures | | (7,451 | ) | (7,730 | ) | (8,607 | ) |
Acquisitions, net of cash acquired | | (8,192 | ) | (210 | ) | (10,801 | ) |
Other, net | | 15 | | 44 | | 37 | |
Cash used for investing activities | | (16,913 | ) | (22,750 | ) | (29,634 | ) |
| | | | | | | |
Financing activities | | | | | | | |
Payments of long-term debt and capital lease obligations | | (18 | ) | (6,561 | ) | (153 | ) |
Proceeds from sale of common stock, primarily stock option exercises | | 7,166 | | 194 | | 127 | |
Proceeds from initial public offering, net | | 18,108 | | — | | — | |
Cash provided by (used for) financing activities | | 25,256 | | (6,367 | ) | (26 | ) |
| | | | | | | |
Effect of exchange rate changes on cash and cash equivalents | | (328 | ) | 317 | | (26 | ) |
Net increase in cash and cash equivalents | | 56,460 | | 4,062 | | 19 | |
Cash and cash equivalents — Beginning of year | | 35,907 | | 31,845 | | 31,826 | |
Cash and cash equivalents — End of year | | $ | 92,367 | | $ | 35,907 | | $ | 31,845 | |
| | | | | | | |
Supplemental disclosures of cash flow information | | | | | | | |
Cash paid for interest | | $ | 29 | | $ | 90 | | $ | 293 | |
Cash paid for income taxes | | $ | 19,527 | | $ | 6,613 | | $ | 802 | |
| | | | | | | |
Supplemental information of non-cash investing and financing activities | | | | | | | |
Unrealized gain (loss) on available for sale investments | | $ | (36 | ) | $ | (166 | ) | $ | 112 | |
Non-cash consideration related to acquisition | | $ | — | | $ | 69 | | $ | — | |
See notes to consolidated financial statements.
76
MORNINGSTAR, INC. AND SUBSIDIARIES
Notes to Consolidated Financial Statements
1. Description of Business
Morningstar, Inc. and its subsidiaries (Morningstar, we, our), is a provider of independent investment research in the United States and in major international markets. We offer an extensive line of Internet, software, and print-based products for individual investors, financial advisors, and institutional clients and provide data on investment offerings worldwide. We also offer asset management services to advisors and institutional clients.
2. Summary of Significant Accounting Policies
Principles of Consolidation. The accompanying consolidated financial statements include the accounts of Morningstar, Inc. and our wholly and majority-owned subsidiaries. The assets, liabilities, and results of operations of subsidiaries in which we have a controlling interest have been consolidated. We account for investments in entities in which we exercise significant influence, but do not control, using the equity method. All significant intercompany accounts and transactions have been eliminated.
Use of Estimates. The preparation of financial statements in conformity with accounting principles generally accepted in the United States requires us to make estimates and assumptions that affect the reported amounts of assets, liabilities, revenues, and expenses during the reporting period. Actual results may differ from these estimates.
Reclassifications. In March 2005, the SEC issued guidance concerning the financial statement presentation of auction-rate securities. Auction-rate securities are long-term variable rate bonds tied to short-term interest rates that are reset through an auction process that occurs approximately every seven to 35 days. Holders of auction-rate securities may liquidate their holdings to prospective buyers by participating in the auctions. Because of their long-term maturity dates and because there is no guarantee that holders of auction-rate securities will be able to liquidate their holdings through the auction process, the SEC stated that auction-rate securities do not qualify as cash equivalents. Accordingly, during 2005, we reclassified our investments in auction-rate securities from cash and cash equivalents to investments in our Consolidated Balance Sheets. The amount of auction-rate securities reclassified from cash and cash equivalents to investments as of December 31, 2004, December 31, 2003, and December 31, 2002 was $23,586,000, $21,664,000, and $12,511,000, respectively. We also made related adjustments to the Consolidated Statements of Cash Flows to reflect the gross purchases and sales of these securities as investing activities. The change in classification had no effect on the amount of total current assets, total assets, net income, income per share, or cash flow from operations as previously reported.
Certain other amounts reported in 2004 and 2003 have been reclassified to conform to the 2005 presentation.
Cash and Cash Equivalents. Cash and cash equivalents consist of cash and money market funds with original maturities of three months or less. We state them at cost, which approximates fair market value.
Investments. We classify certain investments, consisting of certificates of deposit, as held-to-maturity securities, based on our intent and ability to hold these securities to maturity. We record held-to-maturity investments at amortized cost on the Consolidated Balance Sheets. We classify certain other investments, consisting primarily of equity securities, as trading securities, based on our intent to hold the securities for a short period of time and generate profits on short-term differences in price, as well as the requirements of one of our wholly owned subsidiaries, which is a registered broker-dealer. We include realized and unrealized gains and losses associated with these investments in “Other income (expense), net” in the Consolidated Statements of Operations. We classify investments not classified as held-to-maturity or trading securities, which primarily consist of fixed-income securities, as available-for-sale securities. We report unrealized gains and losses for available-for-sale securities as other comprehensive income (loss), net of related income taxes. We record both trading and available-for-sale securities at their fair value on the Consolidated Balance Sheets.
Concentration of Credit Risk. No single customer is large enough to pose a significant credit risk to our operations or financial condition. For the years ended December 31, 2005, 2004, and 2003, no single customer represented 10% or more of our consolidated revenue. If receivables from our customers become delinquent, we begin a collections process. We maintain an allowance for doubtful accounts based on our estimate of the probable losses in accounts receivable.
Property, Equipment, and Depreciation. We state property and equipment at historical cost, net of accumulated depreciation. We depreciate property and equipment primarily using the straight-line method based on the useful life of the asset which ranges from three to seven years. We amortize leasehold improvements over the remaining lease term or their useful lives, whichever is shorter.
Computer Software and Internal Product Development Costs. We capitalize certain costs in accordance with American Institute of Certified Public Accountants Statement of Position No. 98-1, Accounting for the Costs of Computer Software Developed or Obtained for Internal Use, and Statement of Financial Accounting Standards (SFAS) No. 86, Accounting for the Costs of Computer Software to be Sold, Leased, or Otherwise Marketed, and Emerging Issues Task Force (EITF) 00-2, Accounting for Web Site Development Costs. Internal product development costs mainly consist of personnel costs relating to the development of new Web-based products and certain
77
major enhancements of existing products. We amortize these costs on a straight-line basis over the estimated economic life, which is generally three years.
Goodwill. During the years ended December 31, 2005, 2004, and 2003, changes in the carrying amount of our recorded goodwill were primarily the result of business acquisitions. In accordance with SFAS No. 142, Goodwill and Other Intangible Assets, goodwill is not amortized; instead, goodwill is subject to at least an annual test for impairment, or whenever indicators of impairment exist. An impairment would occur if the carrying amount of a reporting unit exceeded the fair value of that reporting unit. Our reporting units are components of our reportable segments. We performed annual impairment reviews as of December 31, 2005, 2004, and 2003 and did not record any impairment losses in these years.
Intangible Assets. We amortize intangible assets using the straight-line method over their economic useful lives, which range from three to 20 years. In accordance with SFAS No. 144, Accounting for the Impairment or Disposal of Long-Lived Assets, we review intangible assets for impairment whenever events or changes in circumstances indicate that the carrying value may not be recoverable. If the value of future undiscounted cash flows is less than the carrying amount of an asset, we record an impairment loss based on the excess of the carrying amount over the fair value of the asset. No impairment losses were recorded in 2005, 2004, or 2003.
Revenue Recognition. We recognize revenue from subscription sales, including print publications, CD-ROM software, and other subscription products, in equal installments over the term of the subscription, generally one year. Deferred revenue represents the portion of subscriptions billed or collected in advance which we expect to recognize in future periods. We recognize revenue from consulting, retirement advice, and other non-subscription products and services when the product or service is delivered or, when applicable, over the service obligation period defined by the terms of the contract.
Advertising Costs. Advertising costs include expenses incurred for various print and Internet ads, search engine fees, and direct mail campaigns. We expense advertising costs as incurred. Advertising expense for the years ended December 31, 2005, 2004, and 2003 totaled $5,862,000, $6,180,000, and $5,639,000, respectively.
Stock-Based Compensation Expense. We measure and record compensation expense related to stock option grants in accordance with the provisions of SFAS No. 123, Accounting for Stock-Based Compensation.
Income (Loss) per Share. We compute and present income (loss) per share in accordance with SFAS No. 128, Earnings per Share. The difference between weighted average shares outstanding and diluted shares outstanding reflects the dilutive effect of stock options in all periods presented.
Income Taxes. We record deferred income taxes for the temporary differences between the carrying amount of assets and liabilities for financial statement purposes and the amounts used for income tax purposes in accordance with SFAS No. 109, Accounting for Income Taxes.
Foreign Currency. We translate the financial statements of non-U.S. subsidiaries to U.S. dollars using the period-end exchange rate for assets and liabilities and an average exchange rate for revenue and expenses. We use the local currency as the functional currency for all of our non-U.S. subsidiaries. We record translation adjustments for non-U.S. subsidiaries as a component of “Accumulated other comprehensive income (loss)” in the Consolidated Statements of Shareholders’ Equity and Comprehensive Income (Loss). We include exchange gains and losses arising from transactions denominated in currencies other than the functional currency in “Other income (expense), net” in the Consolidated Statements of Operations.
3. Initial Public Offering
In May 2005, we completed our initial public offering of 7,612,500 shares of our common stock. These shares commenced trading on May 3, 2005 on the Nasdaq National Market under the symbol “MORN.” All of these shares were sold by affiliates of SOFTBANK Finance Corporation, a wholly owned subsidiary of SOFTBANK Corp. We did not receive any proceeds from the sale of these shares. In addition, we granted the underwriters the right to purchase up to an additional 1,141,875 shares at the initial public offering price to cover over-allotments. In May 2005, the underwriters exercised their over-allotment option in full. We received net proceeds of $18,108,000 based on our initial public offering price of $18.50 per share, after deducting the underwriting discounts and commissions and $2,594,000 of offering expenses.
4. Income (Loss) Per Share
We compute basic income (loss) per share by dividing net income (loss) by the applicable number of weighted average common shares outstanding during the year. Diluted income (loss) per share includes the assumed impact, using the treasury stock method, of converting stock options with an exercise price below the average fair value of our common stock, if the impact of this calculation is more dilutive.
78
The computation of weighted average common shares outstanding for the year ended December 31, 2003 excluded 5,163,000 incremental shares related to employee stock options. These shares were not included in the computation of the loss per share due to their anti-dilutive effect.
The following table reconciles our net income (loss) and the number of shares used in computing basic and diluted income (loss) per share:
(in thousands, except per share amounts) | | 2005 | | 2004 | | 2003 | |
Basic income (loss) per share: | | | | | | | |
Net income (loss) | | $ | 31,117 | | $ | 8,809 | | $ | (11,897 | ) |
Weighted average common shares outstanding | | 39,392 | | 38,418 | | 38,382 | |
Basic income per share | | $ | 0.79 | | $ | 0.23 | | $ | (0.31 | ) |
| | | | | | | |
Diluted income (loss) per share: | | | | | | | |
Net income (loss) | | $ | 31,117 | | $ | 8,809 | | $ | (11,897 | ) |
| | | | | | | |
Weighted average common shares outstanding | | 39,392 | | 38,418 | | 38,382 | |
Net effect of dilutive stock options based on the treasury stock method | | 5,067 | | 3,440 | | — | |
Weighted average common shares outstanding for computing diluted income (loss) per share | | 44,459 | | 41,858 | | 38,382 | |
| | | | | | | |
Diluted income (loss) per share | | $ | 0.70 | | $ | 0.21 | | $ | (0.31 | ) |
5. Segment and Geographical Area Information
We organize our operations based on products and services sold in three primary business segments: Individual, Advisor, and Institutional.
• Individual segment. Our Individual segment provides products and services for individual investors. The largest product in this segment is our U.S.-based Web site, Morningstar.com, which includes both paid Premium Membership service and sales of advertising space. Our Individual segment also includes Morningstar Equity Research, which we distribute through several channels. Investors can access our equity research through our Premium Membership offering on Morningstar.com. In addition, our equity research is currently distributed through six major investment banks to meet the requirements for independent research under the Global Analyst Research Settlement, as well as to several other companies who provide our research to their affiliated financial advisors or to individual investors. We also offer a variety of print publications on stocks and mutual funds, including our monthly newsletters, Morningstar FundInvestor and Morningstar StockInvestor, and our twice-monthly publication, Morningstar Mutual Funds.
• Advisor segment. Our Advisor segment focuses on products and services for financial advisors. Key products in this segment are Morningstar Advisor Workstation and Principia. Advisor Workstation is a Web-based investment planning system that provides financial advisors with a comprehensive set of tools for conducting their core business – including investment research, planning, and presentation tools. Advisor Workstation is available in two editions: the Office Edition for independent financial advisors and the Enterprise Edition for financial advisors affiliated with larger firms. Principia is our CD-ROM-based investment research and planning software for financial planners. In addition, we offer Morningstar Managed Portfolios, a fee-based discretionary asset management service that includes a series of mutual fund and exchange-traded fund portfolios tailored to meet a range of investment time horizons and risk levels.
• Institutional segment. Our Institutional segment focuses on products and services for institutions, including banks, insurance companies, mutual fund companies, brokerage firms, media outlets, and retirement plan providers and sponsors. Key products and services in this segment include Morningstar Direct, a Web-based institutional research platform that provides advanced research and tools on the complete range of securities in Morningstar’s global database; Licensed Data, a set of investment data spanning eight core databases, available through electronic data feeds; Investment Consulting, which focuses on investment monitoring and asset allocation for funds of funds, including mutual funds and variable annuities; Investment Profiles and Guides, which are designed for institutions to use in communicating investment information to individual investors; and Morningstar Retirement Manager, a suite of advice and guidance services for retirement plan participants.
We measure the operating results of these segments based on operating income (loss), including an allocation of corporate costs. We include intersegment revenue and expenses in segment information. We sell services and products between segments at predetermined rates primarily based on cost. The recovery of intersegment cost is shown as “Intersegment revenue.”
79
Our segment accounting policies are the same as those described in Note 2, except for the capitalization and amortization of internal product development costs, stock-based compensation expense, and amortization of intangible assets. We exclude these items from our operating segment results to provide our chief operating decision maker with a better indication of each segment’s ability to generate cash flow. This information is one of the criteria used by our chief operating decision maker in determining how to allocate resources to each segment. We include the capitalization and amortization of internal product development costs, stock-based compensation expense, and amortization of intangible assets, as well as the elimination of intersegment revenue and expense in the Corporate Items and Eliminations category to arrive at the consolidated financial information. Our segment disclosures include the business segment information provided to our chief operating decision maker on a recurring basis, and, therefore, we do not present balance sheet information, including goodwill or other intangibles, by segment.
The following tables show selected segment data for the years ended December 31, 2005, 2004, and 2003:
2005 Segment Data
($000) | | Individual | | Advisor | | Institutional | | Corporate Items
& Eliminations | | Total | |
Revenue: | | | | | | | | | | | |
External customers | | $ | 60,643 | | $ | 72,683 | | $ | 93,788 | | $ | — | | $ | 227,114 | |
Intersegment | | 2,805 | | 6 | | 2,159 | | (4,970 | ) | — | |
Total revenue | | 63,448 | | 72,689 | | 95,947 | | (4,970 | ) | 227,114 | |
Operating expense, excluding depreciation and amortization | | 43,903 | | 53,290 | | 69,140 | | 6,035 | | 172,368 | |
Depreciation and amortization | | 1,172 | | 1,507 | | 2,011 | | 3,576 | | 8,266 | |
Operating income (loss) | | $ | 18,373 | | $ | 17,892 | | $ | 24,796 | | $ | (14,581 | ) | $ | 46,480 | |
| | | | | | | | | | | |
Capital expenditures | | $ | 305 | | $ | 709 | | $ | 1,939 | | $ | 4,498 | | $ | 7,451 | |
| | | | | | | | | | | |
U.S. revenue | | | | | | | | | | $ | 197,672 | |
Non-U.S. revenue | | | | | | | | | | $ | 29,442 | |
| | | | | | | | | | | |
| | | | | | | | | | As of Dec. 31 | |
U.S. long-lived assets | | | | | | | | | | $ | 13,894 | |
Non-U.S. long-lived assets | | | | | | | | | | $ | 3,461 | |
2004 Segment Data
($000) | | Individual | | Advisor | | Institutional | | Corporate Items
& Eliminations | | Total | |
Revenue: | | | | | | | | | | | |
External customers | | $ | 44,478 | | $ | 59,326 | | $ | 75,854 | | $ | — | | $ | 179,658 | |
Intersegment | | 2,518 | | 1,554 | | 2,548 | | (6,620 | ) | — | |
Total revenue | | 46,996 | | 60,880 | | 78,402 | | (6,620 | ) | 179,658 | |
Operating expense, excluding depreciation and amortization | | 38,130 | | 45,311 | | 62,496 | | 7,761 | | 153,698 | |
Depreciation and amortization | | 1,041 | | 1,603 | | 2,239 | | 3,342 | | 8,225 | |
Operating income (loss) | | $ | 7,825 | | $ | 13,966 | | $ | 13,667 | | $ | (17,723 | ) | $ | 17,735 | |
| | | | | | | | | | | |
Capital expenditures | | $ | 100 | | $ | 622 | | $ | 772 | | $ | 6,286 | | $ | 7,730 | |
| | | | | | | | | | | |
U.S. revenue | | | | | | | | | | $ | 154,248 | |
Non-U.S. revenue | | | | | | | | | | $ | 25,410 | |
| | | | | | | | | | | |
| | | | | | | | | | As of Dec. 31 | |
U.S. long-lived assets | | | | | | | | | | $ | 16,016 | |
Non-U.S. long-lived assets | | | | | | | | | | $ | 1,505 | |
80
2003 Segment Data
($000) | | Individual | | Advisor | | Institutional | | Corporate Items
& Eliminations | | Total | |
Revenue: | | | | | | | | | | | |
External customers | | $ | 33,259 | | $ | 48,281 | | $ | 57,956 | | $ | — | | $ | 139,496 | |
Intersegment | | 2,147 | | 880 | | 1,789 | | (4,816 | ) | — | |
Total revenue | | 35,406 | | 49,161 | | 59,745 | | (4,816 | ) | 139,496 | |
Operating expense, excluding depreciation and amortization | | 27,127 | | 37,964 | | 53,276 | | 24,760 | | 143,127 | |
Depreciation and amortization | | 888 | | 1,676 | | 2,309 | | 2,250 | | 7,123 | |
Operating income (loss) | | $ | 7,391 | | $ | 9,521 | | $ | 4,160 | | $ | (31,826 | ) | $ | (10,754 | ) |
| | | | | | | | | | | |
Capital expenditures | | $ | 216 | | $ | 274 | | $ | 638 | | $ | 7,479 | | $ | 8,607 | |
| | | | | | | | | | | |
U.S. revenue | | | | | | | | | | $ | 119,378 | |
Non-U.S. revenue | | | | | | | | | | $ | 20,118 | |
| | | | | | | | | | | |
| | | | | | | | | | As of Dec. 31 | |
U.S. long-lived assets | | | | | | | | | | $ | 15,856 | |
Non-U.S. long-lived assets | | | | | | | | | | $ | 1,744 | |
6. Investments
We classify our investment portfolio, which is primarily invested in fixed-income securities, as follows:
($000) | | Dec. 31, 2005 | | Dec. 31, 2004 | |
Available-for-sale | | $ | 58,761 | | $ | 55,536 | |
Held-to-maturity | | 420 | | 2,850 | |
Trading securities | | 1,642 | | 1,170 | |
Total | | $ | 60,823 | | $ | 59,556 | |
The following table shows the cost, unrealized gains (losses), and fair values related to investments classified as available for sale and held to maturity:
| | Dec. 31, 2005 | | Dec. 31, 2004 | |
($000) | | Cost | | Unrealized
Gain | | Unrealized
Loss | | Fair
Value | | Cost | | Unrealized
Gain | | Unrealized
Loss | | Fair
Value | |
Available-for-sale: | | | | | | | | | | | | | | | | | |
Auction-rate securities | | $ | 16,298 | | $ | — | | $ | — | | $ | 16,298 | | $ | 23,586 | | $ | — | | $ | — | | $ | 23,586 | |
Corporate bonds | | 18,420 | | 2 | | (57 | ) | 18,365 | | 20,483 | | 2 | | (102 | ) | 20,383 | |
Government obligations | | 24,245 | | — | | (147 | ) | 24,098 | | 11,636 | | 1 | | (70 | ) | 11,567 | |
Total | | $ | 58,963 | | $ | 2 | | $ | (204 | ) | $ | 58,761 | | $ | 55,705 | | $ | 3 | | $ | (172 | ) | $ | 55,536 | |
| | | | | | | | | | | | | | | | | |
Held-to-maturity: | | | | | | | | | | | | | | | | | |
Certificate of deposit | | $ | 420 | | $ | — | | $ | — | | $ | 420 | | $ | 2,850 | | $ | — | | $ | — | | $ | 2,850 | |
As of December 31, 2005 and 2004, investments with unrealized losses for greater than a 12-month period were not material to the Consolidated Balance Sheets and were not deemed to have other than temporary declines in value.
The table below shows the cost and estimated fair value of debt and marketable equity securities classified as available-for-sale and held-to-maturity based on their contractual maturities. The expected maturities of certain fixed-income securities may differ from their contractual maturities because some of these holdings have call features that allow the issuers the right to prepay obligations without penalties.
81
| | Dec. 31, 2005 | | | | Dec. 31, 2004 | | | |
($000) | | Cost | | Fair Value | | Cost | | Fair Value | |
Available-for-sale: | | | | | | | | | |
Due in one year or less | | $ | 25,820 | | $ | 25,740 | | $ | 12,134 | | $ | 12,076 | |
Due in one to three years | | 16,845 | | 16,723 | | 19,985 | | 19,874 | |
Due in greater than ten years | | 16,298 | | 16,298 | | 23,586 | | 23,586 | |
Total | | $ | 58,963 | | $ | 58,761 | | $ | 55,705 | | $ | 55,536 | |
| | | | | | | | | |
Held-to-maturity: | | | | | | | | | |
Due in one year or less | | $ | 420 | | $ | 420 | | $ | 2,850 | | $ | 2,850 | |
Securities with contractual maturities of greater than 10 years consist of auction-rate securities. Auction-rate securities are long-term variable rate bonds tied to short-term interest rates that are reset through an auction process that occurs approximately every seven to 35 days. While the contractual maturities are long-term, holders of auction-rate securities may liquidate their holdings to prospective buyers by participating in the auctions.
Net unrealized gains on trading securities included in our Consolidated Statements of Operations were $18,000, $71,000, and $57,000 in 2005, 2004, and 2003, respectively.
The following table shows the net realized gains (losses) arising from sales of our investments recorded in our Consolidated Statements of Operations:
($000) | | Dec. 31, 2005 | | Dec. 31, 2004 | | Dec. 31, 2003 | |
Realized gains | | $ | 36 | | $ | 33 | | $ | 95 | |
Realized losses | | (4 | ) | (2 | ) | (7 | ) |
Realized gains (losses), net | | $ | 32 | | $ | 31 | | $ | 88 | |
7. Acquisitions, Goodwill, and Other Intangible Assets
Variable Annuity Research and Data Service
In January 2005, we acquired Variable Annuity Research and Data Service (VARDS) from Finetre Corporation for $8,192,000 in cash, including costs directly related to the acquisition. The results of VARDS’ operations have been included in our Consolidated Financial Statements beginning in January 2005. VARDS provides research and data on variable annuities and is used by many firms that offer variable annuities. The service is also used by many brokerage firms for research, due diligence, and suitability determination. This acquisition strengthens our investment database and furthers our efforts to provide investors with the information they need to make well-informed decisions when investing in variable annuities
The following table summarizes the allocation of the purchase price to the estimated fair values of the assets acquired and liabilities assumed at the date of the acquisition:
($000) | | | |
Accounts receivable | | $ | 639 | |
Other assets | | 57 | |
Intangible assets | | 6,370 | |
Goodwill | | 3,084 | |
Liabilities, primarily deferred revenue | | (1,958 | ) |
Total purchase price | | $ | 8,192 | |
The acquired intangible assets include $5,700,000 of customer-related assets, consisting primarily of acquired customer contracts; $430,000 of technology-based assets, consisting of a database and developed software; and $240,000 related to supplier relationships. Both the acquired intangible assets and the acquired goodwill are deductible for U.S. income tax purposes.
If the acquisition of VARDS had occurred as of January 1, 2003, revenue, operating income, net income, and basic and diluted income per share would not have been significantly different from the amounts reported in 2004 and 2003.
Morningstar Norway
In February 2004, we purchased the remaining 51% of Morningstar Norway that we did not previously own. The purchase price consisted of $210,000 in cash and $69,000 of other consideration. Prior to this transaction, we accounted for our investment in Morningstar Norway using the equity method.
82
mPower.com, Inc.
In July 2003, we acquired 100% ownership of mPower.com, Inc. (mPower), an investment advisory firm that specialized in serving the large plan sponsor retirement market. The aggregate purchase price was $4,864,000. The results of mPower’s operations have been included in the Consolidated Financial Statements since that date. The acquisition was strategic in nature and gave us immediate entry into the large plan sponsor market. The purchase price was less than the total fair value of the assets acquired; as a result, certain long-term assets were allocated values that were lower than their fair values at the date of acquisition. We allocated the aggregate purchase price to the acquired assets and liabilities based on estimated fair market values as of the date of acquisition.
The following table summarizes the allocation of the purchase price to the estimated fair values of the assets acquired and liabilities assumed at the date of the acquisition:
($000) | | | |
Cash | | $ | 397 | |
Other current assets | | 451 | |
Property, equipment, and capitalized software | | 161 | |
Deferred tax assets | | 4,663 | |
Intangible assets | | 2,003 | |
Liabilities, primarily deferred revenue | | (2,811 | ) |
Total purchase price | | $ | 4,864 | |
Of the $2,003,000 of acquired intangible assets, $871,000 was assigned to a customer list and $1,132,000 was assigned to intellectual property.
The following table shows pro forma consolidated financial information combining our 2003 financial results with mPower’s financial results for the year ended December 31, 2003:
($000) | | Year Ended Dec. 31, 2003
(Unaudited Pro forma) | |
Revenue | | $ | 142,222 | |
Operating loss | | (13,280 | ) |
Net loss | | (14,484 | ) |
| | | |
Basic loss per share | | (0.38 | ) |
Diluted loss per share | | (0.38 | ) |
| | | | |
Morningstar Canada
In January 2003, we purchased the remaining 50% of Morningstar Research Inc. (Morningstar Canada) that we did not previously own for $6,334,000 in cash. The purchase price has been allocated to the acquired assets and liabilities based on their estimated fair values as of the date of acquisition, with the remainder allocated to goodwill.
The following table summarizes the allocation of the purchase price to the estimated fair values of the assets acquired and liabilities assumed at the date of the acquisition:
($000) | | | |
Current assets | | $ | 674 | |
Property, equipment, and capitalized software | | 223 | |
Other assets | | 376 | |
Goodwill | | 8,484 | |
Liabilities | | (3,423 | ) |
Total purchase price | | $ | 6,334 | |
83
Goodwill
The following table shows the changes in our goodwill balances from January 1, 2004 to December 31, 2005:
($000) | | | |
Balance as of January 1, 2004 | | $ | 14,075 | |
Goodwill acquired related to Morningstar Norway | | 248 | |
Other, primarily currency translation adjustment | | 85 | |
Balance as of December 31, 2004 | | $ | 14,408 | |
Goodwill acquired related to VARDS | | 3,084 | |
Other, primarily currency translation adjustment | | 8 | |
Balance as of December 31, 2005 | | $ | 17,500 | |
We did not record any goodwill impairment losses in 2005, 2004, or 2003, respectively.
Other Intangible Assets
The following table summarizes our intangible assets:
| | Dec. 31, 2005 | | Dec. 31, 2004 | |
($000) | | Gross | | Accumulated
Amortization | | Net | | Weighted
Average
Useful Life
(years) | | Gross | | Accumulated
Amortization | | Net | | Weighted
Average
Useful Life
(years) | |
Intellectual property | | $ | 1,132 | | $ | (405 | ) | $ | 727 | | 7 | | $ | 1,132 | | $ | (243 | ) | $ | 889 | | 7 | |
Customer-related assets | | 6,571 | | (597 | ) | 5,974 | | 18 | | 871 | | (187 | ) | 684 | | 7 | |
Supplier relationships | | 240 | | (12 | ) | 228 | | 20 | | — | | — | | — | | — | |
Technology-based assets | | 430 | | (108 | ) | 322 | | 4 | | — | | — | | — | | — | |
Total intangible assets | | $ | 8,373 | | $ | (1,122 | ) | $ | 7,251 | | 16 | | $ | 2,003 | | $ | (430 | ) | $ | 1,573 | | 7 | |
We amortize intangible assets using the straight-line method over their expected economic useful lives. Amortization expense for the years ended December 31, 2005, 2004, and 2003 was $692,000, $287,000, and $143,000, respectively.
We estimate that aggregate amortization expense for intangible assets will be $692,000 in each of the years ending December 31, 2006 and 2007; $635,000 in each of the years ending December 31, 2008 and 2009; and $440,000 in the year ending December 31, 2010.
8. Investments in Unconsolidated Entities
Our investments in unconsolidated entities consist primarily of the following:
Morningstar Japan K.K. In April 1998, we entered into an agreement with Softbank Corporation to form a joint venture, Morningstar Japan K.K. (MJKK), which develops and markets products and services customized for the Japanese market. In June 2000, MJKK became a public company, and its shares are traded on the Osaka Stock Exchange, “Hercules Market,” using the ticker number 4765. Subsequent to MJKK’s initial public offering, the joint venture agreement between us and Softbank Corporation was terminated, but we continued to hold shares of MJKK stock. As of December 31, 2005 and 2004, we owned approximately 35% of MJKK. We account for our investment in MJKK using the equity method. Our investment in MJKK totaled $14,884,000 and $13,852,000 as of December 31, 2005 and 2004, respectively. MJKK’s market value was approximately Japanese Yen 27.8 billion (approximately U.S. $235,625,000) and Japanese Yen 10.7 billion (approximately U.S. $103,400,000) as of December 31, 2005 and 2004, respectively.
Morningstar Korea Ltd. In June 2000, we entered into a joint venture agreement with Shinheung Securities Co., Ltd. and SOFTBANK Finance Corporation to establish a Korean limited liability company named Morningstar Korea Ltd. (Morningstar Korea). Morningstar Korea develops, markets, and sells products and services to assist in the analysis of financial portfolios and provides financial information and services for investments in South Korea. Our ownership interest and profit and loss sharing interest in Morningstar Korea was 40% as of December 31, 2005 and 2004. We account for this investment using the equity method. Our investment totaled $1,129,000 and $767,000 as of December 31, 2005 and 2004, respectively.
84
Other Investments in Unconsolidated Entities. As of December 31, 2005 and 2004, the book value of our other investments in unconsolidated entities totaled $342,000 and $85,000, respectively, and consist primarily of our investments in Morningstar Danmark A/S (Morningstar Denmark) and Morningstar Sweden AB (Morningstar Sweden). In August 2001, we entered into a joint venture agreement with Phosphorus A/S and established Morningstar Denmark, which develops and markets products and services customized for the Danish market. In April 2001, we entered into a joint venture agreement with Stadsporten Citygate AB and established Morningstar Sweden, which develops and markets products and services customized for the Swedish market. Our ownership interest in both Morningstar Denmark and Morningstar Sweden was approximately 25% as of December 31, 2005 and 2004.
The following table shows condensed combined financial information, a portion of which is unaudited, for our investments in unconsolidated entities, and has been updated to reflect consolidated data for MJKK in 2004 and 2003.
($000) | | 2005 | | 2004 | | 2003 | |
Revenue | | $ | 15,069 | | $ | 9,648 | | $ | 8,819 | |
Operating income (loss) | | 2,940 | | 1,143 | | 392 | |
Net income (loss) | | 3,178 | | 656 | | 2 | |
| | | | | | | | | | |
($000) | | Dec. 31, 2005 | | Dec. 31, 2004 | | Dec. 31, 2003 | |
Current assets | | $ | 49,538 | | $ | 50,133 | | $ | 45,041 | |
Total assets | | 55,235 | | 55,294 | | 52,635 | |
Current liabilities | | 2,792 | | 1,536 | | 1,219 | |
Total liabilities | | 3,071 | | 1,536 | | 1,222 | |
| | | | | | | | | | |
9. Property, Equipment, and Capitalized Software
The following table shows our property, equipment, and capitalized software summarized by major category:
($000) | | Dec. 31, 2005 | | Dec. 31, 2004 | |
Computer equipment | | $ | 19,794 | | $ | 18,505 | |
Capitalized software | | 20,400 | | 19,259 | |
Furniture and fixtures | | 2,710 | | 3,479 | |
Leasehold improvements | | 13,565 | | 8,725 | |
Telephone equipment | | 1,277 | | 1,268 | |
Other | | 296 | | 296 | |
Property, equipment, and capitalized software, at cost | | 58,042 | | 51,532 | |
Less accumulated depreciation | | (40,687 | ) | (34,011 | ) |
Property, equipment, and capitalized software, net | | $ | 17,355 | | $ | 17,521 | |
Depreciation and leasehold amortization expense totaled $7,574,000, $7,938,000, and $6,980,000, in 2005, 2004, and 2003, respectively.
10. Long-Term Debt
As of December 31, 2004, we had $18,000 of short-term capital lease obligations recorded on our Consolidated Balance Sheets. The related assets consisted primarily of computer equipment with a remaining net book value of $13,000 at December 31, 2004. As of December 31, 2005, all capital lease obligations have been satisfied.
85
11. Operating Leases
The following table shows our minimum future rental commitments due in each of the next five years and thereafter for all non-cancelable operating leases, consisting primarily of leases for office space:
($000) | | | |
2006 | | $ | 2,511 | |
2007 | | 1,978 | |
2008 | | 3,019 | |
2009 | | 4,314 | |
2010 | | 4,806 | |
Thereafter | | 68,144 | |
Total | | $ | 84,772 | |
In December 2005, we signed an agreement with the Mills Corporation to lease approximately 210,000 square feet of new office space for our corporate headquarters and U.S. operations in Chicago, Illinois. The lease begins in March 2008 and has a term of 15 years. The minimum future lease payments are included in the table above.
Rent expense for 2005, 2004, and 2003 was $5,234,000, $4,155,000, and $3,521,000, respectively, including taxes, insurance, and other operating costs.
Deferred rent in the amount of $808,000 and $848,000 at December 31, 2005 and 2004, respectively, relates to build-out and rent abatement allowances received, which are being amortized on a straight-line basis over the remaining portion of the original term of the lease. Deferred rent is included in Other Current Liabilities and Other Long-Term Liabilities on our Consolidated Balance Sheets, as appropriate.
In 2005, we recorded an asset retirement obligation of $98,000 for costs that will be incurred in 2008 to return office space modified by leasehold improvements to its original condition in accordance with the lease agreement. The asset retirement obligation is recorded in Other Long-Term Liabilities on our Consolidated Balance Sheets.
12. Stock-Based Compensation
Stock Option Plans
Prior to November 2004, we granted options under various plans including the 1993 Stock Option Plan (the 1993 Plan), the 2000 Morningstar Stock Option Plan (the 2000 Plan), and the 2001 Morningstar Stock Option Plan (the 2001 Plan). In general, options granted under the 1993 Plan vest ratably over a five-year period and options granted under the 2000 Plan and the 2001 Plan vest ratably over a four-year period; options under all three plans expire 10 years after the date of grant.
In November 2004, we adopted the 2004 Stock Incentive Plan. The 2004 Stock Incentive Plan amends and restates the 1993 Plan, the 2000 Plan, and the 2001 Plan (collectively, the Prior Plans). Under the 2004 Stock Incentive Plan, we will not grant any additional options under any of the Prior Plans, and any shares subject to an award under any of the Prior Plans that are forfeited, canceled, settled, or otherwise terminated without a distribution of shares, or withheld by us in connection with the exercise of options or in payment of any required income tax withholding, will not be available for awards under the 2004 Stock Incentive Plan. The 2004 Stock Incentive Plan provides for grants of options, stock appreciation rights, restricted stock, restricted stock units, and performance shares. All of our employees are eligible for awards under the 2004 Stock Incentive Plan. Our non-employee directors are also eligible for awards under the 2004 Stock Incentive Plan. Joe Mansueto, our chairman and chief executive officer, does not participate in the 2004 Stock Incentive Plan or the Prior Plans. Options granted under the 2004 Stock Incentive Plan vest ratably over a four-year period and expire 10 years after the date of grant. All of the options granted under the 2004 Stock Incentive Plan, excluding those options granted as a result of the exchange of Morningstar Europe options for Morningstar, Inc. options, as discussed below, have a premium feature in which the exercise price increases over the term of the options at a rate equal to the 10-year Treasury bond yield as of the date of grant. The number of shares available for future stock option grants as of December 31, 2005 and 2004 was 2,989,322 and 4,006,304, respectively.
In February 1999, we entered into an Incentive Stock Option Agreement and a Nonqualified Stock Option Agreement under the 1999 Incentive Stock Option Plan (the 1999 Plan) with an officer of Morningstar. Under these agreements, we granted options to purchase 1,500,000 shares of common stock at an exercise price of $2.77 per share, equal to the fair value at the grant date, to the officer. These options are fully vested and expire in February 2009. On the date of grant, 1,138,560 options were fully exercisable and an additional 36,144 shares became and continue to become exercisable each year from 1999 through 2008. As of December 31, 2005 and 2004, there were 869,174 options remaining to be exercised.
86
Conversion of Morningstar Europe Options
Prior to 2004, Morningstar Europe, a majority-owned subsidiary of Morningstar, granted approximately 1,500,000 options to acquire common stock of Morningstar Europe to certain of its employees. The options vested over a four-year period and none had been exercised as of December 31, 2004. We accounted for these options as equity instruments in accordance with the provisions of SFAS No. 123. In December 2004, the Board of Directors authorized the cancellation of the Morningstar Europe option plan and the exchange of all options outstanding under the Morningstar Europe option plan for 81,189 options granted under the 2004 Stock Incentive Plan. The conversion was accounted for in accordance with SFAS No. 123 and did not result in any incremental stock-based compensation expense.
Accounting for Stock Options
We account for our stock option plans in accordance with SFAS No. 123, Stock-Based Compensation. Subsequent to our initial public offering in May 2005, we account for all outstanding options using the equity method of SFAS No. 123.
Prior to our initial public offering in May 2005, we accounted for options granted under the 1993 Plan and the 1999 Plan using the liability method in accordance with SFAS No. 123, reflecting the terms of the respective stock option plans. Under the terms of the 1993 Plan, at the option holder’s election, the option could be settled in cash, subject to certain conditions, based on the difference in exercise price and the fair value at the date of exercise, or the option could be exercised resulting in issuance of common stock to the employee. In the event that an employee exercised an option and elected net cash settlement, Morningstar had the right to make payment to the employee over a period of time, generally five years. Interest accrued on any unpaid balance due to the employee at a floating rate equal to the yield on the 13-week U.S. Treasury Bill, adjusted on January 1 and July 1 of each year. Under the terms of our 1999 Plan, an officer periodically exercised options that were net settled in cash based on the difference between the exercise price and the fair value of our common stock on the date of exercise.
Under the liability method, we accounted for options as a liability that was measured each period using the fair value per share of our common stock. We recorded changes in the liability resulting from changes in the fair value of our common stock in the Consolidated Statements of Operations. As of December 31, 2004, we recorded the liability using a fair value of $17.50 per share; our Consolidated Balance Sheet reflected $15,874,000 of current liabilities and $23,943,000 of long-term liabilities related to stock options accounted for under the liability method.
As a result of our initial public offering, we are no longer required to settle options under the 1993 Plan and 1999 Plan in cash. Upon our initial public offering, we valued the liability using a fair value of $18.50 per share, equivalent to the fair value of our common stock at the time of our initial public offering. We reclassified stock options accounted for as current liabilities of $16,707,000 and long-term liabilities of $24,882,000 to additional paid-in capital. In addition, because all of the options previously accounted for under the liability method are fully vested, no additional expense will be recorded for these options in future periods
Stock-Based Compensation Expense
The following table summarizes our stock-based compensation expense:
($000) | | 2005 | | 2004 | | 2003 | |
Stock-based compensation expense under the liability method | | $ | 2,810 | | $ | 8,963 | | $ | 17,796 | |
Stock-based compensation expense under the equity method | | 8,085 | | 7,760 | | 11,233 | |
Total stock-based compensation expense | | $ | 10,895 | | $ | 16,723 | | $ | 29,029 | |
Stock Option Fair Value
The weighted average fair value of the options granted in 2005, 2004, and 2003, calculated using a Black-Scholes option-pricing model, was $9.62 per share, $9.39 per share, and $4.08 per share, respectively. We estimated the fair value of these options on the date of grant using the following weighted average assumptions:
| | 2005 | | 2004 | | 2003 | |
Expected life (years) | | 7.0 | | 7.0 | | 5.0 | |
Expected volatility (%) | | 50 | % | 50 | % | 50 | % |
Dividend yield (%) | | — | | — | | — | |
Interest rate (%) | | 4.04 | % | 4.24 | % | 4.19 | % |
Expected exercise price | | $ | 26.20 | | $ | 19.67 | | $ | 8.57 | |
| | | | | | | | | | |
Options granted in 2005 have initial exercise prices that will increase over the term of the options at a rate equal to the 10-year Treasury bond yield as of the date of grant. Options granted in 2004, excluding the options granted as a result of the exchange of
87
Morningstar Europe options for Morningstar, Inc. options, also have exercise prices that will increase over the term of the options at a rate equal to the 10-year Treasury bond yield as of the date of grant. We calculated the expected exercise price included in the option pricing models for these options using an estimated life of seven years and the applicable 10-year Treasury bond rate.
For options granted in 2003, the exercise price of $8.57 remains constant for the life of the options.
Stock Option Activity
The following tables summarize stock option activity for our various stock option grants. The first table includes activity for options granted at an exercise price below the fair value per share of our common stock on the grant date; the second table includes activity for all other option grants. The weighted average exercise prices reflect the exercise price at the date of grant adjusted for the impact of the premium feature, if any.
| | 2005 | | 2004 | | 2003 | |
Options Granted At an Exercise Price
Below the Fair Value Per Share on the
Grant Date | | Underlying
Shares | | Weighted
Average
Exercise
Price | | Underlying
Shares | | Weighted
Average
Exercise
Price | | Underlying
Shares | | Weighted
Average
Exercise
Price | |
Options outstanding—beginning of year | | 3,557,683 | | $ | 10.39 | | 1,936,624 | | $ | 6.78 | | 1,937,174 | | $ | 6.80 | |
Granted | | — | | — | | 1,622,539 | | 14.70 | | 14,750 | | 8.57 | |
Canceled | | (42,658 | ) | 14.84 | | (1,455 | ) | 8.57 | | (15,300 | ) | 10.93 | |
Exercised | | (176,066 | ) | 13.03 | | (25 | ) | 8.57 | | — | | — | |
Options outstanding—end of year | | 3,338,959 | | 10.50 | | 3,557,683 | | 10.39 | | 1,936,624 | | 6.78 | |
| | | | | | | | | | | | | |
Options exercisable | | 2,102,247 | | 8.31 | | 1,760,893 | | 7.07 | | 1,487,329 | | 6.69 | |
| | | | | | | | | | | | | | | | |
| | 2005 | | 2004 | | 2003 | |
All Other Option Grants, Excluding
Activity Shown Above | | Underlying
Shares | | Weighted
Average
Exercise
Price | | Underlying
Shares | | Weighted
Average
Exercise
Price | | Underlying
Shares | | Weighted
Average
Exercise
Price | |
Options outstanding—beginning of year | | 7,394,248 | | $ | 10.67 | | 7,556,364 | | $ | 10.62 | | 6,949,790 | | $ | 10.85 | |
Granted | | 1,077,084 | | 19.64 | | — | | — | | 834,988 | | 8.57 | |
Canceled | | (98,451 | ) | 13.79 | | (80,705 | ) | 11.69 | | (168,810 | ) | 13.20 | |
Exercised | | (577,033 | ) | 10.24 | | (81,411 | ) | 5.45 | | (59,604 | ) | 1.72 | |
Options outstanding—end of year | | 7,795,848 | | 11.96 | | 7,394,248 | | 10.67 | | 7,556,364 | | 10.62 | |
| | | | | | | | | | | | | |
Options exercisable | | 6,193,670 | | 10.79 | | 6,011,684 | | 10.61 | | 4,648,302 | | 9.84 | |
| | | | | | | | | | | | | | | | |
Stock Options Outstanding and Exercisable
The table below shows additional information for options outstanding and options exercisable as of December 31, 2005:
| | Options Outstanding | | | | Options Exercisable | |
Range of Exercise Prices | | Outstanding
Shares | | Weighted
Average
Remaining
Contractual
Life (years) | | Weighted
Average
Exercise Price | | Exercisable
Shares | | Weighted
Average
Exercise Price | |
$ | 2.00 - $2.77 | | 2,353,317 | | 2.62 | | $ | 2.51 | | 2,244,682 | | $ | 2.50 | |
$ | 8.57 - $14.70 | | 6,255,811 | | 5.07 | | 12.55 | | 5,706,290 | | 12.86 | |
$ | 15.38 - $32.25 | | 2,525,679 | | 9.11 | | 17.36 | | 344,945 | | 15.38 | |
$ | 2.00 - $32.25 | | 11,134,807 | | 5.47 | | 11.52 | | 8,295,917 | | 10.16 | |
| | | | | | | | | | | | | | |
88
The table below shows additional information for options outstanding and options exercisable as of December 31, 2004:
| | Options Outstanding | | | Options Exercisable | |
Range of Exercise Prices | | Outstanding
Shares | | Weighted
Average
Remaining
Contractual
Life (years) | | Weighted
Average
Exercise Price | | Exercisable
Shares | | Weighted
Average
Exercise Price | |
$ | 1.72 - $2.77 | | 2,493,506 | | 3.53 | | $ | 2.49 | | 2,343,420 | | $ | 2.48 | |
$ | 8.57 - $14.70 | | 8,458,425 | | 6.84 | | 12.95 | | 5,429,157 | | 12.97 | |
$ | 1.72 - $14.70 | | 10,951,931 | | 6.09 | | 10.57 | | 7,772,577 | | 9.81 | |
| | | | | | | | | | | | | | |
13. Related Party Transactions
Under the 1993 Plan, and prior to our initial public offering in May 2005, employees were able to exercise options and elect net cash settlement based on the difference between the exercise price and the fair value of our common stock. If an employee exercised an option and elected net cash settlement, we had the right to make payments over a period of five years. Interest accrued on any unpaid balance due to the employee at a floating rate equal to the yield on the 13-week U.S. Treasury bill, adjusted on January 1 and July 1 of each year. The liability remaining for these transactions as of December 31, 2005 will be paid in the first quarter of 2006.
In years prior to 2004, certain employees, including an officer of Morningstar, sold common stock back to Morningstar. We had the right to make payments to employees for the purchase price of these shares over a five-year period. All of the remaining payments related to these common stock repurchases were completed during 2005.
In 1989, under our 1989 Nonqualified Stock Option Plan (the 1989 Plan), we granted options to purchase 1,500,000 shares of common stock at an exercise price of $0.075 per share, equal to the fair value at date of issue, to an officer of Morningstar. These options were not exercised and expired in February 1999. In February 1999, in conjunction with the expiration of options granted under the 1989 Plan, we entered into a Deferred Compensation Agreement (the Agreement) with this officer. Under the terms of the Agreement, on any date that the officer exercises the right to purchase shares under the 1999 Plan, we shall pay to the officer $2.69 per share in the form of cash or, at our election, shares of common stock. If on the date of purchase the fair value of Morningstar’s stock is below $2.77 per share, the amount paid per share will be reduced based on the terms of the Agreement. Our obligation to pay deferred compensation will not be increased by any imputed interest or earnings amount.
The following table shows the liabilities recorded for stock options exercised, common stock repurchases, and the Agreement:
($000) | | Dec. 31, 2005 | | Dec. 31, 2004 | |
Liability for stock options exercised | | $ | 45 | | $ | 1,048 | |
Liability for common stock repurchases | | — | | 394 | |
Liability for the Agreement | | 2,340 | | 2,340 | |
Total | | $ | 2,385 | | $ | 3,782 | |
89
We have included the liabilities for stock options exercised, common stock repurchases, and the Agreement in our Consolidated Balance Sheets as follows:
($000) | | Dec. 31, 2005 | | Dec. 31, 2004 | |
Other current liabilities | | $ | 2,190 | | $ | 3,337 | |
Other non-current liabilities | | 195 | | 445 | |
Total | | $ | 2,385 | | $ | 3,782 | |
Interest expense incurred on the liabilities for stock options exercised and common stock repurchases was $14,000, $27,000, and $36,000 for the years ended December 31, 2005, 2004, and 2003, respectively.
Between December 1995 and December 2003, a corporation wholly owned by Joe Mansueto, our chairman and chief executive officer, provided sales and other services for us. We agreed to pay an amount equal to the total costs incurred by the corporation in providing these services, consisting solely of compensation-related expenses for the corporation’s employees (which did not include Joe Mansueto), plus 5% of such costs. In 2003, we recorded expense for these services of $2,915,000, of which $139,000 represented the amount paid in excess of the corporation’s actual costs. This arrangement was discontinued on December 31, 2003 at which time all employees of the corporation were transferred to Morningstar. As of December 31, 2005 and 2004, no liabilities remain related to this arrangement.
In March 2004, we repaid a note payable of $6,500,000 related to borrowings from Joe Mansueto, our chairman and chief executive officer. The repayment is included in our Consolidated Statement of Cash Flows for the year ended December 31, 2004.
14. Defined Contribution Profit-Sharing Plan
We sponsor a defined contribution 401(k) plan, which allows our U.S.-based employees to voluntarily contribute pre-tax dollars up to a maximum amount allowable by the U.S. Internal Revenue Service. We contribute an amount equal to the employee’s contributions, up to 7% of the employee’s salary. Our matching contributions were $3,717,000, $3,221,000, and $2,324,000, respectively, for the years ended December 31, 2005, 2004, and 2003, respectively.
15. Non-Operating Income
The following table presents the components of net non-operating income:
($000) | | 2005 | | 2004 | | 2003 | |
Gain on sale of investment in unconsolidated entity | | $ | — | | $ | 19 | | $ | 510 | |
Interest income, net | | 3,078 | | 1,211 | | 279 | |
Other income (expense), net | | 121 | | 575 | | 321 | |
Non-operating income, net | | $ | 3,199 | | $ | 1,805 | | $ | 1,110 | |
Interest income, net primarily reflects interest from our investment portfolio. Other income (expense), net primarily represents royalty income from Morningstar Japan K.K. and Morningstar Denmark, unrealized and realized gains and losses from our investment portfolio, and foreign currency exchange gains and losses arising in the ordinary course of business related to our international operations.
In March 2000, we entered into a stock purchase agreement with Techfi Corporation (Techfi), a provider of portfolio management and accounting software, training, and support to investment advisors and financial planners. In June 2002, Techfi Corporation and Advent Software, Inc. entered into an Agreement and Plan of Merger, whereby all of the issued and outstanding shares of Techfi common stock and vested options were converted into the right to receive cash. Our share of the total proceeds was $4,838,000, resulting in a gain of $3,398,000 in 2002. In 2004 and 2003, $19,000 and $510,000, respectively, was released from escrow and recorded as an additional gain. The gains recorded in 2004 and 2003 are included as “Gain on sale of investment in unconsolidated entity,” in the Consolidated Statements of Operations.
90
16. Income Taxes
The following table shows our effective income tax expense rate:
($000) | | 2005 | | 2004 | | 2003 | |
Income (loss) before income taxes and equity in net income of unconsolidated entities | | $ | 49,679 | | $ | 19,540 | | $ | (9,644 | ) |
Equity in net income of unconsolidated entities | | 1,662 | | 843 | | 697 | |
Total | | $ | 51,341 | | $ | 20,383 | | $ | (8,947 | ) |
Income tax expense | | $ | 20,224 | | $ | 11,574 | | $ | 2,950 | |
Effective income tax expense rate | | 39.4 | % | 56.8 | % | 33.0 | % |
The following table provides our income (loss) before income taxes and equity in net income of unconsolidated entities generated by our U.S. and non-U.S. operations:
($000) | | 2005 | | 2004 | | 2003 | |
U.S. | | $ | 48,580 | | $ | 22,178 | | $ | (5,311 | ) |
Non-U.S. | | 1,099 | | (2,638 | ) | (4,333 | ) |
Income (loss) before income taxes and equity in net income of unconsolidated entities | | $ | 49,679 | | $ | 19,540 | | $ | (9,644 | ) |
The following table reconciles our income tax expense (benefit) at the U.S. federal income tax rate of 35% to income tax expense (benefit) as recorded:
($000, except percentages) | | 2005 $000 | | % | | 2004 $000 | | % | | 2003 $000 | | % | |
Income tax expense (benefit) at U.S. federal rate | | $ 17,969 | | 35.0 | % | $ 7,134 | | 35.0 | % | $ (3,132 | ) | (35.0 | )% |
State income taxes – net of federal income tax effect | | 2,419 | | 4.7 | | 1,670 | | 8.2 | | 342 | | 3.8 | |
Impact of equity in net (income) losses of unconsolidated entities | | (494 | ) | (0.9 | ) | (295 | ) | (1.4 | ) | (244 | ) | (2.7 | ) |
Stock option activity | | 1,716 | | 3.3 | | 2,351 | | 11.5 | | 4,507 | | 50.3 | |
Disqualifying dispositions on incentive stock options | | (441 | ) | (0.9 | ) | (78 | ) | (0.4 | ) | (102 | ) | (1.1 | ) |
Difference between U.S. federal statutory and foreign tax rates | | 115 | | 0.2 | | 366 | | 1.8 | | 1,520 | | 16.9 | |
Research and development deduction | | (588 | ) | (1.1 | ) | — | | — | | — | | — | |
Other – net | | (472 | ) | (0.9 | ) | 426 | | 2.1 | | 59 | | 0.8 | |
Total income tax expense | | $ | 20,224 | | 39.4 | % | $ | 11,574 | | 56.8 | % | $ | 2,950 | | 33.0 | % |
| | | | | | | | | | | | | | | | |
Our effective income tax rate is influenced by three primary factors: incentive stock options; the reported income or loss of our non-U.S. entities and our evaluation of the realizability of their net operating losses; and the impact of specific tax planning strategies.
In 2005, our effective income tax expense rate decreased compared with prior years, primarily due to a reduction in the tax impact related to incentive stock options. For incentive stock options, we record stock-based compensation expense but we do not record a corresponding tax benefit. This has the impact of increasing our effective income tax rate above the U.S. federal rate of 35%. The amount of incentive stock option expense recorded in 2005 was lower than the amounts recorded in 2004 and 2003, reflecting the fact that, subsequent to our initial public offering, incentive stock options are no longer accounted for under the liability method, and because they are fully vested, no stock-based compensation expense was recorded for these options in the last nine months of 2005. Our 2005 effective tax rate also reflects an increase in the number of disqualifying dispositions related to incentive stock options. A disqualifying disposition occurs when the option holder sells shares within one year of exercising an incentive stock option. We receive a tax benefit in the period that the disqualifying disposition occurs.
Our effective income tax expense rate also reflects the fact that we are not recording an income tax benefit related to losses recorded by certain of our non-U.S. operations. The foreign net operating losses may become deductible in certain international tax jurisdictions to the extent these international operations become profitable. In the year the non-U.S. entity records a loss, we do not record a corresponding tax benefit, thus increasing our effective tax rate. For each of our operations, we evaluate whether it is more likely than not that the tax benefits related to net operating losses will be realized. As part of this evaluation, we consider evidence such as tax planning strategies, historical operating results, forecasted taxable income, and recent financial performance.
91
In the second quarter of 2005, we recorded a deferred income tax benefit of $668,000 related to research and development expenses due to a change in U.S. income tax regulations, which resulted in a one-time reduction of our effective income tax expense rate.
Income tax expense consists of the following:
($000) | | 2005 | | 2004 | | 2003 | |
Federal – deferred | | $ | 411 | | $ | 1,043 | | $ | 2,047 | |
Federal – current | | 15,625 | | 8,652 | | 353 | |
State – deferred | | 92 | | 352 | | 410 | |
State – current | | 3,515 | | 2,084 | | 137 | |
Non-U.S. – deferred | | 80 | | (565 | ) | — | |
Non-U.S. – current | | 501 | | 8 | | 3 | |
Income tax expense | | $ | 20,224 | | $ | 11,574 | | $ | 2,950 | |
92
We recognize deferred income taxes for the temporary differences between the carrying amount of assets and liabilities for financial statement purposes and their tax bases. The tax effects of the temporary differences that give rise to the deferred income tax assets and liabilities are as follows:
| | Dec. 31, 2005 | | Dec. 31, 2004 | |
| | | | | |
($000) | | Current
Asset | | Current
Liability | | Non-current
Asset | | Non-current
Liability | | Current
Asset | | Current
Liability | | Non-current
Asset | | Non-current
Liability | |
Net operating loss carryforwards – U.S. | | $ | — | | $ | — | | $ | 1,614 | | $ | — | | $ | — | | $ | — | | $ | 1,676 | | $ | — | |
Net operating loss carryforwards – non-U.S., net of valuation reserve | | 143 | | — | | — | | — | | 448 | | — | | — | | — | |
Stock-based compensation | | — | | — | | 23,633 | | — | | — | | — | | 22,617 | | — | |
Deferred revenue | | — | | (847 | ) | — | | — | | — | | — | | — | | — | |
Property, equipment, and capitalized software | | — | | — | | 1,050 | | — | | — | | — | | 575 | | — | |
Deferred rent | | — | | — | | 190 | | — | | — | | — | | 331 | | — | |
Allowance for doubtful accounts | | 167 | | — | | — | | — | | 92 | | — | | — | | — | |
Prepaid expenses | | — | | (1,133 | ) | — | | — | | — | | (1,349 | ) | — | | — | |
Deferred royalty revenue | | — | | — | | 586 | | — | | — | | — | | 609 | | — | |
Accrued liabilities | | 891 | | — | | 1,700 | | — | | 3,225 | | — | | 1,457 | | — | |
Foreign exchange gains | | — | | — | | — | | (6 | ) | — | | — | | — | | (160 | ) |
Alternative Minimum Tax Credit | | — | | — | | 294 | | — | | — | | — | | — | | — | |
Research and development credit | | — | | — | | 668 | | — | | — | | — | | — | | — | |
Unrealized loss on available-for-sale securities | | — | | (54 | ) | — | | — | | — | | (43 | ) | — | | — | |
| | $ | 1,201 | | $ | (2,034 | ) | $ | 29,735 | | $ | (6 | ) | $ | 3,765 | | $ | (1,392 | ) | $ | 27,265 | | $ | (160 | ) |
A portion of the net operating losses (NOLs) generated by mPower in the years prior to July 1, 2003 (the date of acquisition) is available to Morningstar. On July 1, 2003, mPower had $121,430,000 of NOLs. Because of limitations on the use of the NOLs imposed by the U.S. Internal Revenue Code, our use of the NOLs is limited to approximately $224,000 per year. On the date of acquisition, we recorded a valuation allowance of $116,932,000 representing a portion of these NOLs to reflect the likelihood that the benefit of the NOLs will not be realized. In 2003, we used $112,000 of these NOLs and in 2004 and 2005 we used $224,000 of these NOLs in each year. The remaining U.S. NOL carryforward as of December 31, 2005 of $3,938,000, net of the valuation allowance, will expire in 2022.
In addition, we have NOL carryforwards of $26,319,000 related to our non-U.S. operations. Of these NOLs, $6,512,000 will begin to expire in 2008 through 2020 and $19,807,000 have no expiration date. Due to the historical operating losses of the non-U.S. operations that generated these NOLs, we have recorded a valuation allowance against all but $396,000 of these NOLs, reflecting the likelihood that the benefit of the NOLs will not be realized.
We establish reserves at the time that we determine that it is more likely than not that we will need to pay additional taxes related to certain matters. We adjust these reserves, including any impact of the related interest and penalties, in light of changing facts and circumstances such as the progress of a tax audit. A number of years may elapse before a particular matter for which we have established a reserve is audited and finally resolved. The number of years with open tax audits varies depending on the tax jurisdiction. While it is often difficult to predict the final outcome or the timing of resolution of any particular tax matter, we record a reserve when we determine the likelihood of loss is more likely than not. These liabilities are recorded as income taxes payable in our Consolidated Balance Sheets and are not material to our Consolidated Balance Sheets. Settlement of any particular issue would
93
usually require the use of cash. Favorable resolutions of tax matters for which we have previously established reserves are recognized as a reduction to our income tax expense when the amounts involved become known.
17. Contingencies
Morningstar Australia
In 2001, Mr. Graham Rich, the then managing director and chief executive officer of Morningstar Research Pty Limited (Morningstar Australia), and one of two companies controlled by Mr. Rich, filed a suit in the Supreme Court of New South Wales, Australia against Morningstar and certain of its officers and nominee directors on the board of Morningstar Australia. Mr. Rich also was a beneficial owner of shares in Morningstar Australia. Mr. Rich and his company originally sought an injunction which, if granted, would have precluded Morningstar Australia from terminating the services of Mr. Rich and from issuing additional shares to Morningstar in exchange for the provision of further funding by Morningstar to Morningstar Australia. Further, Mr. Rich and his company sought an order that a provisional liquidator be appointed for Morningstar Australia. The court rejected this injunction application, observing that Morningstar Australia would be insolvent without financial backing from Morningstar. The application for the appointment of a provisional liquidator also failed. The services of Mr. Rich were terminated in November 2001. Mr. Rich and his company were ordered to pay Morningstar’s costs of the injunction proceedings.
Mr. Rich and the two companies noted above have additional pending claims, alleging, among other things, breaches by Morningstar of contracts and statutory and general law duties, misleading, deceptive, and unconscionable conduct by Morningstar, oppression by Morningstar and its nominee directors, claims under the Industrial Relations Act of New South Wales, breaches of directors’ duties by Morningstar’s nominee directors, and conflict of interest. The claims seek various forms of relief, including monetary damages in the amount of Australian $25,000,000, the setting aside of transactions which resulted in Morningstar obtaining control of Morningstar Australia, and an order either setting aside Morningstar’s acquisition of the shares formerly beneficially owned by Mr. Rich and his companies or determining a different price for this acquisition. In the alternative, Mr. Rich and his companies seek an order that they be entitled to purchase the shares in Morningstar Australia at a price to be determined by the court or book value (as defined in the shareholders agreement of Morningstar Australia). Morningstar has denied the claims and filed counter-claims against Mr. Rich and certain of his companies, alleging breaches of statutory, general law, and contractual duties.
In July 2004, the court decided Morningstar’s application for security for its potential additional costs in the litigation by ordering the two companies controlled by Mr. Rich to provide approximately Australian $925,000 to the court as security for these potential costs. Morningstar will be entitled to be paid costs only if the court makes a determination to that effect. The court stayed the proceedings pending its receipt of the security and indicated that it would entertain an application by Morningstar for additional security at a later time in the proceedings.
In May 2005, Mr. Rich obtained conditional leave of the court to begin a proceeding in the name of Morningstar Australia against Morningstar and its nominee directors. The leave was, however, subject to the following conditions: (i) Mr. Rich must pay and bear, and indemnify Morningstar Australia against, all costs, charges, and expenses of and incidental to the bringing and continuation of the proceeding (except as the court may otherwise direct or allow) and may not seek contribution or indemnity from Morningstar Australia for any of these costs, charges, or expenses; (ii) Morningstar Australia, or Mr. Rich on its behalf, together with the two companies controlled by Mr. Rich must provide to the court, as security for Morningstar’s costs, approximately Australian $925,000 as described in the preceding paragraph; and (iii) approximately Australian $100,000 in costs owed by Mr. Rich and one of his companies to Morningstar in respect of the 2001 injunction proceedings must also be paid to Morningstar.
In July 2005, Mr. Rich provided the indemnity and he and his companies paid Morningstar the costs in respect of the 2001 injunction proceedings in the amount of approximately Australian $116,000. Mr. Rich and his companies have satisfied the obligation to provide the court with security for Morningstar’s potential costs by arranging for two bank guarantees, one, as of July 12, 2005, in the amount of Australian $350,000, and a second, as of January 31, 2006, in the amount of Australian $300,000. Security for approximately Australian $275,000 is due to the court on June 30, 2006.
On September 20, 2005, Mr. Rich and his companies filed a Second Further Amended Statement of Claim, consolidating the claims. Morningstar filed a Defence to that pleading and an Amended Cross-Claim against Mr. Rich, both his companies, and a third Australian company controlled by Mr. Rich.
The parties have discussed settling the claims but have been unable to reach an agreement. In the fourth quarter of 2003, Morningstar offered to settle all claims for Australian $1,250,000, which then approximated U.S. $942,000, and, in accordance with SFAS No. 5, Accounting for Contingencies (SFAS No. 5), Morningstar recorded a reserve in this amount. In December 2005, we increased our offer to settle all claims to approximately Australian $2,500,000, which approximates U.S. $1,800,000, and, in accordance with SFAS No. 5, have a reserve recorded for this amount. While Morningstar is vigorously contesting the claims against it, we cannot predict the outcome of the proceeding.
94
Securities and Exchange Commission “Wells Notice”
The staff of the Securities and Exchange Commission (SEC) conducted an investigation related to incorrect total return data that Morningstar published with respect to a single mutual fund, the Rock Canyon Top Flight Fund, that overstated the fund’s returns. In May 2004, Morningstar received a “Wells Notice” from the staff of the Division of Enforcement of the SEC indicating that it intended to recommend that the SEC take legal action against Morningstar alleging that it violated Section 17(a) of the Securities Act of 1933 and Section 10(b) of the Securities Exchange Act of 1934 and Rule 10(b)-5 promulgated thereunder. On February 7, 2006, the SEC’s Division of Enforcement informed Morningstar that it had decided not to proceed with an action against Morningstar.
Morningstar Associates, LLC Subpoenas from New York Attorney General’s Office, Securities and Exchange Commission, and Department of Labor
In December 2004, Morningstar Associates, LLC, a wholly owned subsidiary of Morningstar, Inc., received a request in the form of a subpoena from the New York Attorney General’s office, seeking information and documents from Morningstar Associates related to an investigation the New York Attorney General’s office is conducting. While the subpoena is very broad, it specifically asks for information and documents about the investment consulting services Morningstar Associates offers to retirement plan providers, including fund lineup recommendations for retirement plan sponsors. On December 16, 2004, shortly after the New York Attorney General’s office issued the subpoena, the SEC notified Morningstar Associates and Morningstar Investment Services, Inc. that it had begun an examination. In February 2005, the SEC issued a request to Morningstar Associates for the voluntary production of documents. The request is similar in scope to the New York Attorney General’s subpoena. In May 2005, Morningstar Associates received a request in the form of a subpoena from the United States Department of Labor, seeking information and documents from Morningstar Associates related to an investigation the Department of Labor is conducting. While the Department of Labor subpoena is very broad, it is substantially similar in scope to the New York Attorney General subpoena and the SEC request. In July 2005, the SEC issued a subpoena to Morningstar Associates. The subpoena is virtually identical to the SEC’s February 2005 request. We have been fully cooperating with the New York Attorney General’s office, the SEC, and the Department of Labor. Although we believe the focus of these investigations is on Morningstar Associates, information and documents pertaining to Morningstar, Inc. and Morningstar Investment Services have also been requested. We cannot predict the scope, timing, or outcome of these matters, which may include the institution of administrative, civil injunctive, or criminal proceedings, the imposition of fines and penalties, and other remedies and sanctions, any of which could lead to an adverse impact on our stock price, the inability to attract or retain key employees, and the loss of customers. We also cannot predict what impact, if any, these matters may have on our business, operating results, or financial condition.
In addition to these proceedings, we are involved in legal proceedings and litigation that have arisen in the normal course of our business. Although the outcome of a particular proceeding can never be predicted, we do not believe that the result of any of these matters will have a material adverse effect on our business, operating results, or financial condition.
18. Subsequent Event
In March 2006, we acquired Ibbotson Associates, a privately held firm that specializes in asset allocation research and services, for $83 million in cash, subject to adjustments for working capital and other items. This acquisition fits several of Morningstar’s growth strategies and broadens our reach in the areas of investment consulting, managed retirement accounts, and institutional and advisor software. Related to this acquisition, we anticipate realizing approximately $10 million in cash tax benefits during 2006 related to payment for the cancellation of Ibbotson’s stock options.
19. Recently Issued Accounting Pronouncements
In December 2004, the Financial Accounting Standards Board (FASB) issued SFAS No. 123 (Revised 2004), Share-Based Payment (SFAS No. 123 (R)), which requires all companies to measure compensation cost for all share-based payments (including employee stock options) at fair value. In April 2005, the SEC announced the adoption of a rule that defers the required effective date of SFAS No. 123 (R) until the beginning of the first fiscal year beginning after June 15, 2005, instead of at the beginning of the first quarter after June 15, 2005 (as prescribed originally by SFAS No. 123 (R)). Therefore, we will adopt the provisions of SFAS No. 123 (R) in the first quarter of 2006; we will adopt SFAS 123 (R) prospectively.
We currently measure and record compensation expense related to stock option grants in accordance with the provisions of SFAS No. 123, Accounting for Stock-Based Compensation. We use a Black-Scholes model to estimate the fair value of stock options granted to employees and expect to continue to use this acceptable option valuation model upon the adoption of SFAS No. 123 (R). We currently account for forfeitures of stock options as they occur. SFAS No. 123 (R) eliminates this alternative and requires us to estimate expected forfeitures at the grant date and recognize compensation cost only for those awards expected to vest. Accordingly, in the first quarter of 2006, we will record a cumulative effect of accounting change, net of tax, of approximately $260,000 to reverse the impact of stock-based compensation expense recorded in prior years related to outstanding stock options that we estimate will not vest. Other than this cumulative effect of accounting change, we do not anticipate that adoption of SFAS No. 123 (R) will have a material impact on our Consolidated Statements of Operations or our Consolidated Balance Sheets. Concerning our Consolidated Statements of Cash Flows, SFAS No. 123 (R) requires that the benefits of tax deductions in excess of recognized compensation expense be reported as a financing cash flow, rather than as an operating cash flow.
95
This requirement will reduce net operating cash flows and increase net financing cash flows in periods after adoption. While we cannot estimate what those amounts will be in the future because they depend on employee stock option exercises and other factors, the amount of operating cash flows recognized in 2005 for these excess tax deductions was $2,451,000.
In March 2005, the FASB issued FASB Interpretation (FIN) No. 47, Accounting for Conditional Asset Retirement Obligations, an Interpretation of FASB Statement No. 143. A conditional asset retirement obligation refers to a legal obligation to retire assets where the timing and/or method of settlement are conditioned on future events. FIN No. 47 requires an entity to recognize a liability for the fair value of a conditional asset retirement obligation when incurred if the liability’s fair value can be reasonably estimated. FIN No. 47 is effective for companies no later than the end of the first fiscal year ending after December 15, 2005. The adoption of FIN No. 47 did not have a material impact on our results of operations, financial position, or cash flows.
In May 2005, the FASB issued SFAS No. 154, Accounting Changes and Error Corrections – replacement of APB Opinion No. 20 and FASB Statement No. 3. SFAS No. 154 changes the accounting for and reporting of a change in accounting principle by requiring retrospective application to prior periods’ financial statements of changes in accounting principle unless impracticable. SFAS No. 154 is effective for accounting changes and corrections of errors made in fiscal years beginning after December 15, 2005. Companies are permitted to adopt the standard earlier than the required date for accounting changes and corrections of errors made in fiscal years beginning after the date that SFAS No. 154 was issued. We do not expect the adoption of SFAS No. 154 will have a material impact on our results of operations, financial position, or cash flows.
96
Item 9. Changes in and Disagreements with Accountants on Accounting and Financial Disclosure
None.
Item 9A. Controls and Procedures
(a) Evaluation and Disclosure Controls and Procedures
Disclosure controls and procedures are designed to reasonably assure that information required to be disclosed in the reports filed or submitted under the Exchange Act is recorded, processed, summarized, and reported within the time periods specified in the SEC’s rules and forms. Disclosure controls and procedures include, without limitation, controls and procedures designed to reasonably assure that information required to be disclosed in the reports filed under the Exchange Act is accumulated and communicated to management, including the chief executive officer and the chief financial officer, as appropriate, to allow timely decisions regarding required disclosure.
We carried out an evaluation, under the supervision and with the participation of our management, including our chief executive officer and chief financial officer, of the effectiveness of the design and operation of our disclosure controls and procedures as of December 31, 2005. Based upon that evaluation, our chief executive officer and chief financial officer concluded that our disclosure controls and procedures are effective to provide reasonable assurance that information required to be disclosed in the reports we file or submit under the Exchange Act is recorded, processed, summarized, and reported as and when required.
(b) Changes in Internal Controls Over Financial Reporting
There were no changes in our internal controls over financial reporting during our fiscal quarter ended December 31, 2005 that have materially affected, or are reasonably likely to materially affect, our internal control over financial reporting.
Item 9B. Other Information
There is no information that was required to be disclosed in a report on Form 8-K during the fourth quarter of the year covered by this Annual Report on Form 10-K that was not reported.
Part III
Item 10. Directors and Executive Officers of the Registrant
The information contained under the headings “Proposal 1 – Election of Directors,” “Board of Directors and Corporate Governance – Independent Directors,” and “Section 16(a) Beneficial Ownership Reporting Compliance” in the definitive proxy statement for our 2006 Annual Meeting of Shareholders (the Proxy Statement) and the information contained under the heading “Executive Officers” in Part I of this report is incorporated herein by reference.
We have adopted a code of ethics and a code of ethics for financial managers and executive officers, each of which is posted in the Investor Relations section on our Web site at corporate.morningstar.com. We intend to include on our Web site any amendments to, or waivers from, a provision of the code of ethics that applies to our principal executive officer, principal financial officer, principal accounting officer or controller that relates to any element of the code of ethics definition contained in Item 406(b) of SEC Regulation S-K. Shareholders may request a free copy of these documents by sending an e-mail to investors@morningstar.com.
97
Item 11. Executive Compensation
The information contained under the headings “Board of Directors and Corporate Governance – Directors’ Compensation,” “Executive Compensation,” and “Certain Relationships and Related Party Transactions – Deferred Compensation Agreement with Don Phillips” is incorporated herein by reference.
Item 12. Security Ownership of Certain Beneficial Owners and Management and Related Stockholder Matters
The information contained under the headings “Security Ownership of Certain Beneficial Owners and Management” and “Equity Compensation Plan Information” in the Proxy Statement is incorporated herein by reference.
Item 13. Certain Relationships and Related Transactions
The information contained under the heading “Certain Relationships and Related Party Transactions” in the Proxy Statement is incorporated herein by reference.
Item 14. Principal Accountants Fee and Services
The information contained under the headings “Audit Committee Report” and “Principal Accounting Firm Fees” in the Proxy Statement is incorporated herein by reference.
Part IV
Item 15. Exhibits and Financial Statement Schedules
(a)
1. Consolidated Financial Statements
The following documents are filed as part of this Annual Report on Form 10-K:
Report of Deloitte & Touche LLP, Independent Registered Public Accounting Firm | | 72 |
| | |
Financial Statements: | | |
Consolidated Balance Sheets | | 73 |
Consolidated Statements of Operations | | 74 |
Consolidated Statements of Shareholders’ Equity and Comprehensive Income (Loss) | | 75 |
Consolidated Statements of Cash Flows | | 76 |
98
REPORT OF INDEPENDENT REGISTERED PUBLIC ACCOUNTING FIRM
To the Board of Directors and Shareholders of Morningstar, Inc.
Chicago, Illinois
We have audited the consolidated financial statements of Morningstar, Inc. and subsidiaries (the “Company”) as of December 31, 2005 and 2004, and for each of the three years in the period ended December 31, 2005, and have issued our report thereon dated March 3, 2006. Such report is included elsewhere in this Annual Report on Form 10-K. Our audits also included the consolidated financial statement schedule of the Company listed in Item 15. This financial statement schedule is the responsibility of the Company’s management. Our responsibility is to express an opinion based on our audits. In our opinion, such consolidated financial statement schedule, when considered in relation to the basic consolidated financial statements taken as a whole, presents fairly, in all material respects, the information set forth therein.
/s/ Deloitte & Touche LLP | |
Deloitte & Touche LLP |
Chicago, Illinois |
March 3, 2006 |
2. Financial Statement Schedules
The following financial statement schedule is filed as part of this Annual Report on Form 10-K:
Schedule II: Valuation and Qualifying Accounts
All other schedules have been omitted as they are not required, not applicable, or the required information is otherwise included.
Schedule II Morningstar, Inc. and Subsidiaries Valuation and Qualifying Accounts
($000) | | Balance at
Beginning
of
Year | | Charged
(Credited) to
Costs &
Expenses | | Deductions
Including
Currency
Translation | | Balance at
End of
Year | |
Allowance for doubtful accounts: | | | | | | | | | |
Year Ended December 31, | | | | | | | | | |
2005 | | $ | 256 | | $ | 223 | | $ | (61 | ) | $ | 418 | |
2004 | | | 654 | | | (55 | ) | | (343 | ) | | 256 | |
2003 | | | 798 | | | 855 | | | (999 | ) | | 654 | |
99
3. Exhibits
Exhibit | | Description |
2.1 | | Stock Purchase Agreement dated December 9, 2005 by and among Morningstar, Inc., Roger G. Ibbotson, Jody L. Sindelar, The Timothy Ibbotson-Sindelar Spray Trust, and The Tyler Ibbotson-Sindelar Spray Trust is incorporated by reference to Exhibit 2.1 to the Current Report on Form 8-K we filed with the SEC on December 14, 2005. |
3.1 | | Amended and Restated Articles of Incorporation of Morningstar are incorporated by reference to Exhibit 3.1 to our Registration Statement on Form S-1, as amended, Registration No. 333-115209 (the Registration Statement). |
3.2 | | Amended and Restated By-laws of Morningstar are incorporated by reference to Exhibit 3.2 to the Registration Statement. |
4.1 | | Specimen Common Stock Certificate is incorporated by reference to Exhibit 4.1 to the Registration Statement. |
10.1* | | Form of Indemnification Agreement is incorporated by reference to Exhibit 10.1 to the Registration Statement. |
10.2* | | Morningstar Incentive Plan is incorporated by reference to Exhibit 10.2 to the Registration Statement. |
10.3* | | Morningstar 1999 Incentive Stock Option Plan is incorporated by reference to Exhibit 10.4 to the Registration Statement. |
10.4* | | Morningstar 2004 Stock Incentive Plan is incorporated by reference to Exhibit 10.5 to the Registration Statement. |
10.5*† | | Form of Morningstar 2004 Stock Incentive Plan Stock Option Agreement. |
10.6* | | Deferred Compensation Agreement dated February 15, 1999 between Morningstar and Don Phillips is incorporated by reference to Exhibit 10.6 to the Registration Statement. |
10.7* | | Purchase Agreement dated April 30, 2003 between Morningstar and Patrick Reinkemeyer is incorporated by reference to Exhibit 10.8 to the Registration Statement. |
10.8* | | First Amendment to Purchase Agreement dated as of February 1, 2006 between Morningstar and Patrick Reinkemeyer is incorporated by reference to Exhibit 10.1 to the Current Report on Form 8-K (Items 1.01 and 1.02) that we filed on February 3, 2006 (the February 2006 8-K). |
10.9* | | Purchase Agreement dated April 30, 2003 between Morningstar and David Williams is incorporated by reference to Exhibit 10.9 to the Registration Statement. |
10.10* | | First Amendment to Purchase Agreement dated as of February 1, 2006 between Morningstar and David Williams is incorporated by reference to Exhibit 10.2 to the February 2006 8-K. |
21.1† | | Subsidiaries of Morningstar. |
23.1† | | Consent of Deloitte & Touche LLP. |
31.1† | | Certification of Chief Executive Officer pursuant to Rule 13a-14(a)/15d-14(a) of the Securities Exchange Act of 1934. |
31.2† | | Certification of Chief Financial Officer pursuant to Rule 13a-14(a)/15d-14(a) of the Securities Exchange Act of 1934. |
32.1† | | Certification of Chief Executive Officer Pursuant to 18 U.S.C. 1350. |
32.2† | | Certification of Chief Financial Officer Pursuant to 18 U.S.C. 1350. |
* Management contract with a director or executive officer or a compensatory plan or arrangement in which directors or executive officers are eligible to participate.
† Filed herewith.
100
Signatures
Pursuant to the requirements of Section 13 or 15(d) of the Securities Exchange Act of 1934, the registrant has duly caused this report to be signed on its behalf by the undersigned, thereunto duly authorized on March 16, 2006.
| MORNINGSTAR, INC. |
| By: | /s/ Joe Mansueto | |
| |
| |
| Name: Joe Mansueto |
| Title: Chairman of the Board and Chief Executive
Officer |
Pursuant to the requirements of the Securities Exchange Act of 1934, this report has been signed below by the following persons on behalf of the registrant and in the capacities and on the dates indicated.
Signature | | Title | | Date |
| | | | |
/s/ Joe Mansueto | | Chairman of the Board and Chief Executive | | March 16, 2006 |
Joe Mansueto | | Officer (principal executive officer) | | |
| | | | |
/s/ Martha Dustin Boudos | | Chief Financial Officer (principal | | March 16, 2006 |
Martha Dustin Boudos | | accounting and financial officer) | | |
| | | | |
/s/ Donald J. Phillips II | | Director | | March 16, 2006 |
Donald J. Phillips II | | | | |
| | | | |
/s/ Cheryl Francis | | Director | | March 16, 2006 |
Cheryl Francis | | | | |
| | | | |
/s/ Steven Kaplan | | Director | | March 16, 2006 |
Steven Kaplan | | | | |
| | | | |
/s/ Jack Noonan | | Director | | March 16, 2006 |
Jack Noonan | | | | |
| | | | |
/s/ Paul Sturm | | Director | | March 16, 2006 |
Paul Sturm | | | | |
101