Searchable text section of graphics shown above
Annual Shareholders’
Meeting 2006
Update on Key Products and Growth Strategies
Joe Mansueto,
Chairman &
Chief Executive Officer
Morningstar Today
• Our mission: Create great products that help investors reach their financial goals
• Established, well-regarded name in independent investment research
• Serving more than 4.9 million individuals, 185,000 advisors, and 750 institutions
• Extensive research and data on more than 145,000 investment offerings
• Operations in 13 countries and minority ownership positions in another three
• 1,250 employees
2005 Highlights
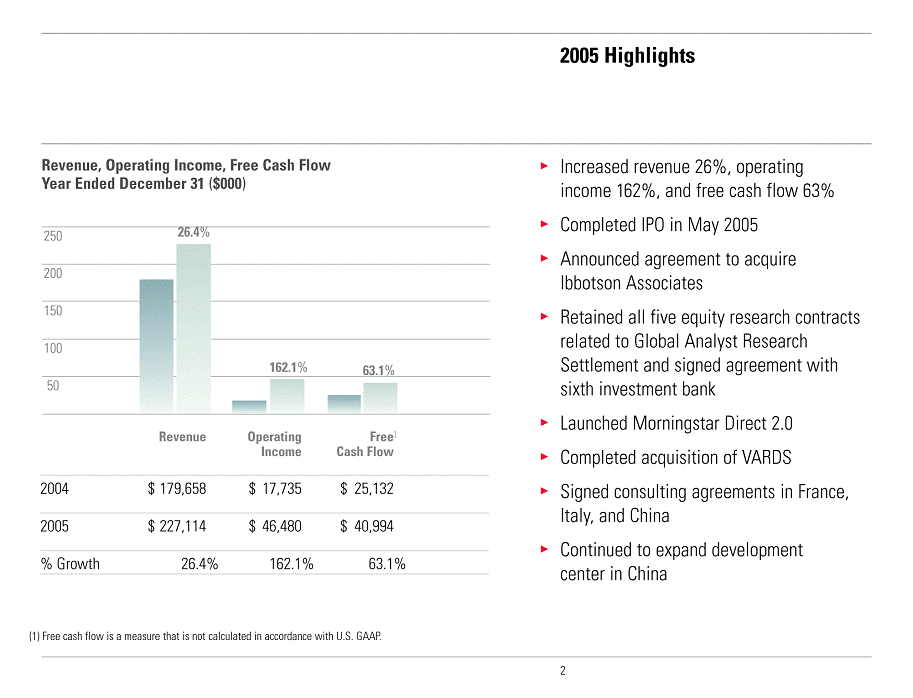
Revenue, Operating Income, Free Cash Flow Year Ended December 31 ($000)
[GRAPHIC]
| | Revenue | | Operating
Income | | Free
Cash Flow(1) | |
2004 | | $179,658 | | $17,735 | | $25,132 | |
2005 | | $227,114 | | $46,480 | | $40,994 | |
% Growth | | 26.4 | % | 162.1 | % | 63.1 | % |
(1) Free cash flow is a measure that is not calculated in accordance with U.S. GAAP.
• Increased revenue 26%, operating income 162%, and free cash flow 63%
• Completed IPO in May 2005
• Announced agreement to acquire Ibbotson Associates
• Retained all five equity research contracts related to Global Analyst Research Settlement and signed agreement with sixth investment bank
• Launched Morningstar Direct 2.0
• Completed acquisition of VARDS
• Signed consulting agreements in France, Italy, and China
• Continued to expand development center in China
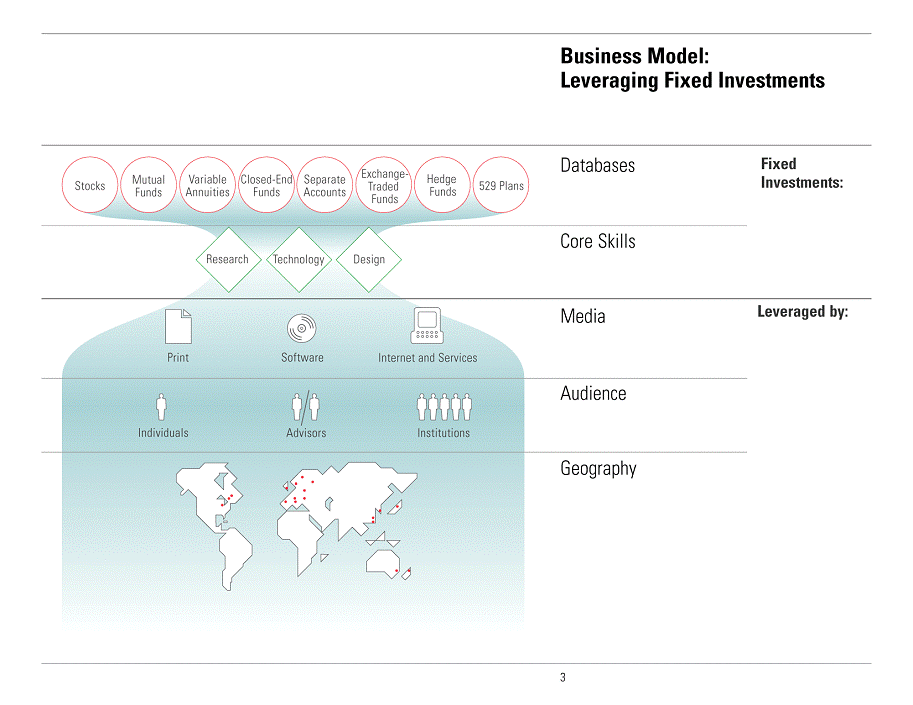
Business Model:
Leveraging Fixed Investments
[GRAPHIC]
Ibbotson Associates
[GRAPHIC]
• Completed acquisition on March 1, 2006 for $86.4 million
• Started in 1977 by Professor Roger Ibbotson
• Focused on providing clients with education and tools to reduce risk and improve returns for investors
• Serving more than 70,000 advisors and 700 institutions
• Key business lines:
• Investment consulting and research
• Planning and analysis software
• Investment advice
• Educational and marketing services
• Presentation materials
Ibbotson Associates
[GRAPHIC]
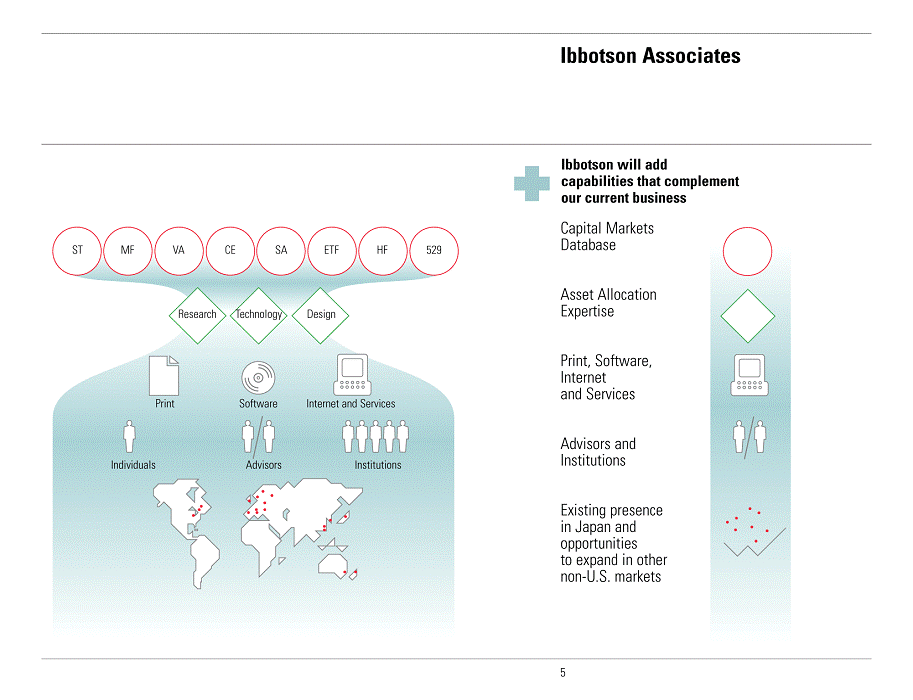
Ibbotson will add capabilities that complement our current business
• Capital Markets Database
• Asset Allocation Expertise
• Print, Software, Internet and Services
• Advisors and Institutions
• Existing presence in Japan and opportunities to expand in other non-U.S. markets
Individual Segment
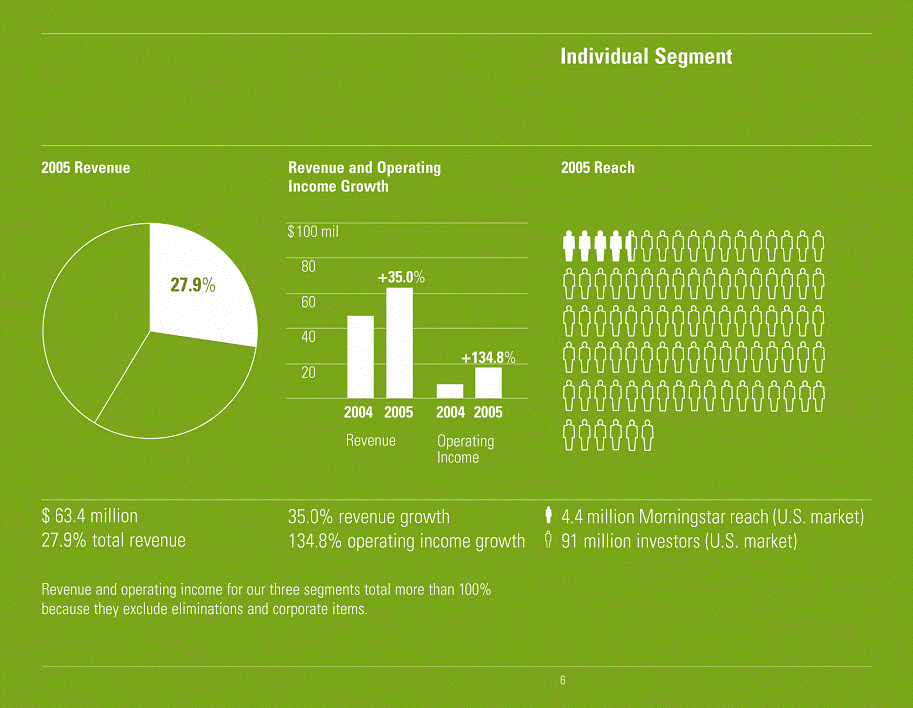
2005 Revenue
[GRAPHIC]
$ 63.4 million
27.9% total revenue
Revenue and Operating Income Growth:
[GRAPHIC]
35.0% revenue growth
134.8% operating income growth
2005 Reach
[GRAPHIC]
4.4 million Morningstar reach (U.S. market)
91 million investors (U.S. market)
Revenue and operating income for our three segments total more than 100% because they exclude eliminations and corporate items.
Morningstar.com
Growth of Morningstar.com Premium Memberships (U.S.) Year Ended December 31
[GRAPHIC]
• Analyst research on 2,000 funds and 1,700 stocks
• Launched Morningstar Stewardship Grade for Stocks
• Expanded analyst coverage on exchange-traded funds
• Created new home page to highlight most frequently used content
• Moderate increase in Premium pricing: now $14.95/month or $135/year
• 2006 priorities:
• Improve site’s speed
• Expand base of enthusiast users
• Increase Premium trials through sampling and other programs
Independent Equity Research
[GRAPHIC]
• Fundamental approach favors companies with discount to estimated intrinsic value and sustainable competitive advantage (economic moat)
• Expanded analyst staff from 73 to 87 in 2005 and increased coverage list from 1,500 to more than 1,700 stocks
• Signed contract with sixth investment bank to provide research under Global Analyst Research Settlement
• 2006 priorities:
• Great service and ongoing training for Global Settlement clients
• Increase coverage outside U.S. and expand non-U.S. client base
• Expand reach with buy side
Advisor Segment
2005 Revenue
[GRAPHIC]
$72.7 million
32.0% total revenue
Revenue and Operating Income Growth
[GRAPHIC]
19.4% revenue growth
28.1% operating income growth
2005 Reach
[GRAPHIC]
185,000 Morningstar reach (global)
715,000 advisors (global)
Revenue and operating income for our three segments total more than 100% because they exclude eliminations and corporate items.
Morningstar Advisor Workstation
[GRAPHIC]
• Advisor Workstation has been a key growth driver and now ranks as largest product in Advisor segment
• 2005 enhancements:
• Advisor Compliance Tools
• Share Class Analyzer Report
• 2006 priorities:
• Retirement income solutions
• Suitability manager tool for mutual funds, 529s, variable annuities
• New portfolio planning tool
• Prices range up to $5,000/user for Office Edition; $80-$2,500/user for Enterprise Edition
Institutional Segment
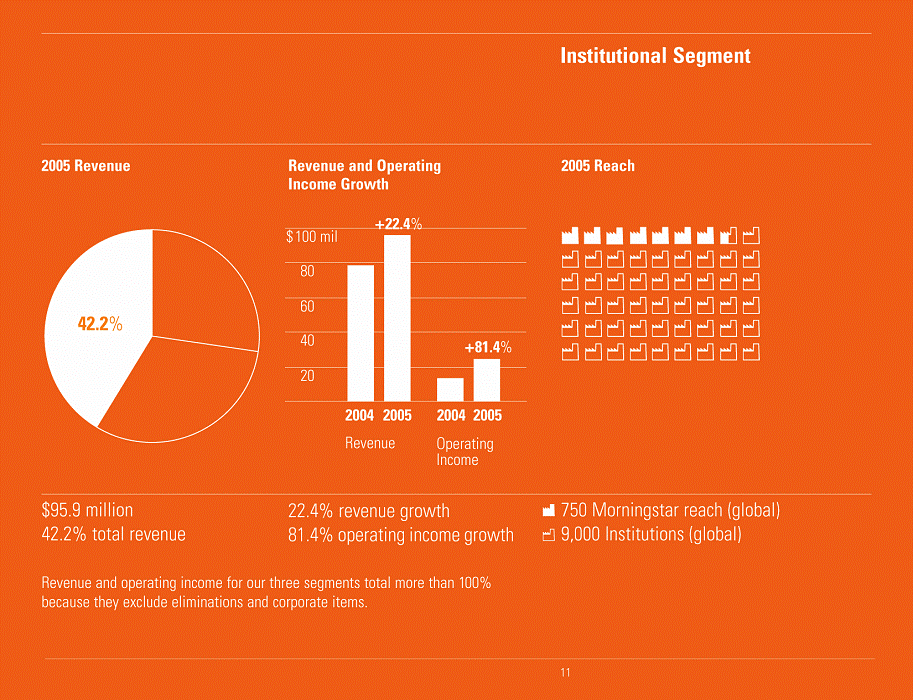
2005 Revenue
[GRAPHIC]
$95.9 million
42.2% total revenue
Revenue and Operating Income Growth
[GRAPHIC]
22.4% revenue growth
81.4% operating income growth
2005 Reach
[GRAPHIC]
750 Morningstar reach (global)
9,000 Institutions (global)
Revenue and operating income for our three segments total more than 100% because they exclude eliminations and corporate items.
Morningstar Direct
[GRAPHIC]
• Added global databases and hedge fund data in 2005
• Expanded sales efforts outside the United States
• 2006 priorities:
• Transition clients to 3.0 version
• Add Ibbotson’s asset allocation capabilities to Morningstar Direct
• Add portfolio processing/accounting capabilities
• Add global ownership database, including portfolio data and 13-F filings
• Simple pricing: $15,000 for first user, $10,000 for second user, and $7,500 for each additional user
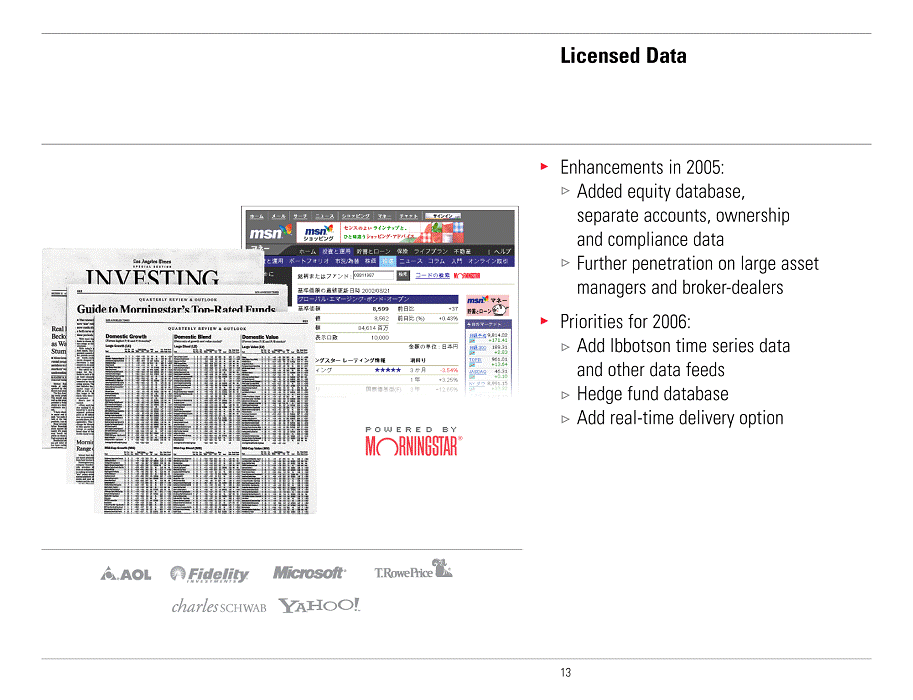
Licensed Data
[GRAPHIC]
• Enhancements in 2005:
• Added equity database, separate accounts, ownership and compliance data
• Further penetration on large asset managers and broker-dealers
• Priorities for 2006:
• Add Ibbotson time series data and other data feeds
• Hedge fund database
• Add real-time delivery option
Investment Consulting
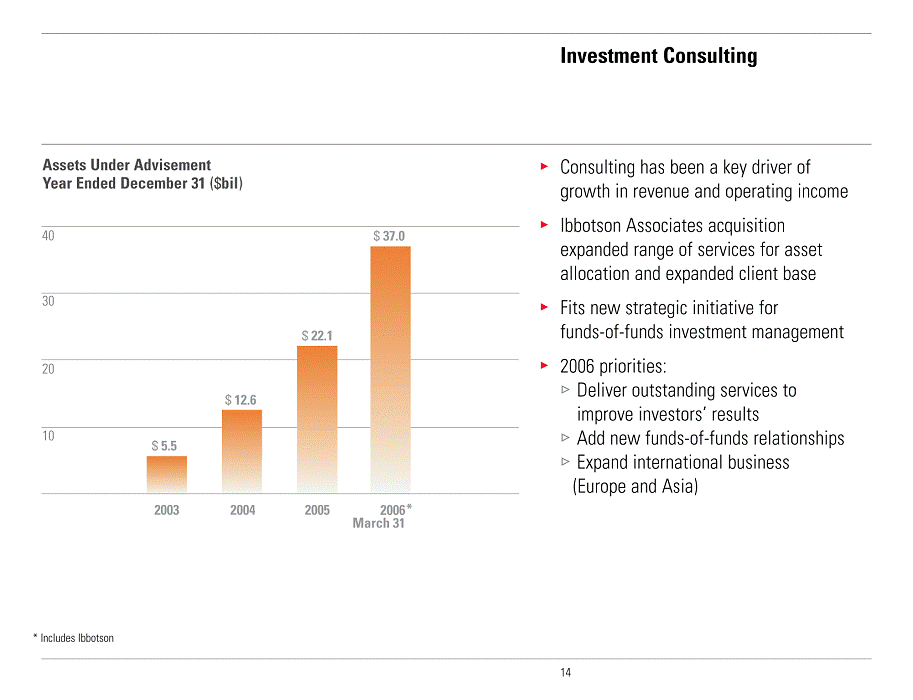
Assets Under Advisement Year Ended December 31 ($bil)
[GRAPHIC]
• Consulting has been a key driver of growth in revenue and operating income
• Ibbotson Associates acquisition expanded range of services for asset allocation and expanded client base
• Fits new strategic initiative for funds-of-funds investment management
• 2006 priorities:
• Deliver outstanding services to improve investors’ results
• Add new funds-of-funds relationships
• Expand international business (Europe and Asia)
Retirement Advice
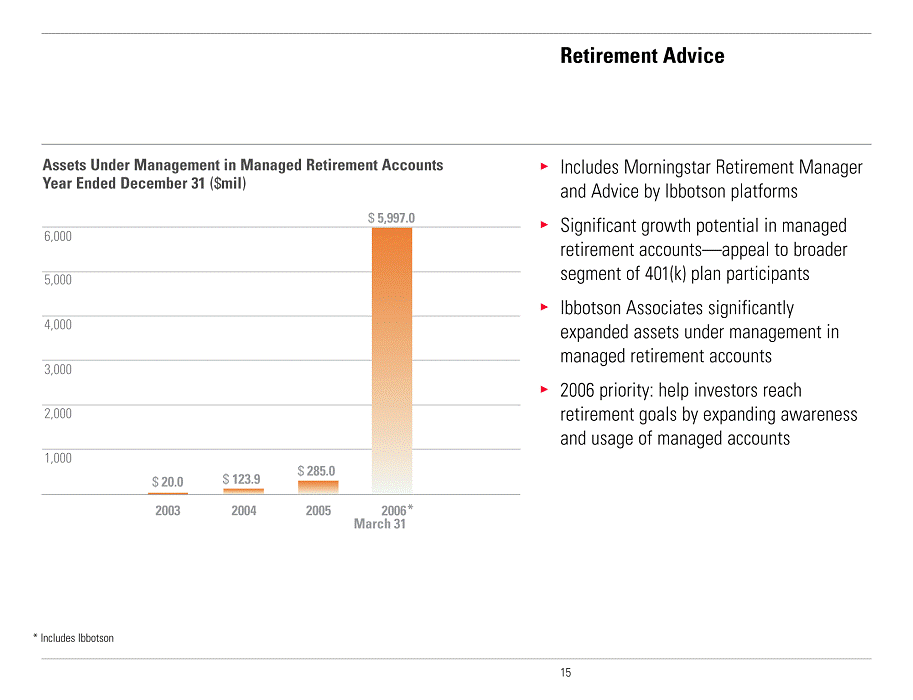
Assets Under Management in Managed Retirement Accounts Year Ended December 31 ($mil)
[GRAPHIC]
• Includes Morningstar Retirement Manager and Advice by Ibbotson platforms
• Significant growth potential in managed retirement accounts—appeal to broader segment of 401(k) plan participants
• Ibbotson Associates significantly expanded assets under management in managed retirement accounts
• 2006 priority: help investors reach retirement goals by expanding awareness and usage of managed accounts
Growth Strategy: Build Leadership Position in Each Market Segment
[GRAPHIC]
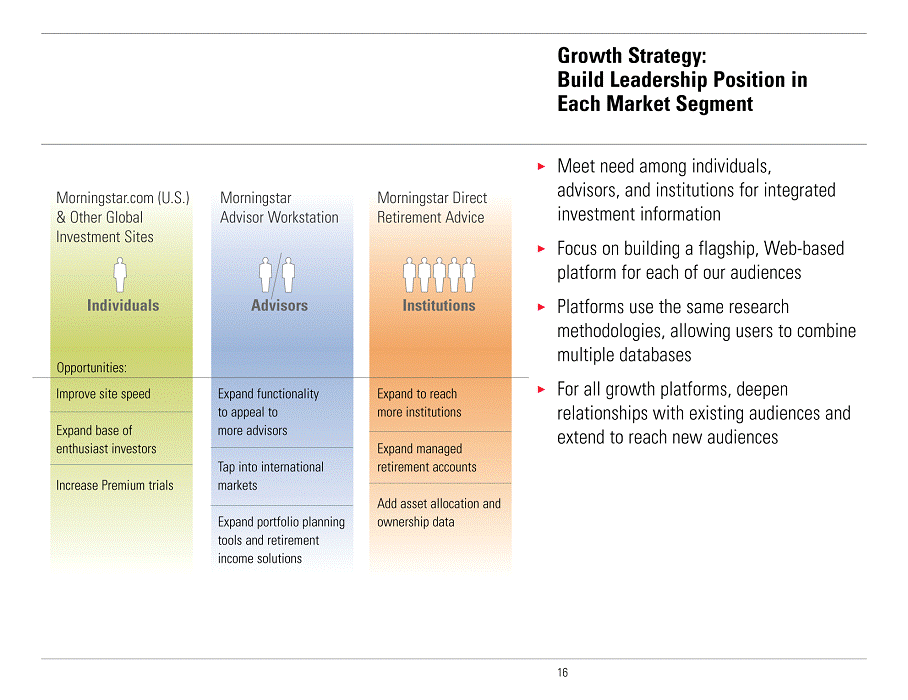
• Meet need among individuals, advisors, and institutions for integrated investment information
• Focus on building a flagship, Web-based platform for each of our audiences
• Platforms use the same research methodologies, allowing users to combine multiple databases
• For all growth platforms, deepen relationships with existing audiences and extend to reach new audiences
Growth Strategy: Become a Global Leader in Funds-of-Funds Investment Management
Assets Under Management in Morningstar Managed Portfolios Year Ended December 31 ($mil)
[GRAPHIC]
• Morningstar Managed Portfolios
• Broaden penetration in independent broker-dealer and registered investment advisor markets
• Expand distribution through additional selling agreements
• Expand ETF-based portfolios and tax-sensitive separate account portfolios to all of our markets
• Investment Consulting:
$37 billion in assets under advisement
• Managed retirement accounts:
$6 billion in assets under management
Growth Strategy: Expand Range of Products and Services
[GRAPHIC]
• Leverage investment in equity research
• Expand capabilities in hedge fund research
• Roll out hedge fund research to qualified/accredited investors
• Integrate research efforts with Ibbotson’s quantitative work
• Continue expanding database
• Develop additional capabilities in managing retirement income
• Launched Retirement Income Education Center for advisors
• Currently developing a retirement income planning application
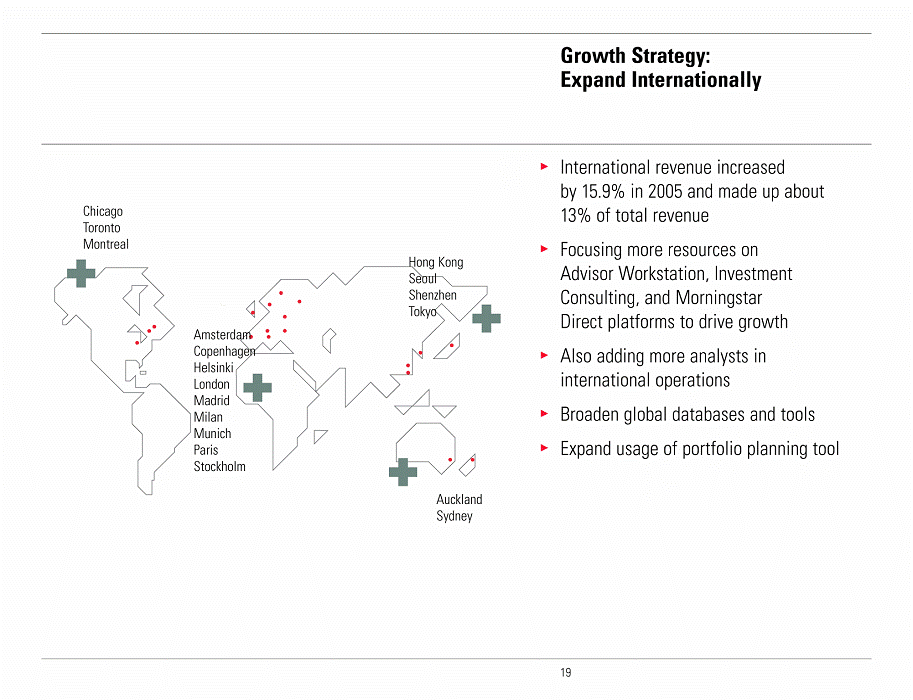
Growth Strategy: Expand Internationally
[GRAPHIC]
• International revenue increased by 15.9% in 2005 and made up about 13% of total revenue
• Focusing more resources on Advisor Workstation, Investment Consulting, and Morningstar Direct platforms to drive growth
• Also adding more analysts in international operations
• Broaden global databases and tools
• Expand usage of portfolio planning tool
Business Model and Financials
Martha Dustin Boudos
Chief Financial Officer
Financial Results in 2005
Consolidated Income Statement Year Ended December 31 ($000, except per share amounts)
| | 2005 | | 2004 | | % change | |
Revenue | | $ | 227,114 | | $ | 179,658 | | 26.4 | % |
Operating Expense(1) | | 180,634 | | 161,923 | | 11.6 | % |
Operating Income | | 46,480 | | 17,735 | | 162.1 | % |
Operating Margin | | 20.5 | % | 9.9 | % | 10.6pp | |
Net Income | | $ | 31,117 | | $ | 8,809 | | 253.2 | % |
Diluted Income per share | | $ | 0.70 | | $ | 0.21 | | | |
Weighted Average Common Shares Outstanding (Diluted) | | 44,459 | | 41,858 | | | |
(1) Includes stock-based compensation expense
• Strong revenue growth from all three business segments
• Substantial growth in operating margin
• Continued margin expansion and organic growth in Q1 2006
Revenue: Consistent Growth Over 20 Years
Annual Growth Rates Over the Past Five Years
[GRAPHIC]
• Have continued to generate strong organic growth
• Ibbotson Associates contributed $4.4 million of revenue in Q1 2006
• Recent growth drivers:
• Morningstar Advisor Workstation
• Equity Research
• Investment Consulting
• Licensed Data
• Morningstar.com
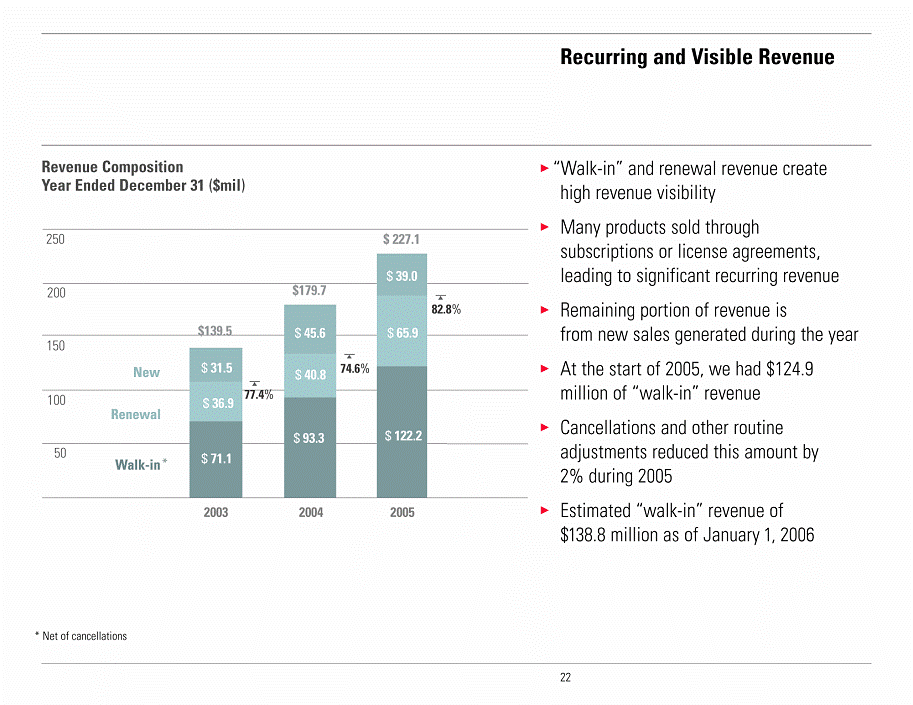
Recurring and Visible Revenue
Revenue Composition Year Ended December 31 ($mil)
[GRAPHIC]
• “Walk-in” and renewal revenue create high revenue visibility
• Many products sold through subscriptions or license agreements, leading to significant recurring revenue
• Remaining portion of revenue is from new sales generated during the year
• �� At the start of 2005, we had $124.9 million of “walk-in” revenue
• Cancellations and other routine adjustments reduced this amount by 2% during 2005
• Estimated “walk-in” revenue of $138.8 million as of January 1, 2006
New Metrics: Retention and Renewal Rates
Retention and Renewal Rates Year Ended December 31, 2005
[GRAPHIC]
• For subscription-based products, calculated retention based on number of subscriptions retained
• Estimate that retention rate for subscription products averaged between 60% and 65% in 2005
• For products sold through contracts and licenses, track dollar value of renewals vs. dollar value of contracts up for renewal
• Weighted average renewal rate for contract-based products and services ranged from 100% to 105%, including impact of price increases
Diversified Revenue
Revenue Composition by Segment Year Ended December 31, 2005
[GRAPHIC]
Revenue for Top Five Products Year Ended December 31, 2005
[GRAPHIC]
• Diversified across multiple segments, products, and increasingly regions
• Largest client relationship represented less than 5% of revenue in 2005
• Not dependent on any one segment, product, or client for a majority of our revenue
Significant Operating Leverage
Revenue and Operating Expense Year Ended December 31 ($000)
[GRAPHIC]
• Substantial expansion in operating margin as revenue has grown faster than expenses
• Operating income growth reflects operating leverage (the relatively low variable cost of adding new customers)
• Expect operating leverage to be evident in operations over the long term
2001 | | 2002 | | 2003 | | 2004 | | 2005 | | | |
$ | 91,230 | | $ | 109,619 | | $ | 139,496 | | $ | 179,658 | | $ | 227,114 | | | Revenue |
22 | % | 20 | % | 27 | % | 29 | % | 26 | % | | Revenue growth |
$ | 107,621 | | $ | 117,959 | | $ | 150,250 | | $ | 161,923 | | $ | 180,634 | | | Operating expense |
5,667 | | 7,292 | | 29,029 | | 16,723 | | 10,895 | | | Stock-based compensation expense |
101,954 | | 110,667 | | 121,221 | | 145,200 | | 169,739 | | * | Operating expense before stock-based compensation |
-16 | % | 9 | % | 10 | % | 20 | % | 17 | % | | Operating expense growth before stock-based compensation |
$ | (10,724 | ) | $ | (1,048 | ) | $ | 18,275 | | $ | 34,458 | | $ | 57,375 | | * | Operating income before stock-based compensation expense |
$ | (16,391 | ) | $ | (8,340 | ) | $ | (10,754 | ) | $ | 17,735 | | $ | 46,480 | | | Operating income (loss) |
NMF | | NMF | | NMF | | 9.9 | % | 20.5 | % | | Operating margin (%) |
* Operating expense and income before stock-based compensation are measures that are not calculated in accordance with U.S. GAAP.
Stock-Based Compensation Expense
Stock-Based Compensation Expense Year Ended December 31 ($000)
| | 2001 | | 2002 | | 2003 | | 2004 | | 2005 | |
Liability method | | $ | (3,336 | ) | $ | (3,283 | ) | $ | 17,796 | | $ | 8,963 | | $ | 2,810 | |
Equity method | | 9,003 | | 10,575 | | 11,233 | | 7,760 | | 8,085 | |
Total expense | | $ | 5,667 | | $ | 7,292 | | $ | 29,029 | | $ | 16,723 | | $ | 10,895 | |
• Have consistently included stock-based compensation in reported financials
• Two methods of recording stock-based compensation:
• Liability method (no longer used following IPO)
• Equity method
• Stock-based compensation expense has declined primarily because no expenses was recorded under liability method in 2006
• Began granting restricted stock units (RSUs) with annual equity awards in May 2006
• Expect to record approximately $8.6 million in stock-based compensation expense in 2006 (including expense for May 15 RSU grant)
Free Cash Flow
Free Cash Flow Year Ended December 31 ($000)
[GRAPHIC]
• Healthy free cash flow as revenue grows faster than expense
• Business does not require significant ongoing capital investment
• Capital expenditures consist mainly of computer equipment, capitalized software development, and leasehold improvements
• Free cash flow increased to $9.1 million in Q1 2006, driven by increase in net income
2001 | | 2002 | | 2003 | | 2004 | | 2005 | | |
| | | | | | | | | | |
$ | (5,183 | ) | $ | 16,542 | | $ | 29,705 | | $ | 32,862 | | $ | 48,445 | | Cash provided by (used for operating activities) |
(5,932 | ) | (5,989 | ) | (8,607 | ) | (7,730 | ) | (7,451 | ) | Capital expenditures |
$ | (11,115 | ) | $ | 10,553 | | $ | 21,098 | | $ | 25,132 | | $ | 40,994 | | Free cash flow |
2,777 | | (6,068 | ) | (29,634 | ) | (22,750 | ) | (16,913 | ) | Cash provided by (used for investing activities) |
(1,049 | ) | (1,952 | ) | (26 | ) | (6,367 | ) | 25,256 | | Cash provided by (used for financing activities) |
“Free cash flow” is defined as cash provided by (used for) operating activities less capital expenditures. We have presented free cash flow solely as a supplemental disclosure to help our investors better understand how much cash is available after we spend money to operate our business. This table includes a reconciliation from cash provided by (used for) operating activities to free cash flow. We use free cash flow to evaluate the performance of our business. Free cash flow should not be considered an alternative to any measure of performance as promulgated under GAAP (such as cash provided by (used for) operating, investing, and financing activities), nor should this data be considered an indicator of our overall financial performance or liquidity. Also, our free cash flow definition may not be comparable to similarly titled measures reported by other companies.
Solid Balance Sheet
Consolidated Balance Sheet Data ($000)
| | as of December 31, 2005 | | as of March 31, 2006 | |
Cash, cash equivalents, and investments | | $ | 153,190 | | $ | 82,906 | |
Total current assets | | $ | 206,215 | | $ | 150,911 | |
Total assets | | $ | 296,311 | | $ | 323,849 | |
Total current liabilities | | $ | 115,841 | | $ | 123,055 | |
Total long-term liabilities | | $ | 6,756 | | $ | 4,762 | |
Total liabilities | | $ | 122,597 | | $ | 127,817 | |
Total shareholders’ equity | | $ | 173,714 | | $ | 196,032 | |
• $82.9 million in cash, cash equivalents, and investments
• Used $86.4 million in cash to acquire Ibbotson
• No external debt
• Advance cash collections from subscription model generate deferred revenue
• Liabilities consist largely of deferred revenue ($87.5 million) and accrued compensation ($16.6 million)
Conclusion
[GRAPHIC]
• “Wide-moat” companies have enduring competitive advantages
• Strive to create and maintain a wide moat for Morningstar
• Emphasis on managing our business to maximize long-term results
• Aim to communicate with candor and give the unvarnished truth about our business

