Exhibit 99.1
|
Annual Shareholders’ Meeting 2009 1 |
|
Meeting Agenda 1. Call to Order 2. Introductions 3. Business of Annual Meeting 4. Management Presentations 5. Business Presentations Break 6. Questions and Answers 7. Adjournment of Meeting 2 |

|
Morningstar Overview Joe Mansueto Chairman and Chief Executive Officer 3 |
|
Today’s presentations contain forward-looking statements. All statements made that are not historical facts are subject to a number of risks and uncertainties, and actual results may differ materially. Please refer to our most recent earnings release and our most recent Form 10-Q or 10-K for more information on the factors that could cause actual results to differ. Today’s presentations also contain non-GAAP financial measures. Please refer to the inside front cover and page 126 of our 2008 annual report posted in the Investor Relations section of our Web site at http://corporate.morningstar.com for a reconciliation to the applicable GAAP measures. 4 |
Please carefully read the legal disclaimer above.
Please refer to our 2008 annual report posted on our corporate Web site for reconciliations of non-GAAP financial measures to the applicable GAAP measures.
|
Morningstar Overview 2008 Highlights Industry Landscape Organizational Structure Growth Strategies Recent Acquisitions 5 |
My talk today will cover five major areas:
· 2008 highlights
· Industry landscape
· New organizational structure
· Growth strategies
· Recent acquisitions
|
2008 Highlights 6 |

|
2008 Key Metrics $ 117.3 $ 139.1 18.6% Operating Income ($mil) 08 07 $ 103.9 $ 101.0 2.9% Free Cash Flow* ($mil) *Free Cash Flow is considered a non-GAAP financial measure under SEC regulations. 08 07 $ 435.1 $ 502.5 15.5% Revenue ($mil) 08 07 7 |
We have three key metrics that we use to measure our results.
Revenue increased 16% to just over $500 million in 2008, operating income increased about 19% to $139.1 million, and free cash flow was relatively flat at $104 million.
|
Quarterly Organic Revenue* Growth 07 08 Q1 Q2 Q3 Q4 Q1 Q2 Q3 Q4 *Organic revenue is considered a non-GAAP financial measure. Please see slide at the end of the presentation xfor reconciliation to consolidated revenue. 07 08 Q1 Q2 Q3 Q4 Q1 Q2 Q3 Q4 5 10 15 20% 8 |
This slide shows organic revenue growth (revenue excluding acquisitions and currency movements) for the eight quarters ending in the fourth quarter of 2008. As you can see our quarterly organic growth rate was strong throughout 2007 but declined steadily in 2008.
This reflects the impact of the market downturn, clients becoming more cautious and price sensitive, and weaker trends in new business and renewals.
|
Industry Landscape 9 |

|
2008 Net Inflows / Outflows *excludes money market funds $0.3 ($50.5) $177.2 MF CE VA HF SA ETF $154.8 ($70.2) ($225.1) bil* 2008 Assets $9.6 tril $188.4 bil $1.1 tril $2.8 tril $497.9 bil $531.3 bil 10 |

Here’s a snapshot of net inflows and outflows into various investment types in 2008. The severe market downturn had a dramatic impact on mutual fund assets in 2008 as many investors shifted money out of long-term funds because of the large market losses.
|
$0.3 $177.2 2008 Net Inflows / Outflows *excludes money market funds 2007 Assets $12 tril $328.1 bil $1.5 tril $2.7 tril $803.2 bil $608.4 bil MF CE VA HF SA ETF $154.8 ($70.2) ($225.1) bil* 2008 Assets $9.6 tril $188.4 bil $1.1 tril $2.8 tril $531.3 bil ($50.5) $497.9 bil 11 |
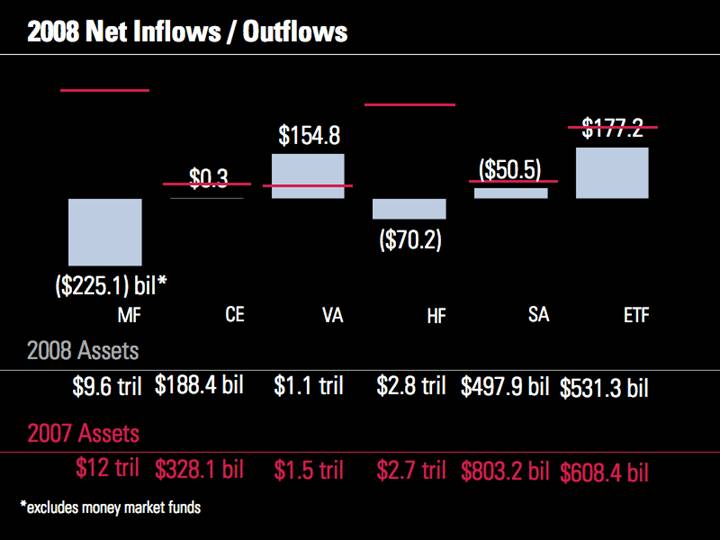
This slide shows net cash flows in 2008 compared with 2007 levels. Cash flows were generally lower in 2008, with the exception of variable annuities and continuing strength in ETFs.
|
Spending on Financial Information *source: Veronis Suhler Stevenson Spending ($bil) CAGR 9.5% 03 $ 7.9 6.8% 04 $ 8.8 10.3% 05 $ 9.7 10.0% 06 $ 10.6 10.1% 07 $ 11.7 10.3% 08 $ 12.3 5.1% 09 $ 13.1 6.0% 10 $ 14.1 8.3% 11 $ 15.5 9.4% 12 $ 17.1 10.5% Projected Spending ($bil) CAGR 7.8% 12 |
There is a large market for financial information, and we see many opportunities ahead of us. Veronis Suhler Stevenson estimates that spending on economic and financial information totaled about $12 billion in 2008, so we have a small, 4% share of this market.
|
–11.25 –5.05 8.51 –1.18 –0.92 4.19 7.48 5.25 4.38 -41.87 -46.28 -39.92 –11.25 –1.18 –0.92 –5.05 4.19 5.25 8.51 7.48 4.38 Current Environment YTD through 04.30.09 13 |
This box shows Morningstar’s market barometer, a heat map of total returns for different areas of the Style Box. The market environment has been somewhat more positive for the year to date through April 30.
|
Current Environment 05 06 07 08 YTD 04.30.09 6.5% 15.7% 5.9% –37.0% Morningstar Market Index Total Return –1.3% –11.25 –5.05 8.51 –1.18 –0.92 4.19 7.48 5.25 4.38 –36.17 –35.95 –31.67 -31.47 -38.73 –36.19 -41.87 -46.28 -39.92 –0.43 –5.52 –8.15 8.64 1.95 –5.43 12.34 19.70 11.06 25.79 18.81 20.03 15.54 14.72 21.17 5.68 9.63 10.04 7.04 11.54 5.12 3.82 10.05 6.30 3.43 16.27 5.77 –15.78 –13.98 0.23 –17.14 –19.07 –9.82 –4.04 –11.94 –8.73 –36.17 –35.95 –31.67 -31.47 -38.73 –36.19 -41.87 -46.28 -39.92 14 |
Here you can see the change in market performance over the past several years. As you know, it was a historically bad year for the equity markets in 2008, with Morningstar’s U.S. Market Index, a broad market benchmark, down 37% for the year.
This created some headwinds for our business, especially on the asset management side.
|
Revenue from Asset-Based Fees 15% Q1 2008 15 |

These slides show our percentage of revenue from asset-based fees, which has declined from 15% of revenue in the first quarter of 2008 to 10% in the first quarter of 2009. The change in this figure over time demonstrates the impact of the market environment on our results.
|
Revenue from Asset-Based Fees 16% Q2 2008 16 |
|
Revenue from Asset-Based Fees 14% Q3 2008 17 |
|
Revenue from Asset-Based Fees 8% Q4 2008 18 |
|
Revenue from Asset-Based Fees 10% Q1 2009 19 |
|
Organizational Structure 20 |

|
Investment Information Investment Management Organizational Structure International Product Lines Software Data Inv. Research Inv. Management International Bevin Desmond Business Groups Institutional Bevin Desmond Advisor Chris Boruff Individual Kunal Kapoor Data Liz Kirscher Equity Research Cathy Odelbo Fund Research Don Phillips Morningstar Associates Patrick Reinkemeyer Ibbotson Associates Peng Chen Investment Services Jeff Ptak 21 |
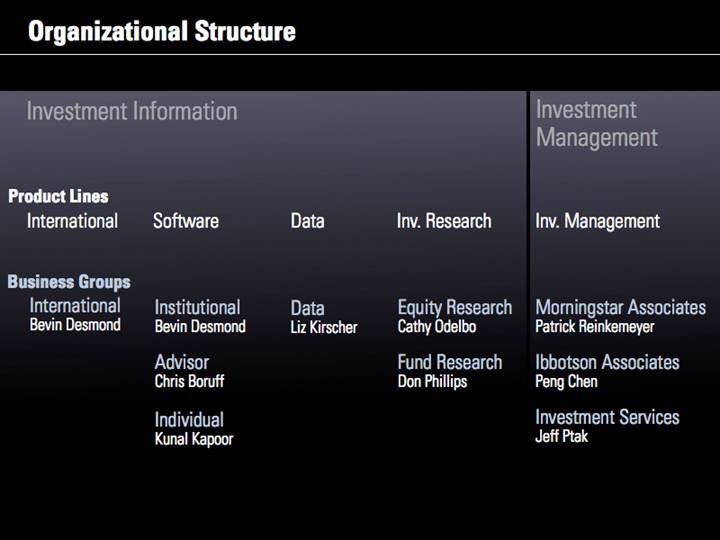
We spent considerable time thinking about our company’s structure this past year and made some changes that were effective in January 2009. Our objectives were to more closely align our company structure with our growth strategies and create a more decentralized structure with greater P&L responsibility at the product level.
We now have two operating segments: Investment Information and Investment Management. In our previous structure we were organized along audience lines; now our structure is divided by product type.
We have five major product lines: international, software, data, investment research, and investment management.
Bevin Desmond continues to head our international operations and has taken on additional responsibilities as president of institutional software. Chris Boruff remains president of advisor software. Kunal Kapoor is president of our individual software group.
Liz Kirscher remains president of our data group and is also responsible for all of our global data operations.
We’ve divided our research team into two groups: equity research, headed by Cathy Odelbo, and fund research, led by Don Phillips.
On the Investment Management side, Patrick Reinkemeyer heads Morningstar Associates. Peng Chen remains president of Ibbotson Associates. And Jeff Ptak was recently named president of Morningstar Investment Services.
|
Growth Strategies 22 |

|
Morningstar’s Growth Strategies Focus on three platforms Become a global leader in funds of funds Create premier global database Expand internationally Continue building thought leadership NEW NEW 23 |
We have five major growth strategies. Those of you who have followed our company might notice that we’ve tweaked these slightly.
We added two new strategies:
· Continue building thought leadership in independent investment research
· Create a premier global investment database
These aren’t new initiatives for us, but we felt they were important enough that we wanted to surface them more.
We deleted one strategy: expand the range of products and services. We’re still doing this throughout our business, but it’s not an end in itself, so we’re no longer identifying it as a separate strategy.
|
Individuals Morningstar.com Strategy: Focus on Three Platforms Institutions Morningstar Direct Advisors Advisor Workstation 24 |
The first of our five strategies is to focus our product offerings on our three major platforms, which are targeted to individuals, advisors, and institutions.
In all three of these markets, we believe investors are looking for integrated solutions, and all of our platforms are designed to meet that need.
The three platforms are:
1. Morningstar.com for individual investors, which includes Premium Membership services and Internet advertising sales
2. Morningstar Advisor Workstation, which is our Web-based planning system for financial advisors
3. Morningstar Direct, which is our institutional research platform that provides access to the full range of our global data, research, and tools
|
Combined Revenue from Three Platforms Combined Revenue ($000) and % of Consolidated Revenue $ 44,854 $ 61,632 $ 84,996 $ 108,508 $ 135,134 27.1% 05 27.0% 06 24.9% 07 08 26.9% 25.0% 04 revised 25 |
This graph shows combined revenue for our three platforms over the past five years. The percentage went down a bit in 2007 because of additional revenue from acquisitions, but we’ve seen steady growth in dollar terms each year.
|
Morningstar.com Premium Memberships 131,035 147,010 165,957 180,366 177,518 05 06 07 08 04 revised 26 |
We had about 177,000 Premium members on Morningstar.com as of year-end 2008. The total declined a bit in 2008 because it has been difficult to sign up new trials. We have seen more reluctance among individual investors to pay for premium content, and in some cases, people have simply told us that they are getting out of the markets.
|
Morningstar Advisor Workstation 80,235 113,461 153,838 175,725 190,267 05 06 07 08 04 revised U.S. Licenses 27 |
U.S. licenses for Advisor Workstation were up about 8% in 2008, driven by new client growth and increased seats at existing clients.
|
Morningstar Direct Licenses 04 05 06 07 08 775 878 1,077 1,892 U.S. 1,564 107 271 665 775 985 1,348 2,229 2,961 Non-U.S. Total 1,069 — 28 |
Total licenses increased about 33% in 2008. We now have more than one-third of licenses from outside the U.S.
|
Strategy: Become a Global Leader in Funds of Funds Morningstar Associates Qualitative focus Bottom-up approach Portfolio analysis + manager selection Ibbotson Associates Quantitative focus Top-down approach Capital markets, portfolio construction theory + practice Morningstar Investment Services Quantitative and qualitative focus Portfolios tailored to risk tolerance levels + investment goals Investment management + technology 29 |
We think assembling and evaluating funds of funds is a natural extension of our expertise in understanding managed investment products.
We have three subsidiaries that offer investment management services: Morningstar Associates, Ibbotson Associates, and Morningstar Investment Services.
|
Become a Global Leader in Funds of Funds Funds of Funds Industry Assets ($bil)* Morningstar’s Combined Assets ($bil) 04 05 06 07 08 $ $ 951 $ 1,258 $ 1,676 $ 1,952 $ 1,724 *source: Cerulli Associates; 2008 amount is projected 4.6% 1.4% 1.9% 3.9% 5.8% $13.6 $23.8 $65.9 $113.4 $78.8 30 |
Here you can see growth in funds of funds over the past five years based on data from Cerulli Associates. The large number of managed investment products has made sorting through them to build a well thought-out portfolio a difficult task. As a result, there’s been strong growth in multimanager assets worldwide, which totaled an estimated $1.7 trillion as of year-end 2008.
We do this work in three major areas: Investment Consulting, managed retirement accounts, and Morningstar Managed Portfolios. Our combined assets in these three areas totaled about $79 billion at year-end 2008, which represents about 5% of industry-wide assets.
|
Page 1 of 4 | Morningstar® Research Report BlackRock US Dynamic A Acc Morningstar Category Benchmark MSCI USA NR USD Morningstar Qualitative Rating™ Elite Superior Standard Inferior Impaired Chetan Modi Morningstar Analyst Executive Summary People: Manager Bob Doll is a seasoned investor and he is backed up by a dedicated team of analysts. He can also leverage BlackRock's considerable resources. Parent: BlackRock is an independent asset management group that is recognized as one of the most prominent fixed-income managers globally. Its merger with MLIM strengthened it on the equity front and the combined firm has considerable global capabilities. Process: The quant-based process with a qualitative overlay has been successful over long periods of time but Doll's strategy can lead to short-term underperformance due to notable sector bets. 12.0 10.5 9.0 7.5 6.0 Growth of 10,000 (GBP) Fund Benchmark Category 2000 2001 2002 2003 2004 2005 2006 2007 2008 YTD Performance 31/03/09 Cat Perf Quartile -11.70 -21.47 -29.99 12.00 2.84 24.46 -1.80 4.56 -18.21 -6.77 Total Return -5.73 -11.39 0.48 -3.48 0.15 6.88 -2.39 0.89 -4.65 3.64 +/- Benchmark -9.79 -8.98 0.89 -2.28 1.33 8.62 -1.13 0.49 -1.63 2.60 +/- Category 91 93 28 63 25 5 64 40 67 18 Tot Ret % Rank in Cat Morningstar Opinion 3 Apr 2009 | Manager experience and depth of resources at BlackRock US Dynamic Equity make it a compelling choice. Robert Doll has been in charge here since April 2004. Doll is Vice Chairman and Chief Investment Officer of Global Equities at BlackRock and he's spent over 28 years in the industry. He manages additional US large-cap offerings undertaken by Doll and his team. They analyse the top 250 ranked stocks and eliminate companies with unappealing features such as those operating in industries with unattractive prospects or run by a questionable management team. This qualitative overlay helps avoid those stocks with high scores but which carry risks that a quant model can overlook. Although the element of fundamental research has its merits, Doll will at times make big sector bets which Qualitative Fund Ratings in Europe Strategy: Continue Building Thought Leadership Income Shortfall (Shortage of income compared to annual income Retirement Income Efficient Frontier with VA + GMWB, 30-Year Horizon 2 $0K 4 20/80 40/60 60/40 20/60/20VA 40/45/15VA 60/30/10VA Working Paper: Guaranteed Products + Traditional Portfolio Ibbotson Lifetime Asset Allocation Research 31 |
We recently introduced qualitative fund ratings in Europe. Our research consists of a four-page report, with each investment rated Elite, Superior, Standard, Inferior, or Impaired.
Ibbotson Associates has also been continuing its research on lifetime asset allocation, which is a new framework for creating target-maturity funds that incorporates both financial capital and human capital.
Ibbotson has also written a working paper on combining guaranteed products with traditional asset allocations—an area where we’ve seen significant investor interest.
|
Strategy: Continue Building Thought Leadership Target Date Fund Family Reports Page 1 of 4 | Morningstar Target Date Report | 31 Jul 2009 Vanguard Target Date Fund Family Report 2055 2050 2045 2040 2035 2030 2025 2020 18 23 28 33 38 43 48 53 87 76 82 76 77 73 65 59 90 88 90 88 87 85 77 69 100% 80 60 Total Equity Exposure Glide Path Available Funds XYZ Retirement 2055 XYZ Retirement 2050 XYZ Retirement 2045 XYZ Retirement 2040 XYZ Retirement 2035 XYZ Retirement 2030 Vanguard’s Target Retirement Funds are built upon two of the firm’s strong suits, index funds and rockbottom The funds’ glide path begins shifting to a higher fixed income weighting 25 years prior to retirement, earlier than most of the competition. The funds’ underlying equity holdings emphasize larger-cap stocks in developed markets, and the Morningstar Opinion 2.0 0.0 –2.0 Strategic Allocation 0.22 Avg Peers 4.0 0.0 –4.0 Subasset Class 0.68 Avg Peers 4.0 0.0 –4.0 Cost –0.37 Avg Peers 5.0 0.0 –5.0 Security Selection Avg Attribution Analysis Trailing 3 Year Returns 12-31-08 Morningstar Rating Top Above Average Average Below Average Bottom Key Features Average Annual Expense (%) 0.68 Active/Passive 100% Passive Open/Closed Architecture 100% Open Total Net Assets (Bil $) 25.14 Morningstar Style Box Ownership Zone Centroid: weighted average of family’s holdings, equal weighted by fund Zone: 75% of family’s holdings stock holdings High Growth Core Growth Blend Core Value Deep Value Giant Large Mid Small Micro Performance: XX Funds have fared relatively well recently due to Vanguard’s cautious asset allocation and the larger-cap, higher-quality bias of its index funds. Investments: XX Holdings include anguard’s index funds and its actively managed TIPS and Prime Money Market funds Structure: XX Index-based structure of underlying funds provides transparency. Vanguard’s approach to asset allocation is pragmatic, if more cautious than most. Stewardship: XX Backed by a strong board, clean regulatory history, and standout corporate culture. Manager ownership and disclosure of Vanguard’s compensation plan is wanting. Methodology for Attribution Analysis Best Selections Sector Weight Return Effect NordstromsXxxxxXxxxxXxxxxXxxx30 NordstromsXxxxxXxxxxXxxxxXxx30 00.00 000.00 000.00 Microsoft XxxxxXxxxxXxxxxXxxxxXxxxxXxx30 00.00 000.00 000.00 Dell XxxxxXxxxxXxxxxXxxxxXxxxxXxx30 00.00 000.00 000.00 Proctor & Gamble XxxxxXxxxxXxxxxXxxxxXxxxxXxx30 00.00 000.00 000.00 Blue Cross Blue Shield XxxxxXxxxxXxxxxXxxxxXxxxxXxx30 00.00 000.00 000.00 Johnson Controls XxxxxXxxxxXxxxxXxxxxXxxxxXxx30 00.00 000.00 000.00 Apple XxxxxXxxxxXxxxxXxxxxXxxxxXxx30 00.00 000.00 000.00 7 6 5 4 3 2 1 Page 1 of 1 | Calculated: 12-31-2009 | Printed: 12-31-2009 Portfolio Custom Named Portfolio Manager Analysis (client can name) Attribution Security Selection Effects 00-00-2009 to 00-00-2009 -10 -8 -6 -4 -2 0 2 4 10 6 1 3 9 8 2 Relative Weight % Underperform 10 5 0 -5 -10 Outperform – + + – Worst Selections NordstromsXxxxxXxxxxXxxxxXxxx30 Microsoft Dell Proctor & Gamble Blue Cross Blue Shield Johnson Controls Apple 7 6 5 4 3 2 1 10 9 6 5 3 1 20 19 18 17 16 15 14 13 12 11 20 17 14 10 5 4 2 Graham & Dodd Award Paul Kaplan 32 |
The CFA Institute recently awarded the Graham & Dodd Award to Paul Kaplan for his article on fundamental indexation.
We developed a methodology for attribution analysis, which now appears in Morningstar Direct.
We’ve seen significant investor interest in target-date funds. We’ve been developing some new research reports in this area that we’ll be introducing later this month.
|
Thought Leadership: Global Fund Research 75 Fund Analysts 3,300 Funds 33 |
Over the past several years, we have expanded our analyst coverage in fund markets outside of the United States. We’ve been working to build an integrated team of locally based fund experts who can help us develop a leadership position in additional markets around the world. We currently have 75 fund analysts globally and cover a total of 3,300 funds. We expect to significantly increase our analyst coverage on funds domiciled outside of the United States over the next several years.
|
Thought Leadership: Equity Research Institutional Equity Research Services IPO Research Services Research Reports Advisor Conference Calls Analyst Research Center Web Site Fundamental Analysis Economic Moat Rating Company Valuation Fair Value Estimate Uncertainty Assessment 34 |
Our approach to equity research is based on fundamental, bottom-up research. We offer this research through several different channels.
|
Equity Research: Life After GARS Expand reach with financial advisors Pursue sales opportunities with buy-side firms Pursue opportunities outside U.S. Monetize research by licensing products Bundled equity services (quotes, data, research, and filings) Integrate into software products Add to third-party platforms Independent research on IPOs 35 |
In 2003 and 2004, 12 leading Wall Street investment banks agreed to a $1.5 billion settlement (the Global Analyst Research Settlement) with the Securities and Exchange Commission (SEC), the New York Attorney General, and other securities regulators to resolve allegations of undue influence of investment banking interests on securities research. Approximately $450 million of the $1.5 billion in fines that the investment banks agreed to pay in the settlement has been designated for independent research over a period of five years, with the independent research to be provided by companies that are not engaged in the investment banking industry. Each firm involved in the settlement is required to provide research from at least three providers of independent research that are not engaged in the investment banking industry. The period covered by the Global Analyst Research Settlement will expire in July 2009. After the settlement period expires, the companies covered by it will no longer be required to provide independent investment research to their clients. For further discussion about this issue, see Item 1A — Risk Factors in our 10-K report for the year ended December 31, 2008.
The period covered by the Global Analyst Research Settlement will expire at the end of July. We expect our equity research revenue to decline significantly beginning in the second half of the year.
We remain strongly committed to equity research as part of our long-term growth strategy and plan to maintain broad coverage after the settlement period ends, although we may need to adjust our coverage and staffing levels based on client demand.
Plans for monetizing equity research include:
· Expand reach with financial advisors
· Continue to pursue sales opportunities with buy-side firms
· Pursue opportunities outside the United States
· Continue to monetize research by licensing investment products based on our equity research
· Continue to integrate equity research in our major software platforms
· Add our research to third-party distribution platforms
· Provide independent research on IPOs prior to and immediately following their listings
· Create bundled equity services including real-time quotes, fundamental equity data, analyst research, and company filings
|
Strategy: Create Premier Global Investment Database Funds Stocks Capital Markets/ Indexes Real-Time Quotes Alternatives Variable Annuities Pension and Life Documents People Hemscott Equities Indexes Futures Options Commodities Precious Metals Foreign Currencies Treasury Markets Fund Flows TD Glide Path Data Global Doc Library Hungary Phillipines Poland South Africa Thailand Turkey United Arab Emirates 36 |
The circles at the top show our major investment database categories. Earlier this year we added data on fund flows as well as glide path data for target-date funds.
The glide path measures how a target-date fund’s asset mix changes over time—typically allocating less to equities and more to fixed-income securities as it approaches the target date.
We also added new fund databases in several markets, real-time quotes through our acquisition of Tenfore Systems, and new data on investment filings, ownership, and managers and directors.
|
Global Investment Database Growth in Database Coverage 145,000 05 190,000 06 265,000 07 300,000 08 125,000 04 Funds Stocks Capital Markets/ Indexes Real-Time Quotes Alternatives Variable Annuities Pension and Life Documents People 37 |
We currently have comprehensive data on more than 300,000 investments globally, as well as real-time market data on an additional 4 million securities. Over the past five years we’ve more than doubled our database coverage.
|
Morningstar Target Risk Indexes Morningstar Lifetime Allocation Indexes Global Investment Database: Indexes Style Sector Dividend Bond Commodity Focus 38 |
Over the past several years, we’ve developed a series of proprietary investment indexes that leverage our investment data. The Morningstar Indexes are rooted in our proprietary research and can be used for precise asset allocation and benchmarking and as tools
for portfolio construction and market analysis.
We recently launched a new family of 13 Lifetime Allocation Indexes and five Target Risk Indexes.
|
Strategy: Expand Internationally 2,370 Morningstar Employees 82 Canada 1,080 U.S. 378 Europe 127 Australia/NZ 532 Asia 160 India 10 South Africa 39 |
A bit more than half of our employees are outside the United States. We have large offshore data centers in China and India, and also have operations in other major markets around the world. We currently have operations in 19 countries plus minority ownership positions in three other countries.
|
Expand Internationally: Acquisitions --InvestData Hemscott Fundamental Data Tenfore Systems Andex C.P.M.S. 40 |
Several of our recent acquisitions have expanded our international operations.
|
Expand Internationally -Revenue by Region ($mil) Australia Japan Europe Asia Canada $ 25.4 05 07 08 04 06 14.1% $ 29.4 $ 44.3 $ 89.7 $ 121.4 13.0% 14.0% 20.6% 24.2% % of total 41 |
Here you can see revenue by region over the past five years. Overall, international revenue made up a bit less than one-fourth of our consolidated revenue in 2008.
|
2008 Acquisitions Hemscott Data, media, and investor relations Web site businesses $s51.3 mil Financial Computer Support A leading provider of practice management software for independent advisors $ss4.9 mil Fundamental Data Limited A leading provider of data on closed-end funds in the United Kingdom $s18.6 mil 10-K Wizard A leading provider of SEC EDGAR filing research and alert services $s11.5 mil Tenfore Systems Global provider of real-time market data and financial data workstations based in the United Kingdom $s19.2 mil InvestData A leading provider of fund information in South Africa not disclosed 42 |
We made six acquisitions in 2008, which was a record number for us:
· Hemscott data, media, and investor relations Web site businesses
· Financial Computer Support
· Fundamental Data Limited
· 10-K Wizard
· Tenfore Systems
· InvestData
|
2009 Acquisitions Global Financial Filings Database Business from Global Reports A leading provider of online financial and Corporate and Social Responsibility (CSR) reports for publicly traded companies around the world not disclosed Equity Research and Data Businesses of C.P.M.S. Tracks fundamental equity data for approximately 4,000 securities in the United States and Canada and brokerage earnings estimates for Canadian stocks C$16.1 mil Andex Associates, Inc. A leading provider of financial communications materials in Canada not disclosed 43 |
We’ve made three acquisitions so far this year:
· The global financial filings database business from Global Reports
· The equity research and data businesses of C.P.M.S.
· Andex Associates, Inc.
|
Slide Title 32 Advisors Individuals Institutions 44 |
Let me wrap things up by offering a few thoughts on the current environment. We have definitely been facing some major headwinds, and we know we’ll face more challenges with the expiration of the Global Analyst Research Settlement period in July as well as the loss of two Investment Consulting contracts we’ve previously disclosed.
The entire financial landscape has gone through a period of severe disruption, leading to greater industry consolidation and pricing constraints. Given the severe disruption in asset management and other areas of financial services, we expect to see continued volatility and noise in business trends in the short term.
Many investors have essentially lost a decade’s worth of accumulated wealth because of the severe market downturn. We’ve also seen an industry-wide decline in investor confidence and trust.
While all of that might sound pretty bleak, we think investors need independent research, data, and tools now more than ever, and I believe we remain well-positioned to help investors reach their goals.
For the past 25 years, we’ve maintained a laser-like focus on our mission of helping investors. I’d like to thank all of our employees for the work they’ve done in helping build our company and making Morningstar a great place to work. We really are passionate about helping investors, and we’ll continue to look for opportunities to help investors and the advisors and institutions that serve them around the globe.
|
0 100000 200000 300000 400000 500000 600000 70% 4. Operating Metrics ($000) 250 300 Institutional Segment Bars 70% 80% +16% 07 08 07 08 07 08 $435.1 $502.5 $117.3 $139.1 $101.0 $103.9 ($mil) +19% +3% +20% -5 0 Revenue Operating Income Free Cash Flow* Morningstar, Inc. 2008 Annual Report 1 * Reconciliation of Non-GAAP Measure with the Nearest Comparable GAAP Measure Organic revenue (illustrated in a previous slide) is considered a non-GAAP measure. Reconciliation from consolidated revenue to revenue excluding acquisitions and foreign currency translations (organic revenue): 2006 2007 2008 Q1 Q2 Q3 Q4 Q1 Q2 Q3 Q4 Q1 Q2 Q3 Q4 Consolidated revenue $ 70,060 $ 76,257 $ 81,821 $ 87,037 $ 95,447 $109,685 $111,859 $118,116 $125,444 $132,237 $125,505 $119,271 Less: acquisitions (4,420) (6,756) (11,640) (13,619) (12,154) (13,002) (10,208) (8,862) (11,098) (4,876) (4,732) (6,419) (Favorable)/unfavorable 177 (208) (328) (435) (397) (552) (875) (1,984) (2,281) (3,085) (271) 3,787 impact of foreign currency translations Revenue excluding $ 65,817 $ 69,294 $ 69,854 $ 72,984 $ 82,896 $ 96,131 $100,776 $107,270 $112,065 $124,276 $120,502 $116,639 acquisitions and foreign currency translations Consolidated revenue growth — — — — 36% 44% 37% 36% 31% 21% 12% 1% Less: acquisitions (17%) (17%) (12%) (10%) (12%) (4%) (4%) (5%) Less: impact of foreign — — — — (1%) (1%) (1%) (2%) (2%) (3%) — 3% currency Revenue growth — — — — 18% 26% 23% 23% 17% 13% 8% (1%) excluding acquisitions and foreign currency translations (organic revenue) (1) (1) Sum of percentages may not match total because of rounding. 45 |
This slide reconciles the organic growth rate shown earlier (a non-GAAP measure) to consolidated revenue.
|
Financial Highlights Scott Cooley Chief Financial Officer 46 |
|
Consolidated Income Statement Year ended Dec. 31 ($000, except per share amounts) 2008 2007 change Revenue $s502,457 $s435,107 15.5 Operating expense $s363,338 $s317,853 14.3 Operating income $s139,119 $s117,254 18.6 Operating margin 27.7 26.9 0.8pp Net income $ss92,532 $ss73,922 25.2 Diluted income per share $ssns1.88 $ssss1.53 22.9 Weighted average common shares outstanding (diluted) 49,213 48,165 2.2 47 |
We had relatively strong results in 2008. Revenue was up 15.5%, and with operating expense rising at a lower rate, our operating margin expanded by about 0.8 percentage points.
|
Individual Segment $23.7 $27.8 17.0 Operating Income ($mil) 07 08 Share of Consolidated Revenue* 21.4 *Revenue for our three segments totals more than 100 because it excludes eliminations aof intersegment revenue. Revenue ($mil) $97.3 $107.6 10.6 07 08 Morningstar Reach / Worldwide Individual Investors 6.5 mil / 227.1 mil 48 |
The individual segment made up about 21% of consolidated revenue in 2008. Revenue rose 10.6% and operating income was up 17%. We currently reach about 6.5 million individual investors globally, out of an estimated market size of roughly 227 million. So we believe we still have ample room to expand with this audience.
|
Advisor Segment Share of Consolidated Revenue* 25.4 *Revenue for our three segments totals more than 100 because it excludes eliminations aof intersegment revenue. 07 08 Revenue ($mil) $115.7 $127.6 10.2 Operating Income ($mil) 07 08 $31.7 $36.8 16.2 Morningstar Reach / Worldwide Financial Advisors 260,000 / 1.3 mil 49 |
The advisor segment represented about one-fourth of consolidated revenue in 2008. Revenue rose 10% and operating income was up 16%. We currently reach about 260,000 financial advisors globally, compared with an estimated market size of approximately 1.3 million. We have a strong presence in this area but believe we still have room to expand, particularly in markets outside the United States.
|
Institutional Segment Share of Consolidated Revenue* 55.1 *Revenue for our three segments totals more than 100 because it excludes eliminations aof intersegment revenue. 07 08 Revenue ($mil) $230.3 $276.8 20.2 $76.7 Operating Income ($mil) 07 08 $91.7 19.6 Morningstar Reach / Worldwide Institutions 3,300 / 16,000 50 |
The institutional segment makes up more than half of our revenue base. Revenue was up 20% in 2008, partly because of incremental revenue from acquisitions, and operating income was up nearly the same amount. We currently reach about 3,300 institutions globally, out of an estimated market size of roughly 16,000.
|
2009 Operating Structure: Investment Information Licensed Data Advisor Workstation Morningstar.com Principia Morningstar Direct Morningstar Equity Research Financial Communications and Publications Real-Time Data Indexes Fund Research 51 |
Now let’s look at our financial results under the new segment structure.
Here are some of the key products in our Investment Information segment.
|
Investment Information Revenue ($mil) 34.7 06 19.3 07 08 $ 327.4 $ 390.7 $ 243.1 33.0 Operating Income ($mil) 06 07 08 $ 114.9 $ 138.9 $ 86.4 20.8 52 |
Revenue was up about 19% in this segment in 2008, while operating income rose at a slightly faster pace. Because of the tough market environment, though, these growth rates were lower than those we saw in 2007.
|
2009 Operating Structure: Investment Management Investment Consulting Retirement Advice Morningstar Managed Portfolios 53 |
These are the three main products in the Investment Management segment.
|
Investment Management Revenue ($mil) 49.4 06 3.7 07 08 $ 107.7 $ 111.8 $ 72.1 72.2 Operating Income ($mil) 06 07 08 $ 55.4 $ 60.4 $ 32.2 9.0 54 |
We had lower growth rates in this segment because of the market downturn in 2008, which had a direct impact on our assets under advisement as well as revenue tied to asset-based fees.
|
Sources of Revenue in 2008 A$000 of total Organic revenue* $ 473,482 94.2 Acquisitions $ 27,125 5.4 Foreign currency $ 1,850 0.4 Total $ 502,457 100.0 *Organic revenue is considered a non-GAAP financial measure. Please see slide at the end of the presentation xfor reconciliation to consolidated revenue. 55 |
Although we made numerous acquisitions in 2008, about 94% of our revenue for the year was organic. Acquisitions contributed about 5% of the total, and we enjoyed a slight benefit from foreign currency translations.
|
Retention and Renewal Rates Renewal (contract-based products) 05 07 06 100–105 95–100 95–100 08 90–95 Retention (subscription-based products) 60–65 05 07 06 08 60–65 65–70 60–65 56 |

In 2008, we estimate that our retention rate for subscription-based products, such as Principia, Morningstar.com Premium Membership service, and print and online newsletters, averaged between 60% and 65%, down from 65% to 70% in 2007.
For contract-based products and services, we estimate that our weighted average renewal rate was on the low end of the range between 90% and 95% and was down about 6 percentage points from our renewal rate in 2007.
The decline in renewal rates in 2008 was largely driven by lower assets in Investment Consulting and, to a smaller extent, a lower renewal rate for Advisor Workstation in the latter part of the year. The figure for contract-based products includes the impact of price changes and changes to the contract value upon renewal, as well as changes in the value of variable-fee contracts.
|
Top Five Products 2008 Revenue ($000) of Revenue Licensed Data (Institutional) $ 78,329 15.6 Investment Consulting (Institutional) $ 77,757 15.5 Advisor Workstation (Advisor) $ 66,675 13.3 Morningstar.com (Individual) $ 43,274 8.6 Principia (Advisor) $ 27,791 5.5 Total $ 293,826 57 |
The order of our top five products changed a bit during 2008. Licensed Data became our largest product because of strong organic growth as well as additional revenue from acquisitions, while Investment Consulting moved down to become the second largest.
|
Significant Operating Leverage Operating margin % 20.5% 24.6% 26.9% 27.7% 9.9% Operating income ($000) $ 17,735 $ 46,480 $ 77,527 $ 117,254 $ 139,119 05 06 07 08 04 Revenue ($000) $ 179,658 $ 227,114 $ 315,175 $ 435,107 $ 502,457 58 |

We’ve often talked about the operating leverage that we believe is inherent in our business, and that has led to growth in operating income and operating margin over the past five years.
|
Free Cash Flow* Capital expenditures ($ 7,451) ($ 4,722) ($ 11,346) ($ 48,519) ($ 7,730) Cash provided by operating activities $ 48,445 $ 98,677 $ 112,368 $ 152,446 $ 32,862 05 06 07 08 04 $ 25,132 $ 40,994 $ 93,955 $ 101,022 $ 103,927 $000 *Free Cash Flow is considered a non-GAAP financial measure under SEC regulations. 59 |
Free cash flow in 2008 was about on par with 2007 levels. We had significantly higher capital expenditures in 2008 compared with previous years because of our new corporate headquarters in Chicago.
|
Solid Balance Sheet Consolidated balance sheet data ($000) as of Dec. 31, 2008 as of Dec. 31, 2007 Cash, cash equivalents, and investments $s297,577 $s258,588 Working capital $s180,295 $s149,723 Total assets $s803,940 $s649,307 Deferred revenue $s130,270 $s129,302 Long-term liabilities $ss34,967 $ss23,166 Total shareholders’ equity $s535,532 $s408,303 60 |

We had about $297 million in cash, cash equivalents, and investments as of December 31, 2008 and no bank debt.
Deferred revenue—which in some ways is a good measure of future revenue trends because it includes revenue we expect to recognize in future periods—was up about 1% in 2008.
|
First Quarter 2009 Key Metrics Operating Income ($mil) 09 08 $ 34.7 $ 34.6 –0.2 *Free Cash Flow is considered a non-GAAP financial measure under SEC regulations. Free Cash Flow* ($mil) 09 08 ($ 12.9) ($ 5.3) –142.1 09 08 Revenue ($mil) $ 125.4 $ 116.7 –6.9 61 |
The first quarter was a challenging one. Organic revenue continued to decline sequentially. We saw the rate of decline level off to some extent within the first quarter and more stabilization in some areas, but other areas remained volatile. Still, we believe we responded effectively to the overall market conditions and global economic weakness. We implemented several cost-savings measures in the first quarter of 2009, and were able to keep operating income nearly flat compared with the prior-year period despite the lower revenue.
|
Cost Savings Measures for Q1 2009 Category Change from Q1 08 ($mil) Bonus expense ($ss7.3) 401(k) match ($ss2.8) Advertising and marketing ($ss2.3) Travel, training, and conferences ($ss0.8) 62 |
Although we had some incremental expense from acquisitions in the first quarter, we took several steps in January to better align our cost structure with revenue in the challenging business environment. Bonus expense decreased $7.3 million in the quarter, primarily because we changed the structure of our bonus plan. We also suspended matching contributions to our 401(k) plan in the United States, reducing operating expense by about $2.8 million. Advertising and marketing costs declined by $2.3 million in the first quarter of 2009 compared with the same period a year ago, primarily because of reduced spending for direct mail campaigns for books and newsletters, including the three investing guides we’re no longer publishing. Travel costs were about $0.8 million lower, in part because we cancelled the annual global sales forum we usually hold in the first quarter.
|
Sources of Revenue in Q1 2009 A$000) of total) Organic revenue* $ 116,501) 99.8) Acquisitions $ 5,928) 5.1) Foreign currency ($ 5,697) (4.9) Total $ 116,732) 100) *Organic revenue is considered a non-GAAP financial measure. Please see slide at the end of the presentation xfor reconciliation to consolidated revenue. 63 |
We had about $6 million in revenue from acquisitions in the first quarter of 2009. In contrast to previous periods, foreign currency movements had a negative impact on our results as the U.S. dollar strengthened. This unfavorable impact essentially offset the additional revenue from acquisitions.
|
First Quarter 2009 Balance Sheet Consolidated balance sheet data ($000) as of March 31, 2009 as of Dec. 31, 2008 * Cash, cash equivalents, and investments $s286,019 $s297,577 Working capital $s213,057 $s180,295 Total assets $s775,606 $s803,940 Deferred revenue $s133,071 $s130,270 Long-term liabilities $ss33,296 $ss34,570 Total equity $s564,311 $s535,929 *Restated to reflect adoption of SFAS 160. 64 |
Our cash balance declined slightly in the first quarter, but we still had about $286 million in cash, cash equivalents, and investments as of March 31, 2009. Deferred revenue was up about 2% from year-end levels.
|
Potential Uses of Cash Balance sheet strength acquisitions organic expansion dividend stock buyback 65 |
We try to use our cash balance in ways that will maximize value over the long term. In addition to maintaining a strong balance sheet, there are several other potential areas we could deploy cash. We like to live within our means and use our cash flow to enhance the company’s value by making acquisitions or for organic expansion. If we reached a point where we did not see enough opportunities in the first two categories, we would consider more active discussion at the board level of other uses of cash, such as a dividend or stock buyback.
|
Organic revenue (illustrated in a previous slide) is considered a non-GAAP measure. The tables below reconcile consolidated revenue with organic revenue (revenue excluding acquisitions and the impact of foreign currency translations): ($000) 2008 Consolidated revenue $ 502,457 Less: acquisitions (27,125) Less: impact of foreign currency translations (1,850) Organic revenue $ 473,482 Three months ended March 31 ($000) 2009 Consolidated revenue $ 116,732 Less: acquisitions (5,928) Unfavorable impact of foreign currency 5,697 Organic revenue $ 116,501 Sources of Revenue in Q1 09 Sources of Revenue in 2008 Reconciliation of Non-GAAP Measures with the Nearest Comparable GAAP Measure * 66 |
This slide reconciles the organic growth rates shown earlier (a non-GAAP measure) to consolidated revenue.
|
Ibbotson Associates Peng Chen President 67 |

|
Morningstar’s Growth Strategies Focus on three platforms Become a global leader in funds of funds Create premier global database Expand internationally Continue building thought leadership NEW NEW 68 |
Ibbotson fits in with two of Morningstar’s growth strategies:
· Become a global leader in funds of funds, and
· Continue to build thought leadership, especially on asset allocation and multi-asset solutions
|
Ibbotson Capital Markets Manager Selection Portfolio Construction Advice VA BD Institutions DB International MF DC Asset Allocation Capability Investors Brand Operations 69 |

At Ibbotson, we serve our clients by leveraging three main areas:
· Our capability on asset allocation, manager selection, portfolio construction, as well as risk management
· Efficient operations
· Trust and respected brand
|
Revenue Fixed Fee Variable Fee Rev. $ Mil 40 30 20 10 $16.0 $12.5 $8.5 $18.7 $19.3 $5.2 $3.4 $4.4 $13.7 $31.2 $35.3 $7.8 2006 (10 Months) 2007 2008 2009 (Q1 Only) 70 |
Our revenue has grown nicely over the past three years, but we have been facing more headwinds in the second half of 2008 and so far in 2009, especially on our variable-fee businesses, where revenue is based on assets under advisement or assets under management.
|
Sources of Revenue in 2008 Broker-Dealer 2.8 Defined Contribution 15.0 Variable Annuity 11.9 Mutual Fund 3.7 International .8 $ Mil Total 35.3 Other 1.1 71 |
Looking at the different areas, defined contribution and variable annuities are the biggest channels of our business both in terms of number of clients and revenue.
|
Market Size by Channel 2009 (US) AUM $ Trillion 10 8 6 4 $9.4 $9.1 $1.2 $1.4 Source: FRC/Ibbotson Ibbotson AUM $ Billion $10.0 Bil $3.3 $30.0 $1.8 Broker/Dealer Defined Contribution Variable Annuity Mutual Fund 72 |
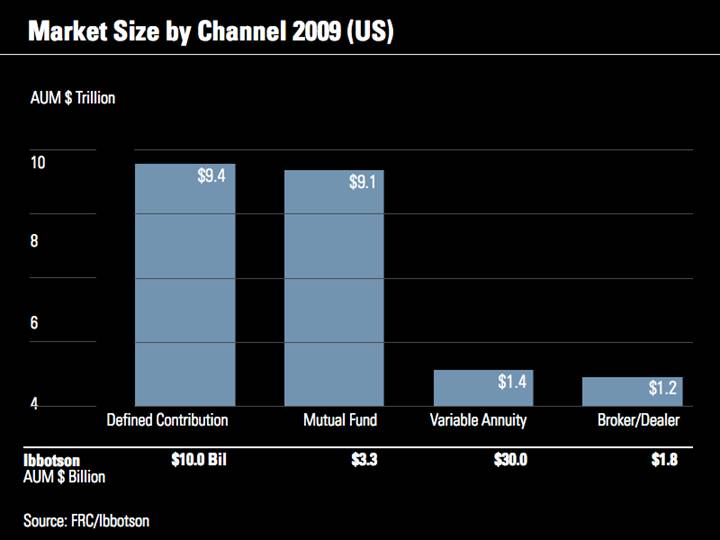
Although we had some nice growth, we are only representing a very small fraction of the market. With asset allocation and multi-asset solutions becoming increasingly popular, we feel that we are in good position to further grow.
|
Market Trends Shift from defined benefit plans to defined contribution plans Convergence of investment and insurance products Commission-based to fee-based Globalization 73 |
These are some of the major market trends we see. We have focused our business strategy around these trends.
|
Strategy: Shift from DB to DC Plans Text 74 |
One of the trends we see is the move from defined benefit to defined contribution plans. To grow in this market, we rely on the unique strength of Ibbotson, which is leveraging our research abilities to develop new and innovative solutions.
|
Strategy: Shift from DB to DC Plans 75 |
In the defined contribution market, we’ve been able to roll out industry-leading methodology on target-date funds as well as managed retirement accounts. We’ve signed on several clients in this area.
|
Strategy: Convergence of Investment and Insurance Products 76 |
The other trend we see is the convergence of traditional investment and insurance products. We have been doing research on how to combine these two types of products in an investor’s portfolio and have been awarded a patent on this methodology.
|
Strategy: Convergence of Investment and Insurance Products 77 |
Using our patented methodology, we have rolled out solutions with two of the largest insurance companies.
|
Strategy: Commission-Based to Fee-Based 78 |
The third trend we are seeing is advisors moving away from a commission-based into a fee-based model. Advisors need more turn-key multi-asset solutions. We have rolled out several different types of multi-asset solutions with different broker-dealer platforms.
|
Strategy: Globalization 79 |
The fourth trend we see is globalization. Many of the trends we see in the United States will also apply to other parts of the world. Many of the solutions we build can be modified and adopted for financial intermediaries in other areas.
|
Strategy: Globalization 80 |
Ultimately, we are in the business of helping investors improve their investment risk and return through partners we work with. That is our focus. We work hard every day on this goal, and to see some of the fruits of our work, such as a recent Financial Times award given to one of the wealth managers we work with, is especially satisfying.
|
Ibbotson Capital Markets Manager Selection Portfolio Construction Advice VA BD Institutions DB International MF DC Asset Allocation Capability Investors Brand Operations 81 |
Going forward, we plan to continue focusing on these areas:
· expand and improve our capabilities
· make our operations more efficient
· build thought leadership and brand
· serve investors through our partners
|
Morningstar.com Kunal Kapoor President, Individual Software 82 |

|
Morningstar.com Timeline 00 03 09 08 96 83 |

Here’s a brief overview of the site’s history and growth, as well as some key events, such as introducing sites in many global markets.
|
Morningstar.com Timeline 96 00 03 09 Morningstar.net launches 08 84 |
|
Morningstar.com Timeline 96 00 03 09 Morningstar.net launches 08 85 |
|
Morningstar.com Timeline 96 00 03 09 Launch International sites 08 86 |
|
Morningstar.com Timeline 96 00 03 09 Launch International sites 08 87 |
|
Morningstar.com Timeline 00 03 09 100,000 Premium Members 08 96 88 |
|
Morningstar.com Timeline 00 03 09 100,000 Premium Members 08 96 89 |
|
Morningstar.com Timeline 00 03 08 09 Morningstar.com Redesign 96 90 |
|
Morningstar.com Timeline 00 03 08 09 Morningstar.com Redesign 96 91 |
|
Morningstar.com Timeline 00 03 08 09 Canadian Redesign 96 92 |
|
Morningstar.com Timeline 00 03 08 09 Canadian Redesign 96 93 |
|
Our Customers Premium Free Registered members 168,257 5.8 Mil Visit site daily 53% 26% Gender ratio 84% Male 82% Male Avg. household income $s157,000 $s124,000 Avg. portfolio size* $s816,000 $s548,000 Avg. age 54 50 Retired 28% 25% Graduate degree 51% 43% Source: Nielsen NetRatings 2008. *Avg. portfolio size source: Morningstar.com 94 |
Our customers come from a desirable demographic—they are wealthy, highly educated, and frequent users of the site.
|
Competitors: Unique Visitors 5,000 3,750 2,500 1,250 Jan 08 Feb 08 Mar 08 Apr 08 May 08 Jun 08 Jul 08 Aug 08 Sep 08 Oct 08 Nov 08 Dec 08 Jan 09 Feb 09 Mar 09 The Street.com Motley Fool Morningstar.com 95 |
We trail a number of our key rivals when we look at unique visitors. We’re working on improving this and believe it highlights the potential growth opportunity if we execute well in upcoming years.
|
Competitors: Unique Visitors 15,000 11,250 7,500 3,750 Jan 08 Feb 08 Mar 08 Apr 08 May 08 Jun 08 Jul 08 Aug 08 Sep 08 Oct 08 Nov 08 Dec 08 Jan 09 Feb 09 Mar 09 AOL The Street.com Motley Fool Morningstar.com 96 |
|
Competitors: Unique Visitors 30,000 22,500 15,000 7,500 0 Jan 08 Feb 08 Mar 08 Apr 08 May 08 Jun 08 Jul 08 Aug 08 Sep 08 Oct 08 Nov 08 Dec 08 Jan 09 Feb 09 Mar 09 Yahoo Finance AOL Morningstar.com The Street.com Motley Fool 97 |
|
Competitors: Time Spent on Site 5.00 3.75 2.50 1.25 Jan 08 Feb 08 Mar 08 Apr 08 May 08 Jun 08 Jul 08 Aug 08 Sep 08 Oct 08 Nov 08 Dec 08 Jan 09 Feb 09 Mar 09 Yahoo Finance AOL The Street.com Motley Fool 98 |
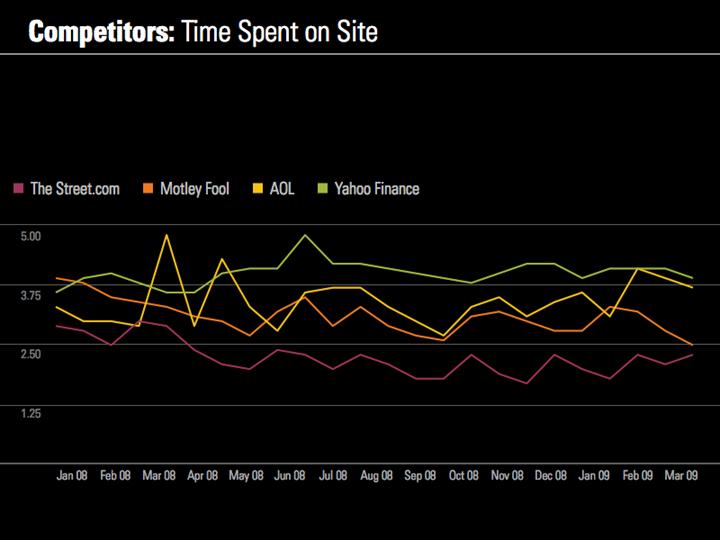
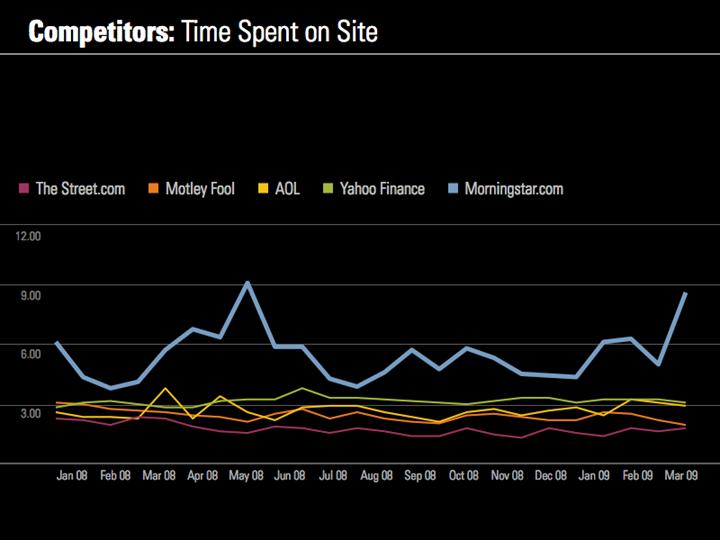
One area we excel is time spent on the site. The typical visitor to our site spends much more time on our site than on competitors’ sites. This is a big plus for advertisers.
|
Competitors: Time Spent on Site 12.00 9.00 6.00 3.00 Jan 08 Feb 08 Mar 08 Apr 08 May 08 Jun 08 Jul 08 Aug 08 Sep 08 Oct 08 Nov 08 Dec 08 Jan 09 Feb 09 Mar 09 Yahoo Finance AOL Morningstar.com The Street.com Motley Fool 99 |
|
Premium Membership Growth 200,000 150,000 100,000 50,000 Premium Members 1Q ‘99 1Q ‘00 1Q ‘01 1Q ‘02 1Q ‘03 1Q ‘04 1Q ‘05 1Q ‘06 1Q ‘07 1Q ‘08 1Q ’09 100 |
Our membership growth has been steady, experiencing a minor hiccup during the bursting of the tech bubble and a more serious challenge recently with the ongoing recession.
|
Premium Membership Growth 200,000 150,000 100,000 50,000 Premium Members 1Q ‘99 1Q ‘00 1Q ‘01 1Q ‘02 1Q ‘03 1Q ‘04 1Q ‘05 1Q ‘06 1Q ‘07 1Q ‘08 1Q ’09 101 |
|
Revenue Mix (US) 6,000,000 12,000,000 18,000,000 24,000,000 30,000,000 01 02 03 04 05 06 07 08 Premium Ad Sales 30 Mil 24 Mil 18 Mil 28% 72% 25% 75% 23% 77% 26% 74% 29% 71% 29% 71% 31% 69% 31% 69% 1Q 2009 $9.1 Mil 22.35% 77.65% 102 |
Typically, our revenue mix has been approximately two-thirds from Premium subscriptions and the remainder from advertising sales. However, in years such as this one, when ad sales contract, we expect that Premium will garner a larger share of revenue.
|
Market Data Portfolio Manager Tools and Content Discuss Portfolio Sharing 103 |
There are a number of popular and heavily trafficked areas of our site, including our Portfolio Manager and fund and stock reports. We recently launched a new ETF screener, performance charts, and a portfolio sharing feature. With the latter, users’ portfolios are given a star rating after being compared to those of professionals.
|
Report Snapshot Tools and Content ETF Screener Performance Charts 104 |
|
Site Usability Site Performance Operational Initiatives Marketing Solutions 105 |
We have recently been spending much time on improving site speed and eliminating clutter. We are also increasingly working with advertisers on complete marketing packages versus simply selling banner ads.
|
Growth Initiatives Global Expansion Search Engine Optimization Syndication Third-Party Content 106 |
We have a myriad of growth opportunities, but our key ones include expanding our business outside the U.S., further optimizing the site for search engines, increasing our syndication efforts, and opening up our site to more third-party content.
|
Global Footprint Chile Portugal Iceland Brazil Ireland Estonia Liechtenstein Lithuania South Africa Latvia Russia Czech Republic Poland Luxembourg Hungary Upcoming Site Launches 107 |
We have sites in a number of countries already and plan to expand that footprint more aggressively in the near future.
|
Search Engine Optimization 662% Increase Since May 2007 May 07 Apr 09 May 07 Jul 07 Sep 07 Nov 07 Jan 08 Mar 08 May 08 Jul 08 Sep 08 Nov 08 Jan 09 Mar 09 Organic Search Referrals 1,100,000 825,000 550,000 275,000 108 |
We’ve had much success with our search engine optimization efforts as evidenced by the strong growth in search referrals.
|
Syndication 109 |
These are some of our key syndication partners.
|
Mobile App 110 |
We recently launched an iPhone application and plan to continue expanding in the mobile market.
|
The death of the individual investor has been greatly exaggerated. 111 |
While individual investors are certainly wounded, they have prematurely been written off. We continue to expect continued engagement and involvement with them in the years to come, with the opportunity to grow our business by helping them reach their goals.