Table of Contents
Filed Pursuant to Rule 424(b)(1)
Registration No. 333-115297
PROSPECTUS

QC Holdings, Inc.
5,000,000 Shares
Common Stock
We are selling 5,000,000 shares of common stock. This is the initial public offering of our common stock. Prior to this offering, there has been no public market for our shares.
We are a leading provider of payday loans in the United States. As of March 31, 2004, we operated 295 payday loan stores in 21 states.
Our common stock has been approved for quotation on The Nasdaq Stock Market’s National Market under the symbol “QCCO.”
Investing in our common stock involves risks. See “Risk Factors” beginning on page 8.
Neither the Securities and Exchange Commission nor any state securities commission has approved or disapproved of these securities or determined if this prospectus is truthful or complete. Any representation to the contrary is a criminal offense.
| Per Share | Total | |||||
Public offering price | $ | 14.00 | $ | 70,000,000 | ||
Underwriting discounts and commissions | $ | 0.98 | $ | 4,900,000 | ||
Proceeds, before expenses, to us | $ | 13.02 | $ | 65,100,000 | ||
Four of our directors or executive officers have granted the underwriters a 30 day option to purchase up to an aggregate of 750,000 additional shares of common stock on the same terms as set forth above to cover over-allotments, if any. All of the shares to be sold upon the exercise of the over-allotment option are to be sold by the selling stockholders. The selling stockholders will only sell shares in this offering if the underwriters exercise their over-allotment option. We will not receive any proceeds from the sale of shares by the selling stockholders.
The underwriters expect to deliver the shares to purchasers on or about July 21, 2004.
Ferris, Baker Watts Incorporated | JMP Securities |
The date of this prospectus is July 15, 2004
Table of Contents
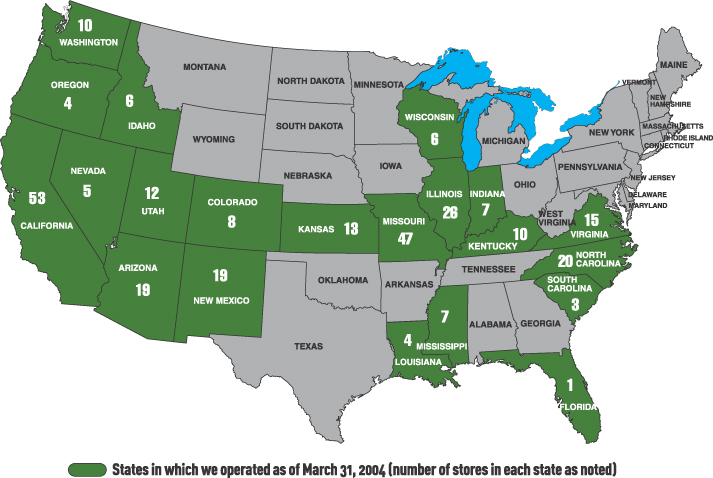
Table of Contents
This summary does not contain all of the information that you should consider before investing. We encourage you to read this entire prospectus, including the “Risk Factors” section and the financial statements and related notes, before deciding to invest in our common stock. All references to our fiscal year reflect the twelve-month period ended December 31 of that year. All references to non-financial operating statistics are as of March 31, 2004, unless the context indicates otherwise. Unless otherwise indicated, the information in this prospectus gives effect to a 10 for 1 stock split effectuated as a stock dividend during our second quarter 2004.
Our Company
We are a leading provider of payday loans in the United States. We operate 295 stores in 21 states. Payday loan revenues constituted approximately 87% of our total revenue in fiscal year 2003 and in the three months ended March 31, 2004. We believe that our customers are typically middle-income, working individuals who use our services because they find them to be a convenient source for small, short-term loans. We focus on payday loans because of the strong customer demand for them. We also offer additional services in our stores, such as check cashing, title loans, money orders and money transfers.
We have 20 years of experience operating retail consumer finance businesses. We entered the payday loan industry in 1992, and we believe that we were one of the first companies to offer the payday loan product in the United States. We have served the same customer base since 1984, beginning with a rent-to-own business and continuing with check cashing services in 1988. We sold our rent-to-own stores in 1994. Several of our executives and senior managers have worked in all levels of our stores. Through this direct, store-level experience, we learned first-hand which products, services and practices were successful. We also learned the importance of creating personal relationships with customers and providing store managers with discretion, under corporate supervision, to determine how best to reach and serve customers in their markets.
From January 1, 1999 to March 31, 2004, we grew from 48 stores to 295 stores through a combination of acquisitions and new store openings. During this period, we opened 137 new stores, acquired 137 stores and closed 27 stores. Comparable store revenue and gross profit growth for stores open at least 24 months were 17% and 31%, respectively, for the year ended December 31, 2003. Our revenue and store gross profit for the year ended December 31, 2003 were $98.5 million and $36.1 million, respectively.
Industry Background
The payday loan industry began its rapid growth in 1996 when there were an estimated 2,000 payday loan stores in the United States. According to the Community Financial Services Association of America (CFSA) and the investment banking firm Stephens Inc., the industry has grown to approximately 22,000 payday loan stores in 2003, generating over $40 billion in annual loan volume. The growth of the payday loan industry has followed the increased acceptance of payday lending by state legislatures. Since 1996, the number of jurisdictions with legislation permitting or not prohibiting payday loans has grown from 6 states to 35 states and the District of Columbia. Each of these jurisdictions now regulates the payday loan business in some form, including licensure requirements, compliance examinations and lending regulations. We believe that the payday loan industry is fragmented and has only 10 companies operating more than 150 stores. We estimate that these 10 companies operate approximately 7,000 stores.
We believe consumers use payday loans for a variety of reasons. A survey by the Credit Research Center at the McDonough School of Business at Georgetown University found that 70% of payday loan customers surveyed who considered other sources of credit use payday loans for reasons of convenience, while only 6% of those payday loan customers use payday loans because they had no other alternative.
1
Table of Contents
Competitive Strengths
We believe that the following competitive strengths position us well for growth:
Management Team with Significant Industry and Company Experience. Our management team has significant experience in the payday loan industry and other retail consumer finance businesses. In addition, they have extensive operating experience as a result of working at all levels of our stores. We believe that this store-level experience has been critical to our outstanding store performance.
Customer Service and Respect. We believe that customer loyalty results from treating customers in a positive, respectful manner and by providing quick and efficient service.
Lending Policy. We believe that our lending policies allow us to efficiently generate loan volume, enabling new stores to become profitable within six months of opening. For the year ended December 31, 2003, our stores generated an average of more than $350,000 of annual revenue and our highest-revenue store generated approximately $1.5 million in revenues.
Significant Role of Our Store Managers. We reward store managers for the success of their stores. We also encourage store managers to share with us the methods that bring them success. We believe that these practices encourage store managers to implement company strategies at the store level.
Balance Sheet Flexibility. Immediately after the closing of this offering, we will have no debt. With cash flow from operations and the net proceeds from this offering, we will be poised to grow through the opening of new stores and opportunistic acquisitions. In addition, we will have the ability to leverage our assets to further grow the company.
Business Strategies
Our primary objective is to increase our profits by expanding our payday lending business and increasing comparable store revenues and gross profit. To accomplish this, we:
Focus on Payday Loans. Our primary focus is to provide the most efficient payday loan services available. We deemphasize low-margin ancillary services, such as bill payments, and concentrate on payday lending.
Pursue De Novo Store Growth. Since 1998, we have grown from 48 stores in five states to 295 stores in 21 states, partly through opening 137 new, or de novo, stores. We believe that through de novo growth we can achieve a strong return on capital due to our new store economics.
Seek Opportunistic Acquisitions. Since 1998, we have acquired 137 stores. Our experience integrating acquired stores has taught us how to leverage our current management structure.
Promote Operational Excellence. Our company-wide Operational Excellence program, which we developed in 2002, is designed to refine operational procedures and improve our internal processes. This program has become part of our culture and continues to foster improvements to our systems and procedures.
Challenges
We face challenges in executing our business strategies. Among the most important we face are:
Regulation. The payday loan industry is highly regulated. Changes in laws governing payday loans, consumer protection or general lending practices may negatively affect our payday loan operations.
2
Table of Contents
Loss of Key Personnel. Our success depends to a large degree upon the continued services of our senior managers. If we lose these senior managers, our operating results could suffer.
Employee Turnover. We experience high turnover among our store-level employees and in our store managers, which increases our operating costs and interferes with implementation of our store operating strategies.
Litigation and Regulatory Actions. The payday lending industry is sometimes the subject of state regulatory actions that result from new interpretations of existing laws. Should any state in which we operate change its historical interpretations of existing laws that permit our operation, our operating results could suffer.
Please see “Risk Factors” beginning on page 8 for information on these and other risks related to our business and this offering.
Company Information
Our principal executive offices are located at 2812 West 47th Avenue, Kansas City, Kansas 66103, and our telephone number is (913) 439-1100. Our website address is www.qcholdings.com. Our website and the information contained on our website are not incorporated into this prospectus or the registration statement of which it forms a part.
3
Table of Contents
The Offering
Common stock offered by QC Holdings, Inc. | 5,000,000 shares |
Common stock to be outstanding after this offering | 20,371,000 shares |
Use of proceeds | We intend to use the net proceeds from this offering to retire all existing debt, to fund growth through the opening of de novo stores and through acquisitions and to fund working capital requirements. |
Listing | Our common stock has been approved for quotation on The Nasdaq Stock Market’s National Market under the symbol “QCCO.” |
We effectuated a 10 for 1 stock split in the form of a stock dividend during our second quarter 2004. All references to shares and per share data in this prospectus reflect the stock split and exclude 1,650,500 shares of common stock issuable upon exercise of outstanding options, at a weighted average price of $2.20 per share and exclude 430,000 shares of common stock issuable upon the exercise of stock options that we granted immediately prior to the effectiveness of the registration statement of which this prospectus forms a part at an option exercise price equal to the price per share in this offering.
The underwriters have an option to purchase up to 750,000 additional shares of our common stock from four of our directors or executive officers to cover over-allotments, if any. We will not receive any of the proceeds from the sale of shares by these selling stockholders. Except as otherwise indicated, the information in this prospectus assumes no exercise of the underwriters’ over-allotment option.
Each trademark, trade name or service mark of any other company or person appearing in this prospectus belongs to its holder or holders.
4
Table of Contents
Summary Financial Data
We derived the following historical financial information from our audited consolidated financial statements as of December 31, 2002 and December 31, 2003 and for each of the years in the three-year period ended December 31, 2003 and our unaudited consolidated financial statements as of and for the three months ended March 31, 2004, and for the three months ended March 31, 2003, which are included elsewhere in this prospectus, and our audited consolidated financial statements as of and for the years ended December 31, 1999 and December 31, 2000 and as of December 31, 2001, which are not included in this prospectus. The as adjusted balance sheet data give effect to this offering and the use of proceeds as if they occurred at March 31, 2004. The unaudited consolidated financial statements include all adjustments, consisting of normal recurring adjustments, which we consider necessary for a fair presentation of the financial position and the results of operations for these periods. Operating results for the three months ended March 31, 2004 are not necessarily indicative of the results that may be expected for the entire year ending December 31, 2004. This table should be read together with the information contained in “Management’s Discussion and Analysis of Financial Condition and Results of Operations” and our audited and unaudited consolidated financial statements and related notes included elsewhere in this prospectus. The information provided below gives effect to a 10 for 1 stock split, which was effectuated as a stock dividend during our second quarter 2004.
| Year Ended December 31, | Three Months Ended March 31, | |||||||||||||||||||||||||||
| 1999 | 2000 | 2001 | 2002 | 2003 | 2003 | 2004 | ||||||||||||||||||||||
| (Dollars in thousands, except per share and Operating Data) | ||||||||||||||||||||||||||||
| (Unaudited) | ||||||||||||||||||||||||||||
Statement of Income Data: | ||||||||||||||||||||||||||||
Total revenues | $ | 18,629 | $ | 39,308 | $ | 60,283 | $ | 70,907 | $ | 98,494 | $ | 21,263 | $ | 28,183 | ||||||||||||||
Total store expenses | 11,351 | 26,746 | 40,753 | 47,120 | 62,402 | 13,677 | 15,247 | |||||||||||||||||||||
Store gross profit | 7,278 | 12,562 | 19,530 | 23,787 | 36,092 | 7,586 | 12,936 | |||||||||||||||||||||
Other expenses | 4,293 | 5,967 | 9,807 | 10,906 | 13,446 | 3,094 | 4,129 | |||||||||||||||||||||
Income before taxes | 2,985 | 6,595 | 9,723 | 12,881 | 22,646 | 4,492 | 8,807 | |||||||||||||||||||||
Provision for income taxes | 1,029 | 2,520 | 3,826 | 5,046 | 8,722 | 1,726 | 3,556 | |||||||||||||||||||||
Net income | $ | 1,956 | $ | 4,075 | $ | 5,897 | $ | 7,835 | $ | 13,924 | $ | 2,766 | $ | 5,251 | ||||||||||||||
Earnings (loss) per share (1): | ||||||||||||||||||||||||||||
Basic | $ | (0.21 | ) | $ | 0.04 | $ | 0.31 | $ | 0.41 | $ | 0.41 | $ | (0.13 | ) | $ | 0.34 | ||||||||||||
Diluted | (0.21 | ) | 0.04 | 0.31 | 0.41 | 0.39 | (0.13 | ) | 0.32 | |||||||||||||||||||
Shares used to calculate earnings (loss) per share: | ||||||||||||||||||||||||||||
Basic | 16,666,129 | 18,915,000 | 18,915,000 | 18,915,000 | 15,934,673 | 18,915,000 | 11,688,010 | |||||||||||||||||||||
Diluted | 16,666,129 | 18,991,998 | 19,036,641 | 19,256,263 | 16,436,429 | 19,381,398 | 12,347,417 | |||||||||||||||||||||
Cash dividends per share | $ | 0.03 | $ | 0.06 | ||||||||||||||||||||||||
Operating Data: | ||||||||||||||||||||||||||||
Stores (at end of period) | 122 | 176 | 204 | 258 | 294 | 270 | 295 | |||||||||||||||||||||
Percentage increase in comparable total store revenues from prior period (3) | 64.7 | % | 8.1 | % | 24.9 | % | 4.1 | % | 16.6 | % | 14.4 | % | 25.2 | % | ||||||||||||||
Payday loans: | �� | |||||||||||||||||||||||||||
Number of loan transactions — new loans and refinances | 443 | 778 | 1,194 | 1,381 | 1,878 | 393 | 519 | |||||||||||||||||||||
Loan volume (in thousands) | $ | 85,610 | $ | 204,169 | $ | 327,334 | $ | 398,494 | $ | 590,071 | $ | 119,441 | $ | 168,848 | ||||||||||||||
Average loan | 193.42 | 262.29 | 274.21 | 288.53 | 314.14 | 303.97 | 325.28 | |||||||||||||||||||||
Average fee | 26.06 | 37.47 | 40.89 | 44.11 | 47.76 | 46.36 | 49.29 | |||||||||||||||||||||
Loss Data: | ||||||||||||||||||||||||||||
Provision for losses as a percentage of revenues | 16.2 | % | 17.4 | % | 24.6 | % | 21.1 | % | 21.6 | % | 18.2 | % | 13.5 | % | ||||||||||||||
5
Table of Contents
| As of December 31, | As of March 31, 2004 | ||||||||||||||||||||
| 1999 | 2000 | 2001 | 2002 | 2003 | Actual | As Adjusted (2) | |||||||||||||||
| (Dollars in thousands) | |||||||||||||||||||||
| (Unaudited) | |||||||||||||||||||||
| Balance Sheet Data: | |||||||||||||||||||||
Cash and cash equivalents | $ | 5,650 | $ | 6,003 | $ | 8,851 | $ | 7,991 | $ | 9,497 | $ | 10,238 | $ | 50,688 | |||||||
Loans receivable, net of allowance | 8,004 | 16,855 | 19,438 | 26,619 | 35,933 | 30,184 | 30,184 | ||||||||||||||
Total assets | 17,884 | 31,503 | 40,607 | 51,045 | 64,929 | 62,481 | 102,731 | ||||||||||||||
Current debt | 953 | 9,796 | 5,319 | 8,893 | 10,974 | 4,546 | |||||||||||||||
Liability for mandatory stock redemption | 17,000 | 17,000 | |||||||||||||||||||
Long-term debt | 5,696 | 5,666 | 10,942 | 7,771 | 18,880 | 18,744 | |||||||||||||||
Shares subject to redemption | 7,000 | 11,000 | 11,000 | 11,000 | |||||||||||||||||
Stockholders’ equity | 2,743 | 2,851 | 8,754 | 16,665 | 9,333 | 14,035 | 94,575 | ||||||||||||||
| (1) | Basic earnings (loss) per share is computed using the two-class method by dividing income available to common stockholders by the weighted average number of common shares outstanding during the period. Diluted earnings (loss) per share is computed giving effect to all dilutive potential common shares that were outstanding during the period. The effect of stock options represents the only differences between the weighted average shares used for the basic earnings per share computation compared to the diluted earnings per share computation. |
The following table presents the computations of basic and diluted earnings per share for the periods presented.
| Year Ended December 31, | Three Months Ended March 31, | ||||||||||||||||||||||||
| 1999 | 2000 | 2001 | 2002 | 2003 | 2003 | 2004 | |||||||||||||||||||
| (Dollars in thousands, except per share data) | |||||||||||||||||||||||||
| (Unaudited) | |||||||||||||||||||||||||
Net income | $ | 1,956 | $ | 4,075 | $ | 5,897 | $ | 7,835 | $ | 13,924 | $ | 2,766 | $ | 5,251 | |||||||||||
Less: reduction to retained earnings in connection with shares subject to redemption | 5,483 | 3,292 | 5,296 | 5,296 | |||||||||||||||||||||
Less: dividend and participation rights associated with mandatory stock redemption (a) | 2,162 | 1,242 | |||||||||||||||||||||||
Income (loss) available to common stockholders | $ | (3,527 | ) | $ | 783 | $ | 5,897 | $ | 7,835 | $ | 6,466 | $ | (2,530 | ) | $ | 4,009 | |||||||||
Weighted average number of actual common shares outstanding | 16,666,129 | 18,915,000 | 18,915,000 | 18,915,000 | 18,137,718 | 18,915,000 | 15,308,110 | ||||||||||||||||||
Reduction in weighted average shares associated with mandatory stock redemption (a) | (2,203,045 | ) | (3,620,100 | ) | |||||||||||||||||||||
Weighted average number of common shares outstanding | 16,666,129 | 18,915,000 | 18,915,000 | 18,915,000 | 15,934,673 | 18,915,000 | 11,688,010 | ||||||||||||||||||
Incremental shares from assumed conversion of stock options | 76,998 | 121,641 | 341,263 | 501,756 | 466,398 | 659,407 | |||||||||||||||||||
Weighted average number of diluted common shares outstanding | 16,666,129 | 18,991,998 | 19,036,641 | 19,256,263 | 16,436,429 | 19,381,398 | 12,347,417 | ||||||||||||||||||
Basic earnings (loss) per share | $ | (0.21 | ) | $ | 0.04 | $ | 0.31 | $ | 0.41 | $ | 0.41 | $ | (0.13 | ) | $ | 0.34 | |||||||||
Diluted earnings (loss) per share | (0.21 | ) | 0.04 | 0.31 | 0.41 | 0.39 | (0.13 | ) | 0.32 | ||||||||||||||||
6
Table of Contents
Basic and diluted earnings (loss) per share computations are adjusted to reflect our obligation to purchase shares from two principal stockholders, Don Early and Gregory L. Smith, upon their death pursuant to our stockholders agreement with them. Under generally accepted accounting principles, for purposes of computing income available to common stockholders in the earnings per share calculations, we are required to include as a reduction to net income the increase in the carrying amount of the shares subject to redemption that is charged directly to retained earnings in any given period. Accordingly, we reduced net income available to common stockholders by $5.5 million in 1999, $3.3 million in 2000, $5.3 million in 2003 and $5.3 million for the three months ended March 31, 2003, to reflect the amount charged directly to retained earnings associated with this obligation. Pursuant to the stockholders agreement, we maintain insurance policies with respect to these two stockholders that will cover the entire share repurchase obligation. The stockholders agreement has been terminated effective June 30, 2004. Upon the termination of the stockholders agreement and related liability for mandatory stock redemption, the computation for earnings per share will no longer require the various adjustments associated with the shares subject to mandatory redemption as described herein.
| (a) | As set forth in Statement of Financial Accounting Standards No. 150 (SFAS 150), Accounting for Certain Financial Instruments with Characteristics of Both Liabilities and Equity, which we adopted on July 1, 2003, the shares considered to be subject to redemption under the stockholders agreement are excluded from weighted average shares for purposes of computing basic and diluted earnings per share. The number of shares excluded will vary based on the change in the market price from period to period. Further, SFAS 150 requires that the portion of net income representing dividend and participation rights associated with the mandatory stock redemption be removed from income available to common stockholders pursuant to the two-class method set forth by Statement of Financial Accounting Standards No. 128,Earnings per Share. |
| (2) | The unaudited as adjusted balance sheet data as of March 31, 2004 gives effect to this offering and the application of a portion of the net proceeds thereof for the repayment of outstanding indebtedness, as well as the termination of the stockholders agreement during second quarter 2004, which removed the liability for mandatory stock redemption and increased stockholders’ equity by $17 million. |
| (3) | Comparable stores are stores which are open during the full periods for which a comparison is being made. For example, comparable stores for the quarterly analysis as of March 31, 2004 are those stores opened for at least 15 months on such date, and comparable stores for the annual analysis as of December 31, 2003 are those stores opened for at least 24 months on such date. |
7
Table of Contents
An investment in our common stock involves a high degree of risk. Before you decide whether to purchase the common stock offered by this prospectus, you should carefully consider these risk factors, as well as the other information contained in this prospectus. If any of these risks actually occur, our business, results of operations and financial condition could be significantly and negatively affected. This could cause the trading price of our common stock to decline, perhaps significantly.
Risks Related to Our Business
The payday loan industry is highly regulated under both federal and state laws. Changes in laws governing consumer protection and lending practices may negatively affect our business.
The financial services we offer are highly regulated and subject to supervision by various state and federal agencies. The payday loan industry in particular is highly regulated. There are 35 states that have either adopted specific laws regulating payday loans, such as laws setting maximum fees that a customer may be charged, or do not have laws that preclude or make unprofitable payday lending. In the remaining states, state usury laws, general small loan laws or other consumer credit laws preclude payday loans. Other regulations that may govern or affect payday lending include licensing requirements, filing and posting of fees, truth in lending, zoning restrictions, permitting requirements, currency transaction and other reporting requirements, and privacy of personal financial information. Failure to comply with any of these regulatory requirements could result in penalties, damages and refunds of fees.
Future legislation or regulations may restrict or prohibit payday lending and may have a negative effect on our business. For example, a law prohibiting payday loans was recently enacted in Georgia. States may also seek to impose new licensing requirements, reduce permissible fees or interpret or enforce existing requirements in new ways.
If we lose key managers or are unable to attract and retain the talent required for our business, our operating results could suffer.
Our future success depends to a significant degree upon the members of our senior management, particularly Don Early, our Chairman of the Board of Directors and Chief Executive Officer, Mary Lou Andersen, our Vice Chairman of the Board, and Darrin J. Andersen, our President and Chief Operating Officer. We believe that our corporate culture and success are tied directly to the influence of Mr. Early and Ms. Andersen. Mr. Andersen has also been critical to our growth through acquisitions and new store openings. Accordingly, we believe that the loss of the services of any of these individuals could adversely affect our business. Our continued growth will also depend upon our ability to attract and retain additional skilled management personnel. Competition for highly-skilled and experienced management is intense and likely to continue and increase. To the extent that we are unable to attract and retain the talent required for our business, our operating results could suffer.
Potential litigation and regulatory actions directed toward our industry could adversely affect our operating results, particularly in a limited number of key states.
During the last few years, we and our competitors have been subject to regulatory proceedings, class action lawsuits and other litigation regarding the offering of payday loans. For instance, we and other payday lenders operated and were licensed in Indiana under a state law that was generally interpreted to permit payday loans. In January 2000, the Indiana Attorney General issued an opinion that this statute did not allow payday lending. Following the issuance of this opinion, we were sued in two class action lawsuits alleging violations of this statute as interpreted by the Attorney General. We settled the lawsuits for an aggregate of approximately $1.0 million in 2001. In addition, we materially reduced operations in Indiana for approximately eight months, until the law was amended to permit payday lending. During this time, we incurred approximately $1.0 million of operating losses from our Indiana stores. Future interpretations of state law in other jurisdictions similar to that of the Indiana Attorney General could have an adverse impact on our ability to offer payday loans in those states.
8
Table of Contents
Revenues from our stores located in Missouri, California, Illinois and New Mexico represented in excess of 60% of our total revenues for the year ended December 31, 2003. Revenues from Missouri and California represented 24% and 17%, respectively, of our total revenues for the year ended December 31, 2003. To the extent that laws are passed that affect our ability to offer payday loans or the manner by which we offer payday loans in any one of those states, our business could be adversely affected.
We could suffer losses from interpretations of state laws regulating any of our other financial services, including check cashing and title loans. Regulatory actions taken with respect to one financial service that we offer could negatively affect our ability to offer other financial services. For example, if we were the subject of regulatory action related to our check cashing, title loans or other products, that regulatory action could adversely affect our ability to maintain our licenses for payday lending. Moreover, the suspension or revocation of our license or other authorization in one state could adversely affect our ability to maintain licenses in other states. Accordingly, a violation of a law or regulation in otherwise unrelated products or jurisdictions could affect other parts of our business and adversely affect our business and operations as a whole.
Our operations in North Carolina are dependent on County Bank. If the FDIC or the state of Delaware restricts County Bank from participating in the payday loan business, our operating results could suffer.
Because North Carolina’s usury laws prevent us from operating there without a bank relationship, we entered into an arrangement with County Bank, a Delaware state chartered bank. Under this arrangement, we provide various services in connection with the bank’s origination of payday loans through our North Carolina stores, and we purchase from the bank a participation interest in those loans. During 2003, approximately 4% of our revenues were earned under this arrangement. North Carolina is the only state in which we presently use this so-called “bank model,” and we are using County Bank exclusively in that state for this purpose. In many other states, laws render the use of the bank model necessary or advantageous to payday lenders. The bank model is, however, subject to federal and state banking regulations. Under the bank model, a state chartered bank makes a payday loan from its offices outside the borrower’s state. The bank model is typically used where the borrower’s state limits the availability of payday loans. Under generally accepted legal principles, the state chartered bank may “export” the interest rate permitted by the state in which it is domiciled on loans made to consumers in other states, and the state where the consumer is located cannot impose its usury law on that loan. Only state chartered banks can take advantage of the bank model, because federal regulators have effectively prohibited national banks and federal savings associations from participating in the payday loan industry. States may attempt to regulate the use of the bank model and challenge the practice that permits the export of interest rates. For example, Georgia’s recent legislation prohibiting payday loans also prohibits the use of the bank model by payday lenders. Other states may pass legislation similar to Georgia’s, particularly if the Georgia legislation survives pending court challenges.
The Federal Deposit Insurance Corporation, or FDIC, is the primary federal regulator of County Bank. In July 2003, the FDIC issued guidance for banks operating in the payday loan industry. The FDIC sets limits on the dollar amount of payday loans County Bank is permitted to have outstanding at any time based on its capital. If the FDIC reduces these limits or restricts County Bank’s ability to continue its current arrangement with us, our ability to maintain or grow this portion of our business in states where we rely or intend to rely on the bank model could be significantly restricted. County Bank is also subject to FDIC inspection and authority, and, as a result of our arrangement with County Bank, we too are subject to such inspection and authority.
The state of Delaware is the state regulator of County Bank. If the state of Delaware were to order County Bank to cease or significantly curtail its payday lending services, our revenues derived from our arrangement with County Bank in North Carolina would be adversely affected.
In addition, we may become subject to litigation or regulatory proceedings focusing on our relationship with County Bank. If we were to be characterized as the lender of these County Bank loans, then the interest charged for these loans would violate North Carolina’s usury laws. Any resulting refunds or penalties we would likely
9
Table of Contents
incur could significantly affect our results of operations. In addition, states could challenge the validity of our arrangement with County Bank. For example, although we do not offer payday loans in New York, recently the New York State Attorney General’s office filed a lawsuit against County Bank and the companies servicing its payday loans in New York challenging the validity of their arrangement in New York. Our arrangement with County Bank requires us to indemnify County Bank against the costs of these types of regulatory challenges to its arrangement with us.
In the future, we may expand into additional states utilizing the bank model. Regulatory changes in existing state laws could require or make advantageous a transition to the bank model.
Media reports and public perception of payday loans as being predatory or abusive could adversely affect our business.
Over the past few years, consumer advocacy groups and certain media reports have advocated governmental action to prohibit or severely restrict payday loans. The consumer groups and media reports typically focus on the cost to a consumer for this type of loan, which is higher than the interest typically charged by credit card issuers. This difference in credit cost is more significant if a consumer does not promptly repay the loan, but renews, or rolls over, that loan for one or more additional short-term periods. The consumer groups and media reports typically characterize these payday loans as predatory or abusive toward consumers. If this negative characterization of our payday loans becomes widely accepted by consumers, demand for our payday loans could significantly decrease, which could adversely affect our results of operations and financial condition.
Negative perception of our payday loans or other activities could also result in our being subject to more restrictive laws and regulations. For example, in recent state legislative sessions dozens of bills have been introduced to restrict or prohibit payday lending. Additionally, negative perception influences local zoning and other approvals necessary to open de novo stores.
Regular turnover among our store managers and store-level employees makes it more difficult for us to operate our stores and increases our costs of operations.
We experience high turnover among our store-level employees and in our store managers. In 2003, we sustained approximately 52% turnover among our store managers and approximately 101% turnover among our store-level employees. Turnover interferes with implementation of store operating strategies. High turnover in the future would perpetuate these operating pressures and increase our operating costs and could restrict our ability to grow.
We lack product and business diversification. Accordingly, our future revenues and earnings are more susceptible to fluctuations than a more diversified company.
Our primary business activity is offering payday loans. We also provide certain related services, such as check cashing and title loans, which accounted for approximately 13% of our revenues in 2003 and first quarter of 2004. If we are unable to maintain and grow the operating revenues from our payday loan business, our future revenues and earnings are not likely to grow and could decline. Our lack of product and business diversification could inhibit the opportunities for growth of our business, revenues and profits.
Any disruption in the availability of our information systems could adversely affect operations at our stores.
We rely upon our information systems to manage and operate our stores and business. Each store is part of an information network that permits us to maintain adequate cash inventory, reconcile cash balances daily, report revenues and expenses timely and, in North Carolina, to access County Bank’s loan approval system. Our back-up systems and security measures could fail to prevent a disruption in the availability of our information systems. Any disruption in the availability of our information systems could adversely affect our operations and our results of operations.
10
Table of Contents
Our headquarters are located at a single location in Kansas City, Kansas. Our information systems and administrative and management processes are primarily provided to our regions and stores from this location, which could be disrupted if a catastrophic event, such as a tornado, power outage or act of terror, destroyed or severely damaged the headquarters. Any of these catastrophic events could adversely affect our operations and our results of operations.
Our business and results of operations may be adversely affected if we are unable to manage our growth effectively.
Our continued growth is dependent upon a number of factors, including the ability to hire, train and retain an adequate number of experienced managers and employees, the availability of good store locations, the availability of adequate financing for our expansion activities, the ability to obtain any government permits and licenses and other factors that are beyond our control. Expansion beyond the geographic areas where our stores are presently located will increase demands on management and divert their attention.
Further, acquisitions may entail numerous integration risks and impose costs on us, including:
| • | difficulties integrating a workforce that understands and implements our vision of customer service and our Operational Excellence program; |
| • | difficulties integrating acquired operations or services; |
| • | the risk of the loss of key employees from acquired businesses; |
| • | diversion of management’s attention from our core business; |
| • | dilutive issuances of our equity securities (to the extent used to finance acquisitions); |
| • | incurrence of indebtedness (to the extent used to finance acquisitions or de novo stores); |
| • | assumption of known and unknown contingent liabilities; |
| • | the potential impairment of acquired assets; and |
| • | incurrence of significant immediate write-offs. |
Further, we may not be successful in identifying attractive acquisitions or completing acquisitions on favorable terms. Our failure to integrate acquired stores could adversely affect our business.
Competition in the retail financial services industry is intense and could cause us to lose market share and revenues.
We believe that the primary competitive factors in the payday loan industry are store location and customer service. We face intense competition in the payday loan industry, and we believe that the payday lending market is becoming more competitive as this industry matures and begins to consolidate. The payday loan industry has low barriers to entry, and new competitors may enter the market easily. We currently compete with services, such as overdraft protection, offered by traditional financial institutions and with other payday loan and check cashing stores and other financial service entities and retail businesses that offer payday loans or other similar financial services. Some of our competitors have larger and more established customer bases and substantially greater financial, marketing and other resources than we have. As a result, we could lose market share and our revenues could decline, thereby affecting our earnings and potential for growth.
General economic conditions affect our loan losses, and accordingly, our results of operations could be adversely affected by a general economic slowdown.
Provision for losses is one of our largest operating expenses, constituting 21.6% of total revenues for the year ended December 31, 2003, and 13.5% of total revenues for the three months ended March 31, 2004, with
11
Table of Contents
payday loan losses constituting substantially all the losses. During each period, if a customer does not repay a payday loan when due and the check we present for payment is returned, all accrued fees, interest and outstanding principal are charged off as uncollectible, generally within 15 days after the loan was due. At the end of each period, management considers recent collection history to develop expected loss rates, which are used for the establishment of the allowance for loan losses. Any changes in economic factors that adversely affect our customers could result in higher loan loss experiences than anticipated, which could adversely affect our loan charge-offs and operating results.
If estimates of our loan losses are not adequate to absorb actual losses, our financial condition and results of operations may be adversely affected.
We maintain an allowance for loan losses at levels to cover the estimated incurred losses in the collection of our loan portfolio outstanding at the end of the applicable period. At the end of each period, management considers recent collection history to develop expected loss rates, which are used for the establishment of the allowance for loan losses. Our allowance for loan loss was $1.1 million on December 31, 2003 and $700,000 on March 31, 2004. Our allowance for loan losses is an estimate, and if actual loan losses are materially greater than our allowance for losses, our financial condition and results of operations could be adversely affected.
Because we maintain a significant supply of cash in our stores, we may experience losses due to employee error and theft.
Because our business requires us to maintain a significant supply of cash in our stores, we are subject to the risk of cash shortages resulting from employee errors and theft. We periodically experience employee error and theft in stores, which can significantly increase the operating expenses of those stores for the period in which the employee error or theft is discovered.
Risks Related to this Offering
Our executive officers, directors and principal stockholders may be able to exert significant control over our future direction.
After this offering, our executive officers, directors and principal stockholders will together control approximately 75% of our outstanding common stock. Don Early, our Chairman and Chief Executive Officer, alone will own approximately 45% of our common stock. The election of each director requires a plurality of the shares voting for directors at a meeting of stockholders at which a quorum is present. Approval of a significant corporate transaction, such as a merger or consolidation of the company, a sale of all or substantially all of its assets or a dissolution of the company, requires the affirmative vote of a majority of the outstanding shares of our common stock. Other actions requiring stockholder approval require the affirmative vote of a majority of the shares of common stock voting on the matter, provided that a quorum is present. A quorum requires the presence of a majority of the shares outstanding. As a result, one or more stockholders owning a relatively low percentage of the outstanding shares of our common stock could, acting together with Don Early, control all matters requiring our stockholders’ approval, including the election of directors and approval of significant corporate transactions. As a result, this concentration of ownership may delay, prevent or deter a change in control or change in board composition, could deprive our stockholders of an opportunity to receive a premium for their common stock as part of a sale of the company or its assets and might reduce the market price of our common stock.
Our quarterly results have fluctuated in the past and may fluctuate in the future. If they fluctuate in the future, the market price of our common stock could also fluctuate significantly.
Our quarterly results have fluctuated in the past and are likely to continue to fluctuate in the future. If they do so, our quarterly revenues and operating results may be difficult to forecast. It is possible that our future quarterly results of operations will not meet the expectations of securities analysts or investors. This could cause a material drop in the market price of our common stock.
12
Table of Contents
Our business will continue to be affected by a number of factors, any one of which could substantially affect our results of operations for a particular fiscal quarter. Our quarterly results of operations can vary due to:
| • | fluctuations in payday loan demand; |
| • | fluctuations in our loan loss experience; and |
| • | regulatory activity restricting our business. |
The price of our common stock after this offering may be lower than the offering price you pay and may be volatile.
Prior to this offering, our common stock has not been sold in a public market. After this offering, an active trading market in our common stock might not develop. If an active trading market develops, it may not continue. Moreover, if an active market develops, the trading price of our common stock may fluctuate widely as a result of a number of factors, many of which are outside of our control. In addition, the stock market has experienced extreme price and volume fluctuations that have affected the market prices of many companies. These broad market fluctuations could adversely affect the market price of our common stock. A significant decline in our stock price could result in substantial losses for individual stockholders and could lead to costly and disruptive securities litigation. If you purchase shares of our common stock in this offering, you will pay a price that was not established in a competitive market. Instead, you will pay a price that was negotiated with the representatives of the underwriters. The price of our common stock that will prevail in the market after this offering may be higher or lower than the offering price.
Future sales of shares of our common stock in the public market could depress our stock price and make it difficult for you to recover the full value of your investment.
Prior to this offering, there has been no public market for our common stock. We cannot predict the effect, if any, that market sales of shares of common stock or the availability of shares of common stock for sale will have on the market price of our common stock prevailing from time to time. If our existing stockholders sell substantial amounts of our common stock in the public market following this offering or if there is a perception that these sales may occur, the market price of our common stock could decline. All of the outstanding shares of common stock belonging to officers, directors and other stockholders are currently “restricted securities” under the Securities Act. Assuming the underwriters do not exercise their over-allotment option, after the lockup agreements pertaining to this offering expire 180 days from the date of this prospectus, unless earlier waived, up to 15,371,000 shares, and 1,491,250 shares issuable upon exercise of outstanding options will be eligible for future sale in the public market at prescribed times pursuant to Rule 144 under the Securities Act, or otherwise. This consists of all the outstanding shares of the company and all the options of the company then exercisable. Sales of a significant number of these shares of common stock in the public market could reduce the market price of our common stock.
The use of our common stock to fund acquisitions or to refinance debt incurred for acquisitions could dilute existing shares.
We intend to consider opportunities to acquire payday loan companies or businesses. We expect that future acquisitions, if any, could provide for consideration to be paid in cash, shares of our common stock, or a combination of cash and shares. If the consideration for an acquisition is paid in common stock, existing stockholders’ investments could be diluted. Furthermore, we may decide to incur debt to fund all or part of the costs of an acquisition and may later issue additional shares of common stock to reduce that debt or to provide funds for future acquisitions. The issuance of additional shares of common stock for those purposes would also dilute our existing stockholders’ investments.
Our anti-takeover provisions could prevent or delay a change in control of our company even if the change of control would be beneficial to our stockholders.
Provisions of our amended and restated articles of incorporation and amended and restated bylaws as well as provisions of Kansas law could discourage, delay or prevent a merger, acquisition or other change in control of
13
Table of Contents
our company, even if the change in control would be beneficial to our stockholders. These provisions include:
| • | authorizing the issuance of “blank check” preferred stock that could be issued by our board of directors without a stockholder vote to increase the number of outstanding shares and thwart a takeover attempt; |
| • | limitations on the ability of stockholders to call special meetings of stockholders; and |
| • | establishing advance notice requirements for nominations for election to the board of directors or for proposing matters that can be acted upon by stockholders at stockholder meetings. |
We will have broad discretion in how we use the proceeds of this offering, and we may not use these proceeds effectively. This could affect our profitability and cause our stock price to decline.
Our management will have considerable discretion in the application of the net proceeds of this offering, and you will not have the opportunity, as part of your investment decision, to assess whether we are using the proceeds appropriately. We intend to use a part of the net proceeds for repayment of indebtedness, and the balance for opening de novo stores, making acquisitions and funding future working capital requirements. We may use the net proceeds for corporate purposes that do not increase our profitability or our market value.
Investors will incur immediate and substantial dilution in the book value of their investment.
The initial public offering price of our common stock will be substantially higher than the net tangible book value per share of our outstanding common stock. If you purchase shares of our common stock, you will incur immediate and substantial dilution in the amount of $10.48 per share, based on the initial public offering price of $14.00 per share.
14
Table of Contents
This prospectus includes forward-looking statements regarding, among other things, our plans, strategies and prospects, both business and financial. All statements other than statements of current or historical fact contained in this prospectus are forward-looking statements. The words “believe,” “expect,” “anticipate,” “should,” “would,” “could,” “plan,” “will,” “may,” “intend,” “estimate,” “potential,” “continue” or similar expressions or the negative of these terms are intended to identify forward-looking statements.
We have based these forward-looking statements largely on our current expectations and projections about future events and financial trends that we believe may affect our financial condition, results of operations and business strategy. They can be affected by inaccurate assumptions, including the risks, uncertainties and assumptions described in “Risk Factors.” In light of these risks, uncertainties and assumptions, the forward-looking statements in this prospectus may not occur and actual results could differ materially from those anticipated or implied in the forward-looking statements. When you consider these forward-looking statements, you should keep in mind the risk factors and other cautionary statements in this prospectus.
Our forward-looking statements speak only as of the date they are made. We undertake no obligation to update or revise any forward-looking statements, whether as a result of new information, future events or otherwise.
15
Table of Contents
Net proceeds to us from this offering are approximately $63.7 million based on the sale of 5,000,000 shares at the initial offering price of $14.00 per share and after deducting the underwriting discount and estimated expenses of the offering payable by us. We intend to use approximately $24.4 million of the net proceeds from this offering to pay in full the balances of all of our indebtedness under our bank loans. The following table sets forth the payoff amount for each of these obligations as of May 31, 2004, along with the applicable interest rates and maturities:
Obligation | Payoff Amount | Interest Rate | Maturity | ||||
Revolving Credit Facility | $ | 4,006,328 | Prime plus 1% | Monthly interest payment plus repayment of all outstanding principal at maturity on October 31, 2004 | |||
Term Loan | 983,333 | Prime plus 1% | All principal and accrued interest due by March 1, 2019 | ||||
Term Loan | 7,830,398 | Prime plus 1% | Monthly principal payments of $147,744 plus interest through October 31, 2008 | ||||
Term Loan | 6,041,622 | Prime plus 1% | Monthly principal payments of $208,332 plus interest through October 31, 2006 | ||||
Subordinated Term Loan | 5,206,215 | 6% in year 1 8% in year 2 10% in year 3 | Due October 2006 | ||||
Subordinated Term Loan | 293,785 | 6% in year 1 8% in year 2 10% in year 3 | Due October 2006 | ||||
Total | $ | 24,361,681 | |||||
We incurred all the indebtedness described in the table above, other than the $1.0 million term loan in October 2003, (1) for working capital purposes, (2) to refinance then existing term loans with our senior lender, and (3) to finance the redemption of shares of our common stock for $15.0 million. We incurred the $1.0 million term loan in 2004 to finance the purchase of real estate.
Net proceeds from this offering after repayment of indebtedness are approximately $39.3 million. We intend to use this balance to fund future growth through the opening of de novo stores and opportunistic acquisitions and for future working capital requirements. As of the date of this prospectus, we have entered into fully executed leases for 22 de novo store locations and are actively negotiating leases for 52 additional de novo store locations. From time to time, we evaluate and consider potential acquisition candidates that may become available. We have no current plans, arrangements, or understandings related to any material acquisitions.
We will not receive any of the proceeds from the shares of common stock sold by the selling stockholders pursuant to the underwriters’ over-allotment option, if exercised.
16
Table of Contents
Currently, we have no dividend policy. All prior dividend decisions made by the board were made on the basis of facts and circumstances present at the relevant time. Immediately after the registration statement of which this prospectus forms a part was declared effective, four new members joined our board. The reconstituted board may adopt a dividend policy in the future.
We have paid dividends in the past. We paid an aggregate of $400,000 in dividends to our stockholders in 2003. We paid $3.1 million of dividends in 2004. We paid dividends in the fourth quarter of 2003 and the first two quarters of 2004 because we were a private company that had historically distributed none of our earnings to our stockholders. Recent changes in tax laws also made payment of cash dividends more attractive.
17
Table of Contents
The following table sets forth our capitalization as of March 31, 2004:
| • | on an actual basis, adjusted for the 10 for 1 split of our common stock effectuated as a stock dividend during our second quarter 2004; and |
| • | on an as adjusted basis to give effect to (1) the sale of shares of our common stock in this offering at the initial public offering price of $14.00 per share, (2) our intended application of the net proceeds, after consideration of underwriting discounts and commissions and offering expenses, (3) amendment to the Articles of Incorporation to increase the number of authorized shares and (4) the termination of the stockholders agreement effective June 30, 2004, which removed the liability for mandatory stock redemption and increased stockholders’ equity by $17 million. |
This table should be read together with “Selected Financial Data,” “Management’s Discussion and Analysis of Financial Condition and Results of Operations” and our consolidated financial statements and related notes included elsewhere in this prospectus.
| As of March 31, 2004 | ||||||||
| Actual | As Adjusted | |||||||
| (Dollars in thousands) | ||||||||
| (Unaudited) | ||||||||
Cash and cash equivalents | $ | 10,238 | $ | 50,688 | ||||
Debt: | ||||||||
Revolving credit facility | $ | 6 | $ | |||||
Subordinated unsecured notes due October 2006 | 7,500 | |||||||
Term loan due October 2006 | 6,458 | |||||||
Term loan due October 2008 | 8,126 | |||||||
Term loan due March 2019 | 1,000 | |||||||
Other | 200 | |||||||
Liability for mandatory stock redemption | 17,000 | |||||||
Total debt | 40,290 | |||||||
Stockholders’ equity: | ||||||||
Common stock, $0.01 par value, 30,000,000 shares authorized, 19,087,600 shares issued and 15,333,000 shares outstanding, actual; 75,000,000 shares authorized, 20,333,000 shares issued and outstanding, as | 191 | 203 | ||||||
Retained earnings | 25,643 | 25,443 | ||||||
Additional paid-in capital | 5,248 | 69,113 | ||||||
Treasury stock, 3,754,600 shares at cost, actual; 0 as adjusted | (16,863 | ) | ||||||
Notes received for equity | (184 | ) | (184 | ) | ||||
Total stockholders’ equity | 14,035 | 94,575 | ||||||
Total capitalization | $ | 54,325 | $ | 94,575 | ||||
| (1) | Excludes1,650,500 shares of our common stock reserved for issuance upon the exercise of options outstanding as of March 31, 2004 at a weighted average exercise price of $2.20 per share and excludes 430,000 shares of common stock issuable upon the exercise of stock options that we granted immediately prior to the effectiveness of the registration statement of which this prospectus forms a part at an option exercise price equal to the price per share in this offering. |
18
Table of Contents
The net tangible book value of our common stock on March 31, 2004 was $7.8 million, or approximately $0.51 per share. Net tangible book value per share represents the amount of our total tangible assets less total liabilities, divided by the number of shares of common stock outstanding. Dilution in net tangible book value per share represents the difference between the amount per share paid by purchasers of shares of our common stock in this offering and the net tangible book value per share of our common stock immediately afterwards. After giving effect to the sale of 5,000,000 shares at the initial public offering price of $14.00 per share and after deducting underwriting discounts and commissions and estimated offering expenses payable by us, our net tangible book value at March 31, 2004 would have been approximately $71.5 million, or $3.52 per share. This represents an immediate increase in net tangible book value of $3.01 per share to existing stockholders and an immediate dilution in net tangible book value of $10.48 per share to new investors purchasing shares of common stock in this offering. The following table illustrates this dilution on a per share basis:
Initial public offering price per share | $ | 14.00 | |||
Net tangible book value per share at March 31, 2004 | 0.51 | ||||
Increase per share attributable to this offering | 3.01 | ||||
As adjusted net tangible book value per share after this offering | 3.52 | ||||
Dilution per share to new investors | $ | 10.48 | |||
The following table summarizes, on an as adjusted basis, as of March 31, 2004, the total number of shares of our common stock, the total consideration paid and the average price per share paid by existing stockholders and by the new investors in this offering, calculated before deducting the underwriting discounts and commissions and estimated offering expenses:
| As of March 31, 2004 | ||||||||||||||
| Shares Purchased | Total Consideration | Average Price Per Share | ||||||||||||
| Number | Percent | Amount | Percent | |||||||||||
Existing Stockholders | 15,333,000 | 75.4 | % | $ | 1,932,238 | 2.7 | % | $ | 0.13 | |||||
New Investors | 5,000,000 | 24.6 | 70,000,000 | 97.3 | 14.00 | |||||||||
Total | 20,333,000 | 100.0 | % | $ | 71,932,238 | 100.0 | % | |||||||
The foregoing discussion and tables assume no exercise of outstanding options to purchase 1,650,500 shares of our common stock that are exercisable at a weighted average price of $2.20 per share. To the extent the outstanding options are exercised, there may be further dilution to new investors. The foregoing table also assumes no exercise of options to acquire 430,000 shares of common stock, which options we granted immediately prior to the effectiveness of the registration statement of which this prospectus forms a part at an option exercise price equal to the price per share in this offering.
19
Table of Contents
We derived the following historical financial information from our audited consolidated financial statements as of December 31, 2002 and December 31, 2003 and for each of the years in the three-year period ended December 31, 2003 and our unaudited consolidated financial statements as of and for the three months ended March 31, 2004 and for the three months ended March 31, 2003, which are included elsewhere in this prospectus, and our audited consolidated financial statements as of and for the years ended December 31, 1999 and December 31, 2000 and as of December 31, 2001, which are not included in this prospectus. The as adjusted balance sheet data give effect to this offering and the use of proceeds as if they occurred at March 31, 2004. The unaudited consolidated financial statements include all adjustments, consisting of normal recurring adjustments, which we consider necessary for a fair presentation of the financial position and the results of operations for these periods. Operating results for the three months ended March 31, 2004 are not necessarily indicative of the results that may be expected for the entire year ending December 31, 2004. This table should be read together with the information contained in “Management’s Discussion and Analysis of Financial Condition and Results of Operations” and our audited and unaudited consolidated financial statements and related notes included elsewhere in this prospectus. The information provided below gives effect to a 10 for 1 stock split, which was effectuated as a stock dividend during our second quarter 2004.
| Year Ended December 31, | Three Months Ended March 31, | |||||||||||||||||||||||
| 1999 | 2000 | 2001 | 2002 | 2003 | 2003 | 2004 | ||||||||||||||||||
| (Dollars in thousands, except per share and Operating and Loss Data) | ||||||||||||||||||||||||
| (Unaudited) | ||||||||||||||||||||||||
Statement of Income Data: | ||||||||||||||||||||||||
Revenues: | ||||||||||||||||||||||||
Payday loan fees | $ | 11,536 | $ | 29,169 | $ | 47,935 | $ | 59,006 | $ | 86,010 | $ | 17,559 | $ | 24,516 | ||||||||||
Other | 7,093 | 10,139 | 12,348 | 11,901 | 12,484 | 3,704 | 3,667 | |||||||||||||||||
Total revenues | 18,629 | 39,308 | 60,283 | 70,907 | 98,494 | 21,263 | 28,183 | |||||||||||||||||
Store expenses: | ||||||||||||||||||||||||
Salaries and benefits | 3,587 | 7,919 | 10,631 | 15,646 | 21,279 | 4,940 | 6,117 | |||||||||||||||||
Provision for losses | 3,017 | 6,822 | 14,827 | 14,943 | 21,293 | 3,873 | 3,797 | |||||||||||||||||
Occupancy | 2,696 | 5,873 | 7,520 | 8,509 | 10,862 | 2,696 | 3,014 | |||||||||||||||||
Depreciation and amortization | 167 | 388 | 559 | 952 | 1,397 | 266 | 366 | |||||||||||||||||
Other | 1,884 | 5,744 | 7,216 | 7,070 | 7,571 | 1,902 | 1,953 | |||||||||||||||||
Total store expenses | 11,351 | 26,746 | 40,753 | 47,120 | 62,402 | 13,677 | 15,247 | |||||||||||||||||
Store gross profit | 7,278 | 12,562 | 19,530 | 23,787 | 36,092 | 7,586 | 12,936 | |||||||||||||||||
Regional expenses | 1,267 | 2,791 | 4,340 | 4,949 | 5,613 | 1,399 | 1,820 | |||||||||||||||||
Corporate expenses | 1,524 | 1,715 | 3,397 | 4,815 | 6,324 | 1,373 | 1,791 | |||||||||||||||||
Depreciation and amortization | 540 | 415 | 944 | 241 | 538 | 81 | 132 | |||||||||||||||||
Interest expense | 948 | 1,008 | 1,210 | 879 | 936 | 216 | 356 | |||||||||||||||||
Other, net | 14 | 38 | (84 | ) | 22 | 35 | 25 | 30 | ||||||||||||||||
Income before taxes | 2,985 | 6,595 | 9,723 | 12,881 | 22,646 | 4,492 | 8,807 | |||||||||||||||||
Provision for income taxes | 1,029 | 2,520 | 3,826 | 5,046 | 8,722 | 1,726 | 3,556 | |||||||||||||||||
Net income | $ | 1,956 | $ | 4,075 | $ | 5,897 | $ | 7,835 | $ | 13,924 | $ | 2,766 | $ | 5,251 | ||||||||||
Earnings (loss) per share (1): | ||||||||||||||||||||||||
Basic | $ | (0.21 | ) | $ | 0.04 | $ | 0.31 | $ | 0.41 | $ | 0.41 | $ | (0.13 | ) | $ | 0.34 | ||||||||
Diluted | (0.21 | ) | 0.04 | 0.31 | 0.41 | 0.39 | (0.13 | ) | 0.32 | |||||||||||||||
Shares used to calculate earnings (loss) per share: | ||||||||||||||||||||||||
Basic | 16,666,129 | 18,915,000 | 18,915,000 | 18,915,000 | 15,934,673 | 18,915,000 | 11,688,010 | |||||||||||||||||
Diluted | 16,666,129 | 18,991,998 | 19,036,641 | 19,256,263 | 16,436,429 | 19,381,398 | 12,347,417 | |||||||||||||||||
Cash dividends per share | $ | 0.03 | $ | 0.06 | ||||||||||||||||||||
20
Table of Contents
| Year Ended December 31, | Three Months Ended March 31, | |||||||||||||||||||||||||||
| 1999 | 2000 | 2001 | 2002 | 2003 | 2003 | 2004 | ||||||||||||||||||||||
| (Dollars in thousands, except per share and Operating and Loss Data) | ||||||||||||||||||||||||||||
| (Unaudited) | ||||||||||||||||||||||||||||
Cash Flow Information: | ||||||||||||||||||||||||||||
Cash flows provided by (used for): | ||||||||||||||||||||||||||||
Operating activities | $ | 3,149 | $ | 4,954 | $ | 9,105 | $ | 10,968 | $ | 18,409 | $ | 2,651 | $ | 4,527 | ||||||||||||||
Investing activities | (6,124 | ) | (13,357 | ) | (7,063 | ) | (12,275 | ) | (14,391 | ) | 3,226 | 3,326 | ||||||||||||||||
Financing activities | 6,212 | 8,756 | 806 | 447 | (2,512 | ) | (3,426 | ) | (7,112 | ) | ||||||||||||||||||
Net increase (decrease) in cash and cash equivalents | $ | 3,237 | $ | 353 | $ | 2,848 | $ | (860 | ) | $ | 1,506 | $ | 2,451 | $ | 741 | |||||||||||||
Operating Data: | ||||||||||||||||||||||||||||
Stores (at end of period) | 122 | 176 | 204 | 258 | 294 | 270 | 295 | |||||||||||||||||||||
Percentage increase in comparable total store revenues from prior period (3) | 64.7 | % | 8.1 | % | 24.9 | % | 4.1 | % | 16.6 | % | 14.4 | % | 25.2 | % | ||||||||||||||
Payday loans: | ||||||||||||||||||||||||||||
Number of loan transactions — new loans and refinances (in thousands) | 443 | 778 | 1,194 | 1,381 | 1,878 | 393 | 519 | |||||||||||||||||||||
Loan volume (in thousands) | $ | 85,610 | $ | 204,169 | $ | 327,334 | $ | 398,494 | $ | 590,071 | $ | 119,441 | $ | 168,848 | ||||||||||||||
Average loan | 193.42 | 262.29 | 274.21 | 288.53 | 314.14 | 303.97 | 325.28 | |||||||||||||||||||||
Average fee | 26.06 | 37.47 | 40.89 | 44.11 | 47.76 | 46.36 | 49.29 | |||||||||||||||||||||
Loss Data: | ||||||||||||||||||||||||||||
Provision for losses as a percentage of revenues | 16.2 | % | 17.4 | % | 24.6 | % | 21.1 | % | 21.6 | % | 18.2 | % | 13.5 | % | ||||||||||||||
Allowance for Loan Losses: | ||||||||||||||||||||||||||||
Balance at beginning of period | $ | 98 | $ | 265 | $ | 565 | $ | 650 | $ | 750 | $ | 750 | $ | 1,090 | ||||||||||||||
Adjustment to provision for losses based on evaluation of outstanding receivables at year end | 167 | 300 | 85 | 100 | 340 | (210 | ) | (390 | ) | |||||||||||||||||||
Balance, at period end | $ | 265 | $ | 565 | $ | 650 | $ | 750 | $ | 1,090 | $ | 540 | $ | 700 | ||||||||||||||
Provision for Losses: | ||||||||||||||||||||||||||||
Charged-off to expense | $ | 5,956 | $ | 14,540 | $ | 26,705 | $ | 32,934 | $ | 45,665 | $ | 10,414 | $ | 11,156 | ||||||||||||||
Recoveries | (3,106 | ) | (8,018 | ) | (11,963 | ) | (18,091 | ) | (24,712 | ) | (6,331 | ) | (6,969 | ) | ||||||||||||||
Adjustment to provision for losses based on evaluation of outstanding receivables at period end | 167 | 300 | 85 | 100 | 340 | (210 | ) | (390 | ) | |||||||||||||||||||
Total provision for losses | $ | 3,017 | $ | 6,822 | $ | 14,827 | $ | 14,943 | $ | 21,293 | $ | 3,873 | $ | 3,797 | ||||||||||||||
| As of December 31, | As of March 31, 2004 | |||||||||||||||||||||||||||
| 1999 | 2000 | 2001 | 2002 | 2003 | Actual | As Adjusted (2) | ||||||||||||||||||||||
| (Dollars in thousands) | (Unaudited) | |||||||||||||||||||||||||||
Balance Sheet Data: |
| |||||||||||||||||||||||||||
Cash and cash equivalents | $ | 5,650 | $ | 6,003 | $ | 8,851 | $ | 7,991 | $ | 9,497 | $ | 10,238 | $ | 50,688 | ||||||||||||||
Loans receivable, net of allowance for losses | 8,004 | 16,855 | 19,438 | 26,619 | 35,933 | 30,184 | 30,184 | |||||||||||||||||||||
Total assets | 17,884 | 31,503 | 40,607 | 51,045 | 64,929 | 62,481 | 102,731 | |||||||||||||||||||||
Current debt | 953 | 9,796 | 5,319 | 8,893 | 10,974 | 4,546 | ||||||||||||||||||||||
Liability for mandatory stock redemption | 17,000 | 17,000 | ||||||||||||||||||||||||||
Long-term debt | 5,696 | 5,666 | 10,942 | 7,771 | 18,880 | 18,744 | ||||||||||||||||||||||
Shares subject to redemption | 7,000 | 11,000 | 11,000 | 11,000 | ||||||||||||||||||||||||
Stockholders’ equity | 2,743 | 2,851 | 8,754 | 16,665 | 9,333 | 14,035 | 94,575 | |||||||||||||||||||||
21
Table of Contents
| (1) | Basic earnings (loss) per share is computed using the two-class method by dividing income available to common stockholders by the weighted average number of common shares outstanding during the period. Diluted earnings (loss) per share is computed giving effect to all dilutive potential common shares that were outstanding during the period. The effect of stock options represents the only differences between the weighted average shares used for the basic earnings per share computation compared to the diluted earnings per share computation. |
The following table presents the computations of basic and diluted earnings per share for the periods presented.
| Year Ended December 31, | Three Months Ended March 31, | ||||||||||||||||||||||||
| 1999 | 2000 | 2001 | 2002 | 2003 | 2003 | 2004 | |||||||||||||||||||
| (Dollars in thousands, except per share data) | |||||||||||||||||||||||||
| (Unaudited) | |||||||||||||||||||||||||
Net income | $ | 1,956 | $ | 4,075 | $ | 5,897 | $ | 7,835 | $ | 13,924 | $ | 2,766 | $ | 5,251 | |||||||||||
Less: reduction to retained | 5,483 | 3,292 | 5,296 | 5,296 | |||||||||||||||||||||
Less: dividend and participation rights associated with mandatory stock redemption (a) | 2,162 | 1,242 | |||||||||||||||||||||||
Income (loss) available to common stockholders | $ | (3,527 | ) | $ | 783 | $ | 5,897 | $ | 7,835 | $ | 6,466 | $ | (2,530 | ) | $ | 4,009 | |||||||||
Weighted average number of actual common shares outstanding | 16,666,129 | 18,915,000 | 18,915,000 | 18,915,000 | 18,137,718 | 18,915,000 | 15,308,110 | ||||||||||||||||||
Reduction in weighted average shares associated with mandatory stock redemption (a) | (2,203,045 | ) | (3,620,100 | ) | |||||||||||||||||||||
Weighted average number of common shares outstanding | 16,666,129 | 18,915,000 | 18,915,000 | 18,915,000 | 15,934,673 | 18,915,000 | 11,688,010 | ||||||||||||||||||
Incremental shares from assumed conversion of stock options | 76,998 | 121,641 | 341,263 | 501,756 | 466,398 | 659,407 | |||||||||||||||||||
Weighted average number of diluted common shares outstanding | 16,666,129 | 18,991,998 | 19,036,641 | 19,256,263 | 16,436,429 | 19,381,398 | 12,347,417 | ||||||||||||||||||
Basic earnings (loss) per share | $ | (0.21 | ) | $ | 0.04 | $ | 0.31 | $ | 0.41 | $ | 0.41 | $ | (0.13 | ) | $ | 0.34 | |||||||||
Diluted earnings (loss) per share | $ | (0.21 | ) | $ | 0.04 | $ | 0.31 | $ | 0.41 | $ | 0.39 | $ | (0.13 | ) | $ | 0.32 | |||||||||
Basic and diluted earnings (loss) per share computations are adjusted to reflect our obligation to purchase shares from two principal stockholders, Don Early and Gregory L. Smith, upon their death pursuant to our stockholders agreement with them. Under generally accepted accounting principles, for purposes of computing income available to common stockholders in the earnings per share calculations, we are required to include as a reduction to net income the increase in the carrying amount of the shares subject to redemption that is charged directly to retained earnings in any given period. Accordingly, we reduced net income available to common stockholders by $5.5 million in 1999, $3.3 million in 2000, $5.3 million in 2003 and $5.3 million for the three months ended March 31, 2003, to reflect the amount charged directly to retained earnings associated with this obligation. Pursuant to the stockholders agreement, we maintain insurance policies with respect to these two stockholders that will cover the entire share repurchase obligation. The stockholders agreement has been terminated effective June 30, 2004. Upon the termination of the stockholders agreement and related liability for mandatory stock redemption, the computation for earnings per share will no longer require the various adjustments associated with the shares subject to mandatory redemption as described herein.
| (a) | As set forth in Statement of Financial Accounting Standards No. 150 (SFAS 150),Accounting for Certain Financial Instruments with Characteristics of Both Liabilities and Equity,which we adopted on July 1, 2003, the shares considered to be subject to redemption under the stockholders agreement are excluded from weighted average shares for purposes of computing basic and diluted earnings per share. The number of shares excluded will vary based on the change in the market price from period to period. Further, SFAS 150 requires that the portion of net income representing dividend and participation rights associated with the mandatory stock redemption be removed from income available to common stockholders pursuant to the two-class method set forth by Statement of Financial Accounting Standards No. 128,Earnings per Share. |
22
Table of Contents
| (2) | The unaudited as adjusted balance sheet data as of March 31, 2004 gives effect to this offering and the application of a portion of the net proceeds thereof for the repayment of outstanding indebtedness, as well as the termination of the stockholders agreement during second quarter 2004, which removed the liability for mandatory stock redemption and increased stockholders’ equity by $17 million. |
| (3) | Comparable stores are stores which are open during the full periods for which a comparison is being made. For example, comparable stores for the quarterly analysis as of March 31, 2004 are those stores opened for at least 15 months on such date, and comparable stores for the annual analysis as of December 31, 2003 are those stores opened for at least 24 months on such date. |
23
Table of Contents
MANAGEMENT’S DISCUSSION AND ANALYSIS OF
FINANCIAL CONDITION AND RESULTS OF OPERATIONS
The following is a discussion and analysis of our financial condition, results of operations and liquidity and capital resources for the three months ended March 31, 2003 and 2004 and for the years ended December 31, 2001, 2002 and 2003. This section should be read together with our audited and unaudited consolidated financial statements and related notes included elsewhere in this prospectus. Some of the information contained in this discussion and analysis or set forth elsewhere in this prospectus, including information with respect to our plans and strategies for our business, includes forward-looking statements that involve risks and uncertainties. You should review the “Risk Factors” section of this prospectus for a discussion of important factors that could cause actual results to differ materially from the results described in, or implied by, the forward-looking statements contained in this prospectus.
Overview
We are the parent company of QC Financial Services, Inc. and its wholly owned subsidiaries. We derive our revenues primarily by providing short-term consumer loans, known as payday loans. We also earn fees for various other financial services, such as check cashing services, title loans, money orders and money transfers. We operate 295 stores in 21 states. In all but one of these states, North Carolina, we fund our payday loans directly to the customer and receive a fee. Fees charged to customers vary from state to state, and in most cases, are limited by state law. In North Carolina, we have an arrangement with County Bank to which we provide various services in connection with the bank’s origination of payday loans in our stores and from which we purchase a pro rata participation interest in those loans. For our check cashing services, we charge our customers a fee that is usually equal to a percentage of the amount of the check being cashed and is deducted from the cash provided to the customer.
Our expenses primarily relate to the operations of our store network, the most significant of which include salaries and benefits for our store employees, provisions for losses and occupancy expense for our leased real estate. Regional and corporate expenses, including compensation of employees and occupancy expenses, are our other primary costs.
We evaluate our stores based on store gross profit and revenue growth, with consideration given as to the length of time the store has been open. We consider comparable store growth a strong indicator of operating efficiency. We define comparable stores as those stores which are open during the full periods for which a comparison is being made. For example, comparable stores for the quarterly analysis as of March 31, 2004 have been open at least 15 months and comparable stores for the annual analysis as of December 31, 2003 have been open at least 24 months. We monitor newer stores for their progress to profitability and rate of loan growth. With respect to our cost structure, salaries and benefits are historically our largest costs and are driven primarily by the addition of stores throughout the year. Our provision for losses is also a significant expense. If a customer’s check is returned by the bank as uncollected, we generally make an immediate charge-off to the provision for losses for the amount of the customer’s loan. Any recoveries on amounts previously charged off are recorded as a reduction to the provision for losses in the period recovered. We have experienced seasonality in our operations, with the first and fourth quarters typically being our strongest periods as a result of broader economic factors, such as holiday spending habits at the end of each year and income tax refunds during the first quarter.
Our industry is highly fragmented, with only 10 companies operating more than 150 stores in the United States. According to the Community Financial Services Association of America (CFSA) and the investment banking firm Stephens Inc., the industry has grown to approximately 22,000 payday loan stores in 2003, generating over $40 billion in annual loan volume.
With this fragmentation and industry growth, we believe there are opportunities to expand through acquisitions and new store openings. We are actively identifying possible store locations in numerous states in which we currently operate and evaluating the regulatory environment and market potential in the various states in which we currently do not have stores. As we consider acquisitions and open new stores, there are various
24
Table of Contents
execution risks associated with any such transactions. In the last five years, however, we have opened 137 new stores, acquired 137 stores and closed 27 stores, while maintaining competitive store gross margins and reporting growth in comparable store revenues.
The growth of the payday loan industry has followed, and continues to be significantly affected by, increasing acceptance of payday lending by state legislatures. However, to the extent that states enact legislation that negatively impacts payday lending, whether through preclusion, fee reduction or loan caps, our business could be adversely affected. We are very active in monitoring and evaluating regulatory initiatives in all of the states, and are closely involved with the efforts of the CFSA.
Discussion of Critical Accounting Policies
Our consolidated financial statements and accompanying notes have been prepared in accordance with accounting principles generally accepted in the United States of America applied on a consistent basis. The preparation of these financial statements requires us to make a number of estimates and assumptions that affect the reported amounts of assets and liabilities, the disclosure of contingent assets and liabilities at the date of the financial statements and the reported amounts of revenues and expenses during the reporting periods. We evaluate these estimates and assumptions on an ongoing basis. We base these estimates on the information currently available to us and on various other assumptions that we believe are reasonable under the circumstances. Actual results could vary materially from these estimates under different assumptions or conditions.
We believe that the following critical accounting policies affect the more significant estimates and assumptions used in the preparation of our financial statements.
Revenue Recognition
We record revenue from loans upon issuance. The term of a loan is generally 14 days for a payday loan and 30 days for a title loan. At the end of each period, we record an estimate of the unearned revenue, which results in revenues being recognized on a constant-yield basis ratably over the term of each loan.
Generally, we recognize revenue for check cashing and other services when those services are provided to the customer, which is at the time of sale.
Provision for Losses and Returned Item Policy
We record a provision for losses associated with loans made to customers when checks are presented to the bank for payment and returned as uncollected. On the date we receive a returned check, all accrued fees, interest and outstanding principal are charged off, generally within 15 days after the due date of the loan. Accordingly, the loans included in the loans receivable balance at any given point in time are typically not older than 30 days. These charge-offs are recorded as expense through the provision for losses. Any recoveries on losses previously charged to expense are recorded as a reduction to the provision for losses in the period recovered.
With respect to the loans receivable at each period end, we maintain an aggregate allowance for loan losses (including fees and interest) for payday loans and title loans at levels estimated to be adequate to absorb estimated incurred losses in the respective outstanding loan portfolios, which includes our pro rata participation in purchased payday loans.
Our receivables are generally no more than 30 days old. The allowance for loan losses is determined by evaluating the aggregate payday and title loan portfolio based on our historical level of loans charged to expense, the timing of each period end in a typical two-week payday cycle and our collections experience over the three months as of March 31, six months as of June 30, nine months as of September 30, and twelve months as of December 31 each year. We believe that, at any given point in time, our recent collection history reflects general
25
Table of Contents
economic conditions. We do not specifically reserve for any individual loan. Our experience over the last several years demonstrates that our estimates of the allowance for loan losses have been reasonable. Accordingly, we do not expect to alter our methodology unless factors come to our attention that would require a change in approach.
We aggregate payday loans and title loans for purposes of computing the loss allowance. We believe that aggregation is appropriate based on very similar historical averages of uncollectible amounts as a percentage of volume for each type of loan (generally ranging between 2% and 4% of total volume). Our experience has been that a separate calculation of our payday and title loan loss allowances would yield a substantially similar result to the combined calculation. If the allowance for loan losses was at the high end of this percentage range, when applied to accounts receivable as of December 31, 2003 and March 31, 2004, the allowance for loan losses would have increased by approximately $400,000 and $600,000, respectively.
The following table summarizes the activity in the allowance for loan losses and the provision for losses during the years ended December 31, 2001, 2002 and 2003 and the three months ended March 31, 2003 and 2004:
| Year Ended December 31, | Three Months Ended March 31, | |||||||||||||||||||
| 2001 | 2002 | 2003 | 2003 | 2004 | ||||||||||||||||
| (Dollars in thousands) | ||||||||||||||||||||
| (Unaudited) | ||||||||||||||||||||
Allowance for Loan Losses: | ||||||||||||||||||||
Balance, beginning of year | $ | 565 | $ | 650 | $ | 750 | $ | 750 | $ | 1,090 | ||||||||||
Adjustment to provision for losses based on evaluation of outstanding receivables at period end | 85 | 100 | 340 | (210 | ) | (390 | ) | |||||||||||||
Balance, end of period | $ | 650 | $ | 750 | $ | 1,090 | $ | 540 | $ | 700 | ||||||||||
Provision for Losses: | ||||||||||||||||||||
Charged-off to expense | $ | 26,705 | $ | 32,934 | $ | 45,665 | $ | 10,414 | $ | 11,156 | ||||||||||
Recoveries | (11,963 | ) | (18,091 | ) | (24,712 | ) | (6,331 | ) | (6,969 | ) | ||||||||||
Adjustment to provision for losses based on evaluation of outstanding receivables at period end | 85 | 100 | 340 | (210 | ) | (390 | ) | |||||||||||||
Total provision for losses | $ | 14,827 | $ | 14,943 | $ | 21,293 | $ | 3,873 | $ | 3,797 | ||||||||||
Our business is seasonal due to the impact of fluctuating demand for payday loans throughout the year, with historically higher demand in the month of January and in the fourth quarter of each year. The provision for losses is lower in the first quarter of the year as a percentage of revenues due to improved historical collection experience associated with our customers’ receipt of income tax refunds. The second and third quarters of each year generally reflect the continued trend to a higher provision for losses as a percentage of revenues, with the third quarter typically having the highest level of provision for losses, indicative of the strong demand for loans and associated higher likelihood of losses.
Income Taxes
In connection with the preparation of our consolidated financial statements, we are required to estimate our income taxes in each of the jurisdictions in which we operate. This process involves estimating current tax exposure, together with assessing the differences between the financial statement and tax bases of assets and liabilities as measured by the tax rates that will be in effect when these differences reverse. These differences result in deferred tax assets and liabilities, which are included in the consolidated balance sheet. As of December 31, 2003 and March 31, 2004, we reported a net deferred tax liability in the consolidated balance sheet.
26
Table of Contents
Results of Operations
Comparison of Three Months Ended March 31, 2004 to Three Months Ended March 31, 2003
The following table sets forth our results of operations for the three months ended March 31, 2004 compared to the three months ended March 31, 2003:
| Three Months Ended March 31, | Three Months Ended March 31, | |||||||||||
| 2003 | 2004 | 2003 | 2004 | |||||||||
| (Dollars in thousands, except Other Information) | (Percentage of revenues) | |||||||||||
| (Unaudited) | ||||||||||||
Statement of Income Data: | ||||||||||||
Revenues: | ||||||||||||
Payday loan fees | $ | 17,559 | $ | 24,516 | 82.6 | % | 87.0 | % | ||||
Other | 3,704 | 3,667 | 17.4 | 13.0 | ||||||||
Total revenues | 21,263 | 28,183 | 100.0 | 100.0 | ||||||||
Store expenses: | ||||||||||||
Salaries and benefits | 4,940 | 6,117 | 23.2 | 21.7 | ||||||||
Provision for losses | 3,873 | 3,797 | 18.2 | 13.5 | ||||||||
Occupancy | 2,696 | 3,014 | 12.7 | 10.7 | ||||||||
Depreciation and amortization | 266 | 366 | 1.3 | 1.3 | ||||||||
Other | 1,902 | 1,953 | 8.9 | 6.9 | ||||||||
Total store expenses | 13,677 | 15,247 | 64.3 | 54.1 | ||||||||
Store gross profit | 7,586 | 12,936 | 35.7 | 45.9 | ||||||||
Regional expenses | 1,399 | 1,820 | 6.6 | 6.4 | ||||||||
Corporate expenses | 1,373 | 1,791 | 6.5 | 6.4 | ||||||||
Depreciation and amortization | 81 | 132 | 0.4 | 0.5 | ||||||||
Interest expense | 216 | 356 | 1.0 | 1.3 | ||||||||
Other, net | 25 | 30 | 0.1 | 0.1 | ||||||||
Income before taxes | 4,492 | 8,807 | 21.1 | 31.2 | ||||||||
Provision for income taxes | 1,726 | 3,556 | 8.1 | 12.6 | ||||||||
Net income | $ | 2,766 | $ | 5,251 | 13.0 | % | 18.6 | % | ||||
Other Information: | ||||||||||||
Number of loans originated | 392,937 | 519,091 | ||||||||||
Average revenue per store | $ | 80,544 | $ | 95,536 | ||||||||
Average loan size | 304 | 325 | ||||||||||
Comparable Store Information (1): | ||||||||||||
| | Three Months Ended March 31, | |||||||||||
2004 to 2003: | ||||||||||||
| 2003 | 2004 | |||||||||||
Total revenues generated by all comparable stores | $ | 20,579 | $ | 25,771 | ||||||||
Total number of comparable stores | 252 | 252 | ||||||||||
Average revenue per comparable store | $ | 82 | $ | 102 | ||||||||
2003 to 2002: | ||||||||||||
| 2002 | 2003 | |||||||||||
Total revenues generated by all comparable stores | $ | 15,415 | $ | 17,634 | ||||||||
Total number of comparable stores | 197 | 197 | ||||||||||
Average revenue per comparable store | $ | 78 | $ | 90 | ||||||||
27
Table of Contents
| Three Months Ended March 31, | ||||||||
| 2003 | 2004 | |||||||
Store Information: | ||||||||
Number of stores, beginning of year | 258 | 294 | ||||||
De novo stores opened | 13 | 2 | ||||||
Acquired stores | ||||||||
Stores closed | 1 | 1 | ||||||
Number of stores, end of period | 270 | 295 | ||||||
Average number of stores open during period | 264 | 295 | ||||||
| (1) | Comparable stores are those stores that were open for at least 15 months as of each March 31. We define comparable stores as stores that were open for all of the two periods being compared, which, for example, would be for the three months ended March 31, 2004 those stores that were opened since at least January 1, 2003. |
Revenues. Revenues totaled $28.2 million for the three months ended March 31, 2004 compared to $21.3 million for the three months ended March 31, 2003, an increase of $6.9 million, or 32.4%. This revenue improvement in first quarter 2004 was attributable to higher payday loan volume. We originated 519,091 payday loans during first quarter 2004, with an average loan size of $325.28, compared to 392,937 payday loans with an average loan size of $303.97 in first quarter 2003.
Comparable store revenues improved approximately $5.2 million, or 25.2%, quarter to quarter, largely as a result of higher payday loan volume during the current year period. Payday loan revenues during first quarter 2004 also benefited from the inclusion of 34 stores that were opened subsequent to first quarter 2003, partially offset by the lack of revenues from nine stores that closed during the same period.
Revenue from other sources, primarily check cashing and title loan fees, totaled $3.7 million for both quarters, with check cashing and title loans representing 7.7% and 3.7% of total revenues, respectively, for the three months ended March 31, 2004. Check cashing fees, as a percentage of revenue, are normally higher in the first quarter due to increased check cashing volume from tax refund checks.
Store Expenses. Store expenses were $15.2 million for the three months ended March 31, 2004 compared to $13.7 million for the three months ended March 31, 2003, an increase of $1.5 million, or 10.9%. Salaries and benefits, which is the largest store expense, increased $1.2 million from first quarter 2003 to first quarter 2004, primarily due to employees hired to work at the stores opened subsequent to March 31, 2003. The remaining $300,000 increase quarter to quarter reflects higher occupancy costs associated with stores added subsequent to March 31, 2003, partially offset by a slightly lower provision for losses.
Our provision for losses for first quarter 2004 was 13.5% of revenue compared to 18.2% of revenue in first quarter 2003. We believe that our favorable loss experience in first quarter 2004 compared to first quarter 2003 was primarily attributable to: (1) improved economic and employment conditions, (2) higher income tax refunds received by our customers and (3) improved collections of loans due to the benefits of our customer service approach to collections. Our business is seasonal due to the impact of fluctuating demand for payday loans throughout the year, with historically higher demand in the month of January and in the fourth quarter of each year. We normally experience improved loan collections in February and March of each year, which reduces our loan losses in the first quarter of each year. Accordingly, as a percentage of revenues, our provision for losses during the first quarter of each year is not reflective of the loss experience we expect for the full year. We implemented our Operational Excellence program throughout 2003, which has a customer service component that is intended to enhance the likelihood of collecting our loans. We believe this approach creates trust between the customer and our store personnel, thereby enhancing the likelihood of effective repayment of outstanding loans.
Expenses related to stores that were opened during 2003 accounted for $1.4 million of the increase in total store expense, primarily in salaries and benefits. Stores closed subsequent to March 31, 2003 reduced expenses by $346,000 compared to first quarter 2003. Comparable store expenses for the current quarter increased over
28
Table of Contents
first quarter 2003 by approximately $484,000, or 3.8%. The slower rate of growth in expenses versus revenues for comparable stores is partially a result of efforts to implement our Operational Excellence program, which encourages store managers to share successful operating procedures with other locations throughout the organization and seeks to provide a greater opportunity for consistency in critical business drivers across geographic boundaries.
Store Gross Profit. Store gross profit improved $5.3 million, or 69.7%, as a result of the higher growth rate of revenues compared to expenses in the current year quarter compared to the prior year’s quarter. Store gross margins, which is gross profit as a percentage of revenues, improved from 35.7% in first quarter 2003 to 45.9% in first quarter 2004. While we believe store gross margins will continue to be strong, historically the first and fourth quarters of each year are our strongest. See “— Seasonality.” Accordingly, store gross margins for the remainder of 2004 are not expected to achieve the levels reported in first quarter 2004.
The gross margin for stores opened subsequent to March 31, 2003 was approximately 9.2%. Generally our de novo locations become profitable after approximately six months. Initial profitability for stores that we have acquired varies greatly based on numerous factors, including the training of personnel and infrastructure development.
Regional and Corporate Expenses. Regional and corporate expenses were $3.6 million for the three months ended March 31, 2004 compared to $2.8 million for the three months ended March 31, 2003, an increase of $800,000, or 28.6%. The increase reflects higher administrative expenses, such as salaries and benefits, professional fees and travel, associated with the increase in the number of stores and resulting need for support functions.
Interest Expense. Interest expense increased $140,000, or 64.8%, to $356,000 for the three months ended March 31, 2004 compared to $216,000 for the three months ended March 31, 2003, due primarily to the additional $15.0 million of long-term debt we incurred in fourth quarter 2003 in connection with the redemption of shares of our common stock.
Income Tax Provision. Our provision for income taxes increased $1.9 million to $3.6 million during first quarter 2004 from $1.7 million during first quarter 2003 as a result of higher pretax income. Our first quarter 2004 effective income tax rate of 40.4% was higher than the 38.4% in first quarter 2003 due to state and local tax planning strategies that reduced the first quarter 2003 provision for income taxes by approximately $89,000, the benefits of which were limited to 2003.
Selected Changes in Financial Condition During First Quarter 2004. Loans receivable, net of allowance for loan losses, declined $5.7 million from December 31, 2003 to $30.2 million as of March 31, 2004 due to collections on the year end balances and the historical lower lending levels in February and March of each year coincident with customers paying off their payday loans with their tax refunds.
Property and equipment, net of depreciation and amortization, increased $2.0 million during first quarter 2004 to $13.9 million as of March 31, 2004, primarily due (1) to the acquisition of property in California for approximately $1.3 million, using $300,000 in cash and $1.0 million in borrowings under a term loan with interest at prime plus 1.0% and due in March 2019, and (2) to leasehold improvements on existing stores.
We repaid the $6.3 million balance on our revolving credit facility during first quarter 2004 from available cash. Other indebtedness declined slightly during the first quarter 2004 as a result of repayments of principal.
29
Table of Contents
Fiscal Year Results of Operations
The following table sets forth our results of operations for the three years ended December 31, 2003:
| Year Ended December 31, | Year Ended December 31, | ||||||||||||||||||
| 2001 | 2002 | 2003 | 2001 | 2002 | 2003 | ||||||||||||||
(Dollars in thousands, except Other Information) | (Percentage of revenues) | ||||||||||||||||||
Statement of Income Data: | |||||||||||||||||||
Revenues: | |||||||||||||||||||
Payday loan fees | $ | 47,935 | $ | 59,006 | $ | 86,010 | 79.5 | % | 83.2 | % | 87.3 | % | |||||||
Other | 12,348 | 11,901 | 12,484 | 20.5 | 16.8 | 12.7 | |||||||||||||
Total revenues | 60,283 | 70,907 | 98,494 | 100.0 | 100.0 | 100.0 | |||||||||||||
Store expenses: | |||||||||||||||||||
Salaries and benefits | 10,631 | 15,646 | 21,279 | 17.6 | 22.1 | 21.6 | |||||||||||||
Provision for losses | 14,827 | 14,943 | 21,293 | 24.6 | 21.1 | 21.6 | |||||||||||||
Occupancy | 7,520 | 8,509 | 10,862 | 12.5 | 12.0 | 11.0 | |||||||||||||
Depreciation and amortization | 559 | 952 | 1,397 | 0.9 | 1.3 | 1.4 | |||||||||||||
Other | 7,216 | 7,070 | 7,571 | 12.0 | 10.0 | 7.7 | |||||||||||||
Total store expenses | 40,753 | 47,120 | 62,402 | 67.6 | 66.5 | 63.3 | |||||||||||||
Store gross profit | 19,530 | 23,787 | 36,092 | 32.4 | 33.5 | 36.7 | |||||||||||||
Regional expenses | 4,340 | 4,949 | 5,613 | 7.2 | 7.0 | 5.7 | |||||||||||||
Corporate expenses | 3,397 | 4,815 | 6,324 | 5.6 | 6.8 | 6.4 | |||||||||||||
Depreciation and amortization | 944 | 241 | 538 | 1.6 | 0.3 | 0.6 | |||||||||||||
Interest expense | 1,210 | 879 | 936 | 2.0 | 1.2 | 1.0 | |||||||||||||
Other, net | (84 | ) | 22 | 35 | (0.1 | ) | |||||||||||||
Income before taxes | 9,723 | 12,881 | 22,646 | 16.1 | 18.2 | 23.0 | |||||||||||||
Provision for income taxes | 3,826 | 5,046 | 8,722 | 6.3 | 7.1 | 8.9 | |||||||||||||
Net income | $ | 5,897 | $ | 7,835 | $ | 13,924 | 9.8 | % | 11.1 | % | 14.1 | % | |||||||
Other Information: | |||||||||||||||||||
Number of loans originated | 1,193,737 | 1,381,104 | 1,878,369 | ||||||||||||||||
Average revenue per store | $ | 317,279 | $ | 306,957 | $ | 356,862 | |||||||||||||
Average loan size | 274 | 289 | 314 | ||||||||||||||||
Comparable Store Information (1): | |||||||||||||||||||
| 2003 to 2002: | Year Ended December 31, | ||||||||||||||||||
| 2002 | 2003 | ||||||||||||||||||
Total revenues generated by all comparable stores | $ | 66,025 | $ | 76,961 | |||||||||||||||
Total number of comparable stores | 192 | 192 | |||||||||||||||||
Average revenue per comparable store | $ | 344 | $ | 401 | |||||||||||||||
2002 to 2001: | |||||||||||||||||||
| 2001 | 2002 | ||||||||||||||||||
Total revenues generated by all comparable stores | $ | 56,200 | $ | 58,477 | |||||||||||||||
Total number of comparable stores | 166 | 166 | |||||||||||||||||
Average revenue per comparable store | $ | 339 | $ | 352 | |||||||||||||||
2001 to 2000: | |||||||||||||||||||
| 2000 | 2001 | ||||||||||||||||||
Total revenues generated by all comparable stores | $ | 35,414 | $ | 44,217 | |||||||||||||||
Total number of comparable stores | 135 | 135 | |||||||||||||||||
Average revenue per comparable store | $ | 262 | $ | 328 | |||||||||||||||
30
Table of Contents
| Year Ended December 31, | ||||||
| 2001 | 2002 | 2003 | ||||
Store Information: | ||||||
Number of stores, beginning of year | 176 | 204 | 258 | |||
De novo stores opened | 22 | 55 | 45 | |||
Acquired stores | 12 | 6 | ||||
Stores closed | 6 | 7 | 9 | |||
Number of stores, end of year | 204 | 258 | 294 | |||
Average number of stores open during year | 190 | 231 | 276 | |||
| (1) | Comparable stores are those stores that were open for at least 24 months as of each December 31. We define comparable stores as stores that were open for all of the two periods being compared, which, for example, would be for the year ended December 31, 2003, those stores that were opened since at least January 1, 2002. |
Year Ended December 31, 2003 Compared to the Year Ended December 31, 2002
Revenues. Revenues totaled $98.5 million for the year ended December 31, 2003 compared to $70.9 million for the year ended December 31, 2002, an increase of $27.6 million or 38.9%. This increase in total revenues was primarily the result of an increase in payday loan volume. During 2003, we originated 1,878,369 payday loans, with an average loan size of $314.14, compared to 1,381,104 payday loans with an average loan size of $288.53 in 2002.
Revenues from stores opened or acquired during 2002 that had a full year of revenue during 2003 represented $13.8 million of the increase year to year. Comparable store revenues during 2003 increased $10.9 million or 16.6%, primarily as a result of (1) a higher number of payday loans made during 2003, (2) the resumption of revenues earned from our stores in Indiana due to enactment of a new payday loan law in Indiana, and (3) a different banking relationship for payday loans in North Carolina that provided higher payday loan volume compared to prior years. The remaining increase in revenues during 2003 compared to 2002 reflects revenues earned from stores added during 2003, partially offset by stores that were closed during the year.
Revenues from other sources, primarily check cashing and title loans, increased $583,000 from 2002 to 2003. This increase reflects modest improvements in check cashing and title loan revenues, primarily as a result of the inclusion of stores in fiscal 2003 totals that were opened during 2002 and 2003. While revenues for these ancillary products and services increased year to year, their percentage of total revenues declined from 16.8% in 2002 to 12.7% in 2003, reflecting our reduced emphasis on these non-core products and services. Revenues from check cashing and title loans represented 6.5% and 4.5% of revenues, respectively, for the year ended December 31, 2003.
Store Expenses. Store expenses were $62.4 million during 2003, compared to $47.1 million in 2002, an increase of $15.3 million, or 32.5%. Higher store expenses reflected an increase in the provision for losses, which increased from $14.9 million in 2002 to $21.3 million in 2003, and higher salaries and benefits, which rose $5.7 million from $15.6 million in 2002 to $21.3 million in 2003. Our provision for losses increased ratably with the increase in revenues year to year, representing 21.6% of revenues in 2003 versus 21.1% of revenues in 2002. With respect to salaries and expenses, the effect of a full year of compensation costs for the employees working in the 55 stores opened during 2002 and the 45 new store openings in 2003 accounted for the majority of the increase.
While occupancy costs increased $2.4 million from 2002 to 2003 as a result of stores added in 2002 and 2003, as a percentage of revenue, occupancy costs declined to 11.0% from 12.0% as a result of revenue increases year to year. Depreciation and amortization increased $445,000 from 2002 to 2003 due to leasehold improvements associated with de novo stores. Other costs, which include advertising, utilities and office supplies increased $501,000 in 2003 compared to 2002 with higher general office costs substantially offset by a
31
Table of Contents
$1.0 million decline in advertising as a result of a reduced focus on new store promotional activities. The rate of the increase in other costs, however, trailed that of revenues, resulting in improvements when analyzed as a percentage of revenue.
Store Gross Profit. Store gross profit increased $12.3 million from $23.8 million for the year ended December 31, 2002 to $36.1 million for the year ended December 31, 2003. Store gross margins improved to 36.7% in 2003 compared to 33.5% in 2002. Comparable store gross margins were 42.1% in 2003 compared to 37.4% in 2002. Stores added during 2002 earned gross profit of $5.5 million during 2003, with a store margin of 31.0%. De novo stores opened during 2003 lost a total of approximately $1.6 million in the aggregate.
Regional and Corporate Expenses. Regional expenses totaled $5.6 million for 2003 compared to $4.9 million for 2002, an increase of $664,000, or 13.6%. This increase is primarily attributable to the addition of stores during 2002 and 2003, which led to higher salaries and benefits with the addition of regional personnel. Corporate expenses increased from $4.8 million in 2002 to $6.3 million in 2003, reflecting ongoing efforts to provide timely and effective strategic and administrative support to the various locations throughout the country through a professional corporate infrastructure. Together, regional and corporate expenses as a percentage of revenues decreased from 13.8% during 2002 to 12.1% during 2003.
Interest Expense. Interest expense increased slightly in 2003 to $936,000 compared to $879,000 in 2002. Higher average debt balances in 2003 compared to 2002, particularly as a result of the $15.0 million borrowed in fourth quarter 2003 to fund a stock redemption, were substantially offset by the benefit of declining interest rates during 2003.
Income Tax Provision. Our provision for income taxes increased to $8.7 million in 2003 compared to $5.0 million in 2002 as a result of higher pretax income. Our effective income tax rate declined from 39.2% in 2002 to 38.5% in 2003, primarily as a result of tax planning strategies related to state income taxes.
Year Ended December 31, 2002 Compared to the Year Ended December 31, 2001
Revenues. Revenues totaled $70.9 million for the year ended December 31, 2002 compared to $60.3 million for the year ended December 31, 2001, an increase of $10.6 million or 17.6%. This improvement in total revenues was primarily the result of an increase in payday loan volume. In 2002, we originated 1,381,104 payday loans, with an average loan size of $288.53, compared to 1,193,737 payday loans with an average loan size of $274.21 in 2001.
Comparable store revenues during 2002 increased 4.1%, and stores opened during 2001 increased $5.5 million to $8.2 million from 2001 to 2002. New stores opened during 2002 accounted for the remainder of the increase, partially offset by the lack of revenues for stores that closed during 2001. The increase in comparable store revenues during 2002 was attributable to a higher number of payday loans originated, partially offset by reduced fees in Indiana and North Carolina as a result of changes in state regulations that severely limited or restricted payday loans in those states.
Revenues from other sources, primarily check cashing and title loans, declined from $12.3 million in 2001 to $11.9 million in 2002. This decline was primarily attributable to lower check cashing fees. As a percentage of total revenues, revenues from other sources continued to decline from 20.5% in 2001 to 16.8% in 2002.
Store Expenses. Store expenses were $47.1 million during 2002 compared to $40.8 million during 2001, an increase of $6.3 million, or 15.4%. The increase in store expenses year to year was primarily attributable to higher salaries and benefits, which rose $5.0 million from $10.6 million in 2001 to $15.6 million in 2002, and increases in occupancy costs. With respect to salaries and expenses, additional personnel to staff stores opened or acquired during 2001 and 2002 accounted for the majority of the increase, with 34 new stores in 2001 and 61 new stores during 2002 resulting in an increase in the average number of employees to 696 during 2002 from 565 during 2001. Occupancy costs increased $1.0 million from 2001 to 2002 as a result of the stores opened or acquired in 2001 and 2002.
32
Table of Contents
As a percentage of revenues, the provision for losses declined from 24.6% to 21.1% year to year. This improvement highlights our emphasis on improved loan volume and collections from stores we acquired in 2000. Depreciation and amortization increased by $393,000 from 2001 to 2002 due to leasehold improvements associated with de novo stores. Other expenses decreased $146,000 from 2001 to 2002. The year ended December 31, 2001 includes a $1.0 million accrued expense associated with litigation in Indiana. We were sued in two class action lawsuits in Indiana after the Indiana Attorney General issued an opinion that an existing statute did not allow payday lending. We settled the lawsuits for an aggregate of approximately $1.0 million in 2002. In 2002, the Indiana legislature enacted new legislation that specifically permits payday lending. See the discussion above under the subsection“Revenues” for the impact on revenues from 2001 to 2002 of the Indiana Attorney General’s opinion, as well as the revenue effect from 2002 to 2003 of the change in legislation. Exclusive of the accrued expense litigation amount in Indiana, other expenses increased by approximately $854,000 reflecting higher variable costs associated with the growth in the number of stores.
Store Gross Profit. Store gross profit increased $4.3 million from $19.5 million for the year ended December 31, 2001 to $23.8 million for the year ended December 31, 2002. Store gross margins improved to 33.5% in 2002 compared to 32.4% in 2001.
Regional and Corporate Expenses. Regional expenses totaled $4.9 million during 2002 compared to $4.3 million during 2001, an increase of $600,000, or 14.0%. This increase is primarily attributable to the addition of stores during 2002, which led to higher salaries and benefits. Corporate expenses increased from $3.4 million in 2001 to $4.8 million in 2002 as a result of corporate initiatives to develop infrastructure to accommodate the rapid growth experienced by the company. Together, regional and corporate expenses as a percentage of revenues increased from 12.8% during 2001 to 13.8% during 2002.
Depreciation and Amortization. Depreciation and amortization declined $703,000 from $944,000 during 2001 to $241,000 during 2002. This decline is largely attributable to amortization in 2001 associated with goodwill, which was no longer required in 2002 pursuant to changes in accounting principles.
Interest Expense. Interest expense decreased $331,000 in 2002 compared to 2001 as a result of slightly lower interest rates compared to 2001.
Income Tax Provision. Our provision for income taxes increased in 2002 compared to 2001 as a result of higher pretax income. Our effective income tax rate of 39.2% for the year ended December 31, 2002 was slightly lower than the 2001 effective income tax rate of 39.3%.
Liquidity and Capital Resources
The following table presents a summary of cash flows for the three years ended December 31, 2003 and the three months ended March 31, 2003 and 2004:
| Year Ended December 31, | Three Months Ended March 31, | |||||||||||||||||||
| 2001 | 2002 | 2003 | 2003 | 2004 | ||||||||||||||||
| (Dollars in thousands) | ||||||||||||||||||||
(Unaudited) | ||||||||||||||||||||
Cash flows provided by (used for): | ||||||||||||||||||||
Operating activities | $ | 9,105 | $ | 10,968 | $ | 18,409 | $ | 2,651 | $ | 4,527 | ||||||||||
Investing activities | (7,063 | ) | (12,275 | ) | (14,391 | ) | 3,226 | 3,326 | ||||||||||||
Financing activities | 806 | 447 | (2,512 | ) | (3,426 | ) | (7,112 | ) | ||||||||||||
Net increase (decrease) in cash and cash equivalents | 2,848 | (860 | ) | 1,506 | 2,451 | 741 | ||||||||||||||
Cash and cash equivalents, beginning of year | 6,003 | 8,851 | 7,991 | 7,991 | 9,497 | |||||||||||||||
Cash and cash equivalents, end of period | $ | 8,851 | $ | 7,991 | $ | 9,497 | $ | 10,442 | $ | 10,238 | ||||||||||
33
Table of Contents
Our principal sources of cash are from operations and borrowings under our revolving credit facility. We have also entered into term loans from time to time in connection with funding of acquisitions, redemption of our common stock, capital expenditures and to place a portion of our credit facility borrowings on a scheduled amortization.
Net cash provided by operating activities was $9.1 million in 2001, $11.0 million in 2002 and $18.4 million in 2003. The increases in operating cash flows year to year are primarily a result of improvements in net income each year. Net cash provided by operating activities was $4.5 million for the three months ended March 31, 2004, compared to $2.7 million for the three months ended March 31, 2003. This $1.8 million increase in net cash provided by operations was primarily due to the increase in net income period to period. Higher net income, however, was partially offset by a greater decline in working capital components in the first three months of 2004 compared to the first three months of 2003, largely attributable to the timing of tax payments.
Beginning in the fall of 2003, we intentionally slowed our growth of de novo store openings in order to strengthen our cash position. Each new store requires up to $150,000 to fund its cash requirements. We slowed our new store growth because we needed additional cash to service the $15.0 million in long-term debt we incurred to repurchase common stock and to pay dividends on our common stock.
Net cash used in investing activities was $7.1 million in 2001, $12.3 million in 2002 and $14.4 million in 2003. Our investing activities primarily relate to the funding of payday loans (net of charge-offs and recoveries) and purchases of property and equipment for our new and existing stores. Loans receivable balances increased $2.6 million in 2001, $7.2 million in 2002 and $9.3 million in 2003. The balances increased due to higher loan volume. The increase in annual capital expenditures from $3.6 million in 2001 to $4.4 million in 2002 is indicative of the growth in the number of stores. The increase from $4.4 million in 2002 to $5.2 million in 2003 reflects renovation efforts on existing stores, including updated signage, improved security and general enhancements, partially offset by a lower number of de novo stores year to year.
For the three months ended March 31, 2004, net cash received from investing activities totaled $3.3 million compared to $3.2 million for the three months ended March 31, 2003. Declines in the loans receivable balances in both periods reflect our historical experience that larger year-end receivable balances are collected during the first quarter due to income tax refunds received by customers, which also lead to fewer loans at the end of the first quarter. The declines in loans receivable in first quarter 2003 and 2004 were partially offset by capital expenditures of $1.9 million and $2.5 million during the three months ended March 31, 2003 and 2004, respectively. We currently expect that our capital expenditure levels will continue to grow during 2004 as we undertake remodeling efforts in various existing stores and open de novo stores.
Net cash provided by (used for) financing activities was $800,000 in 2001, $400,000 in 2002 and $(2.5) million in 2003. The decline during 2003 was largely the result of the $15.0 million repurchase of stock in fourth quarter 2003, which was substantially offset by $13.2 million in net borrowings under our term loans and revolving credit facility largely to fund this stock repurchase. In the fourth quarter of 2003, we paid $400,000 in dividends. Activity in 2001 and 2002 reflects net borrowings during each year.
Net cash used in financing activities was $7.1 million for the three months ended March 31, 2004 compared to $3.4 million for the three months ended March 31, 2003. The greater use of cash for financing activities during the three months ended March 31, 2004 resulted from the repayment of $6.3 million in borrowings under our credit facility, scheduled payments of principal under term loans and repayment of $245,000 of related party notes. These repayments were partially offset by $1.0 million in borrowings through a note payable, bearing interest at the prime lending rate plus 1.0% and due in March 2019, in connection with the acquisition of property in California. Repayments of borrowings under the revolving credit facility and term loans comprised the financing activities during first quarter 2003. We paid $900,000 in dividends in the first quarter of 2004. We have also declared a total of $2.2 million in dividends since March 31, 2004 which were paid in May 2004 using operating cash flows.
Since March 31, 2004, we borrowed under our revolving credit facility to prepay $2.0 million in subordinated notes. We expect to use a portion of the proceeds from this offering to repay all of our debt. Our
34
Table of Contents
revolving credit facility, which provides for borrowings of up to $10.0 million bearing interest at the prime lending rate plus 1.0%, expires in October 2004. We expect to negotiate a new credit facility as soon as practicable after the closing of this offering. After consideration of the liability for mandatory share redemption recorded pursuant to a stockholders agreement with two of our principal stockholders, we were not in compliance with a covenant with respect to a minimum net worth requirement as of March 31, 2004 and for the years ended December 31, 2002 and 2003. The Company received waivers from the financial institution with respect to that covenant for the years ended December 31, 2002 and 2003 and the three months ended March 31, 2004.
After the closing of this offering, we will have a significant cash balance and no debt. We believe that cash flows from operations and available cash will allow us to fund our liquidity and capital expenditure requirements for the foreseeable future. We anticipate that available cash after satisfaction of operations and capital expenditure requirements will be primarily used to fund anticipated increases in payday loans, to finance new store expansion, and to complete opportunistic acquisitions.
As part of our growth strategy, we intend to open de novo stores in existing and new markets. The total cost of opening a de novo store varies depending on the size and type of store, as well as the geographic location, but is typically in the range of $100,000 to $150,000. This cost includes leasehold improvements, signage, infrastructure equipment and working capital requirements. Historically, our stores have required approximately six months to become profitable, and a full year of operations to recover initial operating losses. Store openings are concentrated in the second and third quarters of the year to ensure that these stores are open in the fourth quarter, which traditionally has greater demand for payday loans.
Operating Leases and Other Obligations. Operating leases are scheduled payments on existing store and other administrative leases. These leases typically have initial terms of three to five years and may contain provisions for renewal options, additional rental charges based on revenue and payment of real estate taxes and common area charges. Our principal future obligations and commitments as of December 31, 2003, excluding periodic interest payments, include the following:
| Payments Due by Period | |||||||||||||||
| Total | Less than 1 Year | 1-3 years | 4-5 years | After 5 years | |||||||||||
| (Dollars in thousands) | |||||||||||||||
Long-term debt: | |||||||||||||||
Term loans | $ | 15,653 | $ | 4,273 | $ | 8,129 | $ | 3,251 | |||||||
Revolving credit facility | 6,256 | 6,256 | |||||||||||||
Subordinated notes | 7,945 | 445 | 7,500 | ||||||||||||
Liability for mandatory stock redemption | 17,000 | $ | 17,000 | ||||||||||||
Operating leases | 12,493 | 4,976 | 5,774 | 1,743 | |||||||||||
Total contractual cash obligations | $ | 59,347 | $ | 15,950 | $ | 21,403 | $ | 4,994 | $ | 17,000 | |||||
As of December 31, 2003 and March 31, 2004, we did not have any purchase obligations.
Concentration of Risk. Revenues from our stores located in the states of Missouri, California, Illinois and New Mexico represented in excess of 60% of our total revenues for the year ended December 31, 2003. In each of the states of Missouri and California, revenues represented in excess of 15% of our total revenues for the year ended December 31, 2003. To the extent that laws are passed that affect our ability to offer payday loans or the manner by which we offer payday loans in any one of those states, our business could be adversely affected.
Stock Split. Our Board of Directors effected a 10 for 1 stock split in the form of a stock dividend during our second quarter 2004. All share and per share information included in our consolidated financial statements and accompanying notes have been restated to reflect the stock split for all periods presented.
35
Table of Contents
Impact of New Accounting Pronouncements
Effective January 1, 2003, we adopted Statement of Financial Accounting Standards No. 148 (SFAS 148),Accounting for Stock-Based Compensation—Transition and Disclosure. SFAS 148 provides alternative methods of transition for a voluntary change to the fair value based method of accounting for stock-based employee compensation. In addition, SFAS 148 amends the disclosure requirements of SFAS 123 to require prominent disclosures in both annual and interim financial statements about the method of accounting for stock-based employee compensation and the effect of the method used on reported results. We have not elected to change to a fair value based methodology of accounting for stock-based employee compensation and continue to follow the provisions set forth in Accounting Principles Board Opinion No. 25,Accounting for Stock Issued to Employees. We have complied with the disclosure provisions set forth in SFAS 148 as reflected in our consolidated financial statements and accompanying notes.
Effective July 1, 2003, we adopted the Financial Accounting Standards Board, or FASB, Interpretation No. 45, “Guarantor’s Accounting and Disclosure Requirements for Guarantees, Including Indirect Guarantees of Indebtedness of Others.” This Interpretation elaborates on the disclosures required by guarantors in their interim and annual financial statements. It also requires a guarantor to recognize a liability at the date of inception for the fair value of the obligation it assumes under the guarantee. The disclosure requirements were effective for periods ending after December 15, 2002. The initial recognition and measurement provisions apply on a prospective basis to guarantees issued or modified after December 31, 2002. We have not guaranteed indebtedness of others, and therefore, the adoption of this statement did not have an impact on our consolidated financial condition, consolidated results of operations or liquidity.
In January 2003, the FASB issued FASB Interpretation No. 46 (R) (FIN 46), Consolidation of Variable Interest Entities. FIN 46 requires that variable interest entities be consolidated by their primary beneficiary. FIN 46 became effective with all financial statements issued after January 31, 2003. We do not have investments in or any relationships with any variable interest entities, and therefore the adoption of this statement did not have an impact on our consolidated financial condition, results of operations or liquidity.
In May 2003, the FASB issued Statement of Financial Accounting Standards No. 150 (SFAS 150),Accounting for Certain Financial Instruments with Characteristics of both Liabilities and Equity. SFAS 150 establishes standards for how an issuer classifies and measures certain financial instruments with characteristics of both liabilities and equity. It requires that an issuer classify a financial instrument that is within its scope as a liability (or an asset in some circumstances). SFAS 150 is effective for the first interim period beginning after June 15, 2003. Pursuant to SFAS 150, we recorded a $17.0 million liability for mandatory stock redemption related to a stockholders agreement we entered into with two principal stockholders. Pursuant to the stockholders agreement, we maintained insurance policies with respect to these two stockholders that covered the entire $17.0 million obligation. This stockholders agreement terminated effective June 30, 2004.
Impact of Inflation
We do not believe that inflation has a material impact on our income or operations.
Seasonality
Our business is seasonal due to the impact of fluctuating demand for payday loans during the year. Historically, we have experienced our highest demand for payday loans in the fourth calendar quarter and the first month of each calendar year. As a result of the receipt by customers of their income tax refunds, demand for payday loans has historically declined in the balance of the first quarter of each calendar year and the first month of the second quarter. Our provision for losses historically fluctuates with these changes in payday loan demand, with higher charges in the third quarter of each calendar year and lower charges in the first calendar quarter of each calendar year. Due to the seasonality of our business, results of operations for any quarter are not necessarily indicative of the results of operations that may be achieved for the full year.
36
Table of Contents
Quantitative and Qualitative Disclosures About Market Risk
We have no market risk sensitive instruments entered into for trading purposes, as defined by accounting principles generally accepted in the United States of America. We are exposed to interest rate risk on our term loans and revolving credit facility. We do not currently use any derivative financial instruments. Based on the amount of our bank borrowings and our plan to use a portion of the proceeds of the offering to repay all bank loans, we believe the risk associated with these loans will not have an adverse effect on our financial position, results of operations or cash flows.
37
Table of Contents
Overview
We are a leading provider of payday loans in the United States. We operate 295 stores in 21 states. Payday loan revenues constituted approximately 87% of our total revenue in fiscal year 2003 and in the three months ended March 31, 2004. We believe that our customers are middle-income, working individuals who use our services because they find them to be a convenient source for small, short-term loans.
We have 20 years of experience operating retail consumer finance businesses. We entered the payday loan industry in 1992, and we believe that we were one of the first companies to offer the payday loan product in the United States. We have served the same customer base since 1984, beginning with a rent-to-own business and continuing with check cashing services in 1988. We sold our rent-to-own stores in 1994. Several of our executives and senior managers have worked in all levels of our stores. Through this direct, store-level experience, we have learned first-hand which products, services and practices were successful. We have learned the importance of creating personal relationships with customers and providing store managers with discretion, under corporate supervision, to determine how best to reach and serve customers in their markets.
From January 1, 1999 to March 31, 2004, we grew from 48 stores to 295 stores through a combination of acquisitions and new store openings. During this period, we opened 137 new stores, acquired 137 stores and closed 27 stores. Between fall 1999 and late summer 2000, we acquired 116 stores in three related transactions, which tripled our number of stores in less than nine months. Through these transactions we expanded our operations from five to 14 states, including 30 stores in California and 14 stores in Illinois. Comparable store revenue and gross profit growth for stores open at least 24 months were 17% and 31%, respectively, for the year ended December 31, 2003. Additionally, stores open for more than three years have achieved comparable store revenue and gross profit growth, as of December 31, 2003, of 15% and 25%, respectively. Our revenue and store gross profit for the year ended December 31, 2003 were $98.5 million and $36.1 million, respectively.
The following table sets forth our growth through store acquisitions and de novo store openings since January 1, 1999.
| 1999 | 2000 | 2001 | 2002 | 2003 | ||||||
Acquired stores during year | 69 | 50 | 12 | 6 | 0 | |||||
De novo stores opened during year | 5 | 8 | 22 | 55 | 45 |
Over the last five years, we have grown successfully by identifying and acquiring stores and by building de novo stores. We intend to expand through new store development and opportunistic acquisitions that we believe will provide a solid, long-term return on capital. Leveraging our experience at both acquiring and building de novo stores allows us to adapt to changing market conditions.
Industry Background
The payday loan industry began its rapid growth in 1996 when there were an estimated 2,000 payday loan stores in the United States. According to the Community Financial Services Association of America (CFSA) and the investment banking firm Stephens Inc., the industry has grown to approximately 22,000 payday loan stores in 2003, generating over $40 billion in annual loan volume. The growth of the payday loan industry has followed the increased acceptance of payday lending by state legislatures. Since 1996, the number of jurisdictions with legislation permitting or not prohibiting payday loans has grown from 6 states to 35 states and the District of Columbia. We believe that the payday loan industry is fragmented and has only 10 companies operating more than 150 stores. We estimate that these 10 companies operate approximately 7,000 stores.
38
Table of Contents
According to a survey by the Credit Research Center, McDonough School of Business, Georgetown University in 2001, payday loan customers have the following characteristics:
| • | 77% have incomes over $25,000; |
| • | 25% have incomes over $50,000; |
| • | 94% have a high school diploma or better; |
| • | 56% have some college education; |
| • | 68% are under the age of 45; |
| • | 64% have children; |
| • | 42% own homes; and |
| • | 57% have credit cards. |
A payday loan can be a convenient solution. The Georgetown University study found that, among those payday loan customers who considered other sources of credit, 70% chose payday loans for convenience, citing quick and easy process, fast approval, less paperwork, or convenient location. Only 6% of those customers chose payday loans because there was no alternative.
A payday loan is a small, unsecured short-term cash advance. These loans are usually $100 to $500 loans having a 14-day maturity designed to coincide with the customer’s next payday. Customers pay a one-time fee per loan, which varies according to state law, but is generally $15 to $20 per $100 borrowed. A payday loan customer typically:
| • | reads and signs an agreement that discloses the transaction terms; |
| • | writes a personal check for the loan amount plus a fee; and |
| • | immediately receives the loan proceeds, usually paid in cash, in the amount of the check minus the fee. |
In return, the payday lender agrees to defer deposit of the check. If the customer repays the loan, generally within two weeks, the check is returned to the customer. Otherwise, the check is presented for payment at the customer’s bank.
CFSA, established in 1999, is the only national association focused exclusively on payday loans. Its mission is to (1) promote laws and regulations that provide payday loan customers with substantive consumer protections while preserving their access to short-term credit options, and (2) support and encourage responsible industry practices. All members, which represent over half of all payday loan stores in the United States, agree to follow a set of best practices in order to ensure that payday loans are conducted in a responsible manner with appropriate consumer protections. These best practices cover:
| • | full disclosure of transaction terms; |
| • | customer’s cost-free right of rescission; |
| • | limitation on payday loan rollovers; |
| • | appropriate collection practices; |
| • | prohibition of criminal prosecution of customers for returned checks; |
| • | compliance with all applicable laws; |
| • | encouragement of responsible use of the service; |
| • | truthful advertising; and |
| • | establishment of safe, sound relationships with financial institutions. |
39
Table of Contents
We are a member of CFSA, and Darrin Andersen, our President and Chief Operating Officer, is a member of the CFSA board of directors and is the President-elect of CFSA.
Our Services
We focus on payday loans because of strong customer demand. We offer payday loans in each of our 295 stores. We continue to offer other consumer financial services, such as check cashing services, title loans, money orders and money transfers, in many of our stores. The following table sets forth the percentage of total revenue for payday loans and other services we provide.
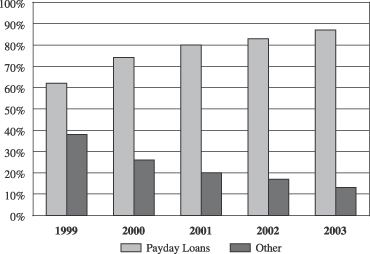
Payday Loans
Our primary business is offering payday loans in each of our 295 stores in 21 states. To obtain a payday loan from us, a customer must complete a loan application, maintain a personal checking account, have a source of income, and not otherwise be in default on a loan from us. To receive a payday loan, the customer signs a promissory note and provides us with a check for the principal loan amount plus a specified fee, which varies by state. State law typically limits fees to a range between $15 and $20 per $100 borrowed. Loans generally mature in two weeks, on or near the date of a customer’s next payday. Our agreement with customers provides that we will not cash their check until the due date of the loan. The customer’s debt to us is satisfied by:
| • | payment of the full amount owed in cash in exchange for return of the customer’s check; |
| • | deposit of the customer’s check; or |
| • | renewal of the customer’s loan after payment of the original loan fee in cash. |
We offer renewals only in states that allow them, and, subject to more restrictive requirements under state law, we comply with CFSA’s recommended best practices and offer no more than four consecutive renewals per customer. We also require that the customer sign a new promissory note and provide a new check for payday loan renewals.
Other Financial Services
We also offer other consumer financial services, such as check cashing services, title loans, money orders and money transfers. Closely related to the payday loan industry is the check cashing industry, a service offered in 162 of our 295 stores. Check cashing fees, constituting most of our revenue for other financial services,
40
Table of Contents
accounted for 6.5% of our total revenues for fiscal 2003 and 7.7% of our total revenues in the three months ended March 31, 2004. Check cashing revenues are typically higher in the first quarter due primarily to customers’ receipt of tax refund checks.
We primarily cash payroll, government assistance, tax refund, insurance and personal checks. Before cashing a check, we verify the customer’s identification and the validity of the check. Our fees for this service average 2.7% of the face amount of the check. If a check cashed by us is not paid for any reason, we record the full face value of the check as a loss in the period when the check was returned unpaid. We then contact the customer to initiate the collection process. In certain circumstances, we will turn the check over to a third party collection agency.
We also offer title loans, which are short-term consumer loans, usually for a term of 30 days, secured by the customer’s automobile. Generally, if a loan has not been repaid by a customer after 30 days, we charge the receivable to expense. We continue our collection efforts, however, through the same customer service approach that we use for originating and collecting payday loans. Occasionally, we hire a bonded agent to initiate repossession. We offer title loans in 80 stores as of March 31, 2004. During the last three fiscal years, revenues from title loans have declined as a percentage of our revenues.
We are also an agent for the transmission and receipt of wire transfers for Western Union. Through this network, our customers can transfer funds electronically to more than 170,000 agents in more than 190 countries throughout the world. Additionally, our stores offer Western Union money orders.
Together, title loans, money transfers, money orders and other financial services constituted 6.2% of our revenues in fiscal year 2003 and 5.3% of our revenues in the first three months ended March 31, 2004.
Competitive Strengths
We believe that the following competitive strengths position us well for growth.
Management Team with Significant Industry and Company Experience
Our management team has significant experience in the payday loan industry and other retail consumer finance businesses. Over the past 15 years, our management team has successfully acquired and integrated stores as well as opened new stores. In addition to our management’s proven track record of growing our business, they also have extensive operating experience as a result of working at all levels of our stores. We believe that this store-level experience has been critical to our outstanding store performance.
Don Early, our Chairman and Chief Executive Officer, founded our company in 1984 and has 20 years of experience in the retail financial services industry. Mary Lou Andersen, our Vice Chairman, has over 15 years experience with us in the retail financial services industry. Mr. Early and Ms. Andersen each have 12 years experience in the payday loan industry, and have extensive experience at every level of our business, including loan origination, customer service, collections, store-level management, corporate operations and strategic planning. Darrin Andersen, our President and Chief Operating Officer, has been instrumental in helping us grow from 37 stores to 295 stores since he joined in 1998 and also has experience at every level of our business. In addition, our regional managers, regional directors and regional vice-presidents, a majority of whom have been payday loan store managers, have an average of over seven years experience in the payday loan industry, which had approximately only 2,000 stores in 1996. We believe that significant store-level operating experience provides senior managers and executives with the ability to understand customer needs and operational matters. Additionally, store-level experience has enabled us to make effective decisions relating to strategic planning, acquisitions, and existing store operations.
41
Table of Contents
Customer Service and Respect
Treating our customers with respect and providing them with excellent service are critical to our success. Our experience has taught us that treating customers in a positive, respectful manner creates customer loyalty. We have a consistent store management strategy throughout the company that stresses the importance of a direct personal relationship with our customers, from the first time a customer is greeted by the customer service representative at a store, through the loan application process, and extending to the collection process. We incorporate the collections process into our customer service process by generally having the same store personnel make the customer service calls to collect overdue balances.
We also believe that our customers expect quick and efficient service. Therefore, we strive to minimize the time it takes to complete a payday loan transaction.
Lending Policy
Our lending policy facilitates quick and convenient service for our customers, while maximizing our payday loan volume. To obtain a payday loan from us, a customer must complete a loan application, maintain a personal checking account, have a source of income and not otherwise be in default on a loan from us. We believe that our lending guidelines allow us to efficiently generate loan volume, enabling new stores to become profitable within six months of opening. For the year ended December 31, 2003, our stores generated an average of more than $350,000 of annual revenue and our highest-revenue store generated approximately $1.5 million in revenues.
Significant Role of Our Store Managers
We believe that our store managers directly affect the profitability of a store by their ability to reach and serve our customers effectively. Accordingly, we:
| • | provide monthly incentives to each store manager tied to his or her store’s financial results; |
| • | provide each store manager numerous opportunities to directly affect his or her store’s operating results; and |
| • | seek the most effective store management practices and share these practices company-wide. |
Because our store managers influence our store operating strategies, we believe that they have a greater commitment to the implementation of those strategies at the store level.
Balance Sheet Flexibility
Immediately after the closing of this offering, we will have no debt. As a result, our cash flow from operations will not be encumbered by debt. With cash flow from operations and the net proceeds from this offering, we will be poised to grow through the opening of de novo stores and opportunistic acquisitions. In addition, we will have the ability to leverage our assets to further grow the company.
Business Strategies
Our primary objective is to increase our profits by expanding our payday lending business and increasing comparable store revenues and gross profit. We believe that we can achieve this objective by focusing on payday lending, growing through de novo stores, opportunistically acquiring additional stores and implementing our Operational Excellence program.
Focus on Payday Loans
Our primary focus is to provide the most effective and efficient payday loan services available. We deemphasize low-margin ancillary services such as bill payments, and concentrate on payday lending. Our
42
Table of Contents
payday loan process is designed to be quick and efficient. Once the process is completed, future transactions can be processed in only a few minutes. We believe that this process improves the customer experience and increases customer loyalty. We believe that our application process also results in more favorable “word-of-mouth” advertising, while increasing loan volume in our stores.
Pursue De Novo Store Growth
Since 1998, we have grown from 48 stores in five states to 295 stores in 21 states, partly through opening 137 new, or de novo, stores. We believe that through de novo growth we can achieve strong return on capital due to our new store economics. See “—De Novo Store Economics.” In addition, de novo growth allows us to leverage our management infrastructure and to train managers and employees at the outset on our strategy and procedures. We also leverage our regional, area and store managers’ knowledge of their local markets to identify strong prospective new store locations. We believe that this approach results in de novo stores that are more acutely tailored to community-level demand.
Seek Opportunistic Acquisitions
Since 1998, we have acquired 137 stores. Though we are not actively undertaking an acquisition program, we consider acquisitions from time to time. Because of our position in the industry, payday lenders have offered to sell as few as one or as many as 119 stores to us. We believe that acquisitions will continue to play a role in our growth strategy due to the following:
| • | acquired stores provide immediate cash flow and an existing customer base; |
| • | larger acquisitions can provide sizable market share in new and existing markets; |
| • | acquired stores in existing markets also allow us to leverage our current management structure; and |
| • | acquired stores provide the opportunity to add key managers and employees. |
Promote Operational Excellence
In 2002, we developed our Operational Excellence program, which is designed to refine operational procedures and improve our internal processes. Through this program, we identify and disseminate company-wide processes designed to improve operational efficiencies, margins and the work environment. This program has become part of our culture and continues to foster improvements to our systems and procedures. Our Operational Excellence program reinforces our strategy of giving store managers the discretion, under corporate supervision, to determine how best to reach and serve the customer. We strive to identify the best practices from all our managers and share those practices company-wide.
We believe that our Operational Excellence program directly correlates to same store annual revenue and gross profit growth for stores open more than one year, as of December 31, 2003, of 36% and 57%, respectively.
De Novo Store Economics
The capital cost of opening a de novo store includes leasehold improvements, signage, computer equipment and security systems, and the cost varies depending on the store size and location and the services being offered. In fiscal 2003, we opened 45 de novo stores. The average capital cost and working capital requirements were approximately $150,000 per new store. On average, it takes approximately six months for our typical new store to obtain positive monthly store margins and another six months for the store to recoup the operating losses incurred during the first six months.
43
Table of Contents
The following tables show the average annual store revenues and the average store gross profit for de novo stores which were opened in the year indicated and were still open as of December 31, 2003. The following tables do not include results from acquired stores.
Year Opened: | Number of Existing Stores | Average Store Revenues Year Ended December 31, | |||||||||||||||||||
| 1999 | 2000 | 2001 | 2002 | 2003 | |||||||||||||||||
| (In thousands) | |||||||||||||||||||||
1998 and earlier | 28 | $ | 329.91 | $ | 350.46 | $ | 388.78 | $ | 401.06 | $ | 442.56 | ||||||||||
1999 | 4 | 112.94 | 229.40 | 323.77 | 387.85 | 468.20 | |||||||||||||||
2000 | 8 | 26.89 | 252.95 | 345.65 | 395.42 | ||||||||||||||||
2001 | 22 | 82.90 | 300.66 | 393.13 | |||||||||||||||||
2002 | 53 | 37.21 | 288.22 | ||||||||||||||||||
2003 | 45 | 68.90 | |||||||||||||||||||
Total de novo stores | 160 | ||||||||||||||||||||
Acquired stores | 134 | ||||||||||||||||||||
Total stores | 294 | ||||||||||||||||||||
Year Opened: | Number of Existing Stores | Average Store Gross Profit Year Ended December 31, | |||||||||||||||||||
| 1999 | 2000 | 2001 | 2002 | 2003 | |||||||||||||||||
| (In thousands) | |||||||||||||||||||||
1998 and earlier | 28 | $ | 128.60 | $ | 130.21 | $ | 148.77 | $ | 164.63 | $ | 190.73 | ||||||||||
1999 | 4 | 1.49 | 65.85 | 109.18 | 155.94 | 209.08 | |||||||||||||||
2000 | 8 | (29.06 | ) | 38.72 | 118.91 | 153.09 | |||||||||||||||
2001 | 22 | (45.80 | ) | 83.07 | 164.46 | ||||||||||||||||
2002 | 53 | (24.18 | ) | 80.13 | |||||||||||||||||
2003 | 45 | (34.45 | ) | ||||||||||||||||||
Total de novo stores | 160 | ||||||||||||||||||||
Acquired stores | 134 | ||||||||||||||||||||
Total stores | 294 | ||||||||||||||||||||
44
Table of Contents
Locations
The following chart shows the number of stores by state that were open as of December 31 from 1998 to 2003 and on March 31, 2004.
| December 31, | March 31, 2004 | |||||||||||||
| 1998 | 1999 | 2000 | 2001 | 2002 | 2003 | |||||||||
Arizona | 5 | 14 | 19 | 19 | ||||||||||
California | 29 | 32 | 36 | 49 | 53 | 53 | ||||||||
Colorado | 4 | 6 | 8 | 8 | ||||||||||
Florida | 1 | |||||||||||||
Idaho | 5 | 5 | 6 | 6 | 6 | |||||||||
Illinois | 14 | 13 | 27 | 26 | 26 | |||||||||
Indiana | 5 | 12 | 12 | 11 | 8 | 7 | 7 | |||||||
Kansas | 10 | 10 | 10 | 10 | 10 | 13 | 13 | |||||||
Kentucky | 7 | 9 | 10 | 10 | ||||||||||
Louisiana | 2 | 3 | 5 | 4 | ||||||||||
Mississippi | 4 | 6 | 6 | 8 | 7 | 7 | 7 | |||||||
Missouri | 23 | 30 | 33 | 35 | 39 | 47 | 47 | |||||||
Nevada | 3 | 4 | 5 | 5 | 5 | |||||||||
New Mexico | 15 | 16 | 19 | 19 | 19 | |||||||||
North Carolina | 6 | 22 | 23 | 24 | 24 | 20 | 20 | |||||||
Oregon | 7 | 7 | 7 | 4 | 4 | 4 | ||||||||
South Carolina | 2 | 2 | 3 | 3 | 3 | |||||||||
Utah | 9 | 9 | 10 | 12 | 12 | |||||||||
Virginia | 6 | 15 | 15 | |||||||||||
Washington | 6 | 5 | 6 | 6 | 9 | 10 | ||||||||
Wisconsin | 3 | 6 | 6 | |||||||||||
Total | 48 | 122 | 176 | 204 | 258 | 294 | 295 | |||||||
We generally choose store locations in high traffic areas providing visible signage and easy access for customers. Stores are generally in small strip-malls or stand-alone buildings. We choose store locations using a combination of market analysis, field surveys and our own site-selection experience.
Our store interiors are designed to provide a pleasant, friendly environment for customers and employees. Store hours vary by market based on customer demand, but generally are open from 9:00 a.m. to 7:00 p.m., Monday through Friday, with shorter hours on Saturdays. Stores are closed on Sundays.
Employees
On March 31, 2004, we employed 1,013 people. Store personnel constituted 876 of these people, 78 were regional management personnel and 59 were management, accounting, information systems, human resources, treasury, finance and administrative personnel.
We believe our relationship with our employees is good, and we have not suffered any work stoppages or labor disputes. None of our employees operates under a collective bargaining agreement.
Properties
We own two store locations, in Grandview, Missouri and Jackson, Mississippi, and our corporate headquarters in Kansas City, Kansas. Our corporate headquarters building is approximately 10,000 square feet. All our other locations are leased. Our average store size is 1,600 square feet. Leases are generally executed with
45
Table of Contents
a minimum initial term of between three to five years with multiple renewal options. We complete all necessary leasehold improvements and required maintenance.
Technology
We maintain an integrated system of applications and platforms for transaction processing. The systems provide improved customer service, internal control mechanisms, record keeping and reporting. We have two point of sale systems, one utilized by 243 stores as of March 31, 2004, and another utilized by 52 stores as of March 31, 2004. We work closely with our point of sale software vendors to continually enhance and update the applications. When we acquire stores we integrate these stores into our network.
Our systems provide our stores with customer information and history to enable our customer service representatives to perform transactions in an efficient manner. The integration of these systems allows for the accurate and timely reporting of information for corporate and field administrative staff. Information is distributed to the company’s accounting systems to provide for daily reconciliation and exception alerts.
On a daily basis, transaction data is collected at our headquarters and integrated into our management information systems. These systems are designed to provide summary, detailed and exception information to regional, area and store managers as well as corporate staff. Reporting is segmented by areas of operational responsibility and accessible through internet connectivity.
Security
The principal security risks to our operations are robbery and employee theft. We have put in place extensive security systems, dedicated security personnel and management information systems to address both areas of potential loss.
To protect against robbery, most store employees work behind bullet-resistant glass and steel partitions, and the back office, safe and computer areas are locked and closed to customers. Each store’s security measures include safes, electronic alarm systems monitored by third parties, control over entry to teller areas, detection of entry through perimeter openings, walls and ceilings and the tracking of all employee movement in and out of secured areas. Employees use cellular phones to ensure safety and security whenever they are outside the secure teller area. Additional security measures include identical alarm systems in all stores, remote control over alarm systems, arming/disarming and changing user codes and mechanically and electronically controlled time-delay safes.
Since we handle high volumes of cash and negotiable instruments at our locations, daily monitoring, unannounced audits and immediate responses to irregularities are critical. We have an internal auditing department that, among other things, performs periodic unannounced store audits and cash counts at randomly selected locations.
Advertising and Marketing
Our advertising and marketing efforts are designed to build customer loyalty and introduce new customers to our services. Our corporate marketing department primarily manages advertising in telephone directories and supervises store-level marketing. Store-level efforts include flyers, coupons, special offers or radio, television or outdoor advertising.
While many stores operate under our Quik Cash name, other names we use include California Budget Finance, National Quik Cash, First Payday Loans, Nationwide Budget Finance, Mississippi Check Cashers, Cash Connection and Check Advance Loans.
46
Table of Contents
Competition
We believe that the primary competitive factors in the payday loan industry are store location and customer service. We face intense competition in an industry with low barriers to entry, and we believe that the payday lending markets are becoming more competitive as these industries mature and consolidate. We compete with services offered by traditional financial institutions, such as overdraft protection, and with other payday and check cashing stores and other financial service entities and retail businesses that offer payday loans or other similar financial services.
Recently, businesses offering loans over the internet as well as “loans by phone” have begun to compete with us in the payday loan market. There also has been increasing penetration of electronic banking services into the check cashing and money transfer industry, including direct deposit of payroll checks and electronic transfer of government benefits.
Regulations
We are subject to regulation by foreign, federal and state governments that affect the products and services we provide. In general, this regulation is designed to protect consumers who deal with us and not to protect the holders of our securities, including our common stock.
Regulation of Payday Lending
Our payday lending and other consumer lending activities are subject to regulation and supervision at the state and federal levels. In those jurisdictions where we make consumer loans directly to consumers (currently all states in which we operate other than North Carolina), we are licensed as a payday lender where required and are subject to various state regulations regarding the terms of our payday loans and our policies, procedures and operations relating to those loans. Typically, state regulations limit the amount that we may lend to any consumer and, in some cases, the number of loans or transactions that we may make to any consumer at one time. These state regulations also typically restrict the amount of finance or service charges or fees that we may assess in connection with any loan or transaction and may limit a customer’s ability to renew or “rollover” a loan. We must also comply with the disclosure requirements of the Federal Truth In Lending Act and Regulation Z promulgated by the Board of Governors of the Federal Reserve System pursuant to that act, as well as the disclosure requirements of certain state statutes (which are typically similar or equivalent to those federal disclosure requirements). The state statutes also often specify minimum and maximum maturity dates for payday loans and, in some cases, specify mandatory cooling-off periods between transactions. Our collection activities regarding past due loans may also be subject to consumer protection laws and regulations relating to debt collection practices adopted by the various states and some states restrict the content of advertising regarding our payday loan activities.
We understand that in October 2002, the Federal Trade Commission sent an Information and Documentation Request to several national companies that offer payday loans. This industry-wide review may result in recommendations regarding the payday loan industry or specific conclusions about us, either of which may negatively affect our operations. During the last few years, legislation has been introduced in the U.S. Congress and in certain state legislatures, and regulatory authorities have proposed or publicly addressed the possibility of proposing regulations, that would prohibit or severely restrict payday loans. For example, in September 2001, we significantly reduced our payday loan activity until March 2003 at our stores in North Carolina as a result of new laws restricting payday loans in that state. More recently, the state of Georgia enacted a law banning payday loans in that state. This Georgia legislation also precludes use of the bank model. We intend to continue, with others in the payday loan industry, to inform and educate legislators and to oppose legislative or regulatory action that would prohibit or severely restrict payday loans. Nevertheless, if legislative or regulatory action with that effect were taken on the federal level or in states in which we have a significant number of stores, that action would have a material adverse effect on our loan-related activities and revenues. Moreover, similar action by states where we are not currently conducting business could result in us having fewer opportunities to pursue our growth strategy.
47
Table of Contents
Since 2003, we have had an arrangement with County Bank to originate and service payday loans for County Bank in North Carolina. County Bank is subject to supervision and regular examinations by the Delaware Office of the State Bank Commissioner and the FDIC. In July 2003, the FDIC issued guidelines governing permissible arrangements between a state-chartered bank and a marketer and servicer of the bank’s payday loans. Those guidelines apply to our marketing and servicing agreement with County Bank regarding the offering of County Bank loans at our North Carolina stores and our servicing activities regarding those loans. The guidelines describe the FDIC’s expectations for a bank’s prudent risk-management practices regarding payday loan marketing and servicing relationships. They address bank capital requirements, allowances for loan losses and loan classifications as well as income recognition, collection-recovery practices and compliance with consumer protection laws when a bank engages in payday lending. For example, the FDIC may under certain circumstances increase the capital requirements for banks involved in the payday lending business to as much as 100%. These potential capital requirements could make it substantially more expensive for such banks to engage in payday lending activity. If the FDIC’s implementation of those guidelines or the promulgation of any additional guidelines were to ultimately restrict the ability of all or certain state-chartered banks, including County Bank, to maintain relationships with payday loan servicers like us, it could have a material adverse impact on our loan-related activities and revenue. The Office of the Comptroller of the Currency, which supervises national banks, took action in 2002 to effectively prohibit certain national banks from offering and making payday loans because of various risks it believes payday lending poses to those banks.
As a result of our arrangement with County Bank, our activities regarding County Bank loans are also subject to examination by the FDIC and the other regulatory authorities to which County Bank is subject. To the extent an examination involves review of the County Bank loans and related processes, the regulatory authority may require us to provide requested information and to grant access to our pertinent locations, personnel and records.
We were a defendant in two class action lawsuits in Indiana shortly after the Indiana Attorney General issued an opinion in January 2000 that payday lenders were subject to the maximum annual percentage rates set out in the Indiana Consumer Credit Code. Both lawsuits alleged that, among other things, we charged interest in excess of the maximum rate permitted by Indiana law. In August 2001, the Indiana Supreme Court affirmed the Indiana Attorney General’s position that payday loans were subject to the statutory usury ceilings and related criminal statutes. We settled both lawsuits for approximately $1.0 million in late 2001. In 2002, the Indiana legislature revised the Indiana Consumer Credit Code to exempt the payment of finance charges to licensed payday lenders from the state usury limits.
Regulation of Check Cashing
We are subject to regulation in several jurisdictions in which we operate that require the registration or licensing of check cashing companies or regulate the fees that check cashing companies may impose. Some states require fee schedules to be filed with the state, while others require the conspicuous posting of the fees charged for cashing checks by each store. In other states, check cashing companies are required to meet minimum bonding or capital requirements and are subject to recordkeeping requirements. We are licensed in each of the states or jurisdictions in which a license is currently required for us to operate as a check cashing company and have filed our schedule of fees with each of the states or other jurisdictions in which such a filing is required. To the extent those states have adopted ceilings on check cashing fees, the fees we currently charge are at or below the maximum ceiling.
Regulation of Money Transmission and Sale of Money Orders
We are subject to regulation in several jurisdictions in which we operate that (1) require the registration or licensing of money transmission companies or companies that sell money orders and (2) regulate the fees that such companies may impose. In some states, companies engaged in the money transmission business are required to meet certain minimum bonding and/or capital requirements, are prohibited from commingling the proceeds from the sale of money orders with other funds and are subject to various recordkeeping requirements. We are
48
Table of Contents
licensed in each of the states or jurisdictions in which a license is currently required for us to operate as a money transmitter. In some states we act as agent for Western Union in the sale of money orders. This is not a significant component of our business. Certain states, including California where we operate a total of 53 stores, have enacted so-called “prompt remittance” statutes which specify the maximum time for payment of proceeds from the sale of money orders to the issuer of the money orders. In this way, the statutes limit the number of days, known as the “float,” that we have use of the money from the sale of a money order.
Currency Reporting Regulation
Regulations promulgated by the United States Department of the Treasury under the Bank Secrecy Act require reporting of transactions involving currency in an amount greater than $10,000, or the purchase of monetary instruments for cash in amounts from $3,000 to $10,000. In general, every financial institution must report each deposit, withdrawal, exchange of currency or other payment or transfer that involves currency in an amount greater than $10,000. In addition, multiple currency transactions must be treated as a single transaction if the financial institution has knowledge that the transactions are by, or on behalf of, any one person and result in either cash in or cash out totaling more than $10,000 during any one business day. We believe that our point of sale systems and employee training programs support our compliance with these regulatory requirements.
Also, money services businesses are required by the Money Laundering Act of 1994 to register with the United States Department of the Treasury. Money services businesses include check cashers and sellers of money orders. Money services businesses must renew their registrations every two years, maintain a list of their agents, update the agent list annually and make the agent list available for examination. In addition, the Bank Secrecy Act requires money services businesses to file a Suspicious Activity Report for any transaction conducted or attempted involving amounts individually or in total equaling $2,000 or greater, when the money services business knows or suspects that the transaction involves funds derived from an illegal activity, the transaction is designed to evade the requirements of the Bank Secrecy Act or the transaction is considered so unusual that there appears to be no reasonable explanation for the transaction. The USA PATRIOT Act includes a number of anti-money laundering measures designed to prevent the banking system from being used to launder money and to assist in the identification and seizure of funds that may be used to support terrorist activities. The USA PATRIOT Act includes provisions that directly impact check cashers and other money services businesses. Specifically, the USA PATRIOT Act requires all check cashers to establish certain programs designed to accurately identify those conducting transactions and to detect and report money laundering activities to law enforcement. We believe we are in compliance with the USA PATRIOT Act.
Privacy Regulation
We are subject to a variety of foreign, federal and state laws and regulations restricting the use and seeking to protect the confidentiality of the customer identity and other personal customer information. We have identified our systems that capture and maintain non-public personal information, as that term is used in the privacy provisions of the Gramm-Leach-Bliley Act and its implementing federal regulations. We disclose our public information policies to our customers as required by that law. We have systems in place intended to safeguard this information as required by the Gramm-Leach-Bliley Act.
Legal Proceedings
We are currently involved in ordinary, routine litigation and administrative proceedings incidental to our business. We believe the likely outcome of these cases and proceedings will not be material to our business or financial condition.
49
Table of Contents
Directors and Executive Officers
Our current directors, those individuals chosen to become directors upon completion of this offering, and our executive officers, as well as certain information about them, follows:
Name | Age | Position | ||
Don Early | 61 | Chairman, Chief Executive Officer and Director | ||
Mary Lou Andersen | 59 | Vice Chairman, Secretary and Director | ||
Gregory L. Smith | 68 | Director | ||
Richard B. Chalker* | 63 | Director | ||
Gerald F. Lamberti* | 75 | Director | ||
Francis P. Lemery* | 64 | Director | ||
Mary V. Powell* | 73 | Director | ||
Darrin J. Andersen | 36 | President and Chief Operating Officer | ||
Douglas E. Nickerson | 38 | Chief Financial Officer | ||
Robert L. Albin | 63 | Senior Vice President | ||
R. Michael Peck | 60 | Regional Vice President, Western U.S. | ||
David M. Kusuda | 58 | Regional Vice President, Eastern U.S. |
| * | Mr. Chalker, Mr. Lamberti, Mr. Lemery and Ms. Powell joined the board of directors immediately |
after the registration statement of which this prospectus forms a part was declared effective.
Don Early has served as Chairman of the Board and Chief Executive Officer of the company since May 2004. Mr. Early founded the company in 1984 and has served as a director since then. He served as President and Chief Executive Officer from 1984 until May 2004. He started our company as a rent-to-own business in 1984. In 1994, the company sold its six rent-to-own stores. Mr. Early and Ms. Andersen have a long-standing personal relationship. Mr. Early holds a degree in Business Administration from the University of Missouri.
Mary Lou Andersen has served as Vice Chairman of our board of directors since May 2004. She has been employed by the company in a variety of executive positions since 1988, including Vice President and Chief Operating Officer until May 2004. Ms. Andersen became a director of the company in 1997. Ms. Andersen and Mr. Early have a long-standing personal relationship. Ms. Andersen is the mother of Darrin Andersen.
Gregory L. Smith has served as a director of the company since 1988. Mr. Smith is an individual investor and is retired from the financial services industry. He became a stockholder and director of the company in 1988. In 1982, he co-founded Smith Breeden Associates, Inc., a privately held financial advisory firm to the savings and loan industry. From 1978 until 1982, Mr. Smith owned an investment advisory firm. Prior to 1978, he was employed with a variety of investment banking firms, including E.F. Hutton and Company and Dillon Read. Mr. Smith has previously served as a director of various savings banks. He holds a degree in Journalism from the University of Missouri.
Richard B. Chalker joined the company’s board of directors immediately after the registration statement of which this prospectus forms a part was declared effective. Mr. Chalker currently serves as a director of PBI/Gordon Corporation, an employee-owned manufacturer of pesticides and professional turf and agricultural products. Mr. Chalker also serves as a director of Decorize, Inc., a manufacturer of home furnishings and accessories. Decorize, Inc. is listed on the American Stock Exchange. Mr. Chalker retired in 2004 as Division Vice President, Tax and Customs, of Hallmark Cards after nine years of service. Mr. Chalker also spent 32 years at Ernst & Young LLP, including 19 years as a partner specializing in taxation. He holds a degree in Industrial Administration from Yale University and a law degree from DePaul University.
Gerald F. Lamberti joined the company’s board of directors immediately after the registration statement of which this prospectus forms a part was declared effective. Mr. Lamberti retired from the Federal
50
Table of Contents
Deposit Insurance Corporation in 1998, where he was an attorney for over 25 years, including the last 13 years as Regional Counsel, Kansas City Region, FDIC. Prior to joining the FDIC, Mr. Lamberti was Deputy General Counsel of the United States Catholic Conference in Washington, D.C. He holds a degree in Accounting from St. John’s University School of Commerce and a law degree from St. John’s University Law School. Mr. Lamberti served three years in the U.S. Air Force in the Korean War, in which he received the Distinguished Flying Cross.
Francis P. Lemery joined the company’s board of directors immediately after the registration statement of which this prospectus forms a part was declared effective. He retired in 1999 as Senior Vice President and Actuary of Kansas City Life Insurance Company, a publicly traded company. He served on the board of directors of Kansas City Life from 1985 to 1999. Mr. Lemery has been a Fellow of the Society of Actuaries since 1968, and a member of the American Academy of Actuaries since 1969. He holds a degree in Business Administration and a masters degree in Actuarial Science from the University of Michigan.
Mary V. Powell joined our board of directors immediately after the registration statement of which this prospectus forms a part was declared effective. Ms. Powell has been a partner in Johnson-Powell Accounting Services for more than 25 years, where she provides accounting, auditing and tax preparation services primarily to privately-owned businesses. Ms. Powell has been engaged in providing accounting, auditing and tax preparation services to individuals and private businesses since 1968.
Darrin J. Andersen has served as our President and Chief Operating Officer since May 2004. He joined the company in February 1998 and served as our Chief Financial Officer from December 1999 until April 2004. Prior to joining the company, Mr. Andersen worked in the accounting department of Newell Rubbermaid, a manufacturing company listed on the New York Stock Exchange, and in the audit group of Deloitte & Touche. Mr. Andersen is the President-elect of the CFSA. Mr. Andersen is the son of Mary Lou Andersen. Mr. Andersen holds a degree in Accounting from the University of Kansas, and earned a Certified Public Accountant certificate in 1992.
Douglas E. Nickerson has served as our Chief Financial Officer since April 2004. Prior to joining the company, Mr. Nickerson served for eight years in various management positions with Stilwell Financial Inc., now known as Janus Capital Group, Inc., a New York Stock Exchange-listed provider of diversified financial services. From 2001 to 2003, Mr. Nickerson served as Vice President — Controller and Treasurer of Stilwell, and from 1999 to 2001 served as Vice President — Controller. Mr. Nickerson holds a degree in Accounting from Kansas State University and a law degree from the University of Missouri — Kansas City. He is a Certified Public Accountant.
Robert L. Albin has served as Senior Vice President since February 2003. He was a consultant to the company for approximately six months before joining the company. Prior to that, Mr. Albin served three years with Western Union North America, a financial services company, as Executive Vice President and Chief Operating Officer. Prior to that time, Mr. Albin was President of First Data Payment Services, a division of First Data Corp, a New York Stock Exchange listed financial services company. Mr. Albin also served as President-Domestic Retail Services for First Data Corp, overseeing the American Express Money Order and Money Gram worldwide money wiring services. Mr. Albin holds a degree in History and Political Science from Missouri Valley College.
R. Michael Peck has served as Regional Vice President, Western U.S., since January 2000. Prior to joining the company, Mr. Peck spent 24 years with House of Lloyd’s, a direct marketing consumer products company, as an operations manager and Vice President of Sales. Mr. Peck holds degrees in Biology and Administration and a masters degree in Education from the University of Missouri.
David M. Kusuda has served as Regional Vice President, Eastern U.S., since December 2001. Prior to joining the company, Mr. Kusuda spent seven years with First Data Corp, in its Western Union Division as Senior Vice President, Agent Network Management. Prior to joining First Data Corp he served for three years as National Sales Manager of Innovative Services of America. Mr. Kusuda also spent 14 years with Citicorp where he held various sales and marketing positions. Mr. Kusuda holds a degree in Business Administration from Regis University.
51
Table of Contents
Board of Directors and Committees
Mr. Chalker, Mr. Lamberti, Mr. Lemery and Ms. Powell joined our board of directors immediately after the registration statement of which this prospectus forms a part was declared effective. Our board currently has five independent directors as that term is defined by the Nasdaq National Market. Our board of directors maintains audit, nominating or compensation committees, in compliance with the requirements of the Nasdaq National Market and the SEC.
Executive Compensation
The following table sets forth information with respect to the compensation of our Chief Executive Officer and each of our four most highly compensated executive officers whose annual total salary and bonus in fiscal 2003 exceeded $100,000:
| Annual Compensation | All Other Compensation($)(5) | ||||||||||||||
Name and Principal Position | Year | Salary ($) | Bonus ($) | Other Annual Compensation ($) | |||||||||||
Don Early | |||||||||||||||
Chairman and Chief Executive Officer | 2003 | $ | 150,000 | $ | 200,844 | $ | 66,209 | (1) | $ | 1,763 | |||||
Mary Lou Andersen | |||||||||||||||
Vice Chairman | 2003 | 118,500 | 92,000 | 51,942 | (2) | 1,348 | |||||||||
Darrin J. Andersen | |||||||||||||||
President and Chief Operating Officer | 2003 | 127,500 | 130,000 | 4,150 | (3) | 2,051 | |||||||||
Robert L. Albin | |||||||||||||||
Senior Vice President | 2003 | 137,500 | 3,000 | 62,500 | (4) | 1,170 | |||||||||
David M. Kusuda | |||||||||||||||
Regional Vice President, Eastern U.S. | 2003 | 137,500 | 28,000 | — | 2,381 | ||||||||||
| (1) | Consists of directors’ fees of $12,000, car expense of $7,600 and payment of personal expenses of $46,609. Excludes $153,573, the annual premium paid by us for insurance on Mr. Early’s life. We are contractually obligated to use the proceeds of this insurance policy to redeem shares of our common stock from Mr. Early’s estate at the then-current market value. Our obligation to redeem the shares and to maintain this insurance policy terminated effective June 30, 2004. |
| (2) | Consists of directors’ fees of $12,000, car expense of $7,600 and payment of personal expenses of $32,342. |
| (3) | Consists of car expense. |
| (4) | Consists of consulting fees earned in 2003 before Mr. Albin became an employee of the company. |
| (5) | Consists of the company’s contribution to the employee’s 401(k) plan. |
We did not grant any restricted stock, stock options, stock appreciation rights or other long-term incentive compensation to any of the named executive officers in 2003. Effective June 1, 2004, we increased the base salary of our three most highly-compensated executives. The annual salary of Mr. Early, Ms. Andersen and Mr. Andersen increased to $500,000, $400,000 and $300,000, respectively.
Option Grants in Last Fiscal Year
No options were granted to any of the named executive officers in the last fiscal year.
52
Table of Contents
The following table sets forth information concerning stock options exercised by the named executive officers during the year ended December 31, 2003, and the number of shares and the value of the options outstanding as of December 31, 2003, for each named executive officer. All of the information set forth below relates to the grant of stock options under the QC Holdings, Inc. 1999 Stock Option Plan.
Aggregated Option Exercises in Last Fiscal Year and Fiscal Year-End Option Values
| ||||||||
Name | Shares (#) | Value Realized ($) | Number of Securities Underlying Unexercised Options at Fiscal Year End (#) | Value of Unexercised ($) | ||||
| (Exercisable/Unexercisable) | (Exercisable/Unexercisable) | |||||||
Don Early | — | — | — | — | ||||
Mary Lou Andersen | — | — | — | — | ||||
Darrin J. Andersen | — | — | 200,000 / 0 | 800,000 / 0 | ||||
Robert L. Albin | — | — | 50,000 / 150,000 | 177,500 / 532,500 | ||||
David M. Kusuda | — | — | 100,000 / 100,000 | 355,000 / 355,000 | ||||
| (1) | An assumed fair market value of $6.00 per share was used to calculate the value of the options. As the shares are not traded in an established public market, the value assigned is based upon the tax valuation used at the time of the last exercise of a stock option by an employee of the company which occurred on April 14, 2004. |
In May 2004, we agreed to grant Douglas E. Nickerson, our Chief Financial Officer, an option to purchase 50,000 shares of our common stock at an option exercise price per share equal to the public offering price in this offering. The options are exercisable for 10 years from the date of grant and vest ratably over four years.
In June 2004, we agreed to grant 25 employees options to purchase up to a total of 342,500 shares of our common stock at an option exercise price per share equal to the public offering price in this offering. This grant includes a grant to Darrin J. Andersen, our President and Chief Operating Officer, of an option to purchase 50,000 shares of our common stock and a grant to Douglas E. Nickerson, our Chief Financial Officer, of an option to purchase 20,000 shares of our common stock. The options are exercisable for 10 years from the date of grant and vest ratably over four years.
In June 2004, we agreed to grant to each of Gregory L. Smith, Richard B. Chalker, Francis P. Lemery, Mary V. Powell and Gerald F. Lamberti options to purchase 7,500 shares of our common stock at an option exercise price per share equal to the public offering price in this offering. The options are exercisable for 10 years from the date of grant and are fully vested upon the date of grant.
1999 Stock Option Plan
Our 1999 Stock Option Plan is intended to establish and continue a close identity of interests between the company and its employees and non-employee directors. The material terms of the 1999 plan follow:
Shares Subject to Plan. The aggregate number of shares of common stock reserved and available for issuance under the 1999 plan is 1,700,000, of which 1,412,500 were underlying outstanding stock options as of March 31, 2004. Shares of stock covered by options that are terminated in accordance with the provisions of the 1999 plan are eligible for the granting of further options under the 1999 plan. The number of shares of common stock reserved for issuance is generally subject to appropriate and equitable adjustment upon the occurrence of any reorganization, merger, consolidation, recapitalization, stock split, or stock dividend.
Administration. The plan is administered by a Stock Option Committee consisting of at least two and no more than five directors selected by our board of directors. Currently, the board of directors acts as the Stock Option Committee. Upon the closing of this offering, the 1999 plan will be administered by the compensation
53
Table of Contents
committee as designated by our board of directors. Each member of the compensation committee will be a “nonemployee director” (within the meaning of Rule 16b-3 promulgated under Section 16 of the Securities Exchange Act of 1934) and an “outside director” (within the meaning of Section 162(m) of the Internal Revenue Code). The compensation committee will have authority to construe and interpret the 1999 plan and any awards made thereunder, to grant and determine the terms of awards and to make any necessary rules and regulations for the administration of the 1999 plan.
Eligibility. Persons eligible to receive options under the 1999 plan are those employees (including officers) and non-employee directors selected by the Stock Option Committee in its sole discretion.
Type of Awards. Nonqualified stock options or incentive stock options may be granted under the 1999 plan. The total number of shares subject to incentive stock options granted to any participant in the 1999 plan that are first exercisable during any calendar year must have an aggregate fair market value that does not exceed $100,000 (determined as of the date the option is granted).
Amendment and Termination. The 1999 plan terminates on December 21, 2009. The plan may be amended by the board of directors, from time to time, provided that such amendment does not (1) reduce the number of shares of common stock subject to any outstanding option or change the conditions thereof without the consent of the optionee, (2) materially increase the total number of shares of common stock that may be issued under the plan, (3) reduce the minimum exercise price at which any option may be granted, (4) materially increase the benefits accruing to participants, or (5) alter the class of eligible persons.
Exercisability, Vesting and Price of Awards. The stock options will vest and be exercisable at the times and upon the conditions provided in each option agreement according to the terms decided by the Stock Option Committee. The price at which shares subject to any stock options may be purchased are reflected in each particular stock option agreement. The exercise price of an incentive stock option may not be less than 100% (or in the case of a holder of more than 10% of the voting stock of the company, 110%) of the fair market value per share of stock subject to the option as of the grant date. The exercise price of a nonqualified stock option may not be less than 85% of the fair market value per share of stock subject to the option as of the grant date.
All options granted under the 1999 plan have been granted with an exercise price that the board of directors has determined was equal to the fair market value of the common stock on the date of grant.
2004 Equity Incentive Plan
Our 2004 Equity Incentive Plan is intended to provide employees, consultants and non-employee directors of the company and its subsidiaries with added incentive to remain employed by the company and align such individuals’ interests with those of the company’s stockholders. The material terms of the 2004 plan are as follows:
General. The 2004 plan provides for the granting of stock options, stock appreciation rights, performance share awards, restricted stock awards, cash bonus awards and other incentive awards to designated eligible participants.
Eligibility. Employees, consultants, independent contractors and non-employee directors of the company, its subsidiaries and affiliates as may be identified by our compensation committee are eligible to be granted awards under the 2004 plan. However, incentive stock options may be granted only to employees of the company.
Plan Administration. The 2004 plan will be administered by our compensation committee, or such other committee as the board may determine. The compensation committee will have the sole discretion to administer and interpret the 2004 plan and to determine who shall be granted awards, the size and types of such awards and the terms and conditions of such awards.
Shares Subject to the 2004 Plan. The aggregate number of shares of common stock of the company reserved and available for issuance under the 2004 plan is 3,000,000.
54
Table of Contents
Stock Options. Both incentive stock options and nonqualified stock options may be granted under the 2004 plan provided that incentive stock options may only be granted to employees of the company or its subsidiaries. The exercise price per share of our common stock subject to each option will be set by the compensation committee but may not be less than the fair market value on the date of grant. Options granted under the 2004 plan will be exercisable at the times and on the terms established by the compensation committee. The grant and the terms of incentive stock options shall be restricted to the extent required by the Internal Revenue Code. The option price must be paid in full in cash or, subject to certain conditions, by the tender of previously acquired shares of the company’s common stock or such other legal consideration which the compensation committee determines to be consistent with the 2004 plan’s purpose and applicable law.
The 2004 plan limits the number of options that can be granted to any individual during any calendar year to 200,000 shares. This limitation is applicable to other awards made under the 2004 plan to the extent such awards are settled in shares of company common stock.
Stock Appreciation Rights. The 2004 plan permits the grant of two types of stock appreciation rights: freestanding stock appreciation rights, tandem stock appreciation rights, or any combination thereof. A freestanding stock appreciation right is a stock appreciation right that is granted independently of any option. A tandem stock appreciation right is a stock appreciation right that is granted in connection with a related option, the exercise of which requires a forfeiture of the right to purchase a share under the related option (and when a share is purchased under the option, the stock appreciation right is similarly canceled). The compensation committee will have complete discretion to determine the number of stock appreciation rights granted to any optionee or recipient and the terms and conditions pertaining to such stock appreciation rights, provided, however, that in the case of a tandem stock appreciation right, the exercise price of the stock appreciation right shall be equal to the exercise price of the related option. At no time may a tandem stock appreciation right be issued if the exercise price of its related option is less than 100% of the fair market value of the company’s common stock on the date of the grant.
Performance Share Awards. The 2004 plan permits the grant of performance share awards each of which shall represent one share of the company’s common stock. Each performance share shall represent the right of the grantee to receive an amount based on the value of the performance share, if performance goals established by the compensation committee are met. When performance shares are granted, the compensation committee shall establish a performance period during which performance shall be measured and shall determine to what extent the performance goals and other conditions of the performance shares are met.
Restricted Stock Awards. The 2004 plan permits the grant of restricted stock awards. Restricted stock may be issued or transferred for consideration or for no consideration, as may be determined by the compensation committee. The compensation committee may establish conditions under which restrictions on shares of restricted stock shall lapse over a period of time. The holder of a restricted stock award may not sell, transfer, pledge, exchange, hypothecate or otherwise dispose of the restricted shares during the applicable restriction period. The compensation committee may accelerate the time at which any restrictions lapse, or remove any restrictions. During any restriction period, the compensation committee may grant to the holder of a restricted stock award all or any of the rights of a stockholder in the company including, but not limited to, the right to vote and to receive dividends.
Cash Bonus Awards. The 2004 plan permits the compensation committee to award cash bonus payments. Such cash bonuses shall be determined based upon the recipient’s level of responsibility in the company and the competitive compensation of other major businesses as such factors may be deemed appropriate by the compensation committee. Cash bonuses will be paid out of a fund established by the compensation committee for a particular performance period upon achievement of performance goals established by the compensation committee. The compensation committee may establish such other conditions, restrictions or limitations on the cash bonuses consistent with the terms of the 2004 plan as it may deem appropriate.
Other Incentive Awards. The compensation committee may grant other types of awards of or based on the common stock of the company. Any other award will have such terms and be subject to such conditions and limitations as the compensation committee may determine.
55
Table of Contents
Nontransferability of Awards. Awards granted under the 2004 plan may not be sold, transferred, pledged, assigned, or otherwise alienated or encumbered, other than by will or by the applicable laws of descent and distribution, or as may otherwise be specifically permitted by the compensation committee.
Amendment and Termination of the 2004 Plan. Except as specifically provided for in the 2004 plan, the compensation committee or the board of directors of the company may amend or terminate the 2004 plan at any time or from time to time, without obtaining the approval of the company’s stockholders. The company, however, cannot amend the 2004 plan without obtaining the approval of the company’s stockholders: (1) to increase the aggregate number of shares issuable under the 2004 plan, (2) to change the option price of optioned stock except for certain permitted adjustments, (3) to change the requirement that the option price per share of common stock covered by an incentive stock option granted under the 2004 plan not be less than 100% of the fair market value of such stock, (4) to extend the time within which options may be granted or the time within which a grant may be exercised, (5) to change any granted option without the consent of the optionee, or, (6) to make any amendment that requires stockholder approval under Section 162(m) of the Internal Revenue Code. Unless terminated earlier by the compensation committee, the 2004 plan shall terminate on the day immediately preceding the tenth anniversary of its effective date, unless the 2004 plan is extended with the approval of the stockholders.
The board of directors granted stock options under the 2004 plan immediately prior to the effectiveness of the registration statement of which this prospectus forms a part to purchase an aggregate of 380,000 shares of common stock at an option exercise price equal to the price per share in this offering.
Employment Agreements
The company does not have employment agreements with any of the named executive officers.
Director Compensation
Our directors currently receive $12,000 per year as compensation for their service on the board of directors. Upon completion of the offering, we intend to implement a director compensation plan to provide non-employee directors with appropriate compensation for service on the board of directors and any committee of the board on which they serve. We do not intend to provide our employee directors with compensation for their service on the board other than reimbursement provided to all directors for reasonable out-of-pocket expenses incurred in attending board and committee meetings. We granted options to purchase 7,500 shares of common stock, at an exercise price per share equal to the public offering price in this offering, to each of our non-employee directors immediately prior to the effectiveness of the registration statement of which this prospectus forms a part.
Compensation Committee Interlocks and Insider Participation
Historically, our entire board of directors, including Don Early, our Chairman and Chief Executive Officer, and Mary Lou Andersen, our Vice Chairman, have participated in deliberations regarding executive officer compensation. Our compensation committee currently consists solely of non-employee directors, which will determine executive compensation. No interlocking relationship exists between our board of directors or compensation committee and the board of directors or compensation committee of any other company.
56
Table of Contents
CERTAIN RELATIONSHIPS AND RELATED PARTY TRANSACTIONS
Beginning in 1999, companies controlled by Don Early, our Chief Executive Officer, and Mary Lou Andersen, our Vice Chairman, acquired six coin-operated laundromats. In exchange for the right to offer our check cashing or payday loan services at these locations, we maintained oral agreements with the laundromat companies to pay all or a portion of the rent, utilities, employee or maintenance expenses at the laundromats. We entered into these arrangements to determine whether check cashing and payday loan operations could be effectively combined with a laundromat store. Three of the six laundromat locations have been sold and the remaining three are currently offered for sale. During 2003 and the first quarter of 2004, we continued to pay a portion of the expenses at one laundromat at which we continue to offer payday loans. In 2003, we incurred total store expenses for this one shared payday loan and laundromat store of $175,770. We also advanced funds on a non-interest-bearing basis to each of the laundromat companies to cover a portion of their operating shortfalls. The aggregate unpaid amount owed to us by the laundromat companies at March 31, 2004, was $176,000. The laundromat companies repaid all indebtedness owed to us in June 2004.
In 1997, we loaned Ms. Andersen $88,000 to purchase 799,000 shares of our common stock. Ms. Andersen signed a promissory note bearing interest at a variable rate, which ranged from 6% in 2001 to 1.62% in March 2004. The highest amount of indebtedness outstanding under the loan during 2003 was $45,711. We also loaned Ms. Andersen $43,543 in 2001 for personal purposes. Ms. Andersen signed a promissory note bearing interest at a variable rate, which ranged from 4.75% to 1.62%. The highest amount of indebtedness outstanding under this loan during 2003 was $42,758. Ms. Andersen repaid these loans in full in March 2004.
In 1999, we loaned Darrin J. Andersen, our President, $120,360 to purchase 244,000 shares of our common stock. Mr. Andersen signed a promissory note bearing interest at a variable rate, which ranged from 6% in 2001 to 1.62% in March 2004. The highest amount of indebtedness outstanding under the loan during 2003 was $111,238. The outstanding amount of the loan on March 31, 2004 was $98,688. We also loaned Mr. Andersen $100,000 in December, 2003 for personal purposes. Mr. Andersen signed a promissory note bearing interest at a variable rate, which decreased from 1.81% in 2003 to 1.62% in March 2004. The highest amount of indebtedness outstanding under the loan during 2003 was $100,000, and, as of March 31, 2004, the outstanding amount of the loan was $100,000. Mr. Andersen repaid the loans in full in May 2004.
In 1999, we redeemed 1,710,000 shares of our common stock from Gregory L. Smith, a director of the company, at a total redemption price of $2,100,000. We paid a portion of the redemption price in cash and issued Mr. Smith a $500,000 subordinated note bearing interest at 9% for the balance of the redemption price. Throughout 2002 and 2003, the unpaid principal balance of the subordinated note was $400,000. We made interest payments to Mr. Smith of $36,000 in each of those years. Through March 31, 2004, we had paid $200,000 in principal and $4,500 in interest payments to Mr. Smith to reduce the remaining principal balance of the loan to $200,000. In April 2004, we repaid Mr. Smith’s loan, and $1,500 in additional interest.
Mr. Smith’s son, Darin Smith, is a company employee. He currently serves as one of our three Regional Directors. In 2003, we paid Darin Smith salary and bonus totaling approximately $108,000. In 2000, we granted Darin Smith an option to purchase 40,000 shares of common stock at an exercise price of $2.45 per share.
We loaned R. Michael Peck, our Regional Vice President for the Western U.S., $51,000 through May 1, 2004, and have agreed to loan him up to $78,000 for personal purposes. The promissory note bears interest at a variable interest rate equal to the applicable federal rate under the Internal Revenue Code. As of March 31, 2004, the applicable federal rate for this type of loan was 1.62%. The note matures on January 1, 2009. Mr. Peck repaid the loan and agreed to cancel the outstanding loan commitments in June 2004.
In February 2004, we purchased a single-family residence with nine acres of land in Pauma Valley, California for approximately $1,330,000. We have agreed that upon completion of the offering we will sell the house to Mr. Early and Ms. Andersen for fair value, expected to equal the purchase price plus the amount we incurred in furnishing the residence.
57
Table of Contents
We maintain $15 million of life insurance on Mr. Early and $2 million of life insurance on Gregory Smith. Both policies are term policies that we own and under which the company is the beneficiary. We previously agreed pursuant to a stockholders agreement with Mr. Early and Mr. Smith, subject to the terms of any applicable bank agreements, to use the proceeds of those insurance policies to repurchase a portion of the shares of our common stock held by Mr. Early or Mr. Smith, as applicable, upon their death. Annual premiums for the policies on Mr. Early and Mr. Smith are $154,000 and $11,000 respectively. We have agreed with Mr. Early and Mr. Smith to terminate this agreement. This termination is effective June 30, 2004. We intend to cancel the life insurance policy on Mr. Smith effective that day. We presently intend to maintain the life insurance on Mr. Early, but, effective June 30, 2004, our obligation to use the life insurance proceeds to purchase any stock from Mr. Early’s estate terminated.
In exchange for Mr. Early’s agreement to terminate the requirement to maintain life insurance and the stock repurchase obligations, we have entered into a Registration Rights Agreement with Mr. Early. The Registration Rights Agreement grants to Mr. Early’s estate and certain beneficiaries of his estate three demand registration rights, which may be effected by the holders of stock from Mr. Early’s estate for up to two years after his death. Demand registration may be effected only if the gross proceeds of the offering are at least $15 million. We have agreed to pay the expenses of each demand registration, other than underwriting commissions and discounts and the fees of counsel to the selling stockholders in the registration. The agreement includes certain other customary provisions for a registration rights agreement, including various obligations of the company to facilitate the filing and effectiveness of the demand registrations.
58
Table of Contents
SECURITY OWNERSHIP OF CERTAIN BENEFICIAL OWNERS AND MANAGEMENT
The following table sets forth the number of shares of our common stock beneficially owned by: (1) each director and nominee for election as a director of the company; (2) each executive officer; (3) all directors and executive officers as a group; and (4) each person that is the beneficial owner of more than 5% of our common stock. Beneficial ownership for directors, director nominees, and officers is shown as of May 31, 2004. Information is also provided with respect to beneficial ownership immediately following the offering.
Name and Address of Beneficial Owner (1) | Amount and Nature of Beneficial Ownership | Percent of Shares Outstanding Before Offering | Percent of Class After Offering(2) | |||||
Don Early | 9,175,000 | 59.7 | % | 45.0 | % | |||
Mary Lou Andersen | 799,000 | 5.2 | % | 3.9 | % | |||
Gregory L. Smith (3)(4) | 4,078,500 | 26.5 | % | 20.0 | % | |||
Richard B. Chalker (4) | 7,500 | * | * | |||||
Gerald F. Lamberti (4) | 7,500 | * | * | |||||
Francis P. Lemery (4) | 7,500 | * | * | |||||
Mary V. Powell (4) | 7,500 | * | * | |||||
Darrin J. Andersen (5) | 444,000 | 2.9 | % | 2.2 | % | |||
Robert L. Albin (6) | 50,000 | * | * | |||||
David M. Kusuda (7) | 100,000 | * | * | |||||
Douglas E. Nickerson | 0 | * | * | |||||
R. Michael Peck (8) | 360,000 | 2.3 | % | 1.7 | % | |||
All directors, nominees and executive officers as a group (12 persons) (9) | 15,036,500 | 93.3 | % | 71.2 | % |
| * | Less than one percent. |
Mr. Early, Ms. Andersen, Mr. Smith and Mr. Andersen have agreed to sell to the underwriters up to 475,000, 40,000, 215,000 and 20,000 shares, respectively, pursuant to the over-allotment option exercised by the underwriters, if it is exercised. The foregoing table does not reflect those potential sales.
| (1) | The address of all of the named individuals is c/o QC Holdings, Inc., 2812 West 47th Avenue, Kansas City, Kansas 66103. |
| (2) | Assumes no exercise of the underwriter’s over-allotment option. |
| (3) | Excludes 219,000 shares held in irrevocable trusts for the benefit of Mr. Smith’s children and grandchildren, over which Mr. Smith has no investment or voting power. |
| (4) | Includes options to acquire 7,500 shares of common stock, at an exercise price per share equal to the public offering price in this offering, which were granted to each of the non-employee directors |
immediately before the registration statement of which this prospectus forms a part was declared effective.
| (5) | Includes options to purchase 200,000 shares of our common stock, which are currently exercisable. |
| (6) | Represents options to purchase 50,000 shares of our common stock, which are currently exercisable. |
| (7) | Represents options to purchase 100,000 shares of our common stock, which are currently exercisable. |
| (8) | Represents options to purchase 360,000 shares of our common stock, which are currently exercisable. |
| (9) | Includes options to purchase 747,500 shares of our common stock, which are currently exercisable or exercisable within 60 days of May 31, 2004. |
59
Table of Contents
General
We are authorized to issue 75,000,000 shares of common stock, $0.01 par value per share.
Common Stock
As of the date of this prospectus, there were 15,371,000 shares of common stock outstanding, which were held of record by 12 stockholders. The holders of common stock are entitled to one vote per share on all matters to be voted upon by the stockholders. The holders of common stock are entitled to receive ratably stock dividends, if any, as may be declared from time to time by the board of directors out of funds legally available for that purpose. In the event of our liquidation, dissolution or winding up, the holders of common stock are entitled to share ratably in all assets remaining after payment of liabilities. The holders of common stock do not have preemptive or conversion rights or other subscription rights. There are no redemption or sinking fund provisions applicable to the common stock.
Certain Charter and Bylaws Provisions and Kansas Anti-Takeover Law
Prior to the completion of the offering, we amended and restated our articles of incorporation and our bylaws. As amended, our articles of incorporation and bylaws, as well as provisions of Kansas law, could discourage, make more difficult, delay or prevent a change in control of the company without the support of our board of directors or without meeting various other conditions. These provisions and laws, summarized below, are expected to discourage certain types of coercive takeover practices and inadequate takeover bids. These provisions and laws are also designed to encourage persons seeking to acquire control of the company to first negotiate with our board of directors. We believe the benefits of requiring a proponent of an unfriendly or unsolicited proposal to acquire or restructure the company outweigh the disadvantages of discouraging such proposals because such negotiations could result in more favorable terms for the company and its stockholders. As amended, our articles of incorporation also provide for the redemption of stock held by a stockholder whose ownership in the company may result in the loss or failure to secure a license or permit necessary to conduct business or adversely affect or impede the company’s ability to conduct business in compliance with any applicable laws or regulations.
Blank Check Preferred Stock. Our articles of incorporation, as amended, authorize the issuance by our board of directors, without requiring further notice or authorization by our stockholders, of 5,000,000 shares of preferred stock, all of which are unissued, unreserved and available for issuance. The preferred stock may be issued in one or more series and will have the voting powers, preferences, relative rights, designations, qualifications and limitations set by the board of directors at the time of issuance. One of the effects of blank check preferred stock could be to enable our board of directors to issue shares to persons friendly to current management. Such issuance could discourage or make it more difficult to obtain control of the company by means of a merger, tender offer or proxy contest, and may protect the continuity of our management. Additional shares could also be used to dilute the stock ownership of persons seeking to obtain control of the company.
Stockholder Meetings. Under our bylaws, as amended, only a majority of the board of directors, the Chairman of the Board, the Chief Executive Officer, or the President may call special meetings of stockholders.
Requirements for Advance Notification of Stockholder Proposals and Director Nominations. Our bylaws, as amended, establish advance notice procedures with respect to stockholder proposals and the nomination of candidates for election as directors, other than nominations made by or at the direction of the board of directors or a committee of the board of directors. These provisions may preclude stockholders from bringing matters before an annual meeting of stockholders or from making nominations for directors at an annual meeting of stockholders.
60
Table of Contents
Business Combination Statute. Kansas’ business combination statutes generally limit business combinations including mergers and the sale of assets, between the company and its interested stockholders. Such business combinations can be approved by the board of directors and by the affirmative vote of disinterested stockholders holding two-thirds of the outstanding shares or by stockholder amendment of the articles or bylaws to opt-out of the business combination statute.
Control Share Acquisition Statute. Kansas’ control share acquisition statutes limit the voting rights of a person acquiring our shares when the acquisition causes the acquiring person to exceed certain levels of voting power in the company. Shares acquired in such an acquisition cannot be voted by the acquiring person, and may be subject to redemption, unless the company’s articles or bylaws are amended to state that the control share acquisition statutes do not apply to it. Stockholders may also approve the voting rights of a person making such an acquisition. This statute is designed to limit the ability of a stockholder to acquire a substantial stake in the Company without the approval of our stockholders.
Redemption of Shares Held by Disqualified Holders. Federal and state law applicable to payday lenders may now or in the future restrict direct or indirect ownership or control of payday lenders by disqualified persons (such as convicted felons). Our articles of incorporation, as amended, provide that we may redeem shares to the extent deemed necessary in the judgment of the board of directors to prevent the loss, or to secure the reinstatement or renewal of, any license or permit from any governmental agency held by the company to conduct any portion of the company’s business, which license or permit is conditioned upon some or all of the holders of the company’s common stock possessing prescribed qualifications or not possessing prescribed disqualifications. The redemption price is the average of the daily closing prices per share of common stock for the 30 consecutive trading days immediately prior to the redemption date fixed by the board of directors. The redemption price must be paid in cash, debt or equity securities or a combination of cash and debt or equity securities.
Transfer Agent and Registrar
The transfer agent and registrar for the common stock is UMB Bank, N.A.
Listing
Our common stock has been approved for quotation on The Nasdaq Stock Market’s National Market under the symbol “QCCO.”
61
Table of Contents
SHARES ELIGIBLE FOR FUTURE SALE
Sales of Restricted Securities
Prior to this offering, there has been no public market for our common stock, and we cannot predict the effect, if any, that market sales of shares of our common stock or the availability of shares of our common stock for sale will have on the market price of our common stock prevailing from time to time. Nevertheless, sales of substantial amounts of our common stock in the public market could adversely affect the market price of our common stock and could impair our future ability to raise capital through the sale of our equity securities.
Upon the completion of this offering, we will have 20,371,000 shares of our common stock outstanding. All of the shares sold in this offering will be freely tradable, except that any shares purchased by directors, officers or other affiliates may only be sold in compliance with the applicable limitations of Rule 144. The 15,371,000 shares of our common stock which are currently outstanding are “restricted securities” as defined under Rule 144. Restricted securities may be sold in the public market only if registered or if they qualify for an exemption from registration under Rules 144, 144(k) or 701 promulgated under the Securities Act, which rules are summarized below.
Subject to the provisions of Rules 144, 144(k) and 701, 15,371,000 shares of our common stock, and 1,491,250 shares issuable upon exercise of vested stock options, will be available for sale in the public market upon the expiration of the 180-day lock-up period.
If our stockholders sell substantial amounts of our common stock in the public market following this offering, the prevailing market price of our common stock could decline. Furthermore, sales of substantial amounts of our common stock in the public market after contractual and legal restrictions lapse could adversely affect the prevailing market price of the common stock and our ability to raise equity capital in the future.
Rule 144
In general, under Rule 144 as currently in effect, beginning 90 days after the date of this prospectus, a person who has beneficially owned restricted shares for at least one year would be entitled to sell, within any three-month period, a number of shares that does not exceed the greater of:
| • | 1% of the number of shares of common stock then outstanding, which will equal approximately 203,710 shares immediately after this offering, or |
| • | the average weekly trading volume of the common stock on the Nasdaq National Market during the four calendar weeks preceding the filing of a notice on Form 144 with respect to such sale. |
Sales under Rule 144 are also subject to other requirements regarding the manner of sale, notice filing and the availability of current public information about us.
Rule 144(k)
Under Rule 144(k), a person who is not deemed to have been one of our affiliates at any time during the three months preceding a sale, and who has beneficially owned the shares proposed to be sold for at least two years, including the holding period of any prior owner other than an affiliate, is entitled to sell such shares without complying with the manner of sale, notice filing, volume limitation or notice provisions of Rule 144. Rule “144(k) shares” may be sold immediately upon the completion of this offering, subject to the provisions of the lock-up agreements described below. The Securities Act defines affiliates to be persons that directly, or indirectly through one or more intermediaries, control or are controlled by, or under common control with, QC Holdings, Inc. These persons typically include our directors and certain executive officers.
Rule 701
In general, under Rule 701, any of our employees, directors, officers, consultants or advisors who purchase shares from us in connection with a compensatory stock or option plan or other written agreement before the effective date of this offering are entitled to resell such shares 90 days after the effective date of this offering without complying with the holding period requirements or other restrictions contained in Rule 144. As of the date of this prospectus, no shares of our outstanding common stock have been issued in reliance on Rule 701 as a result of exercises of stock options.
62
Table of Contents
Stock Options
After this offering, we intend to file a registration statement on Form S-8 under the Securities Act to register all shares of common stock issued or reserved for issuance under our stock option plans. After the effective date of these registration statements, subject to the lock-up agreements, shares purchased upon exercise of options granted under our 1999 Stock Option Plan and 2004 Stock Incentive Plan will be available for resale in the public market. As of May 31, 2004, we had outstanding options to purchase 1,612,500 shares of common stock. The board of directors granted stock options under the stock option plans immediately prior to the effectiveness of the registration statement, of which this prospectus forms a part, to purchase an aggregate of 430,000 shares of common stock at an option exercise price equal to the price per share in this offering.
Lock-Up Agreements
In addition to the limitations placed on the sale of common stock by operation of the Securities Act, each of our directors, officers, stockholders and option holders (including the persons who received stock options immediately prior to the effectiveness of this registration statement) has agreed with the underwriters, subject to certain exceptions, not to sell or otherwise transfer their shares of common stock, or any shares of common stock underlying our securities, for a period of 180 days after the date of this prospectus, without the underwriters’ prior written consent. The lock-up agreements signed by our stockholders and option holders cover all of the outstanding shares of common stock and all of the shares of common stock issuable upon exercise of outstanding options, outstanding immediately prior to this offering.
63
Table of Contents
Subject to the terms and conditions of an underwriting agreement dated July 15, 2004, the underwriters named below have severally agreed to purchase from us the number of shares of common stock indicated in the following table. Ferris, Baker Watts, Incorporated is acting as the lead managing underwriter of this offering and, together with JMP Securities LLC, is acting as a representative of the underwriters.
Underwriters | Number of Shares | |
Ferris, Baker Watts, Incorporated | 3,125,000 | |
JMP Securities LLC | 1,875,000 | |
Total | 5,000,000 |
This offering will be underwritten on a firm commitment basis. The underwriters propose to offer shares of our common stock, directly to the public at the public offering price set forth on the cover page of this prospectus. Any shares sold by the underwriters to securities dealers will be sold at the public offering price less a selling concession not in excess of $0.59 per share. The underwriters may allow, and these selected dealers may re-allow, a concession of not more than $0.10 per share to other brokers and dealers. After the shares of common stock are released for sale to the public, the offering price and other selling terms may, from time to time, be changed by the underwriters.
The underwriters’ obligations to purchase shares of our common stock are subject to conditions contained in the underwriting agreement. The underwriters are obligated to purchase all of the shares of common stock that they have agreed to purchase under the underwriting agreement, other than those covered by the over-allotment option, if they purchase any shares. The offering of the shares of common stock is made for delivery when, as and if accepted by the underwriters and subject to prior sale and to withdrawal, cancellation and modification of the offering without notice. The underwriters reserve the right to reject any order for the purchase of shares of common stock.
The following table summarizes the underwriting discount to be paid to the underwriters by us, or, with respect to the over-allotment option, by the selling stockholders.
| Per Share | Total, With No Exercise of Over-allotment Option | Total, With Full Exercise of Over-allotment Option | |||||||
Underwriting discount | $ | 0.98 | $ | 4,900,000 | $ | 5,635,000 | |||
We have agreed to pay certain expenses of the underwriters whether or not the public offering is consummated.
Over-allotment Option
Four of our stockholders have granted to the underwriters an option, exercisable not later than 30 days after the date of this prospectus, to purchase up to 750,000 additional shares of our common stock at the public offering price, less the underwriting discount, set forth on the cover page of this prospectus. The underwriters may exercise the option solely to cover over-allotments, if any, made in connection with this offering. To the extent that the underwriters exercise the option, each underwriter will become obligated, as long as the conditions of the underwriting agreement are satisfied, to purchase a number of additional shares of common stock approximately proportionate to that underwriter’s initial commitment as indicated in the table above. The selling stockholders will be obligated, pursuant to the option, to sell these additional shares of common stock to the underwriters to the extent the option is exercised. If any additional shares of common stock are purchased pursuant to the option, the underwriters will offer the additional shares on the same terms as those on which the other shares are being offered hereby.
Indemnification
We have agreed to indemnify the underwriters against certain liabilities, including liabilities under the Securities Act, or to contribute to payments the underwriters may be required to make in respect of any of these liabilities.
64
Table of Contents
Lock-Up Agreements
We and each of our officers, directors, other stockholders and option holders have agreed not to offer, sell, contract to sell or otherwise dispose of, or enter into any transaction that is designed to, or could reasonably be expected to, result in the disposition of any shares of our common stock or other securities convertible into or exchangeable or exercisable for shares of our common stock (other than exercise of stock options) for a period of 180 days after the date of this prospectus, without the prior written consent of Ferris, Baker Watts, Incorporated. This consent may be given at any time without public notice. There are no present agreements between Ferris, Baker Watts, Incorporated and us or any of our executive officers, directors, stockholders or option holders releasing us or them from these lock-up agreements prior to the expiration of the 180-day period other than with respect to our issuance of shares of common stock upon exercise by the underwriters of their over-allotment option.
Stabilization, Short Positions and Penalty Bids
In connection with the offering, the underwriters may engage in over-allotment, syndicate covering transactions, stabilizing transactions and penalty bids or purchases for the purpose of stabilizing, maintaining or otherwise affecting the price of our common stock.
These syndicate covering transactions, stabilizing transactions and penalty bids may have the effect of raising or maintaining the market price of our common stock above that which might otherwise prevail in the open market or preventing or retarding a decline in the market price of our common stock. The imposition of a penalty bid may also affect the price of the common stock to the extent that it discourages resales. These transactions may be effected on the Nasdaq National Market or otherwise and, if commenced, may be discontinued at any time.
Neither we nor the underwriters make any representation or prediction as to the magnitude or effect of any such transaction. In addition, neither we nor the underwriters make any representation that the underwriters will engage in these stabilizing transactions or that any transaction, once commenced, will not be discontinued without notice.
Pricing of the Offering
Prior to this offering, there has been no public market for our common stock. Consequently, the initial public offering price for our common stock has been determined by negotiations between us and Ferris, Baker Watts, Incorporated. Among the primary factors considered in determining the initial public offering price were:
| • | prevailing market and economic conditions; |
| • | our capital structure; |
| • | the present state of the short-term consumer lending industry; |
| • | the valuation multiples of publicly traded companies that Ferris, Baker Watts, Incorporated believes to be comparable to us; and |
| • | estimates of our business potential and earning prospects. |
Prior to this offering, our common stock was not publicly traded. Accordingly, there has been no current active trading market for our common stock. Consequently, we cannot assure or guarantee that an active trading market for our common stock will develop or that, if developed, will continue. An active and orderly trading market will depend on the existence, and individual decisions, of willing buyers and sellers at any given time. We will not have any control over these factors. If an active trading market does not develop or is sporadic, this may hurt the market value of our common stock and make it difficult to buy or sell shares on short notice. We cannot assure you that if you purchase common stock in the offering you will later be able to sell it at or above the purchase price.
65
Table of Contents
Directed Share Program
At our request, the underwriters have reserved for sale to our employees and directors at the initial public offering price up to 50,000 shares being offered by this prospectus. The sales will be made by Ferris, Baker Watts, Incorporated through a directed share program. We do not know if our employees or directors will choose to purchase all or any portion of the reserved shares, but any purchases they do make will reduce the number of shares available to the general public. If all of these reserved shares are not purchased, the underwriters will offer the remainder to the general public on the same terms as the other shares offered by this prospectus.
Listing of Shares
Our common stock has been approved for quotation on The Nasdaq National Market under the symbol “QCCO.”
The validity of the common stock offered in this prospectus will be passed upon for us by Shook, Hardy & Bacon, L.L.P., Kansas City, Missouri and for the underwriters by Venable LLP, Vienna, Virginia.
The consolidated financial statements of QC Holdings, Inc. at December 31, 2003 and 2002, and for each of the three years in the period ended December 31, 2003, included in this prospectus and registration statement, have been audited by Grant Thornton LLP, independent registered public accounting firm, as set forth in their report appearing elsewhere herein, and are included in reliance upon such report given on the authority of such firm as experts in accounting and auditing.
WHERE YOU CAN FIND MORE INFORMATION
We have filed a registration statement on Form S-1 with the SEC under the Securities Act with respect to the common stock we are offering. This prospectus, which is a part of the registration statement, does not contain all the information included in the registration statement, including its exhibits and schedules. For further information about us and the securities offered in this prospectus, you should refer to the registration statement and its exhibits and schedules. Statements we make in this prospectus about certain contracts or other documents summarize their material provisions and are not necessarily complete. When we make such statements, we refer you to copies of the contracts or documents that are filed as exhibits to the registration statement.
When we complete this offering, we will be required to file annual, quarterly and special reports, proxy statements and other information with the SEC. You can obtain our SEC filings, including the registration statement, over the Internet at the SEC’s website atwww.sec.gov. You may also read and copy any document we file with the SEC at its public reference facilities at 450 Fifth Street, N.W., Washington, D.C. 20549. You may also obtain copies of these documents at personnel rates by writing to the Public Reference Room of the SEC at 450 Fifth Street, N.W., Washington, D.C. 20549. Please call the SEC at 1-800-SEC-0330 for further information on the operation of the public reference facilities.
As a result of this offering, we will become subject to the information and reporting requirements of the Securities Exchange Act and, in accordance therewith, will file periodic reports, proxy statements and other information with the SEC.
We intend to furnish our stockholders with annual reports containing audited consolidated financial statements and with quarterly reports for the first three quarters of each year containing unaudited interim consolidated financial information.
66
Table of Contents
INDEX TO FINANCIAL STATEMENTS
QC Holdings, Inc. and Subsidiaries
| Audited Consolidated Financial Statements | ||
Report of Independent Registered Public Accounting Firm | F-2 | |
Consolidated Balance Sheets as of December 31, 2002 and 2003 | F-3 | |
Consolidated Statements of Income for the Years Ended December 31, 2001, 2002 and 2003 | F-4 | |
Consolidated Statement of Stockholders’ Equity | F-5 | |
Consolidated Statements of Cash Flows for the Years Ended December 31, 2001, 2002 and 2003 | F-6 | |
Notes to Consolidated Financial Statements | F-7 | |
Unaudited Consolidated Financial Statements | ||
Unaudited Consolidated Balance Sheets as of December 31, 2003 and March 31, 2004 | F-21 | |
Unaudited Consolidated Statements of Income for the Three Months Ended March 31, 2003 and 2004 | F-22 | |
Unaudited Consolidated Statements of Cash Flows for the Three Months Ended | F-23 | |
Notes to Unaudited Consolidated Financial Statements | F-24 | |
F-1
Table of Contents
REPORT OF INDEPENDENT REGISTERED PUBLIC ACCOUNTING FIRM
Board of Directors
QC Holdings, Inc. and Subsidiaries
We have audited the accompanying consolidated balance sheets of QC Holdings, Inc. and subsidiaries as of December 31, 2003 and 2002, and the related consolidated statements of income, stockholders’ equity, and cash flows for each of the three years in the period ended December 31, 2003. These financial statements are the responsibility of the Company’s management. Our responsibility is to express an opinion on these financial statements based on our audits.
We conducted our audits in accordance with auditing standards of the Public Company Accounting Oversight Board (United States). Those standards require that we plan and perform the audit to obtain reasonable assurance about whether the financial statements are free of material misstatement. An audit includes examining, on a test basis, evidence supporting the amounts and disclosures in the financial statements. An audit also includes assessing the accounting principles used and significant estimates made by management, as well as evaluating the overall financial statement presentation. We believe that our audits provide a reasonable basis for our opinion.
In our opinion, the consolidated financial statements referred to above present fairly, in all material respects, the financial position of QC Holdings, Inc. and subsidiaries as of December 31, 2003 and 2002, and the consolidated results of its operations and its cash flows for each of the three years in the period ended December 31, 2003 in conformity with accounting principles generally accepted in the United States of America.
As discussed in Note 15 to the consolidated financial statements, the Company adopted Statement of Financial Accounting Standards No. 150,Accounting for Certain Financial Instruments with Characteristics of both Liabilities and Equity, on July 1, 2003.
/S/ GRANT THORNTON LLP
Kansas City, Missouri
May 7, 2004 (except for the sixth and seventh paragraphs
of Note 16, as to which the date is June 9, 2004)
F-2
Table of Contents
QC HOLDINGS, INC. AND SUBSIDIARIES
CONSOLIDATED BALANCE SHEETS
(in thousands, except share and per share amounts)
| December 31, | ||||||||
| 2002 | 2003 | |||||||
ASSETS | ||||||||
Current assets | ||||||||
Cash and cash equivalents | $ | 7,991 | $ | 9,497 | ||||
Loans receivable, net of allowance for losses of $750 in 2002 and $1,090 in 2003 | 26,619 | 35,933 | ||||||
Prepaid expenses and other assets | 1,219 | 1,352 | ||||||
Total current assets | 35,829 | 46,782 | ||||||
Property and equipment, net | 8,701 | 11,852 | ||||||
Goodwill | 5,431 | 5,431 | ||||||
Other assets, net | 1,084 | 864 | ||||||
Total assets | $ | 51,045 | $ | 64,929 | ||||
LIABILITIES AND STOCKHOLDERS’ EQUITY | ||||||||
Current liabilities | ||||||||
Accounts payable | $ | 990 | $ | 276 | ||||
Accrued expenses and other liabilities | 1,767 | 1,235 | ||||||
Deferred revenue | 1,553 | 2,188 | ||||||
Income taxes payable | 61 | 1,051 | ||||||
Deferred income taxes | 1,600 | 2,517 | ||||||
Revolving credit facility | 5,824 | 6,256 | ||||||
Current portion of long-term debt | 3,069 | 4,718 | ||||||
Total current liabilities | 14,864 | 18,241 | ||||||
Deferred income taxes | 745 | 1,475 | ||||||
Liability for mandatory stock redemption | 17,000 | |||||||
Long-term debt, less current portion | 7,771 | 18,880 | ||||||
Total liabilities | 23,380 | 55,596 | ||||||
Commitments and contingencies | ||||||||
Shares subject to redemption | 11,000 | |||||||
Stockholders’ equity | ||||||||
Common stock, $0.01 par value; 30,000,000 shares authorized; 19,087,600 shares issued | 191 | 191 | ||||||
Retained earnings | 13,064 | 21,292 | ||||||
Additional paid-in capital | 5,852 | 5,248 | ||||||
Treasury stock, at cost | (2,165 | ) | (17,165 | ) | ||||
Notes received for equity | (277 | ) | (233 | ) | ||||
Total stockholders’ equity | 16,665 | 9,333 | ||||||
Total liabilities and stockholders’ equity | $ | 51,045 | $ | 64,929 | ||||
The accompanying notes are an integral part of these consolidated financial statements.
F-3
Table of Contents
QC HOLDINGS, INC. AND SUBSIDIARIES
CONSOLIDATED STATEMENTS OF INCOME
(in thousands, except share and per share amounts)
| Year Ended December 31, | ||||||||||
| 2001 | 2002 | 2003 | ||||||||
Revenues | ||||||||||
Payday loan fees | $ | 47,935 | $ | 59,006 | $ | 86,010 | ||||
Other | 12,348 | 11,901 | 12,484 | |||||||
Total revenues | 60,283 | 70,907 | 98,494 | |||||||
Store expenses | ||||||||||
Salaries and benefits | 10,631 | 15,646 | 21,279 | |||||||
Provision for losses | 14,827 | 14,943 | 21,293 | |||||||
Occupancy | 7,520 | 8,509 | 10,862 | |||||||
Depreciation and amortization | 559 | 952 | 1,397 | |||||||
Other | 7,216 | 7,070 | 7,571 | |||||||
Total store expenses | 40,753 | 47,120 | 62,402 | |||||||
Store gross profit | 19,530 | 23,787 | 36,092 | |||||||
Regional expenses | 4,340 | 4,949 | 5,613 | |||||||
Corporate expenses | 3,397 | 4,815 | 6,324 | |||||||
Depreciation and amortization | 944 | 241 | 538 | |||||||
Interest expense | 1,210 | 879 | 936 | |||||||
Other, net | (84 | ) | 22 | 35 | ||||||
Income before taxes | 9,723 | 12,881 | 22,646 | |||||||
Provision for income taxes | 3,826 | 5,046 | 8,722 | |||||||
Net income | $ | 5,897 | $ | 7,835 | $ | 13,924 | ||||
Earnings per share: | ||||||||||
Basic | $ | 0.31 | $ | 0.41 | $ | 0.41 | ||||
Diluted | $ | 0.31 | $ | 0.41 | $ | 0.39 | ||||
Weighted average number of common shares outstanding: | ||||||||||
Basic | 18,915,000 | 18,915,000 | 15,934,673 | |||||||
Diluted | 19,036,641 | 19,256,263 | 16,436,429 | |||||||
The accompanying notes are an integral part of these consolidated financial statements.
F-4
Table of Contents
QC HOLDINGS, INC. AND SUBSIDIARIES
CONSOLIDATED STATEMENT OF STOCKHOLDERS’ EQUITY
(in thousands, except share amounts)
| Outstanding shares | Common stock | Retained earnings (deficit) | Additional paid-in capital | Treasury stock | Notes received for equity | Total stockholders’ equity | ||||||||||||||||||||
Balance, January 1, 2001 | 18,915,000 | $ | 191 | $ | (668 | ) | $ | 5,819 | $ | (2,165 | ) | $ | (326 | ) | $ | 2,851 | ||||||||||
Net income and comprehensive income | 5,897 | 5,897 | ||||||||||||||||||||||||
Payments received on notes | 6 | 6 | ||||||||||||||||||||||||
Balance, December 31, 2001 | 18,915,000 | 191 | 5,229 | 5,819 | (2,165 | ) | (320 | ) | 8,754 | |||||||||||||||||
Net income and comprehensive income | 7,835 | 7,835 | ||||||||||||||||||||||||
Expense associated with issuance of stock options to non-employee | 33 | 33 | ||||||||||||||||||||||||
Payments received on notes | 43 | 43 | ||||||||||||||||||||||||
Balance, December 31, 2002 | 18,915,000 | 191 | 13,064 | 5,852 | (2,165 | ) | (277 | ) | 16,665 | |||||||||||||||||
Net income and comprehensive income | 13,924 | 13,924 | ||||||||||||||||||||||||
Shares subject to mandatory redemption | (5,296 | ) | (704 | ) | (6,000 | ) | ||||||||||||||||||||
Expense associated with issuance of stock options to non-employee | 100 | 100 | ||||||||||||||||||||||||
Repurchase of common stock | (3,733,000 | ) | (15,000 | ) | (15,000 | ) | ||||||||||||||||||||
Dividends to stockholders | (400 | ) | (400 | ) | ||||||||||||||||||||||
Payments received on notes | 44 | 44 | ||||||||||||||||||||||||
Balance, December 31, 2003 | 15,182,000 | $ | 191 | $ | 21,292 | $ | 5,248 | $ | (17,165 | ) | $ | (233 | ) | $ | 9,333 | |||||||||||
The accompanying notes are an integral part of these consolidated financial statements.
F-5
Table of Contents
QC HOLDINGS, INC. AND SUBSIDIARIES
CONSOLIDATED STATEMENTS OF CASH FLOWS
(in thousands)
| Year Ended December 31, | ||||||||||||
| 2001 | 2002 | 2003 | ||||||||||
Cash flows from operating activities | ||||||||||||
Net income | $ | 5,897 | $ | 7,835 | $ | 13,924 | ||||||
Adjustments to reconcile net income to net cash provided by operating activities: | ||||||||||||
Depreciation and amortization | 1,503 | 1,193 | 1,935 | |||||||||
Deferred income taxes | 96 | 1,490 | 1,647 | |||||||||
Other, net | (82 | ) | 55 | 135 | ||||||||
Changes in operating assets and liabilities, net of effects of acquisitions: | ||||||||||||
Prepaid expenses and other assets | (292 | ) | (398 | ) | (33 | ) | ||||||
Other assets | (65 | ) | (606 | ) | 422 | |||||||
Accounts payable | (79 | ) | 990 | (714 | ) | |||||||
Accrued expenses, other liabilities and deferred revenue | 2,410 | (418 | ) | 103 | ||||||||
Income taxes | (283 | ) | 827 | 990 | ||||||||
Net operating | 9,105 | 10,968 | 18,409 | |||||||||
Cash flows from investing activities | ||||||||||||
Loans receivable, net | (2,583 | ) | (7,181 | ) | (9,314 | ) | ||||||
Purchase of property and equipment | (3,572 | ) | (4,372 | ) | (5,193 | ) | ||||||
Proceeds from sale of property and equipment | 207 | 81 | 216 | |||||||||
Acquisition costs, net | (1,074 | ) | (802 | ) | ||||||||
Other, net | (41 | ) | (1 | ) | (100 | ) | ||||||
Net investing | (7,063 | ) | (12,275 | ) | (14,391 | ) | ||||||
Cash flows from financing activities | ||||||||||||
Net borrowings (repayments) under revolving credit facility | 2,575 | (4,150 | ) | 432 | ||||||||
Payments on long-term debt | (1,776 | ) | (1,496 | ) | (11,107 | ) | ||||||
Proceeds from long-term debt | 6,050 | 23,865 | ||||||||||
Dividends to stockholders | (400 | ) | ||||||||||
Purchase of treasury stock | (15,000 | ) | ||||||||||
Other, net | 7 | 43 | (302 | ) | ||||||||
Net financing | 806 | 447 | (2,512 | ) | ||||||||
Cash and cash equivalents | ||||||||||||
Net increase (decrease) | 2,848 | (860 | ) | 1,506 | ||||||||
At beginning of year | 6,003 | 8,851 | 7,991 | |||||||||
At end of year | $ | 8,851 | $ | 7,991 | $ | 9,497 | ||||||
Supplementary schedule of cash flow information | ||||||||||||
Cash paid during the year for | ||||||||||||
Interest | $ | 1,207 | $ | 949 | $ | 915 | ||||||
Income taxes | 4,013 | 2,729 | 6,085 | |||||||||
The accompanying notes are an integral part of these consolidated financial statements.
F-6
Table of Contents
QC HOLDINGS, INC. AND SUBSIDIARIES
NOTES TO CONSOLIDATED FINANCIAL STATEMENTS
NOTE 1 — DESCRIPTION OF THE BUSINESS
The accompanying consolidated financial statements include the accounts of QC Holdings, Inc. and its wholly-owned subsidiary, QC Financial Services, Inc. (collectively known as the Company). QC Financial Services, Inc. is the 100% owner of QC Financial Services of California, Inc., Financial Services of North Carolina, Inc., QC Advance, Inc. (formerly Title Loans, Inc.) and Cash Title Loans, Inc. QC Holdings, Inc., incorporated in 1998 under the laws of the State of Kansas, was founded in 1984, and has provided various retail consumer financial products and services throughout its 20-year history. Since 1998, the Company has been principally engaged in the business of providing short-term consumer loans, known as payday loans. Payday loans provide customers with cash in exchange for a promissory note with a maturity of generally 14 days and supported by that customer’s personal check for the aggregate amount of the cash advanced plus a fee, which varies from state to state based on applicable regulations and generally ranges between $15 to $20 per $100 borrowed. To repay the cash advance, customers may redeem their check by paying cash or they may allow the check to be presented for collection. Certain locations offer payday loans from a third-party financial institution (the Bank), from which the Company purchases a pro rata participation (see Note 3).
The Company also provides other consumer financial products and services, such as check cashing services, title loans, money transfers and money orders. All of the Company’s loans and other services are made in accordance with state regulation, which vary from state to state. As of December 31, 2003, the Company operated 294 stores with locations in Arizona, California, Colorado, Idaho, Illinois, Indiana, Kansas, Kentucky, Louisiana, Mississippi, Missouri, Nevada, New Mexico, North Carolina, Oregon, South Carolina, Utah, Virginia, Washington and Wisconsin.
NOTE 2 — SUMMARY OF SIGNIFICANT ACCOUNTING POLICIES
Principles of Consolidation. The accompanying consolidated financial statements include the accounts of the Company. All significant intercompany balances and transactions have been eliminated in consolidation. Certain reclassifications were made to the prior year consolidated financial statements to conform to the current year presentation.
Use of Estimates. In preparing financial statements in conformity with accounting principles generally accepted in the United States of America, management is required to make estimates and assumptions that affect the reported amounts of assets and liabilities, the disclosure of contingent assets and liabilities at the date of the financial statements, and the reported amounts of revenues and expenses during the reporting period. Actual results could differ from those estimates.
Revenue Recognition. The Company records revenue from loans upon issuance. The term of a loan is generally 14 days for a payday loan and 30 days for a title loan. At the end of each period, the Company records an estimate of the unearned revenue, which results in revenues being recognized on a constant-yield basis ratably over the term of each loan.
The Company recognizes revenues for its other consumer financial products and services, including, among others, check cashing, money transfers and money orders, at the time those services are rendered to the customer, which is generally at the point of sale.
F-7
Table of Contents
QC HOLDINGS, INC. AND SUBSIDIARIES
NOTES TO CONSOLIDATED FINANCIAL STATEMENTS — (Continued)
The components of “Other” revenues as reported in the statements of income are as follows(in thousands):
| Year Ended December 31, | |||||||||
| 2001 | 2002 | 2003 | |||||||
Check cashing fees | $ | 5,747 | $ | 6,257 | $ | 6,361 | |||
Title loan fees | 5,458 | 4,306 | 4,405 | ||||||
Other fees | 1,143 | 1,338 | 1,718 | ||||||
Total | $ | 12,348 | $ | 11,901 | $ | 12,484 | |||
Cash and Cash Equivalents. The Company considers all highly liquid investment securities purchased with an original maturity of three months or less from the date of purchase to be cash equivalents.
Loans Receivable, Provision for Losses and Allowance for Loan Losses. When the Company enters into a payday loan with a customer, the Company records a loan receivable for the amount loaned to the customer plus the fee charged by the Company, which varies from state to state based on applicable regulations.
The following table summarizes certain data with respect to the Company’s payday loans:
| Year Ended December 31, | |||||||||
| 2001 | 2002 | 2003 | |||||||
Average amount of cash provided to a customer | $ | 233.32 | $ | 244.42 | $ | 266.38 | |||
Average fee received by the Company | $ | 40.89 | $ | 44.11 | $ | 47.76 | |||
Average term of loan (days) | 14 | 14 | 14 | ||||||
When checks are presented to the bank for payment and returned as uncollected, all accrued fees, interest and outstanding principal are charged-off as uncollectible, generally within 15 days of their due date. Accordingly, the loans included in the receivable balance at any given point in time are typically not older than 30 days. These charge-offs are recorded as expense through the provision for losses. Any recoveries on losses previously charged to expense are recorded as a reduction to the provision for losses in the period recovered.
With respect to the loans receivable at each period end, the Company maintains an aggregate allowance for loan losses (including fees and interest) for payday loans and title loans at levels estimated to be adequate to absorb estimated incurred losses in the respective outstanding loan portfolios, which includes the Company’s pro rata participation in purchased payday loans as discussed in Note 3.
Loans receivable are generally no more than 30 days old. The allowance for loan losses is determined by evaluating the aggregate payday and title loan portfolio based on the historical level of loans charged to expense, the timing of each period end in a typical two-week payday cycle and the Company’s collections experience over the three months as of March 31, six months as of June 30, nine months as of September 30, and twelve months as of December 31 each year. The Company believes that, at any given point in time, its recent collection history reflects general economic conditions. The Company does not specifically reserve for any individual loan. The Company aggregates payday loans and title loans for purposes of computing the loss allowance based on very similar historical averages of uncollectible amounts as a percentage of volume for each type of loan (generally ranging between 2% and 4% of the total volume).
Using this information, the Company records an adjustment to the allowance for loan losses through the provision for losses.
F-8
Table of Contents
QC HOLDINGS, INC. AND SUBSIDIARIES
NOTES TO CONSOLIDATED FINANCIAL STATEMENTS — (Continued)
The following table summarizes the activity in the allowance for loan losses and the provision for losses during the years ended December 31, 2001, 2002 and 2003(in thousands):
| 2001 | 2002 | 2003 | ||||||||||
Allowance for Loan Losses | ||||||||||||
Balance at beginning of year | $ | 565 | $ | 650 | $ | 750 | ||||||
Adjustment to provision for losses based on evaluation of outstanding receivables at year end | 85 | 100 | 340 | |||||||||
Balance, end of year | $ | 650 | $ | 750 | $ | 1,090 | ||||||
Provision for Losses | ||||||||||||
Charged-off to expense | $ | 26,705 | $ | 32,934 | $ | 45,665 | ||||||
Recoveries | (11,963 | ) | (18,091 | ) | (24,712 | ) | ||||||
Adjustment to provision for losses based on evaluation of outstanding receivables at year end | 85 | 100 | 340 | |||||||||
Total provision for losses | $ | 14,827 | $ | 14,943 | $ | 21,293 | ||||||
Store Expenses. The direct costs incurred in operating the Company’s stores have been classified as store expenses. Store expenses include salaries and benefits of store employees, rent and other occupancy costs, depreciation and amortization of store property and equipment, armored and security costs, loan losses and other costs incurred by the stores.
Property and Equipment. Property and equipment are recorded at cost. Depreciation is charged to operations using the straight-line method over the estimated useful lives of the assets generally ranging from 3 to 7 years. Leasehold improvements are amortized using the straight-line method over the shorter of the lease term or the estimated useful life of the related asset. Repair and maintenance expenditures that do not significantly extend asset lives are charged to expense as incurred. The cost and related accumulated depreciation and amortization of assets sold or disposed of are removed from the accounts, and the resulting gain or loss is included in income.
Advertising Costs. Advertising costs are charged to operations when incurred. Advertising expense was $1.7 million, $2.1 million and $1.2 million for the years ended December 31, 2001, 2002 and 2003, respectively.
Goodwill and Intangible Assets. Goodwill represents the excess of cost over the fair value of net tangible assets of acquired companies using purchase accounting. Intangible assets, which are included in other assets, consist of debt issuance costs, noncompete agreements and other assets.
During 2001, the Financial Accounting Standards Board (the FASB) issued Statement of Financial Accounting Standards No. 141 (SFAS 141),Business Combinations, and No. 142 (SFAS 142),Goodwill and Other Intangible Assets. SFAS 141 requires the purchase method of accounting for all acquisitions. Under SFAS 142, goodwill and other intangible assets having indefinite useful lives are no longer amortized. The useful lives of other intangible assets must be reassessed, and the remaining amortization periods must be adjusted accordingly. Goodwill and other intangible assets having indefinite useful lives will be tested for impairment annually, or more frequently if events or changes in circumstances indicate that the assets might be impaired, using a two-step impairment assessment. The first step tests for potential impairment through a comparison of the fair value of a reporting unit with its carrying amount, including goodwill. The second step of the test, which measures the amount of impairment loss, if any, is only required if the carrying amount of a reporting unit exceeds its fair value. The Company adopted the provisions of SFAS 141 and SFAS 142 on January 1, 2002. No goodwill impairment was recognized during 2001, 2002 or 2003.
F-9
Table of Contents
QC HOLDINGS, INC. AND SUBSIDIARIES
NOTES TO CONSOLIDATED FINANCIAL STATEMENTS — (Continued)
Impairment of Long-Lived Assets. The Company evaluates all long-lived assets, including intangible assets, for impairment whenever events or changes in circumstances indicate that the carrying amounts may not be recoverable. Impairment is recognized when the carrying amounts of these assets cannot be recovered by the undiscounted net cash flows they will generate.
Stock Option Plans. As permitted by Statement of Financial Accounting Standards No. 123 (SFAS 123),Accounting for Stock Based Compensation (and as amended by Statement of Financial Accounting Standards No. 148,Accounting for Stock-Based Compensation — Transition and Disclosure),the Company accounts for stock options issued to employees under the recognition and measurement principles (intrinsic-value method) of Accounting Principles Board Opinion No. 25 (APB 25),Accounting for Stock Issued to Employees, and its related Interpretations. There was no stock-based employee compensation expense reflected in the Company’s reported net income for the years ended December 31, 2001, 2002 or 2003 because all stock options granted under these plans had an exercise price equal to the fair market value of the underlying common stock on the date of grant.
In 2002 and in years prior to 2001, the Company granted stock options to non-employees. In accordance with the provisions of SFAS 123, the Company has recorded compensation expense related to these non-employee option grants in the consolidated financial statements.
Had the Company applied the provisions set forth in SFAS 123 with respect to stock options to employees, compensation expense for the years ended December 31, 2001, 2002 and 2003 would have been approximately $300,000 higher than is reported in the consolidated financial statements for each year. See Note 10 for additional stock option disclosures and information. The following table illustrates the effect on net income and earnings per share if the Company had applied the fair value recognition provisions of SFAS No. 123 to stock options(in thousands, except per share data):
| 2001 | 2002 | 2003 | ||||||||||
Net income as reported | $ | 5,897 | $ | 7,835 | $ | 13,924 | ||||||
Deduct total stock-based employee compensation expense determined under fair value based methods for all awards, net of related tax effects | (183 | ) | (183 | ) | (183 | ) | ||||||
Pro forma net income | 5,714 | 7,652 | 13,741 | |||||||||
Less: reduction to retained earnings in connection with shares subject to redemption as discussed in Note 15 | 5,296 | |||||||||||
Less: dividend and participation rights associated with mandatory stock redemption as discussed in Note 15 | 2,162 | |||||||||||
Pro forma income available to common stockholders | $ | 5,714 | $ | 7,652 | $ | 6,283 | ||||||
Basic earnings per share: | ||||||||||||
As reported | $ | 0.31 | $ | 0.41 | $ | 0.41 | ||||||
Pro forma | $ | 0.30 | $ | 0.40 | $ | 0.39 | ||||||
Diluted earnings per share: | ||||||||||||
As reported | $ | 0.31 | $ | 0.41 | $ | 0.39 | ||||||
Pro forma | $ | 0.30 | $ | 0.40 | $ | 0.38 | ||||||
Income Taxes. Deferred income taxes are recorded to reflect the tax consequences in future years of differences between the tax basis of assets and liabilities and their financial reporting amounts, based on enacted tax laws and statutory tax rates applicable to the periods in which the differences are expected to affect taxable income. Valuation allowances are established when necessary to reduce deferred tax assets to the amounts expected to be realized. Income tax expense represents the tax payable for the current period and the change during the period in deferred tax assets and liabilities.
F-10
Table of Contents
QC HOLDINGS, INC. AND SUBSIDIARIES
NOTES TO CONSOLIDATED FINANCIAL STATEMENTS — (Continued)
Earnings per Share. Basic earnings per share is computed using the two-class method by dividing income available to common stockholders by the weighted average number of common shares outstanding during the period. Diluted earnings per share is computed giving effect to all dilutive potential common shares that were outstanding during the period. The effect of stock options represent the only differences between the weighted average shares used for the basic earnings per share computation compared to the diluted earnings per share computation.
The following table presents the computations of basic and diluted earnings per share for the periods presented(in thousands, except share and per share data).
| Year Ended December 31, | |||||||||
| 2001 | 2002 | 2003 | |||||||
Net income | $ | 5,897 | $ | 7,835 | $ | 13,924 | |||
Less: reduction to retained earnings in connection with shares subject to redemption as discussed in Note 15 | 5,296 | ||||||||
Less: dividend and participation rights associated with mandatory stock redemption as discussed in Note 15 | 2,162 | ||||||||
Income available to common stockholders | $ | 5,897 | $ | 7,835 | $ | 6,466 | |||
Weighted average number of common shares outstanding | 18,915,000 | 18,915,000 | 15,934,673 | ||||||
Incremental shares from assumed conversion of | 121,641 | 341,263 | 501,756 | ||||||
Weighted average number of diluted common shares outstanding | 19,036,641 | 19,256,263 | 16,436,429 | ||||||
Basic earnings per share | $ | 0.31 | $ | 0.41 | $ | 0.41 | |||
Diluted earnings per share | $ | 0.31 | $ | 0.41 | $ | 0.39 | |||
All options that were outstanding for the years ended December 31, 2001, 2002 and 2003 were included in the computation of diluted earnings per share because the exercise prices were equal to or lower than the average market prices of the common shares.
Fair Value of Financial Instruments. Statement of Financial Accounting Standards No. 107,Disclosures About Fair Value of Financial Instruments, requires the Company to disclose the fair value of its financial instruments, which represents the amount at which the instrument could be exchanged in a current transaction between willing parties other than a forced sale or liquidation. The amounts reported in the consolidated balance sheets for cash equivalents, loans receivable and accounts payable are short-term in nature and their fair value approximates fair value. The carrying value of the revolving credit facility approximates fair value, as the interest rate is variable. Based on borrowing rates currently available to the Company for term loans and notes payable with similar terms and average maturities, the carrying value of long-term debt is considered to approximate fair value at December 31, 2002 and 2003.
Recently Issued Accounting Pronouncements. In January 2003, the FASB issued FASB Interpretation No. 46 (R) (FIN 46),Consolidation of Variable Interest Entities. FIN 46 requires that variable interest entities be consolidated by their primary beneficiary. FIN 46 became effective with all financial statements issued after January 31, 2003. The Company does not have investments in or any relationships with any variable interest entities, and therefore the adoption of this statement did not have an impact on the Company’s financial condition or results of operations.
In May 2003, the FASB issued Statement of Financial Accounting Standards No. 150 (SFAS 150),Accounting for Certain Financial Instruments with Characteristics of both Liabilities and Equity.SFAS 150 establishes standards for how an issuer classifies and measures certain financial instruments with characteristics
F-11
Table of Contents
QC HOLDINGS, INC. AND SUBSIDIARIES
NOTES TO CONSOLIDATED FINANCIAL STATEMENTS — (Continued)
of both liabilities and equity. It requires that an issuer classify a financial instrument that is within its scope as a liability (or an asset in some circumstances). SFAS 150 is effective for the first interim period beginning after June 15, 2003. The Company adopted SFAS 150 on July 1, 2003. See Note 15 for discussion.
NOTE 3 — LOANS BY THIRD-PARTY FINANCIAL INSTITUTIONS
Payday loans are originated by the Company at all of its locations, except for North Carolina, where payday loans are offered by a third-party financial institution (the Bank) through the Company’s stores. The Company entered into a new arrangement with the Bank in April 2003. Under the terms of the agreement, which may be terminated by either party for any reason with 90 days written notice, the Bank sells the Company a pro rata participation in loans that are made to borrowers. The terms of the loans are generally similar to those of the Company’s own loans, though the Bank has sole discretion regarding the terms of its loans. The Company recorded loan fees totaling approximately $4.1 million under this arrangement during the year ended December 31, 2003, with an outstanding receivable balance of $1.7 million at December 31, 2003.
In 2001, 2002 and first quarter 2003, the Company had an arrangement with a different third-party financial institution. Under this arrangement, each payday loan entered into by the third-party financial institution that remained unpaid after the scheduled maturity date was assigned to the Company at a discount from the amount owed by the borrower. The Company recorded loan fee revenue totaling approximately $762,000, $2.5 million and $707,000 under this arrangement during the years ended December 31, 2001, 2002 and 2003, respectively, with an outstanding receivable balance of $1.1 million at December 31, 2002.
NOTE 4 — PROPERTY AND EQUIPMENT
Property and equipment consisted of the following at December 31,(in thousands):
| 2002 | 2003 | |||||
Buildings | $ | 1,501 | $ | 1,595 | ||
Leasehold improvements | 4,774 | 7,034 | ||||
Furniture and equipment | 5,148 | 6,872 | ||||
Vehicles | 297 | 310 | ||||
Furnishings | 70 | 135 | ||||
| 11,790 | 15,946 | |||||
Less: Accumulated depreciation and amortization | 3,089 | 4,094 | ||||
| $ | 8,701 | $ | 11,852 | |||
Depreciation expense totaled $670,000, $1.2 million and $1.8 million for the years ended December 31, 2001, 2002 and 2003, respectively.
NOTE 5 — REVOLVING CREDIT FACILITY
The Company has a revolving credit facility with an available amount of $6,000,000 in 2002 and $10,000,000 in 2003, of which $5.8 million and $6.3 million were borrowed as of December 31, 2002 and 2003, respectively. The facility expires in October 2004. Interest is payable monthly at prime (4% at December 31, 2003) plus 1%. The weighted average interest rate paid by the Company was 7.94%, 5.68% and 5.12% during the years ended December 31, 2001, 2002 and 2003, respectively. The facility is collateralized by substantially all Company assets and guaranteed by the Company’s principal stockholder. The credit facility contains several financial covenants that require, among other things, that the Company maintain a minimum net worth, leverage ratio, current ratio, coverage ratio, and debt-to-revenue ratio as specified in the agreement. The Company was not in compliance with certain covenants with respect to the minimum net worth requirement after consideration of the impact of shares subject to redemption as discussed in Note 15. The Company received waivers from the
F-12
Table of Contents
QC HOLDINGS, INC. AND SUBSIDIARIES
NOTES TO CONSOLIDATED FINANCIAL STATEMENTS — (Continued)
financial institution with respect to those covenants for the years ended December 31, 2002 and 2003. In addition, the Company received a waiver with respect to the minimum net worth covenant as of March 31, 2004. See Note 16 regarding the Company’s repayment of outstanding amounts under the credit facility during first quarter 2004.
NOTE 6 — LONG-TERM DEBT
Long-term debt consisted of the following at December 31,(in thousands):
| 2002 | 2003 | |||||
Note payable to related party, due on demand, with interest at 10%; unsecured | $ | 45 | $ | 45 | ||
Note payable to related party, due December 2004, with interest payable quarterly at 9.0%; unsecured | 400 | 400 | ||||
Term loan from bank, due October 2006, with interest payable monthly at prime plus 1%; monthly principal payments of $208; collateralized by substantially all Company assets; guaranteed by the Company’s principal stockholder; weighted average interest rate of 5.68% and 5.12% in 2002 and 2003, respectively | 7,084 | |||||
Term loan from bank, due October 2008, with interest payable monthly at prime plus 1%; monthly principal payments of $148; collateralized by substantially all Company assets; guaranteed by the Company’s principal stockholder; weighted average interest rate of 5.68% and 5.12% in 2002 and 2003, respectively | 8,569 | |||||
Subordinated unsecured notes payable, due October 2006, with interest payable quarterly at 6% through October 2004, 8% through October 2005 and 10% through October 2006 | 7,500 | |||||
Term loans from bank, with various maturities through 2009, with interest payable monthly at prime plus 1%; monthly principal payments totaling $218; collateralized by substantially all Company assets; guaranteed by the Company’s principal stockholder; repaid in 2003 | 10,395 | |||||
| 10,840 | 23,598 | |||||
Less: current portion | 3,069 | 4,718 | ||||
| $ | 7,771 | $ | 18,880 | |||
Future maturities of long-term debt are as follows(in thousands):
Year ending | Amount | ||
2004 | $ | 4,718 | |
2005 | 4,273 | ||
2006 | 11,356 | ||
2007 | 1,773 | ||
2008 | 1,478 | ||
| $ | 23,598 | ||
F-13
Table of Contents
QC HOLDINGS, INC. AND SUBSIDIARIES
NOTES TO CONSOLIDATED FINANCIAL STATEMENTS — (Continued)
The various debt instruments contain several financial covenants that require, among other things, that the Company maintain a minimum net worth, leverage ratio, current ratio, coverage ratio, and debt-to-revenue ratio as specified in the agreement. See Note 5 with respect to the Company’s compliance with covenants at December 31, 2003.
NOTE 7 — INCOME TAXES
The Company’s provision for income taxes is summarized as follows(in thousands):
| Year Ended December 31, | |||||||||
| 2001 | 2002 | 2003 | |||||||
Current: | |||||||||
Federal | $ | 3,095 | $ | 2,901 | $ | 5,818 | |||
State | 635 | 655 | 1,257 | ||||||
Total Current | 3,730 | 3,556 | 7,075 | ||||||
Deferred: | |||||||||
Federal | 80 | 1,268 | 1,400 | ||||||
State | 16 | 222 | 247 | ||||||
Total Deferred | 96 | 1,490 | 1,647 | ||||||
Total provision for income taxes | $ | 3,826 | $ | 5,046 | $ | 8,722 | |||
The sources of deferred income tax liabilities (assets) are summarized as follows at December 31,(in thousands):
| 2002 | 2003 | |||||||
Deferred tax assets related to: | ||||||||
Allowance for loan losses | $ | (300 | ) | $ | (436 | ) | ||
Deferred tax liabilities related to: | ||||||||
Property and equipment | 465 | 1,145 | ||||||
Loans receivable, tax value | 1,900 | 2,592 | ||||||
Goodwill | 280 | 330 | ||||||
Prepaid assets | 361 | |||||||
Gross deferred tax liabilities | 2,645 | 4,428 | ||||||
Net deferred tax liabilities | $ | 2,345 | $ | 3,992 | ||||
Differences between the Company’s effective income tax rate and the statutory federal income tax rate are as follows(in thousands):
| 2001 | 2002 | 2003 | ||||||||||
Income tax expense using the statutory federal rate in effect | $ | 3,403 | $ | 4,508 | $ | 7,926 | ||||||
Tax effect of: | ||||||||||||
State and local income taxes, net of federal benefit | 423 | 570 | 978 | |||||||||
Other | (32 | ) | (182 | ) | ||||||||
Total provision for income taxes | $ | 3,826 | $ | 5,046 | $ | 8,722 | ||||||
Effective tax rate | 39.3 | % | 39.2 | % | 38.5 | % | ||||||
Statutory federal tax rate | 35.0 | % | 35.0 | % | 35.0 | % | ||||||
F-14
Table of Contents
QC HOLDINGS, INC. AND SUBSIDIARIES
NOTES TO CONSOLIDATED FINANCIAL STATEMENTS — (Continued)
NOTE 8 — ACQUISITIONS, GOODWILL AND INTANGIBLE ASSETS
Acquisitions and Goodwill. In March 2002, in an effort to gain market share, the Company acquired six stores and certain assets of First PayDay Loans of Illinois for a total of $1.5 million, which included net book value of depreciable assets in the amount of approximately $111,000 and 100% of payday loans receivable that were no more than 90 days past due in the amount of approximately $631,000. The Company used the purchase method of accounting. The excess of the total acquisition cost over the fair value of the net assets acquired totaled $802,000. The value of identified intangible assets associated with those acquisitions was minimal and, as a result, all excess cost over fair value of net assets acquired was recorded as goodwill. The pro forma results of operations have not been presented because the results of operations for the Company would not have been materially different from those reported for 2002.
During 2001, in an effort to gain market share, the Company made several small acquisitions between March and June for nine stores and certain assets for a total of $1.7 million plus cash on hand, a substantial portion of the gross payday loans receivable not past due and a portion of the face value of uncollected checks on hand (that were not related to payday loans receivable). The Company used the purchase method of accounting. The excess of the total acquisition cost over the fair value of the net assets acquired totaled approximately $912,000. The value of identified intangible assets associated with those acquisitions was minimal and, as a result, all excess cost over fair value of net assets acquired was recorded as goodwill. The Company amortized the goodwill using the straight-line method over 15 years until adoption of SFAS 142 (see Note 2 above). The pro forma results of operations have not been presented because the results of operations for the Company would not have been materially different from those reported for 2001.
The following table provides a summary of actual amortization expense and pro forma net income and earnings per share excluding the amortization of goodwill in 2001(in thousands, except per share amounts):
Year Ended December 31, | |||||||||
| 2001 | 2002 | 2003 | |||||||
Reported net income | $ | 5,897 | $ | 7,835 | $ | 13,924 | |||
Add back: goodwill amortization, net of income taxes | 198 | ||||||||
Adjusted net income | 6,095 | 7,835 | 13,924 | ||||||
Less: reduction to retained earnings in connection with shares subject to redemption as discussed in Note 15 | 5,296 | ||||||||
Less: dividend and participation rights associated with mandatory stock redemption as discussed in Note 15 | 2,162 | ||||||||
Adjusted income available to common stockholders | $ | 6,095 | $ | 7,835 | $ | 6,466 | |||
Basic earnings per share: | |||||||||
Reported | $ | 0.31 | $ | 0.41 | $ | 0.41 | |||
Goodwill amortization, net of income taxes | 0.01 | ||||||||
Adjusted basic earnings per share | $ | 0.32 | $ | 0.41 | $ | 0.41 | |||
Diluted earnings per share: | |||||||||
Reported | $ | 0.31 | $ | 0.41 | $ | 0.39 | |||
Goodwill amortization, net of income taxes | 0.01 | ||||||||
Adjusted diluted earnings per share | $ | 0.32 | $ | 0.41 | $ | 0.39 | |||
The Company completed its initial impairment testing and annual impairment testing of goodwill and has concluded that no such impairment existed at December 31, 2003.
F-15
Table of Contents
QC HOLDINGS, INC. AND SUBSIDIARIES
NOTES TO CONSOLIDATED FINANCIAL STATEMENTS — (Continued)
Intangible Assets. Costs paid to obtain debt financing are amortized over the term of each related debt agreement using the straight-line method, which approximates the effective interest method. Noncompete agreements are currently being amortized using the straight-line method over the term of the agreements ranging from one to two years. These intangible assets totaled $505,000 and $851,000, at cost, and $48,000 and $250,000, net of accumulated amortization, as of December 31, 2002 and 2003, respectively. Amortization expense for the years ended December 31, 2001, 2002 and 2003 was $507,000, $28,000 and $144,000, respectively. Future estimated amortization expense for intangible assets is expected to be $50,000 per year over the next five years.
NOTE 9 — EMPLOYEE BENEFIT PLAN
The Company has established a defined-contribution 401(k) benefit plan that covers substantially all of its full-time employees. Under the plan, the Company makes a matching contribution of 25% of each employee’s contribution, up to 6% of the employee’s compensation. The Company’s matching contributions and administrative expenses relating to the 401(k) plan were $69,000, $84,000 and $103,000 during 2001, 2002 and 2003, respectively.
NOTE 10 — STOCK OPTIONS
In accordance with the provisions of the 1999 Stock Option Plan (the Option Plan), the Company’s Board of Directors may grant stock options to purchase up to an aggregate 1,700,000 shares of Company common stock to employees and non-employee directors. The Company applies the provisions of APB 25 in accounting for options granted under the Option Plan. Under the terms of the Option Plan, all options expire 10 years from the date of grant.
The fair value of stock options granted to employees in 2001 used to compute pro forma net income and earnings per share disclosures (see Note 2) was estimated on the date of grant using the Black-Scholes option pricing model with the following weighted-average assumptions: a risk-free rate of 4.5%, expected life of 10 years, volatility of zero and no expected dividends. Using these factors, the weighted average fair value of an option granted was $0.89.
During 2002, the Company granted 200,000 options to a non-employee outside of the Option Plan at an exercise price of $2.45 per share. These options vest equally over four years, and expire 10 years from the date of grant. Because these options were issued to a non-employee, the Company recorded compensation expense in accordance with SFAS 123 totaling approximately $33,000 and $100,000 during the years ended December 31, 2002 and 2003, respectively, with an associated credit to additional paid-in capital. The fair value of these stock options were estimated on the date of grant using the Black-Scholes option pricing model with the following weighted-average assumptions: a risk-free rate of 4.25%, expected life of 10 years, volatility of zero and no expected dividends. Using these factors, the weighted average fair value of an option granted was $1.99.
F-16
Table of Contents
QC HOLDINGS, INC. AND SUBSIDIARIES
NOTES TO CONSOLIDATED FINANCIAL STATEMENTS — (Continued)
The Company did not grant any options during 2003.
The following summary sets forth the activity related to stock options:
| Options exercisable at $2.00 | Options exercisable at $2.45 | Total | |||||||
Outstanding at December 31, 2000 | 1,072,500 | 120,000 | 1,192,500 | ||||||
Granted during 2001 | 485,000 | 485,000 | |||||||
Outstanding at December 31, 2001 | 1,072,500 | 605,000 | 1,677,500 | ||||||
Forfeited during 2002 | (70,000 | ) | (70,000 | ) | |||||
Granted during 2002 | 200,000 | 200,000 | |||||||
Outstanding at December 31, 2002 | 1,072,500 | 735,000 | 1,807,500 | ||||||
Forfeited during 2003 | (6,000 | ) | (6,000 | ) | |||||
Outstanding at December 31, 2003 | 1,066,500 | 735,000 | 1,801,500 | ||||||
Options vested | 1,026,500 | 367,500 | 1,394,000 | ||||||
The following table summarizes information about options outstanding and exercisable at December 31, 2003:
| Options outstanding | Options exercisable | |||||||||||
Range of exercise prices | Number outstanding | Weighted average remaining contractual life | Weighted average exercise price | Number exercisable | Weighted average exercisable price | |||||||
$2.00 to $2.45 | 1,801,500 | 6.8 years | $ | 2.18 | 1,394,000 | $ | 2.12 | |||||
NOTE 11 — COMMITMENTS AND CONTINGENCIES
Operating Leases. The Company leases certain equipment and buildings under noncancelable operating leases. Future minimum lease payments are as follows(in thousands):
Year ending December 31, | Amount | ||
2004 | $ | 4,976 | |
2005 | 3,510 | ||
2006 | 2,264 | ||
2007 | 1,332 | ||
2008 | 411 | ||
| $ | 12,493 | ||
Rental expense was $4.3 million, $4.7 million and $5.9 million during the years ended December 31, 2001, 2002 and 2003, respectively.
Litigation. The Company is engaged in various lawsuits, either as plaintiff or defendant, involving legal matters in the normal course of business. While the outcome of these legal proceedings cannot be predicted with certainty, it is the opinion of management, based upon advice of counsel, that the ultimate outcome of these lawsuits will not have a material impact on the Company’s consolidated financial position, results of operations or cash flows. Legal costs associated with such litigation are expensed as incurred.
F-17
Table of Contents
QC HOLDINGS, INC. AND SUBSIDIARIES
NOTES TO CONSOLIDATED FINANCIAL STATEMENTS — (Continued)
The Company accrued $1.0 million in 2001 with respect to two litigation matters in the State of Indiana arising in the normal course of payday loan transaction business. The accrued amounts were reflected as other store expenses in the statement of income for the year ended December 31, 2001. In 2002, the Company fully settled the matters and paid $1.0 million to the plaintiffs’ settlement fund.
NOTE 12 — RELATED PARTY TRANSACTIONS
Stockholders’ equity includes notes received for equity that represent unsecured loans to four stockholders totaling $277,000 and $233,000 at December 31, 2002 and 2003, respectively. These notes require that interest be paid annually at the applicable federal rate published by the Internal Revenue Service for short-term loans (1.81% at December 31, 2003). Future maturities of these notes are $46,000 on June 15, 2004 and $187,000 on June 1, 2005.
Notes receivable from stockholders, in the amounts of $82,000 and $182,000 at December 31, 2002 and 2003, respectively, represent three notes: $39,000, due on demand with interest at 5.77%, and $43,000 and $100,000, due on demand with interest at the applicable federal rate published by the Internal Revenue Service for short-term loans (1.81% at December 31, 2003).
At December 31, 2003, the Company has a receivable recorded for approximately $176,000 representing advances made by the Company to companies controlled by two principal stockholders. The advances are non-interest bearing and payable on demand by the Company.
Long-term debt at December 31, 2003 includes $400,000 due to a principal stockholder in connection with a stock repurchase during 1999. See Note 6 for additional information and Note 16 regarding repayment during 2004.
NOTE 13 — CERTAIN CONCENTRATIONS OF RISK
The Company is subject to regulation by federal and state governments that affect the products and services provided by the Company, particularly payday loans. The Company currently offers payday loans in 21 states throughout the United States. The level and type of regulation of payday loans varies greatly from state to state, ranging from states with no regulations or legislation to other states with very strict guidelines and requirements.
Company stores located in the states of Missouri, California, Illinois and New Mexico represented approximately 24%, 17%, 11% and 9%, respectively, of total revenues for the year ended December 31, 2003. To the extent that laws and regulations are passed that affect the Company’s ability to offer payday loans or the manner by which the Company offers its payday loans in any one of those states, the Company’s financial position, results of operations and cash flows could be affected.
NOTE 14 — TREASURY STOCK
During 2003, the Company purchased 3,733,000 shares of its common stock for $15 million. The shares were purchased using cash flow from operations and long-term debt (see Note 6). The shares purchased will be utilized for the Company’s stock option program, as necessary. The Company had 172,600 shares and 3,905,600 shares of common stock held in treasury at December 31, 2002 and 2003, respectively.
NOTE 15 — STOCKHOLDERS AGREEMENT
The Company entered into a Stockholders Agreement (Agreement) with two of its principal stockholders (principals) in October 1999 (as amended January 19, 2000 and again on January 1, 2003). The Agreement provides that the Company will purchase shares of Company common stock owned by the principals upon their
F-18
Table of Contents
QC HOLDINGS, INC. AND SUBSIDIARIES
NOTES TO CONSOLIDATED FINANCIAL STATEMENTS — (Continued)
death, up to a maximum of $11.0 million as of December 31, 2002 and $17.0 million as of December 31, 2003. The Company maintains insurance policies with respect to the principals that will cover the entire amount of the obligations under the Agreement.
In accordance with Emerging Issues Task Force Topic No. D-98 (EITF Topic D-98),Classification and Measurement of Redeemable Securities, and Accounting Series Release No. 268, the Company recorded an $11.0 million mandatorily redeemable instrument, referred to as shares subject to redemption, in the consolidated balance sheet outside of permanent stockholders’ equity, with an offsetting reduction to additional paid-in capital, to the extent of book value attributable to those shares, and then to retained earnings. Because the Agreement sets forth a limit to the Company’s obligation, and that limit was less than the fair value of the shares subject to repurchase at December 31, 2002, the Company recorded the maximum obligation as of December 31, 2002.
In January 2003, the Agreement was amended to provide for a maximum Company obligation of $17.0 million. Because the Agreement sets forth a limit to the Company’s obligation, and that limit was less than the fair value of the shares subject to repurchase, the Company recorded the maximum obligation of $17.0 million. Accordingly, the Company increased the shares subject to redemption component in the consolidated balance sheet and reduced additional paid-in capital, to the extent of book value attributable to the additional shares, and then retained earnings.
After recording the shares subject to redemption and associated reduction in stockholders’ equity, the Company was not in compliance with certain covenants under various debt agreements. The Company received waivers from the financial institution with respect to these covenants. See Notes 5 and 6.
As set forth in EITF Topic D-98, the Company recognizes the changes in the value of the redeemable stock as they occur at the end of each reporting period, effectively treating the end of each period as the redemption date. The amount of the increase in the carrying amount of the shares subject to redemption that has been charged to retained earnings is included as a reduction to the income available to common stockholders in the computations of basic and diluted earnings per share (see Note 2).
In connection with the adoption of SFAS 150 on July 1, 2003, the Company recognized a liability, referred to as liability for mandatory stock redemption, for $17.0 million and reduced shares subject to redemption for the same amount. As set forth in SFAS 150, beginning July 1, 2003, the shares considered to be subject to redemption under the Agreement (approximately 4.4 million) have been excluded from the computations of basic and diluted earnings per share. Further, SFAS 150 requires that the portion of net income representing dividend and participation rights associated with the mandatory stock redemption be removed from income available to common stockholders pursuant to the two-class method set forth by Statement of Financial Accounting Standards No. 128,Earnings per Share.
NOTE 16 — SUBSEQUENT EVENTS
During first quarter 2004, the Company repaid $6.3 million under the credit facility using operating cash flows.
In February 2004, the Company purchased property in California for approximately $1.3 million, which was funded with $0.3 million in cash and $1.0 million in borrowings through a note payable with interest at prime plus 1% and due March 2019. The Company expects to sell the property to two principal stockholders during the second half of 2004 based on appraised value.
F-19
Table of Contents
QC HOLDINGS, INC. AND SUBSIDIARIES
NOTES TO CONSOLIDATED FINANCIAL STATEMENTS — (Continued)
In first quarter 2004, the Company repaid $245,000 of the related party notes payable using cash from operations. In April 2004, the remaining $200,000 was paid to settle the obligation using cash from operations.
On May 6, 2004, the Company repaid approximately $2.0 million of the subordinated unsecured notes payable using available cash and borrowings under the revolving credit facility. The Company received a waiver from the financial institution providing the revolving credit facility that allowed for partial repayment of the subordinated obligations.
On May 6, 2004, the Company declared a $2.0 million dividend to be paid prior to May 31, 2004. The Company funded this payment from operating cash flows.
On June 9, 2004, the Company’s Board of Directors effected a 10 for 1 stock split in the form of a stock dividend. The share and per share information included in the consolidated financial statements and accompanying notes have been restated to reflect the stock split for all periods presented.
Effective June 30, 2004, the Company terminated the Stockholders Agreement with two principal shareholders as discussed in Note 15. As a result, the liability for mandatory stock redemption will be removed and stockholders’ equity increased by $17 million pursuant to SFAS 150.
F-20
Table of Contents
QC HOLDINGS, INC. AND SUBSIDIARIES
UNAUDITED CONSOLIDATED BALANCE SHEETS
(in thousands, except share and per share amounts)
| December 31, 2003 | March 31, 2004 | |||||||
ASSETS | ||||||||
Current assets | ||||||||
Cash and cash equivalents | $ | 9,497 | $ | 10,238 | ||||
Loans receivable, net of allowance for losses of $1,090 at December 31, 2003 and $700 at March 31, 2004 | 35,933 | 30,184 | ||||||
Prepaid expenses and other assets | 1,352 | 1,919 | ||||||
Total current assets | 46,782 | 42,341 | ||||||
Property and equipment, net | 11,852 | 13,866 | ||||||
Goodwill | 5,431 | 5,431 | ||||||
Other assets, net | 864 | 843 | ||||||
Total assets | $ | 64,929 | $ | 62,481 | ||||
LIABILITIES AND STOCKHOLDERS’ EQUITY | ||||||||
Current liabilities | ||||||||
Accounts payable | $ | 276 | $ | 276 | ||||
Accrued expenses and other liabilities | 1,235 | 834 | ||||||
Deferred revenue | 2,188 | 1,833 | ||||||
Income taxes payable | 1,051 | 1,182 | ||||||
Deferred income taxes | 2,517 | 2,381 | ||||||
Revolving credit facility | 6,256 | 6 | ||||||
Current portion of long-term debt | 4,718 | 4,540 | ||||||
Total current liabilities | 18,241 | 11,052 | ||||||
Deferred income taxes | 1,475 | 1,650 | ||||||
Liability for mandatory stock redemption | 17,000 | 17,000 | ||||||
Long-term debt, less current portion | 18,880 | 18,744 | ||||||
Total liabilities | 55,596 | 48,446 | ||||||
Commitments and contingencies | ||||||||
Stockholders’ equity | ||||||||
Common stock, $0.01 par value; 30,000,000 shares authorized; 19,087,600 shares issued; 15,182,000 shares outstanding at December 31, 2003 and 15,333,000 at March 31, 2004 | 191 | 191 | ||||||
Retained earnings | 21,292 | 25,643 | ||||||
Additional paid-in capital | 5,248 | 5,248 | ||||||
Treasury stock, at cost | (17,165 | ) | (16,863 | ) | ||||
Notes received for equity | (233 | ) | (184 | ) | ||||
Total stockholders’ equity | 9,333 | 14,035 | ||||||
Total liabilities and stockholders’ equity | $ | 64,929 | $ | 62,481 | ||||
The accompanying notes are an integral part of these unaudited consolidated financial statements.
F-21
Table of Contents
QC HOLDINGS, INC. AND SUBSIDIARIES
UNAUDITED CONSOLIDATED STATEMENTS OF INCOME
(in thousands, except share and per share amounts)
| Three Months Ended March 31, | |||||||
| 2003 | 2004 | ||||||
Revenues | |||||||
Payday loan fees | $ | 17,559 | $ | 24,516 | |||
Other | 3,704 | 3,667 | |||||
Total revenues | 21,263 | 28,183 | |||||
Store expenses | |||||||
Salaries and benefits | 4,940 | 6,117 | |||||
Provision for losses | 3,873 | 3,797 | |||||
Occupancy | 2,696 | 3,014 | |||||
Depreciation and amortization | 266 | 366 | |||||
Other | 1,902 | 1,953 | |||||
Total store expenses | 13,677 | 15,247 | |||||
Store gross profit | 7,586 | 12,936 | |||||
Regional expenses | 1,399 | 1,820 | |||||
Corporate expenses | 1,373 | 1,791 | |||||
Depreciation and amortization | 81 | 132 | |||||
Interest expense | 216 | 356 | |||||
Other, net | 25 | 30 | |||||
Income before taxes | 4,492 | 8,807 | |||||
Provision for income taxes | 1,726 | 3,556 | |||||
Net income | $ | 2,766 | $ | 5,251 | |||
Earnings (loss) per share: | |||||||
Basic | $ | (0.13 | ) | $ | 0.34 | ||
Diluted | $ | (0.13 | ) | $ | 0.32 | ||
Weighted average number of common shares outstanding: | |||||||
Basic | 18,915,000 | 11,688,010 | |||||
Diluted | 19,381,398 | 12,347,417 | |||||
The accompanying notes are an integral part of these unaudited consolidated financial statements.
F-22
Table of Contents
QC HOLDINGS, INC. AND SUBSIDIARIES
UNAUDITED CONSOLIDATED STATEMENTS OF CASH FLOWS
(in thousands)
| Three Months Ended March 31, | ||||||||
| 2003 | 2004 | |||||||
Cash flows from operating activities | ||||||||
Net income | $ | 2,766 | $ | 5,251 | ||||
Adjustments to reconcile net income to net cash provided by operating activities: | ||||||||
Depreciation and amortization | 347 | 498 | ||||||
Deferred income taxes | 85 | 39 | ||||||
Other, net | 24 | 30 | ||||||
Changes in operating assets and liabilities: | ||||||||
Prepaid expenses and other assets | (371 | ) | (649 | ) | ||||
Other assets | 372 | (17 | ) | |||||
Accounts payable | (415 | ) | ||||||
Accrued expenses, other liabilities and deferred revenue | (1,701 | ) | (756 | ) | ||||
Income taxes | 1,544 | 131 | ||||||
Net operating | 2,651 | 4,527 | ||||||
Cash flows from investing activities | ||||||||
Loans receivable, net | 5,106 | 5,749 | ||||||
Purchase of property and equipment | (1,883 | ) | (2,505 | ) | ||||
Other, net | 3 | 82 | ||||||
Net investing | 3,226 | 3,326 | ||||||
Cash flows from financing activities | ||||||||
Net borrowings (repayments) on line of credit | (2,724 | ) | (6,250 | ) | ||||
Payments on long-term debt | (656 | ) | (1,314 | ) | ||||
Proceeds from long-term debt | 1,000 | |||||||
Dividends to stockholders | (900 | ) | ||||||
Proceeds from stock option exercises | 302 | |||||||
Other, net | (46 | ) | 50 | |||||
Net financing | (3,426 | ) | (7,112 | ) | ||||
Cash and cash equivalents | ||||||||
Net increase | 2,451 | 741 | ||||||
At beginning of year | 7,991 | 9,497 | ||||||
At end of period | $ | 10,442 | $ | 10,238 | ||||
Supplementary schedule of cash flow information | ||||||||
Cash paid during the period for | ||||||||
Interest | $ | 234 | $ | 455 | ||||
Income taxes | 183 | 3,425 | ||||||
The accompanying notes are an integral part of these unaudited consolidated financial statements.
F-23
Table of Contents
QC HOLDINGS, INC. AND SUBSIDIARIES
NOTES TO UNAUDITED CONSOLIDATED FINANCIAL STATEMENTS
Note 1 — SUMMARY OF SIGNIFICANT ACCOUNTING POLICIES
Basis of Presentation. The accompanying unaudited interim consolidated financial statements are of QC Holdings, Inc. and its wholly-owned subsidiaries, QC Financial Services, Inc. and QC Properties, LLC (collectively known as the Company). QC Financial Services, Inc. is the 100% owner of QC Financial Services of California, Inc., Financial Services of North Carolina, Inc., QC Advance, Inc. (formerly Title Loans, Inc.) and Cash Title Loans, Inc.
The Company’s unaudited interim consolidated financial statements have been prepared in accordance with accounting principles generally accepted in the United States for interim financial information, the instructions to Form 10-Q and Article 10 of Regulation S-X. Accordingly, they do not include all information and footnotes required by accounting principles generally accepted in the United States of America for complete financial statements and should be read in conjunction with the Company’s audited consolidated financial statements included in this Registration Statement on S-1 filed with the Securities and Exchange Commission. In the opinion of management, all adjustments, consisting of normal recurring adjustments, considered necessary for a fair presentation have been included. Operating results of interim periods are not necessarily indicative of the results that may be expected for a full fiscal year.
Business. QC Holdings, Inc., incorporated in 1998 under the laws of the State of Kansas, was originally formed in 1984 and has provided various retail consumer financial products and services throughout its 20-year history. Since 1998, the Company has been principally engaged in the business of providing short-term consumer loans, known as payday loans. Payday loans provide customers with cash in exchange for a promissory note with a maturity of generally 14 days and supported by that customer’s personal check for the aggregate amount of the cash advanced plus a fee, which varies from state to state based on applicable regulations and generally ranges between $15 to $20 per $100 borrowed. To repay the cash advance, customers may redeem their check by paying cash or they may allow the check to be presented to the bank for collection. Certain locations offer payday loans from a third-party financial institution, from which the Company purchases a pro rata participation.
The Company also provides other consumer financial products and services, such as check cashing services, title loans, money transfers and money orders. All of the Company’s loans and other services are made in accordance with state regulation, which vary from state to state. As of March 31, 2004, the Company operates 295 stores with locations in Arizona, California, Colorado, Florida, Idaho, Illinois, Indiana, Kansas, Kentucky, Louisiana, Mississippi, Missouri, Nevada, New Mexico, North Carolina, Oregon, South Carolina, Utah, Virginia, Washington and Wisconsin.
Use of Estimates. The preparation of financial statements in conformity with accounting principles generally accepted in the United States requires management to make estimates and assumptions that affect the amounts reported in the consolidated financial statements and accompanying notes. Actual results could differ from those estimates.
Principles of Consolidation. The accompanying unaudited interim consolidated financial statements include the accounts of the Company and its wholly-owned subsidiaries. All significant intercompany balances and transactions have been eliminated in consolidation. Certain reclassifications were made to the prior year interim consolidated financial statements to conform to the current year presentation.
Revenue Recognition. The Company records revenue from loans upon issuance. The term of a loan is generally 14 days for a payday loan and 30 days for a title loan. At the end of each period, the Company records
F-24
Table of Contents
QC HOLDINGS, INC. AND SUBSIDIARIES
NOTES TO UNAUDITED CONSOLIDATED FINANCIAL STATEMENTS — (Continued)
an estimate of the unearned revenue, which results in revenues being recognized on a constant-yield basis ratably over the term of each loan.
The Company recognizes revenues for its other consumer financial products and services, including, among others, check cashing, money transfers and money orders, at the time those services are rendered to the customer, which is generally at the point of sale.
Loans Receivable, Provision for Losses and Allowance for Loan Losses. When the Company enters into a payday loan with a customer, the Company records a loan receivable for the amount loaned to the customer plus the fee charged by the Company, which varies from state to state based on applicable regulations. During the three months ended March 31, 2004, the average amount of cash provided to a customer in such a transaction was $275.99, the average fee to the company was $49.29 and the average term of the loan was approximately 14 days. During the three months ended March 31, 2003, the average amount of cash provided to a customer in such a transaction was $257.61, the average fee to the company was $46.36 and the average term of the loan was approximately 14 days.
When checks are presented to the bank for payment and returned as uncollected, all accrued fees, interest and outstanding principal are charged-off as uncollectible, generally within 15 days of their due date. Accordingly, the loans included in the receivable balance at any give point in time are typically not older than 30 days. These charge-offs are recorded as expense through the provision for losses. Any recoveries on losses previously charged to expense are recorded as a reduction to the provision for losses in the period recovered.
With respect to the loans receivable at each period end, the Company maintains an allowance for loan losses (including fees and interest) for aggregate payday loans and title loans at levels estimated to be adequate to absorb estimated incurred losses in the respective outstanding loan portfolios, which includes for payday loans the Company’s pro rata participation in purchased loans.
Loans receivable are generally no more than 30 days old. The allowance is determined by evaluating the aggregate payday and title loan portfolio based on the historical level of loans charged to expense, the timing of each period end in a typical two-week payday cycle and the Company’s collections experience over the three months as of March 31, six months as of June 30, nine months as of September 30, and twelve months as of December 31 each year. The Company believes that, at any given point in time, its recent collection history reflects general economic conditions. The Company does not specifically reserve for any individual loan. The Company aggregates payday loans and title loans for purposes of computing the allowance based on very similar historical averages of uncollectible amounts as a percentage of volume for each type of loan (generally ranging between 2% and 4% of total volume).
Using this information, the Company records an adjustment to the allowance for loan losses through the provision for losses.
The following table summarizes the activity in the allowance for loan losses and the provision for losses during the three months ended March 31, 2003 and 2004(in thousands):
| 2003 | 2004 | |||||||
Allowance for Loan Losses | ||||||||
Balance at beginning of year | $ | 750 | $ | 1,090 | ||||
Adjustment to provision for losses based on evaluation of outstanding receivables at period end | (210 | ) | (390 | ) | ||||
Balance, end of period | $ | 540 | $ | 700 | ||||
Provision for Losses | ||||||||
Charged-off to expense | $ | 10,414 | $ | 11,156 | ||||
Recoveries | (6,331 | ) | (6,969 | ) | ||||
Adjustment to provision for losses based on evaluation of outstanding receivables at period end | (210 | ) | (390 | ) | ||||
Total provision for losses | $ | 3,873 | $ | 3,797 | ||||
F-25
Table of Contents
QC HOLDINGS, INC. AND SUBSIDIARIES
NOTES TO UNAUDITED CONSOLIDATED FINANCIAL STATEMENTS — (Continued)
Earnings per Share. Basic earnings per share is computed using the two class method by dividing income available to common stockholders by the weighted average number of common shares outstanding during the period. Diluted earnings per share is computed giving effect to all dilutive potential common shares that were outstanding during the period. The effect of stock options represent the only differences between the weighted average shares used for the basic earnings per share computation compared to the diluted earnings per share computation.
The following table presents the computations of basic and diluted earnings (loss) per share for the periods presented(in thousands, except share and per share data).
| Three Months Ended March 31, | |||||||
| 2003 | 2004 | ||||||
Net income | $ | 2,766 | $ | 5,251 | |||
Less: reduction to retained earnings in connection with shares subject to redemption as discussed below | 5,296 | ||||||
Less: dividend and participation rights associated with mandatory stock redemption as discussed below | 1,242 | ||||||
Income available to common stockholders | $ | (2,530 | ) | $ | 4,009 | ||
Weighted average common shares outstanding | 18,915,000 | 11,688,010 | |||||
Incremental shares from assumed conversion of stock options | 466,398 | 659,407 | |||||
Weighted average diluted common shares outstanding | 19,381,398 | 12,347,417 | |||||
Basic earnings (loss) per share | $ | (0.13 | ) | $ | 0.34 | ||
Diluted earnings (loss) per share | $ | (0.13 | ) | $ | 0.32 | ||
All options that were outstanding for the three months ended March 31, 2003 and 2004 were included in the computation of diluted earnings per share because the exercise prices were equal to or lower than the average market prices of the common shares. Because the net amount available to common stockholders is a net loss for the three months ended March 31, 2003, the effect of dilutive shares is not considered.
With respect to the three months ended March 31, 2003, income available to common stockholders is adjusted to reflect the shares subject to redemption as set forth in Emerging Issues Task Force Topic D-98 (EITF Topic D-98),Classification and Measurement of Redeemable Securities. In January 2003, the Stockholders Agreement (the Agreement) with two principal stockholders was amended to increase the Company’s obligation to repurchase shares to $17.0 million from $11.0 million as of December 31, 2002. The amount of the increase in the carrying amount of the shares subject to redemption that has been charged to retained earnings is included as a reduction to income available to common stockholders.
As set forth in Statement of Financial Accounting Standards No. 150 (SFAS 150),Accounting for Certain Financial Instruments with Characteristics of both Liabilities and Equity, which the Company adopted as of July 1, 2003, the shares considered to be subject to redemption under the Agreement (approximately 3.6 million) have been excluded from the computations of basic and diluted earnings per share for the three months ended March 31, 2004. Further, SFAS 150 requires that the portion of net income representing dividend and participation rights associated with the mandatory stock redemption be removed from income available to common stockholders pursuant to the two-class method set forth by Statement of Financial Accounting Standards No. 128,Earnings per Share.
Stockholders’ Equity. During first quarter 2004, the company issued 151,000 shares of common stock in connection with a stock option exercise. The issuance reduced the number of common stock shares held in treasury to 3,754,600 as of March 31, 2004.
F-26
Table of Contents
QC HOLDINGS, INC. AND SUBSIDIARIES
NOTES TO UNAUDITED CONSOLIDATED FINANCIAL STATEMENTS — (Continued)
NOTE 2 — RELATED PARTY TRANSACTIONS
In February 2004, the Company purchased property in California for approximately $1.3 million, which was funded with $0.3 million in cash and $1.0 million in borrowings through a note payable with interest at prime plus 1% and due March 2019. The Company expects to sell the property to two principal stockholders during the second half of 2004 based on appraised value.
In first quarter 2004, the Company repaid $245,000 of the related party notes payable using cash from operations. In April 2004, the remaining $200,000 was paid to settle the obligation using cash from operations.
NOTE 3 — SUBSEQUENT EVENTS
On May 6, 2004, the Company repaid approximately $2.0 million of the subordinated unsecured notes payable using available cash and borrowings under the revolving credit facility. The Company received a waiver from the financial institution providing the revolving credit facility that allowed for partial repayment of the subordinated obligations.
On May 6, 2004, the Company declared a $2.0 million dividend to be paid prior to May 31, 2004. The Company funded this payment from operating cash flows.
The Company’s Board of Directors effected a 10 for 1 stock split in the form of a stock dividend on June 9, 2004. All share and per share information included in the consolidated financial statements and accompanying notes have been restated to reflect this stock split for all periods presented.
Effective June 30, 2004, the Company terminated the Stockholders Agreement with two principal shareholders as discussed above. As a result, the liability for mandatory stock redemption will be removed and stockholders’ equity increased by $17 million pursuant to SFAS 150.
F-27
Table of Contents
You should rely only on the information contained in this prospectus. We have not authorized anyone to provide you with different information. We are not making an offer of these securities in any state where the offer is not permitted. You should not assume that the information contained in this prospectus is accurate as of any date other than the date on the front of this prospectus.
| Page | ||
| 1 | ||
| 8 | ||
| 15 | ||
| 16 | ||
| 17 | ||
| 18 | ||
| 19 | ||
| 20 | ||
Management’s Discussion and Analysis of Financial Condition and Results of Operations | 24 | |
| 38 | ||
| 50 | ||
| 57 | ||
Security Ownership of Certain Beneficial Owners and Management | 59 | |
| 60 | ||
| 62 | ||
| 64 | ||
| 66 | ||
| 66 | ||
| 66 |
Through and including August 9, 2004 (25 days after the date of this prospectus), all dealers that buy, sell or trade our common stock, whether or not participating in this offering, may be required to deliver a prospectus. This is in addition to the dealers’ obligation to deliver a prospectus when acting as underwriters and with respect to their unsold allotments or subscriptions.
QC Holdings, Inc.
5,000,000 Shares
Common Stock
PROSPECTUS
Ferris, Baker Watts
Incorporated
JMP Securities
July 15, 2004