Exhibit 99.1
1. First Quarter 2011 Earnings Presentation |
Forward-Looking Statements The Private Securities Litigation Reform Act of 1995 provides a "safe harbor" for forward-looking statements. This presentation and any other written or oral statements made by or on behalf of Tower may include forward-looking statements that reflect Tower's current views with respect to future events and financial performance. All statements other than statements of historical fact included in this presentation are forward-looking statements. Forward-looking statements can generally be identified by the use of forward-looking terminology such as "may," "will," "plan," "expect," "project," "intend," "estimate," "anticipate," "believe" and "continue" or their negative or variations or similar terminology. All forward-looking statements address matters that involve risks and uncertainties. Accordingly, there are or will be important factors that could cause the actual results of Tower to differ materially from those indicated in these statements. Please refer to Tower's filings with the SEC, including among others Tower's Annual Report on Form 10-K for the year ended December 31, 2010, for a description of the important factors that could cause the actual results of Tower to differ materially from those indicated in these statements. Forward-looking statements speak only as of the date on which they are made, and Tower undertakes no obligation to update publicly or revise any forward-looking statement, whether as a result of new information, future developments or otherwise. Notes on Non-GAAP Financial Measures Operating income excludes realized gains and losses, acquisition-related transaction costs and the results of the reciprocal business, net of tax. This is a common measurement for property and casualty insurance companies. We believe this presentation enhances the understanding of our results of operations by highlighting the underlying profitability of our insurance business. Additionally, these measures are a key internal management performance standard. Operating earnings per share is operating income divided by diluted weighted average shares outstanding. Operating return on equity is annualized operating income divided by average common stockholders' equity. Total premiums include gross premiums written through our insurance subsidiaries and produced as managing general agent on behalf of other insurance companies. Other Notes In October 2010, the Financial Accounting Standards Board issued new guidance concerning the accounting for costs associated with acquiring or renewing insurance contracts. Under the new guidance, only direct incremental costs associated with successful insurance contract acquisitions or renewals are deferrable. We have adopted this guidance early, effective January 1, 2011, and have retrospectively adjusted our previously issued financial information. Adoption of this guidance reduced the carrying value of our deferred acquisition costs as of December 31, 2010, by $78.7 million and Tower Group Inc. stockholders' equity by $42.6 million. Diluted earnings per share for the first quarter 2010 were reduced by $0.09 per share as a result of this change in accounting. |
1Q11 Highlights: Strong Operating Results Despite Winter Storm Losses * *Tower has repurchased $98.2 million of its common stock since 1Q 2010 Excluding the effect of winter storms, operating earnings would have been $30.1 million in 1Q11 compared to $25.4 million in 1Q10 Excluding the effect of winter storms, operating EPS would have been $0.72 in 1Q11 compared to $0.56 in 1Q10 * |
Tower - Continued Growth and Profitability Excluding the effect of winter storms, operating ROE would have been 11.6% in 1Q11 compared to 11.1% in 1Q10 |
Tower's Strategy Is Working Despite Challenging Market Conditions P&C market conditions Significant catastrophe activity in the 1st quarter (estimated $50B) Competitive market conditions and poor underwriting results Outlook: Potential rate increases in reinsurance and certain primary lines of business Pressure for companies to increase rates to improve results or exit Tower's strategy Diversify, specialize and customize Improve existing and create new business units Acquire and make strategic investments |
Business Segment Results Segment Summary GPW increased in niche middle market workers compensation business; small business premiums decreased slightly in competitive classes and territories GPW rose from organic growth generated through customized solutions, assumed reinsurance and risk sharing business Program business from managing general agents declined due to non-renewal or re- underwriting of unprofitable business GPW rose due to acquisition of One Beacon Personal Lines (OBPL) in 2010 Loss ratio will trend favorably with reduced monoline personal auto writings * Total revenue for the segment Fee income expected to rise due to the continued management of the personal lines reciprocals in NY and NJ Commercial Commercial Commercial Personal Insurance General Specialty Services 1Q11 GPW ($ millions) 1Q11 GPW ($ millions) $165 $98 $127 $7* 1Q10 GPW ($ millions) 1Q10 GPW ($ millions) 159 88 36 0* 1Q11 % of total GPW 1Q11 % of total GPW 42% 25% 33% n/a Commercial Consolidated Commercial Consolidated Commercial Consolidated Loss Ratio 65.3% 65.3% 65.3% 59.1% n/a Expense Ratio 32.7% 32.7% 32.7% 38.0% n/a Combined Ratio 98.0% 98.0% 98.0% 97.1% n/a Retention 74.8% 74.8% 74.8% 83.8% n/a Renewal Pricing 1.0% 1.0% 1.0% 3.5% n/a |
New Organic Growth Initiative - Customized Solutions Strategy and implementation Focus on the top 100 retail and wholesale agents in the U.S. with significant premium volume Differentiate and add value by developing products customized to meet their needs rather than offering off-the-shelf products Focus on specialty business Created a new business unit dedicated to this concept Examples Non-standard Lawyers' E&O program Landscape Contractors Auto Dealers Franchise Restaurants Positive market reaction Identified and received positive response from our top 25 producers Developed programs with expected annual premium of $40 million that generated $7 million during the 1st quarter |
New Organic Growth Initiative - Reinsurance and Risk Sharing Strategy Rebuild reinsurance and risk-sharing operation Focus on reinsurers, insurance companies and managing general agents with strong underwriting track records Quickly respond and take advantage of growth opportunities Minimize start-up costs and lead time of building own platform Examples of business opportunities Reinsurance of established Directors & Officers insurance program International and specialty business Property catastrophe reinsurance Low concentration in any geographical region; low correlation to primary business Offsets Tower's ceded catastrophe reinsurance costs Experienced management and risk management controls Experienced management team led by individual with almost twenty years in CEO, COO and CUO positions with professional reinsurers Positive outlook Significant growth opportunities in key markets due to current conditions |
Acquisitions and Strategic Investments Acquisitions Strategy: create an internal hard market by consolidating books of business and improving the underwriting profitability by diversifying, re-underwriting, reducing expenses and increasing scale Challenging market conditions are causing many companies to consider selling as a strategic option - may be a catalyst for a market turn Growing pipeline of acquisitions this quarter Navigators renewal rights transaction: $7 million premium this quarter and $20 million projected in 2011; integration progressing as planned Strategic investments Strategy: Invest in distribution sources and underwriting managers to increase investment income and expand into specialty classes of business |
Net Loss and Loss Expense Ratio * * *Figures portray Tower's consolidated accident year and calendar year loss ratios as reported in 10-K, which excludes reserve strengthening made on acquired companies prior to the acquisition and included in the schedule P development of the entities. ** Industry data provided by A.M. Best Company ** No annual prior year adverse development since 2004 Prior adverse development shown on insurance company statutory filings misleading: Reflects reserve strengthening on acquired companies prior to closing Excludes GAAP reserves risk premium ($9.8 million as of March 2011) and cost savings from loss adjustment expenses AY loss ratio from 2007 to 2009 - 55%; lower CY loss ratio due to prior year reserve releases Increased loss ratio estimate above 60% beginning in 2010 despite lower prior year loss ratio Estimated 2011 loss ratio of 61% to reflect business mix, pricing environment, and storm and catastrophe losses |
Declining Expense Ratio 2010 BB&T expenses include $2.6 million of New York State workers compensation surcharges which are considered non-recurring. |
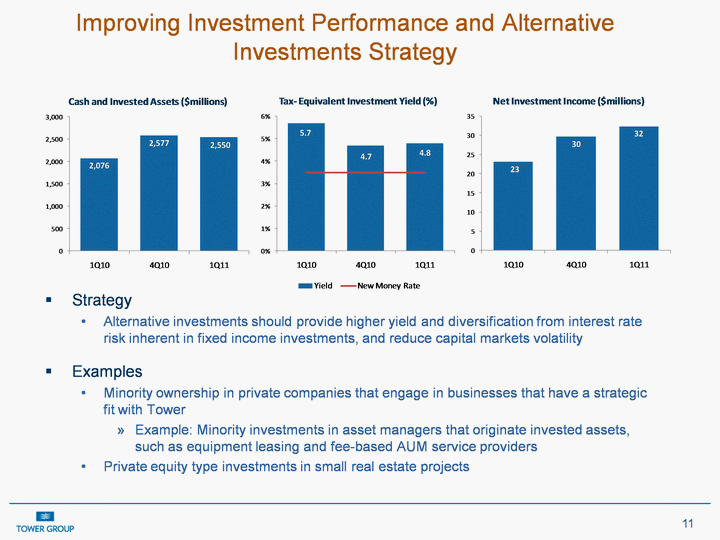
Improving Investment Performance and Alternative Investments Strategy Strategy Alternative investments should provide higher yield and diversification from interest rate risk inherent in fixed income investments, and reduce capital markets volatility Examples Minority ownership in private companies that engage in businesses that have a strategic fit with Tower Example: Minority investments in asset managers that originate invested assets, such as equipment leasing and fee-based AUM service providers Private equity type investments in small real estate projects |
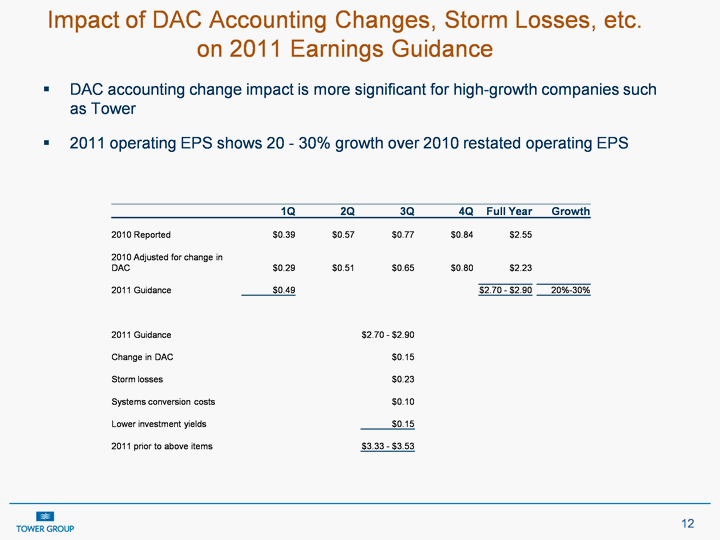
Impact of DAC Accounting Changes, Storm Losses, etc. on 2011 Earnings Guidance DAC accounting change impact is more significant for high-growth companies such as Tower 2011 operating EPS shows 20 - 30% growth over 2010 restated operating EPS 1Q 2Q 3Q 4Q Full Year Growth 2010 Reported $0.39 $0.57 $0.77 $0.84 $2.55 2010 Adjusted for change in DAC 2010 Adjusted for change in DAC $0.29 $0.51 $0.65 $0.80 $2.23 2011 Guidance $0.49 $2.70 - $2.90 20%-30% 2011 Guidance $2.70 - $2.90 Change in DAC $0.15 Storm losses Storm losses Storm losses $0.23 Systems conversion costs $0.10 Lower investment yields $0.15 2011 prior to above items 2011 prior to above items 2011 prior to above items 2011 prior to above items 2011 prior to above items $3.33 - $3.53 |
Summary - Positive Trends and Outlook Increasing GWP Reported $390M in the first quarter; expected to generate $1.75B-1.8B for 2011 full year Full year effect of One Beacon personal lines acquisition 5% organic growth due to new growth initiatives Declining combined ratio Lower loss ratio after 1st quarter winter storms Declining expense ratio due to increased scale Investment income After declining for the past two years, investment yield is projected to increase due to alternative investments and revised asset allocation Moving closer to 13% to 15% target ROE Gradually increasing throughout 2011 to reach close to the target ROE by the 4th quarter 2011 Guidance 2011 full-year earnings guidance remains unchanged despite 1st quarter storm losses Positive outlook beyond 2011 Early adoption of DAC accounting change removes book value and earnings charges beyond 2011 Increase in dividend Dividend increased by 50% from $0.50 to $0.75 |