 November 19, 2012 Investor Presentation Exhibit 99.1 |
1 Forward-Looking Statements The Private Securities Litigation Reform Act of 1995 provides a "safe harbor" for forward-looking statements. This press release and any other written or oral statements made by or on behalf of Tower may include forward-looking statements that reflect Tower's current views with respect to future events and financial performance. All statements other than statements of historical fact included in this press release are forward-looking statements. Forward-looking statements can generally be identified by the use of forward-looking terminology such as "may," "will," "plan," "expect," "project," "intend," "estimate,” "anticipate," "believe" and "continue" or their negative or variations or similar terminology. All forward- looking statements address matters that involve risks and uncertainties. Accordingly, there are or will be important factors that could cause the actual results of Tower to differ materially from those indicated in these statements. Please refer to Tower's filings with the SEC, including among others Tower's Annual Report on Form 10-K for the year ended December 31, 2011 and subsequent filings on Form 10-Q, for a description of the important factors that could cause the actual results of Tower to differ materially from those indicated in these statements. Forward-looking statements speak only as of the date on which they are made, and Tower undertakes no obligation to update publicly or revise any forward-looking statement, whether as a result of new information, future developments or otherwise. Notes on Non-GAAP Financial Measures (1) Operating income excludes realized gains and losses, acquisition-related transaction costs and the results of the reciprocal business, net of tax. Operating income is a common measurement for property and casualty insurance companies. We believe this presentation enhances the understanding of our results of operations by highlighting the underlying profitability of our insurance business. Additionally, these measures are a key internal management performance standard. Operating earnings per share is operating income divided by diluted weighted average shares outstanding. Operating return on equity is annualized operating income divided by average common stockholders' equity. See appendix for reconciliation of Non- GAAP measures. (2) Gross premiums written and managed include gross premiums written through our insurance subsidiaries and produced as managing general agent on behalf of other insurance companies, including the reciprocal business. See appendix for reconciliation of Non-GAAP measures. |
2 Presentation Outline I. Tower Overview II. Third Quarter 2012 and Superstorm Sandy Update III. Merger Transaction Overview IV. Positive Trends and Outlook |
 I. Overview of Tower 3 |
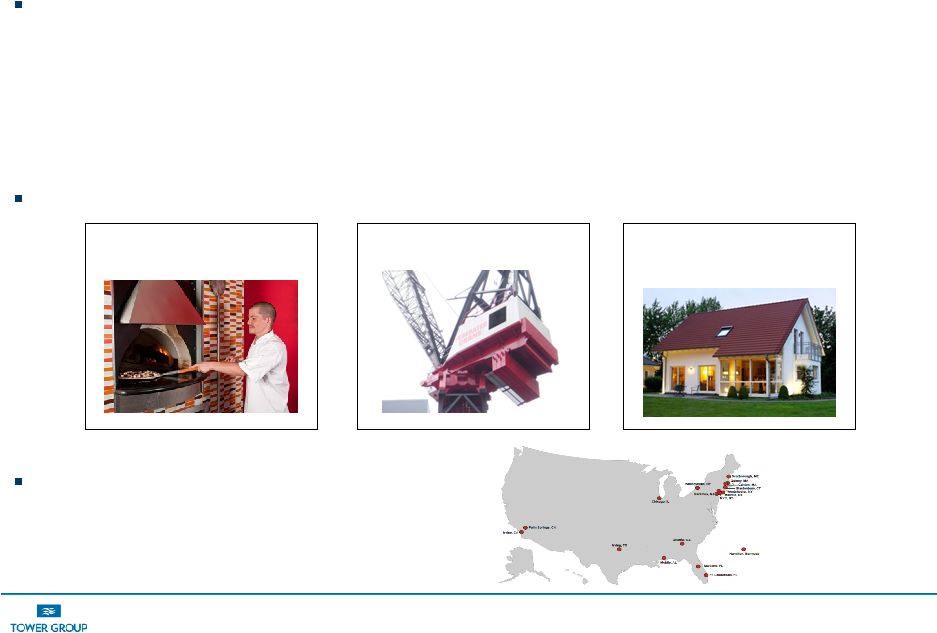 4 Diversified Property and Casualty Insurance Company With a Niche Focus • Headquartered in New York City • Formed in 1990 with a favorable track record of operating performance • Top 50 P&C insurance company in U.S., rated “A-" by A.M. Best with positive outlook • 2011 GPW and managed of $1.8B and over $1B in equity Broad Product Offering Expanding National Presence • 20 offices nationwide • Over 1400 employees Overview of Tower (“TWGP”) Commercial General Commercial Specialty Personal Lines Home and auto |
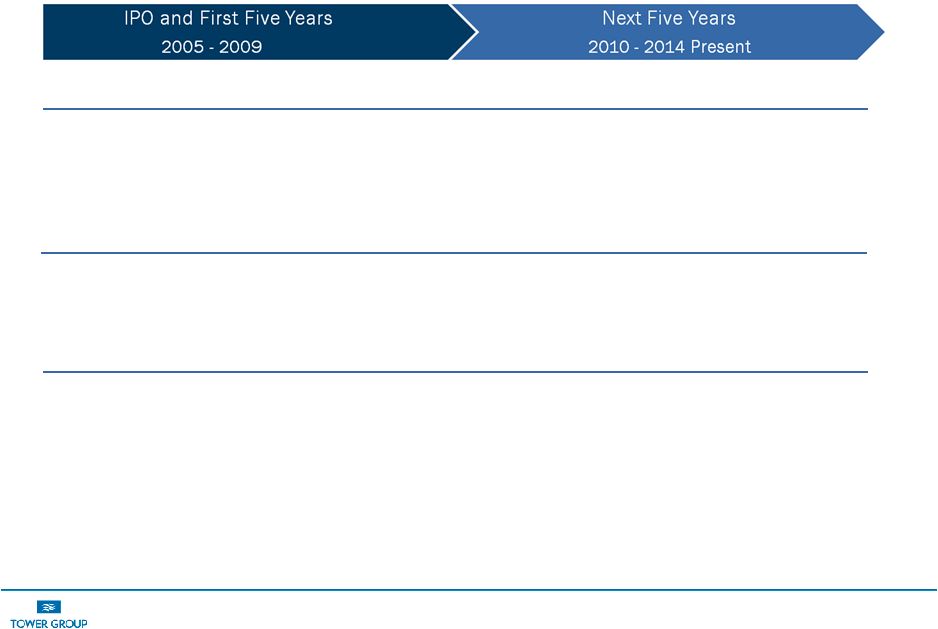 5 History and Progress • High ROE achieved by maintaining limited capital base ($330M) with reinsurance support from CastlePoint • Significantly increased capital ($1B) and lost access to Bermuda platform after merger with CastlePoint in 2009 • Developed a new 5 year plan to leverage capital first by making acquisitions in 2009 and then through organic growth initiatives beginning in 2011 • Significant investment in technology, winding down in 2013 • Generating fee income through acquisition of reciprocal exchanges • Entered into Canopius transaction in 2012 to expand globally (U.S, London, Bermuda) and regain Bermuda platform • IPO in October, 2004 • Formed CastlePoint in 2006 • CastlePoint merged with Tower in 2009 • Acquisitions to deploy excess capital 2009 – 2010 • Organic Growth Initiative 2011 • Canopius Transaction 2012 • Northeast expansion with limited expansion nationally • Commercial lines /limited personal lines • National expansion with international business mix through Lloyd’s and Bermuda • Commercial/Specialty/ Personal / International Geographical Focus / Products Business Model Significant Events |
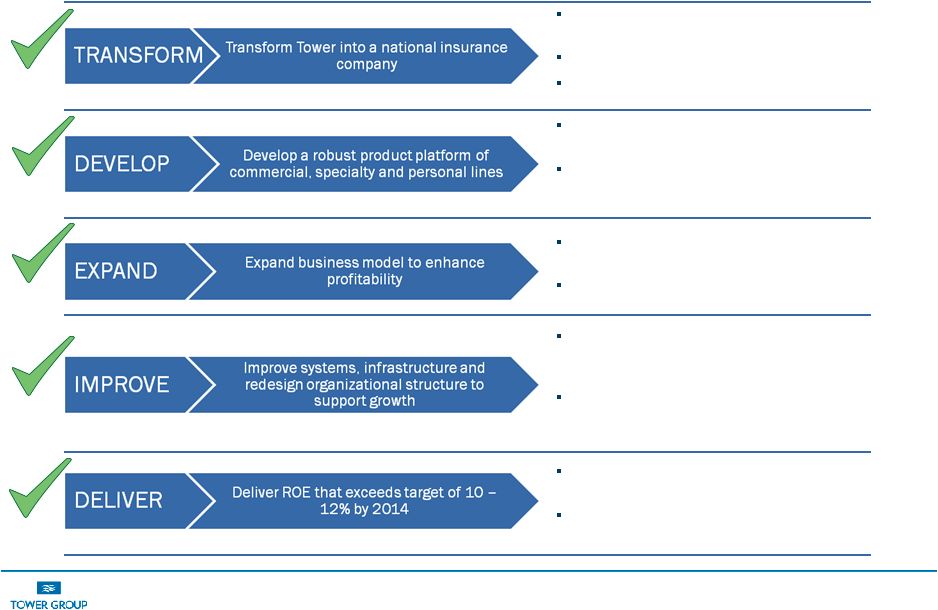 6 Tower is Well-Positioned to Achieve its 2010 – 2014 Goals One of the Top 50 insurance companies in the US with $1.8bn in gross premiums Licensed in 50 states International expansion began in 2011 due to soft domestic market conditions 3Q 2012 GPW was 35% commercial lines, 29% specialty lines and 36% personal lines Organic initiatives are creating growth opportunities across existing and new product lines and customer groups Personal lines reciprocals are a new source of fee income with opportunity for growth Merger transaction allows Tower to regain the Bermuda platform Developed and implemented new systems infrastructure across all functional areas to fully leverage product suite nationwide Completion of technology projects will lower internal expense structure (Legacy systems to be replaced by mid-2013) Towers expects ROE to be in the range between 10 to 12% beginning in 2013 Merger transaction restores Bermuda platform and increases ROE range to 13 – 15% |
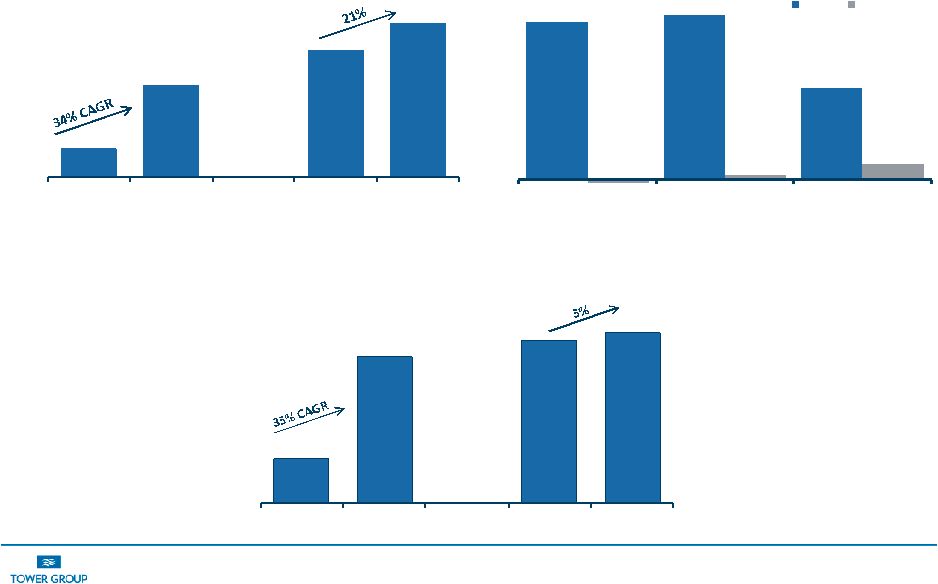 7 36.5% 38.2% 21.0% -0.8% 0.9% 3.5% 2005-2009 2010 2011 Tower P&C Industry Strong Track Record of Profitable Growth AM Best and Company Data. Total Premium Growth Gross Premiums Written and Produced Book Value per Share *2005 – 2009 represents average total premium growth for Tower and Industry * $335 $1,082 $1,496 $1,811 2005 2009 2010 2011 $6.88 $22.72 $25.19 $26.37 2005 2009 2010 2011 |
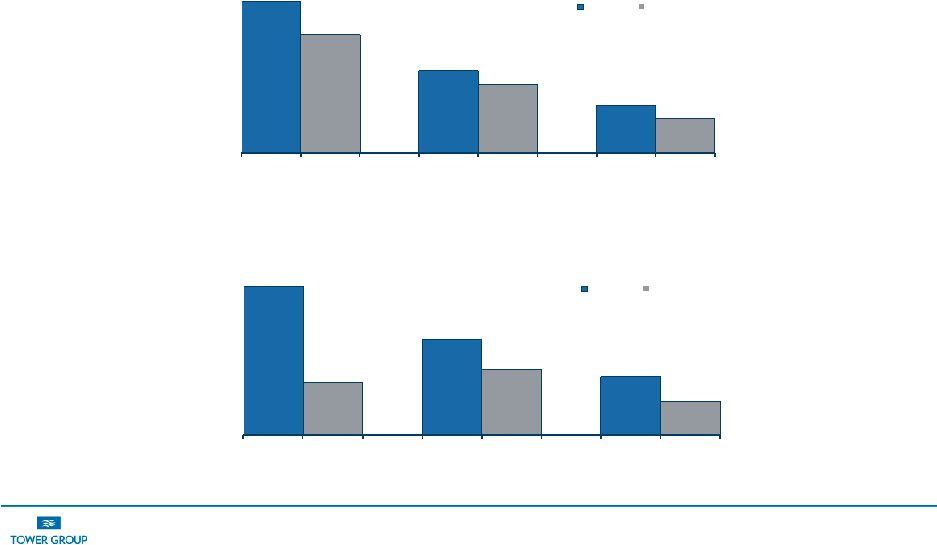 8 21.0% 7.5% 13.6% 9.4% 8.3% 4.8% 2005 - 09 2010 2011 Tower P & C Industry 17.2% 13.4% 9.4% 7.8% 5.4% 4.0% 2005 - 09 2010 2011 Tower P & C Industry Tower’s Returns Have Consistently Outperformed the Average of Publicly Traded P&C Companies Note: SNL Financial and Company Data. 2005 – 2009 averages are premium weighted Operating Return on Average Equity Operating Return on Average Tangible Equity |
 II. Third Quarter 2012 and Superstorm Sandy Update 9 |
 10 Third Quarter Snapshot - Strong Operating Results Net operating Income • Net operating income of $23.8 million or $0.62 per diluted share compared with operating loss of $15.3 million, or ($0.38) per diluted share same period last year • Previously disclosed litigation settlement of $2.9 million after-tax ($0.08 per share) charge was recorded against 3Q operating results. » Excluding the litigation charge, net operating income would have been $26.7 million or ($0.70) per diluted share Gross premiums written and managed • $484.8 million, representing a decrease of 6.6% primarily due to the termination of two programs ($51.7 million from program cancelled in 3Q12 and $23.3 million of assumed reinsurance business, which was commuted in 4Q11) • Excluded these 2 programs, 3Q12 GWP and managed increased by 8.2% Net loss ratio and combined ratio • The net loss ratio excluding the reciprocal exchanges improved to 60.8% from 77.6% • Excluding the business that Tower manages on behalf of the reciprocal exchanges, the net combined ratio improved to 96.3% from 112.0% Continued positive market and pricing trends • 4.3% premium increase on renewed business (4.0% increase for commercial excluding programs; 4.5% for personal) Growth in book value • Stockholders’ equity increased by 4% in 3Q12 to $1,055 million from $1,014 million from same time period last year despite the $64.5 million in share repurchases. • Book value per share increased by 8% to $27.49 in 3Q12 compared to $25.42 in 3Q11 |
 11 Organic Growth Initiative is Working Excluding the effects of terminated program and commutation of an assumed reinsurance treaty GPW were up $40.7 million or 8.2% due to organic growth initiatives • Continued production from newly created businesses including Assumed Reinsurance ($39 million of GWP in the third quarter), Customized Solutions and National Commercial Property business units • Forming strategic alliances with Lloyd's syndicates to provide expertise and to support customized solutions • Evaluating industries and customer groups such as construction and affluent home owners • Improving product manufacturing capabilities for core products The Organic Growth Initiative is building momentum by investing in Product, People and Process • Product: Identifying product opportunities from internal research and customized solutions clients while forming strategic alliances with companies with specialty product expertise • People: Recruiting franchise leaders to expand our product offering. Decentralizing and implementing franchise concept • Process: Investing in business development to deliver customized solutions and in business intelligence to conduct research. Strengthening cross functional committees and practices. Investing our processes and practices to improve and drive customer experience |
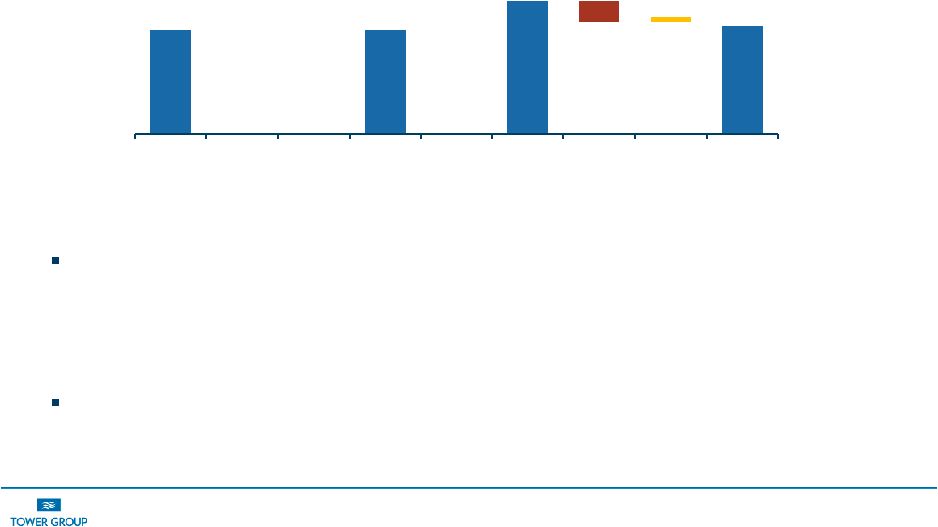 12 Net Loss and Loss Expense Ratio, Excluding Reciprocals The net loss ratio was 60.8% for the third quarter of 2012 compared to 77.6% for the third quarter of 2011. • Included in the third quarter 2011 loss ratio was 12.3 points associated with Hurricane Irene and 2.6 points associated with reserve development. Excluding the impact of severe weather and reserve development the net loss ratio improved to 60.8% in 3Q12 compared to 62.7% in 3Q11. 60.8 60.8 77.6 65.3 65.3 62.7 -12.3 -2.6 3Q12 Storms Dev. Pro - Forma 3Q12 3Q11 Storms Dev. Pro - Forma 3Q11 Loss Ratio (%) 3Q12 3Q11 |
 13 Superstorm Sandy Impact to be Limited due to Tower’s Catastrophe Reinsurance Program Tower’s current after-tax estimate of loss ranges from $55 million to $68 million • Tower has exposure to Superstorm Sandy through direct insurance operations, reinsurance assumed businesses and two alternative investments Tower expects its direct insurance loss to be contained in its first reinsurance layer • Tower expects pre-tax net loss from direct insurance business to be $90 to $95 million, including reinstatement premiums • Direct losses in excess of $75 million pre-tax are ceded to reinsurers as shown in table below Assumed reinsurance pre-tax losses expected to be between $15 and $20 million Tower expects to recover $10 million if industry losses exceed $10 billion and an additional $10 million if industry losses exceed $15 billion through industry loss warranties that it put in place in July 2012 to manage risk associated with exposure in the Northeast Tower believes its alternative investments will not be materially affected by the losses associated with Superstorm Sandy Range of Loss Retention Tower Net Loss $0 - $75 million Retained by Tower $75 million $75 - $150 million 100% reinsured $75 million $150 - $225 million 70% reinsured $75 - $97.5 million $225 - $400 million 100% reinsured $75 - $97.5 million |
 III. Merger Transaction Overview 14 |
 15 Merger Benefits Creates an efficient global, diversified specialty insurance company that supports our expansion plans • Efficient international holding company structure • Diversified product platform comprised of U.S and international business with access to U.S., Bermuda and Lloyd’s markets Improve profitability and financial strength • By regaining a Bermuda platform, Tower expects to increase its ROE range to 13% to 15% within 18 months of the merger • Projected to be single-digit accretive to EPS in the first full year and mid-teens accretive in the second full year • Stockholders’ equity will increase through the merger to support growth resulting from the new business platform Bermuda platform provides competitive advantage to support growth opportunities in U.S. and international markets • Provides efficient source of capital to support Tower’s expansion in the U.S. • Supports international expansion plans, especially business sourced from Lloyd’s and Bermuda |
 16 Combined Business Plan, Post-Merger Merger will enable Tower to create a global specialty insurance company with access to U.S., Bermuda and Lloyd’s markets: U.S. Bermuda Lloyds Continue to focus on building commercial, specialty and personal lines businesses with continuing reinsurance support from Bermuda based reinsurance affiliate Assumed Reinsurance business will be underwritten from the Bermuda office utilizing the staff acquired from the merger with CHBL supplemented by other Bermuda personnel Other businesses (ex. risk sharing business previously underwritten by CastlePoint Re) will be created using Bermuda platform Continue to participate in Lloyd’s business through ownership in and expanded reinsurance relationship with Canopius and continue to support other Lloyd’s syndicates Continue to build out organic initiatives to leverage infrastructure Efficient use of capital across the group Diversification of business model to source attractive business Access to business global and specialty risks |
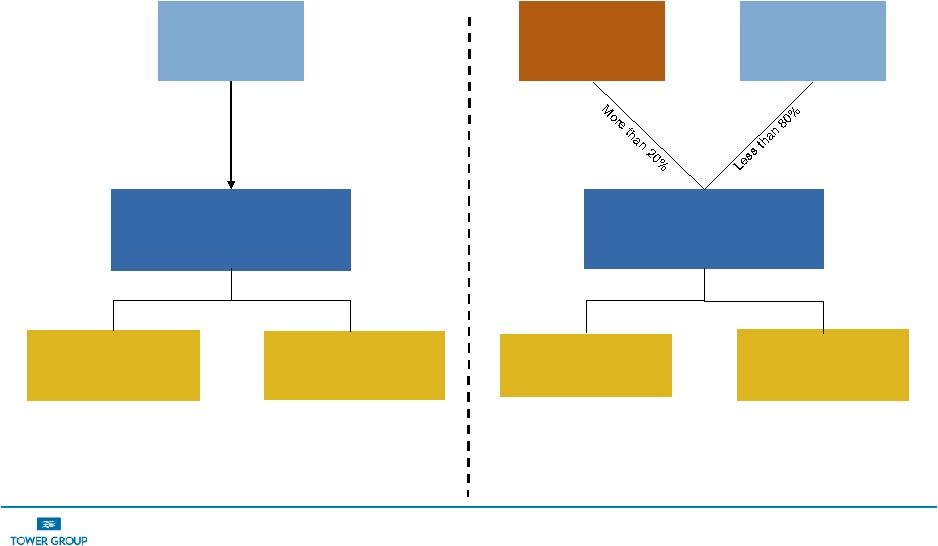 17 High Level Pro Forma Corporate Chart Tower Group Delaware Holding Company *CP Re used solely to reinsure US Pool Tower Shareholders 100% US Pool* Castle Point Re* (“CP Re”) CURRENT STRUCTURE New Shareholders Tower Shareholders Tower Group Bermuda Holding Company Bermuda Operations, Lloyd’s and CP Re business Tower and its Subsidiaries U.S. Operations EXPECTED POST MERGER STRUCTURE |
 IV. Positive Trends and Outlook 18 |
 19 Positive Trends and Outlook Successful implementation of new five year plan (2010 to 2014) will allow Tower to emerge with greater size, diversification and profitability • Underperformance from 2010 to 2012 due to: » Deployment of excess capital, acquisition integration costs, investment in infrastructure and non-recurring events • Positive trends expected in 2013 (excluding merger) due to: » Full deployment of capital, improving scale resulting from leveraging technology investment and organic growth initiative and improving P&C market conditions Merger transaction • Accelerates completion of business model revision (U.S, Bermuda and London) and restores CastlePoint’s Bermuda platform • Creates an efficient global, diversified specialty insurance company with a Bermuda platform that provides a competitive advantage to support U.S. and international growth • Provides highly compelling opportunity for Tower shareholders to benefit from upside potential of combined entity • Closing of merger is at Tower’s discretion (and will only occur on terms favorable to Tower shareholders) Tower expects full year 2013 operating earnings per share to be in a range of $2.85 to $3.05 excluding any benefits of the proposed merger transaction. • By regaining a Bermuda platform, Tower expects to increase its ROE range to 13% to 15% within 18 months of the merger |
 Appendix 20 |
 21 Appendix- Non- GAAP Measures and Reconciliation GPW Written and managed (Dollars in thousands) Years ended December 31, 2011 2010 2009 Gross Premiums Written, Tower Stock Companies $1,561,624 $1,369,481 $1,082,417 Premiums managed for others (A) 209,300 126,800 11,700 Gross Premiums Written and Managed $1,810,924 $1,496,281 $1,070,717 (A) managed premiums in 2011 and 2010 are for the Reciprocal Business Operating Income (Dollars in thousands) Years ended December 31, 2011 2010 2009 Net income attributable to Tower Group, Inc. $60,198 $103,890 $96,798 Less: Net realized gains (losses) on investments 6,980 13,740 1,501 Add: Acquisition related transaction costs 360 2,369 14,038 Income tax 2,470 4,636 (2,047) Operating Income $56,048 $97,155 $107,288 |