UNITED STATES
SECURITIES AND EXCHANGE COMMISSION
Washington, D.C. 20549
FORM N-CSR
CERTIFIED SHAREHOLDER REPORT OF REGISTERED
MANAGEMENT INVESTMENT COMPANIES
Investment Company Act file number 811-21582
Madison / Claymore Covered Call Fund
(Exact name of registrant as specified in charter)
2455 Corporate West Drive
Lisle, IL 60532
(Address of principal executive offices) (Zip code)
Nicholas Dalmaso, Chief Legal and Executive Officer
Madison / Claymore Covered Call Fund
2455 Corporate West Drive
Lisle, IL 60532
(Name and address of agent for service)
Registrant’s telephone number, including area code: (630) 505-3700
Date of fiscal year end: December 31
Date of reporting period: June 30, 2005
Form N-CSR is to be used by management investment companies to file reports with the Commission not later than 10 days after the transmission to stockholders of any report that is required to be transmitted to stockholders under Rule 30e-1 under the Investment Company Act of 1940 (17 CFR 270.30e-1). The Commission may use the information provided on Form N-CSR in its regulatory, disclosure review, inspection, and policymaking roles.
A registrant is required to disclose the information specified by Form N-CSR, and the Commission will make this information public. A registrant is not required to respond to the collection of information contained in Form N-CSR unless the Form displays a currently valid Office of Management and Budget (“OMB”) control number. Please direct comments concerning the accuracy of the information collection burden estimate and any suggestions for reducing the burden to Secretary, Securities and Exchange Commission, 450 Fifth Street, NW, Washington, DC 20549-0609. The OMB has reviewed this collection of information under the clearance requirements of 44 U.S.C. Section 3507.
| Item 1. | Reports to Stockholders. |
The registrant’s semi-annual report transmitted to shareholders pursuant to Rule 30e-1 under the Investment Company Act of 1940 is as follows:

www.madisonclaymore.com
| | | | |
| | | ... your road to the LATEST, | | |
| | | most up-to-date INFORMATION about the | | |
| | | Madison/Claymore Covered Call Fund | | |

The shareholder report you are reading right now is just the beginning of the story. Online at madisonclaymore.com, you will find:
| • | | Daily, weekly and monthly data on share prices, distributions and more |
| • | | Monthly portfolio overviews and performance analyses |
| • | | Announcements, press releases and special notices |
| • | | Fund and adviser contact information |
Madison Investment Advisors and Claymore are continually updating and expanding shareholder information services on the Fund’s website, in an ongoing effort to provide you with the most current information about how your Fund’s assets are managed, and the results of our efforts. It is just one more way we are working to keep you better informed about your investment in the Fund.
2 | SemiAnnual Report | June 30, 2005
MCN | Madison/Claymore Covered Call Fund
Dear Shareholder
We thank you for your investment in Madison/Claymore Covered Call Fund (MCN). As Investment Adviser for the Fund, we are pleased to submit the MCN semiannual shareholder report for the six-month period ended June 30, 2005.
As you may know, the Fund’s primary investment objective is to seek to provide a high level of current income and current gains, with a secondary objective of long-term capital appreciation. The Fund pursues its investment objectives by investing in a portfolio of what the Investment Manager believes to be high-quality, large-capitalization stocks that are trading reasonable valuations in relation to their long-term earnings growth rates. A covered call options overlay is employed on a substantial portion of the Fund’s portfolio to help support income.
Madison Asset Management, LLC, a wholly-owned subsidiary of Madison Investment Advisors, Inc., is the Fund’s Investment Manager. Founded in 1974, Madison is an independently owned firm that acts as an investment adviser for individuals, corporations, pension funds, endowments, insurance companies and mutual funds. Madison and its subsidiaries managed approximately $11.1 billion in assets as of June 30, 2005.
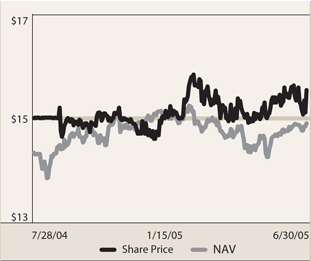
During the six-month period, the Fund generated a total return of 2.86% at net asset value (NAV). This represents a change in NAV from $15.14 at the start of the period to $14.90 on June 30, 2005 plus the reinvestment of the Fund’s quarterly dividends. The Fund’s market price exceeded these returns with a gain of 9.00%, which reflects a market price of $15.54 at the close of the period vs. $14.90 on December 31, 2004 plus the reinvestment of the Fund’s quarterly dividends.
We’d like to encourage shareholders to consider the opportunity to reinvest their dividends from the Fund through the Dividend Reinvestment Plan (DRIP) that is described in detail on page 18 of this report.
If shares should trade at a discount to NAV, the DRIP takes advantage of the discount by reinvesting the quarterly dividend distribution in common shares of the Fund purchased in the market at a price less than NAV. Conversely, when the market price of the Fund’s common shares is at a premium above NAV, the DRIP reinvests participants’ dividends in newly-issued common shares at NAV, subject to an IRS limitation that the purchase price can not be more than 5% below the market price per share. The DRIP provides a cost effective means to accumulate additional shares and enjoy the benefits of compounding returns over time.
To learn more about the Fund’s performance over this fiscal period, we encourage you to read the Portfolio Management Commentary section of the report on page 4. You’ll find information on what impacted the performance of the Fund during the fiscal period and Madison Asset Management’s views on the overall market environment.
We appreciate your investment and look forward to serving your investment needs in the future. For the most up-to-date information on your investment, please visit the Fund’s website at www.madisonclaymore.com.
Sincerely,

Nicholas Dalmaso
Chief Executive Officer, Madison/Claymore Covered Call Fund
August 8, 2005
SemiAnnual Report | June 30, 2005 | 3
MCN | Madison/Claymore Covered Call Fund
Questions & Answers
We at Madison Asset Management LLC are pleased to address the progress of the Madison Claymore Covered Call Fund (MCN) for the semiannual period ending June 30, 2005. Introduced in July of 2004, the Fund continues to pursue its investment objectives by investing in what we believe are high-quality, large-capitalization common stocks that are, in our view, selling at a reasonable price with respect to their long-term earnings growth rates. Our option-writing strategy has provided a steady income return from option premiums which help to achieve our goal of providing a high level of current income and current gains with a secondary objective of long-term capital appreciation.
Madison Asset Management, LLC, (MAM) a wholly-owned subsidiary of Madison Investment Advisors, Inc., with its affiliates, manages over $11.1 billion in individual, corporate, pension, insurance, endowment and mutual fund assets.
What are your thoughts on the economy and the market outlook?
Our thoughts on the economy reveal two conflicting and generally unpredicted factors that influenced the investment picture this period: $60/barrel oil and 10-year bond yields hovering around 4%. Higher energy and commodity prices are taxing on the consumer and many businesses, while lower long-term interest rates stimulate growth in cyclical industries, such as those related to construction.
The sentiment for the remainder of the year is mixed. Those in the bullish camp envision favorable investment prospects, with Fed tightening in the late innings of the game and moderate, if decelerating, corporate earnings growth. They point towards consumer optimism, which remains solid behind appreciating real estate assets and the low cost of debt. The bearish camp chooses to focus on what they fear is a housing bubble brought about by very low interest rates, the flattening yield curve and signs that the consumer is overextended. Both camps have plenty of ammunition for their arguments as the economy is undoubtedly sending mixed signals. Domestically, growth is still strong, although moderating somewhat, but globally, economies are weaker. This divergence of economic indicators and investor sentiment has created uncertainty in the markets since the beginning of the year.
Since the lows in August of 2004 and after a meaningful pause in the post-recession market rally, stocks have moved ahead and have gained nearly 10% (based on Standard & Poor’s 500 Index return of 9.96% for the period July 30, 2004 through June 30, 2005)1. With the growing expectation of an economic acceleration in the second half of 2005, the market advance has enjoyed solid underpinnings and gives us confidence that the rally may continue through the remainder of the year. However, many stocks in our research universe, including a number of the Fund’s larger stock holdings, appear rather fully priced after the recent rally. Finding new, attractive stocks has proven more difficult, all suggesting that an intermediate market correction is due. Such a short-term setback would actually be a welcome event, as it would restore better value and allow us decent opportunities to replace appreciated stocks that may be called away at their various option expiration dates over the next few months.
How did the Fund perform given the marketplace conditions during the six-month period?
We are pleased to report that MCN enjoyed an excellent startup from its inception on July 28, 2004, almost one year ago. The Fund’s NAV (net asset value per share) has grown nicely from $14.33 per share at inception to $14.90 on June 30, 2005, and since inception has paid $0.96 per share in dividends. The Fund’s market value on June 30 was $15.542.
For the first half of 2005, its total return at NAV of 2.86% compares very favorably to the - -0.81% return for the Standard & Poor’s 500 and the 0.82% increase for the BXM (CBOE Buy/Write Index) over the same period3. We’re also pleased with the 9.00% gain the Fund achieved in market value in the six-month period. While we can’t control market price, we are, nonetheless, pleased by the confidence that investors have shown in the Fund.
Thus, we believe that the Fund has achieved excellent results since its inception, providing us with considerable confidence in meeting our longer term goals.
4 | SemiAnnual Report | June 30, 2005
MCN | Madison/Claymore Covered Call Fund | Questions & Answers continued
Describe the Fund’s portfolio equity and option structure:
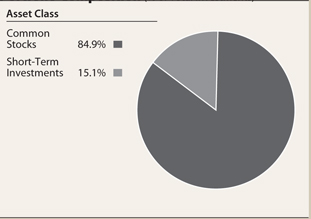
As of June 30, 2005, the Fund held 43 common stocks, comprising 92.8% of total net assets. Covered call options were written on more than 86% of the stock holdings on June 30, 2005. During the second quarter, we’ve written option premiums of $6.9 million which had an average duration to their option expiration dates of 4.3 months. Through June 30, a meaningful number of the covered stocks have risen in price beyond their respective option expiration dates (or “in-the-money”). Following the recent stock market rally, this provides the Fund with a measure of downside protection because those stocks may now drift slightly lower in price, to the option expiration price, without sacrificing our maximum potential total return for the stock.
Which sectors are prevalent in the Fund?
From a sector perspective, MCN’s largest exposure was in the consumer discretionary sector, followed by near equal weightings in the financial, health care and pharmaceutical and technology sectors. We continue to remain absent from the energy and materials sectors (which declined in the period) as our investment discipline avoids companies that are cyclical in nature and unpredictable with respect to corporate cash flow.
Please discuss the Fund’s security and option selection process:
The Fund is managed by two teams of investment professionals. We like to think of these teams as the “right hand” and “left hand” in that they work together to make common stock and option decisions. We use fundamental analysis to select solid companies with what we believe to be good growth prospects and attractive valuations. We then seek attractive call options to write on those stocks. It is our belief that this partnership of active management between the equity and option teams provides investors with an innovative, risk-moderated approach to equity investing.
Madison Asset Management seeks to invest in a portfolio of common stocks that have favorable “PEG” ratios (Price-Earnings ratio to Growth rate) as well as financial strength and industry leadership. As bottom-up investors, we focus on the fundamental businesses of our companies. Our stock selection philosophy strays away from the “beat the street” objective, as we seek companies that have sustainable competitive advantages, predictable cash flows, solid balance sheets and high-quality management teams. By concentrating on long-term prospects and circumventing the “instant gratification” school of thought, we believe we bring elements of consistency, and predictability to our shareholders.
Once we have selected what we believe to be attractive and solid names for the Fund, we employ our call writing strategy. This procedure entails selling calls that are primarily out-of the-money, meaning that the strike price is higher than the common stock price, so that the Fund can participate in some stock appreciation. By receiving option premium, the Fund receives a high level of investment income and adds an element of downside protection. Call options may be written over a number of time periods and at differing strike prices in an effort to maximize the protective value to the strategy and spread income evenly throughout the year.
Describe the Fund’s Dividend Policy:
The Fund’s policy is to declare quarterly dividends to shareholders consisting of investment company taxable income, which includes, among other things, ordinary income, qualified dividend income, short-term capital gain (including premiums earned in connection with certain of the Fund’s covered call options) and income from certain hedging and interest rate transactions. Net realized long-term capital gain, if any, will be distributed annually.
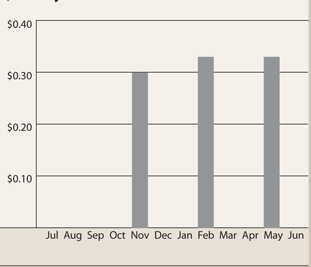
The Fund declared its first quarterly dividend of $0.30 per share last November, and then increased the quarterly dividend to $0.33 per share in February, followed by another $0.33 dividend paid May 28, 2005. At the Fund’s market price per share of $15.54 on June 30, 2005, the distribution rate assuming the current $0.33 quarterly dividend is 8.49%.
SemiAnnual Report | June 30, 2005 | 5
MCN | Madison/Claymore Covered Call Fund | Questions & Answers continued
Do you have any other comments for the shareholders?
The Fund’s management is quite pleased with its early performance success, compared to the S&P 500 and BXM indexes and, in our assessment, most of the other publicly-traded option writing funds, especially those that have entered the market over the past year. We continue to believe that our strategy will provide superior long-term results, owing to (1) selection of high-quality, consistent growth stocks at reasonable valuations, (2) writing call options on individual stocks which offer larger option premiums than call options on major market indexes and (3) allowing for some upside appreciation participation in our individual stocks. Of course there is no guarantee that the Fund will achieve those objectives, but we feel that the Fund has made considerable progress to date on reaching those goals. As always, we appreciate your confidence in the Fund.
| 1 | The S&P 500 Index is a capitalization-weighted index of 500 stocks designed to measure performance of the broad economy, representing all major industries. Index returns include the reinvestment of all distributions. It is not possible to invest directly in an index. |
| 2 | In addition, further progress has been made since the close of the fiscal period. For the 12 months ended July 29, 2005 the Fund posted a NAV return of 13.57%, which reflects a NAV of $15.23 per share at the end of July. For the same 12-month period, we are pleased to report that the Fund’s market value (appreciation, realized capital gains and net income) return was 12.32%, reflecting a market price of $15.80 on July 29, 2005. This compares well to the Fund’s primary performance benchmark, the Chicago Board Option Exchange’s Buy/Write Index, the BXM, which gained 9.70% for the 12 months ended July 29, 2005. |
| 3 | The Chicago Board Option Exchange (CBOE) BuyWrite index (BXM) is an index that simulates an ongoing covered call strategy on the S&P 500 index. The BXM index consists of an unmanaged portfolio of stocks, upon which a call option on the S&P 500 index is continuously written. The option is always a one-month option at the nearest out-of-the-money strike price. Index returns include the reinvestment of all distributions. It is not possible to invest directly in an index. |
MCN Risks and Other Considerations
There can be no assurance that the Fund will achieve its investment objectives. The value of the Fund will fluctuate with the value of the underlying securities. Historically, closed-end funds often trade at a discount to their net asset value.
A strategy of writing (selling) covered call options entails various risks. For example, the correlation between the equity securities and options markets may, at times, be imperfect and can furthermore be affected by market behavior and unforeseen events, thus causing a given transaction to not achieve its objectives. There may be times when the Fund will be required to purchase or sell equity securities to meet its obligations under the options contracts on certain options at inopportune times when it may not be beneficial to the Fund. The Fund will forego the opportunity to profit from increases in the market value of equity securities that it has written call options on, above the sum of the premium and the strike price of the option. Furthermore, the Fund’s downside protection on equity securities it has written call options on would be limited to the amount of the premium received for writing the call option and thus the Fund would be at risk for any further price declines in the stock below that level. Please refer to the Fund’s prospectus for a more thorough discussion of the risks associated with investments in options on equity securities.
An investment in the Fund includes, but is not limited to, risks and considerations such as: Investment Risk, Not a Complete Investment Program, Equity Risk, Risks Associated with Options on Securities, Limitation on Option Writing Risk, Risks of Mid-Cap Companies, Income Risk, Foreign Securities Risk, Industry Concentration Risk, Derivatives Risk, Illiquid Securities Risk, Fund Distribution Risk, Market Discount Risk, Other Investment Companies, Financial Leverage Risk, Management Risk, Risks Related to Preferred Securities, Interest Rate Risk, Inflation Risk, Current Developments Risk and Anti-Takeover Provisions.
Fund Distribution Risk In order to make regular quarterly distributions on its common shares, the fund may have to sell a portion of its investment portfolio at a time when independent investment judgment may not dictate such action. In addition, the Fund’s ability to make distributions more frequently than annually from any net realized capital gains by the Fund is subject to the Fund obtaining exemptive relief from the Securities and Exchange Commission, which cannot be assured. To the extent the total quarterly distributions for a year exceed the Fund’s net investment company income and net realized capital gain for that year, the excess will generally constitute a return of the Fund’s capital to its common shareholders. Such return of capital distributions generally are tax-free up to the amount of a common shareholder’s tax basis in the common shares (generally, the amount paid for the common shares). In addition, such excess distributions will decrease the Fund’s total assets and may increase the Fund’s expense ratio.
Risks Associated with Options on Securities There are several risks associated with transactions in options on securities. For example, there are significant differences between the securities and options markets that could result in an imperfect correlation between these markets, causing a given transaction not to achieve its objectives. A decision as to whether, when and how to use options involves the exercise of skill and judgment, and even a well-conceived transaction may be unsuccessful to some degree because of market behavior or unexpected events. As the writer of a covered call option, the Fund forgoes, during the option’s life, the opportunity to profit from increases in the market value of the security covering the call option above the sum of the premium and the strike price of the call but has retained the risk of loss should the price of the underlying security decline. The writer of an option has no control over the time when it may be required to fulfill its obligation as a writer of the option. Once an option writer has received an exercise notice, it cannot effect a closing purchase transaction in order to terminate its obligation under the option and must deliver the underlying security at the exercise price.
NOT FDIC-INSURED • NOT BANK-GUARANTEED • MAY LOSE VALUE
6 | SemiAnnual Report | June 30, 2005
MCN | Madison/Claymore Covered Call Fund
Fund Summary | As of June 30, 2005 (unaudited)
| | | | | | | |
| Fund Statistics | | | | | | | |
| | |
Share Price | | | | | $ | 15.54 | |
Common Share Net Asset Value | | | | | $ | 14.90 | |
Premium/(Discount) to NAV | | | | | | 4.30 | % |
Net Assets ($000) | | | | | $ | 278,706 | |
| | |
Total Returns | | | | | | | |
| (Inception 7/28/04) | | | | | | | |
| | |
| | | Market
| | | NAV
| |
Six Month – non-annualized | | 9.00 | % | | | 2.86 | % |
Since Inception – average annual | | 10.48 | % | | | 10.88 | % |
| | | | |
Share Price & NAV Performance
Quarterly Dividends Per Share
| | | |
| Top Sectors* | | | |
| | | % of Long-Term Investments
| |
Consumer Discretionary | | 20.7 | % |
Financials | | 19.0 | % |
Technology | | 18.9 | % |
Healthcare | | 18.6 | % |
Business Services | | 7.0 | % |
Insurance | | 6.2 | % |
Software | | 3.8 | % |
Exchange Traded Funds | | 3.7 | % |
Consumer Services | | 2.1 | % |
| |
| Top Ten Holdings | | | |
| |
| | | % of Long-Term Investments
| |
Bed Bath & Beyond, Inc. | | 4.4 | % |
Intel Corp. | | 4.1 | % |
Capital One Financial Corp. | | 3.9 | % |
Kohl’s Corp. | | 3.7 | % |
Nasdaq-100 Index Tracking Stock | | 3.7 | % |
Amgen, Inc. | | 3.6 | % |
Home Depot, Inc. | | 3.5 | % |
Morgan Stanley Co. | | 3.4 | % |
Hewlett-Packard Co. | | 3.3 | % |
American International Group, Inc. | | 3.2 | % |
| * | Securities are classified by sectors that represent broad groupings of related industries. |
Past performance does not guarantee future results. Portfolio composition, holdings and sectors are subject to change daily.
Portfolio Composition (% of Total Investments)
7 | SemiAnnual Report | June 30, 2005
MCN | Madison/Claymore Covered Call Fund
Portfolio of Investments | June 30, 2005 (unaudited)
| | | | | | | |
Number of Shares
| | | | Value
| |
| | | | Common Stocks – 92.8% | | | | |
| | |
| | | | Business Services – 6.5% | | | | |
| | 100,000 | | Cintas Corp. | | $ | 3,860,000 | |
| | 190,000 | | First Data Corp. | | | 7,626,600 | |
| | 153,700 | | Fiserv, Inc. (a) | | | 6,601,415 | |
| | | | | |
|
|
|
| | | | | | | 18,088,015 | |
| | | | | |
|
|
|
| | |
| | | | Consumer Discretionary – 19.2% | | | | |
| | 60,000 | | American Eagle Outfitters, Inc. | | | 1,839,000 | |
| | 270,000 | | Bed Bath & Beyond, Inc. (a) | | | 11,280,600 | |
| | 72,900 | | Best Buy Co., Inc. | | | 4,997,295 | |
| | 200,000 | | Family Dollar Stores, Inc. | | | 5,220,000 | |
| | 24,230 | | Harley-Davidson, Inc. | | | 1,201,808 | |
| | 230,000 | | Home Depot, Inc. | | | 8,947,000 | |
| | 172,000 | | Kohl’s Corp. (a) | | | 9,616,520 | |
| | 130,000 | | Lowe’s Cos., Inc. | | | 7,568,600 | |
| | 30,000 | | Target Corp. | | | 1,632,300 | |
| | 35,000 | | Tiffany & Co. | | | 1,146,600 | |
| | | | | |
|
|
|
| | | | | | | 53,449,723 | |
| | | | | |
|
|
|
| | | | Consumer Services – 2.0% | | | | |
| | 121,400 | | Intuit, Inc. (a) | | | 5,476,354 | |
| | | | | |
|
|
|
| | | | Exchange Traded Funds – 3.4% | | | | |
| | 260,000 | | Nasdaq-100 Index Tracking Stock | | | 9,565,400 | |
| | | | | |
|
|
|
| | | | Financials – 17.6% | | | | |
| | 86,500 | | Affiliated Managers Group, Inc. (a) | | | 5,910,545 | |
| | 125,000 | | Capital One Financial Corp. | | | 10,001,250 | |
| | 113,000 | | Citigroup, Inc. | | | 5,223,990 | |
| | 173,000 | | Countrywide Financial Corp. | | | 6,679,530 | |
| | 270,000 | | MBNA Corp. | | | 7,063,200 | |
| | 100,000 | | Merrill Lynch & Co., Inc. | | | 5,501,000 | |
| | 165,000 | | Morgan Stanley Co. | | | 8,657,550 | |
| | | | | |
|
|
|
| | | | | | | 49,037,065 | |
| | | | | |
|
|
|
| | | | Healthcare – 17.3% | | | | |
| | 155,200 | | Amgen, Inc. (a) | | | 9,383,392 | |
| | 170,000 | | Biogen Idec, Inc. (a) | | | 5,856,500 | |
| | 175,000 | | Biomet, Inc. | | | 6,062,000 | |
| | 231,200 | | Boston Scientific Corp. (a) | | | 6,242,400 | |
| | 256,600 | | Health Management Associates, Inc. | | | 6,717,788 | |
| | 120,000 | | Laboratory Corp. of America Holdings (a) | | | 5,988,000 | |
| | 210,000 | | Mylan Laboratories, Inc. | | | 4,040,400 | |
| | 144,400 | | Pfizer, Inc. | | | 3,982,552 | |
| | | | | |
|
|
|
| | | | | | | 48,273,032 | |
| | | | | |
|
|
|
| | | | Insurance – 5.7% | | | | |
| | 140,000 | | American International Group, Inc. | | | 8,134,000 | |
| | 120,000 | | MGIC Investment Corp. | | | 7,826,400 | |
| | | | | |
|
|
|
| | | | | | | 15,960,400 | |
| | | | | |
|
|
|
| | | | Software – 3.5% | | | | |
| | 200,000 | | Check Point Software Technologies Ltd. (Israel) (a) | | | 3,960,000 | |
| | 270,000 | | Symantec Corp. (a) | | | 5,869,800 | |
| | | | | |
|
|
|
| | | | | | | 9,829,800 | |
| | | | | |
|
|
|
| | | | Technology – 17.6% | | | | |
| | 220,000 | | Altera Corp. (a) | | | 4,360,400 | |
| | 380,000 | | Applied Materials, Inc. | | | 6,148,400 | |
| | 336,000 | | Cisco Systems, Inc. (a) | | | 6,420,960 | |
| | 400,000 | | Flextronics International Ltd. (Singapore) (a) | | | 5,284,000 | |
| | 360,000 | | Hewlett-Packard Co. | | | 8,463,600 | |
| | 407,000 | | Intel Corp. | | | 10,606,420 | |
| | 56,000 | | Maxim Integrated Products, Inc. | | | 2,139,760 | |
| | 100,000 | | Texas Instruments, Inc. | | | 2,807,000 | |
| | 105,000 | | Xilinx, Inc. | | | 2,677,500 | |
| | | | | |
|
|
|
| | | | | | | 48,908,040 | |
| | | | | |
|
|
|
| | | | Total Long-Term Investments – 92.8% (Cost $254,488,682) | | | 258,587,829 | |
| | | | | |
|
|
|
| | |
Principal Amount
| | | | Value
| |
| | | | Short-Term Investments – 16.4% | | | | |
| | |
| | | | Money Market Funds – 0.1% | | | | |
| $ | 237,457 | | AIM Liquid Assets Money Market Fund (Cost $237,457) | | $ | 237,457 | |
| | | | | |
|
|
|
| | | | Repurchase Agreement – 14.1% | | | | |
| | 39,318,000 | | Morgan Stanley Co. (issued 6/30/05 , yielding 2.73%; collateralized by $39,440,000 par of U.S.Treasury Notes due 1/15/15; to be sold on 7/1/05 at $39,320,982) (Cost $39,318,000) | | | 39,318,000 | |
| | | | | |
|
|
|
| | | | U.S. Government and Agencies – 2.2% | | | | |
| | 6,315,000 | | U.S.Treasury Note (yielding 2.73%, maturity 7/7/05) (Cost $6,312,127) | | | 6,312,127 | |
| | | | | |
|
|
|
| | | | Total Short-Term Investments – 16.4% (Cost $45,867,584) | | | 45,867,584 | |
| | | | | |
|
|
|
| | | | Total Investments – 109.2% (Cost $300,356,266) | | | 304,455,413 | |
| | | | Liabilities in excess of other assets (3.1%) | | | (8,808,296 | ) |
| | | | Total Value of Options Written (6.1%) | | | (16,940,935 | ) |
| | | | | |
|
|
|
| | | | Net Assets – 100.0% | | $ | 278,706,182 | |
| | | | | |
|
|
|
See notes to financial statements.
8 | SemiAnnual Report | June 30, 2005
MCN | Madison/Claymore Covered Call Fund | Portfolio of Investments (unaudited) continued
| | | | | | | | | | |
Contracts
(100 shares
per contract)
| | Call Options Written(a)
| | Expiration Date
| | Exercise
Price
| | Value
|
| 865 | | Affiliated Managers Group, Inc. | | September 2005 | | $ | 65.00 | | $ | 436,825 |
| 2,200 | | Altera Corp. | | January 2006 | | | 20.00 | | | 434,500 |
| 300 | | American Eagle Outfitters, Inc. | | January 2006 | | | 27.50 | | | 157,500 |
| 300 | | American Eagle Outfitters, Inc. | | January 2006 | | | 30.00 | | | 112,500 |
| 1,400 | | American International Group, Inc. | | August 2005 | | | 65.00 | | | 17,500 |
| 1,102 | | Amgen, Inc. | | October 2005 | | | 60.00 | | | 347,130 |
| 450 | | Amgen, Inc. | | July 2005 | | | 65.00 | | | 3,375 |
| 1,930 | | Applied Materials, Inc. | | July 2005 | | | 17.00 | | | 14,475 |
| 1,870 | | Applied Materials, Inc. | | January 2006 | | | 17.50 | | | 144,925 |
| 1,020 | | Bed Bath & Beyond, Inc. | | November 2005 | | | 37.50 | | | 591,600 |
| 80 | | Bed Bath & Beyond, Inc. | | August 2005 | | | 40.00 | | | 21,800 |
| 540 | | Bed Bath & Beyond, Inc. | | January 2006 | | | 40.00 | | | 248,400 |
| 462 | | Bed Bath & Beyond, Inc. | | November 2005 | | | 42.50 | | | 120,120 |
| 300 | | Bed Bath & Beyond, Inc. | | January 2006 | | | 42.50 | | | 96,000 |
| 298 | | Bed Bath & Beyond, Inc. | | January 2006 | | | 45.00 | | | 64,070 |
| 729 | | Best Buy Co., Inc. | | September 2005 | | | 55.00 | | | 1,046,115 |
| 250 | | Biogen Idec, Inc. | | January 2006 | | | 35.00 | | | 90,000 |
| 1,450 | | Biogen Idec, Inc. | | October 2005 | | | 40.00 | | | 148,625 |
| 30 | | Biomet, Inc. | | January 2006 | | | 40.00 | | | 2,700 |
| 800 | | Boston Scientific Corp. | | August 2005 | | | 35.00 | | | 6,000 |
| 650 | | Capital One Financial Corp. | | September 2005 | | | 75.00 | | | 445,250 |
| 600 | | Capital One Financial Corp. | | September 2005 | | | 80.00 | | | 216,000 |
| 600 | | Check Point Software Technologies Ltd. (Israel) | | January 2006 | | | 22.50 | | | 52,500 |
| 1,400 | | Check Point Software Technologies Ltd. (Israel) | | July 2005 | | | 25.00 | | | 7,000 |
| 140 | | Cintas Corp. | | November 2005 | | | 40.00 | | | 21,700 |
| 860 | | Cintas Corp. | | August 2005 | | | 45.00 | | | 4,300 |
| 576 | | Cisco Systems, Inc. | | July 2005 | | | 17.50 | | | 95,040 |
| 400 | | Cisco Systems, Inc. | | January 2006 | | | 17.50 | | | 101,000 |
| 1,384 | | Cisco Systems, Inc. | | October 2005 | | | 20.00 | | | 86,500 |
| 405 | | Cisco Systems, Inc. | | January 2006 | | | 20.00 | | | 43,538 |
| 500 | | Countrywide Financial Corp. | | October 2005 | | | 35.00 | | | 242,500 |
| 1,230 | | Countrywide Financial Corp. | | January 2006 | | | 37.50 | | | 504,300 |
| 2,000 | | Family Dollar Stores, Inc. | | July 2005 | | | 32.50 | | | 10,000 |
| 700 | | First Data Corp. | | August 2005 | | | 42.50 | | | 22,750 |
| 200 | | First Data Corp. | | January 2006 | | | 42.50 | | | 34,000 |
| 1,011 | | Fiserv, Inc. | | September 2005 | | | 40.00 | | | 384,180 |
| 296 | | Fiserv, Inc. | | December 2005 | | | 40.00 | | | 139,120 |
| 230 | | Fiserv, Inc. | | December 2005 | | | 45.00 | | | 40,825 |
| 2,753 | | Flextronics International Ltd. (Singapore) | | January 2006 | | | 12.50 | | | 468,010 |
| 1,247 | | Flextronics International Ltd. (Singapore) | | January 2006 | | | 15.00 | | | 68,585 |
| 242 | | Harley-Davidson, Inc. | | January 2006 | | | 50.00 | | | 93,170 |
| 960 | | Hewlett-Packard Co. | | August 2005 | | | 20.00 | | | 355,200 |
| 1,000 | | Hewlett-Packard Co. | | November 2005 | | | 20.00 | | | 405,000 |
| 900 | | Hewlett-Packard Co. | | August 2005 | | | 22.50 | | | 135,000 |
| 740 | | Hewlett-Packard Co. | | January 2006 | | | 22.50 | | | 177,600 |
| 1,360 | | Health Management Associates, Inc. | | August 2005 | | | 25.00 | | | 221,000 |
| 320 | | Health Management Associates, Inc. | | November 2005 | | | 25.00 | | | 68,800 |
| 1,500 | | Home Depot, Inc. | | November 2005 | | | 40.00 | | | 262,500 |
| 200 | | Home Depot, Inc. | | January 2006 | | | 40.00 | | | 46,000 |
| 600 | | Home Depot, Inc. | | January 2006 | | | 42.50 | | | 75,000 |
| 2,560 | | Intel Corp. | | July 2005 | | | 22.50 | | | 908,800 |
| 1,510 | | Intel Corp. | | October 2005 | | | 22.50 | | | 596,450 |
| 529 | | Intuit, Inc. | | July 2005 | | | 40.00 | | | 275,080 |
| 685 | | Intuit, Inc. | | October 2005 | | | 42.50 | | | 294,550 |
| 600 | | Kohl’s Corp. | | July 2005 | | | 45.00 | | | 651,000 |
| 740 | | Kohl’s Corp. | | July 2005 | | | 50.00 | | | 440,300 |
| 380 | | Kohl’s Corp. | | October 2005 | | | 50.00 | | | 286,900 |
| 878 | | Laboratory Corp. of America Holdings | | November 2005 | | | 50.00 | | | 226,085 |
| 400 | | Lowe’s Cos., Inc. | | January 2006 | | | 55.00 | | | 238,000 |
| 100 | | Lowe’s Cos., Inc. | | October 2005 | | | 60.00 | | | 19,250 |
| 800 | | Lowe’s Cos., Inc. | | January 2006 | | | 60.00 | | | 240,000 |
| 560 | | Maxim Integrated Products, Inc. | | August 2005 | | | 40.00 | | | 40,600 |
| 419 | | MBNA Corp. | | December 2005 | | | 22.50 | | | 163,410 |
| 1,000 | | Merrill Lynch & Co., Inc. | | October 2005 | | | 55.00 | | | 247,500 |
| 600 | | MGIC Investment Corp. | | January 2006 | | | 65.00 | | | 264,000 |
| 300 | | MGIC Investment Corp. | | January 2006 | | | 70.00 | | | 63,750 |
| 600 | | Morgan Stanley Co. | | January 2006 | | | 55.00 | | | 156,000 |
| 750 | | Morgan Stanley Co. | | July 2005 | | | 60.00 | | | 3,750 |
| 990 | | Mylan Laboratories, Inc. | | July 2005 | | | 17.50 | | | 168,300 |
| 1,110 | | Mylan Laboratories, Inc. | | October 2005 | | | 17.50 | | | 260,850 |
| 2,300 | | Nasdaq-100 Index Tracking Stock | | December 2005 | | | 37.00 | | | 419,750 |
| 1,200 | | Pfizer, Inc. | | September 2005 | | | 25.00 | | | 357,000 |
| 244 | | Pfizer, Inc. | | September 2005 | | | 27.50 | | | 26,840 |
| 300 | | Symantec Corp. | | January 2006 | | | 20.00 | | | 100,500 |
| 1,100 | | Symantec Corp. | | July 2005 | | | 22.50 | | | 33,000 |
| 200 | | Symantec Corp. | | October 2005 | | | 22.50 | | | 28,500 |
| 1,100 | | Symantec Corp. | | January 2006 | | | 22.50 | | | 220,000 |
| 300 | | Target Corp. | | January 2006 | | | 50.00 | | | 201,000 |
| 1,000 | | Texas Instruments, Inc. | | July 2005 | | | 22.50 | | | 560,000 |
| 245 | | Tiffany & Co. | | January 2006 | | | 35.00 | | | 42,875 |
| 105 | | Tiffany & Co. | | November 2005 | | | 35.00 | | | 13,387 |
| 1,050 | | Xilinx, Inc. | | December 2005 | | | 27.50 | | | 147,000 |
| | | | | | | | | |
|
|
| | | Total Value of Call Options Written (Premiums received $15,406,354) | | | | | | | $ | 16,624,955 |
| | | | | | | | | |
|
|
| | | | |
| | | Put Option Written(a) | | | | | | | | |
| 1,498 | | Altera Corp. | | January 2006 | | $ | 17.50 | | $ | 119,840 |
| 57 | | Flextronics International Ltd. (Singapore) | | January 2006 | | | 10.00 | | | 1,140 |
| 2,600 | | Flextronics International Ltd. (Singapore) | | January 2006 | | | 12.50 | | | 195,000 |
| | | | | | | | | |
|
|
| | | Total Value of Put Options Written (Premium received $757,945) | | | | | | | $ | 315,980 |
| | | | | | | | | |
|
|
| | | Total Options Written (Premiums received $16,164,299) | | | | | | | $ | 16,940,935 |
| | | | | | | | | |
|
|
| (a) | Non-income producing security. |
See notes to financial statements.
9 | SemiAnnual Report | June 30, 2005
MCN | Madison/Claymore Covered Call Fund
Statement of Assets and Liabilities | June 30, 2005 (unaudited)
| | | | | | | |
Assets | | | | | | | |
Investments, at value (cost $261,038,266) | | $ | 265,137,413 | | | | |
Repurchase Agreement (cost $39,318,000) | | | 39,318,000 | | | | |
| | |
|
| | | | |
Total Investments (cost $300,356,266) | | | | | $ | 304,455,413 | |
Cash | | | | | | 492,177 | |
Receivable for investments sold | | | | | | 200,152 | |
Dividends and interest receivable | | | | | | 133,752 | |
Other assets | | | | | | 19,544 | |
| | | | | |
|
|
|
Total assets | | | | | | 305,301,038 | |
| | | | | |
|
|
|
| | |
Liabilities | | | | | | | |
Options written, at value (premiums received of $16,164,299) | | | | | | 16,940,935 | |
Payables: | | | | | | | |
Investments purchased | | | | | | 9,357,350 | |
Investment Advisory fee | | | | | | 113,852 | |
Investment Management fee | | | | | | 113,852 | |
Other affiliates | | | | | | 10,583 | |
Trustees’ fees | | | | | | 12,352 | |
Accrued expenses and other liabilities | | | | | | 45,932 | |
| | | | | |
|
|
|
Total liabilities | | | | | | 26,594,856 | |
| | | | | |
|
|
|
| | |
Net Assets | | | | | $ | 278,706,182 | |
| | | | | |
|
|
|
| | |
Composition of Net Assets | | | | | | | |
Common stock, $.01 par value per share; unlimited number of shares authorized, 18,708,963 shares issued and outstanding | | | | | $ | 187,090 | |
Additional paid-in capital | | | | | | 267,402,013 | |
Accumulated net realized gain on investments and options transactions | | | | | | 20,409,656 | |
Net unrealized appreciation on investments and options transactions | | | | | | 3,322,511 | |
Distributions in excess of net investment income (See note 2d) | | | | | | (12,615,088 | ) |
| | | | | |
|
|
|
| | |
Net Assets | | | | | $ | 278,706,182 | |
| | | | | |
|
|
|
| | |
Net Asset Value (based on 18,708,963 common shares outstanding) | | | | | $ | 14.90 | |
| | | | | |
|
|
|
See notes to financial statements.
10 | SemiAnnual Report | June 30, 2005
MCN | Madison/Claymore Covered Call Fund
Statement of Operations | For the six months ended June 30, 2005 (unaudited)
| | | | | | | |
Investment Income | | | | | | | |
Dividends (net of foreign withholding taxes of $2,157) | | $ | 868,323 | | | | |
Interest | | | 417,123 | | | | |
| | |
|
| | | | |
Total income | | | | | $ | 1,285,446 | |
| | | | | |
|
|
|
Expenses | | | | | | | |
Investment Advisory fee | | | 682,152 | | | | |
Investment Management fee | | | 682,152 | | | | |
Trustees’ fees and expenses | | | 80,580 | | | | |
Fund accounting | | | 34,725 | | | | |
Fund administration | | | 33,793 | | | | |
Custodian fee | | | 28,138 | | | | |
Transfer agent fee | | | 19,533 | | | | |
Legal fees | | | 16,685 | | | | |
NYSE listing fee | | | 14,549 | | | | |
Prepaid Insurance | | | 14,220 | | | | |
Printing expenses | | | 12,674 | | | | |
Audit fees | | | 12,535 | | | | |
Other | | | 17,754 | | | | |
Total expenses | | | | | | 1,649,490 | |
| | | | | |
|
|
|
Net investment loss | | | | | | (364,044 | ) |
| | | | | |
|
|
|
Realized and Unrealized Gain (Loss) on Investments Transactions | | | | | | | |
Net realized gain (loss) on: | | | | | | | |
Investments | | | | | | 1,623,447 | |
Options | | | | | | 18,204,363 | |
Net change in unrealized appreciation (depreciation) on: | | | | | | | |
Investments | | | | | | (21,367,749 | ) |
Options | | | | | | 9,680,728 | |
| | | | | |
|
|
|
Net realized and unrealized gain on investments and options transactions | | | | | | 8,140,789 | |
| | | | | |
|
|
|
Net Increase in Net Assets Resulting from Operations | | | | | $ | 7,776,745 | |
| | | | | |
|
|
|
See notes to financial statements.
SemiAnnual Report | June 30, 2005 | 11
MCN | Madison/Claymore Covered Call Fund
Statement of Changes in Net Assets |
| | | | | | | | |
| | | For the Six Months
Ended June 30, 2005 (unaudited)
| | | For the Period July 28, 2004* through December 31, 2004
| |
Increase in Net Assets Resulting from Operations | | | | | | | | |
Net investment loss | | $ | (364,044 | ) | | $ | (429,401 | ) |
Net realized gain on investments and options transactions | | | 19,827,810 | | | | 6,534,625 | |
Net unrealized appreciation (depreciation) on investments and options transactions | | | (11,687,021 | ) | | | 15,009,532 | |
| | |
|
|
| |
|
|
|
Net increase in net assets resulting from operations | | | 7,776,745 | | | | 21,114,756 | |
| | |
|
|
| |
|
|
|
Distributions to Shareholders | | | | | | | | |
In excess of net investment income | | | (12,251,044 | ) | | | (5,523,378 | ) |
| | |
|
|
| |
|
|
|
Capital Share Transactions | | | | | | | | |
Proceeds from the issuance of common shares | | | — | | | | 263,641,039 | |
Reinvestment of dividends | | | 2,890,711 | | | | 1,509,206 | |
Common share offering costs charged to paid-in-capital | | | — | | | | (552,128 | ) |
| | |
|
|
| |
|
|
|
Net increase from capital share transactions | | | 2,890,711 | | | | 264,598,117 | |
| | |
|
|
| |
|
|
|
Total increase in net assets | | | (1,583,588 | ) | | | 280,189,495 | |
| | |
Net Assets: | | | | | | | | |
Beginning of period | | | 280,289,770 | | | | 100,275 | |
| | |
|
|
| |
|
|
|
End of period (including distributions in excess of net investment income of ($12,615,088) and $0, respectively). | | $ | 278,706,182 | | | $ | 280,289,770 | |
| | |
|
|
| |
|
|
|
| * | Commencement of operations |
See notes to financial statements.
12 | SemiAnnual Report | June 30, 2005
MCN | Madison/Claymore Covered Call Fund
Financial Highlights |
| | | | | | | | |
| | | For the Six Months Ended June 30, 2005 (unaudited)
| | | For the Period July 28, 2004* through December 31, 2004
| |
Per share operating performance for one share outstanding throughout the period | | | | | | | | |
| | |
Net asset value, beginning of period | | $ | 15.14 | | | $ | 14.33 | (a) |
| | |
Investment operations | | | | | | | | |
Net investment loss(b) | | | (0.02 | ) | | | (0.02 | ) |
Net realized and unrealized gain on investments and options transactions | | | 0.44 | | | | 1.16 | |
| | |
|
|
| |
|
|
|
Total from investment operations | | | 0.42 | | | | 1.14 | |
| | |
|
|
| |
|
|
|
| | |
Distributions from net investment income | | | (0.66 | ) | | | (0.30 | ) |
| | |
|
|
| |
|
|
|
| | |
Offering expenses charged to paid-in-capital | | | — | | | | (0.03 | ) |
| | |
|
|
| |
|
|
|
| | |
Net asset value, end of period | | $ | 14.90 | | | $ | 15.14 | |
| | |
|
|
| |
|
|
|
| | |
Market value, end of period | | $ | 15.54 | | | $ | 14.90 | |
| | |
|
|
| |
|
|
|
| | |
Total investment return(c) | | | | | | | | |
Net asset value | | | 2.86 | % | | | 7.80 | % |
Market value | | | 9.00 | % | | | 1.35 | % |
| | |
Ratios and supplemental data | | | | | | | | |
Net assets end of period (thousands) | | $ | 278,706 | | | $ | 280,290 | |
Ratio of expenses to average net assets(d) | | | 1.21 | % | | | 1.24 | % |
Ratio of net investment income(loss) to average net assets(d) | | | (0.27 | )% | | | (0.36 | )% |
Portfolio turnover | | | 56 | % | | | 33 | % |
| * | Commencement of operations. |
| (a) | Before deduction of offering expenses charged to capital. |
| (b) | Based on average shares outstanding. |
| (c) | Total investment return is calculated assuming a purchase of a common share at the beginning of the period and a sale on the last day of the period reported either at net asset value (NAV) or market price per share. Dividends and distributions are assumed to be reinvested at NAV for returns at NAV or in accordance with the Fund’s dividend reinvestment plan for returns at market value. Total investment return does not reflect brokerage commissions. A return calculated for a period of less than one year is not annualized. |
See notes to financial statements.
| | |
| | | SemiAnnual Report | June 30, 2005 | 13 |
MCN | Madison/Claymore Covered Call Fund
Notes to Financial Statements | June 30, 2005 (unaudited)
Note 1 – Organization:
Madison/Claymore Covered Call Fund (the “Fund”) was organized as a Delaware statutory trust on May 6, 2004. The Fund is registered as a diversified, closed-end management investment company under the Investment Company Act of 1940.
The Fund’s primary investment objective is to provide a high level of current income and current gains, with a secondary objective of long-term capital appreciation. The Fund will pursue its investment objectives by investing in a portfolio consisting primarily of high quality, large capitalization common stocks that are, in the view of the Fund’s Investment Manager, selling at a reasonable price in relation to their long-term earnings growth rates. The Fund will, on an ongoing and consistent basis, sell covered call options to seek to generate a reasonably steady production of option premiums. There can be no assurance that the Fund will achieve its investment objectives. The Fund’s investment objectives are considered fundamental and may not be changed without shareholder approval.
Note 2 – Significant Accounting Policies:
The preparation of the financial statements in accordance with U.S. generally accepted accounting principles requires management to make estimates and assumptions that affect the reported amounts and disclosures in the financial statements. Actual results could differ from these estimates.
The following is a summary of significant accounting policies consistently followed by the Fund.
(a) Valuation of Investments
Readily marketable portfolio securities listed on an exchange or traded in the over-the-counter market are generally valued at their last reported sale price. If no sales are reported, the securities are valued at the mean of the closing bid and asked prices on such day. If no bid or asked prices are quoted on such day, then the security is valued by such method as the Fund’s Board of Trustees shall determine in good faith to reflect its fair value. Portfolio securities traded on more than one securities exchange are valued at the last sale price at the close of the exchange representing the principal market for such securities. Debt securities are valued at the last available bid price for such securities or, if such prices are not available, at the mean between the last bid and asked price. Exchange-traded options are valued at the mean of the best bid and best asked prices across all option exchanges.
Short-term debt securities having a remaining maturity of sixty days or less are valued at amortized cost, which approximates market value.
(b) Investment Transactions and Investment Income
Investment transactions are accounted for on the trade date. Realized gains and losses on investments are determined on the identified cost basis. Dividend income is recorded net of applicable withholding taxes on the ex-dividend date and interest income is recorded on an accrual basis. Discounts or premiums on debt securities purchased are accreted or amortized to interest income over the lives of the respective securities using the effective interest method.
The Fund may invest in repurchase agreements, which are short-term investments in which the Fund acquires ownership of a debt security and the seller agrees to repurchase the security at a future time and specified price. Repurchase agreements are fully collateralized by the underlying debt security. The Fund will make payment for such securities only upon physical delivery or evidence of book entry transfer to the account of the custodian bank. The seller is required to maintain the value of the underlying security at not less than the repurchase proceeds due the Fund.
(c) Options
The Fund will pursue its primary objective by employing an option strategy of writing (selling) covered call options on common stocks. The Fund seeks to produce a high level of current income and gains generated from option writing premiums and, to a lesser extent, from dividends.
An option on a security is a contract that gives the holder of the option, in return for a premium, the right to buy from (in the case of a call) or sell to (in the case of a put) the writer of the option the security underlying the option at a specified exercise or “strike” price. The writer of an option on a security has the obligation upon exercise of the option to deliver the underlying security upon payment of the exercise price (in the case of a call) or to pay the exercise price upon delivery of the underlying security (in the case of a put).
There are several risks associated with transactions in options on securities. As the writer of a covered call option, the Fund forgoes, during the option’s life, the opportunity to profit from increases in the market value of the security covering the call option above the sum of the premium and the strike price of the call but has retained the risk of loss should the price of the underlying security decline. The writer of an option has no control over the time when it may be required to fulfill its obligation as writer of the option. Once an option writer has received an exercise notice, it cannot effect a closing purchase transaction in order to terminate its obligation under the option and must deliver the underlying security at the exercise price.
(d) Distributions to Shareholders
The Fund declares and pays quarterly dividends to common shareholders. These dividends consist of investment company taxable income, which generally includes qualified dividend income, ordinary income, short-term capital gains and premiums received on written options. Realized short-term capital gains and premiums received on written options are considered ordinary income for tax purposes and will be reclassified at the Fund’s fiscal year end on the Fund’s Statement of Assets and Liabilities from Accumulated net realized gain to Distributions in excess of net investment income. Any net realized long-term gains are distributed annually to common shareholders.
Distributions to shareholders are recorded on the ex-dividend date. The amount and timing of distributions are determined in accordance with federal income tax regulations, which may differ from accounting principles generally accepted in the United States.
Note 3 – Investment Advisory Agreement, Investment Management Agreement and Other Transactions with Affiliates:
Pursuant to an Investment Advisory Agreement (the “Agreement”) between the Fund and Claymore Advisors, LLC (“the Adviser”), the Adviser will furnish offices, necessary facilities and equipment, provide administrative services, oversee the activities of Madison Asset Management LLC (the “Investment Manager”), provide personnel, including certain officers required for the Fund’s administrative management and compensate all officers and trustees
14 | SemiAnnual Report | June 30, 2005
MCN | Madison/Claymore Covered Call Fund | Notes to Financial Statements (unaudited) continued
of the Fund who are its affiliates. As compensation for these services, the Fund will pay the Investment Adviser a fee, payable monthly, in an amount equal to 0.50% of the Fund’s average daily managed assets (net assets plus any assets attributable to financial leverage).
Pursuant to an Investment Management Agreement between the Fund and the Investment Manager, the Investment Manager, under the supervision of the Fund’s Board of Trustees and the Adviser, will provide a continuous investment program for the Fund’s portfolio; provide investment research and make and execute recommendations for the purchase and sale of securities; and provide certain facilities and personnel, including officers required for the Fund’s administrative management and compensation of all officers and trustees of the Fund who are its affiliate. For these services, the Fund will pay the Investment Manager a fee, payable monthly, in an amount equal to 0.50% of the Funds average daily managed assets.
Under separate Fund Administration and Fund Accounting agreements, the Adviser provides fund administration services and the Investment Manager provides fund accounting services to the Fund. The Fund recognized expenses of approximately $33,800 and $34,700 respectively, for these services.
Certain officers and trustees of the Fund are also officers and directors of Claymore Securities Inc. or Madison Asset Management LLC. The Fund does not compensate its officers or trustees who are officers of the two aforementioned firms.
Note 4 – Federal Income Taxes:
The Fund intends to comply with the requirements of Subchapter M of the Internal Revenue Code of 1986, as amended, applicable to regulated investment companies. Accordingly, no provision for U.S. federal income taxes is required. In addition, by distributing substantially all of its ordinary income and long-term capital gains, if any, during each calendar year, the Fund intends not to be subject to U.S. federal excise tax.
Information on the components of investments, excluding written options as of June 30, 2005 is as follows:
| | | | | | | | | | | |
Cost of
Investments
| | Gross
Unrealized
Appreciation
| | Gross
Unrealized
Depreciation
| | | Net
Unrealized
Appreciation
|
| $ | 300,356,266 | | $ | 13,672,778 | | $ | (9,573,631 | ) | | $ | 4,099,147 |
For the period ended December 31, 2004, the tax character of distributions paid to common shareholders as reflected in the statement of changes in net assets was as follows:
| | | |
Distributions paid from:
| | 2004
|
Ordinary income | | $ | 5,523,378 |
Note 5 – Investment Transactions:
During the period, the cost of purchases and proceeds from sales of investments, excluding written options and short-term investments were $155,781,378 and $141,805,383 respectively.
Transactions in option contracts during the period ended June 30, 2005 were as follows:
| | | | | | | |
| | | Number of Contracts
| | | Premiums Received
| |
Options outstanding, beginning of period | | 69,483 | | | $ | 16,044,251 | |
Options written during the period | | 86,818 | | | | 18,919,361 | |
Options received from stock split | | 1,850 | | | | — | |
Options expired during the period | | (34,289 | ) | | | (6,574,655 | ) |
Options closed during the period | | (10,078 | ) | | | (2,459,998 | ) |
Options assigned during the period | | (43,594 | ) | | | (9,764,660 | ) |
| | |
|
| |
|
|
|
Options outstanding, end of period | | 70,190 | | | $ | 16,164,299 | |
| | |
|
| |
|
|
|
Note 6 – Capital:
Common Shares
In connection with its organizational process, the Fund sold 7,000 common shares of beneficial interest to Claymore Securities Inc., an affiliate of the Adviser, for consideration of $100,275. The Fund has an unlimited amount of common shares, $0.01 par value, authorized and issued 17,350,000 shares of common stock in its initial public offering. These shares were all issued at $14.325 per share after deducting the sales load but before a reimbursement of expenses to the underwriters of $0.005 per share. In connection with the initial public offering of the Fund’s common shares, the underwriters were granted an option to purchase additional common shares. On August 26, 2004 and September 14, 2004, the underwriters purchased, at a price of $14.325 per common share (after deducting the sales load but before underwriter’s expense reimbursement) 1,000,000 and 54,261 common shares, respectively, of the Fund pursuant to the over-allotment option.
Offering costs, estimated at $552,128 or $0.03 per share, in connection with the issuance of the common shares have been borne by the Fund and were charged to paid-in-capital. The Advisor has agreed to reimburse the Fund’s organizational expenses, which are estimated at $25,000.
Transactions in common shares were as follows:
| | | | |
| | | Six Months
June 30, 2005
| | Period Ended
December 31, 2004
|
Beginning Shares | | 18,513,442 | | 7,000 |
Issuance of common shares | | — | | 18,404,261 |
Shares issued through dividend reinvestment | | 195,521 | | 102,181 |
| | |
| |
|
Ending Shares | | 18,708,963 | | 18,513,442 |
| | |
| |
|
Note 7 – Indemnifications:
In the normal course of business, the Fund enters into contracts that provide general indemnifications. The Fund’s maximum exposure under these arrangements is dependent upon claims that may be made against the Fund in the future, and, therefore cannot be estimated; however, the risk of material loss from such claims is considered remote.
Note 8 – Subsequent Event:
On August 1, 2005, the Board of Trustees declared a quarterly dividend of $0.33 per common share. This dividend is payable August 31, 2005 to share holders of record on August 15, 2005.
SemiAnnual Report | June 30, 2005 | 15
MCN | Madison/Claymore Covered Call Fund
Supplemental Information | (unaudited)
Trustees
The Trustees of the Madison/Claymore Covered Call Fund and their principal occupations during the past five years:
| | | | | | | | |
Name, Address*, Year of Birth and Position(s)
Held with Registrant
| | Term of Office**
and Length of
Time Served
| | Principal Occupation During the Past Five Years and Other Affiliations
| | Portfolios In The
Fund Complex***
Overseen by Trustee
| | Other Directorships Held by Trustee
|
| Independent Trustees: | | | | | | | | |
| | | | |
Randall C. Barnes Year of Birth: 1952 Trustee | | Since 2004 | | Formerly, Senior Vice President, Treasurer (1993-1997), President, Pizza Hut International (1991-1993) and Senior Vice President, Strategic Planning and New Business Development (1987-1990) of PepsiCo, Inc. (1987-1997). | | 3 | | None. |
| | | | |
Philip E. Blake Year of Birth: 1944 1 South Pinckney Street Suite 501 Madison, WI 53703 Trustee | | Since 2004 | | Managing Partner of Forecastle Inc. (2000-present). Formerly, President and CEO of Madison Newspapers Inc. (1993-2000) and Vice President, Publishing, Lee Enterprises (1998-2001). | | 1 | | Director, Madison Newspapers, Inc., Forecastle, Inc, and Nemtes Inc. Trustee, the Mosaic family of mutual funds and Madison Strategic Sector Premium Fund. |
| | | | |
James R. Imhoff, Jr. Year of Birth: 1944 5250 East Terrace Drive Madison, WI 53718 Trustee | | Since 2004 | | Chairman and CEO of First Weber Group. | | 1 | | Director, Park Bank. Trustee, the Mosaic family of mutual funds and Madison Strategic Sector Premium Fund. |
| | | | |
Ronald A. Nyberg Year of Birth: 1953 Trustee | | Since 2004 | | Principal of Ronald A. Nyberg, Ltd., a law firm specializing in corporate law, estate planning and business transactions (2000-present). Formerly, Executive Vice President, General Counsel and Corporate Secretary of Van Kampen Investments (1982-1999). | | 10 | | None. |
| | | | |
Ronald E. Toupin, Jr. Year of Birth: 1958 Trustee | | Since 2004 | | Formerly, Vice President, Manager and Portfolio Manager of Nuveen Asset Management (1998-1999), Vice President of Nuveen Investment Advisory Corporation (1992-1999), Vice President and Manager of Nuveen Unit Investment Trusts (1991-1999), and Assistant Vice President and Portfolio Manager of Nuveen Unit Investment Trusts (1988-1999), each of John Nuveen & Company, Inc. (1982-1999). | | 9 | | None. |
| | | | |
Lorence Wheeler Year of Birth: 1938 135 County Road Tabernash, CO 80478 Trustee | | Since 2004 | | Formerly, President of Credit Union Benefits Services, Inc. and Pension Specialist for CUNA Mutual Group. | | 1 | | Trustee, the Mosaic family of mutual funds and Madison Strategic Sector Premium Fund. |
| | | | |
| Interested Trustees: | | | | | | | | |
| | | | |
Frank E. Burgess† Year of Birth: 1942 550 Science Drive Madison, WI 53711 Trustee and Senior Vice President | | Since 2004 | | Founder, President and CEO of Madison Investment Advisors, Inc. (1974-present) and Madison Asset Management, LLC | | 1 | | Director, Capital Bankshares, Inc. and Outrider Foundation, Inc. Trustee, the Mosaic family of mutual funds and Madison Strategic Sector Premium Fund. |
| | | | |
Nicholas Dalmaso†† Year of Birth: 1965 Trustee; Chief Legal and Executive Officer; Chief Compliance Officer | | Since 2004 | | Senior Managing Director and General Counsel of Claymore Advisors, LLC and Claymore Securities, Inc. (2001-present). Formerly, Assistant General Counsel, John Nuveen and Company, Inc. (1999-2000). Former Vice President and Associate General Counsel of Van Kampen Investments, Inc. (1992-1999). | | 10 | | None. |
| * | Address for all Trustees, unless otherwise noted: 2455 Corporate West Drive, Lisle, IL 60532 |
| ** | After a Trustee’s initial term, each Trustee is expected to serve a three-year term concurrent with the class of Trustees for which he serves: |
| | • | | Messrs. Barnes and Burgess, as Class I Trustees, are expected to stand for re-election at the Fund’s 2005 annual meeting of shareholders. |
| | • | | Messrs. Blake, Dalmaso and Imhoff, as Class II Trustees, are expected to stand for re-election at the Fund’s 2006 annual meeting of shareholders. |
| | • | | Messrs. Nyberg, Toupin and Wheeler, as Class III Trustees, are expected to stand for re-election at the Fund’s 2007 annual meeting of shareholders. |
| *** | The Claymore Fund Complex consists of U.S. registered investment companies advised or serviced by Claymore Advisors, LLC or Claymore Securities, Inc. |
| † | Mr. Burgess is an “interested person” (as defined in section 2(a) (19)) of the Fund because of his position as an officer of Madison Asset Management, LLC, the Fund’s Investment Manager. |
| †† | Mr. Dalmaso is an “interested person” (as defined in section 2(a) (19)) of the Fund because of his position as an officer of Claymore Advisors, LLC, the Fund’s Investment Adviser. |
16 | SemiAnnual Report | June 30, 2005
MCN | Madison/Claymore Covered Call Fund | Supplemental Information (unaudited) continued
Officers:
The Officers of the Madison/Claymore Covered Call Fund and their principal occupations during the past five years:
| | | | |
Name, Address*, Year of Birth and Position(s)
Held with Registrant
| | Term of Office **
and Length of
Time Served
| | Principal Occupation During the Past Five Years and Other Affiliations
|
| Officers | | | | |
| | |
Steven M. Hill Year of Birth: 1964 Chief Financial Officer, Chief Accounting Officer and Treasurer | | Since 2004 | | Senior Managing Director of Claymore Advisors, LLC and Claymore Securities, Inc. (2003-present) and Chief Financial Officer (2005-present). Previously, Treasurer of Henderson Global Funds and Operations Manager for Henderson Global Investors (North America) Inc., from 2002-2003; Managing Director, FrontPoint Partners LLC (2001-2002); Vice President, Nuveen Investments (1999-2001); Chief Financial Officer, Skyline Asset Management LP, (1999); Vice President, Van Kampen Investments and Assistant Treasurer, Van Kampen mutual funds (1989-1999). |
| | |
Heidemarie Gregoriev Year of Birth: 1971 Secretary | | Since 2004 | | Vice President and Assistant General Counsel, Claymore Advisors, LLC and Claymore Securities, Inc. since 2004; Legal Counsel, Henderson Global Investors (North America) Inc. and Assistant Secretary (2001-2004) and Chief Legal Officer (2003-2004) of Henderson Global Funds; Attorney, Gardner, Carton & Douglas LLP (1997-2001) |
| | |
Jay Sekelsky 550 Science Drive Madison, WI 53711 Year of Birth: 1959 Vice President | | Since 2004 | | Managing Director of Madison Investment Advisors, Inc.; Vice President of Madison Asset Management, LLC; Vice President of Funds in the Mosaic family of funds and of Madison Strategic Sector Premium Fund. |
| | |
Kay Frank 550 Science Drive Madison, WI 53711 Year of Birth: 1960 Vice President | | Since 2004 | | Managing Director of Madison Investment Advisors, Inc.; Vice President of Madison Asset Management, LLC; President of Funds in the Mosaic family of funds and President of Madison Strategic Sector Premium Fund. |
| | |
Rita Bauer 550 Science Drive Madison, WI 53711 Year of Birth: 1959 Vice President | | Since 2004 | | Vice President of Madison Investment Advisors, Inc.; Vice President of Madison Asset Management, LLC. |
| | |
Ray DiBernardo 550 Science Drive Madison, WI 53711 Year of Birth: 1962 Vice President | | Since 2004 | | Vice President of Madison Investment Advisors, Inc. and of Madison Strategic Sector Premium Fund. Previously, Vice President and Portfolio Manager, Concord Investment Company. |
| | |
Deborah Pines 550 Science Drive Madison, WI 53711 Year of Birth: 1973 Vice President | | Since 2004 | | Director of Closed-End Funds of Madison Investment Advisors, Inc. Previously, Senior Investigator, Chicago Board of Trade. |
| | |
Richard Sarhaddi Year of Birth: 1973 Assistant Secretary | | Since 2004 | | Assistant Vice President of Claymore Advisors, LLC and Claymore Securities, Inc. Previously, Editor, CCH Incorporated. |
| * | Address for all Officers unless otherwise noted: 2455 Corporate West Drive, Lisle, IL 60532 |
| ** | Officers serve at the pleasure of the Board of Trustees and until his or her successor is appointed and qualified or until his or her resignation or removal. |
SemiAnnual Report | June 30, 2005 | 17
MCN | Madison/Claymore Covered Call Fund
Dividend Reinvestment Plan | (unaudited)
Unless the registered owner of common shares elects to receive cash by contacting the Plan Administrator, all dividends declared on common shares of the Fund will be automatically reinvested by the Bank of New York (the “Plan Administrator”), Administrator for shareholders in the Fund’s Dividend Reinvestment Plan (the “Plan”), in additional common shares of the Fund. Participation in the Plan is completely voluntary and may be terminated or resumed at any time without penalty by notice if received and processed by the Plan Administrator prior to the dividend record date; otherwise such termination or resumption will be effective with respect to any subsequently declared dividend or other distribution. Some brokers may automatically elect to receive cash on your behalf and may re-invest that cash in additional common shares of the Fund for you. If you wish for all dividends declared on your common shares of the Fund to be automatically reinvested pursuant to the Plan, please contact your broker.
The Plan Administrator will open an account for each common shareholder under the Plan in the same name in which such common shareholder’s common shares are registered. Whenever the Fund declares a dividend or other distribution (together, a “Dividend”) payable in cash, non-participants in the Plan will receive cash and participants in the Plan will receive the equivalent in common shares. The common shares will be acquired by the Plan Administrator for the participants’ accounts, depending upon the circumstances described below, either (i) through receipt of additional unissued but authorized common shares from the Fund (“Newly Issued Common Shares”) or (ii) by purchase of outstanding common shares on the open market (“Open-Market Purchases”) on the New York Stock Exchange or elsewhere. If, on the payment date for any Dividend, the closing market price plus estimated brokerage commission per common share is equal to or greater than the net asset value per common share, the Plan Administrator will invest the Dividend amount in Newly Issued Common Shares on behalf of the participants. The number of Newly Issued Common Shares to be credited to each participant’s account will be determined by dividing the dollar amount of the Dividend by the net asset value per common share on the payment date; provided that, if the net asset value is less than or equal to 95% of the closing market value on the payment date, the dollar amount of the Dividend will be divided by 95% of the closing market price per common share on the payment date. If, on the payment date for any Dividend, the net asset value per common share is greater than the closing market value plus estimated brokerage commission, the Plan Administrator will invest the Dividend amount in common shares acquired on behalf of the participants in Open-Market Purchases.
If, before the Plan Administrator has completed its Open-Market Purchases, the market price per common share exceeds the net asset value per common share, the average per common share purchase price paid by the Plan Administrator may exceed the net asset value of the common shares, resulting in the acquisition of fewer common shares than if the Dividend had been paid in Newly Issued Common Shares on the Dividend payment date. Because of the foregoing difficulty with respect to Open-Market Purchases, the Plan provides that if the Plan Administrator is unable to invest the full Dividend amount in Open-Market Purchases during the purchase period or if the market discount shifts to a market premium during the purchase period, the Plan Administrator may cease making Open-Market Purchases and may invest the uninvested portion of the Dividend amount in Newly Issued Common Shares at net asset value per common share at the close of business on the Last Purchase Date provided that, if the net asset value is less than or equal to 95% of the then current market price per common share; the dollar amount of the Dividend will be divided by 95% of the market price on the payment date.
The Plan Administrator maintains all shareholders’ accounts in the Plan and furnishes written confirmation of all transactions in the accounts, including information needed by shareholders for tax records. Common shares in the account of each Plan participant will be held by the Plan Administrator on behalf of the Plan participant, and each shareholder proxy will include those shares purchased or received pursuant to the Plan. The Plan Administrator will forward all proxy solicitation materials to participants and vote proxies for shares held under the Plan in accordance with the instruction of the participants.
There will be no brokerage charges with respect to common shares issued directly by the Fund. However, each participant will pay a pro rata share of brokerage commission incurred in connection with Open-Market Purchases. The automatic reinvestment of Dividends will not relieve participants of any Federal, state or local income tax that may be payable (or required to be withheld) on such Dividends.
The Fund reserves the right to amend or terminate the Plan. There is no direct service charge to participants with regard to purchases in the Plan; however, the Fund reserves the right to amend the Plan to include a service charge payable by the participants.
All correspondence or questions concerning the Plan should be directed to the Plan Administrator, The Bank of New York, 2 Hanson Place, Brooklyn, New York, 11217, Attention: Irina Krylov, Phone Number: (718) 315-4818.
18 | SemiAnnual Report | June 30, 2005
MCN | Madison/Claymore Covered Call Fund
Fund Information |
| | | | |
| Board of Trustees | | Officers | | Investment Manager |
| Randall C. Barnes | | Nicholas Dalmaso | | Madison Asset Management, LLC |
| | | Chief Executive and Legal Officer | | 550 Science Drive |
| Philip E. Blake | | | | Madison, WI 53711 |
| Frank Burgess* | | Steven M. Hill | | |
| | | Chief Financial Officer and Treasurer | | Investment Adviser |
| | | | | Claymore Advisors, LLC |
| Nicholas Dalmaso* | | Heidemarie Gregoriev Secretary | | 2455 Corporate West Drive Lisle, IL 60532 |
| James Imhoff, Jr. | | | | |
| | | | | |
| Ronald A. Nyberg | | Frank Burgess Senior Vice President | | Administrator Claymore Advisors, LLC 2455 Corporate West Drive Lisle, IL 60532 |
| Ronald E. Toupin, Jr. | | | | |
| Lorence Wheeler | | Jay Sekelsky Vice President | | |
| | |
| | | Kay Frank Vice President | | Custodian and Transfer Agent The Bank of New York New York, New York |
| | |
| | | Rita Bauer Vice President | | Legal Counsel Skadden, Arps, Slate, Meagher & Flom LLP Chicago, Illinois |
| | | | |
| | | Ray DiBernardo | |
| | | Vice President | |
| | |
| | | Deborah Pines | | Independent Registered |
| | | Vice President | | Public Accounting Firm |
| | | | | Ernst & Young LLP |
| | | Richard C. Sarhaddi | | Chicago, Illinois |
| | | Assistant Secretary | | |
| * | Trustee is an “interested person” of the Fund as defined in the Investment Company Act of 1940, as amended. |
Privacy Principles of Madison/Claymore Covered Call Fund for Shareholders
The Fund is committed to maintaining the privacy of shareholders and to safeguarding its non-public information. The following information is provided to help you understand what personal information the Fund collects, how we protect that information and why, in certain cases, we may share information with select other parties.
Generally, the Fund does not receive any nonpublic personal information relating to its shareholders, although certain nonpublic personal information of its shareholders may become available to the Fund. The Fund does not disclose any nonpublic personal information about its shareholders or former shareholders to anyone, except as permitted by law or as is necessary in order to service shareholder accounts (for example, to a transfer agent or third party administrator).
The Fund restricts access to nonpublic personal information about the shareholders to Claymore Advisors, LLC employees with a legitimate business need for the information. The Fund maintains physical, electronic and procedural safeguards designed to protect the nonpublic personal information of its shareholders.
Question concerning your shares of Madison/Claymore Covered Call Fund?
| • | | If your shares are held in a Brokerage Account, contact your Broker |
| • | | If you have physical possession of your shares in certificate form, contact the Fund’s Custodian and Transfer Agent: |
The Bank of New York, 101 Barclay Street, New York, New York 10286 1-800-701-8178
This report is sent to shareholders of Madison/Claymore Covered Call Fund for their information. It is not a Prospectus, circular or representation intended for use in the purchase or sale of shares of the Fund or of any securities mentioned in this report
A description of the Fund’s proxy voting policies and procedures related to portfolio securities is available without charge, upon request, by calling the Fund at 1-800-345-7999 or on the U.S. Securities and Exchange Commission’s website at http://www.sec.gov
Information regarding how the Fund voted proxies for portfolio securities, if applicable, during the most recent 12-month period ended June 30, will be available beginning in August 2005 without charge and upon request by calling the Fund at (800) 345-7999 or by accessing the Fund’s Form N-PX on the Commission’s website at http://www.sec.gov.
The Fund files its complete schedule of portfolio holdings with the Securities and Exchange Commission for the first and third quarters of each fiscal year on Form N-Q. The Fund’s Form N-Q is available on the SEC website at http://www.sec.gov. The Fund’s Form N-Q may also be reviewed and copied at the Commission’s Public Reference Room in Washington, DC; information on the operation of the Public Reference Room may be obtained by calling (800) SEC-0330.
19 | SemiAnnual Report | June 30, 2005
MCN | Madison/Claymore Covered Call Fund
About the Fund Manager |
Madison Investment Advisors, Inc.
Madison Asset Management, LLC, (MAM) a wholly-owned subsidiary of Madison Investment Advisors, Inc., with its affiliates, manages over $11.1 billion in individual, corporate, pension, insurance, endowment and mutual fund assets.
Investment Philosophy
Madison believes in investing in high-quality growth companies, which deliver potentially consistent and sustainable earnings growth, yet sell at attractive valuations. Historically, shareholders of these types of companies have been rewarded over the long term with above-average returns, and favorable risk characteristics. Constructing portfolios with positive risk/reward profiles has historically allowed clients to participate during strong market environments, while mitigating potential declines.
Investment Process
The managers employ a fundamental, bottom-up strategy in constructing equity portfolios. The managers look for companies that they believe are consistently growing at an above-average pace, yet sell at below-average multiple.
The managers follow a rigorous three-step process when evaluating companies and then employ an actively-managed option strategy to help enhance income and mitigate downside risk.
| 1. | Business model. The managers look for a sustainable competitive advantage, cash flow that is both predictable and growing, as well as a rock-solid balance sheet. |
| 2. | Management. When assessing management, the managers look to see how the company has allocated capital in the past, their track record for enhancing shareholder value and the nature of their accounting practices. |
| 3. | Proper valuation. The final step in the process is assessing the proper valuation for the company. The managers strive to purchase securities trading at a discount to their intrinsic value as determined by discounted cash flows. They corroborate this valuation work with additional valuation methodologies. |
The covered call investment strategy focuses on stocks in which the managers have high confidence in their continuing earnings growth rates, but sell at reasonable Price-Earnings Ratios. By writing the majority of the Fund’s calls out-of-the-money, meaning the strike price is higher than the stock price, the Fund can participate in some stock appreciation while still receiving income in the form of option premiums. The covered call strategy also tends to reduce the risk compared to just owning the stock.
| | |
Claymore Securities Inc. 2455 Corporate West Drive, Lisle, IL 60532 | |  |
Not applicable for a semi-annual reporting period.
| Item 3. | Audit Committee Financial Expert. |
Not applicable for a semi-annual reporting period.
| Item 4. | Principal Accountant Fees and Services. |
Not applicable for a semi-annual reporting period.
| Item 5. | Audit Committee of Listed Registrants. |
Not applicable for a semi-annual reporting period.
| Item 6. | Schedule of Investments. |
The Schedule of Investments is included as part of Item 1.
| Item 7. | Disclosure of Proxy Voting Policies and Procedures for Closed-End Management Investment Companies. |
Not applicable for a semi-annual reporting period.
| Item 8. | Portfolio Managers of Closed-End Management Investment Companies. |
Not applicable.
| Item 9. | Purchases of Equity Securities by Closed-End Management Investment Company and Affiliated Purchasers. |
None.
| Item 10. | Submission of Matters to a Vote of Security Holders. |
The registrant has not made any material changes to the procedures by which shareholders may recommend nominees to the registrant’s Board of Trustees.
| Item 11. | Controls and Procedures. |
(a) The registrant’s principal executive officer and principal financial officer have evaluated the registrant’s disclosure controls and procedures within 90 days of this filing and have concluded based on such evaluation, that the registrant’s disclosure controls and procedures were effective, as of that date, in ensuring that information required to be disclosed by the registrant in this Form N-CSR was recorded, processed, summarized, and reported within the time periods specified in the Securities and Exchange Commission’s rules and forms.
(b) There were no changes in the registrant’s internal control over financial reporting (as defined in Rule 30a-3(d) under the Investment Company Act of 1940) that occurred during the registrant’s last fiscal quarter that have materially affected, or are reasonably likely to materially affect, the registrant’s internal control over financial reporting.
| | |
| (a)(1) | | Not applicable. |
| |
| (a)(2) | | Certification of principal executive officer and principal financial officer pursuant to Rule30a-2. |
| |
| (b) | | Certification of principal executive officer and principal financial officer pursuant to Section 906 of the Sarbanes-Oxley Act of 2002. |
SIGNATURES
Pursuant to the requirements of the Securities Exchange Act of 1934 and the Investment Company Act of 1940, the registrant has duly caused this report to be signed on its behalf by the undersigned, thereunto duly authorized.
| | |
(Registrant) Madison / Claymore Covered Call Fund |
| |
By: | | /s/ Nicholas Dalmaso |
Name: | | Nicholas Dalmaso |
Title: | | Chief Legal and Executive Officer |
Date: | | August 26, 2005 |
Pursuant to the requirements of the Securities Exchange Act of 1934 and the Investment Company Act of 1940, this report has been signed by the following persons on behalf of the registrant and in the capacities and on the dates indicated.
| | |
| |
By: | | /s/ Nicholas Dalmaso |
Name: | | Nicholas Dalmaso |
Title: | | Chief Legal and Executive Officer |
Date: | | August 26, 2005 |
| | |
| |
By: | | /s/ Steven M. Hill |
Name: | | Steven M. Hill |
Title: | | Treasurer and Chief Financial Officer |
Date: | | August 26, 2005 |