OMB APPROVAL
OMB Number: 3235-0570
Expires: July 31, 2022
Estimated average burden hours per response...20.3
UNITED STATES SECURITIES AND EXCHANGE COMMISSION
Washington, DC 20549
FORM N-CSR
CERTIFIED SHAREHOLDER REPORT OF REGISTERED
MANAGEMENT INVESTMENT COMPANIES
Investment Company Act file number 811-21582
Madison Covered Call & Equity Strategy Fund
(Exact name of registrant as specified in charter)
550 Science Drive, Madison, WI 53711
(Address of principal executive offices)(Zip code)
Steven J. Fredricks
Madison Legal and Compliance Department
550 Science Drive
Madison, WI 53711
(Name and address of agent for service)
Registrant's telephone number, including area code: 608-274-0300
Date of fiscal year end: December 31
Date of reporting period: December 31, 2022
Form N-CSR is to be used by management investment companies to file reports with the Commission not later than 10 days after the transmission to stockholders of any report that is required to be transmitted to stockholders under Rule 30e-1 under the Investment Company Act of 1940 (17 CFR 270.30e-1). The Commission may use the information provided on Form N-CSR in its regulatory, disclosure review, inspection, and policymaking roles.
A registrant is required to disclose the information specified by Form N-CSR, and the Commission will make this information public. A registrant is not required to respond to the collection of information contained in Form N-CSR unless the Form displays a currently valid Office of Management and Budget ("OMB") control number. Please direct comments concerning the accuracy of the information collection burden estimate and any suggestions for reducing the burden to Secretary, Securities and Exchange Commission, 450 Fifth Street, NW, Washington, DC 20549-0609. The OMB has reviewed this collection of information under the clearance requirements of 44 U.S.C. s 3507.
Item 1. Report to Shareholders.

| | MADISON COVERED CALL & EQUITY STRATEGY FUND (MCN) |
| | |
| | Active Equity Management combined |
| | with a Covered Call Option Strategy |
MCN | Madison Covered Call & Equity Strategy Fund | December 31, 2022
Table of Contents
MCN | Madison Covered Call & Equity Strategy Fund | Management’s Discussion of Fund Performance - continued | December 31, 2022
Management’s Discussion of Fund Performance (unaudited)
Covered Call strategies, by their nature, are defensive. They are structured to knowingly sacrifice a portion of upside growth potential in order to provide additional downside protection. The Madison Covered Call & Equity Strategy Fund pursues these strategies by owning a very high quality portfolio of individual equities and selling equity call options on the portfolio holdings. The Fund provides a total return platform which seeks capital appreciation and a high distribution rate which is primarily sourced from selling call options and realizing capital gains on the underlying portfolio. It is a relatively concentrated, actively managed portfolio providing a defensive way to participate in U.S. equity markets.
Port in a Storm
By most measures, 2022 was an extremely stormy year for investors. U.S. stocks were hammered to the tune of -18.1% on the S&P 500© index while the technology-laden NASDAQ Composite Index fell 32%. Bonds were not much better with the return on the U.S. 10 year Treasury coming in at -16.5%, its worst return in almost a century. As a result, a 60/40 portfolio (S&P 500/ 10-year Treasury) carded a -17.5% return, worst since 1931. It wasn’t pretty and there were very few places to hide. We are extremely proud to have been one of those few ports in the storm. The Madison Covered Call & Equity Strategy Fund not only offered protection but gained ground on both a net asset value (NAV) basis and market value basis.
Overall, areas of relative strength were few and far between in 2022. Most agricultural commodities were higher during the year. Many industrial metals were also higher, although copper and aluminum fell sharply in the second half as China aggressively shut down on Covid concerns. Gold was flat while the U.S. dollar was a beacon of strength, rising 8% against a basket of major currencies. Oil (WTI) was up 7% but swung wildly, starting the year at $75 per barrel, rising above $123 following the Russian invasion of Ukraine and then settling back to $80 at end the year. Within the S&P 500, the Energy sector was the star, rising 65% while the only other positive sector was Utilities, up 1.6%. The Technology, Consumer Discretionary and Communication Services sectors fell 28.2%, 37% and 39.9%, respectively. These lagging sectors typified the weakness of the prior leaders, mega-cap growth stocks. The NYSE Fang+ Index which houses these titans fell 40%. Also, several bubbles deflated in 2022 including money supply growth, crypto currencies, SPACs and used car prices with more likely to come in 2023.
The focus in 2022 for investors was rising inflation and rising interest rates. The X factor is whether the Fed can combat inflation by raising rates without plunging the economy into a deep recession. During the year, the Fed raised rates 7 times, moving the rate on reserve balances from 0.1% to 4.4% … the most aggressive move since the early 1980’s. The average 30-year fixed mortgage rate rose above 7% for the 1st time in over 20 years before retreating at year end to 6.4%. Housing affordability is at record lows and if mortgage rates remain elevated, house prices are likely to correct. The yield on the 10-year treasury bond rose from 1.5% to 3.9% and was a catalyst for significant price to earnings multiple contraction throughout the year in equity markets.
Back in 2021, the S&P 500’s top performing sector was Energy with a 54.4% return in a very robust overall market. In 2022, with the market in decline, the Energy sector led again with an even higher return. The performance differential between Energy and the worst performing sector, Communication Services which includes Alphabet, Meta (Facebook), Disney, Verizon etc, was an astounding 105%. We have been over-weighted in the Energy sector for many years and did suffer when large cap growth companies led the market. However, our patience has been rewarded over the past two years. Our view has not wavered. Demand for petroleum products will continue to grow even if we have a recession unless it is a very severe one. Supply growth will remain curtailed globally as companies maintain capital discipline and fewer meaningful discoveries occur. The industry has suffered from
MCN | Madison Covered Call & Equity Strategy Fund | Management’s Discussion of Fund Performance - continued | December 31, 2022
underinvestment for many years and will struggle to meet continued global demand growth. Companies within the sector exhibit many of the qualities that we like such as high free cashflow generation, strong balance sheets, increasing dividends and stock buybacks. Even if oil prices don’t move higher, companies are extremely profitable in the current environment and barring a very deep recession or another Covid-like experience which eliminated demand, prices, while volatile, are more likely to rise than fall.
Cumulative Performance of $10,000 Investment
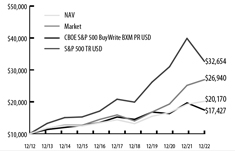
| Average Annual Total Return (%) through December 31, 2022* |
| | | 1 yr | | | 5 yr | | | 10 yr | |
| NAV | | | 4.90 | % | | | 7.00 | % | | | 7.27 | % |
| Market | | | 7.12 | % | | | 11.14 | % | | | 10.42 | % |
| S&P 500 TR USD | | | -18.11 | % | | | 9.42 | % | | | 12.56 | % |
| CBOE S&P 500 BuyWrite BXM PR USD | | | -11.37 | % | | | 2.73 | % | | | 5.71 | % |
| *The graph and table do not reflect the deduction of taxes that a shareholder would pay on fund distributions or the sale of fund shares. Past performance is not predictive of future results. |
Corporate earnings continue to remain on thin ice. The massive money supply growth post-Covid ramped up inflation which showed up in corporate revenue growth and companies with good operating leverage succeeded in growing earnings impressively. We are now on the other side of that phenomenon with money supply growth that has shrunk in record fashion. Corporate revenue growth is now faltering and with inflation remaining sticky, profit margins are getting hit. Cost cutting efforts are now in full swing as we see large layoff announcements on an almost daily basis. In our estimation, S&P 500 earnings estimates are still too high despite trending lower in the 2nd half of the year. Over the coming quarters, we should get more clarity on the potential depth of a coming recession. For over a year, our view has been that we are at risk of a significant earnings decline and recession and now that view has become the consensus view. That concerns us as we are never very comfortable being part of the consensus. A comforting factor is that when we took this stance, the consensus wasn’t with us. Now it appears that where the consensus is likely to be wrong is in its underestimation of the depth of a recession. As such, we lean to continue to be very defensive and watch our energy exposure very closely.
We believe that remaining in port is still the most comfortable place to be. The storm hasn’t fully passed on …. we may not have even seen the worst of it yet.
How did the Fund perform given the marketplace conditions during 2022?
With most of the market decline occurring in the first half of the year, the second half performance was flattish but notably volatile, rising on hopes of a Federal Reserve pivot and falling as those hopes waned. In the 4th quarter, the market rallied early but sold off in December. The Fund outperformed the S&P 500 and the CBOE S&P 500 Buy-Write Index (BXM) in each quarter. Over the full year, the Fund NAV gained 4. 90% and on a stock price basis, the Fund rose 7.12% compared to the S&P 500’s -18.1% decline and the BXM’s -11.4% fall. The market declined immediately after the year began and continued lower through the first half of the year with only a minor attempt at recovering in late March. Over this period, the Fund consistently outperformed as the market moved lower. Through the July to mid-August period, the market attempted to rebound on hopes that the Federal Reserve would pivot from its rate hiking and quantitative tightening stance, thus potentially fueling a new bull market. During this short market bounce, the Fund underperformed. Once it became evident that the Fed was steadfast in its inflation fighting stance, the market resumed its downturn and the Fund returned to outperforming. The fourth quarter of the year began with a strong rally in October which lasted through mid-December but unlike a similar
MCN | Madison Covered Call & Equity Strategy Fund | Management’s Discussion of Fund Performance - continued | December 31, 2022
year-end rally in 2021 which was dominated by mega cap growth stocks, this rally was led by cyclical companies including those in the Energy sector. Mega cap growth stocks continued to lag despite the strong move upward in the overall market. As the Fund has been underweighted in the mega cap area, it was able to strongly outperform the S&P 500™ despite its upward momentum.
Over the full year, stock selection was the primary driver of the Fund’s excellent returns while sector allocation was also positive. The Fund’s cash allocation and call option coverage were also very additive to returns given the downward trend of the market. The Fund came into the year with a tilt toward cyclical and commodity-based companies and less exposure to the higher flying and expensive Technology and Communication Services sectors. This gave the Fund a decidedly value oriented tilt which benefited from the very strong outperformance of value stocks relative to growth stocks. We expect this trend to continue into 2023 but we are prepared to move to a more balanced approach once the market environment allows. The Fund remained very defensively postured throughout the year with high call option coverage and elevated cash levels. Cash acts as an added downward hedge and is redeployed on an opportunistic basis.
As noted above, stock selection over the full year was a very strong positive contributor to overall performance. Over the full period, 54% of the Fund’s holdings managed positive returns in a severely down-trending market. Clearly, with the Energy sector up over 60%, the Fund enjoyed very strong results from its individual energy holdings led by Apache, Transocean, EOG Resources and Range Resources. However, despite the weakness in the overall market, many non-energy companies also contributed strongly. Among the larger contributors were T-Mobile, Las Vegas Sands, Archer Daniels and Midland, Air Products and Chemicals and utility companies. Weaker performers included Medtronic, PayPal, CME Group, and Newmont Mining.
Sector allocation was accretive to performance relative to the S&P 500. The most significant positive was our continued overweighting of the Energy sector which remains a favored area given the strong fundamentals of the commodity and the historically strong fundamentals of many of the companies within the sector. Underweighting the Consumer Discretionary sector was also a positive contributor as the sector declined 37% during the year. The Fund was underweighted in defensive sectors such as Consumer Staples and Health Care as high valuation levels made it difficult to find attractive defensive companies at reasonable prices.
Describe the fund’s portfolio equity and option structure:
As of December 31, 2022, the Fund held 35 equity securities, an Electronic Exchange Traded Fund (ETF), and unexpired covered call options had been written against 82.6% of the Fund’s stock holdings. It is the strategy of the Fund to write “out-of-the-money” call options, and, as of December 31, 95% of the Fund’s call options (36 of 38 different options) remained “out-of-the-money”. (Out-of-the-money means the stock price is below the strike price at which the shares could be called away by the option holder.) On average, the call options in the Fund were 9.4% out-of-the-money at year end with an average time to expiration of 39.4 days.
Which sectors are prevalent in the fund?
From a sector perspective, MCN’s largest exposure as of December 31, 2022 was to the Information Technology sector, followed by Energy, Health Care and Financials. The most significant divergences from the sector weightings of the S&P 500 were over-weightings in the Energy and Materials sectors and under-weightings in the Information Technology, Industrials, Health Care and Consumer Staples sectors.
MCN | Madison Covered Call & Equity Strategy Fund | Management’s Discussion of Fund Performance - continued | December 31, 2022
| ALLOCATION AS A PERCENTAGE OF TOTAL INVESTMENTS AS OF 12/31/22 | | | |
| Communication Services | | | 6.1 | % |
| Consumer Discretionary | | | 7.6 | % |
| Consumer Staples | | | 2.3 | % |
| Energy | | | 14.1 | % |
| Exchange Traded Funds | | | 0.9 | % |
| Financials | | | 9.0 | % |
| Health Care | | | 9.3 | % |
| Industrials | | | 2.6 | % |
| Information Technology | | | 18.8 | % |
| Materials | | | 4.2 | % |
| Real Estate | | | 2.5 | % |
| Short Term Investment | | | 21.1 | % |
| Utilities | | | 1.5 | % |
Discuss the fund’s security and option selection process:
The Fund is managed by primarily focusing on active stock selection before adding the call option overlay utilizing individual equity call options rather than index options. We use fundamental analysis to select solid companies with good growth prospects and attractive valuations. We then seek attractive call options to write on those stocks. It is our belief that this partnership of active management of the equity and option strategies provides investors with an innovative, risk-moderated approach to equity investing. The fund’s portfolio managers seek to invest in a portfolio of common stocks that have favorable “PEG” ratios (Price-Earnings ratio to Growth rate) as well as financial strength and industry leadership. As bottom-up investors, we focus on the fundamental businesses of our companies. Our stock selection philosophy strays away from the “beat the street” mentality, as we seek companies that have sustainable competitive advantages, predictable cash flows, solid balance sheets and high-quality management teams. By concentrating on long-term prospects and circumventing the “instant gratification” school of thought, we believe we bring elements of consistency, stability and predictability to our shareholders.
Once we have selected attractive and solid names for the fund, we employ our call writing strategy. This procedure entails selling calls that are primarily out-of the-money, meaning that the strike price is higher than the common stock price, so that the fund can participate in some stock appreciation. By receiving option premiums, the fund receives a high level of investment income and adds an element of downside protection. Call options may be written over a number of time periods and at differing strike prices in an effort to maximize the protective value to the strategy and spread income evenly throughout the year.
Discuss how risk is managed through the fund’s investment process:
Risk management is a critical component of the investment manager’s overall philosophy and investment process. The primary means for managing risk are as follows:
1. Focus on the underlying security. The manager’s bottom-up stock selection process is geared toward investing in companies with very strong fundamentals including market leadership, balance sheet strength, attractive growth prospects, sustainable competitive advantages, predictable cash flows, and high-quality management teams. Purchasing such companies at attractive valuations is vital to providing an added margin of safety and the manager’s “growth-at-a-reasonable-price” (GARP) philosophy is specifically tuned to such valuation discipline.
2. Active covered call writing. The manager actively sells (writes) individual equity call options on equities that are owned by the fund. The specific characteristics of the call options ( strike price, expiration, degree of coverage) are dependent on the manager’s outlook on the underlying equity and/or general market conditions. If equity prices appear over-valued due to individual company strength or surging markets, the manager may choose to become more defensive with the fund’s option strategy by selling call options that are closer to the current equity market
MCN | Madison Covered Call & Equity Strategy Fund | Management’s Discussion of Fund Performance - continued | December 31, 2022
price, generating larger option premiums which would help defend against a market reversal. The manager may also sell call options on a greater percentage of the portfolio in an effort to provide for more downside protection. Following a market downturn, the manager may sell options further out of the money in order to allow the fund to benefit from a market recovery. In such an environment, the manager may also determine that a lesser percentage of the portfolio be covered by call options in order to more fully participate in market upside.
3. Cash management and timing. Generally, the manager believes that the fund should be fully invested under normal market conditions. A covered call strategy is rather unique relative to most equity portfolios as the short term nature of call options can lead to the assignment or sale of underlying stock positions on a fairly regular basis. As a result, the fund’s cash levels are likely to frequently fluctuate based on the characteristics of the call options and the market conditions. The thoughtful reinvestment of cash levels adds a layer of risk management to the investment process. This is most evident following a strong surge in equity prices above the strike prices of call options written against individual stocks in the fund (call options move in-the-money). This could lead to a larger than normal wave of stock sales via call option assignment which would increase the fund’s cash position following a period of very strong stock. Given the manager’s disciplined focus on purchasing underlying securities at appropriate valuation levels, the immediate reinvestment of cash may be delayed until market conditions and valuations become more attractive. If market conditions continue to surge for a period of time, the fund may underperform due to higher than normal cash levels, however, it is the manager’s belief that maintaining a strong valuation discipline will provide greater downside protection over a full market cycle.
What is the management’s outlook for the market and fund in 2023?
Historically, it is rare that the S&P 500 declines two years in succession. Since the Great Depression, it has only occurred 3 times, 1939-41, 1973-74 and 2000-03. It’s a little early to handicap 2023 with much precision but the path forward at least holds the potential for another down year ahead. Global PMI’s (Purchasing Managers Index) are leading indicators and very highly corelated to equity trends. They are weak and getting weaker. Central bank monetary tightening is still in place and likely getting tighter … interest rates higher for longer and the F ed is deleveraging its balance sheet. Banks are aggressively tightening lending standards. With Congress in gridlock, no major fiscal stimulus is coming to the rescue. The impact of this tightening has a lagged effect on the economy and should continue to weigh on markets and economic activity for the immediate future. It is likely as the economy weakens , unemployment will rise and the housing market will suffer. Only when housing bottoms can we truly see the embers of the next bull market. Corporate earnings estimates are very likely to revise lower and the environment is not conducive to valuations expanding.
While we hope for the best, we are tasked with preparing for the worst. We hope for better markets ahead but it likely will take longer than many currently expect for the storm clouds to clear. Until then, we will remain defensive and protect capital to the best of our ability. We accomplished that extremely well in 2022 and we remain focused on doing so in the future.
| TOP TEN EQUITY HOLDINGS AS OF 12/31/22 | | | |
| | | % of Total Investments | |
| Fiserv, Inc. | | | 4.2 | % |
| Las Vegas Sands Corp. | | | 4.0 | % |
| APA Corp. | | | 3.6 | % |
| Baker Hughes Co. | | | 3.4 | % |
| CVS Health Corp. | | | 3.0 | % |
| T-Mobile U.S., Inc. | | | 3.0 | % |
| Transocean Ltd. | | | 2.9 | % |
| JPMorgan Chase & Co. | | | 2.8 | % |
| Stryker Corp. | | | 2.8 | % |
| Visa, Inc. | | | 2.8 | % |
MCN | Madison Covered Call & Equity Strategy Fund | December 31, 2022
Portfolio of Investments
| | | Shares | | | Value (Note 2,3) | |
| COMMON STOCKS - 79.0% | | | | | | | | |
| Communication Services - 6.1% | | | | | | | | |
| Alphabet, Inc., Class C * (A) | | | 32,000 | | | $ | 2,839,360 | |
| Comcast Corp., Class A | | | 31,500 | | | | 1,101,555 | |
| Lumen Technologies, Inc. | | | 124,000 | | | | 647,280 | |
| T-Mobile U.S., Inc. * (A) | | | 32,000 | | | | 4,480,000 | |
| | | | | | | | 9,068,195 | |
| | | | | | | | | |
| Consumer Discretionary - 7.7% | | | | | | | | |
| Amazon.com, Inc. * (A) | | | 34,000 | | | | 2,856,000 | |
| Las Vegas Sands Corp. * (A) | | | 124,000 | | | | 5,960,680 | |
| Nordstrom, Inc. (A) (B) | | | 156,000 | | | | 2,517,840 | |
| | | | | | | | 11,334,520 | |
| | | | | | | | | |
| Consumer Staples - 2.4% | | | | | | | | |
| Constellation Brands, Inc., Class A (A) | | | 15,000 | | | | 3,476,250 | |
| | | | | | | | | |
| Energy - 14.3% | | | | | | | | |
| APA Corp. (A) | | | 117,000 | | | | 5,461,560 | |
| Baker Hughes Co. (A) | | | 171,000 | | | | 5,049,630 | |
| Diamondback Energy, Inc. (A) | | | 20,500 | | | | 2,803,990 | |
| EOG Resources, Inc. (A) | | | 16,000 | | | | 2,072,320 | |
| EQT Corp. (A) | | | 45,000 | | | | 1,522,350 | |
| Transocean Ltd. * | | | 940,000 | | | | 4,286,400 | |
| | | | | | | | 21,196,250 | |
| | | | | | | | | |
| Financials - 9.1% | | | | | | | | |
| BlackRock, Inc. (A) | | | 5,700 | | | | 4,039,191 | |
| CME Group, Inc. (A) | | | 18,000 | | | | 3,026,880 | |
| JPMorgan Chase & Co. (A) | | | 31,700 | | | | 4,250,970 | |
| Morgan Stanley (A) | | | 26,000 | | | | 2,210,520 | |
| | | | | | | | 13,527,561 | |
| | | | | | | | | |
| Health Care - 9.4% | | | | | | | | |
| CVS Health Corp. (A) | | | 48,500 | | | | 4,519,715 | |
| Danaher Corp. (A) | | | 9,000 | | | | 2,388,780 | |
| Medtronic PLC (A) | | | 37,300 | | | | 2,898,956 | |
| Stryker Corp. (A) | | | 17,000 | | | | 4,156,330 | |
| | | | | | | | 13,963,781 | |
| | | | | | | | | |
| Industrials - 2.6% | | | | | | | | |
| 3M Co. (A) | | | 12,500 | | | | 1,499,000 | |
| FedEx Corp. (A) | | | 13,700 | | | | 2,372,840 | |
| | | | | | | | 3,871,840 | |
| | | | | | | | | |
| Information Technology - 19.0% | | | | | | | | |
| Adobe, Inc. * (A) | | | 12,100 | | | | 4,072,013 | |
| Analog Devices, Inc. (A) | | | 23,000 | | | | 3,772,690 | |
| Ciena Corp. * (A) | | | 47,000 | | | | 2,396,060 | |
| Fiserv, Inc. * (A) | | | 62,000 | | | | 6,266,340 | |
| Microsoft Corp. (A) | | | 15,000 | | | | 3,597,300 | |
| PayPal Holdings, Inc. * | | | 53,800 | | | | 3,831,636 | |
| Visa, Inc., Class A (A) | | | 20,500 | | | | 4,259,080 | |
| | | | | | | | 28,195,119 | |
| | | | | | | | | |
| Materials - 4.2% | | | | | | | | |
| Barrick Gold Corp. | | | 233,500 | | | | 4,011,530 | |
| Newmont Corp. (A) | | | 47,000 | | | | 2,218,400 | |
| | | | | | | | 6,229,930 | |
| | | Shares | | | Value (Note 2,3) | |
| Real Estate - 2.6% | | | | | | | | |
| American Tower Corp., REIT (A) | | | 18,000 | | | $ | 3,813,480 | |
| | | | | | | | | |
| Utilities - 1.6% | | | | | | | | |
| AES Corp. (A) | | | 80,000 | | | | 2,300,800 | |
| | | | | | | | | |
| Total Common Stocks | | | | | | | | |
| ( Cost $142,187,195 ) | | | | | | | 116,977,726 | |
| | | | | | | | | |
| EXCHANGE TRADED FUNDS- 0.9% | | | | | | | | |
| | | | | | | | | |
| VanEck Gold Miners ETF (B) | | | 46,900 | | | | 1,344,154 | |
| | | | | | | | | |
| Total Exchange Traded Funds | | | | | | | | |
| ( Cost $1,833,807 ) | | | | | | | 1,344,154 | |
| | | | | | | | | |
| SHORT-TERM INVESTMENTS - 21.3% | | | | | | | | |
| State Street Institutional U.S. | | | | | | | | |
| Government Money Market Fund, | | | | | | | | |
| Premier Class, (D), 4.11% | | | 31,480,003 | | | | 31,480,003 | |
| | | | | | | | | |
| State Street Navigator Securities | | | | | | | | |
| Lending Government Money Market | | | | | | | | |
| Portfolio, (C) (D), 4.34% | | | 118,000 | | | | 118,000 | |
| | | | | | | | | |
| Total Short-Term Investments | | | | | | | | |
| ( Cost $31,598,003 ) | | | | | | | 31,598,003 | |
| | | | | | | | | |
| TOTAL INVESTMENTS - 101.2% | | | | | | | | |
| (Cost $175,619,005** ) | | | | | | | 149,919,883 | |
| | | | | | | | | |
| TOTAL OPTIONS WRITTEN - (1.2%) | | | | | | | (1,742,440 | ) |
| | | | | | | | | |
| NET OTHER ASSETS AND LIABILITIES – (0.0)% | | | | | | | (21,421 | ) |
| | | | | | | | | |
| TOTAL NET ASSETS - 100.0% | | | | | | $ | 148,156,022 | |
| * | | Non-income producing. |
| | | |
| ** | | Aggregate cost for Federal tax purposes was $176,124,515. |
| | | |
| (A) | | All or a portion of these securities’ positions, with a value of $103,099,325, represent covers (directly or through conversion rights) for outstanding options written. |
| | | |
| (B) | | All or a portion of these securities, with an aggregate fair value of $792,673, are on loan as part of a securities lending program. See footnote (C) and Note 5 for details on the securities lending program. |
| | | |
| (C) | | Represents investments of cash collateral received in connection with securities lending. |
| | | |
| (D) | | 7-day yield. |
| | | |
| ETF | | Exchange Traded Fund. |
| | | |
| PLC | | Public Limited Company. |
| | | |
| REIT | | Real Estate Investment Trust. |
See accompanying Notes to Financial Statements.
MCN | Madison Covered Call & Equity Strategy Fund | Portfolio of Investments - concluded | December 31, 2022
Written Option Contracts Outstanding at December 31, 2022
| Description | | Exercise
Price | | | Expiration
Date | | Number
of
Contracts | | | Notional
Amount | | | Market
Value | | | Premiums
Paid
(Received) | | | Unrealized
Appreciation
(Depreciation) | |
| Call Options Written | | | | | | | | | | | | | | | | | | | | |
| 3M Co. | | $ | 130.00 | | | 1/20/23 | | | (125 | ) | | $ | (1,625,000 | ) | | $ | (3,437 | ) | | $ | (31,876 | ) | | $ | 28,439 | |
| Adobe, Inc. | | | 355.00 | | | 1/20/23 | | | (121 | ) | | | (4,295,500 | ) | | | (57,173 | ) | | | (117,259 | ) | | | 60,086 | |
| AES Corp. | | | 30.00 | | | 2/17/23 | | | (800 | ) | | | (2,400,000 | ) | | | (54,000 | ) | | | (59,200 | ) | | | 5,200 | |
| Alphabet, Inc., Class C | | | 100.00 | | | 2/17/23 | | | (320 | ) | | | (3,200,000 | ) | | | (44,320 | ) | | | (57,570 | ) | | | 13,250 | |
| Amazon.com, Inc. | | | 100.00 | | | 2/17/23 | | | (340 | ) | | | (3,400,000 | ) | | | (46,920 | ) | | | (73,709 | ) | | | 26,789 | |
| American Tower Corp., REIT | | | 230.00 | | | 1/20/23 | | | (140 | ) | | | (3,220,000 | ) | | | (12,950 | ) | | | (68,947 | ) | | | 55,997 | |
| American Tower Corp., REIT | | | 220.00 | | | 2/17/23 | | | (40 | ) | | | (880,000 | ) | | | (26,600 | ) | | | (21,559 | ) | | | (5,041 | ) |
| Analog Devices, Inc. | | | 175.00 | | | 2/17/23 | | | (230 | ) | | | (4,025,000 | ) | | | (90,850 | ) | | | (111,953 | ) | | | 21,103 | |
| APA Corp. | | | 52.50 | | | 1/20/23 | | | (585 | ) | | | (3,071,250 | ) | | | (23,985 | ) | | | (105,667 | ) | | | 81,682 | |
| APA Corp. | | | 52.50 | | | 2/17/23 | | | (585 | ) | | | (3,071,250 | ) | | | (81,023 | ) | | | (72,528 | ) | | | (8,495 | ) |
| Baker Hughes Co. | | | 32.00 | | | 1/20/23 | | | (59 | ) | | | (188,800 | ) | | | (1,622 | ) | | | (7,315 | ) | | | 5,693 | |
| Baker Hughes Co. | | | 35.00 | | | 1/20/23 | | | (855 | ) | | | (2,992,500 | ) | | | — | | | | (74,703 | ) | | | 74,703 | |
| BlackRock, Inc. | | | 750.00 | | | 2/17/23 | | | (57 | ) | | | (4,275,000 | ) | | | (105,735 | ) | | | (108,255 | ) | | | 2,520 | |
| Ciena Corp. | | | 50.00 | | | 1/20/23 | | | (250 | ) | | | (1,250,000 | ) | | | (52,500 | ) | | | (28,492 | ) | | | (24,008 | ) |
| Ciena Corp. | | | 50.00 | | | 2/17/23 | | | (220 | ) | | | (1,100,000 | ) | | | (70,400 | ) | | | (44,879 | ) | | | (25,521 | ) |
| CME Group, Inc. | | | 185.00 | | | 1/20/23 | | | (17 | ) | | | (314,500 | ) | | | (297 | ) | | | (3,723 | ) | | | 3,426 | |
| CME Group, Inc. | | | 180.00 | | | 3/17/23 | | | (163 | ) | | | (2,934,000 | ) | | | (48,085 | ) | | | (41,980 | ) | | | (6,105 | ) |
| Constellation Brands, Inc. | | | 240.00 | | | 1/20/23 | | | (150 | ) | | | (3,600,000 | ) | | | (39,375 | ) | | | (74,845 | ) | | | 35,470 | |
| CVS Health Corp. | | | 100.00 | | | 2/17/23 | | | (485 | ) | | | (4,850,000 | ) | | | (47,530 | ) | | | (98,921 | ) | | | 51,391 | |
| Danaher Corp. | | | 270.00 | | | 2/17/23 | | | (90 | ) | | | (2,430,000 | ) | | | (99,900 | ) | | | (67,409 | ) | | | (32,491 | ) |
| Diamondback Energy, Inc. | | | 145.00 | | | 2/17/23 | | | (205 | ) | | | (2,972,500 | ) | | | (98,400 | ) | | | (104,091 | ) | | | 5,691 | |
| EOG Resources, Inc. | | | 150.20 | | | 1/20/23 | | | (160 | ) | | | (2,403,200 | ) | | | (2,800 | ) | | | (80,241 | ) | | | 77,441 | |
| EQT Corp. | | | 40.00 | | | 2/17/23 | | | (450 | ) | | | (1,800,000 | ) | | | (33,750 | ) | | | (53,540 | ) | | | 19,790 | |
| FedEx Corp. | | | 185.00 | | | 1/20/23 | | | (137 | ) | | | (2,534,500 | ) | | | (18,906 | ) | | | (62,730 | ) | | | 43,824 | |
| Fiserv, Inc. | | | 110.00 | | | 2/17/23 | | | (446 | ) | | | (4,906,000 | ) | | | (62,440 | ) | | | (103,103 | ) | | | 40,663 | |
| Fiserv, Inc. | | | 110.00 | | | 3/17/23 | | | (174 | ) | | | (1,914,000 | ) | | | (39,150 | ) | | | (34,665 | ) | | | (4,485 | ) |
| JPMorgan Chase & Co. | | | 135.00 | | | 1/20/23 | | | (157 | ) | | | (2,119,500 | ) | | | (47,807 | ) | | | (55,585 | ) | | | 7,778 | |
| JPMorgan Chase & Co. | | | 140.00 | | | 1/20/23 | | | (160 | ) | | | (2,240,000 | ) | | | (20,160 | ) | | | (38,556 | ) | | | 18,396 | |
| Las Vegas Sands Corp. | | | 55.00 | | | 1/20/23 | | | (620 | ) | | | (3,410,000 | ) | | | (12,400 | ) | | | (68,193 | ) | | | 55,793 | |
| Las Vegas Sands Corp. | | | 55.00 | | | 3/17/23 | | | (620 | ) | | | (3,410,000 | ) | | | (103,540 | ) | | | (90,699 | ) | | | (12,841 | ) |
| Medtronic PLC | | | 82.50 | | | 3/17/23 | | | (190 | ) | | | (1,567,500 | ) | | | (39,615 | ) | | | (35,999 | ) | | | (3,616 | ) |
| Microsoft Corp. | | | 255.00 | | | 2/17/23 | | | (150 | ) | | | (3,825,000 | ) | | | (88,125 | ) | | | (114,595 | ) | | | 26,470 | |
| Morgan Stanley | | | 90.00 | | | 2/17/23 | | | (260 | ) | | | (2,340,000 | ) | | | (46,930 | ) | | | (58,819 | ) | | | 11,889 | |
| Newmont Corp. | | | 50.00 | | | 1/20/23 | | | (470 | ) | | | (2,350,000 | ) | | | (28,200 | ) | | | (66,335 | ) | | | 38,135 | |
| Nordstrom, Inc. | | | 25.00 | | | 1/20/23 | | | (565 | ) | | | (1,412,500 | ) | | | — | | | | (67,223 | ) | | | 67,223 | |
| Stryker Corp. | | | 250.00 | | | 1/20/23 | | | (170 | ) | | | (4,250,000 | ) | | | (68,000 | ) | | | (77,904 | ) | | | 9,904 | |
| T-Mobile U.S., Inc. | | | 150.00 | | | 2/17/23 | | | (320 | ) | | | (4,800,000 | ) | | | (81,440 | ) | | | (100,472 | ) | | | 19,032 | |
| Visa, Inc., Class A | | | 215.00 | | | 1/20/23 | | | (205 | ) | | | (4,407,500 | ) | | | (44,075 | ) | | | (60,164 | ) | | | 16,089 | |
| | | | | | | | | | | | | | | | | | | | | | | | | | | |
| Total Call Options Written | | | | | | | | | | | | | | | | $ | (1,742,440 | ) | | $ | (2,543,704 | ) | | $ | 801,264 | |
| Total Options Written, at Value | | | | | | | | | | | | | | | | $ | (1,742,440 | ) | | $ | (2,543,704 | ) | | $ | 801,264 | |
See accompanying Notes to Financial Statements.
MCN | Madison Covered Call & Equity Strategy Fund | December 31, 2022
Statement of Assets and Liabilities as of December 31, 2022
| Assets: | | | |
| Investments in unaffiliated securities, at fair value†§ | | $ | 149,919,883 | |
| Receivables: | | | | |
| Fund shares issued for reinvestment | | | 65,767 | |
| Dividends and Interest | | | 165,198 | |
| Total assets | | | 150,150,848 | |
| Liabilities: | | | | |
| Payables: | | | | |
| Upon return of securities loaned | | | 118,000 | |
| Advisory agreement fees | | | 101,420 | |
| Administrative services agreement fees | | | 32,966 | |
| Options written, at value (premium received $2,543,704) | | | 1,742,440 | |
| Total liabilities | | | 1,994,826 | |
| Net assets | | $ | 148,156,022 | |
| | | | | |
| Net assets consist of: | | | | |
| Common Stock/Shares: | | | | |
| Paid-in capital in excess of par | | $ | 173,538,098 | |
| Accumulated distributable earnings (loss) | | | (25,382,076 | ) |
| Net Assets | | $ | 148,156,022 | |
| | | | | |
| Capital Shares Issued and Outstanding (Note 9) | | | 21,016,506 | |
| Net Asset Value per share | | $ | 7.05 | |
| | | | | |
| † Cost of Investments in unaffiliated securities | | $ | 175,619,005 | |
| § Fair Value of securities on loan | | $ | 792,673 | |
See accompanying Notes to Financial Statements.
MCN | Madison Covered Call & Equity Strategy Fund | December 31, 2022
Statement of Operations for the year ended December 31, 2022
| Investment Income: | | | |
| Interest | | $ | 381,884 | |
| Dividends | | | | |
| Unaffiliated issuers | | | 2,425,083 | |
| Less: Foreign taxes withheld/reclaimed | | | (22,804 | ) |
| Income from securities lending | | | 366 | |
| Total investment income | | | 2,784,529 | |
| Expenses (Note 4): | | | | |
| Advisory agreement fees | | | 1,197,831 | |
| Administrative services agreement fees | | | 389,295 | |
| Trustee fees | | | 37,000 | |
| Other expenses | | | 187 | |
| Total expenses | | | 1,624,313 | |
| Net Investment Income | | | 1,160,216 | |
| Net Realized and Unrealized Gain (loss) on Investments | | | | |
| Net realized gain (loss) on investments (including net realized gain (loss) on foreign currency related transactions) | | | | |
| Options purchased | | | 1,843,097 | |
| Options written | | | 6,446,380 | |
| Unaffiliated issuers | | | 5,036,089 | |
| Net change in unrealized appreciation (depreciation) on investments (including net unrealized appreciation (depreciation) on foreign currency related transactions) | | | | |
| Options purchased | | | 1,863,005 | |
| Options written | | | 68,936 | |
| Unaffiliated issuers | | | (9,609,853 | ) |
| Net Realized and Unrealized Gain on Investments | | | 5,647,654 | |
| Net Increase in Net Assets from Operations | | $ | 6,807,870 | |
See accompanying Notes to Financial Statements.
MCN | Madison Covered Call & Equity Strategy Fund | December 31, 2022
Statements of Changes in Net Assets
| Year Ended December 31, | | 2022 | | | 2021 | |
| Net Assets at beginning of period | | $ | 156,219,786 | | | $ | 148,475,062 | |
| Increase (decrease) in net assets from operations: | | | | | | | | |
| Net investment income | | | 1,160,216 | | | | 254,814 | |
| Net realized gain | | | 13,325,566 | | | | 13,277,772 | |
| Net change in unrealized appreciation (depreciation) | | | (7,677,912 | ) | | | 9,040,542 | |
| Net increase in net assets from operations | | | 6,807,870 | | | | 22,573,128 | |
| Distributions to shareholders from: | | | | | | | | |
| Accumulated earnings (combined net investment income and net realized gains) | | | (15,115,784 | ) | | | (12,559,719 | ) |
| Return of capital | | | – | | | | (2,532,497 | ) |
| Total distributions | | | (15,115,784 | ) | | | (15,092,216 | ) |
| Capital Stock transactions: | | | | | | | | |
| Newly issued to shareholders in reinvestment of distributions | | | 244,150 | | | | 263,812 | |
| Increase from capital stock transactions | | | 244,150 | | | | 263,812 | |
| Total increase (decrease) in net assets | | | (8,063,764 | ) | | | 7,744,724 | |
| Net Assets at end of period | | $ | 148,156,022 | | | $ | 156,219,786 | |
| | | | | | | | | |
| Capital Share transactions: | | | | | | | | |
| Newly issued shares reinvested | | | 34,956 | | | | 34,626 | |
| Increase from capital shares transactions | | | 34,956 | | | | 34,626 | |
See accompanying Notes to Financial Statements.
MCN | Madison Covered Call & Equity Strategy Fund | December 31, 2022
Financial Highlights for a Share of Beneficial Interest Outstanding
| | | Year Ended December 31, | |
| | | 2022 | | | 2021 | | | 2020 | | | 2019 | | | 2018 | |
| Net Asset Value at beginning of period | | $ | 7.45 | | | $ | 7.09 | | | $ | 7.35 | | | $ | 6.91 | | | $ | 8.27 | |
| Income from Investment Operations: | | | | | | | | | | | | | | | | | | | | |
| Net investment income | | | 0.06 | | | | 0.01 | | | | 0.04 | | | | 0.08 | | | | 0.10 | |
| Net realized and unrealized gain (loss) on investments | | | 0.26 | | | | 1.07 | | | | 0.42 | | | | 1.08 | | | | (0.74 | ) |
| Total from investment operations | | | 0.32 | | | | 1.08 | | | | 0.46 | | | | 1.16 | | | | (0.64 | ) |
| Less Distributions From: | | | | | | | | | | | | | | | | | | | | |
| Net investment income | | | (0.65 | ) | | | (0.60 | ) | | | (0.50 | ) | | | (0.47 | ) | | | (0.51 | ) |
Capital gains | | | (0.07 | ) | | | - | | | | - | | | | - | | | | - | |
| Return of Capital | | | – | | | | (0.12 | ) | | | (0.22 | ) | | | (0.25 | ) | | | (0.21 | ) |
| Total distributions | | | (0.72 | ) | | | (0.72 | ) | | | (0.72 | ) | | | (0.72 | ) | | | (0.72 | ) |
| Net increase (decrease) in net asset value | | | (0.40 | ) | | | 0.36 | | | | (0.26 | ) | | | 0.44 | | | | (1.36 | ) |
| Net Asset Value at end of period | | $ | 7.05 | | | $ | 7.45 | | | $ | 7.09 | | | $ | 7.35 | | | $ | 6.91 | |
| Market Value at end of period | | $ | 7.75 | | | $ | 8.02 | | | $ | 6.75 | | | $ | 6.63 | | | $ | 6.16 | |
| Total Return | | | | | | | | | | | | | | | | | | | | |
| Net asset value (%)1 | | | 4.90 | | | | 15.36 | | | | 7.72 | | | | 17.39 | | | | (8.37 | ) |
| Market value (%)2 | | | 7.12 | | | | 30.44 | | | | 15.22 | | | | 19.83 | | | | (11.79 | ) |
| Ratios/Supplemental Data: | | | | | | | | | | | | | | | | | | | | |
| Net Assets at end of period (in 000‘s) | | $ | 148,156 | | | $ | 156,220 | | | $ | 148,475 | | | $ | 153,963 | | | $ | 144,686 | |
| Ratios of expenses to average net assets (%) | | | 1.08 | | | | 1.08 | | | | 1.07 | | | | 1.073 | | | | 1.173 | |
| Ratio of net investment income to average net assets (%) | | | 0.77 | | | | 0.16 | | | | 0.61 | | | | 1.15 | | | | 0.75 | |
| Portfolio turnover (%) | | | 104 | | | | 178 | | | | 128 | | | | 114 | | | | 114 | |
1 Total net asset value return is calculated based on changes in the net asset value per share for the year reported on. Dividends and distributions, if any, are assumed, for purposes of this calculation, to be reinvested at the net asset value amount on the date of the distribution.
2 Total market value return is calculated assuming a purchase of a share of common stock at the market price on the first day and a sale of a share of common stock at the market price on the last day of each period reported. Dividends and distributions, if any, are assumed, for purposes of this calculation, to be reinvested at prices obtained under the dividend reinvestment plan. Total market value return does not reflect brokerage commissions or sales charges in connection with the purchase or sale of Fund stock.
3 Includes Board-approved expenses related to special and annual meetings that took place during the year.
See accompanying Notes to Financial Statements.
MCN | Madison Covered Call & Equity Strategy Fund | December 31, 2022
Notes to Financial Statements
1. ORGANIZATION
Madison Covered Call & Equity Strategy Fund (the “Fund”) was organized as a Delaware statutory trust on May 6, 2004. The Fund is registered as a diversified, closed-end management investment company under the Investment Company Act of 1940 (“1940 Act”), as amended, and the Securities Act of 1933, as amended. The Fund’s primary investment objective is to provide a high level of current income and current gains, with a secondary objective of long-term capital appreciation. The Fund will pursue its investment objectives by investing primarily in large and mid-capitalization common stocks that are, in the view of Madison Asset Management, LLC, the Fund’s investment adviser (the “Adviser”), selling at a reasonable price in relation to their long-term earnings growth rates. Under normal market conditions, the Fund will seek to generate current earnings from option premiums by writing (selling) covered call options on a substantial portion of its portfolio securities. There can be no assurance that the Fund will achieve its investment objectives. The Fund’s investment objectives are considered fundamental and may not be changed without shareholder approval.
2. SIGNIFICANT ACCOUNTING POLICIES
The Fund is an investment company that applies the accounting and reporting guidance in the Financial Accounting Standards Board (FASB) Accounting Standards Codification Topic 946, Financial Services - Investment Companies (ASC 946). The following is a summary of significant accounting policies consistently followed by the Fund in the preparation of its financial statements.
Use of Estimates: The preparation of financial statements in conformity with accounting principles generally accepted in the United States of America requires management to make estimates and assumptions. Such estimates affect the reported amounts of assets and liabilities and reported amounts of increases and decreases in net assets from operations during the reporting period. Actual results could differ from those estimates.
Portfolio Valuation: Securities traded on a national securities exchange are valued at their closing sale price, except for securities traded on the National Association of Securities Dealers Automated Quotation System (“NASDAQ”), which are valued at the NASDAQ official closing price (“NOCP”). If no sale occurs, equities traded on a U.S. exchange or on NASDAQ are valued at the bid price. Options are valued at the mean between the best bid and best ask price across all option exchanges. Debt securities having maturities of 60 days or less are valued at amortized cost, which approximates market value. Debt securities having longer maturities are valued on the basis of the last available bid prices or current market quotations provided by dealers or pricing services approved by the Fund. Mutual funds are valued at their net asset value (“NAV”). Securities for which market quotations are not readily available are valued at their fair value as determined in good faith under procedures approved by the Board of Trustees.
At times, the Fund maintains cash balances at financial institutions in excess of federally insured limits. The Fund monitors this credit risk and has not experienced any losses related to this risk.
Investment Transactions and Investment Income: Investment transactions are recorded on a trade date basis. The cost of investments sold is determined on the identified cost basis for financial statement and federal income tax purposes. Dividend income is recorded on the ex-dividend date and interest income is recorded on an accrual basis.
MCN | Madison Covered Call & Equity Strategy Fund | Notes to the Financial Statements - continued | December 31, 2022
Covered Call and Put Options: An option on a security is a contract that gives the holder of the option, in return for a premium, the right to buy from (in the case of a call) or sell to (in the case of a put) the writer of the option the security underlying the option at a specified exercise or “strike” price. The writer of an option on a security has an obligation upon exercise of the option to deliver the underlying security upon payment of the exercise price (in the case of a call) or pay the exercise price upon delivery of the underlying security (in the case of a put).
The number of call options the Fund can write (sell) is limited by the amount of equity securities the Fund holds in its portfolio. The Fund will not write (sell) “naked” or uncovered call options. The Fund seeks to produce a high level of current income and gains generated from option writing premiums and, to a lesser extent, from dividends.
Options on securities indices are designed to reflect price fluctuations in a group of securities or segment of the securities market rather than price fluctuations in a single security and are similar to options on single securities, except that the exercise of securities index options requires cash settlement payments and does not involve the actual purchase or sale of securities.
When an option is written, a liability is recorded equal to the premium received. This liability for options written is marked-to-market on a daily basis to reflect the current market value of the option written. These liabilities are reflected as options written in the Statement of Assets and Liabilities. Premiums received from writing options that expire unexercised are recorded on the expiration date as a realized gain. The difference between the premium received and the amount paid on effecting a closing purchase transaction, including brokerage commissions, is also treated as a realized gain, or if the premium is less than the amount paid for the closing purchase transactions, as a realized loss. If a call option is exercised, the premium is added to the proceeds from the sale of the underlying security in determining whether there has been a realized gain or loss.
Distributions to Shareholders: The Fund declares and pays quarterly distributions to shareholders. Distributions to shareholders are recorded on the ex-dividend date. The amount and timing of distributions are determined in accordance with federal income tax regulations, which may differ from Generally Accepted Accounting Principles (“GAAP”). These distributions consist of investment company taxable income, which generally includes qualified dividend income, ordinary income and short-term capital gains, including premiums received on written options. Distributions may also include a return of capital. Any net realized long-term capital gains are distributed annually to shareholders. The character of the distributions are determined annually in accordance with federal income tax regulations.
Recently Issued Accounting Pronouncements: On December 3, 2020, the Securities and Exchange Commission (SEC) adopted new rule 2a-5 (Valuation Rule) under the Investment Company Act of 1940, establishing an updated regulatory framework for fund valuation. The Valuation Rule, in part, provides a framework for good faith fair value determination and permits a Board to designate fair value determinations to a fund’s investment adviser. Further, the SEC is rescinded previously issued guidance on related issues. The Valuation Rule became effective on March 8, 2021, with a compliance date of September 8, 2022. The Trust approved new pricing and valuation procedure to comply with the Valuation Rule as of the compliance date.
3. FAIR VALUE MEASUREMENTS
The Fund has adopted FASB applicable guidance on fair value measurements. Fair value is defined as the price that the Fund would receive upon selling an investment in a timely transaction to an independent buyer in the principal or most advantageous market of the investment. A three-tier hierarchy is used to maximize the use of observable market data “inputs” and minimize the use of unobservable “inputs” and to establish classification of fair value measurements for disclosure purposes. Inputs refer broadly to the assumptions that market participants would use in pricing the asset or liability, including assumptions about risk (for example, the risk inherent in a
MCN | Madison Covered Call & Equity Strategy Fund | Notes to the Financial Statements - continued | December 31, 2022
particular valuation technique used to measure fair value including such a pricing model and/or the risk inherent in the inputs to the valuation technique). Inputs may be observable or unobservable.
Observable inputs are inputs that reflect the assumptions market participants would use in pricing the asset or liability developed based on market data obtained from sources independent of the reporting entity. Unobservable inputs are inputs that reflect the reporting entity’s own assumptions about the assumptions market participants would use in pricing the asset or liability developed based on the best information available under the circumstances. The three-tier hierarchy of inputs is summarized in the three broad Levels listed below:
| • | Level 1 - unadjusted quoted prices in active markets for identical investments |
| • | Level 2 - other significant observable inputs (including quoted prices for similar investments, interest rate volatilities, prepayment speeds, credit risk, benchmark yields, transactions, bids, offers, new issues, spreads and other relationships observed in the markets among comparable securities, underlying equity of the issuer; and proprietary pricing models such as yield measures calculated using factors such as cash flows, financial or collateral performance and other reference data, etc.) |
| • | Level 3 - significant unobservable inputs (including the Fund’s own assumptions in determining the fair value of investments). |
The valuation techniques used by the Fund to measure fair value for the year ended December 31, 2022, maximized the use of observable inputs and minimized the use of unobservable inputs.
There were no transfers between classifications levels during the year ended December 31, 2022. As of and during the period ended December 31, 2022, the Fund did not hold securities deemed as a Level 3.
The following is a summary of the inputs used as of December 31, 2022, in valuing the Fund’s investments carried at fair value:
| Description | | Level 1 | | | Level 2 | | | Level 3 | | | Value at 12/31/22 | |
| Assets:1 | | | | | | | | | | | | | | | | |
| Common Stocks | | $ | 116,977,726 | | | $ | — | | | $ | — | | | $ | 116,977,726 | |
| Exchange Traded Funds | | | 1,344,154 | | | | — | | | | — | | | | 1,344,154 | |
| Short-Term Investments | | | 31,598,003 | | | | — | | | | — | | | | 31,598,003 | |
| | | $ | 149,919,883 | | | $ | — | | | $ | — | | | $ | 149,919,883 | |
| Liabilities:1 | | | | | | | | | | | | | | | | |
| Options Written | | $ | (1,742,440 | ) | | $ | — | | | $ | — | | | $ | (1,742,440 | ) |
1 Please see the Portfolio of Investments for a listing of all securities within each category.
4. ADVISORY, ADMINISTRATIVE SERVICES AND OTHER EXPENSES
Pursuant to an Investment Advisory Agreement with the Fund, the Adviser, under the supervision of the Fund’s Board of Trustees, provides a continuous investment program for the Fund’s portfolio; provides investment research and makes and executes recommendations for the purchase and sale of securities; and provides certain facilities and personnel, including officers required for the Fund’s administrative management and compensation of all officers and interested trustees of the Fund. For these services, the Fund pays the Adviser an advisory fee, payable monthly, in an amount equal to an annualized rate of 0.80% of the Fund’s average daily net assets.
Under a separate Administrative Services Agreement, the Adviser also provides or arranges to have a third party provide the Fund with such services as it may require in the ordinary course of its business. Services to the Fund include: compliance services, custodial services, Fund administration services, Fund accounting services, and such other services necessary to conduct the Fund’s business. In addition, the Adviser shall arrange and pay for
MCN | Madison Covered Call & Equity Strategy Fund | Notes to the Financial Statements - continued | December 31, 2022
independent public accounting services for audit and tax purposes, legal services, a fidelity bond, and directors and officers/errors and omissions insurance. In exchange for these services, the Fund pays the Adviser a service fee, payable monthly, equal to an annualized rate of 0.26% of the Fund’s average daily net assets. Not included in this fee and, therefore, the responsibility of the Fund are “excluded expenses” and “transitional expenses.” Excluded expenses consist of (i) any fees and expenses relating to portfolio holdings (e.g., brokerage commissions, interest on loans, etc.); (ii) extraordinary and non-recurring fees and expenses (e.g., costs relating to any borrowing costs, overdrafts or taxes the Fund may owe, etc.); (iii) the costs associated with investment by the Fund in other investment companies (i.e., acquired fund fees and expenses); and (iv) Independent Trustees compensation, including Lead Independent Trustee compensation.
Certain officers and Trustees of the Fund may also be officers, directors and/or employees of the Adviser or its affiliates. The Fund does not compensate its officers or Trustees who are officers, directors and/or employees of the Adviser or its affiliates.
5. SECURITIES LENDING:
The Board of Trustees has authorized the Fund to engage in securities lending with State Street Bank and Trust Company as securities lending agent pursuant to a Securities Lending Authorization Agreement (the “Agreement”) and subject to the Fund’s securities lending policies and procedures. Under the terms of the Agreement, and subject to the policies and procedures, the Fund may lend portfolio securities to qualified borrowers in order to generate additional income, while managing risk associated with the securities lending program. The Agreement requires that loans are collateralized at all times by cash or U.S.government securities, initially equal to at least 102% of the value of the domestic securities and 105% of non-domestic securities, based upon the prior days market value for securities loaned. The loaned securities and collateral are marked to market daily to maintain collateral at 102% of the total loaned portfolio. Amounts earned as interest on investments of cash collateral, net of rebates and fees, if any, are included in the Statement of Operations. The primary risk associated with securities lending is loss associated with investment of cash and non-cash collateral. A secondary risk is if the borrower defaults on its obligation to return the securities loaned because of insolvency or other reasons. The Fund could experience delays and costs in recovering securities loaned or in gaining access to the collateral. Under the Agreement, the securities lending agent has provided a limited indemnification in the event of a borrower default. The Fund does not have a master netting agreement.
As of December 31, 2022, the aggregate fair value of securities on loan for the Trust was $ 792,673. Cash collateral received for such loans is reinvested into the State Street Navigator Securities Lending Government Money Market Portfolio. Non-cash collateral is comprised of U.S. treasuries or government securities. See below for fair value on loan and collateral breakout for each fund and each respective fund’s portfolio of investments for individual securities identified on loan.
| Fund | | Fair Value on Loan | | | Cash Collateral* | | | Non-Cash Collateral* | |
| Conservative Allocation | | $ | 792,673 | | | $ | 118,000 | | | $ | 695,542 | |
* Collateral represents minimum 102% of the value of domestic securities and 105% of non-domestic securities on loan, based upon the prior days market value for securities loaned.
The following table provides increased transparency about the types of collateral pledged for securities lending transactions that are accounted for as secured borrowing. Non-cash collateral is not reflected in the table because the funds cannot repledge or resell this collateral.
MCN | Madison Covered Call & Equity Strategy Fund | Notes to the Financial Statements - continued | December 31, 2022
| | | Remaining Contractual Maturity of the Agreements
As of December 31, 2022 | |
| | | Overnight and
Continuous | | | <30 days | | | Between
30 & 90 days | | | >90 days | | | Total | |
| Securities Lending Transactions(1) | | | | | | | | | | | | | | | | | | | | |
| Conservative Allocation | | | | | | | | | | | | | | | | | | | | |
| Government Money Market | | $ | 118,000 | | | $ | — | | | $ | — | | | $ | — | | | $ | 118,000 | |
| Total Borrowings | | $ | 118,000 | | | $ | — | | | $ | — | | | $ | — | | | $ | 118,000 | |
| Gross amount of recognized liabilities for securities lending transactions | | | | | | | | | | | $ | 118,000 | |
6. Derivatives:
The FASB issued guidance intended to enhance financial statement disclosure for derivative instruments and enable investors to understand: a) how and why a fund uses derivative investments, b) how derivative instruments are accounted for, and c) how derivative instruments affect a fund’s financial position, and results of operations.
In addition, in November 2020, the SEC adopted Rule 18f-4 under the 1940 Act to govern the use of derivatives and certain related instruments by registered investment companies. Rule 18f-4, which had a compliance date of August 19, 2022, replaced existing SEC and staff guidance with a new framework for the use of derivatives by registered investment companies. Unless a fund qualifies as a “limited derivatives user,” as defined in Rule 18f-4, Rule 18f-4 requires registered investment companies that trade derivatives and other instruments that create future payment or delivery obligations to adopt a value at-risk leverage limit and implement a derivatives risk management program. Because the Fund’s strategy involves investing in derivatives, and the Fund’s use of such derivatives does not meet the conditions applicable to the “limited user exception” in Rule 18f-4, the Fund has adopted a derivatives program that complies with the requirements of the rule. As part of this, certain officers of the Investment Adviser and the Fund serve as the “derivatives risk manager” for the Fund.
The following table presents the types of derivatives in the fund by location and as presented on the Statement of Assets and Liabilities as of December 31, 2022.
| | | Statement of Asset & Liability Presentation of Fair Values of Derivative Instruments | |
| | | Asset Derivatives | | | Liability Derivatives | |
| Underlying Risk | | Statement of Assets and Liabilities
Location | | Fair Value | | | Statement of Assets and Liabilities
Location | | Fair Value | |
| Equity | | Options purchased | | $ | - | | | Options written | | $ | (1,742,440 | ) |
The following table presents the effect of derivative instruments on the Statement of Operations for the year ended December 31, 2022.
| Statement of Operations | | Underlying Risk | | Realized Gain
(Loss) on Derivatives | | | Change in Unrealized Appreciation
(Depreciation) on Derivatives | |
| Options Purchased | | Equity | | $ | 1,843,097 | | | $ | 1,863,005 | |
| Options Written | | Equity | | | 6,446,380 | | | | 68,936 | |
| | | | | $ | 8,289,477 | | | $ | 1,931,941 | |
The average volume (based on the open positions at each month-end) of derivative activity during the year ended December 31, 2022.
| | | Options Purchased Contracts(1) | | | Options Written Contracts(1) | |
| Madison Covered Call & Equity Strategy Fund | | | 70 | | | | 10,964 | |
(1) Number of Contracts
MCN | Madison Covered Call & Equity Strategy Fund | Notes to the Financial Statements - continued | December 31, 2022
7. FEDERAL INCOME TAX INFORMATION
No provision is made for federal income taxes since it is the intention of the Fund to comply with the provisions of Subchapter M of the Internal Revenue Code of 1986 as amended, applicable to regulated investment companies and to make the requisite distribution to shareholders of taxable income, which will be sufficient to relieve it from all or substantially all federal income taxes. Due to inherent differences in the recognition of income, expenses, and realized gains/losses under GAAP and federal income tax purposes, permanent differences between book and tax basis reporting have been identified and appropriately reclassified on the Statement of Assets and Liabilities. At December 31, 2022, the aggregate gross unrealized appreciation (depreciation) and net unrealized depreciation for all securities, as computed on a federal income tax basis for the fund, were as follows:
| Cost | | $ | 176,124,515 | |
| Gross appreciation | | | 1,606,016 | |
| Gross depreciation | | | (27,009,384 | ) |
| Net depreciation | | $ | (25,403,368 | ) |
Net realized gains or losses may differ for financial reporting and tax purposes primarily as a result of the deferral of losses relating to wash sale transactions and certain market-to-market investments. For the years ended December 31, 2022, and 2021, the tax character of distributions paid to shareholders was $13,560,297 ordinary income and $1,555,487 for long-term capital gain for 2022 and $12,559,719 ordinary income and $2,532,497 for return on capital for 2021.
As of December 31, 2022, the components of distributable earnings on a tax basis were as follows:
| Fund | | Ordinary
Income | | | Long-Term
Capital Gain | | | Tax Exempt
Income | |
| Covered Call Equity Strategy | | $ | 21,292 | | | $ | - | | | $ | - | |
For all open tax years and all major jurisdictions, management of the Fund has concluded that there are no significant uncertain tax positions that would require recognition in the financial statements. Uncertain tax positions are tax positions taken or expected to be taken in the course of preparing the Fund’s tax returns that would not meet a more-likely-than not threshold of being sustained by the applicable tax authority and would be recorded as a tax expense in the current year. Open tax years are those that are open for examination by taxing authorities (i.e., generally the last four tax year ends). Furthermore, management of the Fund is also not aware of any tax positions for which it is reasonably possible that the total amounts of unrecognized tax benefits will significantly change in the next twelve months. It is the Fund’s policy to recognize accrued interest and penalties related to uncertain tax benefits in income taxes, as appropriate.
8. INVESTMENT TRANSACTIONS
During the year ended December 31, 2022, the cost of purchases and proceeds from sales of investments, excluding short-term investments, were $128,039,249 and $128,899,939 respectively. No long-term U.S. government securities were purchased or sold during the year.
9. CAPITAL
The Fund has an unlimited amount of common shares, $0.01 par value, authorized and 21,016,506 shares issued and outstanding as of December 31, 2022. During the years ended December 31, 2022 and December 31, 2021, 34,956 shares and 34,626 shares were issued and reinvested, respectively, per the Dividend Reinvestment Plan, since the Fund was trading at a premium.
MCN | Madison Covered Call & Equity Strategy Fund | Notes to the Financial Statements - continued | December 31, 2022
10. INDEMNIFICATIONS
In the normal course of business, the Fund enters into contracts that provide general indemnifications. The Fund’s maximum exposure under these arrangements is dependent upon claims that may be made against the Fund in the future and therefore cannot be estimated; however, the Fund considers the risk of material loss from such claims as remote.
11. DISCUSSION OF RISKS
Equity Risk: The value of the securities held by the Fund may decline due to general market and economic conditions, perceptions regarding the industries in which the issuers of securities held by the Fund participate, or factors relating to specific companies in which the Fund invests.
Option Risk: There are several risks associated with transactions in options on securities. For example, there are significant differences between the securities and options markets that could result in an imperfect correlation between these markets, causing a given transaction not to achieve its objectives. A decision as to whether, when and how to use options involves the exercise of skill and judgment, and even a well-conceived transaction may be unsuccessful to some degree because of market behavior or unexpected events.
As the writer of a covered call option, the Fund forgoes, during the option’s life, the opportunity to profit from increases in the market value of the security covering the call option above the sum of the premium and the strike price of the call, but retains the risk of loss should the price of the underlying security decline. The writer of an option has no control over the time when it may be required to fulfill its obligation as a writer of the option. Once an option writer has received an exercise notice, it cannot effect a closing purchase transaction in order to terminate its obligation under the option and must deliver the underlying security at the exercise price.
When the Fund writes covered put options, it bears the risk of loss if the value of the underlying stock declines below the exercise price. If the option is exercised, the Fund could incur a loss if it is required to purchase the stock underlying the put option at a price greater than the market price of the stock at the time of exercise. While the Fund’s potential gain in writing a covered put option is limited to the interest earned on the liquid assets securing the put option plus the premium received from the purchaser of the put option, the Fund risks a loss equal to the entire value of the stock.
Derivatives Risk: The risk that loss may result from investments in options, forwards, futures, swaps and other derivatives instruments. These instruments may be illiquid, difficult to price and leveraged so that small changes in the value of the underlying instruments may produce disproportionate losses to the fund. Derivatives are also subject to counterparty risk, which is the risk that the other party to the transaction will not fulfill its contractual obligations.
Industry Concentration Risk: To the extent that the Fund makes substantial investments in a single industry, the Fund will be more susceptible to adverse economic or regulatory occurrences affecting those sectors.
Fund Distribution Risk: In order to make regular quarterly distributions on its common shares, the Fund may have to sell a portion of its investment portfolio at a time when independent investment judgment may not dictate such action. In addition, the Fund’s ability to make distributions more frequently than annually from any net realized capital gains by the Fund is subject to the Fund obtaining exemptive relief from the SEC, which cannot be assured. To the extent the total quarterly distributions for a year exceed the Fund’s net investment company income and net realized capital gain for that year, the excess will generally constitute a return of the Fund’s capital to its common shareholders. Such return of capital distributions generally are tax-free up to the amount of a
MCN | Madison Covered Call & Equity Strategy Fund | Notes to the Financial Statements - continued | December 31, 2022
common shareholder’s tax basis in the common shares (generally, the amount paid for the common shares). In addition, such excess distributions will decrease the Fund’s total assets and may increase the Fund’s expense ratio.
Cybersecurity Risk: The Fund is also subject to cybersecurity risk, which includes the risks associated with computer systems, networks and devices to carry out routine business operations. These systems, networks and devices employ a variety of protections that are designed to prevent cyberattacks. Despite the various cyber protections utilized by the Fund, the Adviser, and other service providers, their systems, networks, or devices could potentially be breached. The Fund, its shareholders, and the Adviser could be negatively impacted as a result of a cybersecurity breach. The Fund cannot control the cybersecurity plans and systems put in place by service providers or any other third parties whose operations may affect the Fund.
Foreign Investment Risk: Investing in non-U.S. issuers may involve unique risks such as currency, political, and economic risks, as well as lower market liquidity, generally greater market volatility and less complete financial information than for U.S. issuers.
Mid-Cap Company Risk: Mid-cap companies often are newer or less established companies than larger companies. Investments in mid-cap companies carry additional risks because earnings of these companies tend to be less predictable; they often have limited product lines, markets, distribution channels or financial resources; and the management of such companies may be dependent upon one or a few key people. The market movements of equity securities of mid-cap companies may be more abrupt or erratic than the market movements of equity securities of larger, more established companies or the stock market in general.
Financial Leverage Risk: The Fund is authorized to utilize leverage through the issuance of preferred shares and/ or the Fund may borrow or issue debt securities for financial leveraging purposes and for temporary purposes such as settlement of transactions. Although the use of any financial leverage by the Fund may create an opportunity for increased net income, gains and capital appreciation for common shares, it also results in additional risks and can magnify the effect of any losses. If the income and gains earned on securities purchased with financial leverage proceeds are greater than the cost of financial leverage, the Fund’s return will be greater than if financial leverage had not been used. Conversely, if the income or gain from the securities purchased with such proceeds does not cover the cost of financial leverage, the return to the Fund will be less than if financial leverage had not been used. Financial leverage also increases the likelihood of greater volatility of the NAV and market price of, and dividends on, the common shares than a comparable portfolio without leverage.
U.S. and international markets have experienced and may continue to experience significant periods of volatility in recent years and months due to a number of economic, political and global macro factors including rising inflation, uncertainty regarding central banks’ interest rate increases, the possibility of a national or global recession, trade tensions, political events, the war between Russia and Ukraine and the impact of the coronavirus (COVID-19) global pandemic. As a result of continuing political tensions and armed conflicts, including the war between Ukraine and Russia, the U.S. and the European Union imposed sanctions on certain Russian individuals and companies, including certain financial institutions, and have limited certain exports and imports to and from Russia. These developments, as well as other events, could result in further market volatility and negatively affect financial asset prices, the liquidity of certain securities and the normal operations of securities exchanges and other markets, despite government efforts to address market disruptions.
Additional Risks: While investments in securities have been keystones in wealth building and management, at times these investments have produced surprises. Those who enjoyed growth and income of their investments generally were rewarded for the risks they took by investing in the markets. Although the Adviser seeks to
MCN | Madison Covered Call & Equity Strategy Fund | December 31, 2022
appropriately address and manage the risks identified and disclosed to you in connection with the management of the securities in the Fund, you should understand that the very nature of the securities markets includes the possibility that there may be additional risks of which we are not aware. We certainly seek to identify all applicable risks and then appropriately address them, take appropriate action to reasonably manage them and to make you aware of them so you can determine if they exceed your risk tolerance. Nevertheless, the often volatile nature of the securities markets and the global economy in which we work suggests that the risk of the unknown is something to consider in connection with an investment in securities. Unforeseen events could under certain circumstances produce a material loss of the value of some or all of the securities we manage for you in the Fund.
12. SUBSEQUENT EVENTS
Management has evaluated all subsequent events through the date the financial statements were issued. No events have taken place that meet the definition of a subsequent event that requires adjustment to, or disclosure in the financial statements.
MCN | Madison Covered Call & Equity Strategy Fund | December 31, 2022
Audit Opinion
REPORT OF INDEPENDENT REGISTERED PUBLIC ACCOUNTING FIRM
To the shareholders and the Board of Trustees of Madison Covered Call & Equity Strategy Fund:
Opinion on the Financial Statements and Financial Highlights
We have audited the accompanying statement of assets and liabilities of Madison Covered Call & Equity Strategy Fund (the “Fund”), including the portfolio of investments as of December 31, 2022, the related statement of operations for the year then ended, the statements of changes in net assets for each of the two years in the period then ended, the financial highlights for each of the five years in the period then ended, and the related notes. In our opinion, the financial statements and financial highlights present fairly, in all material respects, the financial position of the Fund as of December 31, 2022, and the results of its operations for the year then ended, the changes in its net assets for each of the two years in the period then ended, and the financial highlights for each of the five years in the period then ended, in conformity with accounting principles generally accepted in the United States of America.
Basis for Opinion
These financial statements and financial highlights are the responsibility of the Fund’s management. Our responsibility is to express an opinion on the Fund’s financial statements and financial highlights based on our audits. We are a public accounting firm registered with the Public Company Accounting Oversight Board (United States) (PCAOB) and are required to be independent with respect to the Fund in accordance with the U.S. federal securities laws and the applicable rules and regulations of the Securities and Exchange Commission and the PCAOB.
We conducted our audits in accordance with the standards of the PCAOB. Those standards require that we plan and perform the audit to obtain reasonable assurance about whether the financial statements and financial highlights are free of material misstatement, whether due to error or fraud. The Fund is not required to have, nor were we engaged to perform, an audit of its internal control over financial reporting. As part of our audits we are required to obtain an understanding of internal control over financial reporting but not for the purpose of expressing an opinion on the effectiveness of the Fund’s internal control over financial reporting. Accordingly, we express no such opinion.
Our audit included performing procedures to assess the risks of material misstatement of the financial statements and financial highlights, whether due to error or fraud, and performing procedures that respond to those risks. Such procedures included examining, on a test basis, evidence regarding the amounts and disclosures in the financial statements and financial highlights. Our audits also included evaluating the accounting principles used and significant estimates made by management, as well as evaluating the overall presentation of the financial statements and financial highlights. Our procedures included confirmation of securities owned as of December 31, 2022, by correspondence with the custodian and brokers. We believe that our audits provide a reasonable basis for our opinion.
/s/ Deloitte & Touche LLP
Chicago, Illinois
February 24, 2023
We have served as the auditor of one or more Madison Investment Advisors investment companies since 2009.
MCN | Madison Covered Call & Equity Strategy Fund | December 31, 2022
Fund Investment Objectives, Policies and Risks (unaudited)
Recent Changes
During the most recent fiscal year ended, there were no material changes in (i) the Fund’s investment objectives or policies that have not been approved by shareholders or (ii) in the principal risks factors associated with investment in the Fund. Furthermore there were no change in the persons primarily responsible for the day-to-day management of the Fund’s portfolio.
Investment Objective:
To provide a high level of current income and current gains, with a secondary objective of long-term capital appreciation.
Principal Investment Strategy:
The Fund invests at least 80% of its total assets in common stocks, with at least 65% of its total assets in common stocks of large capitalization issuers. The Fund may invest the remainder of its total assets in companies that meet the Fund’s growth and value criteria but whose market capitalization is considered as middle sized or “mid-cap.” The Fund will pursue its primary objective by employing an option strategy of writing (selling) a substantial amount (i.e., 80%) of covered call options on common stocks.
In addition to its covered call strategy the Fund may, to a lesser extent (not more than 20% of its total assets), pursue an option strategy that includes the sale (writing) of both put options and call options on certain of the common stocks in the Fund’s portfolio. To seek to offset some of the risk of a larger potential decline in the event the overall stock market has a sizeable short-term or intermediate-term decline, the Fund may purchase put options on certain ETFs (exchange-traded funds) that trade like common stocks but represent certain market indices such as the Nasdaq 100 or S&P 500 that correlate with the mix of common stocks held in the Fund’s portfolio.
Fundamental Policies:
The following are fundamental policies and may not be changed without the approval of a majority of the outstanding voting securities (as defined in the 1940 Act) of the Fund.
Senior Securities and Borrowing. The Fund may not issue senior securities nor borrow money, except the Fund may issue senior securities or borrow money to the extent permitted by applicable law.
Acting as Underwriter: The Fund may not act as an underwriter of securities of other issuers, except to the extent that the Fund might be considered an underwriter within the meaning of the Securities Act of 1933, as amended (the “1933 Act”) in the disposition of securities.
Industry Concentration: The Fund may not invest in any security if, as a result, 25% or more of the value of the Fund’s total assets, taken at market value at the time of each investment, are in the securities of issuers in any particular industry or group of related industries (as such terms are defined by the Fund’s Board of Trustees) except (a) excluding securities issued or guaranteed by the U.S. government and its agencies and instrumentalities or tax-exempt securities of state and municipal governments or their political subdivisions, (b) when the Fund has taken a temporary defensive position, or (c) as otherwise permitted by applicable law.
MCN | Fund Investment Objectives, Policies and Risks (unaudited) - continued | December 31, 2022
Real Estate: The Fund may not purchase or sell real estate, except that the Fund may (a) acquire or lease office space for its own use, (b) invest in securities of issuers that invest in real estate or interests therein or that are engaged in or operate in the real estate industry, (c) invest in securities that are secured by real estate or interests therein, (d) purchase and sell mortgage-related securities, (e) hold and sell real estate acquired by the Fund as a result of the ownership of securities and (f) as otherwise permitted by applicable law.
Commodities: The Fund may not purchase or sell physical commodities unless acquired as a result of ownership of securities or other instruments; provided that this restriction shall not prohibit the Fund from purchasing or selling options, futures contracts and related options thereon, forward contracts, swaps, caps, floors, collars and any other financial instruments or from investing in securities or other instruments backed by physical commodities or as otherwise permitted by applicable law.
Lending: The Fund may not make loans of money or property to any person, except (a) to the extent that securities or interests in which the Fund may invest are considered to be loans, (b) through the loan of portfolio securities in an amount up to 33% of the Fund’s total assets, (c) by engaging in repurchase agreements or as may otherwise be permitted by applicable law.
Diversification: The Fund is classified as a “diversified” investment company under the 1940 Act, which means it will limit the proportion of its total assets that may be invested in the securities of a single issuer. The Fund will not purchase more than 10% of the outstanding voting securities of any one issuer, or, with respect to 75% of its total assets, invest in securities of any one issuer if immediately after and as a result of such investment more than 5% of the total assets of the Fund would be invested in securities of such issuer.
Non-Fundamental Policies:
The following are non-fundamental policies and may be changed without the approval of a majority of the outstanding voting securities (as defined in the 1940 Act) of the Fund.
Sector Concentration: No stated sector limitation. However, MCN does not invest or intend to invest in more than 35% of its net assets in the securities of any single sector.
Single Security: The Fund may invest no more than 4% of total assets in any single security.
Mid Cap: No stated limitation, however, MCN does not intend to invest more than 35% of its net assets in mid-cap companies.
Short Sales: The Fund may not invest more than 25% of its total assets in short sales, more than 10% of its total assets in short sales of any one issuer or more than 5% of any single issuer’s voting shares in short sales.
Risks of the Fund:
The Fund is a closed-end management investment companies designed primarily as long-term investments and not as a trading vehicle. The Fund is not intended to be a complete investment program and, due to the uncertainty inherent in all investments, there can be no assurance that the Fund will achieve its investment objectives. The following are the principal risks of investing in the Fund.
Investment Risk. An investment in the Fund is subject to investment risk, including the possible loss of the entire principal amount that you invest.
Equity Risk. Substantially all of the Fund’s assets will be invested in common stocks and (to a lesser extent) preferred equity securities, and therefore a principal risk of investing in the Fund is equity risk. Equity risk is the
MCN | Fund Investment Objectives, Policies and Risks (unaudited) - continued | December 31, 2022
risk that securities held by the Fund will fall due to general market or economic conditions, perceptions regarding the industries in which the issuers of securities held by the Fund participate, and the particular circumstances and performance of particular companies whose securities the Fund holds. For example, an adverse event, such as an unfavorable earnings report, may depress the value of equity securities of an issuer held by the Fund; the price of common stock of an issuer may be particularly sensitive to general movements in the stock market; or a drop the stock market may depress the price of most or all of the common stocks and other equity securities held by the Fund. In addition, common stock of an issuer in the Fund’s portfolio may decline in price if the issuer fails to make anticipated dividend payments because, among other reasons, the issuer of the security experiences a decline in its financial condition. Common equity securities in which the Fund will invest are structurally subordinated to preferred stocks, bonds and other debt instruments in a company’s capital structure, in terms of priority to corporate income, and therefore will be subject to greater dividend risk than preferred stocks or debt instruments of such issuers. In addition, while broad market measures of common stocks have historically generated higher average returns than fixed income securities, common stocks have also experienced significantly more volatility in those returns.
Options on Securities Risk. There are several risks associated with transactions in options on securities. For example, there are significant differences between the securities and options markets that could result in an imperfect correlation between these markets, causing a given transaction not to achieve its objectives. A decision as to whether, when and how to use options involves the exercise of skill and judgment, and even a well-conceived transaction may be unsuccessful to some degree because of market behavior or unexpected events. As the writer of a covered call option, the Fund forgoes, during the option’s life, the opportunity to profit from increases in the market value of the security covering the call option above the sum of the premium and the strike price of the call, but has retained the risk of loss should the price of the underlying security decline. The writer of an option has no control over the time when it may be required to fulfill its obligation as a writer of the option. Once an option writer has received an exercise notice, it cannot effect a closing purchase transaction in order to terminate its obligation under the option and must deliver the underlying security at the exercise price.
There can be no assurance that a liquid market will exist when the Fund seeks to close out an option position. Reasons for the absence of a liquid secondary market on an exchange include the following: (i) there may be insufficient trading interest in certain options; (ii) restrictions may be imposed by an exchange on opening transactions or closing transactions or both; (iii) trading halts, suspensions or other restrictions may be imposed with respect to particular classes or series of options; (iv) unusual or unforeseen circumstances may interrupt normal operations on an exchange; (v) the facilities of an exchange or the Options Clearing Corporation (the “OCC”) may not at all times be adequate to handle current trading volume; or (vi) one or more exchanges could, for economic or other reasons, decide or be compelled at some future date to discontinue the trading of options (or a particular class or series of options). If trading were discontinued, the secondary market on that exchange (or in that class or series of options) would cease to exist. However, outstanding options on that exchange that had been issued by the OCC as a result of trades on that exchange would continue to be exercisable in accordance with their terms. The Fund’s ability to terminate over-the-counter options is more limited than with exchange-traded options and may involve the risk that broker-dealers participating in such transactions will not fulfill their obligations. If the Fund were unable to close out a covered call option that it had written on a security, it would not be able to sell the underlying security unless the option expired without exercise.
The hours of trading for options may not conform to the hours during which the underlying securities are traded. To the extent that the options markets close before the markets for the underlying securities, significant price and rate movements can take place in the underlying markets that cannot be reflected in the options markets. Call options are marked to market daily and their value will be affected by changes in the value of and dividend rates
MCN | Fund Investment Objectives, Policies and Risks (unaudited) - continued | December 31, 2022
of the underlying common stocks, an increase in interest rates, changes in the actual or perceived volatility of the stock market and the underlying common stocks and the remaining time to the options’ expiration. Additionally, the exercise price of an option may be adjusted downward before the option’s expiration as a result of the occurrence of certain corporate events affecting the underlying equity security, such as extraordinary dividends, stock splits, merger or other extraordinary distributions or events. A reduction in the exercise price of an option would reduce the Fund’s capital appreciation potential on the underlying security.
When the Fund writes covered put options, it bears the risk of loss if the value of the underlying stock declines below the exercise price. If the option is exercised, the Fund could incur a loss if it is required to purchase the stock underlying the put option at a price greater than the market price of the stock at the time of exercise. While the Fund’s potential gain in writing a covered put option is limited to the interest earned on the liquid assets securing the put option plus the premium received from the purchaser of the put option, the Fund risks a loss equal to the entire value of the stock.
To the extent that the Fund purchases options pursuant to a hedging strategy, the Fund will be subject to the following additional risks. If a put or call option purchased by the Fund is not sold when it has remaining value, and if the market price of the underlying security remains equal to or greater than the exercise price (in the case of a put), or remains less than or equal to the exercise price (in the case of a call), the Fund will lose its entire investment in the option. Also, where a put or call option on a particular security is purchased to hedge against price movements in a related security, the price of the put or call option may move more or less than the price of the related security. If restrictions on exercise were imposed, the Fund might be unable to exercise an option it had purchased. If the Fund were unable to close out an option that it had purchased on a security, it would have to exercise the option in order to realize any profit or the option may expire worthless.
Limitation of Option Writing Risk. The number of call options the Fund can write is limited by the number of shares of common stock the Fund holds, and further limited by the fact that call options represent 100 share lots of the underlying common stock. The Fund will not write “naked” or uncovered call options. Furthermore, the Fund’s options transactions will be subject to limitations established by each of the exchanges, boards of trade or other trading facilities on which such options are traded. These limitations govern the maximum number of options in each class which may be written or purchased by a single investor or group of investors acting in concert, regardless of whether the options are written or purchased on the same or different exchanges, boards of trade or other trading facilities or are held or written in one or more accounts or through one or more brokers. Thus, the number of options which the Fund may write or purchase may be affected by options written or purchased by other investment advisory clients of the Adviser. An exchange, board of trade or other trading facility may order the liquidation of positions found to be in excess of these limits, and it may impose certain other sanctions.
Mid-Cap Companies Risk. Mid-cap companies often are newer or less established companies than larger companies. Investments in mid-cap companies carry additional risks because earnings of these companies tend to be less predictable; they often have limited product lines, markets, distribution channels or financial resources; and the management of such companies may be dependent upon one or a few key people. The market movements of equity securities of mid-cap companies may be more abrupt or erratic than the market movements of equity securities of larger, more established companies or the stock market in general. Historically, mid-cap companies have sometimes gone through extended periods when they did not perform as well as larger companies. In addition, equity securities of mid-cap companies generally are less liquid than those of larger companies. This means that the Fund could have greater difficulty selling such securities at the time and price that the Fund would like.
MCN | Fund Investment Objectives, Policies and Risks (unaudited) - continued | December 31, 2022
Income Risk. The income common shareholders receive from the Fund is based primarily on the premiums the Fund receives from writing options as well as the dividends and interest it earns from its investments, which can vary widely over the short- and long- term. If prevailing market interest rates drop, distribution rates of the Fund’s portfolio holdings of preferred securities and debt securities may decline which then may adversely affect the Fund’s distributions on common shares as well. The Fund’s income also would likely be affected adversely when prevailing short-term interest rates increase at any time during which the Fund is utilizing financial leverage.
Foreign Securities Risk. Investments in non-U.S. issuers may involve unique risks compared to investing in securities of U.S. issuers. These risks are more pronounced to the extent that the Fund invests a significant portion of its non-U.S. investments in one region or in the securities of emerging market issuers. These risks may include: less information about non-U.S. issuers or markets may be available due to less rigorous disclosure or accounting standards or regulatory practices; many non-U.S. markets are smaller, less liquid and more volatile; in a changing market, the Adviser may not be able to sell the Fund’s portfolio securities at times, in amounts and at prices it considers desirable; the economies of non-U.S. countries may grow at slower rates than expected or may experience downturns or recessions; economic, political and social developments may adversely affect the securities markets; and withholding and other non-U.S. taxes may decrease the Fund’s return.
Derivatives Risk. In addition to the risks associated with its option strategies, the Fund may, but is not required or expected to any significant extent, participate in certain derivative transactions. Such transactions entail certain execution, market, liquidity, hedging and tax risks. Participation in the options or futures markets involves investment risks and transaction costs to which the Fund would not be subject absent the use of these strategies. If the Adviser’s prediction of movements in the direction of the securities and interest rate markets is inaccurate, the consequences to the Fund may leave the Fund in a worse position than if it had not used such strategies.
Illiquid Securities Risk. Although the Fund does not anticipate doing so to any significant extent, the Fund may invest in securities for which there is no readily available trading market or are otherwise illiquid. It may be difficult to sell such securities at a price representing the fair value and where registration is required, a considerable period may elapse between a decision to sell the securities and the time when the Fund would be permitted to sell.
Fund Distribution Risk. Pursuant to its distribution policy, the Fund intends to make regular quarterly distributions on its common shares. In order to make such distributions, the Fund may have to sell a portion of its investment portfolio at a time when independent investment judgment may not dictate such action. In addition, the Fund’s ability to make distributions more frequently than annually from any net realized capital gains by the Fund is subject to the Fund obtaining exemptive relief from the SEC, which cannot be assured. To the extent the total quarterly distributions for a year exceed the Fund’s net investment company income and net realized capital gain for that year, the excess will generally constitute a return of capital. Such return of capital distributions generally are tax- free up to the amount of a common shareholder’s tax basis in the common shares (generally, the amount paid for the common shares). In addition, such excess distributions will decrease the Fund’s total assets and may increase the Fund’s expense ratio.
Market Discount Risk. Whether investors will realize gains or losses upon the sale of shares of the Fund will depend upon the market price of the shares at the time of sale, which may be less or more than the Fund’s net asset value per share. Since the market price of the shares will be affected by such factors as the relative demand for and supply of the shares in the market, general market and economic conditions and other factors beyond the control of the Fund, the Fund cannot predict whether the shares will trade at, below or above net asset value or at, below or above the public offering price. Shares of closed-end funds often trade at a discount to their net asset values, and the Fund’s shares have in the past and may in the future trade at such a discount. The shares of the
MCN | Fund Investment Objectives, Policies and Risks (unaudited) - continued | December 31, 2022
Fund were designed primarily for long-term investors, and investors in the shares should not view the Fund as a vehicle for trading purposes.
Other Investment Companies Risk. The Fund may invest up to 10% of the Fund’s total assets in securities of other open- or closed-end investment companies, including ETFs, which invest primarily in securities of the types in which the Fund may invest directly. The Fund expects that these investments will be primarily in ETFs. As a stockholder in an investment company, the Fund will bear its ratable share of that investment company’s expenses, and would remain subject to payment of the Fund’s investment management fees with respect to the assets so invested. Common shareholders would therefore be subject to duplicative expenses to the extent the Fund invests in other investment companies.
Rule 12d1-4 of the 1940 Act provides an exemption from Section 12(d)(1) that allows a fund to invest all of its assets in other registered funds, including ETFs, if the fund satisfies certain conditions specified in the Rule, including, among other conditions, that the funds and their advisory group will not control (individually or in the aggregate) an acquired fund (e.g., hold more than 25% of the outstanding voting securities of an acquired fund that is a registered open-end management investment company). However, such control and other conditions under Rule 12d1-4 do not apply if either and acquiring fund is in the same group of investment companies as the acquired fund, or the acquiring fund’s subadviser or an affiliate is the acquired fund’s adviser.
Financial Leverage Risk. Although the Fund has no current intention to do so, the Fund is authorized to utilize leverage through the issuance of preferred shares and/or the Fund may borrow or issue debt securities for financial leveraging purposes and for temporary purposes such as settlement of transactions. Any such financial leverage would be limited to an amount up to 20% of the Fund’s total assets (including the proceeds of such financial leverage). Although the use of any financial leverage by the Fund may create an opportunity for increased net income, gains and capital appreciation for the common shares, it also results in additional risks and can magnify the effect of any losses. If financial leverage is utilized, there is no guarantee that it will be successful in enhancing the level of the Fund’s current income. If the income and gains earned on securities purchased with financial leverage proceeds are greater than the cost of financial leverage, then the Fund’s return will be greater than if financial leverage had not been used. Conversely, if the income or gain from the securities purchased with such proceeds does not cover the cost of financial leverage, the return to the Fund will be less than if financial leverage had not been used. Financial leverage also increases the likelihood of greater volatility of NAV and market price of and dividends on the common shares than a comparable portfolio without leverage.
Management Risk. The Fund is subject to management risk because it is an actively managed portfolio. In acting as the Fund’s investment manager of its portfolio securities, the Adviser will apply investment techniques and risk analyses in making investment decisions for the Fund, but there can be no guarantee that these will produce the desired results.
Recent Market Events: U.S. and international markets have experienced volatility in recent months and years due to a number of economic, political and global macro factors, including the impact of the coronavirus (COVID-19) global pandemic, which resulted in a public health crisis, business interruptions, growth concerns in the U.S. and overseas, travel restrictions, changed social behaviors, rising inflation and reduced consumer spending. While several countries, including the U.S., have begun to lift public health restrictions in efforts to reopen their respective economies, the outbreak of new variants has led to the renewal of health mandates by local governments and businesses, event cancellations and additional travel restrictions, supply chain shortages, cessation of return-to-office plans and an overall economic slowdown. While U.S. and global economies are recovering from the effects of COVID-19, the recovery is proceeding at slower than expected rates and may last for a prolonged period of time. In addition, the impact and spread of infectious diseases in developing or emerging market countries may cause relatively greater strain on those countries’ healthcare systems than
MCN | Fund Investment Objectives, Policies and Risks (unaudited) - continued | December 31, 2022
those in developed countries. Continuing uncertainties regarding inflation, interest rates, political events, rising government debt in the U.S. and trade tensions have also contributed to market volatility. Global economies and financial markets are increasingly interconnected, which increases the possibility that conditions in one country or region might adversely impact issuers in a different country or region. In particular, a rise in protectionist trade policies, slowing global economic growth, risks associated with epidemic and pandemic diseases, risks associated with the departure of the United Kingdom from the European Union, the risk of trade disputes, and the possibility of changes to some international trade agreements, could affect the economies of many nations, including the United States, in ways that cannot necessarily be foreseen at the present time. Continuing market volatility as a result of recent market conditions or other events may have adverse effects on your account. Madison will monitor developments and seek to manage the Fund in a manner consistent with achieving the Fund’s investment objective, but there can be no assurance that they will be successful in doing so.
Cybersecurity Risk. The Fund is also subject to cybersecurity risk, which includes the risks associated with computer systems, networks and devices to carry out routine business operations. These systems, networks and devices employ a variety of protections that are designed to prevent cyberattacks. Despite the various cyber protections utilized by the Fund, the Adviser, and other service providers, their systems, networks, or devices could potentially be breached. The Fund, its shareholders, and the Adviser could be negatively impacted as a result of a cybersecurity breach. The Fund cannot control the cybersecurity plans and systems put in place by service providers or any other third parties whose operations may affect the Fund. The Fund does monitor this risk closely.
Repurchase Agreement Risk. The Fund bears a risk of loss in the event that the other party to a repurchase agreement defaults on its obligations and the Fund is delayed in or prevented from exercising its rights to dispose of the collateral securities, including the risk of a possible decline in the value of the underlying securities during the period in which it seeks to assert these rights.
Reverse Repurchase Agreement Risk. Reverse repurchase agreements involve the risk that the market value of the securities acquired in connection with the reverse repurchase agreement may decline below the price of the securities the Fund has sold but is obligated to repurchase. Also, reverse repurchase agreements involve the risk that the market value of the securities retained in lieu of sale by the Fund in connection with the reverse repurchase agreement may decline in price. If the buyer of securities under a reverse repurchase agreement files for bankruptcy or becomes insolvent, such buyer or its trustee or receiver may receive an extension of time to determine whether to enforce the Fund’s obligation to repurchase the securities, and the Fund’s use of the proceeds of the reverse repurchase agreement may effectively be restricted pending such decision. Also, the Fund would bear the risk of loss to the extent that the proceeds of the reverse repurchase agreement are less than the value of the securities subject to such agreement.
Securities Lending Risk. Although the Fund has no current intention to do so, the Fund has the authority to lend its portfolio securities. If the Fund lends its portfolio securities, it may not be able to get them back from the borrower on a timely basis, in which case the Fund may lose certain investment opportunities, as well as the opportunity to vote the securities. The Fund also is subject to the risks associated with the investment of cash collateral, usually fixed income securities risk. If the Fund receives a payment from a borrower in lieu of the dividends on the loaned securities, such payment will generally be taxed as ordinary income for federal income tax purposes and will not be treated as “qualified dividend income.”
Temporary Defensive Position Risk. In moving to a substantial temporary investments position and in transitioning from such a position back into full conformity with the Fund’s normal investment objectives and policies, the Fund may incur transaction costs that would not be incurred if the Fund had remained fully invested in accordance with such normal policies.
MCN | Madison Covered Call & Equity Strategy Fund | December 31, 2022
Other Information (unaudited)
Federal Income Tax Information. The Fund did not recognize qualified dividend income during the fiscal year ended December 31, 2022. The Fund intends to designate the maximum amount of dividends that qualify for the reduced tax rate pursuant to the Jobs and Growth Tax Relief Reconciliation Act of 2003. For corporate shareholders, 14.61% of the dividends paid by the Fund qualifies for the dividends-received deduction.
Complete information regarding the federal tax status of the distributions received during the calendar year 2022 will be reported in conjunction with Form 1099-DIV.
Results of Shareholder Vote. The Annual Meeting of shareholders of the Fund was held on August 26, 2022. Shareholders voted on the election of one Class III Trustee to serve until the 2025 Annual Meeting of Shareholders. The number of shares of the Fund as of June 23, 2022, the “record date,” issued and outstanding and entitled to vote were 20,989,163.
Proposal 1. Election of Class III Trustee. Proposal 1 received the requisite votes and was approved. At the Annual Meeting, the holders of 16,975,653 shares (80.88%) were represented in person or by proxy, constituting a quorum. The Class III nominee for Trustee for election by shareholders received the following votes:
| Fund’s Nominee | | For | | Withheld |
| Steven P. Riege | | 16,513,338 | | 462,315 |
ADDITIONAL INFORMATION. Notice is hereby given in accordance with Section 23(c) of the 1940 Act that from time to time, the Fund may purchase shares of its common stock in the open market at prevailing market prices.
This report is sent to shareholders of the Fund for their information. It is not a prospectus, circular or representation intended for use in the purchase or sale of shares of the Fund or any securities mentioned in this report.
AVAILABILITY OF QUARTERLY PORTFOLIO SCHEDULES
The Fund files a complete schedule of portfolio holdings with the SEC for the first and third quarters of each fiscal year on Form NPORT-EX. Form NPORT-EX is available upon request to shareholders at no cost on the Fund’s website at www.madisonfunds.com, on the SEC’s website at www.sec.gov, or by calling 1-800-767-0300. Form NPORT-EX may also be reviewed and copied at the SEC’s Public Reference Room in Washington, DC. More information on the operation of the Public Reference Room may be obtained by calling 1-800-SEC-0330.
PROXY VOTING POLICIES, PROCEDURES AND RECORDS
A description of the policies and procedures used by the Fund to vote proxies related to portfolio securities is available to shareholders at no cost on the Funds’ website at www.madisonfunds.com or upon request by calling 1-800-767-0300 or on the SEC’s website at www.sec.gov. The proxy voting records for the Funds for the most recent twelve-month year ended June 30 are available to shareholders at no cost upon request by calling 1-800-767-0300 or on the SEC’s website at www.sec.gov.
FORWARD-LOOKING STATEMENT DISCLOSURE
One of our most important responsibilities as investment company managers is to communicate with shareholders in an open and direct manner. Some of our comments in the “Management’s Discussion of Fund Performance” are based on current management expectations and are considered “forward-looking statements.” Actual future results, however, may prove to be different from our expectations. You can identify forward-looking statements by words such as estimate, may, will, expect, believe, plan and other similar terms. We cannot promise future returns. Our opinions are a reflection of our best judgment at the time this report is compiled, and we disclaim any obligation to update or alter forward-looking statements as a result of new information, future events, or otherwise.
MCN | Madison Covered Call & Equity Strategy Fund | Other Information (unaudited) - continued | December 31, 2022
Discussion of Contract Renewal Process and Considerations:
At a meeting of the Board of Trustees (the “Board” or “Trustees”) of the Madison Covered Call & Equity Strategy Fund (the “Trust”) held on August 9, 2022, the Board, and by a separate vote, the Independent Trustees of the Trust, approved the continuance of the Investment Advisory Agreement (the “Agreement”) between the Trust and Madison Asset Management, LLC (the “Adviser”).
In determining whether to approve the continuation of the Investment Advisory Agreement, the Adviser furnished information necessary for a majority of the Independent Trustees to make the determination that the continuance of the Agreement was in the best interests of the Trust and its shareholders. The information provided to the Board included: (1) data comparing management fees and expense ratios of comparable investment companies; (2) comparative performance information; (3) the Adviser’s and its affiliates’ revenues and costs of providing services to the Trust; and (4) information about the Adviser’s personnel. Prior to voting, the Independent Trustees reviewed the proposed continuance of the Agreement with management and independent legal counsel to the Independent Trustees and received materials from such counsel discussing the legal standards for their consideration of the proposed continuation of the Agreement. The Independent Trustees also reviewed the proposed continuation of the Agreement with independent legal counsel in a private session at which no representatives of management were present. The Independent Trustees made a variety of additional inquiries regarding the written materials provided by the Adviser and discussed the Adviser’s responses thereto with independence legal counsel in advance of the meeting.
In approving the continuance of the Investment Advisory Agreement, the Board considered various factors, among them: (1) the nature, extent and quality of services provided by the Adviser; (2) the investment performance of the Trust; (3) the costs of the services to be provided and the profits to be realized by the Adviser and their respective affiliates; (4) economies of scale; and (5) the terms of the Agreement. The Board’s analysis of these factors is set forth below. The Independent Trustees were advised by independent legal counsel throughout the process.
With regard to the nature, extent and quality of the services to be provided by the Adviser, the Board reviewed the biographies and tenure of the personnel involved in Trust management and the experience of the Adviser and its affiliates as investment manager to other investment companies with similar investment strategies or to individual clients or institutions with similar investment strategies. They recognized the wide array of investment professionals employed by the Adviser, and their varying levels of experience and qualifications. Representatives of the Adviser discussed or otherwise presented their investment philosophies and strategies intended to provide investment performance consistent with the Trust’s investment objectives in a variety of market environments. The Trustees also noted their familiarity with the Adviser, due to the Adviser’s long history of providing advisory services to the Trust and other funds which are managed by the Adviser and which they oversee.
The Board also discussed the quality of services provided to the Trust by its transfer agent, sub-administrator and custodian as well as the various administrative services provided directly by the Adviser.
Based on their review of the information provided, the Board determined that the nature, extent and quality of services provided by the Adviser to the Trust were satisfactory.
With regard to the investment performance of the Trust and the investment adviser, the Board reviewed current performance information provided in the written Board materials. They discussed the reasons for both outperformance and underperformance compared with peer groups and applicable indices and benchmarks. They recognized that the usefulness of comparative performance data as a frame of reference to measure the Trust’s performance may be limited because the performance peer group, among other things, may not precisely reflect the objectives and strategies of the Trust, may have a different investable universe, or the composition of the peer
MCN | Madison Covered Call & Equity Strategy Fund | Other Information (unaudited) - continued | December 31, 2022
group may be limited in size or number as well as other factors. They reviewed both long-term and short-term performance, recognizing that the performance data reflects a snapshot in time, in this case as of the end of the most recent calendar year or quarter. They considered that a different performance period, however, could generate significantly different results. Further, they noted that long-term performance can be adversely affected by even one period of significant underperformance so that a single investment decision or theme has the ability to disproportionately affect long-term performance.
The Board also noted that on a quarterly basis, they review detailed information for the Trust, including investment performance results, portfolio composition and investment philosophies, processes, and strategies. In addition, the Board also considered the Adviser’s quarterly portfolio commentary and discussion of the Trust’s performance, as well as the Investment Risk Oversight Committee’s overviews. They also considered whether any relative underperformance was appropriate in view of the Adviser’s conservative investment philosophy. The Board noted the type of market environments that favor the Trust’s strategies and discussed the Trust’s performance in such market environments. Representatives of the Adviser discussed with the Board the methodology for arriving at peer groups and indices used for performance comparisons which, with respect to peer groups, followed the same process as the prior year. The Board also considered that sometimes, the Morningstar categories the Trust falls into do not precisely match the Trust’s investment strategy and philosophy. Based on their review, the Board determined that, given the totality of the above factors and considerations, the Trust’s overall investment performance had been satisfactory.
With regard to the costs of the services to be provided and the profits to be realized by the investment adviser from the relationship with the Trust, the Board reviewed the expense ratios for a variety of other funds in the Trust’s peer group with similar investment objectives. Like the performance comparisons described above, the expense comparisons followed the same methodology as last year in terms of peer group selection.
The Board noted that the Adviser or its affiliates provided investment management services to other investment company and/or non-investment company clients and considered the advisory fees charged by the Adviser to such funds and clients for purposes of determining whether the given advisory fee was disproportionately large under the so-called Gartenberg standard traditionally used by investment company boards in connection with advisory contract renewal considerations. The Board took those fees into account and considered the differences in services and time required by the various types of funds and clients to which the Adviser provided services. The Board recognized that significant differences may exist between the services provided to one type of fund or client and those provided to others, such as those resulting from the additional compliance and regulatory work associated with managing a 1940 Act fund. The Board gave such comparisons the weight that they merit in light of the similarities and differences between the services that the various funds and clients require. They considered that, if the services rendered by the Adviser to one type of fund or client differed significantly from others, then the comparison should be given less weight. In the case of non-investment company clients for which the Adviser acts as an investment adviser, the Board noted that the fee may be lower than the fee charged to the Trust. The Board noted too the various administrative, operational, compliance, legal and corporate communication services required to be handled by the Adviser which are performed for investment company clients but are not typically performed for non-investment company clients.
The Trustees compared the Trust’s total expense ratio and advisory fee to those of comparable funds with similar investment objectives and strategies. The Board noted the relatively simple expense structure maintained by the Trust, an advisory fee and a capped administrative “services” fee, plus expenses for Trustee compensation which are
MCN | Madison Covered Call & Equity Strategy Fund | Other Information (unaudited) - continued | December 31, 2022
not covered by the administrative services fee. The Board reviewed total expense ratios paid by other funds with similar investment objectives and asset size, recognizing that such a comparison, while not dispositive, was an important consideration.
With regard to the administrative services provided by the Adviser under a separate Services Agreement with the Trust (the “Services Agreement”), the Board acknowledged that the Adviser is compensated for the administrative services it provides or arranges to provide to the Trust and that such compensation does not always cover all costs incurred by the Adviser because the Services Agreement effectively acts as a cap on administrative expenses. Therefore, the Board recognized that some of the administrative, operational, regulatory or compliance fees or costs in excess of the Services Agreement fees are paid by the Adviser from investment advisory fees earned. In this regard, the Trustees noted that examination of the Trust’s total expense ratio compared to those of other investment companies was more meaningful than a simple comparison of basic “investment management only” fee schedules.
Following their review, the Board concluded that the costs for services provided by, and the level of profitability to, the Adviser with respect to the Investment Advisory and Services Agreement were reasonable considering the services provided.
With regard to the extent to which economies of scale would be realized as the Trust’s assets increase, because the Trust is a closed-end fund, it is unlikely that the size of the Trust will increase over time (other than through appreciation of its investments). Nevertheless, the Trustees recognized that at its current asset level, it was premature to discuss any economies of scale not already factored into the compensation payable under the existing Investment Advisory and Services Agreement.
Counsel to the Independent Trustees confirmed that the Trust’s Independent Trustees had met previously and reviewed the written materials provided by the Adviser, including responses to supplemental questioned posed by the Independent Trustees in advance of the meeting. Counsel noted that the Independent Trustees had considered such materials in light of the Gartenberg standard as well as criteria either set forth or discussed in the Supreme Court decision in Jones v. Harris regarding the investment company contract renewal process under Section 15(c) of the Investment Company Act of 1940, as amended. The Independent Trustees made several additional inquiries regarding such written materials to the Adviser and representatives of the Adviser provided satisfactory responses thereto.
In considering the renewal of the Investment Advisory and Services Agreements, the Board, including the Independent Trustees, did not identify any single factor as controlling, and each Trustee may have attributed different weights to the various factors. The Board reached the following conclusions regarding the Trust’s Investment Advisory and Services Agreements, among others: (a) the Adviser demonstrated that it possesses the capability and resources to perform the duties required of it under the Investment Advisory and Services Agreements; (b) the Adviser is qualified to manage the Trust’s assets in accordance with the Trust’s investment objectives and strategies; (c) the overall investment performance of the Trust is satisfactory relative to the performance of funds with similar investment objectives and relevant indices and benchmarks; (d) the Trust’s advisory and services fees are reasonable in light of the services received by the Trust from the Adviser and other factors considered; and (e) the Adviser’s investment strategies are appropriate for pursuing the investment objectives of the Trust. Based on the foregoing conclusions, the Board determined that continuation of the Investment Advisory Agreement with the Adviser was in the best interests of the Trust and its shareholders. Moreover, the Board determined that renewal of the Services Agreement for the Trust was in the best interests of the Trust and its shareholders.
MCN | Madison Covered Call & Equity Strategy Fund | December 31, 2022
Trustees and Officers
The address of each Trustee and Officer of the fund is 550 Science Drive, Madison, Wisconsin 53711
Interested Trustees and Officers
| Name and Age | Position(s) Held
and Length of Time
Served | Principal Occupation(s) During Past Five Years | Portfolios
Overseen in
Fund Complex
by Director/
Trustee1 | Other
Directorships
Held by Trustee |
| | | | | |
| Paul A. Lefurgey2 58 | Class II Trustee, since 2021, to serve until 2024 Vice President, 2012 – Present | Madison Investment Holdings, Inc. (“MIH”), Madison Asset Management, LLC (“Madison”) and Madison Investment Advisors, LLC (“MIA”), Co-Head of Investments, 2022 – Present; CEO, 2017 – 2021; Co-Head of Fixed Income, 2019 – 2021; Director of Fixed Income Investments, 2016 – 2019; Executive Director and Head of Fixed Income Investments, 2013 – 2016; Chairman - Executive Committee, 2015 – 2017 Madison Funds (15 mutual funds) and Ultra Series Fund (14 mutual funds), Vice President, 2009 – Present; Madison Strategic Sector Premium Fund, Vice President, 2010 – 2018 | 30 | Madison Funds (15), 2020 – Present Ultra Series Fund (14), 2022 – Present |
| | | | | |
| Patrick F. Ryan 43 | President, 2020 – Present | MIH, Madison and MIA, Head of Multi-Asset Solutions and Portfolio Manager, 2018 – Present; Co-Head of Multi-Asset Solutions and Portfolio Manager, 2016 – 2017 Madison Funds (15) and Ultra Series Fund (14), President, 2020 – Present | N/A | N/A |
| | | | | |
| Greg D. Hoppe 53 | Vice President, 2020 – Present; Chief Financial Officer, 2019 – Present; Treasurer, 2012 – 2019 | MIH and MIA, Vice President, 1999 – Present; Madison, Vice President, 2009 – Present Madison Funds (15) and Ultra Series Fund (14), Vice President, 2020 – Present, Chief Financial Officer, 2019 – Present, Treasurer, 2009 – 2019; Madison Strategic Sector Premium Fund, Treasurer, 2009 – 2018 | N/A | N/A |
| | | | | |
| Holly S. Baggot 62 | Secretary and Assistant Treasurer, 2012 – Present | MIH and MIA, Vice President, 2010 – Present; Madison, Vice President, 2009 – Present; MFD Distributor, LLC (“MFD”) (an affiliated brokerage firm of Madison), Vice President, 2012 – Present | N/A | N/A |
| | | | | |
| | | Madison Funds (15) and Ultra Series Fund (14), Secretary, 1999 – Present, Assistant Treasurer, 1999 – 2007 and 2009 – Present and Anti-Money Laundering Officer, 2019 – 2020; Madison Strategic Sector Premium Fund, Secretary and Assistant Treasurer, 2010 – 2018 | | |
MCN | Madison Covered Call & Equity Strategy Fund | Trustees and Officers - continued | December 31, 2022
| Name and Age | Position(s) Held
and Length of Time
Served | Principal Occupation(s) During Past Five Years | Portfolios
Overseen in
Fund Complex
by Director/
Trustee1 | Other
Directorships
Held by Trustee |
| | | | | |
| Steve J. Fredricks 52 | Chief Compliance Officer and Assistant Secretary, 2018 – Present | MIH, MIA and Madison, Chief Legal Officer, 2020 – Present; Chief Compliance Officer, 2018 – Present | N/A | N/A |
| | | Madison Funds (15) and Ultra Series Fund (14), Chief Compliance Officer and Assistant Secretary, 2018 – Present; Madison Strategic Sector Premium Fund, Chief Compliance Officer during 2018 Jackson National Asset Management, LLC, Senior Vice President and Chief Compliance Officer, 2005 – 2018 | | |
| | | | | |
| Terri Wilhelm 54 | Assistant Secretary, 2022 – Present | MIH, MIA and Madison, Senior Compliance Analyst, September 2022 – Present | N/A | N/A |
| | | | | |
| | | Ultra Series Fund (14) and Madison Covered Call & Equity Strategy Fund, Assistant Secretary, November 2022 – Present | | |
| | | | | |
| | | State of Wisconsin Investment Board, Senior Paralegal, 2017 – 2022 | | |
1 As of the date of this report, the fund complex consists of the Fund, the Madison Funds with 15 portfolios and the Ultra Series Fund with 14 portfolios, for a grand total of 30 separate portfolios in the fund complex.
2 “Interested person” as defined in the 1940 Act. Considered an interested Trustee because of the position held with the investment adviser of Madison Funds.
MCN | Madison Covered Call & Equity Strategy Fund | Trustees and Officers - continued | December 31, 2022
Independent Trustees
| Name and Age | Position(s) Held, First Elected and Term of Office1 | Principal Occupation(s) During Past Five Years | Portfolios Overseen in Fund Complex2 | Other Directorships held by Trustee |
| | | | | |
| Richard E. Struthers 70 | Class I Trustee, since 2017, to serve until 2026 | Clearwater Capital Management (investment advisory firm), Naples, FL, Chair and Chief Executive Officer, 1998 – Present | 30 | Madison Funds (15) and Ultra Series Fund (14), 2004 – Present |
| | | | | |
| | | Park Nicollet Health Services, Minneapolis, MN, Chairman, Finance and Investment Committee, 2006 – 2012 | | |
| | | | | |
| Scott C. Jones 60 | Class II Trustee, since 2021, to serve until 2024 | Managing Director, Carne Global Financial Services (US) LLC (a provider of independent governance and distribution support for the asset management industry), 2013 – Present Managing Director, Park Agency, Inc., 2020 – Present | 16 | XAI Octagon Floating Rate & Alternative Income Term Trust, 2017 – Present Manager Directed Portfolios (open-end fund family, 9 portfolios), 2016 – Present and Lead Independent Trustee since 2017 |
| | | | | |
| | | | | Madison Funds (15), 2019 – Present |
| | | | | |
| Steven P. Riege 68 | Class III Trustee, since 2015, to serve until 2025 | Ovation Leadership (management consulting), Milwaukee, WI, Owner/President, 2001 – Present Robert W. Baird & Company (financial services), Milwaukee, WI, Senior Vice President- Marketing and Vice President-Human Resources, 1986 – 2001 | 30 | Madison Funds (15) and Ultra Series Fund (14), 2005 – Present |
1 A Trustee must retire at the end of the calendar year in which the first of the following two events occurs: (1) they attain the age of seventy-six (76), or (2) they have served on the Board for a total of fifteen (15) years, subject in the latter case to extension by unanimous vote of the remaining Trustees on an annual basis. The fifteen (15) year term limitation shall commence on the later of April 19, 2013 or the date of the Trustee’s initial election or appointment as a trustee. Board terms end on December 31 of the year noted.
2 As of the date of this report, the fund complex consists of the Fund, the Madison Funds with 15 portfolios and the Ultra Series Fund with 14 portfolios, for a grand total of 30 separate portfolios in the fund complex.
MCN | Madison Covered Call & Equity Strategy Fund | December 31, 2022
Dividend Reinvestment Plan
Unless the registered owner of common shares elects to receive cash by contacting Computershare Trust Company, Inc. (the “Plan Administrator”), all distributions declared on common shares of the Fund will be automatically reinvested by the Plan Administrator in the Fund’s Dividend Reinvestment Plan (the “Plan”) in additional common shares of the Fund. Participation in the Plan is completely voluntary and may be terminated or resumed at any time without penalty by notice if received and processed by the Plan Administrator prior to the distribution record date; otherwise such termination or resumption will be effective with respect to any subsequently declared dividend or other distribution. Some brokers may automatically elect to receive cash on your behalf and may re-invest that cash in additional common shares of the Fund for you. If you wish for all distributions declared on your common shares of the Fund to be automatically reinvested pursuant to the Plan, please contact your broker.
The Plan Administrator will open an account for each common shareholder under the Plan in the same name in which such common shareholder’s common shares are registered. Whenever the Fund declares a dividend or other distribution (together, a “Distribution”) payable in cash, non-participants in the Plan will receive cash and participants in the Plan will receive the equivalent in common shares. The common shares will be acquired by the Plan Administrator for the participants’ accounts, depending upon the circumstances described below, either (i) through receipt of additional unissued but authorized common shares from the Fund (“Newly Issued Common Shares”) or (ii) by purchase of outstanding common shares on the open market (“Open-Market Purchases”) on the New York Stock Exchange or elsewhere. If, on the payment date for any Distribution, the closing market price plus estimated brokerage commission per common share is equal to or greater than the net asset value per common share, the Plan Administrator will invest the Distribution amount in Newly Issued Common Shares on behalf of the participants. The number of Newly Issued Common Shares to be credited to each participant’s account will be determined by dividing the dollar amount of the Distribution by the net asset value per common share on the payment date; provided that, if the net asset value is less than or equal to 95% of the closing market value on the payment date, the dollar amount of the Distribution will be divided by 95% of the closing market price per common share on the payment date. If, on the payment date for any Distribution, the net asset value per common share is greater than the closing market value plus estimated brokerage commission, the Plan Administrator will invest the Distribution amount in common shares acquired on behalf of the participants in Open-Market Purchases.
If, before the Plan Administrator has completed its Open-Market Purchases, the market price per common share exceeds the net asset value per common share, the average per common share purchase price paid by the Plan Administrator may exceed the net asset value of the common shares, resulting in the acquisition of fewer common shares than if the Distribution had been paid in Newly Issued Common Shares on the Distribution payment date. Because of the foregoing difficulty with respect to Open-Market Purchases, the Plan provides that if the Plan Administrator is unable to invest the full Distribution amount in Open-Market Purchases during the purchase period or if the market discount shifts to a market premium during the purchase period, the Plan Administrator may cease making Open-Market Purchases and may invest the uninvested portion of the Distribution amount in Newly Issued Common Shares at net asset value per common share at the close of business on the Last Purchase Date provided that, if the net asset value is less than or equal to 95% of the then current market price per common share; the dollar amount of the Distribution will be divided by 95% of the market price on the payment date.
The Plan Administrator maintains all shareholders’ accounts in the Plan and furnishes written confirmation of all transactions in the accounts, including information needed by shareholders for tax records. Common shares in the account of each Plan participant will be held by the Plan Administrator on behalf of the Plan participant, and each
MCN | Madison Covered Call & Equity Strategy Fund | Dividend Reinvestment Plan - continued | December 31, 2022
shareholder proxy will include those shares purchased or received pursuant to the Plan. The Plan Administrator will forward all proxy solicitation materials to participants and vote proxies for shares held under the Plan in accordance with the instruction of the participants.
There will be no brokerage charges with respect to common shares issued directly by the Fund. However, each participant will pay a pro rata share of brokerage commission incurred in connection with Open-Market Purchases. The automatic reinvestment of Distributions will not relieve participants of any Federal, state or local income tax that may be payable (or required to be withheld) on such Distributions.
The Fund reserves the right to amend or terminate the Plan. There is no direct service charge to participants with regard to purchases in the Plan; however, the Fund reserves the right to amend the Plan to include a service charge payable by the participants
All correspondence or questions concerning the Plan should be directed to the Plan Administrator, Computershare Trust Company, N.A., P.O. Box 505000, Louisville, KY 40233, Phone Number: 1-781-575-4523.
This page intentionally left blank.
39
This page intentionally left blank.
40

MCN-AR-1222
Item 2. Code of Ethics.
(a) The Madison Covered Call & Equity Strategy Fund (hereinafter referred to either as the "Trust" or the "Fund") has adopted a code of ethics that applies to the Trust’s principal executive officer, principal financial officer, principal accounting officer or controller or persons performing similar functions, regardless of whether these individuals are employed by the Trust or a third party. The code was adopted effective January 1, 2013.
(c) During the period covered by this report, registrant did not make any substantive amendments to the Code.
(d) The Trust granted no waivers from the code during the period covered by this report.
(f) Any person may obtain a complete copy of the code without charge by calling the Trust at 800-767-0300 and requesting a copy of the "Madison Covered Call & Equity Strategy Fund Sarbanes Oxley Code of Ethics."
Item 3. Audit Committee Financial Expert.
In August 2022, Richard Struthers, an “independent” Trustee and a member of the Trust’s audit committee, was elected to serve as the Trust’s audit committee financial expert among the three Fund independent Trustees who so qualify to serve in that capacity.
Item 4. Principal Accountant Fees and Services.
(a) Audit Fees: Total audit fees paid (or to be paid) to the registrant's principal accountant for the fiscal years ended December 31, 2022 and 2021, respectively were $23,950 ($451,950 including the Madison Funds and Ultra Series Fund, all affiliated investment companies “together, the “Affiliated Funds”) and $22,000 ($416,000 including the Affiliated Funds).
(b) Audit-Related Fees: Not applicable.
(c) Tax Fees: For the fiscal years ended December 31, 2022 and December 31, 2021, the aggregate fees paid (or to be paid) for professional services rendered by Deloitte & Touche for tax compliance, tax advice and tax planning are approximately $4,652 ($86,625 including the Affiliated Funds) and $4,442 ($79,706 including the Affiliated Funds), respectively.
(d) All Other Fees. Not applicable.
(e) (1) Before any accountant is engaged by the registrant to render audit or non-audit services, the engagement must be approved by the audit committee as contemplated by paragraph (c)(7)(i)(A) of Rule 2-01of Regulation S-X.
(2) Not applicable.
(f) Not applicable.
(g) Not applicable
(h) Not applicable.
Item 5. Audit Committee of Listed Registrants.
(a) The registrant has a separately-designated standing audit committee established in accordance with Section 3(a)(58)(A) of the Exchange Act (15 U.S.C. 78c(a)(58)(A)). The members of the committee include all the disinterested Trustees of the registrant, namely, Richard Struthers, Scott Jones and Steve Riege.
(b) Not applicable.
Item 6. Schedule of Investments
Included in report to shareholders (Item 1) above.
Item 7. Disclosure of Proxy Voting Policies and Procedures for Closed-End Management Investment Companies.
The following discloses our current policies and procedures that we use to determine how to vote proxies relating to portfolio securities. Because we manage portfolios for clients in addition to the registrant, the policies and procedures are not specific to the registrant except as indicated.
MADISON ASSET MANAGEMENT, LLC
PROXY VOTING POLICIES AND PROCEDURES
In accordance with Rule 206(4)-6 of the Investment Advisers Act of 1940, as amended, Madison Investment Holdings, Inc. and affiliates (“Madison” or the “Firm”) has adopted the following proxy voting policies and procedures (the “Policy”). This Policy applies to Madison and anyone acting on its behalf and at its designation, in connection with the voting of proxies. This Policy consists of the policies, procedures and requirements set forth below and will be periodically reviewed and amended as needed. Capitalized terms used but not otherwise defined herein have the meanings ascribed to them in Madison’s Compliance Manual.
Proxy or Proxies as used in this Policy includes the submission of a security holder vote by Proxy instrument, in person at a meeting of security holders or by written consent.
This Policy applies to Madison and each of its officers and anyone acting on its behalf and at its designation, in connection with the voting of proxies. This Policy consists of the policies, procedures and requirements set forth below and will be periodically reviewed and amended as needed. It is Madison’s general policy to vote Proxies in the best interest of its clients. Accordingly, Madison will vote all Proxies in a manner intended to promote the client’s investment objectives and to maximize investment returns, while following the investment restrictions and policies of each client, generally, as set forth in the governing documents of the relevant client. Madison will typically vote a security's proxy in accordance with the recommendations of that security's Board of Directors' recommendations, including, but not limited to:
| • | Changes in corporate governance; |
| • | Changes in corporate structure; |
| • | Appointment of auditors; |
| • | Social responsibility programs; |
| • | Compensation plans for executives; and |
| • | Mergers and acquisitions, as applicable. |
Madison will typically vote against shareholder proposals; however, Madison seeks the best of interests of its clients, and is not bound by the recommendations of a security's Board of Directors or the recommendations of any third-party proxy research and voting service.
Madison will use the services of an independent third party (e.g. Glass Lewis or Broadridge) for research, recommendations, and voting services. In the use of such services, Madison will typically vote the actual proxies on behalf of its clients. As discussed herein, where there is a material conflict of interest with a client or material conflict of interest with a client's portfolio holdings, Madison will typically defer to the voting recommendations of the third party proxy research provider, and vote that proxy in accordance with the instructions of the third party proxy voting service provider.
In the event Madison has proxies to vote, there may be instances when the Firm refrains from voting a Proxy, such as when Madison determines that the cost of voting the Proxy exceeds the expected benefit to the client and would not be in the client’s best interest. For example, the cost of voting certain foreign proxies may exceed the benefit to clients. Madison cannot anticipate every situation, and certain issues are better handled on a case-by-case basis. Proxy voting decisions are generally made by the relevant Madison Portfolio Management teams with knowledge of the security and coordinated by Madison operations personnel.
In cases where a proxy will not be voted or, as described below, voted against the Board of Directors’ recommendation, Madison’s policy is to make a notation to the file containing the records for such security explaining the Firm’s action or inaction, as the case may be. The majority of clients have elected that Madison vote the proxies on their behalf. The Firm votes client proxies in one of two ways. Proxy votes are either cast through Proxy Edge, a service which provides notification of proxy meetings and establishes voting through their electronic platform, or votes are made through proxyvote.com for those accounts which have not yet been set up on Proxy Edge.
The CCO will be responsible for the following:
| 1. | Overall compliance with this Policy; and |
| 2. | Reviewing and updating the Policy, as appropriate. |
| IV. | MATERIAL CONFLICTS OF INTEREST |
In the event Madison determines there is or may be a material conflict of interest between Madison and a client or client's portfolio holdings when voting Proxies, Madison will seek to resolve the issue in the best interest of its client. Madison will address such actual or potential material conflicts of interest using one of the following procedures:
| 1. | Madison may vote the Proxy using the established objective policies described herein; |
| 2. | Madison may engage a third party to recommend a vote with respect to the Proxy based on application of the policies set forth herein or Madison may bring the Proxy to senior management of the Firm to make a determination; or |
| 3. | Madison may employ such other method as is deemed appropriate under the circumstances, given the nature of the conflict. |
Although it is not likely, in the event there is a conflict of interest between Madison and a client in connection with a material proxy vote, Madison will typically employ the services of an independent third party proxy services firm to make the proxy voting decision in accordance with Rule 206(4)-6 under the Investment Advisers Act of 1940, as amended.
In the absence of any conflict, if any member of the relevant Portfolio Management team determines that it would be in the clients’ best interests to vote against management recommendations (or, for Madison Scottsdale, any particular portfolio manager makes such determination), then the decision should be brought to the attention of the management team, or any subcommittee appointed by the management team from among its members, to ratify the decision to stray from the general policy of voting with management. Such ratification need not be in writing.
Madison will make the following disclosures to clients:
| 1. | Upon request by a client, a copy of the Policy; and |
| 2. | Upon request by a client, the Proxy voting record for Proxies voted on behalf of the client. |
Madison will keep the following records, if applicable:
| 2. | A copy of each Proxy statement received with respect to client portfolio securities, except when a Proxy statement is available on the SEC’s EDGAR public filing system, Madison may rely on that filing in lieu of keeping its own copy; |
| 3. | A record of each Proxy vote cast by Madison on behalf of a client; |
| 4. | A record of each Proxy vote Madison refrained from voting on behalf of a client; |
| 5. | A copy of any document prepared by Madison that was material to a Proxy voting decision; and |
| 6. | A copy of each written client request for information regarding how Madison voted Proxies on behalf of clients and any written response by Madison to any client requests shall be maintained in such client’s file. |
Madison has retained the services of Proxy Edge to maintain the records of the proxy votes cast on behalf of clients. To the extent the Firm votes any proxies outside of this service, then copies of the voted proxy must be maintained in the applicable client or research file, as the case may be.
This Policy may be amended from time to time by the CCO.
December 2022
Item 8. Portfolio Managers of Closed-End Management Investment Companies.
(a) (1) Ray Di Bernardo, CFA is the lead Portfolio Manager for Madison's Covered Call portfolios and Vice President of Madison Investment Holdings, Inc. Ray has more than 25 years of equity management experience and is jointly responsible for the day to day management of the registrant. Prior to joining Madison in 2003 he was an equity analyst at Concord Trust in Chicago, and before that, an equity analyst and co-manager of international and emerging market portfolios at a Toronto-based international equity firm. Ray holds a BA from the University of Western Ontario.
Drew Justman, CFA serves as a Portfolio Manager on Madison’s Covered Call portfolios and Vice President of Madison Investment Holdings, Inc. Drew is jointly responsible for day to day management of the registrant. Prior to joining Madison, he worked with Merrill Lynch. Drew holds a BBA in Finance and Economics and an MS in Finance from the University of Wisconsin. He also graduated from the Applied Security Analysis Program.
(a) (2) Other portfolios managed.
As of the end of the registrant's most recent fiscal year, the portfolio managers were involved in the management of other accounts as follows:
Ray Di Bernardo:
Types of Accounts | Number of Other Accounts
Managed | Total Assets in
Accounts1 | Accounts with
Performance-Based
Advisory Fees | Total Assets in
Accounts with
Performance-Based
Advisory Fees |
| Registered Investment Companies | 1 | $148,049,829 | 0 | $0 |
| Other Pooled Investment Vehicles | 0 | $0 | 0 | $0 |
| Other Accounts | 2 | $145,325,006 | 0 | $0 |
1 Numbers are approximate.
Drew Justman:
Types of Accounts | Number of Other Accounts
Managed | Total Assets in
Accounts1 | Accounts with
Performance-Based Advisory Fees | Total Assets in
Accounts with
Performance-Based Advisory Fees |
| Registered Investment Companies | 6 | $148,049,029 | 0 | $0 |
| Other Pooled Investment Vehicles | 0 | $0 | 0 | $0 |
| Other Accounts | 105 | $891,423,066 | 0 | $0 |
1 Numbers are approximate.
Material conflicts of interest that may arise in connection with the manager's management of the Trust's investments and the investments of the other accounts: None identified.
(a) (3) Compensation.
Madison believes portfolio managers should receive compensation for the performance of the funds they manage, their individual effort, and the overall profitability of the firm. As members of the investment teams, portfolio managers receive a base salary, are included in the investment team’s incentive compensation plan (ICP), and have the potential for equity ownership in the firm. The amount of firm equity any portfolio manager may acquire is at the discretion of the Board of Directors of Madison Investment Holdings, Inc. which considers a variety of factors including, for example, seniority, responsibility, and longevity.
With regard to ICP, portfolio managers receive up to 25% of the annual revenue of their respective investment strategy. Eighty percent (80%) of the ICP pool is paid to the investment team that manages each respective investment strategy and 20% is subjective, based largely on performance against benchmark, with consideration given to team dynamics within each respective investment strategy.
The intention of the 25% revenue model is to focus our portfolio managers on delivering consistent performance which in turn drives long-term assets under management and revenue growth for the firm. Madison believes that taking a long-term approach better aligns the interests of shareholders of the funds, our clients, the investment teams, and our firm.
There is no difference in the way the firm compensates portfolio managers for managing a mutual fund or a private client account (or any other type of account). Instead, compensation is based on the entire employment relationship, not on the performance of any single account or type of account.
(a) (4) Ownership of Securities.
As of December 31, 2022, the portfolio manager beneficially owned the following amounts of the registrant:
| Name of Manager | Name of Registrant | Range of Ownership Interest |
| Ray Di Bernardo | Madison Covered Call & Equity Strategy Fund | None |
| Drew Justman | Madison Covered Call & Equity Strategy Fund | None |
(b) Not applicable.
Item 9. Purchases of Equity Securities by Closed-End Management Investment Company and Affiliated Purchasers.
(a) None*
(b) None*
*Note to Item 9: As announced and disclosed in the registrant's prospectus, the registrant maintains a Dividend Reinvestment Plan. The plan has no expiration date and no limits on the dollar amount of securities that may be purchased by the registrant to satisfy the plan's dividend reinvestment requirements.
Item 10. Submission of Matters to a Vote of Security Holders.
There have been no material changes to the procedures by which shareholders may recommend nominees to the registrant’s board of directors.
Item 11. Controls and Procedures.
(a) The Trust’s principal executive officer and principal financial officer determined that the registrant’s disclosure controls and procedures are effective, based on their evaluation of these controls and procedures within 90 days of the date of this report. There were no significant changes in the registrant’s internal controls or in other factors that could significantly affect these controls subsequent to the date of their evaluation. The officers identified no significant deficiencies or material weaknesses.
(b) There have been no changes in the registrant's internal control over financial reporting that occurred during the second fiscal quarter of the period covered by this report that has materially affected, or is reasonably likely to materially affect, the registrant's internal control over financial reporting.
Item 12. Disclosure of Securities Lending Activities for Closed-End Management Investment Companies.
(a) State Street serves as securities lending agent for the fund and in that role administers the fund’s securities lending program pursuant to the terms of a securities lending agency agreement entered into between the Trust and State Street (the "Securities Lending Agreement").
State Street is compensated for services from its securities lending revenue split, as provided in the Securities Lending Agreement. The table below shows the income each fund earned and the fees and compensation it paid to State Street as securities lending agent in connection with its securities lending activities during the fiscal year ended December 31, 2022.
FUND | Gross Income from Securities
Lending
Activities | Fees Paid to
Securities
Lending Agent
from a Revenue
Split | Fees Paid for
Cash Collateral
Management Services | Rebate
(paid to borrower) | Aggregate
Fees/Compensation
Paid by the Fund for
Securities Lending
Activity | Net Income to
the Fund from
Securities
Lending
Activities |
| Madison Covered Call & Equity Strategy Fund | $933 | $139 | $28 | $439 | $607 | $326 |
The fund does not pay separate indemnification fees, administration fees, or other fees not reflected above.
Item 13. Exhibits.
(a) (1) Code of ethics - See Item 2.
(2) Certifications of principal executive and principal financial officers pursuant to Section 302 of the Sarbanes-Oxley Act of 2002 – Filed herewith.
(3) Not applicable.
(4) There was no change in the registrant’s independent public accountant for the period covered by this report.
(b) Certifications pursuant to Section 906 of the Sarbanes - Oxley Act of 2002 - Filed herewith.
SIGNATURES
Pursuant to the requirements of the Securities Exchange Act of 1934 and the Investment Company Act of 1940, the Registrant has duly caused this Report to be signed on its behalf by the undersigned, thereunto duly authorized.
Madison Covered Call & Equity Strategy Fund
/s/ Steven J. Fredricks
Steven J. Fredricks, Chief Legal Officer & Chief Compliance Officer
Date: February 27, 2023
Pursuant to the requirements of the Securities Exchange Act of 1934 and the Investment Company Act of 1940, this Report has been signed below by the following persons on behalf of the Registrant and in the capacities and on the dates indicated.
/s/ Patrick F. Ryan
Patrick F. Ryan, Principal Executive Officer
Date: February 27, 2023
/s/ Greg Hoppe
Greg Hoppe, Principal Financial Officer & Principal Accounting Officer
Date: February 27, 2023