


Searchable text section of graphics shown above
Forward-Looking Statements
The statements, other than statements of historical fact, included in this presentation are forward-looking statements. Forward-looking statements are based on current management expectations and assumptions. However, we cannot be assured that such expectations will occur. Our actual future performance could differ materially from such statements. These forward-looking statements are subject to risks and uncertainties that could cause actual results and events to differ materially. These forward-looking statements apply only as of the date of this report; as such, they should not be unduly relied upon for current circumstances. Except as required by law, we are not obligated to release publicly any revisions to these forward-looking statements that might reflect events or circumstances occurring after the date of this report or those that might reflect the occurrence of unanticipated events.
Non-GAAP Financial Measurements
We use EBITDA before Parent Management Fees as a financial measurement. This is not a GAAP measurement. All the information to determine EBITDA before Parent Management Fees is derived from the audited financial statements or unaudited pro-forma information which is contained in the preliminary proxy statement. EBITDA, excluding parent management fees, is derived by taking each entity’s Net Loss for the respective year and adding back the following: Net Interest Expenses, Depreciation and Amortization, Impairment of Intangible expenses and Management Fees paid by MPC to is current parent that ended at the end of fiscal 2004. This non-GAAP measurement is provided as supplementary information and is not an alternative to GAAP. Some investors may use EBITDA to supplement their analysis of our results of operations. A reconciliation of EBITDA to Net Loss is provided in this presentation.
[LOGO] |
| © 2005 HyperSpace Communications, Inc. |
| [LOGO] |
2
This Presentation has been prepared by the
management of HyperSpace Communications, Inc
and MPC Computers, LLC
HyperSpace Communications (HCO) filed a preliminary proxy statement with the SEC on May 16, 2005 detailing its proposed merger with MPC Computers, LLC (MPC).
SHAREHOLDERS CAN OBTAIN A FREE COPY OF THE PRELIMINARY PROXY STATEMENT, WHICH CONTAINS A DESCRIPTION OF THE DIRECT AND INDIRECT INTEREST OF THE MANAGEMENT OF HYPERSPACE COMMUNICATIONS, INC ON WHOSE BEHALF THIS PRESENTATION IS BEING MADE, AS WELL AS OTHER FILINGS CONTAINING INFORMATION ABOUT THE COMPANY, AT THE SEC’S INTERNET SITE (HTTP://WWW.SEC.GOV). COPIES OF THE PROXY STATEMENT CAN ALSO BE OBTAINED, WITHOUT CHARGE, BY DIRECTING A REQUEST TO THE COMPANY.
Investors and Shareholders are urged to read the definitive proxy statement and other materials when they become available because they will contain important information.
For a discussion on risks please refer to HCO’s SEC filings including the annual report on Form 10-KSB for the fiscal year 2004.
3
HyperSpace Overview
• Develops, produces and markets network acceleration software
• Software products address growing need for real-time application acceleration and improved business communications over wired and wireless networks
• Products:
• HyperWeb — Web-site and web application secure acceleration
• HyperTunnel — Site-to-site and remote user secure acceleration
• Proposed merger with MPC Computers
• Formerly MicronPC
• Creates diversified IT services, computing solutions and software company
4
HCO’s Two Product Lines
Web Apps & | [GRAPHIC] | HyperWeb | [GRAPHIC] | Any |
Avg. 200 - 600% performance improvement.
Client/Server | [GRAPHIC] | HyperTunnel | [GRAPHIC] | Gateway to |
|
|
| ||
HyperTunnel | [GRAPHIC] | Mobile PCs & |
5
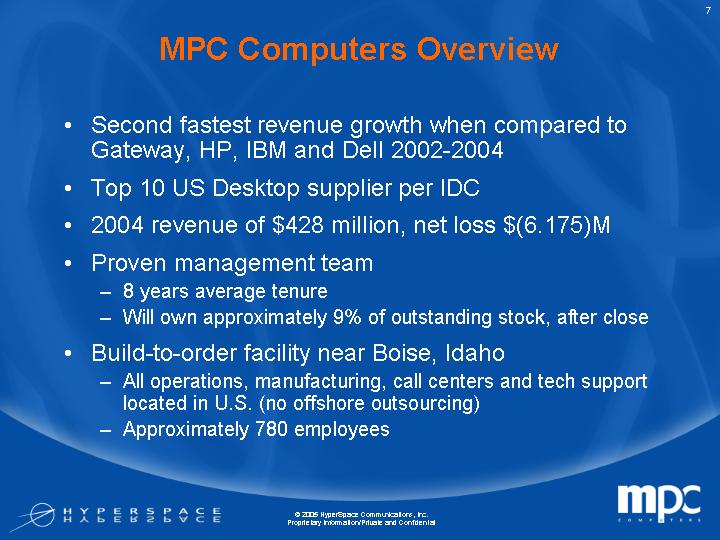
MPC Computers Overview
• Second fastest revenue growth when compared to Gateway, HP, IBM and Dell 2002-2004
• Top 10 US Desktop supplier per IDC
• 2004 revenue of $428 million, net loss $(6.175)M
• Proven management team
• 8 years average tenure
• Will own approximately 9% of outstanding stock, after close
• Build-to-order facility near Boise, Idaho
• All operations, manufacturing, call centers and tech support located in U.S. (no offshore outsourcing)
• Approximately 780 employees
7
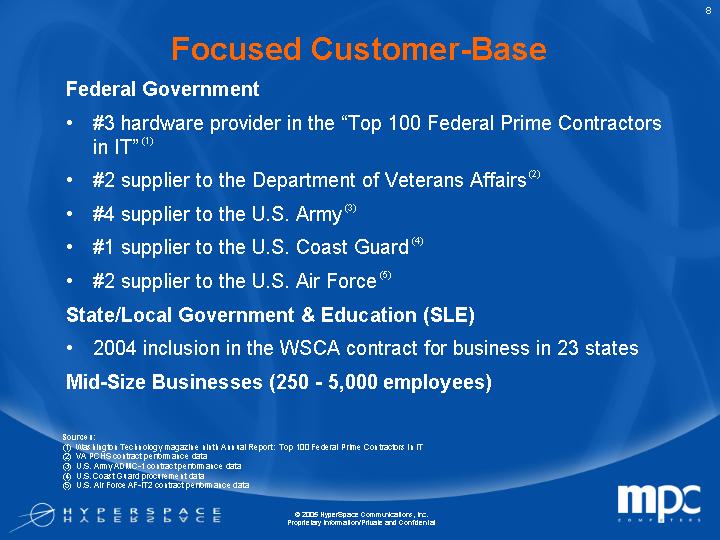
Focused Customer-Base
Federal Government
• #3 hardware provider in the “Top 100 Federal Prime Contractors in IT” (1)
• #2 supplier to the Department of Veterans Affairs (2)
• #4 supplier to the U.S. Army (3)
• #1 supplier to the U.S. Coast Guard (4)
• #2 supplier to the U.S. Air Force (5)
State/Local Government & Education (SLE)
• 2004 inclusion in the WSCA contract for business in 23 states
Mid-Size Businesses (250 - 5,000 employees)
Sources:
(1) Washington Technology magazine ninth Annual Report: Top 100 Federal Prime Contractors in IT
(2) VA PCHS contract performance data
(3) U.S. Army ADMC-1 contract performance data
(4) U.S. Coast Guard procurement data
(5) U.S. Air Force AF-IT2 contract performance data
8
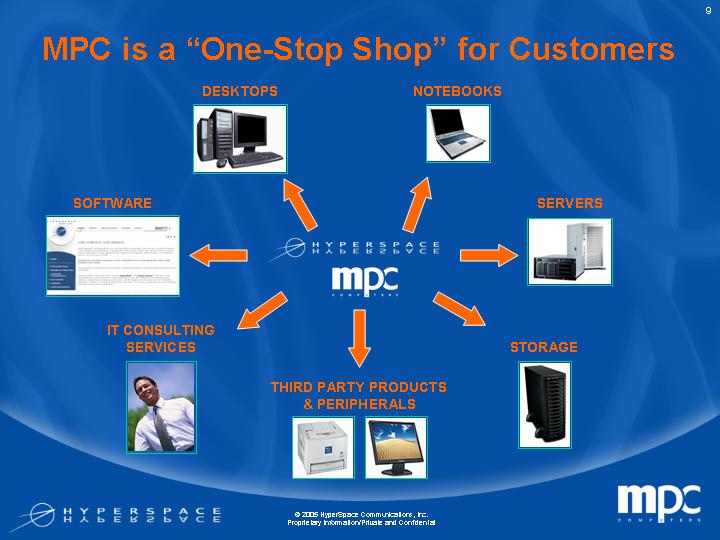
MPC is a “One-Stop Shop” for Customers
| DESKTOPS | NOTEBOOKS |
| |||
| [GRAPHIC] | [GRAPHIC] |
| |||
|
|
| ||||
SOFTWARE |
|
| SERVERS | |||
[GRAPHIC] |
| [LOGO] | [GRAPHIC] | |||
| [LOGO] |
| ||||
IT CONSULTING |
| STORAGE | ||||
[GRAPHIC] |
| [GRAPHIC] | ||||
|
|
| ||||
| THIRD PARTY PRODUCTS & PERIPHERALS |
| ||||
| [GRAPHIC] |
| ||||
9
MPC’s View of Competitive Landscape
|
| Primary Business Model |
|
|
|
|
| ||
|
| Build-to-Order |
| Direct Manuf. |
| Target Markets |
| Differentiator |
|
[LOGO] |
| [GRAPHIC] |
| [GRAPHIC] |
| Domestic Federal, SLE, Mid-market enterprise |
| Service |
|
|
|
|
|
|
|
|
|
|
|
[LOGO] |
| [GRAPHIC] |
| [GRAPHIC] |
| All |
| Price, Product Breadth |
|
|
|
|
|
|
|
|
|
|
|
[LOGO] |
|
|
|
|
| Consumer, Retail “Professional” |
| Price, Product Breadth |
|
|
|
|
|
|
|
|
|
|
|
[LOGO] |
|
|
|
|
| Global, Channel, Fortune 1000 |
| Product Breadth, Price |
|
|
|
|
|
|
|
|
|
|
|
[LOGO] (1) |
|
|
|
|
| Global, Channel, Fortune 1000 |
| Professional services |
|
(1) IBM information does not include Lenovo data.
10
2005 Strategy
• Capitalize on exclusive US operations to expand sales in the Federal, State & Local Government
• Increased utilization of operations capacity
• Grow contract manufacturing
• Introduce private label server line
• Pursue small business certification
• May accelerate Federal market sales growth
• Differentiation amongst direct competitors
• Expand Healthcare vertical
• Currently 20% of commercial sales
• Expand fast growing storage product portfolio
• Leverage improved capital structure in supplier negotiations to improve overall gross margin
• Complement organic growth with M&A
11
MPC Trends 2003-2004
• Revenue up 15% to $428M
• Net Loss down 27.9% to $(6.175)M
• $43 million in Deferred Revenue at end of 2004
• Growth in Storage, Software & Services sectors
• Gross Margin up 2% to 13.2%
• Opex % Rev lower by 4% to 13.2% (1)
• Cash from Operations better by $31 million
• MPC Parent Management Fees and Distributions of $23 million over last 3 years ended January 2005
(1) Exclusive of parent management fee
12
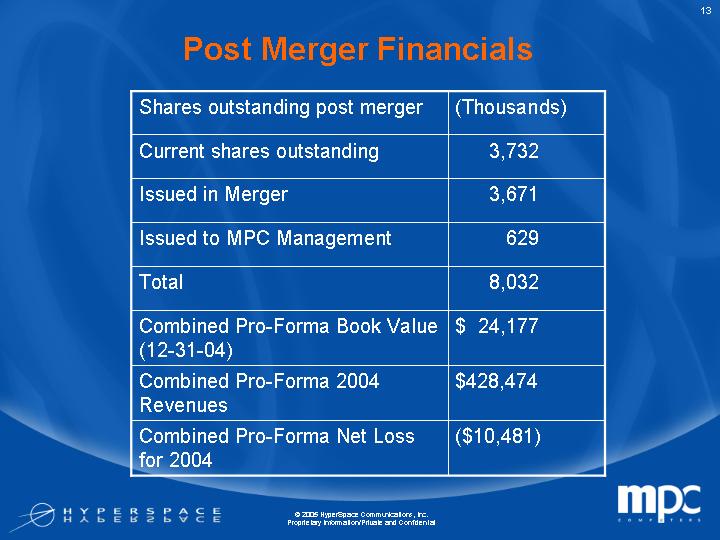
Post Merger Financials
Shares outstanding post merger |
| (Thousands) |
| |
Current shares outstanding |
| 3,732 |
| |
Issued in Merger |
| 3,671 |
| |
Issued to MPC Management |
| 629 |
| |
Total |
| 8,032 |
| |
Combined Pro-Forma Book Value (12-31-04) |
| $ | 24,177 |
|
Combined Pro-Forma 2004 Revenues |
| $ | 428,474 |
|
Combined Pro-Forma Net Loss for 2004 |
| $ | (10,481 | ) |
13
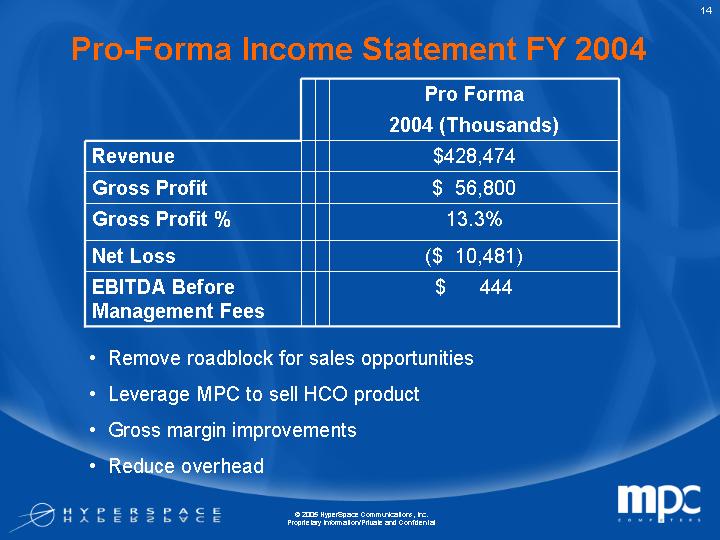
Pro-Forma Income Statement FY 2004
|
| Pro Forma |
| |
|
| 2004 (Thousands) |
| |
Revenue |
| $ | 428,474 |
|
Gross Profit |
| $ | 56,800 |
|
Gross Profit % |
| 13.3 | % | |
Net Loss |
| $ | (10,481 | ) |
EBITDA Before Management Fees |
| $ | 444 |
|
• Remove roadblock for sales opportunities
• Leverage MPC to sell HCO product
• Gross margin improvements
• Reduce overhead
14
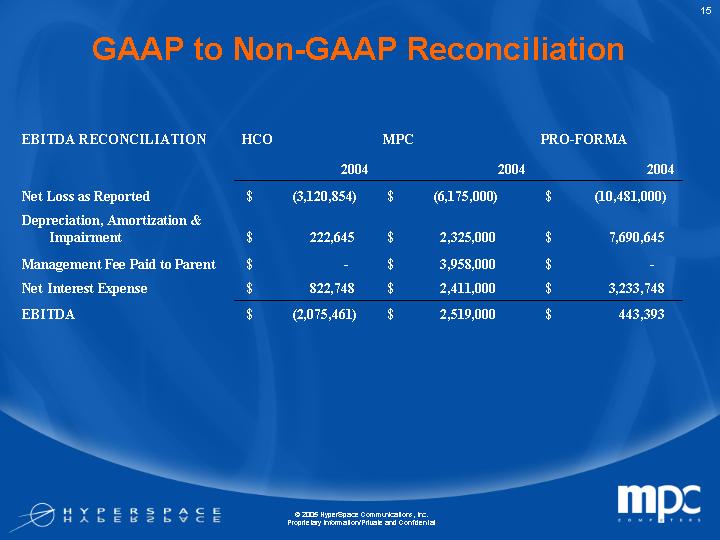
GAAP to Non-GAAP Reconciliation
|
| HCO |
| MPC |
| PRO-FORMA |
| |||
EBITDA RECONCILIATION |
| 2004 |
| 2004 |
| 2004 |
| |||
Net Loss as Reported |
| $ | (3,120,854 | ) | $ | (6,175,000 | ) | $ | (10,481,000 | ) |
Depreciation, Amortization & Impairment |
| $ | 222,645 |
| $ | 2,325,000 |
| $ | 7,690,645 |
|
Management Fee Paid to Parent |
| $ | — |
| $ | 3,958,000 |
| $ | — |
|
Net Interest Expense |
| $ | 822,748 |
| $ | 2,411,000 |
| $ | 3,233,748 |
|
EBITDA |
| $ | (2,075,461 | ) | $ | 2,519,000 |
| $ | 443,393 |
|
15
Management and Partnerships
• Management team
• HyperSpace team brings public company and software experience
• MPC management team remains in place
• Diversified and experienced Board of Directors
• Relationships
• Gores Technology Group
• Friedman, Billings, Ramsey
16