Exhibit 99.1

You're a Neighbor, Not a Number Q4 201 9 Investor Presentation Exhibit 99.1
Cautionary Statement Regarding Forward - Looking Statements This presentation contains forward - looking statements within the meaning of the Private Securities Litigation Reform Act of 1995. These forward - looking statements include, but are not limited to, statements about (i) the Company’s plans, objectives, expectations and intentions and other statements contained in this presentation that are not historical facts; and (ii) other statements identified by words such as “expects” “anticipates,” “intends,” “plans,” “believes,” “seeks,” “estimates,” “targets,” “projects,” or words of similar meaning generally intended to identify forward - looking statements. These forward - looking statements are based on the current beliefs and expectations of the Company’s management and are inherently subject to significant business, economic and competitive uncertainties and contingencies, many of which are beyond management’s control. In addition, these forward - looking statements are subject to assumptions with respect to future business strategies and decisions that are subject to change. Actual results may differ materially from the anticipated results discussed or implied in these forward - looking statements because of numerous possible uncertainties. The following factors, among others, could cause actual results to differ materially from the anticipated results or other expectations expressed in the forward - looking statements: (1) adverse governmental or regulatory policies may be enacted; (2) the interest rate environment may compress margins and adversely affect net interest income; (3) results may be adversely affected by continued diversification of assets and adverse changes to credit quality; (4) competition from other financial services companies in the Company’s markets could adversely affect operations; (5) a change in the current economic environment could adversely affect credit quality and loan originations; and (6) social and political conditions such as war, political unrest and terrorism or natural disasters could have unpredictable negative effects on our businesses and the economy. Additional factors that could cause actual results to differ materially from those expressed in the forward - looking statements are discussed in the Company’s reports (such as our Annual Report on Form 10 - K, Quarterly Reports on Form 10 - Q and Current Reports on Form 8 - K) filed with the Securities and Exchange Commission and available on the SEC’s website at www.sec.gov. 1
Non - GAAP Financial Measures The accounting and reporting polices of the Company conform to generally accepted accounting principles (“GAAP”) in the United States and prevailing practices in the banking industry. However, management uses certain non - GAAP measures to supplement the evaluation of the Company’s performance. These measures include core operating income for the consolidated entity, the commercial banking segment, and the mortgage banking segment. Management believes presentations of these non - GAAP financial measures provide useful supplemental information that is essential to a proper understanding of the operating results of the Company’s core businesses. These non - GAAP disclosures should not be viewed as a substitute for operating results determined in accordance with GAAP, nor are they necessarily comparable to non - GAAP performance measures that may be presented by other companies. Reconciliations of GAAP to non - GAAP disclosures are included as tables at the end of this presentation. 2
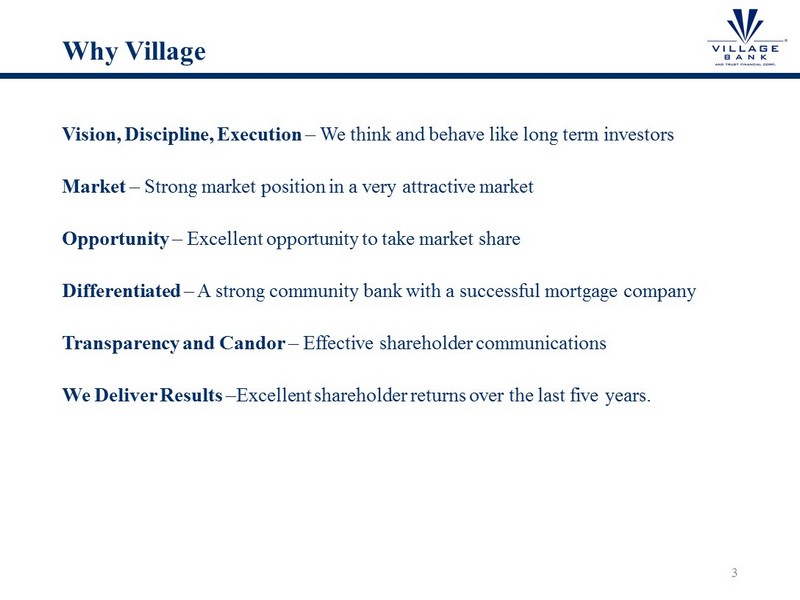
Why Village Vision, Discipline, Execution – We think and behave like long term investors Market – Strong market position in a very attractive market Opportunity – Excellent opportunity to take m arket share Differentiated – A strong community bank with a successful mortgage company Transparency and Candor – Effective shareholder communications We Deliver Results – Excellent shareholder returns over the last five years. 3
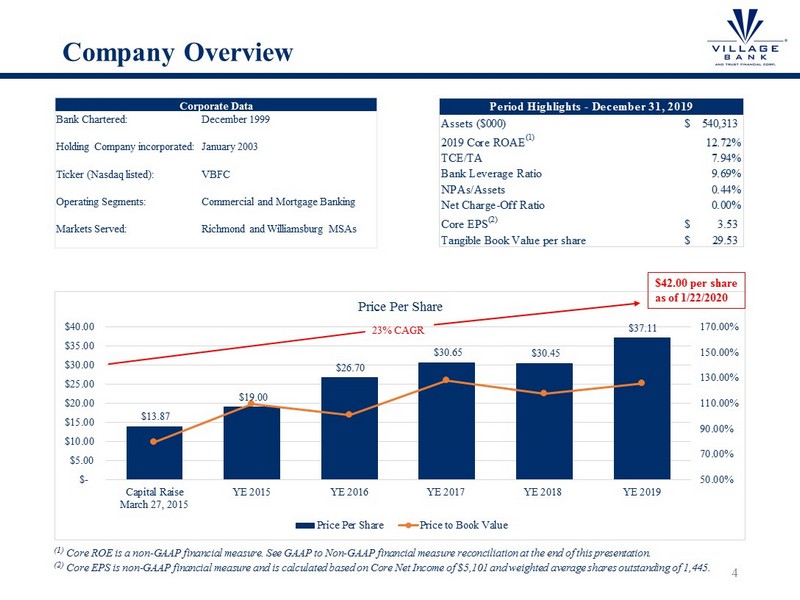
Company Overview 4 Corporate Data Bank Chartered: December 1999 Holding Company incorporated: January 2003 Ticker (Nasdaq listed): VBFC Operating Segments: Commercial and Mortgage Banking Markets Served: Richmond and Williamsburg MSAs (1) Core ROE is a non - GAAP financial measure. See GAAP to Non - GAAP financial measure reconciliation at the end of this presentation . (2) Core EPS is non - GAAP financial measure and is calculated based on Core Net Income of $5,101 and weighted average shares outstand ing of 1,445. $13.87 $19.00 $26.70 $30.65 $30.45 $37.11 79.33% 109.31% 100.62% 127.82% 117.70% 125.65% 50.00% 70.00% 90.00% 110.00% 130.00% 150.00% 170.00% $- $5.00 $10.00 $15.00 $20.00 $25.00 $30.00 $35.00 $40.00 Capital Raise March 27, 2015 YE 2015 YE 2016 YE 2017 YE 2018 YE 2019 Price Per Share Price Per Share Price to Book Value 23% CAGR Assets ($000) 540,313$ 2019 Core ROAE (1) 12.72% TCE/TA 7.94% Bank Leverage Ratio 9.69% NPAs/Assets 0.44% Net Charge-Off Ratio 0.00% Core EPS (2) 3.53$ Tangible Book Value per share 29.53$ Period Highlights - December 31, 2019 $42.00 per share as of 1/22/2020
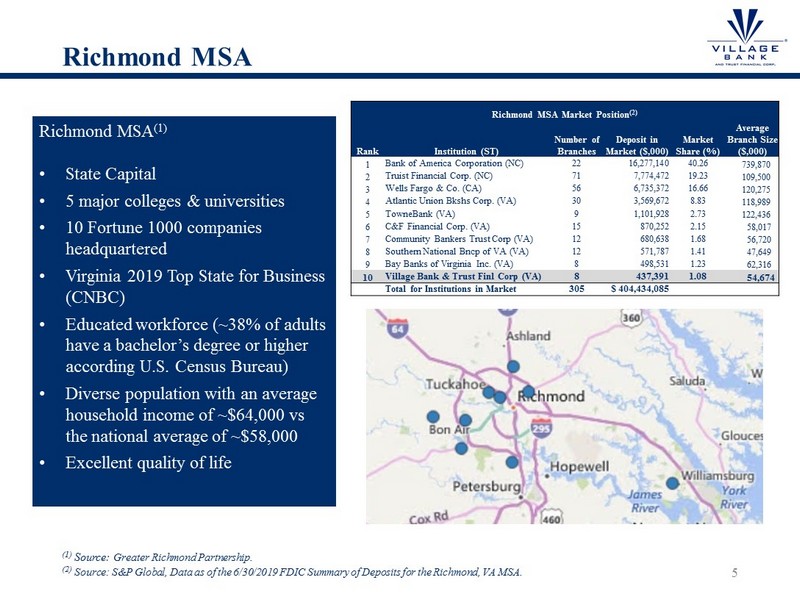
Richmond MSA 5 (1) Source: Greater Richmond Partnership. (2) Source : S&P Global, Data as of the 6/30/2019 FDIC Summary of Deposits for the Richmond, VA MSA . Richmond MSA Market Position (2) Rank Institution (ST) Number of Branches Deposit in Market ($,000) Market Share (%) Average Branch Size ($,000) 1 Bank of America Corporation (NC) 22 16,277,140 40.26 739,870 2 Truist Financial Corp. (NC) 71 7,774,472 19.23 109,500 3 Wells Fargo & Co. (CA) 56 6,735,372 16.66 120,275 4 Atlantic Union Bkshs Corp. (VA) 30 3,569,672 8.83 118,989 5 TowneBank (VA) 9 1,101,928 2.73 122,436 6 C&F Financial Corp. (VA) 15 870,252 2.15 58,017 7 Community Bankers Trust Corp (VA) 12 680,638 1.68 56,720 8 Southern National Bncp of VA (VA) 12 571,787 1.41 47,649 9 Bay Banks of Virginia Inc. (VA) 8 498,531 1.23 62,316 10 Village Bank & Trust Finl Corp (VA) 8 437,391 1.08 54,674 Total for Institutions in Market 305 $ 404,434,085 Richmond MSA (1) • State Capital • 5 major colleges & universities • 10 Fortune 1000 companies headquartered • Virginia 2019 Top State for Business (CNBC) • Educated workforce (~38% of adults have a bachelor’s degree or higher according U.S. Census Bureau) • Diverse population with an average household income of ~$64,000 vs the national average of ~$58,000 • Excellent quality of life

Management Team 6 Bill Foster President & CEO Jay Hendricks Chief Risk Officer Chief Operating Officer Donnie Kaloski Chief Financial Officer • CEO of the Company and the Bank since March 1, 2014. President of the Company and the Bank since August 2013. • Joined as Chief Credit Officer of the Bank in March 2012. • Independent consultant focusing on business restructuring, turnaround and strategic planning from 2008 - 2012. • 18 years with SunTrust/Crestar including Group EVP of Mid - Atlantic Commercial Banking, Group EVP of Mid - Atlantic Commercial Real Estate Banking and Senior MD/Chief Credit Officer of Corporate and Investment Banking. • More than 30 years experience in the banking industry . • Chief Operating Officer and Chief Risk Officer of the Bank since December 2016. • Chief Credit Officer of the Bank since September 2013. • 23 years with SunTrust/Crestar including roles as Chief Operational Risk Officer for mortgage and Credit and Compliance O fficer for consumer banking. • Prior to 1990, served as Bank Examiner for the Comptroller of the Currency. • More than 30 years experience in the banking industry. • Chief Financial Officer of the Company and the Bank since May 2018. • Previously served as Senior Vice President of Accounting of the Bank. • From 2007 to 2013 supervised audit teams on financial institutions throughout the country with BDO USA, LLP.. • Holds a BA in Accounting and a MBA from Troy University. • Is a Certified Public Accountant and Charted Global Management Accountant. • More than 12 years experience in the accounting and banking industry.
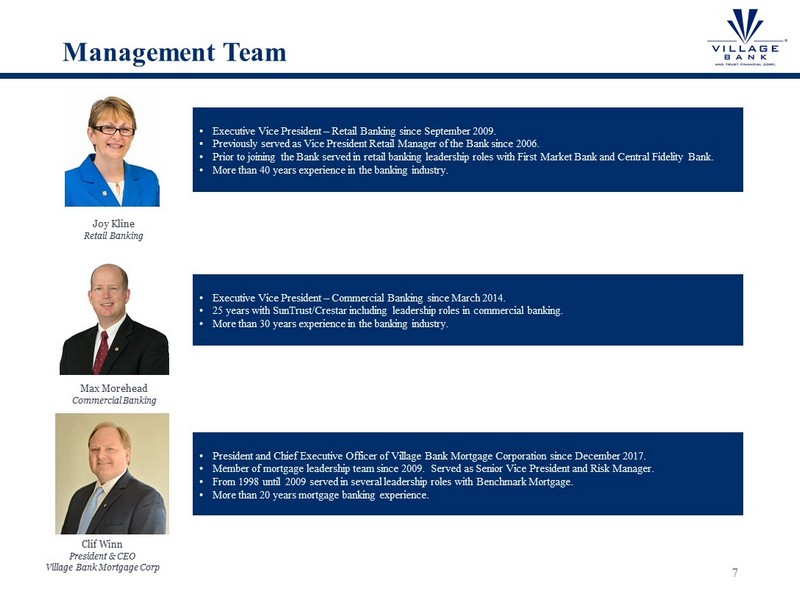
Management Team 7 • Executive Vice President – Retail Banking since September 2009. • Previously served as Vice President Retail Manager of the Bank since 2006. • Prior to joining the Bank served in retail banking leadership roles with First Market Bank and Central Fidelity Bank. • More than 40 years experience in the banking industry . • President and Chief Executive Officer of Village Bank Mortgage Corporation since December 2017. • Member of mortgage leadership team since 2009. Served as Senior Vice President and Risk Manager. • From 1998 until 2009 served in several leadership roles with Benchmark Mortgage. • More than 20 years mortgage banking experience. Max Morehead Commercial Banking Clif Winn President & CEO Village Bank Mortgage Corp Joy Kline Retail Banking • Executive Vice President – Commercial Banking since March 2014. • 25 years with SunTrust/Crestar including leadership roles in commercial banking. • More than 30 years experience in the banking industry .

Operating Results by Segment 8 GAAP Operating Results by Segment Y 2019 Q4 2019 Q3 2019 Q2 2019 Q1 2019 Q4 2018 Pre - tax earnings (loss) by segment Commercial banking $ 4,402 $ 1,289 $ 1,376 $ 642 $ 1,095 $ 1,050 Mortgage banking 1,239 360 814 175 (110) (6) Income before income tax expense (benefit) 5,641 1,649 2,190 817 985 1,044 Commercial banking income tax expense 904 271 292 143 198 189 Mortgage banking income tax expense 260 74 171 37 (22) (1) Net income $ 4,477 $ 1,304 $ 1,727 $ 637 $ 809 $ 856 Core Operating Results by Segment (1) Y 2019 Q4 2019 Q3 2019 Q2 2019 Q1 2019 Q4 2018 Commercial banking GAAP pre - tax earnings $ 4,402 $ 1,289 $ 1,376 $ 642 $ 1,095 $ 1,050 Non - core (income) expense items Salaries and benefits (2) 760 - - 760 - - Branch write - down 22 22 - - - 56 (Gain)/loss on sale of securities (101) - - - (101) 89 Other non - core expense (3) 55 - - 12 43 119 Commercial banking operating income 5,138 1,311 1,376 1,414 1,037 1,314 Mortgage banking GAAP pre - tax earnings (loss) 1,239 360 814 175 (110) (6) Non - core (income) expense items Salaries and benefits (2) 54 - - 54 - - Mortgage banking operating income 1,293 360 814 229 (110) (6) Core operating income before income tax expense 6,431 1,671 2,190 1,643 927 1,308 Commercial banking income tax expense (4) 1,059 276 292 305 186 244 Mortgage banking income tax expense (4) 271 74 171 48 (22) (1) Core operating net income $ 5,101 $ 1,321 $ 1,727 $ 1,290 $ 763 $ 1,065 (1) Non - GAAP financial measure. (2) The Company recognized $814,000 in additional compensation expense during Q2 2019, as a result of the accelerated vesting of res tricted stock awards and retirement benefits as disclosed in the Company's Form 8 - K filed on June 25, 2019. (3) Other non - core expense is composed of the write - off of premiums associated with United State Department of Agriculture Loans, $ 12,000 during Q2 2019, $96,000 during Q4 2018, and $35,000 during Q4 2018, and additional audit and tax fees of $43,000 during Q1 2019 and $23,000 d uri ng Q4 2018 associated with the transition of our external auditors during 2018. (4) Income tax expense was adjusted for the non - core items at the corporate tax rate of 21%.
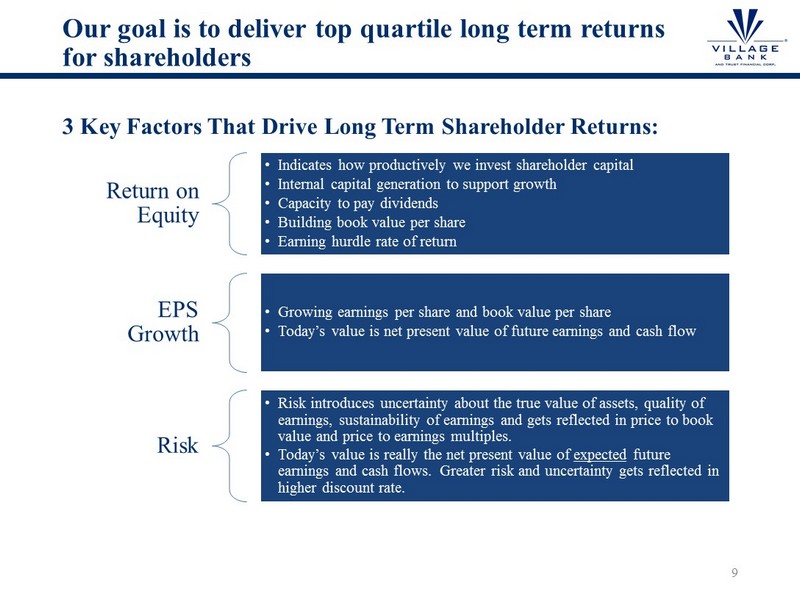
Our goal is to deliver top quartile l ong t erm returns for shareholders Return on Equity • Indicates how productively we invest shareholder capital • Internal capital generation to support growth • Capacity to pay dividends • Building book value per share • Earning hurdle rate of return EPS Growth • Growing earnings per share and book value per share • Today’s value is net present value of future earnings and cash flow Risk • Risk introduces uncertainty about the true value of assets, quality of earnings, sustainability of earnings and gets reflected in price to book value and price to earnings multiples. • Today’s value is really the net present value of expected future earnings and cash flows. Greater risk and uncertainty gets reflected in higher discount rate. 3 Key Factors That Drive Long Term Shareholder Returns: 9
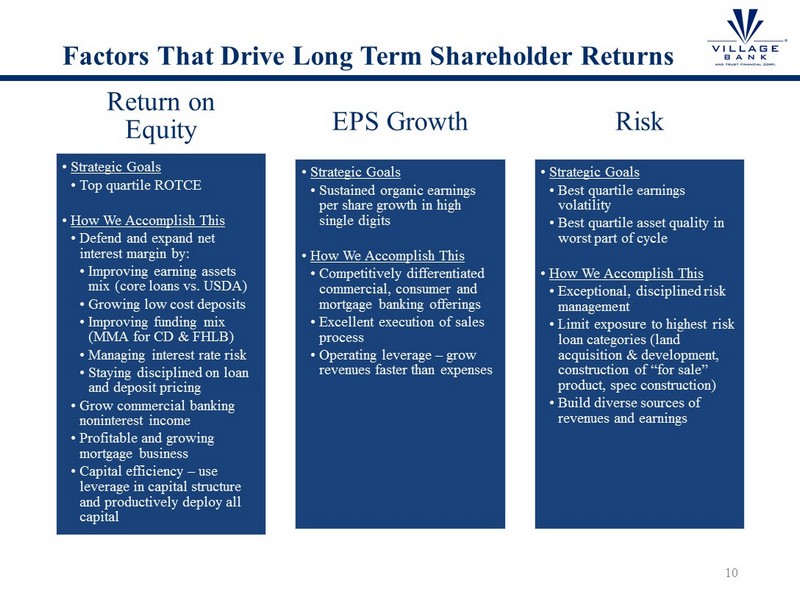
Factors That Drive Long Term Shareholder Returns Return on Equity • Strategic Goals • Top quartile ROTCE • How We Accomplish This • Defend and expand net interest margin by: • Improving earning assets mix (core loans vs. USDA) • Growing low cost deposits • Improving funding mix (MMA for CD & FHLB) • Managing interest rate risk • Staying disciplined on loan and deposit pricing • Grow commercial banking noninterest income • Profitable and growing mortgage business • Capital efficiency – use leverage in capital structure and productively deploy all capital EPS Growth • Strategic Goals • Sustained organic earnings per share growth in high single digits • How We Accomplish This • Competitively differentiated commercial, consumer and mortgage banking offerings • Excellent execution of sales process • Operating leverage – grow revenues faster than expenses Risk • Strategic Goals • Best quartile earnings volatility • Best quartile asset quality in worst part of cycle • How We Accomplish This • Exceptional, disciplined risk management • Limit exposure to highest risk loan categories (land acquisition & development, construction of “for sale” product, spec construction) • Build diverse sources of revenues and earnings 10
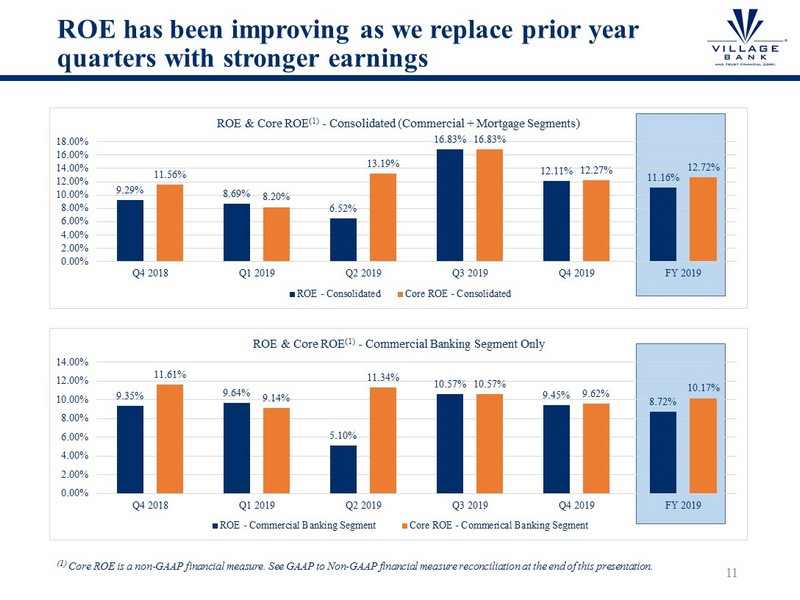
ROE has been improving as we replace prior year quarters with stronger earnings (1) Core ROE is a non - GAAP financial measure. See GAAP to Non - GAAP financial measure reconciliation at the end of this presentation. 11 9.29% 8.69% 6.52% 16.83% 12.11% 11.16% 11.56% 8.20% 13.19% 16.83% 12.27% 12.72% 0.00% 2.00% 4.00% 6.00% 8.00% 10.00% 12.00% 14.00% 16.00% 18.00% Q4 2018 Q1 2019 Q2 2019 Q3 2019 Q4 2019 FY 2019 ROE & Core ROE (1) - Consolidated (Commercial + Mortgage Segments) ROE - Consolidated Core ROE - Consolidated 9.35% 9.64% 5.10% 10.57% 9.45% 8.72% 11.61% 9.14% 11.34% 10.57% 9.62% 10.17% 0.00% 2.00% 4.00% 6.00% 8.00% 10.00% 12.00% 14.00% Q4 2018 Q1 2019 Q2 2019 Q3 2019 Q4 2019 FY 2019 ROE & Core ROE (1) - Commercial Banking Segment Only ROE - Commercial Banking Segment Core ROE - Commerical Banking Segment
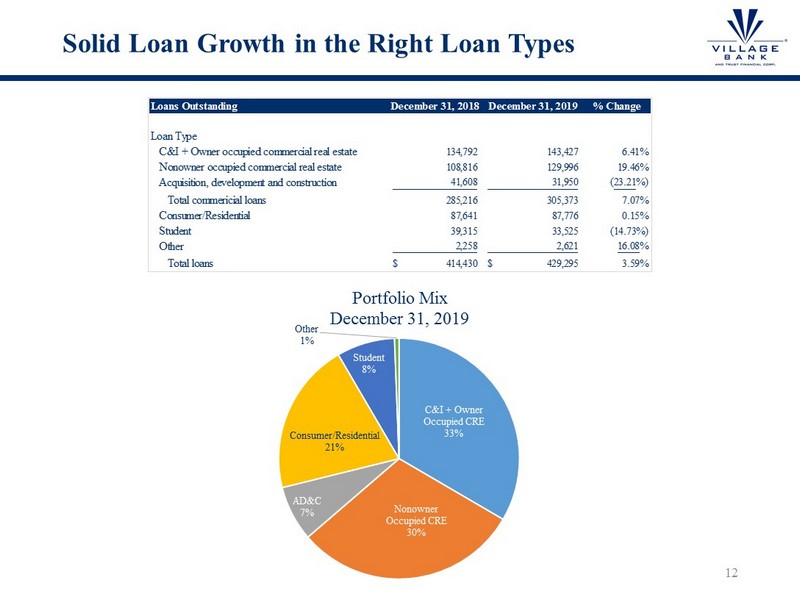
Solid Loan Growth in the Right Loan Types 12 Loans Outstanding December 31, 2018 December 31, 2019 % Change Loan Type C&I + Owner occupied commercial real estate 134,792 143,427 6.41% Nonowner occupied commercial real estate 108,816 129,996 19.46% Acquisition, development and construction 41,608 31,950 (23.21%) Total commericial loans 285,216 305,373 7.07% Consumer/Residential 87,641 87,776 0.15% Student 39,315 33,525 (14.73%) Other 2,258 2,621 16.08% Total loans 414,430$ 429,295$ 3.59% C&I + Owner Occupied CRE 33% Nonowner Occupied CRE 30% AD&C 7% Consumer/Residential 21% Student 8% Other 1% Portfolio Mix December 31, 2019
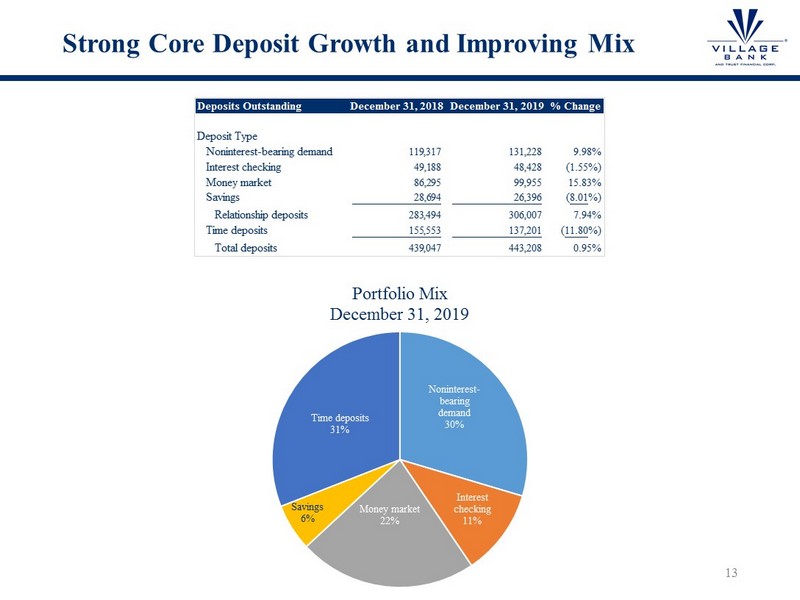
Strong Core Deposit Growth and Improving Mix 13 Deposits Outstanding December 31, 2018 December 31, 2019 % Change Deposit Type Noninterest-bearing demand 119,317 131,228 9.98% Interest checking 49,188 48,428 (1.55%) Money market 86,295 99,955 15.83% Savings 28,694 26,396 (8.01%) Relationship deposits 283,494 306,007 7.94% Time deposits 155,553 137,201 (11.80%) Total deposits 439,047 443,208 0.95% Noninterest - bearing demand 30% Interest checking 11% Money market 22% Savings 6% Time deposits 31% Portfolio Mix December 31, 2019
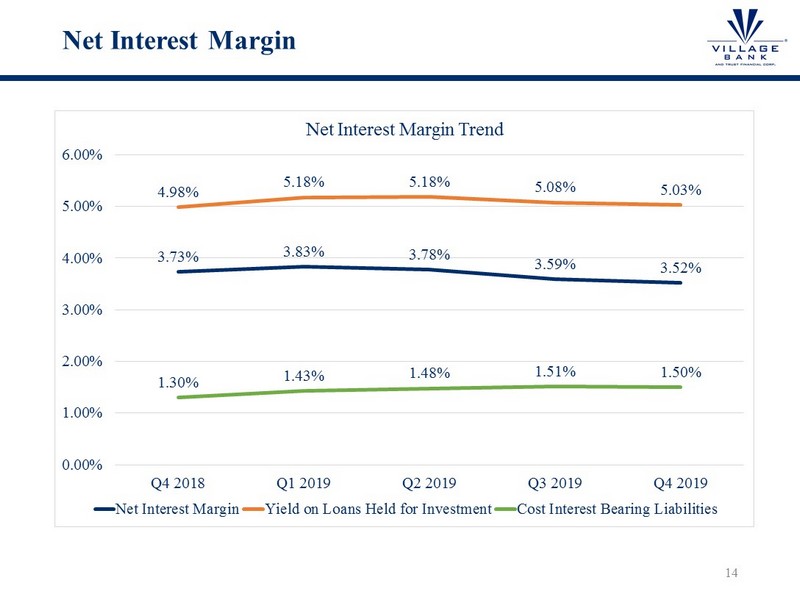
Net Interest Margin 14 3.73% 3.83% 3.78% 3.59% 3.52% 4.98% 5.18% 5.18% 5.08% 5.03% 1.30% 1.43% 1.48% 1.51% 1.50% 0.00% 1.00% 2.00% 3.00% 4.00% 5.00% 6.00% Q4 2018 Q1 2019 Q2 2019 Q3 2019 Q4 2019 Net Interest Margin Trend Net Interest Margin Yield on Loans Held for Investment Cost Interest Bearing Liabilities
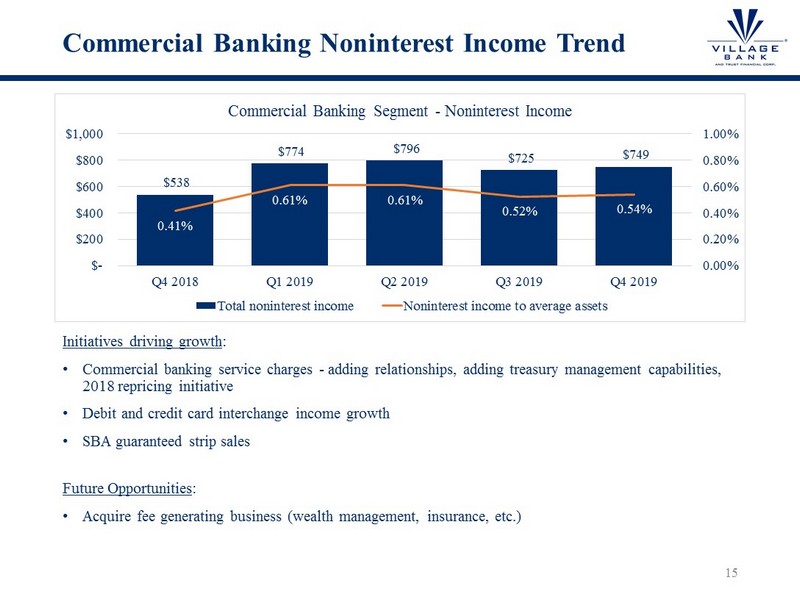
Commercial Banking Noninterest Income Trend Initiatives driving growth : • Commercial banking service charges - adding relationships, adding treasury management capabilities, 2018 repricing initiative • Debit and credit card interchange income growth • SBA guaranteed strip sales Future Opportunities : • Acquire fee generating business (wealth management, insurance, etc.) 15 $538 $774 $796 $725 $749 0.41% 0.61% 0.61% 0.52% 0.54% 0.00% 0.20% 0.40% 0.60% 0.80% 1.00% $- $200 $400 $600 $800 $1,000 Q4 2018 Q1 2019 Q2 2019 Q3 2019 Q4 2019 Commercial Banking Segment - Noninterest Income Total noninterest income Noninterest income to average assets
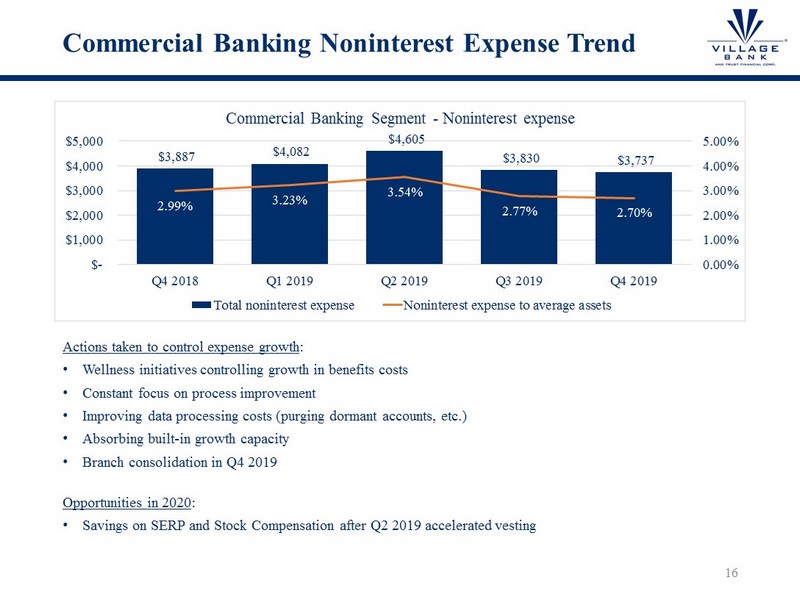
Commercial Banking Noninterest Expense Trend Actions taken to control expense growth : • Wellness initiatives controlling growth in benefits costs • Constant focus on process improvement • Improving data processing costs (purging dormant accounts, etc.) • Absorbing built - in growth capacity • Branch consolidation in Q4 2019 Opportunities in 2020 : • Savings on SERP and Stock Compensation after Q2 2019 accelerated vesting 16 $3,887 $4,082 $4,605 $3,830 $3,737 2.99% 3.23% 3.54% 2.77% 2.70% 0.00% 1.00% 2.00% 3.00% 4.00% 5.00% $- $1,000 $2,000 $3,000 $4,000 $5,000 Q4 2018 Q1 2019 Q2 2019 Q3 2019 Q4 2019 Commercial Banking Segment - Noninterest expense Total noninterest expense Noninterest expense to average assets
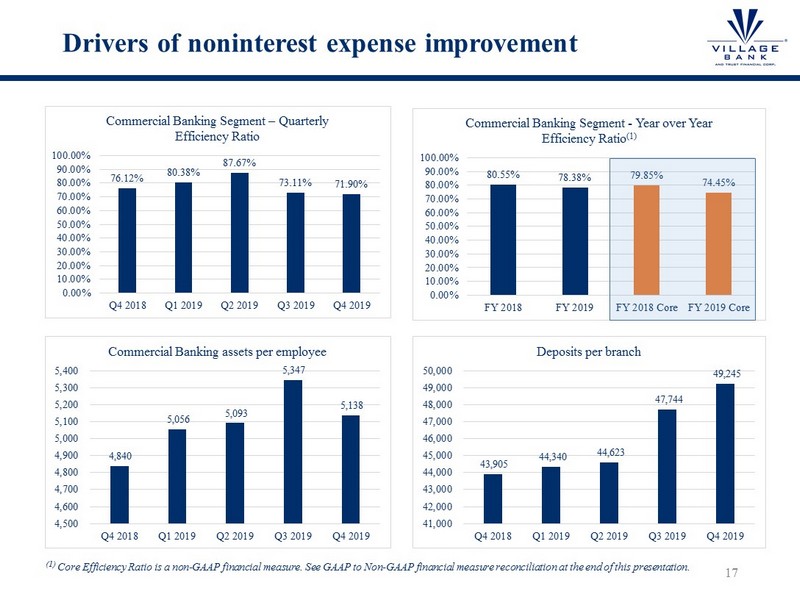
Drivers of noninterest expense improvement (1) Core Efficiency Ratio is a non - GAAP financial measure. See GAAP to Non - GAAP financial measure reconciliation at the end of this presentation. 17 76.12% 80.38% 87.67% 73.11% 71.90% 0.00% 10.00% 20.00% 30.00% 40.00% 50.00% 60.00% 70.00% 80.00% 90.00% 100.00% Q4 2018 Q1 2019 Q2 2019 Q3 2019 Q4 2019 Commercial Banking Segment – Quarterly Efficiency Ratio 43,905 44,340 44,623 47,744 49,245 41,000 42,000 43,000 44,000 45,000 46,000 47,000 48,000 49,000 50,000 Q4 2018 Q1 2019 Q2 2019 Q3 2019 Q4 2019 Deposits per branch 80.55% 78.38% 79.85% 74.45% 0.00% 10.00% 20.00% 30.00% 40.00% 50.00% 60.00% 70.00% 80.00% 90.00% 100.00% FY 2018 FY 2019 FY 2018 Core FY 2019 Core Commercial Banking Segment - Year over Year Efficiency Ratio (1) 4,840 5,056 5,093 5,347 5,138 4,500 4,600 4,700 4,800 4,900 5,000 5,100 5,200 5,300 5,400 Q4 2018 Q1 2019 Q2 2019 Q3 2019 Q4 2019 Commercial Banking assets per employee
Mortgage Banking Segment • Run like an independent mortgage company • 100% retail production • Commission only, self sourcing loan officers • Referrals from realtors and builders • A ll loans sold servicing released • Purchase money focused with the ability to opportunistically capture refis (83% purchase in 2019) • Best - efforts delivery – do not take rate risk • Exceptional execution extends and enhances the Village brand in the eyes of borrowers, realtors, builders, title companies, closing attorneys • Very attractive loan officer value proposition – product, operational support and execution, marketing support • Excellent compliance and audit track record • Leadership team is strong across the board and functioning at a high level • Seeing recruiting successes – new head of operations, 2 loan officers, loan processors, loan officer assistants. • Actively recruiting additional loan officers in Richmond, Williamsburg and other attractive markets • Increasing introductions from bank client base 18
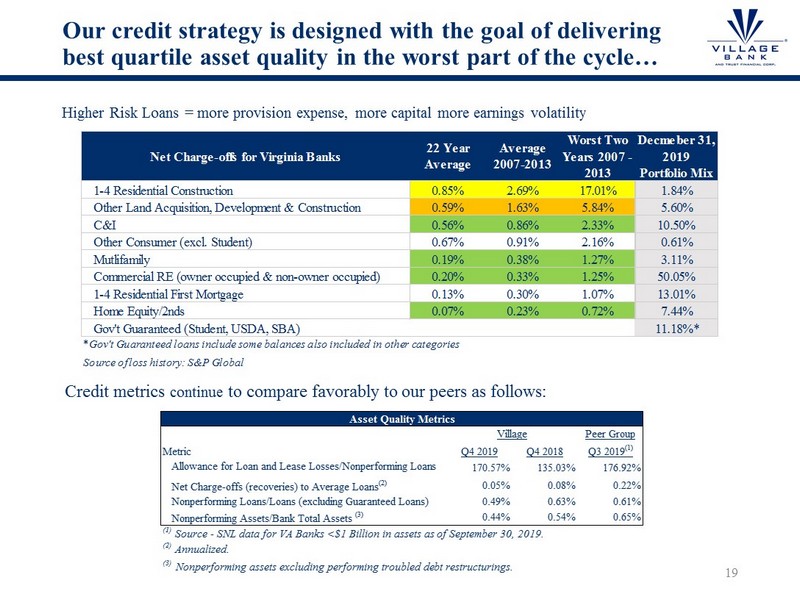
Our credit strategy is designed with the goal of delivering best quartile asset quality in the worst part of the cycle… Higher Risk Loans = more provision expense, more capital more earnings volatility Credit metrics continue to compare favorably to our peers as follows: 19 Net Charge-offs for Virginia Banks 22 Year Average Average 2007-2013 Worst Two Years 2007 - 2013 Decmeber 31, 2019 Portfolio Mix 1-4 Residential Construction 0.85% 2.69% 17.01% 1.84% Other Land Acquisition, Development & Construction 0.59% 1.63% 5.84% 5.60% C&I 0.56% 0.86% 2.33% 10.50% Other Consumer (excl. Student) 0.67% 0.91% 2.16% 0.61% Mutlifamily 0.19% 0.38% 1.27% 3.11% Commercial RE (owner occupied & non-owner occupied) 0.20% 0.33% 1.25% 50.05% 1-4 Residential First Mortgage 0.13% 0.30% 1.07% 13.01% Home Equity/2nds 0.07% 0.23% 0.72% 7.44% Gov't Guaranteed (Student, USDA, SBA) 11.18%* *Gov't Guaranteed loans include some balances also included in other categories Source of loss history: S&P Global Peer Group Q4 2019 Q4 2018 Q3 2019 (1) Allowance for Loan and Lease Losses/Nonperforming Loans 170.57% 135.03% 176.92% Net Charge-offs (recoveries) to Average Loans (2) 0.05% 0.08% 0.22% Nonperforming Loans/Loans (excluding Guaranteed Loans) 0.49% 0.63% 0.61% Nonperforming Assets/Bank Total Assets (3) 0.44% 0.54% 0.65% (1) Source - SNL data for VA Banks <$1 Billion in assets as of September 30, 2019. (3) Nonperforming assets excluding performing troubled debt restructurings. Asset Quality Metrics Metric Village (2) Annualized.
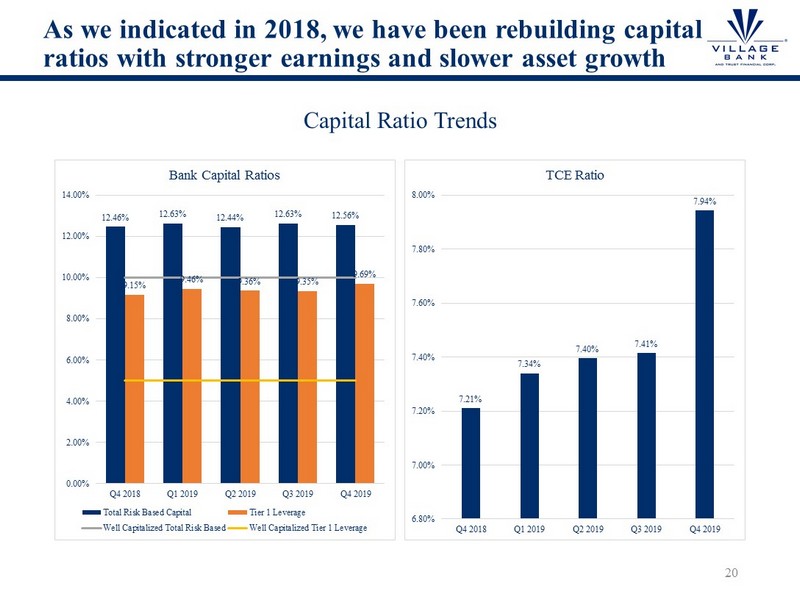
As we indicated in 2018, we have been rebuilding capital ratios with stronger earnings and slower asset growth Capital Ratio Trends 20 12.46% 12.63% 12.44% 12.63% 12.56% 9.15% 9.46% 9.36% 9.35% 9.69% 0.00% 2.00% 4.00% 6.00% 8.00% 10.00% 12.00% 14.00% Q4 2018 Q1 2019 Q2 2019 Q3 2019 Q4 2019 Bank Capital Ratios Total Risk Based Capital Tier 1 Leverage Well Capitalized Total Risk Based Well Capitalized Tier 1 Leverage 7.21% 7.34% 7.40% 7.41% 7.94% 6.80% 7.00% 7.20% 7.40% 7.60% 7.80% 8.00% Q4 2018 Q1 2019 Q2 2019 Q3 2019 Q4 2019 TCE Ratio
2020 Opportunities and Challenges • Opportunities • Growth in the Williamsburg and Peninsula markets • Truist • Wells Fargo • Atlantic Union and Sonabank strategy changes • SBA guaranty strip sales • Mortgage recruiting • Challenges • Loan and deposit pricing pressures are squeezing margins at many banks. We are fighting those pressures but are not immune. 21

Why Village Vision, Discipline, Execution – We think and behave like long term investors Market – Strong market position in a very attractive market Opportunity – Excellent opportunity to take m arket share Differentiated – A strong community bank with a successful mortgage company Transparency and Candor – Effective shareholder communications We Deliver Results – Excellent shareholder returns over the last five years. 22
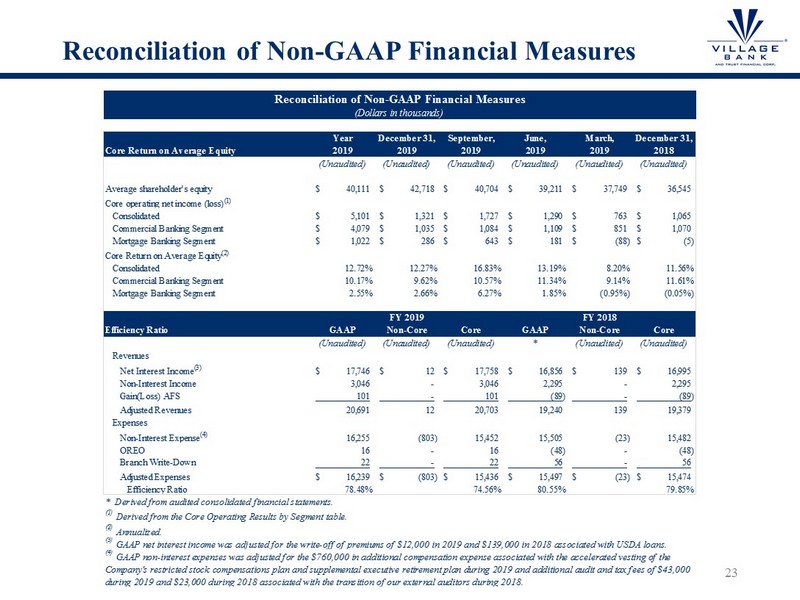
Reconciliation of Non - GAAP Financial Measures 23 Year December 31, September, June, March, December 31, Core Return on Average Equity 2019 2019 2019 2019 2019 2018 (Unaudited) (Unaudited) (Unaudited) (Unaudited) (Unaudited) (Unaudited) Average shareholder's equity 40,111$ 42,718$ 40,704$ 39,211$ 37,749$ 36,545$ Core operating net income (loss) (1) Consolidated 5,101$ 1,321$ 1,727$ 1,290$ 763$ 1,065$ Commercial Banking Segment 4,079$ 1,035$ 1,084$ 1,109$ 851$ 1,070$ Mortgage Banking Segment 1,022$ 286$ 643$ 181$ (88)$ (5)$ Core Return on Average Equity (2) Consolidated 12.72% 12.27% 16.83% 13.19% 8.20% 11.56% Commercial Banking Segment 10.17% 9.62% 10.57% 11.34% 9.14% 11.61% Mortgage Banking Segment 2.55% 2.66% 6.27% 1.85% (0.95%) (0.05%) Efficiency Ratio GAAP Non-Core Core GAAP Non-Core Core (Unaudited) (Unaudited) (Unaudited) * (Unaudited) (Unaudited) Revenues Net Interest Income (3) 17,746$ 12$ 17,758$ 16,856$ 139$ 16,995$ Non-Interest Income 3,046 - 3,046 2,295 - 2,295 Gain(Loss) AFS 101 - 101 (89) - (89) Adjusted Revenues 20,691 12 20,703 19,240 139 19,379 Expenses Non-Interest Expense (4) 16,255 (803) 15,452 15,505 (23) 15,482 OREO 16 - 16 (48) - (48) Branch Write-Down 22 - 22 56 - 56 Adjusted Expenses 16,239$ (803)$ 15,436$ 15,497$ (23)$ 15,474$ Efficiency Ratio 78.48% 74.56% 80.55% 79.85% * Derived from audited consolidated financial statements. (1) Derived from the Core Operating Results by Segment table. (2) Annualized. (3) GAAP net interest income was adjusted for the write-off of premiums of $12,000 in 2019 and $139,000 in 2018 associated with USDA loans. (4) GAAP non-interest expenses was adjusted for the $760,000 in additional compensation expense associated with the accelerated vesting of the Company's restricted stock compensations plan and supplemental executive retirement plan during 2019 and additional audit and tax fees of $43,000 during 2019 and $23,000 during 2018 associated with the transition of our external auditors during 2018. Reconciliation of Non-GAAP Financial Measures (Dollars in thousands) FY 2019 FY 2018