Exhibit 99.1
and Trust Financial Corp. You're a Neighbor, Not a Number May 2015 Annual Shareholder Meeting
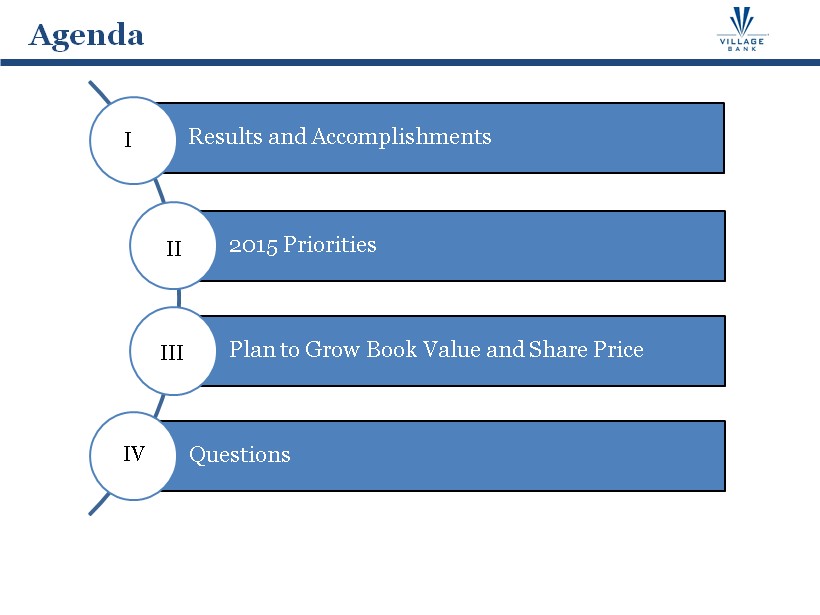
Agenda Results and Accomplishments 2015 Priorities Plan to Grow Book Value and Share Price Questions I II IV III
Cautionary Statement Regarding Forward - Looking Statements This presentation contains forward - looking statements within the meaning of the Private Securities Litigation Reform Act of 1995. These forward - looking statements include, but are not limited to, statements about (i) the Company’s plans, objectives, expectations and intentions and other statements contained in this presentation that are not historical facts; and (ii) other statements identified by words such as “expects” “anticipates,” “intends,” “plans,” “believes,” “seeks,” “estimates,” “targets,” “projects,” or words of similar meaning generally intended to identify forward - looking statements. These forward - looking statements are based on the current beliefs and expectations of the Company’s management and are inherently subject to significant business, economic and competitive uncertainties and contingencies, many of which are beyond management’s control. In addition, these forward - looking statements are subject to assumptions with respect to future business strategies and decisions that are subject to change. Actual results may differ materially from the anticipated results discussed or implied in these forward - looking statements because of numerous possible uncertainties. The following factors, among others, could cause actual results to differ materially from the anticipated results or other expectations expressed in the forward - looking statements : (1) adverse governmental or regulatory policies may be enacted; (2) the interest rate environment may compress margins and adversely affect net interest income; (3) results may be adversely affected by continued diversification of assets and adverse changes to credit quality; (4) competition from other financial services companies in the Company’s markets could adversely affect operations; (5) a continuance of the current economic slowdown could adversely affect credit quality and loan originations; and (6) social and political conditions such as war, political unrest and terrorism or natural disasters could have unpredictable negative effects on our businesses and the economy. Additional factors, that could cause actual results to differ materially from those expressed in the forward - looking statements are discussed in the Company’s reports (such as our Annual Report on Form 10 - K, Quarterly Reports on Form 10 - Q and Current Reports on Form 8 - K) filed with the Securities and Exchange Commission and available on the SEC’s Web site www.sec.gov.
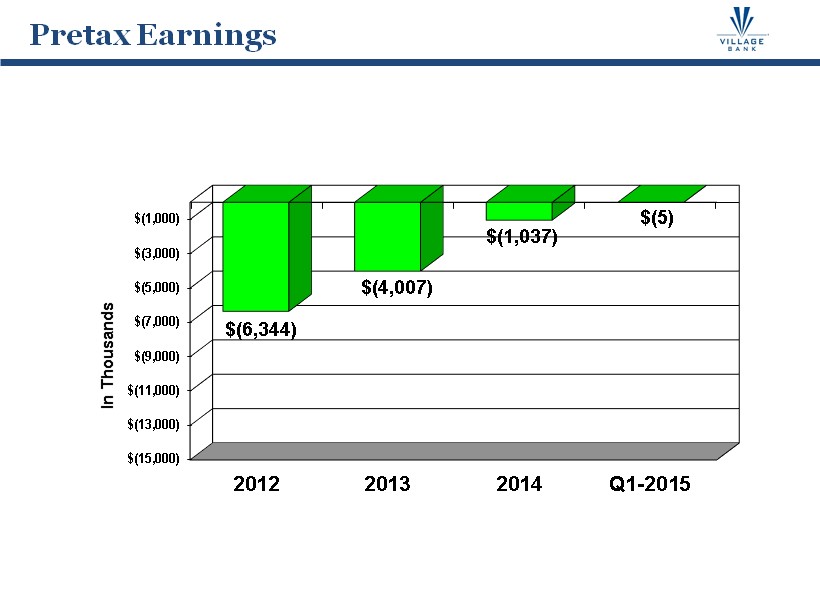
4 $(15,000) $(13,000) $(11,000) $(9,000) $(7,000) $(5,000) $(3,000) $(1,000) 2012 2013 2014 Q1-2015 $(6,344) $(4,007) $(1,037) $(5) In Thousands Pretax Earnings
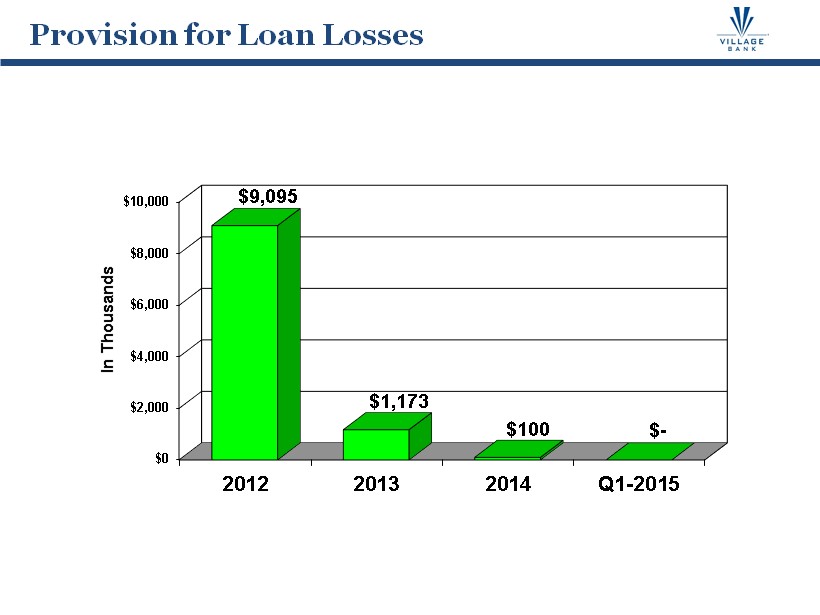
5 $0 $2,000 $4,000 $6,000 $8,000 $10,000 2012 2013 2014 Q1-2015 $9,095 $1,173 $100 $ - In Thousands Provision for Loan Losses
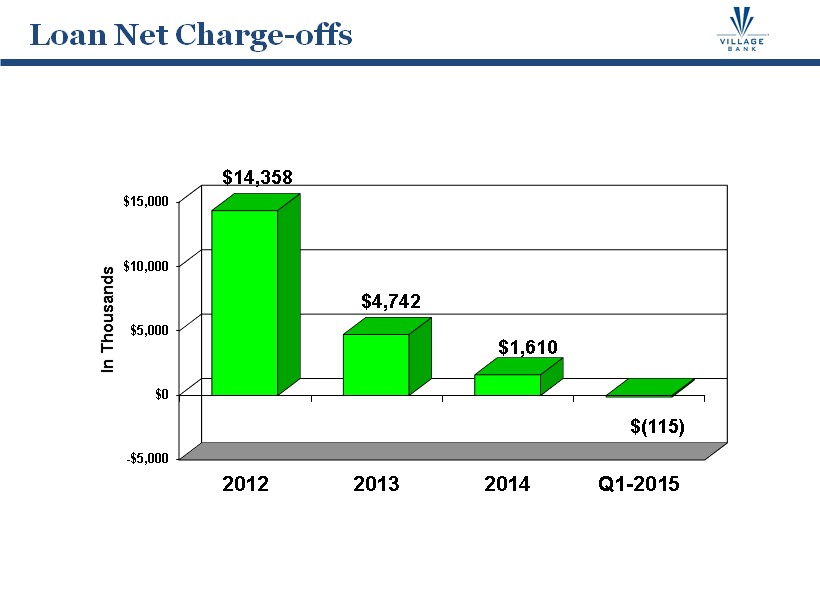
6 -$5,000 $0 $5,000 $10,000 $15,000 2012 2013 2014 Q1-2015 $14,358 $4,742 $1,610 $(115) In Thousands Loan Net Charge - offs
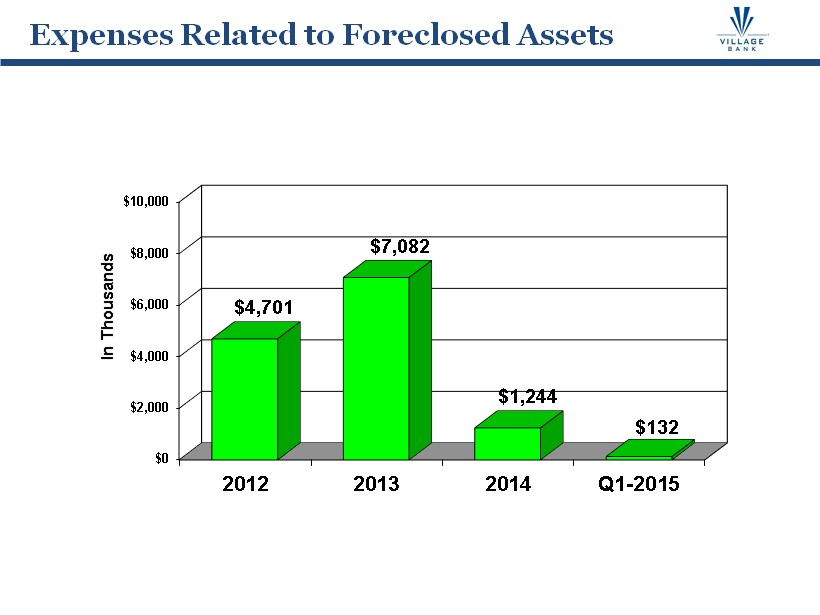
7 $0 $2,000 $4,000 $6,000 $8,000 $10,000 2012 2013 2014 Q1-2015 $4,701 $7,082 $1,244 $132 In Thousands Expenses Related to Foreclosed Assets
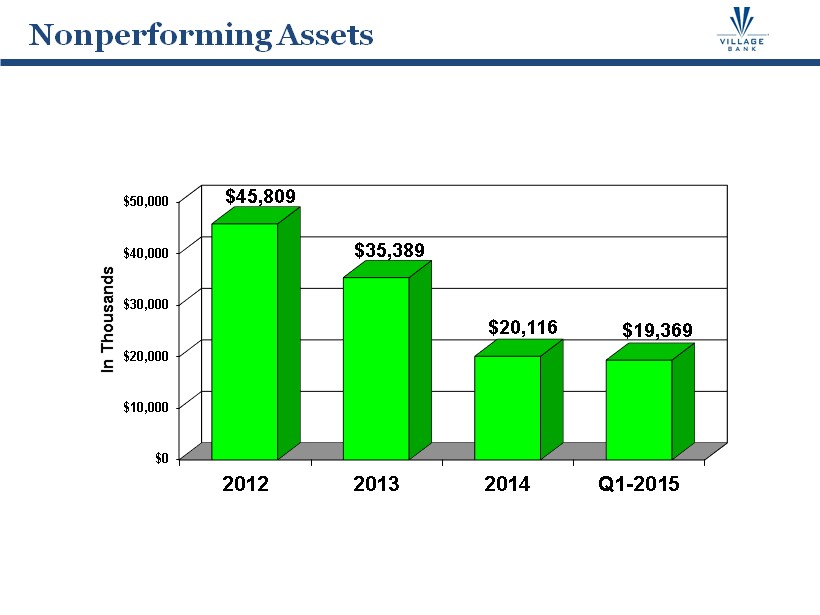
8 $0 $10,000 $20,000 $30,000 $40,000 $50,000 2012 2013 2014 Q1-2015 $45,809 $35,389 $20,116 $19,369 In Thousands Nonperforming Assets
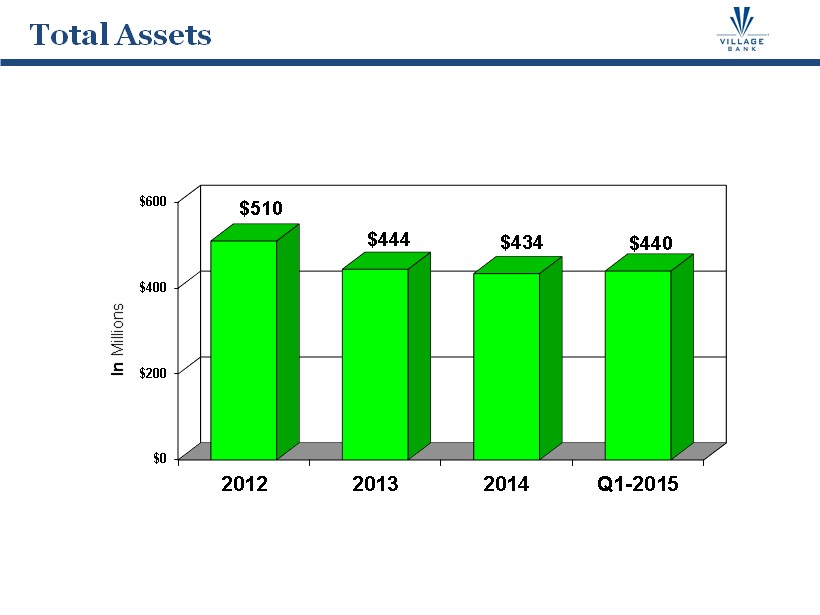
9 $0 $200 $400 $600 2012 2013 2014 Q1-2015 $510 $444 $434 $440 In Millions Total Assets
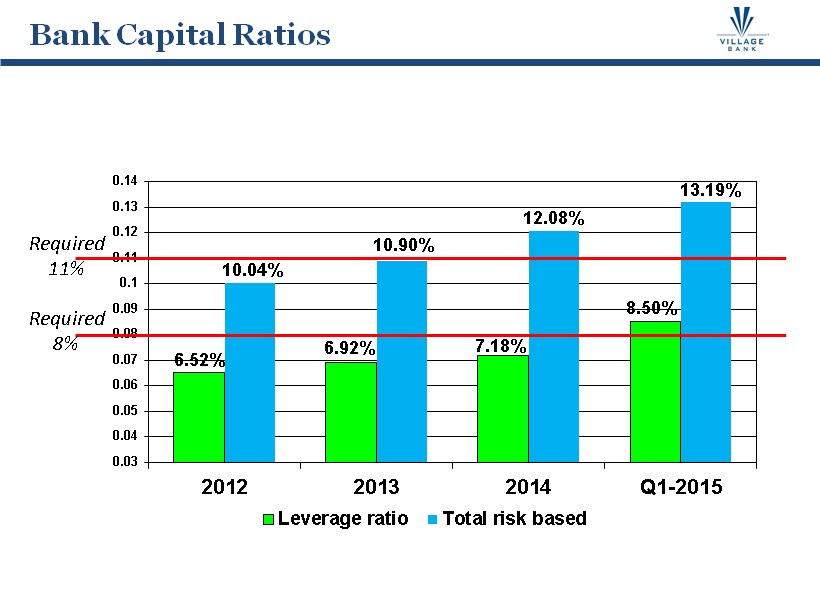
10 6.52% 6.92% 7.18% 8.50% 10.04% 10.90% 12.08% 13.19% 0.03 0.04 0.05 0.06 0.07 0.08 0.09 0.1 0.11 0.12 0.13 0.14 2012 2013 2014 Q1-2015 Leverage ratio Total risk based Bank Capital Ratios Required 11% Required 8%
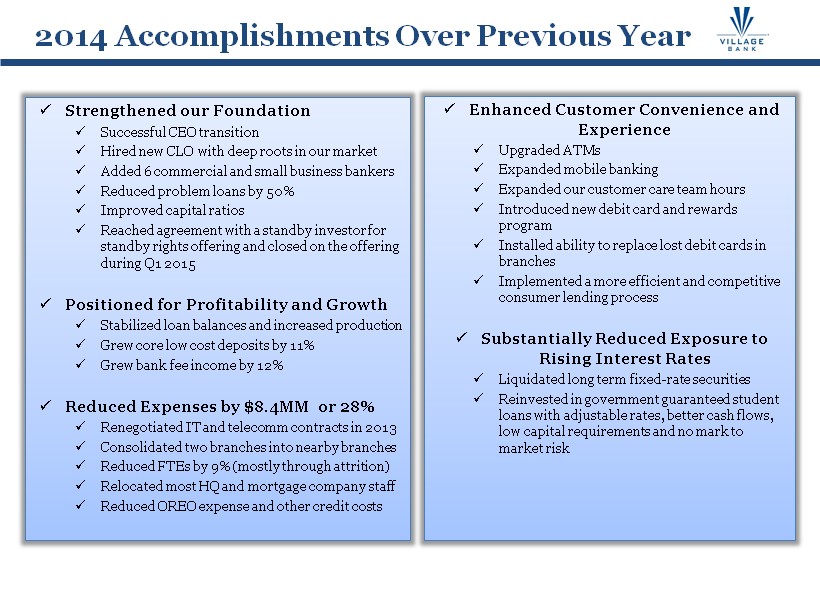
x Strengthened our Foundation x Successful CEO transition x Hired new CLO with deep roots in our market x Added 6 commercial and small business bankers x Reduced problem loans by 50% x Improved capital ratios x Reached agreement with a standby investor for standby rights offering and closed on the offering during Q1 2015 x Positioned for Profitability and Growth x Stabilized loan balances and increased production x Grew core low cost deposits by 11% x Grew bank fee income by 12% x Reduced Expenses by $8.4MM or 28% x Renegotiated IT and telecomm contracts in 2013 x Consolidated two branches into nearby branches x Reduced FTEs by 9% (mostly through attrition) x Relocated most HQ and mortgage company staff x Reduced OREO expense and other credit costs x Enhanced Customer Convenience and Experience x Upgraded ATMs x Expanded mobile banking x Expanded our customer care team hours x Introduced new debit card and rewards program x Installed ability to replace lost debit cards in branches x Implemented a more efficient and competitive consumer lending process x Substantially Reduced Exposure to Rising Interest Rates x Liquidated long term fixed - rate securities x Reinvested in government guaranteed student loans with adjustable rates, better cash flows, low capital requirements and no mark to market risk 2014 Accomplishments Over Previous Year
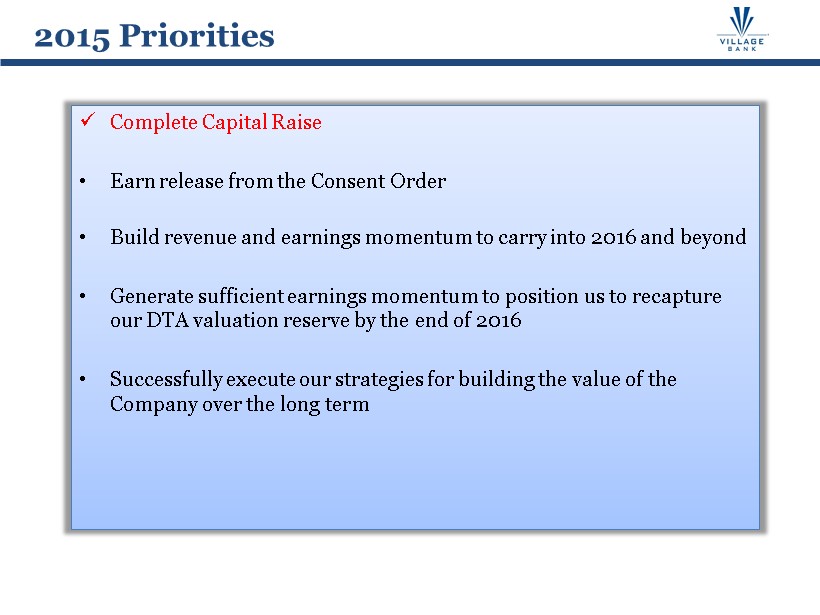
x Complete Capital Raise • Earn release from the Consent Order • Build r evenue and earnings momentum to carry into 2016 and beyond • Generate sufficient earnings momentum to position us to recapture our DTA valuation reserve by the end of 2016 • Successfully execute our strategies for building the value of the Company over the long term 2015 Priorities
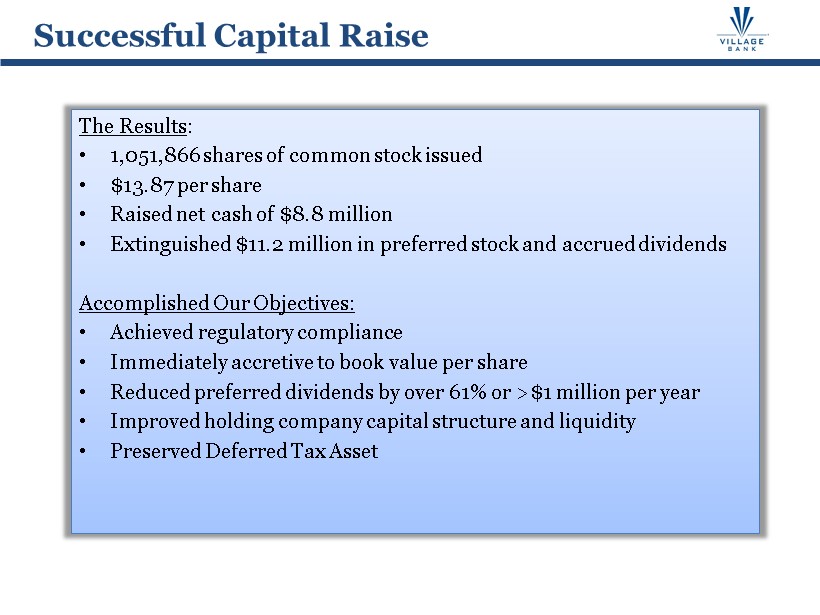
The Results : • 1,051,866 shares of common stock issued • $13.87 per share • Raised net cash of $8.8 million • Extinguished $11.2 million in preferred stock and accrued dividends Accomplished Our O bjectives: • Achieved regulatory compliance • Immediately accretive to book value per share • Reduced preferred dividends by over 61% or >$1 million per year • Improved holding company capital structure and liquidity • Preserved Deferred Tax Asset Successful Capital Raise
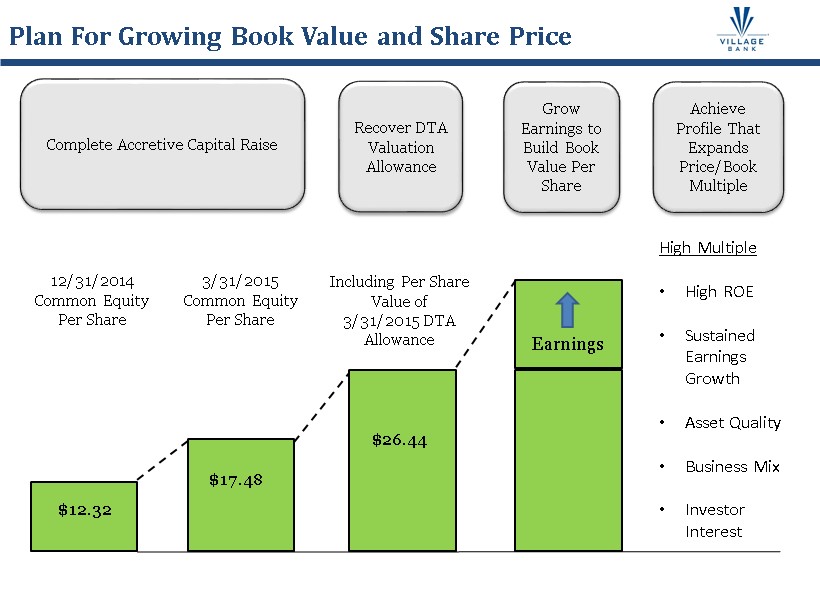
Complete Accretive Capital Raise Plan For Growing Book Value and Share Price $12.32 12/31/2014 Common Equity Per Share 3/31/2015 Common Equity Per Share $17.48 $26.44 Including Per Share Value of 3/31/2015 DTA Allowance Earnings High Multiple • High ROE • Sustained Earnings Growth • Asset Quality • Business Mix • Investor Interest Recover DTA Valuation Allowance Grow Earnings to Build Book Value Per Share Achieve Profile That Expands Price/Book Multiple
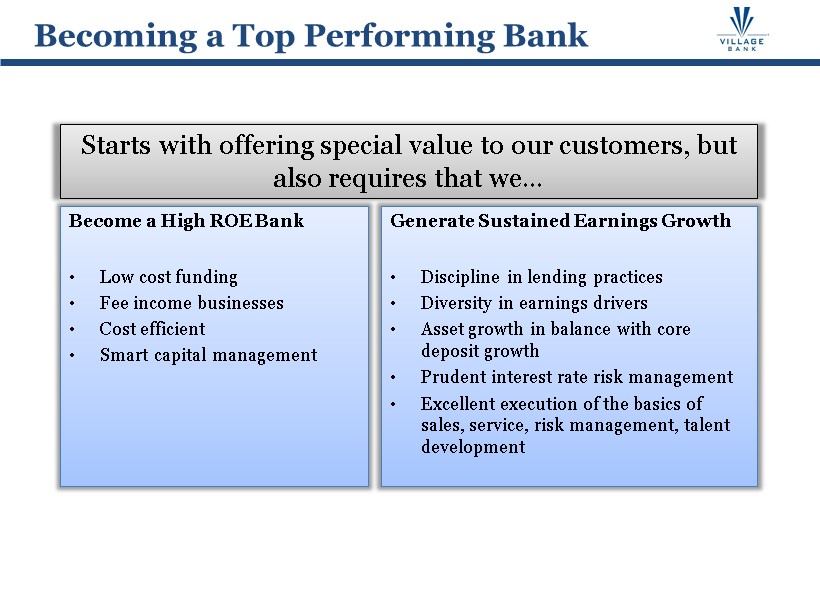
Become a High ROE Bank • Low cost funding • Fee income businesses • Cost efficient • Smart capital management Generate Sustained Earnings Growth • Discipline in lending practices • Diversity in earnings drivers • Asset growth in balance with core deposit growth • Prudent interest rate risk management • Excellent execution of the basics of sales, service, risk management, talent development Becoming a Top Performing Bank Starts with offering special value to our customers, but also requires that we…
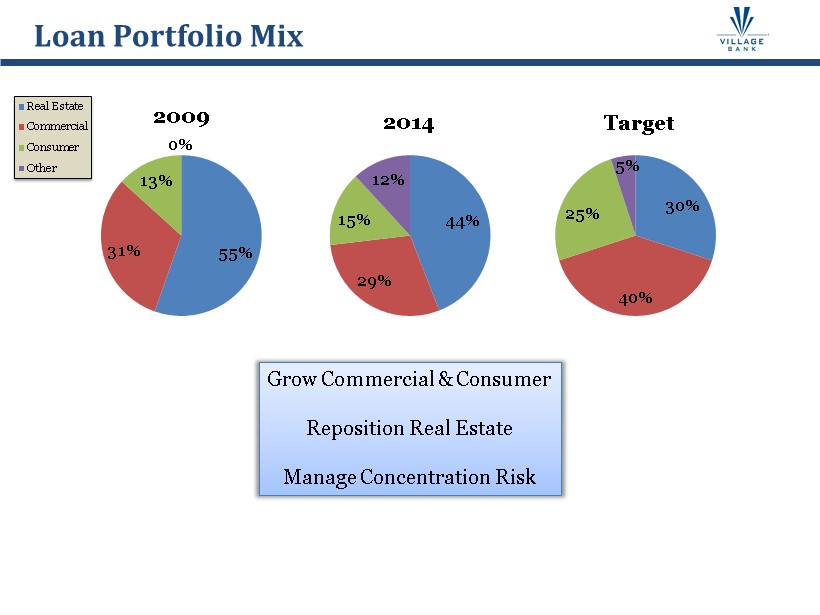
Loan Portfolio Mix 55% 31% 13% 0% 2009 Real Estate Commercial Consumer Other 44% 29% 15% 12% 2014 30% 40% 25% 5% Target Grow Commercial & Consumer Reposition Real Estate Manage Concentration Risk
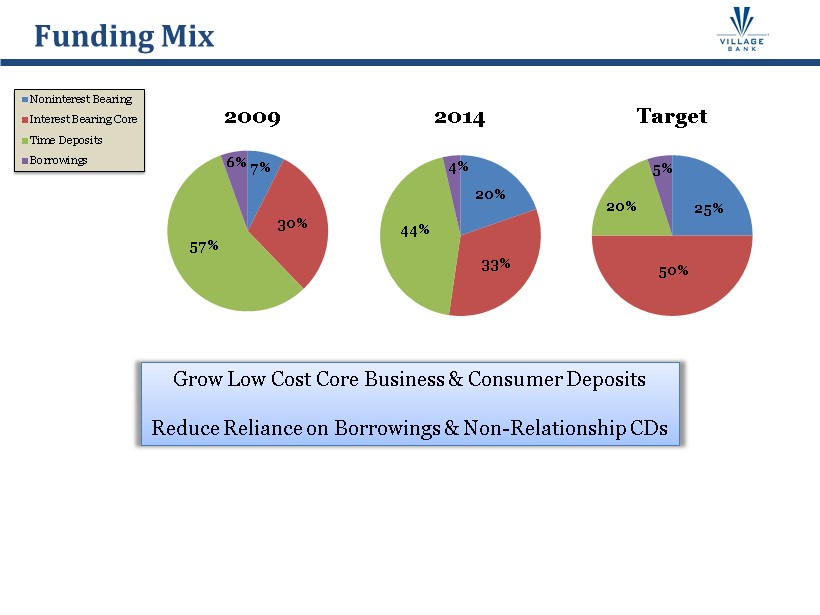
Funding Mix 7% 30% 57% 6% 2009 Noninterest Bearing Interest Bearing Core Time Deposits Borrowings 20% 33% 44% 4% 2014 25% 50% 20% 5% Target Grow Low Cost Core Business & Consumer Deposits Reduce Reliance on Borrowings & Non - Relationship CDs
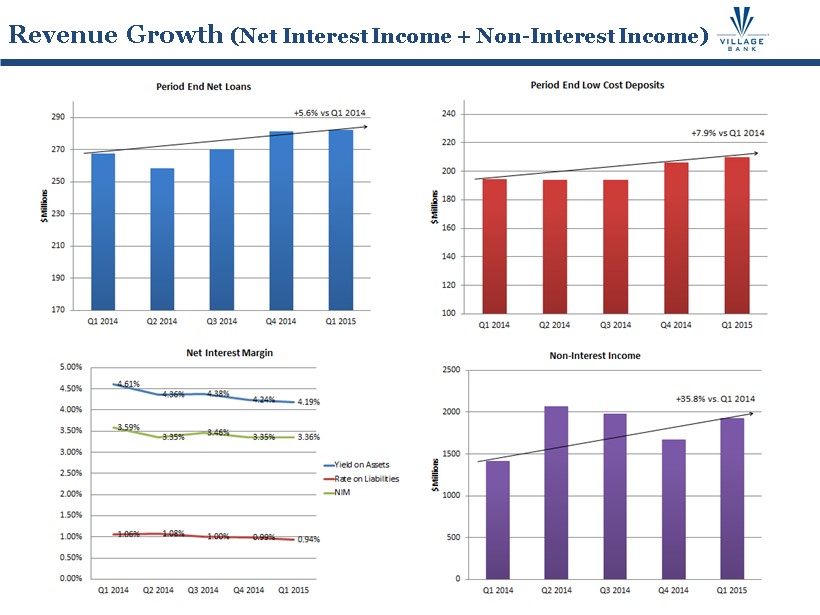
Revenue Growth (Net Interest Income + Non - Interest Income)
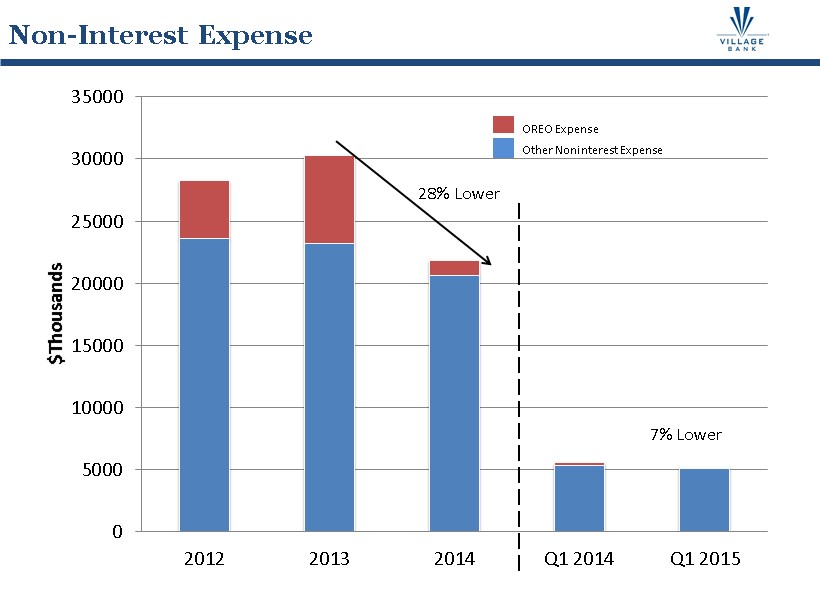
Non - Interest Expense 0 5000 10000 15000 20000 25000 30000 35000 2012 2013 2014 Q1 2014 Q1 2015 $Thousands OREO Expense Other Noninterest Expense 28% Lower 7% Lower
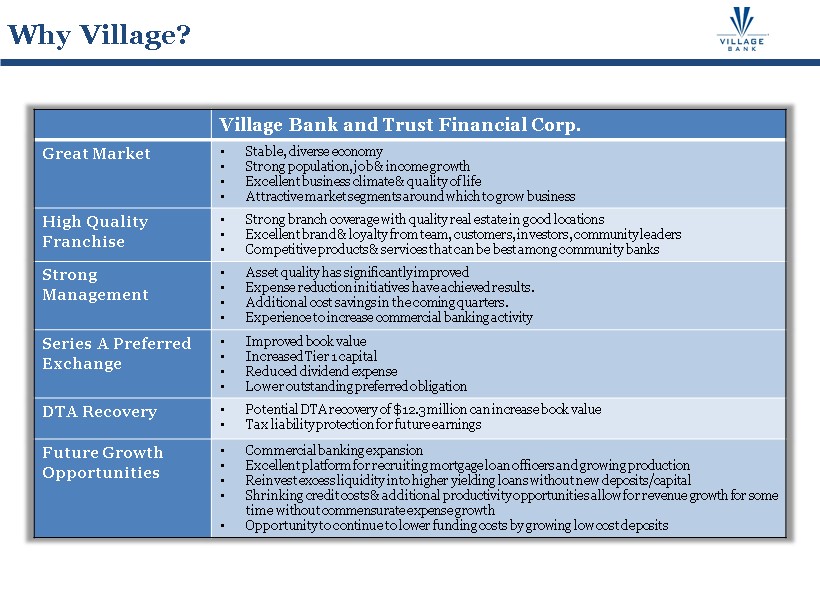
Why Village? Village Bank and Trust Financial Corp. Great Market • Stable , diverse economy • Strong population, job & income growth • Excellent business climate & quality of life • Attractive market segments around which to grow business High Quality Franchise • Strong branch coverage with quality real estate in good locations • Excellent brand & loyalty from team, customers, investors, community leaders • Competitive products & services that can be best among community banks Strong Management • Asset quality has significantly improved • Expense reduction initiatives have achieved results. • Additional cost savings in the coming quarters. • Experience to increase commercial banking activity Series A Preferred Exchange • Improved book value • Increased Tier 1 capital • Reduced dividend expense • Lower outstanding preferred obligation DTA Recovery • Potential DTA recovery of $12.3 million can increase book value • Tax liability protection for future earnings Future Growth Opportunities • Commercial banking expansion • Excellent platform for recruiting mortgage loan officers and growing production • Reinvest excess liquidity into higher yielding loans without new deposits/capital • Shrinking credit costs & additional productivity opportunities allow for revenue growth for some time without commensurate expense growth • Opportunity to continue to lower funding costs by growing low cost deposits