
You're a Neighbor, Not a Number 201 9 Annual Shareholders Meeting Exhibit 99.1

Cautionary Statement Regarding Forward - Looking Statements This presentation contains forward - looking statements within the meaning of the Private Securities Litigation Reform Act of 1995. These forward - looking statements include, but are not limited to, statements about ( i ) the Company’s plans, objectives, expectations and intentions and other statements contained in this presentation that are not historical facts; and (ii) other statements identified by words such as “expects” “anticipates,” “intends,” “plans,” “believes,” “seeks,” “estimates,” “targets,” “projects,” or words of similar meaning generally intended to identify forward - looking statements. These forward - looking statements are based on the current beliefs and expectations of the Company’s management and are inherently subject to significant business, economic and competitive uncertainties and contingencies, many of which are beyond management’s control. In addition, these forward - looking statements are subject to assumptions with respect to future business strategies and decisions that are subject to change. Actual results may differ materially from the anticipated results discussed or implied in these forward - looking statements because of numerous possible uncertainties. The following factors, among others, could cause actual results to differ materially from the anticipated results or other expectations expressed in the forward - looking statements: (1) adverse governmental or regulatory policies may be enacted; (2) the interest rate environment may compress margins and adversely affect net interest income; (3) results may be adversely affected by continued diversification of assets and adverse changes to credit quality; (4) competition from other financial services companies in the Company’s markets could adversely affect operations; (5) a change in the current economic environment could adversely affect credit quality and loan originations; and (6) social and political conditions such as war, political unrest and terrorism or natural disasters could have unpredictable negative effects on our businesses and the economy. Additional factors that could cause actual results to differ materially from those expressed in the forward - looking statements are discussed in the Company’s reports (such as our Annual Report on Form 10 - K, Quarterly Reports on Form 10 - Q and Current Reports on Form 8 - K) filed with the Securities and Exchange Commission and available on the SEC’s website at www.sec.gov. 2

Non - GAAP Financial Measures The accounting and reporting polices of the Company conform to generally accepted accounting principles (“GAAP”) in the United States and prevailing practices in the banking industry. However, management uses certain non - GAAP measures to supplement the evaluation of the Company’s performance. These measures include return on average tangible common equity for the consolidated entity and the commercial banking segment. Management believes presentations of these non - GAAP financial measures provide useful supplemental information that is essential to a proper understanding of the operating results of the Company’s core businesses. These non - GAAP disclosures should not be viewed as a substitute for operating results determined in accordance with GAAP, nor are they necessarily comparable to non - GAAP performance measures that may be presented by other companies. Reconciliations of GAAP to non - GAAP disclosures are included as tables at the end of this presentation. 3

Company Overview Corporate Data Headquarters: 13319 Midlothian Turnpike Midlothian, VA 23113 Phone: (804) 897 - 3900 Web Address: www.villagebank.com Chairman: Craig Bell President & CEO: Bill Foster Executive VP & CFO: Donnie Kaloski Executive VP, COO & CRO: Jay Hendricks 4 Assets ($000) 522,274$ TCE/TA (%) 7.21% Tangible Book Value ($) 26.64$ Bank Leverage Ratio 9.46% Net Interest Margin 3.83% NPAs/Assets (%) 0.51% Reserves/Non-accrual loans (%) 143.27% Reserves/Loans(%) 0.72% Period Highlights - March 31, 2019

Our goal is to deliver top quartile l ong t erm returns for shareholders Return on Equity • Indicates how productively we invest shareholder capital • Internal capital generation to support growth • Capacity to pay dividends • Building book value per share • Earning hurdle rate of return EPS Growth • Growing earnings per share and book value per share • Today’s value is net present value of future earnings and cash flow Risk • Risk introduces uncertainty about the true value of assets, quality of earnings, sustainability of earnings and gets reflected in price to book value and price to earnings multiples. • Today’s value is really the net present value of expected future earnings and cash flows. Greater risk and uncertainty gets reflected in higher discount rate. 5 3 Key Factors That Drive Long Term Shareholder Returns:

Factors That Drive Long Term Shareholder Returns Return on Equity • Strategic Goals • Top quartile ROTCE • How We Accomplish This • Defend and expand net interest margin through: • Improving assets/earnings mix • Low cost deposit growth • Managing interest rate risk • Staying disciplined on loan and deposit pricing • Capital efficiency – use leverage in capital structure • Grow commercial banking noninterest income • Profitable and growing mortgage business • Operating leverage - grow revenues faster than expenses EPS Growth • Strategic Goals • Sustained earnings per share growth in high single digits • How We Accomplish This • Competitively differentiated commercial, consumer and mortgage banking offerings • Excellent execution of sales process Risk • Strategic Goals • Best quartile earnings volatility • Best quartile asset quality in worst part of cycle • How We Accomplish This • Exceptional, disciplined risk management • Limit exposure to highest risk loan categories (land acquisition & development, construction of “for sale” product, spec construction) • Build diverse sources of revenues and earnings 6

Price Per Share Growth 7 $13.87 $19.00 $26.70 $30.65 $30.45 $32.60 79.33% 109.31% 100.62% 127.82% 117.70% 122.39% 50.00% 70.00% 90.00% 110.00% 130.00% 150.00% 170.00% $- $5.00 $10.00 $15.00 $20.00 $25.00 $30.00 $35.00 Q1 2015 YE 2015 YE 2016 YE 2017 YE 2018 Q1 2019 Price Per Share Price Per Share Price to Book Value 24% CAGR
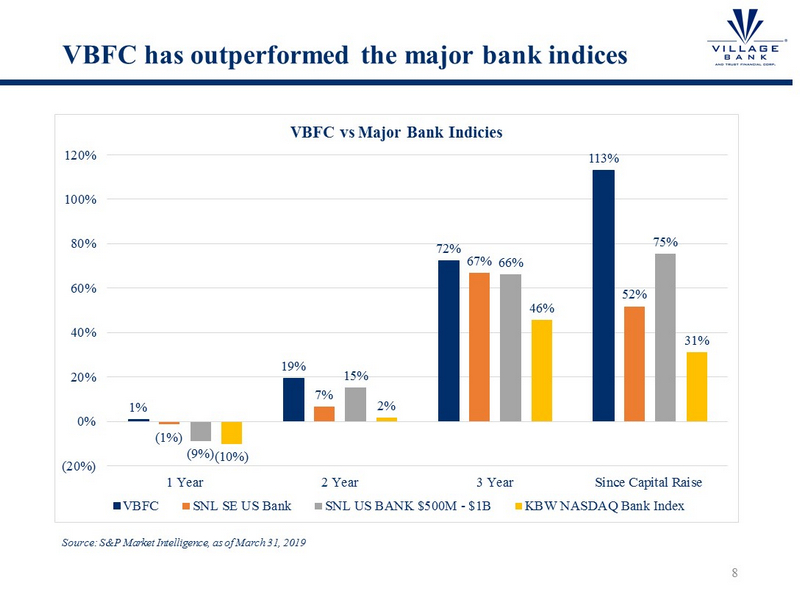
VBFC has outperformed the major bank indices 8 Source: S&P Market Intelligence, as of March 31, 2019 1% 19% 72% 113% (1%) 7% 67% 52% (9%) 15% 66% 75% (10%) 2% 46% 31% (20%) 0% 20% 40% 60% 80% 100% 120% 1 Year 2 Year 3 Year Since Capital Raise VBFC vs Major Bank Indicies VBFC SNL SE US Bank SNL US BANK $500M - $1B KBW NASDAQ Bank Index
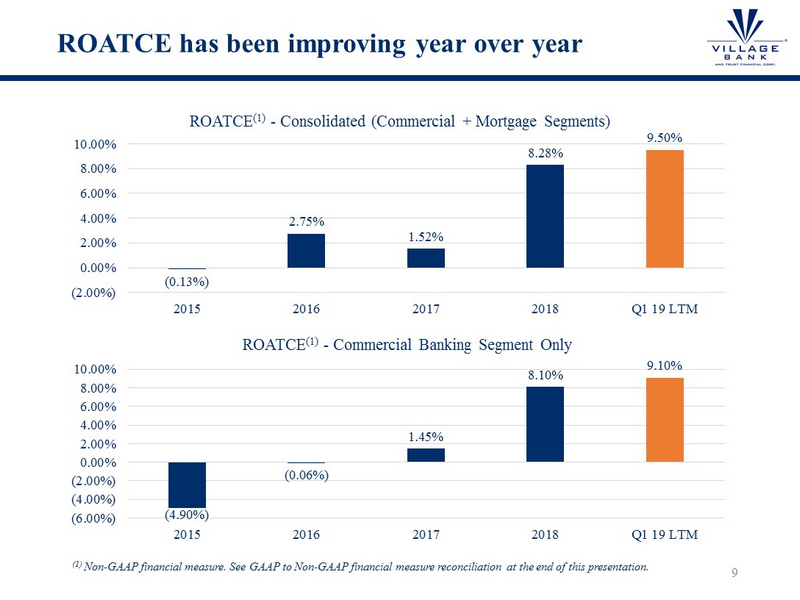
ROATCE has been improving year over year 9 (0.13%) 2.75% 1.52% 8.28% 9.50% (2.00%) 0.00% 2.00% 4.00% 6.00% 8.00% 10.00% 2015 2016 2017 2018 Q1 19 LTM ROATCE (1) - Consolidated (Commercial + Mortgage Segments) (4.90%) (0.06%) 1.45% 8.10% 9.10% (6.00%) (4.00%) (2.00%) 0.00% 2.00% 4.00% 6.00% 8.00% 10.00% 2015 2016 2017 2018 Q1 19 LTM ROATCE (1) - Commercial Banking Segment Only (1) Non - GAAP financial measure. See GAAP to Non - GAAP financial measure reconciliation at the end of this presentation.

ROATCE has been improving as we replace prior year quarters with stronger earnings 10 3.52% 7.44% 12.56% 9.29% 8.69% 9.50% 0.00% 2.00% 4.00% 6.00% 8.00% 10.00% 12.00% 14.00% Q1 2018 Q2 2018 Q3 2018 Q4 2018 Q1 2019 Q1 19 LTM ROATCE (1) – Consolidated (Commercial + Mortgage Segments) 5.53% 6.58% 10.71% 9.35% 9.64% 9.10% 0.00% 2.00% 4.00% 6.00% 8.00% 10.00% 12.00% Q1 2018 Q2 2018 Q3 2018 Q4 2018 Q1 2019 Q1 19 LTM ROATCE (1) - Commercial Banking Segment Only (1) Non - GAAP financial measure. See GAAP to Non - GAAP financial measure reconciliation at the end of this presentation.

Levers to Improve ROTCE and ROAA Plan for achieving targets • Maintain credit disciplines in underwriting, pricing, concentration risk management • Continue to grow core loans and low cost deposits at strong single digit pace • Trim low yielding assets as appropriate to expand margins • Sustain and expand bank noninterest income initiatives including selective sale of SBA guaranteed strips • Manage commercial banking segment noninterest expenses to deliver NIE/Assets <2.90 % • Grow mortgage banking production and earnings: • Help existing loan officers grow their production through more robust CRM , enhanced marketing , expanded product offerings, increased internal referrals and additional support from loan officer assistants • Actively recruit new loan officers 11 Metrics Y 2016 Y 2017 Y 2018 Q1 2019 Target Commercial Banking Segment Net Interest Income/Average Assets 3.03% 3.15% 3.38% 3.49% >3.50% Provision/Average Assets - - - - <0.15% Noninterest Income/Average Assets 0.86% 0.44% 0.46% 0.61% >0.50% Noninterest Expense/Average Assets 3.63% 3.28% 3.11% 3.23% <2.90% Mortgage Segment Net Income Before Tax/Average Assets 0.29% 0.01% 0.02% (0.09)% >0.30% Key Operating Metrics

Loan and Deposit Growth and Yield/Cost 12 $387,727 $403,350 $415,555 $414,430 $417,810 4.80% 4.90% 4.91% 4.98% 5.18% 4.50% 4.75% 5.00% 5.25% 5.50% $350,000 $360,000 $370,000 $380,000 $390,000 $400,000 $410,000 $420,000 Q1 2018 Q2 2018 Q3 2018 Q4 2018 Q1 2019 Loan Growth Total loans Yield on Loans 421,498 432,983 436,866 439,047 443,400 0.62% 0.62% 0.65% 0.74% 0.82% 0.25% 0.45% 0.65% 0.85% 1.05% 1.25% - 100,000 200,000 300,000 400,000 500,000 Q1 2018 Q2 2018 Q3 2018 Q4 2018 Q1 2019 Deposit Growth Relationship deposits Time deposits Cost of total deposits
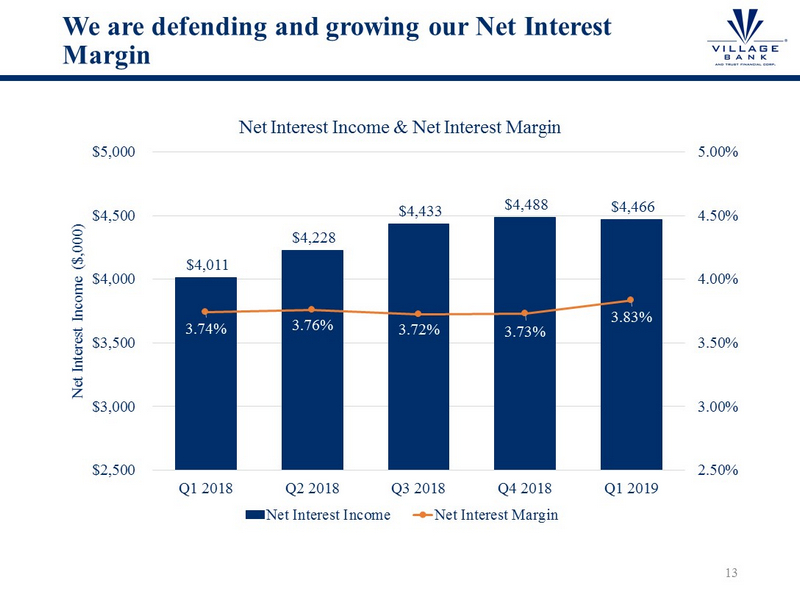
We are defending and growing our Net Interest Margin 13 $4,011 $4,228 $4,433 $4,488 $4,466 3.74% 3.76% 3.72% 3.73% 3.83% 2.50% 3.00% 3.50% 4.00% 4.50% 5.00% $2,500 $3,000 $3,500 $4,000 $4,500 $5,000 Q1 2018 Q2 2018 Q3 2018 Q4 2018 Q1 2019 Net Interest Income ($,000) Net Interest Income & Net Interest Margin Net Interest Income Net Interest Margin

Credit costs have a material impact on shareholder returns and reveal themselves primarily in a downturn… 14 Source: S&P Market Intelligence, based on average return on tangible common equity between 2007 and 2018 of Southeast Banks u nde r $1 billion in assets. 12.33% 8.52% 7.37% 8.81% 9.12% 10.90% 11.18% 11.62% 10.43% 9.28% 10.02% 10.92% 10.21% 0.00% 2.00% 4.00% 6.00% 8.00% 10.00% 12.00% 14.00% 0.00 0.50 1.00 1.50 2.00 2.50 3.00 2007 2008 2009 2010 2011 2012 2013 2014 2015 2016 2017 2018 Top Quartile of Southeast Banks ROATCE EPS Pre-Prov EPS 12 Year Avg. 10.48% 6.03% 4.09% 3.57% 1.28% 7.01% 8.61% 8.26% 7.50% 7.97% 7.07% 10.11% 6.86% 0.00% 1.00% 2.00% 3.00% 4.00% 5.00% 6.00% 7.00% 8.00% 9.00% 10.00% 0.00 0.25 0.50 0.75 1.00 1.25 1.50 1.75 2.00 2.25 2.50 2.75 2007 2008 2009 2010 2011 2012 2013 2014 2015 2016 2017 2018 Third Quartile of Southeast Banks ROATCE EPS Pre-Prov EPS 12 Year Avg.
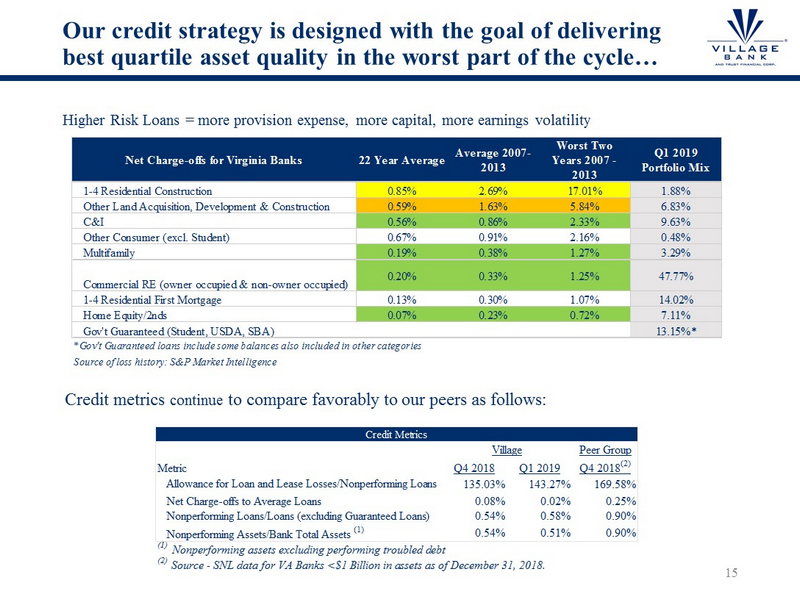
Our credit strategy is designed with the goal of delivering best quartile asset quality in the worst part of the cycle… Higher Risk Loans = more provision expense, more capital, more earnings volatility Credit metrics continue to compare favorably to our peers as follows: 15 Net Charge-offs for Virginia Banks 22 Year Average Average 2007- 2013 Worst Two Years 2007 - 2013 Q1 2019 Portfolio Mix 1-4 Residential Construction 0.85% 2.69% 17.01% 1.88% Other Land Acquisition, Development & Construction 0.59% 1.63% 5.84% 6.83% C&I 0.56% 0.86% 2.33% 9.63% Other Consumer (excl. Student) 0.67% 0.91% 2.16% 0.48% Multifamily 0.19% 0.38% 1.27% 3.29% Commercial RE (owner occupied & non-owner occupied) 0.20% 0.33% 1.25% 47.77% 1-4 Residential First Mortgage 0.13% 0.30% 1.07% 14.02% Home Equity/2nds 0.07% 0.23% 0.72% 7.11% Gov't Guaranteed (Student, USDA, SBA) 13.15%* *Gov't Guaranteed loans include some balances also included in other categories Source of loss history: S&P Market Intelligence Peer Group Q4 2018 Q1 2019 Q4 2018 (2) Allowance for Loan and Lease Losses/Nonperforming Loans 135.03% 143.27% 169.58% Net Charge-offs to Average Loans 0.08% 0.02% 0.25% Nonperforming Loans/Loans (excluding Guaranteed Loans) 0.54% 0.58% 0.90% Nonperforming Assets/Bank Total Assets (1) 0.54% 0.51% 0.90% Metric Village (1) Nonperforming assets excluding performing troubled debt Credit Metrics (2) Source - SNL data for VA Banks <$1 Billion in assets as of December 31, 2018.

As we indicated in 2018, we have been rebuilding capital ratios with stronger earnings and slower asset growth 16 Capital Ratio Trends 12.61% 12.11% 12.22% 12.46% 12.63% 9.08% 9.00% 8.96% 9.15% 9.46% 0.00% 2.00% 4.00% 6.00% 8.00% 10.00% 12.00% 14.00% Q1 2018 Q2 2018 Q3 2018 Q4 2018 Q1 2019 Bank Capital Ratios Total Risk Based Capital Tier 1 Leverage Well Capitalized Total Risk Based Well Capitalized Tier 1 Leverage 7.00% 6.87% 6.99% 7.21% 7.34% 6.60% 6.70% 6.80% 6.90% 7.00% 7.10% 7.20% 7.30% 7.40% Q1 2018 Q2 2018 Q3 2018 Q4 2018 Q1 2019 TCE Ratio
2019 Opportunities and Challenges • Opportunities • BB&T and STI merger (client disruption and branch divestitures) • Wells Fargo • Atlantic Union and Sonabank strategy changes • SBA guaranty strip sales • Mortgage recruiting • Challenges • Loan and relationship deposit growth has slowed in the broader market • Loan and deposit pricing pressures are squeezing margins at many banks. We are fighting those pressures but are not immune. 17

Conclusion • We have delivered better stock price performance than our peer group over the shorter and longer terms by constantly working on all of the levers that drive long term shareholder returns. • One of the most important drivers of long term shareholder returns will not reveal itself until we go through a downturn (risk or credit costs). • We believe that there will be tremendous market opportunity to take market share over the next 24 months. • We are very well positioned with our franchise, talent, capabilities and value proposition to grow share and profitability in that environment. • We offer exceptional service and execution for the mortgage banking and consumer banking services we provide. • We believe that we are, simply put, the best financial partner for small to mid - sized businesses, wealth building real estate investors, community based organizations, and the professionals who advise all of them. • We have meaningful capacity committed to growing the franchise (Williamsburg team and branch, branch coverage in Richmond and commercial bankers devoted to prospecting in Richmond). It costs us now, but it is an investment that will allow us to continue to grow revenues and EPS. 18

Questions Question and Answer Session Each questioner is asked to state his or her name and affiliation. Out of respect for other shareholders, we ask that each questioner be brief and to the point. Thank you 19

Reconciliation of Non - GAAP Financial Measures 20 2015 2016 2017 2018 Q1 19 LTM ROTCE Average shareholder's equity 28,171$ 34,819$ 43,743$ 36,523$ 36,129$ Less: average preferred stock (1)(2)(3) 6,843 5,715 5,130 1,229 - Average tangible common equity 21,328$ 29,104$ 38,613$ 35,294$ 36,129$ Net income (loss) available to common shareholders Consolidated (4)(5) (28)$ 799$ 587$ 2,924$ 3,434$ Commercial Banking Segment (4)(5) (1,046)$ (17)$ 559$ 2,860$ 3,287$ Return on Tangible Common Equity (6) Consolidated (0.13%) 2.75% 1.52% 8.28% 9.50% Commercial Banking Segment (4.90%) (0.06%) 1.45% 8.10% 9.10% (6) Q1 2019 LTM Annualized. Reconciliation of Non-GAAP Financial Measures (Dollars in thousands) (3) On March 30, 2018, the Company redeemed the remaining 5,027 shares ($5,027,000 aggregate liquidation value) of its Fixed Rate Cumulative Perpetual Preferred Stock, Series A. (5) Net income and net income available to common shareholders for the year ended December 31, 2017 was negatively impacted by the write-down of the net deferred tax asset of approximately $4,181,000 as a result of the reduction in the corporate income tax rate. The impact of the net deferred tax write-down was excluded from earnings for the year ended December 31, 2017 for comparability. (1) On March 27, 2015, the Company completed a rights offering to shareholders and concurrent standby offering to Kenneth R. Lehman. As part of the standby offering, Mr. Lehman forgave $6,619,000 in principal and accrued dividends on preferred shares. (2) On February 24, 2017, the Company redeemed 688 shares ($688,000 aggregate liquidation value) of its Fixed Rate Cumulative Perpetual Preferred Stock, Series A. (4) Net income and net income available to common shareholders for the year ended December 31, 2016 was positively impacted by the reversal of the valuation allowance on the net deferred tax asset of approximately $11,977,000 as a result of the consistent earnings and improved asset quality. The impact of the net deferred tax write-down was excluded from earnings for the year ended December 31, 2016 for comparability.
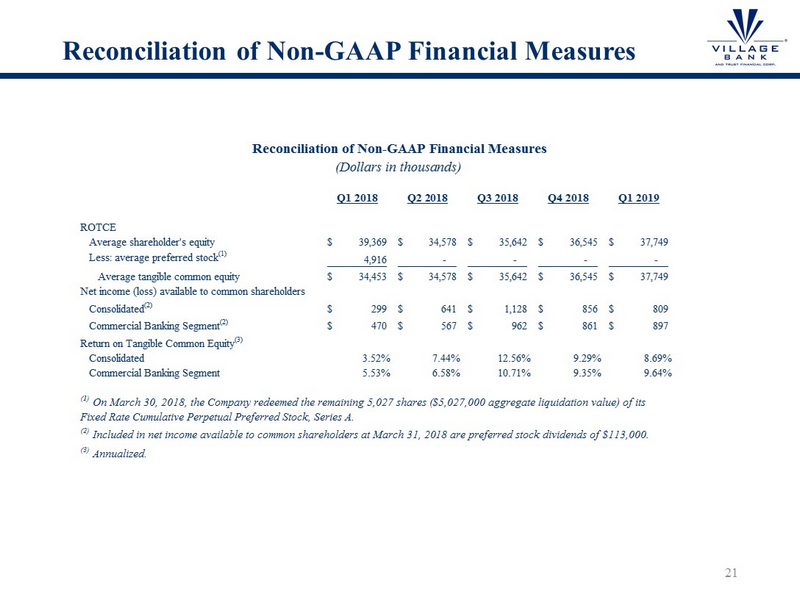
Reconciliation of Non - GAAP Financial Measures 21 Q1 2018 Q2 2018 Q3 2018 Q4 2018 Q1 2019 ROTCE Average shareholder's equity 39,369$ 34,578$ 35,642$ 36,545$ 37,749$ Less: average preferred stock (1) 4,916 - - - - Average tangible common equity 34,453$ 34,578$ 35,642$ 36,545$ 37,749$ Net income (loss) available to common shareholders Consolidated (2) 299$ 641$ 1,128$ 856$ 809$ Commercial Banking Segment (2) 470$ 567$ 962$ 861$ 897$ Return on Tangible Common Equity (3) Consolidated 3.52% 7.44% 12.56% 9.29% 8.69% Commercial Banking Segment 5.53% 6.58% 10.71% 9.35% 9.64% (3) Annualized. Reconciliation of Non-GAAP Financial Measures (Dollars in thousands) (2) Included in net income available to common shareholders at March 31, 2018 are preferred stock dividends of $113,000. (1) On March 30, 2018, the Company redeemed the remaining 5,027 shares ($5,027,000 aggregate liquidation value) of its Fixed Rate Cumulative Perpetual Preferred Stock, Series A.