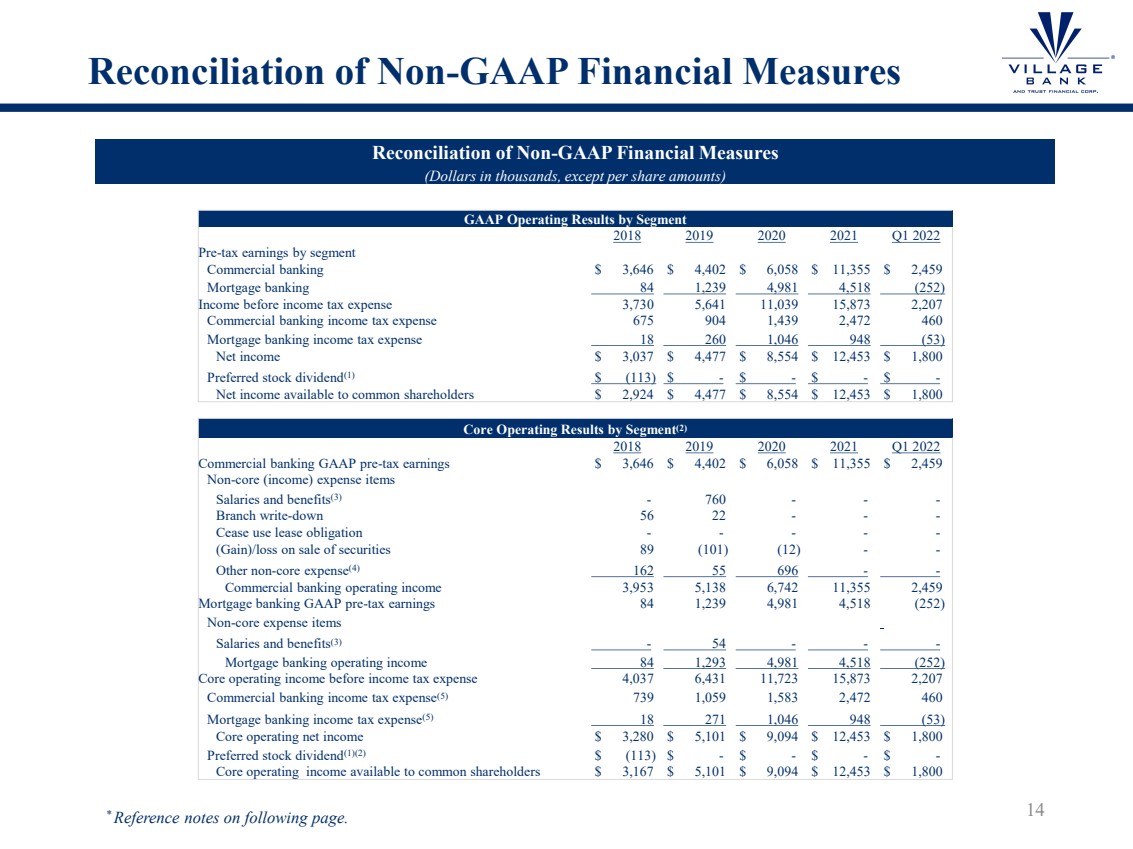
| Reconciliation of Non - GAAP Financial Measures 14 Reconciliation of Non - GAAP Financial Measures (Dollars in thousands, except per share amounts) * Reference notes on following page. GAAP Operating Results by Segment 2018 2019 2020 2021 Q1 2022 Pre - tax earnings by segment Commercial banking $ 3,646 $ 4,402 $ 6,058 $ 11,355 $ 2,459 Mortgage banking 84 1,239 4,981 4,518 (252) Income before income tax expense 3,730 5,641 11,039 15,873 2,207 Commercial banking income tax expense 675 904 1,439 2,472 460 Mortgage banking income tax expense 18 260 1,046 948 (53) Net income $ 3,037 $ 4,477 $ 8,554 $ 12,453 $ 1,800 Preferred stock dividend (1) $ (113) $ - $ - $ - $ - Net income available to common shareholders $ 2,924 $ 4,477 $ 8,554 $ 12,453 $ 1,800 Core Operating Results by Segment (2) 2018 2019 2020 2021 Q1 2022 Commercial banking GAAP pre - tax earnings $ 3,646 $ 4,402 $ 6,058 $ 11,355 $ 2,459 Non - core (income) expense items Salaries and benefits (3) - 760 - - - Branch write - down 56 22 - - - Cease use lease obligation - - - - - (Gain)/loss on sale of securities 89 (101) (12) - - Other non - core expense (4) 162 55 696 - - Commercial banking operating income 3,953 5,138 6,742 11,355 2,459 Mortgage banking GAAP pre - tax earnings 84 1,239 4,981 4,518 (252) Non - core expense items Salaries and benefits (3) - 54 - - - Mortgage banking operating income 84 1,293 4,981 4,518 (252) Core operating income before income tax expense 4,037 6,431 11,723 15,873 2,207 Commercial banking income tax expense (5) 739 1,059 1,583 2,472 460 Mortgage banking income tax expense (5) 18 271 1,046 948 (53) Core operating net income $ 3,280 $ 5,101 $ 9,094 $ 12,453 $ 1,800 Preferred stock dividend (1)(2) $ (113) $ - $ - $ - $ - Core operating income available to common shareholders $ 3,167 $ 5,101 $ 9,094 $ 12,453 $ 1,800 |