
Patrick Miller President and CEO Tim Trenary Chief Financial Officer Terry Hammett Treasurer and VP Investor Relations Commercial Vehicle Group, Inc. November 2017

Forward Looking Statements pg | 1 This presentation contains forward-looking statements that are subject to risks and uncertainties. These statements often include words such as "believe," "expect," "anticipate," "intend," "plan," "estimate," or similar expressions. In particular, this presentation may contain forward-looking statements about Company expectations for future periods with respect to its plans to improve financial results and enhance the Company, the future of the Company’s end markets, Class 8 North America build rates, performance of the global construction equipment business, expected cost savings, the Company’s initiatives to address customer needs, organic growth, the Company’s economic growth plans to focus on certain segments and markets and the Company’s financial position or other financial information. These statements are based on certain assumptions that the Company has made in light of its experience in the industry as well as its perspective on historical trends, current conditions, expected future developments and other factors it believes are appropriate under the circumstances. Actual results may differ materially from the anticipated results because of certain risks and uncertainties, including but not limited to: (i) general economic or business conditions affecting the markets in which the Company serves; (ii) the Company's ability to develop or successfully introduce new products; (iii) risks associated with conducting business in foreign countries and currencies; (iv) increased competition in the heavy-duty truck, construction, aftermarket, military, bus, agriculture and other markets; (v) the Company’s failure to complete or successfully integrate strategic acquisitions; (vi) the impact of changes in governmental regulations on the Company's customers or on its business; (vii) the loss of business from a major customer or the discontinuation of particular commercial vehicle platforms; (viii) security breaches and other disruptions to our information systems and our business; (ix) the Company’s ability to obtain future financing due to changes in the lending markets or its financial position; (x) the Company’s ability to comply with the financial covenants in its revolving credit facility and term loan facility; (xi) fluctuation in interest rates relating to the Company's term loan facility and revolving credit facility; (xii) the Company’s ability to realize the benefits of its cost reduction and strategic initiatives; (xiii) a material weakness in our internal control over financial reporting which could, if not remediated, result in material misstatements in our financial statements; (xiv) volatility and cyclicality in the commercial vehicle market adversely affecting us; (xv) the geographic profile of our taxable income and changes in valuation of our deferred tax assets and liabilities impacting our effective tax rate; (xvi) changes to domestic manufacturing initiatives impacting our effective tax rate related to products manufactured either in the United States or in international jurisdictions; (xvii) implementation of tax changes, by the United States or another international jurisdiction, related to products manufactured in one or more jurisdictions where we do business; and (xviii) various other risks as outlined under the heading "Risk Factors" in the Company's Annual Report on Form 10-K for fiscal year ending December 31, 2016 and Quarterly Report on Form 10-Q for the quarterly period ended June 30, 2017. There can be no assurance that statements made in this presentation relating to future events will be achieved. The Company undertakes no obligation to update or revise forward-looking statements to reflect changed assumptions, the occurrence of unanticipated events or changes to future operating results over time. All subsequent written and oral forward-looking statements attributable to the Company or persons acting on behalf of the Company are expressly qualified in their entirety by such cautionary statements.
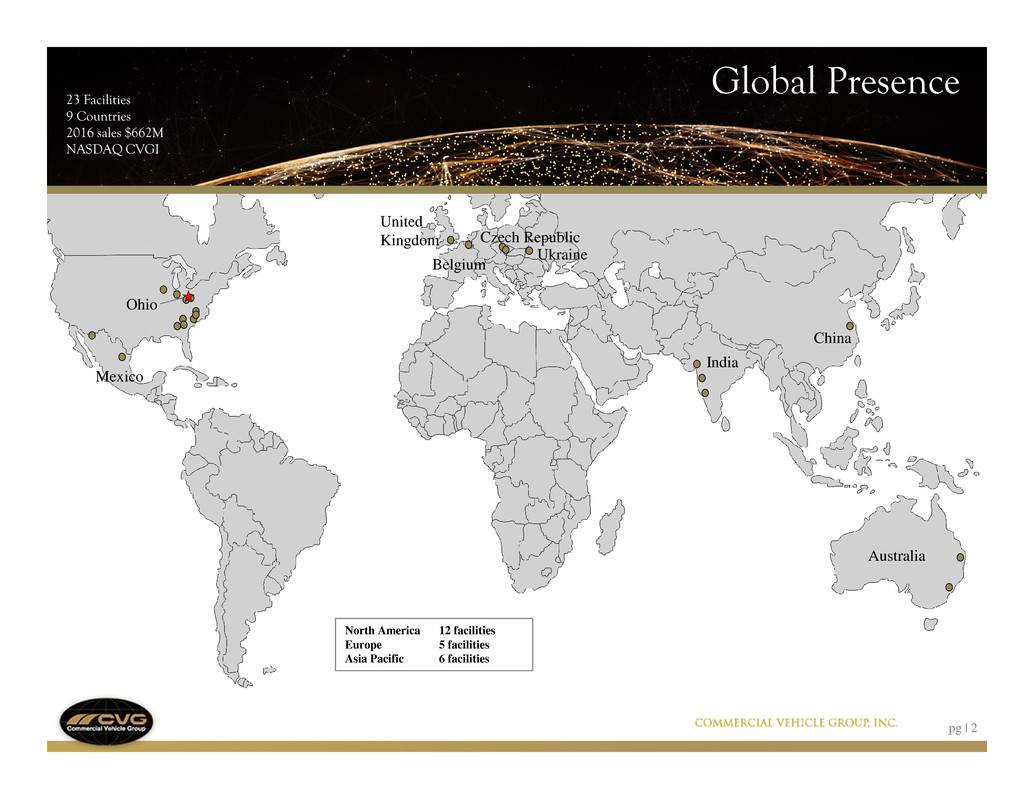
23 Facilities 9 Countries 2016 sales $662M NASDAQ CVGI pg | 2 Global Presence North America 12 facilities Europe 5 facilities Asia Pacific 6 facilities Mexico Australia Ohio United Kingdom Belgium Czech Republic Ukraine India China
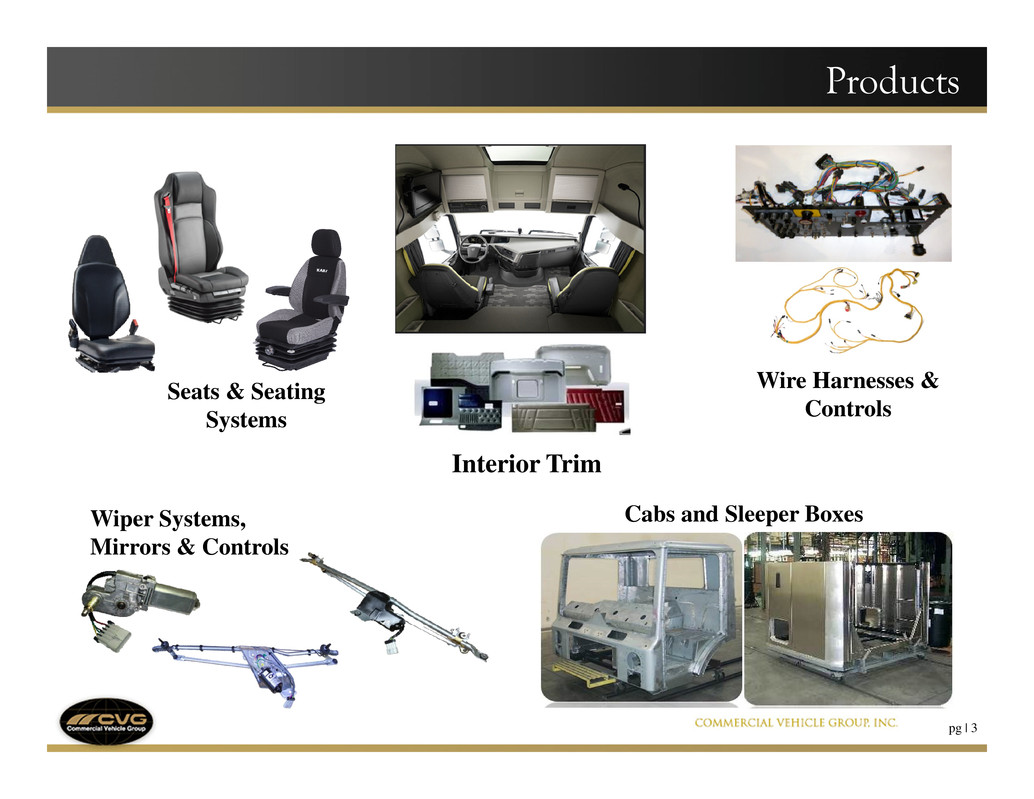
pg | 3 Products Seats & Seating Systems Cabs and Sleeper BoxesWiper Systems, Mirrors & Controls Wire Harnesses & Controls Interior Trim

2016 Sales - $662 Million pg | 4 78% 11% 11% N. America EMEA APAC 42% 19% 5%2% 18% 14% OEM Truck OEM Construction OEM Bus OEM Agriculture Aftermarket Other 42% 23% 20% 9% 6% Seats Wire Harnesses Trim Structures Wipers / Mirrors 17% 15% 10% 7%6% 6% 39% Volvo Daimler Paccar Caterpillar John Deere Navistar All Other Region End Market Product Customer
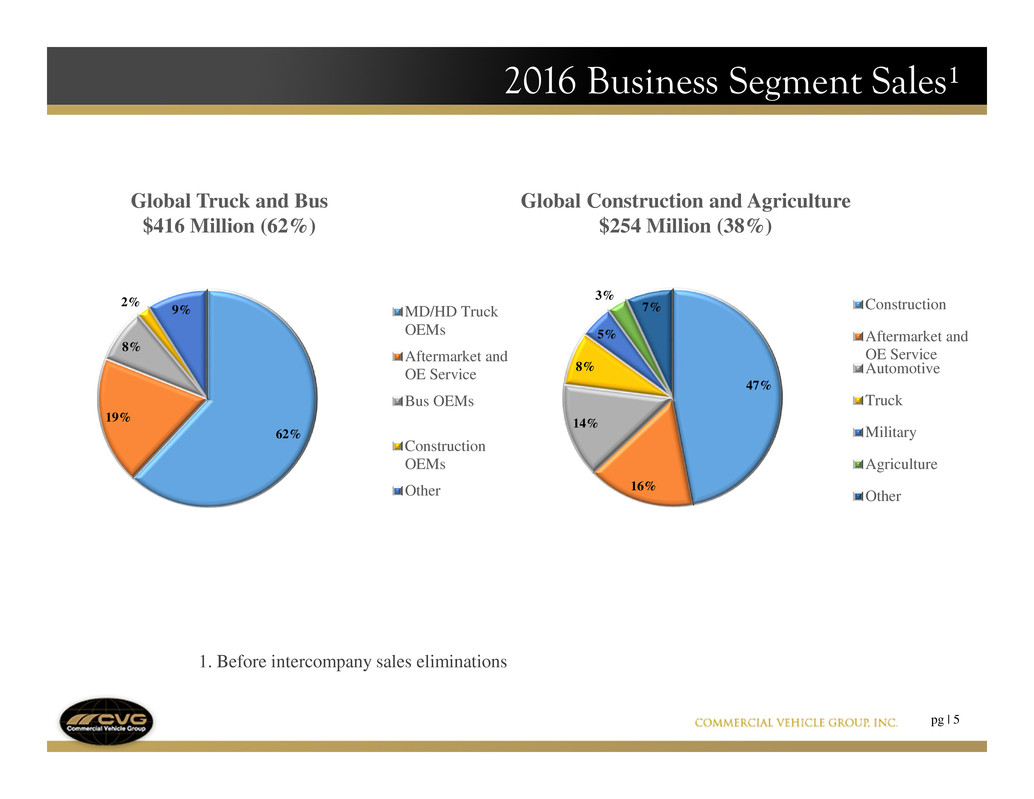
2016 Business Segment Sales¹ pg | 5 1. Before intercompany sales eliminations 62% 19% 8% 2% 9% MD/HD Truck OEMs Aftermarket and OE Service Bus OEMs Construction OEMs Other Global Truck and Bus $416 Million (62%) 47% 16% 14% 8% 5% 3% 7% Construction Aftermarket and OE Service Automotive Truck Military Agriculture Other Global Construction and Agriculture $254 Million (38%)

pg | 6 North American Truck Build Rates 2016 CVG Sales by End Market (‘000s of units) 228 256 322 295 244 263 280 2016A 2017E 2018E 2019E 2020E 2021E 2022E Heavy-Duty Truck (Class 8) 233 250 251 258 271 265 275 2016A 2017E 2018E 2019E 2020E 2021E 2022E 42% 19% 5% 2% 18% 14% OEM Truck OEM Bus OEM Agriculture Aftermarket* Other OEM ConstructionMedium-Duty Trucks (Class 5-7) Source: Company website and filings, ACT Research. * Each segment has aftermarket exposure. • Forecasting services recently increased Class 8 builds for 2017 and 2018 • October 2017 order level highest since December 2014 (34 months) • Freight tonnage and pricing is moving in positive direction Industry Outlook – North America Truck

??? ??? ??? ??? ??? ??? ??? ??? ??? ??? ??? ????? ?? ?? ?? ?? ????? ??? ??? ??? ??? ?????? ??? ??? ??? ??? ??? ????? ????? ????? ????? ????? ????? ???????????? ?????? ????????????? ???????????? ??????? ????????????? (‘000s of units) pg | 7 Industry Outlook – Global Construction Global Sales of Construction Equipment 2016 CVG Sales by End Market 42% 19% 5% 2% 18% 14% OEM Truck OEM Bus OEM Agriculture Aftermarket* Other Market Observations OEM Construction Source: Millmark Associates (Oct 2016), VDMA (2016), Customer S&OP data, and Wall Street Research. Reflects select platforms in Crane, Earthmoving equipment, and Paving. * Each segment has aftermarket exposure. 1,267 1,325 1,330 1,303 square4 Positive economic fundamentals. Consumer spending, fueled by wage and job growth, may continue to translate into housing demand. Expected tailwinds from infrastructure spending. Low machinery inventories and high rental utilization has triggered demand increase. square4 Elevated construction growth in Asia, Europe, and North America square4 North America – Up 30% in Q3 2017 versus Q3 2016 square4 Europe – HD-MD machinery demand up 17% Q3 2017 versus Q3 2016 square4 Construction output continues to be supported by consumer spending, housing recovery, and global trade. square4 Commodity pricing, housing growth in top tier cities, combined with stimulus plans have contributed to significant machinery growth in 2017. Continued growth expected through short term outlook. 1,090 1,290

Strategies to Improve the Core pg | 8 ??????????????? ??????????????? ?????????? ????? head2right CVG Digital – Digitalize processes, design, production, and products square4 Updating manufacturing and support processes – connectivity square4 Benefits – Increased efficiency, quality, and reduction of working capital head2right Process investments square4 Proprietary automated processes for interior trim in North America square4 Updated high volume seat assembly cells in US and UK square4 Expanding wire harness capacity – Europe, North America and Asia square4 Lean Six Sigma program (Operational Excellence) – Training and program expansion continues globally head2right Restructuring plan announced November 2015 square4 SG&A actions fully implemented in 2016 square4 Remaining operational changes – expect completion by end of 2017

Examples of CVG Digital Actions pg | 9 ??????????????? ??????????????? ?????????? ????? Virtual Wiring Boards for high proliferation Built-in Quality – Digital error proofing and smart processes Real time process monitoring and data tracking Digital design and validation speeds product development

Improving the Foundation pg | 10 ??????????????? ??????????????? ?????????? ????? Institutionalizing Lean Culture Reducing Working Capital Cost Focus to lower Break-Even Investing in Innovation Next Gen Product Growth Initiatives Customer Support CVG Digital Actions Optimizing Manufacturing Footprint Stronger Performance throughout the cycle
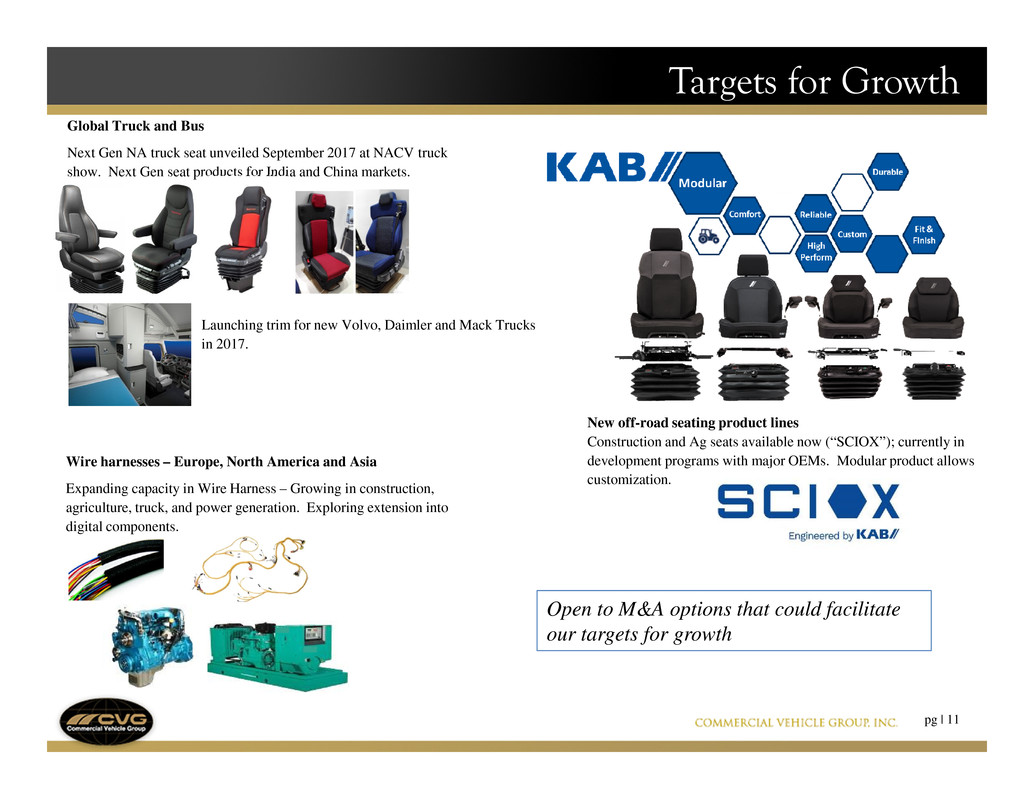
Targets for Growth pg | 11 Global Truck and Bus Next Gen NA truck seat unveiled September 2017 at NACV truck show. Next Gen seat products for India and China markets. Wire harnesses – Europe, North America and Asia Expanding capacity in Wire Harness – Growing in construction, agriculture, truck, and power generation. Exploring extension into digital components. New off-road seating product lines Construction and Ag seats available now (“SCIOX”); currently in development programs with major OEMs. Modular product allows customization. Open to M&A options that could facilitate our targets for growth Launching trim for new Volvo, Daimler and Mack Trucks in 2017.
Finance Update

pg | 13 Outlook for medium and heavy duty truck production 000’s)* Class 8 Class 5-7 * Source: ACT Research See appendix for reconciliation of GAAP to non-GAAP financial measures Financial Results (Dollars in millions) Q3 2016 Q3 2017 Sales $ 153.6 $ 198.3 Up 29% Gross Profit $ 18.9 $ 25.2 MX labor shortage ? $2 million Q3 '17 impact Margin 12.3 % 12.7 % SG&A $ 14.1 $ 14.1 Cost discipline in rising sales environment Operating Income $ 4.5 $ 10.7 Margin 2.9 % 5.4 % Adjusted Operating Income $ 6.0 $ 11.1 Almost double Margin 3.9 % 5.6 % N.A. Class 8 Production (000's) 54 73 N.A. Class 5 - 7 Production (000's) 52 62

pg | 14 Business Segments1 1 Before intercompany sales eliminations See appendix for reconciliation of GAAP to non-GAAP financial measures (Dollars in millions) Global Truck & Bus Global Construction & Agriculture Sales $ 122.0 $ 79.6 Gross Profit $ 17.2 $ 8.3 MX labor shortage ? $2 million Q3 '17 impact Margin 14.1 % 10.5 % SG&A $ 5.5 $ 4.2 Operating Income $ 11.4 $ 4.1 Margin 9.3 % 5.2 % Adjusted Operating Income $ 11.7 $ 4.1 Margin 9.6 % 5.2 % Three Months Ended September 30, 2017

See appendix for reconciliation of GAAP to non-GAAP financial measures pg | 15 Capital Structure Capital Allocation: 1.) liquidity 2.) growth 3.) de-leverage 4.) return capital to shareholders 1 Refinanced $235 million in Senior Secured Notes with an Institutional Term Loan in April 2017 LTM Q1 LTM Q3 1 (Dollars in millions) 2017 2017 Principal Balance $ 174 Debt $ 235 $ 174 Interest Rate LIBOR + 600 Less: Cash 119 50 Maturity April 2023 Net Debt $ 116 $ 124 Interest Rate Swap $ 80 Adjusted EBITDA $ 44 $ 49 Interest Rate 8.07% Maturity April 2022 Adjusted Gross Leverage 5.3 X 3.6 X Adjusted Net Leverage 2.6 X 2.5 X Commitment $ 65 Availability $ 63 Liquidity: Letters of Credit $ 2 Cash $ 50 Accordion $ 40 ABL Borrowing Base 65 Less: LOC (2) Liquidity $ 113 Moody's B2 / Stable S&P B / Stable Term Loan1 New Asset Based Credit Facility Agency Ratings

Appendix GAAP to Non-GAAP Reconciliation
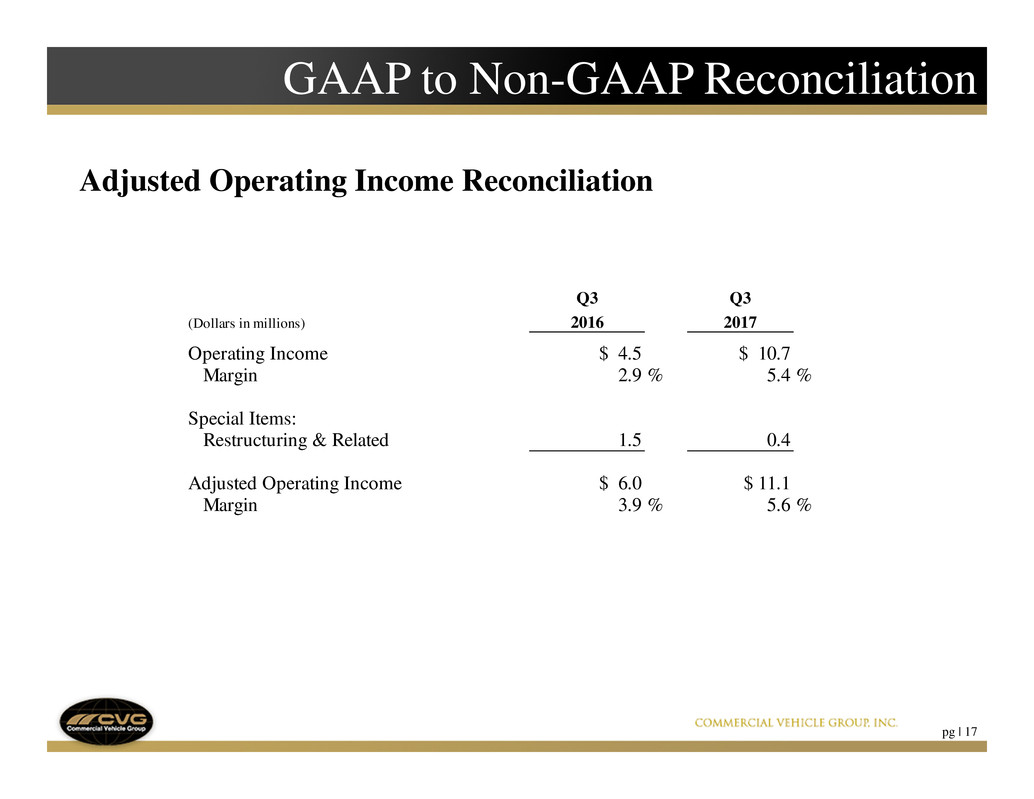
pg | 17 GAAP to Non-GAAP Reconciliation Adjusted Operating Income Reconciliation Q3 Q3 (Dollars in millions) 2016 2017 Operating Income $ 4.5 $ 10.7 Margin 2.9 % 5.4 % Special Items: Restructuring & Related 1.5 0.4 Adjusted Operating Income $ 6.0 $ 11.1 Margin 3.9 % 5.6 %

EBITDA & Adjusted EBITDA Reconciliation pg | 18 GAAP to Non-GAAP Reconciliation LTM LTM (Dollars in millions) Q1 2017 Q3 2017 Net Income $ 4.8 $ 5.9 Interest Expense 19.3 20.6 Tax Provision (1.7) 2.1 Depreciation 14.7 14.0 Amortization 1.3 1.3 EBITDA $ 38.4 $ 43.9 Restructuring & Related 4.3 3.6 Insurance Recovery (0.7) (0.7) Litigation Settlement 2.3 2.3 Adjusted EBITDA $ 44.3 $ 49.1
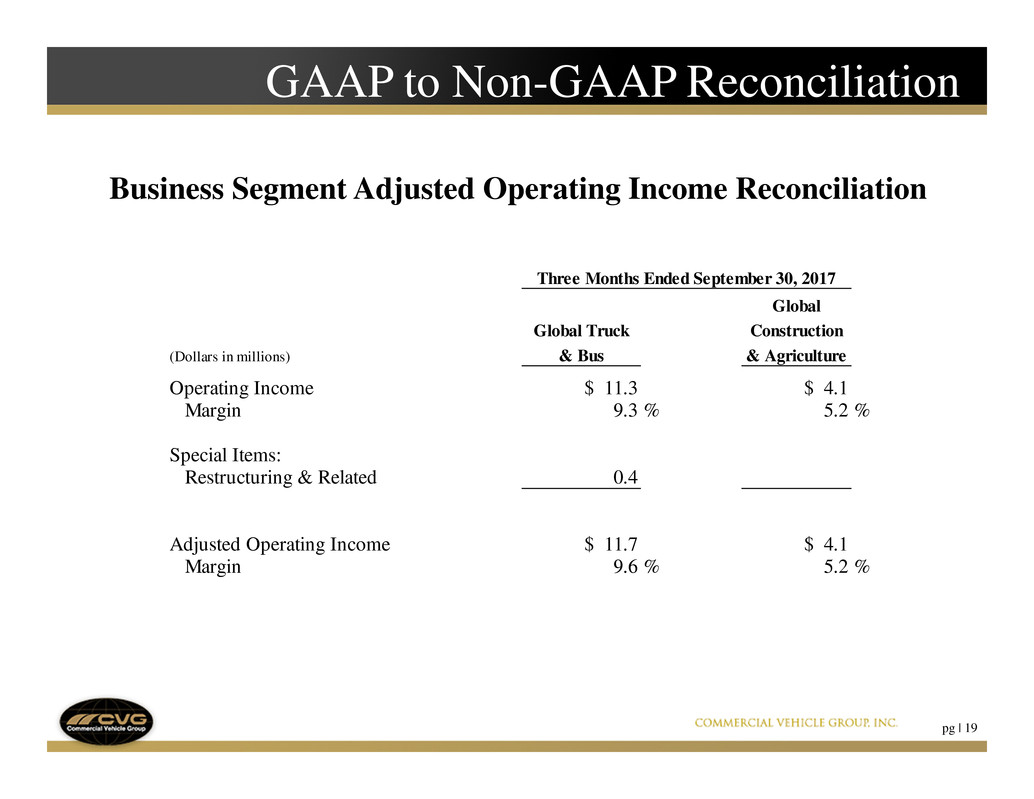
pg | 19 GAAP to Non-GAAP Reconciliation Business Segment Adjusted Operating Income Reconciliation Global Global Truck Construction (Dollars in millions) & Bus & Agriculture Operating Income $ 11.3 $ 4.1 Margin 9.3 % 5.2 % Special Items: Restructuring & Related 0.4 Adjusted Operating Income $ 11.7 $ 4.1 Margin 9.6 % 5.2 % Three Months Ended September 30, 2017