Exhibit (c)-(2)
eLong, Inc. Fairness Analysis Presented to the Special Committee of Independent Directors February 4, 2016 The information contained herein is of a confidential nature and is intended for the use of the persons or firm to whom it is furnished by us. Reproduction, publication, or dissemination of any portion hereof may not be made without prior approval of Duff & Phelps, LLC and its affiliates.
2 CONFIDENTIAL Duff & Phelps Disclaimer • The following pages contain materials that are being provided by Duff & Phelps, LLC (“ Duff & Phelps ”) to the special committee of independent directors (the “ Special Committee ”) of the board of directors (the “ Board of Directors ”) of eLong, Inc . (“ eLong ” or the “ Company ”) in the context of a meeting of the Special Committee held to consider the Proposed Transaction (as defined herein) . • The accompanying materials are, and any Opinion (as defined herein) will be, compiled and presented on a confidential basis solely for the use and benefit of the Special Committee in connection with their evaluation of the Proposed Transaction, and may not be distributed to any other party, publicly disclosed, or relied upon for any other purpose without the prior written consent of Duff & Phelps . • Because these materials were prepared for use in the context of an oral presentation to the Special Committee, whose members are familiar with the business and affairs of the Company, neither the Company nor Duff & Phelps, nor any of their respective legal or financial advisors or accountants, take any responsibility for the accuracy or completeness of any of the materials if used by persons other than the Special Committee . • These materials are not intended to represent an Opinion and shall not be treated, construed, used or relied upon in any way as an opinion, report, appraisal relating to the fairness of the Proposed Transaction . These materials are intended to serve as discussion materials for the Special Committee and as a summary of the basis upon which Duff & Phelps may render an Opinion, and are incomplete without reference to, and should be viewed solely in conjunction with, the discussion between Duff & Phelps and the Special Committee . • The accompanying material does not, and any Opinion provided by Duff & Phelps will not : (i) address the merits of the underlying business decision of the Special Committee, the Board of Directors or the Company or any other party to the Proposed Transaction to enter into the Proposed Transaction versus any alternative strategy or transaction ; (ii) constitute a recommendation to the Special Committee, the Board of Directors, the Company or any other person including security holders of the Company as to how such person should vote or as to any other specific action that should be taken in connection with the Proposed Transaction ; or (iii) create any fiduciary duty on the part of Duff & Phelps to any party . • The information utilized in preparing this presentation was obtained from the Company and from public sources . Any estimates and forecasts contained herein have been prepared by or are based on discussions with the senior management of the Company and involve numerous and significant subjective determinations, which may or may not prove to be correct . No representation or warranty, expressed or implied, is made as to the accuracy or completeness of such information and nothing contained herein is, or shall be relied upon as, a representation, whether as to the past or the future . Duff & Phelps did not independently verify such information . • No selected company or selected transaction used in our analysis is directly comparable to the Company or the Proposed Transaction . • Duff & Phelps’ affiliate, Duff & Phelps Securities, LLC (“ DPS ”), has acted as financial advisor to the Special Committee providing such financial and market related advice and assistance as requested by the Special Committee in connection with the Proposed Transaction, and will receive a fee for certain investment banking services if requested by the Special Committee .

3 CONFIDENTIAL Table of Contents 1. Introduction and Transaction Overview 2. Valuation Analysis – Discounted Cash Flow Analysis – Selected Public Companies / M&A Transactions Analysis Appendix 1. Assumptions, Qualifications, and Limiting Conditions 2. Summary of Premiums Paid – Supplemental
Introduction and Transaction Overview Section 01

5 CONFIDENTIAL Introduction and Transaction Overview The Engagement • Duff & Phelps was retained by the Special Committee and the Company to serve as independent financial advisor to the Special Committee (solely in its capacity as such) . • Specifically , Duff & Phelps has been asked to provide an opinion (the “ Opinion ”) to the Special Committee as to the fairness , from a financial point of view, to (i) the holders of (a) ordinary shares of the Company that are designated as “Ordinary Shares” with a par value of US $ 0 . 01 per share (each, an “Ordinary Share”), (b) ordinary shares of the Company that are designated as “High - Vote Ordinary Shares” with a par value of US $ 0 . 01 per share, and (c) preferred shares of the Company with a par value of US $ 0 . 01 per share (each, a “Share” and collectively, the “Shares”), other than the Excluded Shares, the Dissenting Shares (each as defined below) and Shares represented by ADSs (as defined below), and (ii) the holders of American Depositary Shares of the Company, each representing two Shares (each, an “ADS” and collectively, the “ADSs”), other than the ADSs representing the Excluded Shares, of the Merger Consideration (as defined below) to be received by such holders in the Proposed Transaction (as defined below) (without giving effect to any impact of the Proposed Transaction on any particular holder of the Shares or ADSs other than in their capacity as holders of Shares or ADSs) . The Proposed Transaction • It is Duff & Phelps’ understanding that the Company, China E - dragon Holdings Limited, an exempted company incorporated with limited liability under the laws of the Cayman Islands (“Parent”), and China E - dragon Mergersub Limited, an exempted company incorporated with limited liability under the laws of the Cayman Islands and a wholly owned subsidiary of Parent (“Merger Sub”), propose to enter into an Agreement and Plan of Merger (the “Merger Agreement”), dated as of the date hereof, the latest draft of which Duff & Phelps has reviewed is dated February 3 , 2016 . Pursuant to the Merger Agreement, among other things, Merger Sub will merge with and into the Company, with the Company being the surviving entity, and in connection with such merger, (a) each issued and outstanding Share (other than the Excluded Shares, the Dissenting Shares and Shares represented by ADSs) will be cancelled in exchange for the right to receive US $ 9 . 00 in cash per Share without interest (the “Per Share Merger Consideration”), and (b) each issued and outstanding ADS (other than ADSs representing the Excluded Shares), together with the underlying Ordinary Shares represented by such ADS, will be cancelled in exchange for the right to receive US $ 18 . 00 in cash per ADS without interest (the “Per ADS Merger Consideration”, and together with the Per Share Merger Consideration, the “Merger Consideration”) . The above is collectively referred to as the “Proposed Transaction . ” The terms and conditions of the Proposed Transaction are more fully set forth in the Merger Agreement . • For purposes of this Opinion, (i) “Excluded Shares” shall mean, collectively, (a) the Rollover Shares (as defined in the Merger Agreement), (b) Shares (including Shares represented by ADSs) held by Parent, the Company or any of their respective Subsidiaries (as defined in the Merger Agreement), and (c) Shares (including Shares represented by ADSs) held by the Depository (as defined in the Merger Agreement) and reserved for issuance, settlement and allocation upon exercise or vesting of Company Options and/or Company RSU Awards (each as defined in the Merger Agreement) ; and (ii) “Dissenting Shares” shall have the meaning set forth in the Merger Agreement .

6 CONFIDENTIAL Introduction and Transaction Overview Scope of Analysis Duff & Phelps has made such reviews, analyses and inquiries as it has deemed necessary and appropriate under the circumstances . Duff & Phelps also took into account its assessment of general economic, market and financial conditions, as well as its experience in securities and business valuation, in general, and with respect to similar transactions, in particular . Duff & Phelps’ procedures, investigations, and financial analysis with respect to the preparation of its analysis included , but were not limited to, the items summarized below : 1. Reviewed the following documents : - The Company’s annual reports and audited financial statements on Form 20 - F filed with the Securities and Exchange Commission (“ SEC ”) for the fiscal years ended December 31 , 2013 and December 31 , 2014 ; and the Company’s unaudited interim financial statements for the nine months ended September 30 , 2014 and September 30 , 2015 included in the Company’s Form 6 - K filed with the SEC ; - A detailed financial projection model for the fiscal years ending December 31 , 2015 through 2024 , prepared and provided to Duff & Phelps by the management of the Company, upon which Duff & Phelps has relied, with your consent, in performing its analysis (the “ Management Projections ”) ; - Other internal documents relating to the past and current operations, financial conditions, and probable future outlook of the Company, provided to Duff & Phelps by the management of the Company ; - A letter dated January 25 , 2016 from the management of the Company, which made certain representations as to the Management Projections and the underlying assumptions for the Company (the “ Management Representation Letter ”) ; and - Documents related to the Proposed Transaction, including the Merger Agreement, the latest draft of which Duff & Phelps has reviewed is dated February 3 , 2016 ; 2. Discussed the information referred to above and the background and other elements of the Proposed Transaction with the management of the Company ; 3. Discussed with Company management its plans and intentions with respect to the management and operation of the business ; 4. Reviewed the historical trading price and trading volume of the ADSs and the publicly traded securities of certain other companies that Duff & Phelps deemed relevant ; 5. Performed certain valuation and comparative analyses using generally accepted valuation and analytical techniques including a discounted cash flow analysis, an analysis of selected public companies that Duff & Phelps deemed relevant, an analysis of selected transactions that Duff & Phelps deemed relevant, and a review of premiums paid in selected transactions that Duff & Phelps deemed relevant ; and 6. Conducted such other analyses and considered such other factors as Duff & Phelps deemed necessary or appropriate .
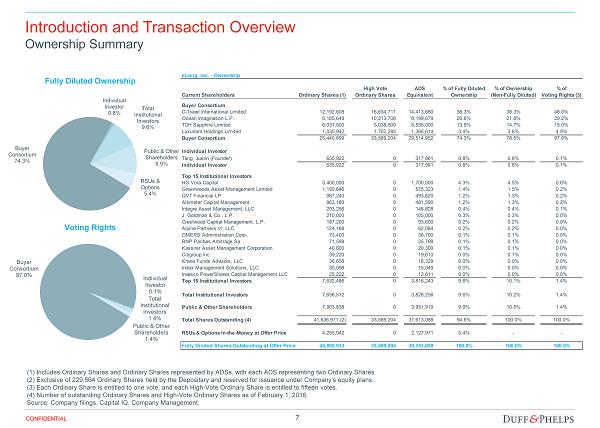
7 CONFIDENTIAL Introduction and Transaction Overview Ownership Summary Fully Diluted Ownership Voting Rights (1) Includes Ordinary Shares and Ordinary Shares represented by ADSs, with each ADS representing two Ordinary Shares. (2) Exclusive of 229,564 Ordinary Shares held by the Depositary and reserved for issuance under Company’s equity plans. (3) Each Ordinary Share is entitled to one vote, and each High - Vote Ordinary Share is entitled to fifteen votes. (4) Number of outstanding Ordinary Shares and High - Vote Ordinary Shares as of February 1, 2016. Source : Company filings, Capital IQ, Company Management. eLong, Inc. - Ownership High Vote ADS % of Fully Diluted % of Ownership % of Current Shareholders Ordinary Shares (1) Ordinary Shares Equivalent Ownership (Non-Fully Diluted) Voting Rights (3) Buyer Consortium C-Travel International Limited 12,192,608 16,634,711 14,413,660 36.3% 38.3% 48.0% Ocean Imagination L.P. 6,185,649 10,213,708 8,199,679 20.6% 21.8% 29.2% TCH Sapphire Limited 6,031,500 5,038,500 5,535,000 13.9% 14.7% 15.0% Luxuriant Holdings Limited 1,030,942 1,702,285 1,366,614 3.4% 3.6% 4.9% Buyer Consortium 25,440,699 33,589,204 29,514,952 74.3% 78.5% 97.0% Individual Investor Tang, Justin (Founder) 635,922 0 317,961 0.8% 0.8% 0.1% Individual Investor 635,922 0 317,961 0.8% 0.8% 0.1% Top 15 Institutional Investors HG Vora Capital 3,400,000 0 1,700,000 4.3% 4.5% 0.6% Greenwoods Asset Management Limited 1,150,646 0 575,323 1.4% 1.5% 0.2% QVT Financial LP 987,240 0 493,620 1.2% 1.3% 0.2% Altimeter Capital Management 963,180 0 481,590 1.2% 1.3% 0.2% Integre Asset Management, LLC 293,256 0 146,628 0.4% 0.4% 0.1% J. Goldman & Co., L.P. 210,000 0 105,000 0.3% 0.3% 0.0% Crestwood Capital Management, L.P. 187,200 0 93,600 0.2% 0.2% 0.0% Alpine Partners VI, LLC 124,168 0 62,084 0.2% 0.2% 0.0% OMERS Administration Corp. 73,400 0 36,700 0.1% 0.1% 0.0% BNP Paribas Arbitrage Sa 71,598 0 35,799 0.1% 0.1% 0.0% Kassirer Asset Management Corporation 40,600 0 20,300 0.1% 0.1% 0.0% Citigroup Inc. 39,220 0 19,610 0.0% 0.1% 0.0% Krane Funds Advisors, LLC 36,658 0 18,329 0.0% 0.0% 0.0% Index Management Solutions, LLC 30,098 0 15,049 0.0% 0.0% 0.0% Invesco PowerShares Capital Management LLC 25,222 0 12,611 0.0% 0.0% 0.0% Top 15 Institutional Investors 7,632,486 0 3,816,243 9.6% 10.1% 1.4% Total Institutional Investors 7,656,512 0 3,828,256 9.6% 10.2% 1.4% Public & Other Shareholders 7,903,838 0 3,951,919 9.9% 10.5% 1.4% Total Shares Outstanding (4) 41,636,971 (2) 33,589,204 37,613,088 94.6% 100.0% 100.0% RSUs & Options In-the-Money at Offer Price 4,255,942 0 2,127,971 5.4% - - Fully Diluted Shares Outstanding at Offer Price 45,892,913 33,589,204 39,741,059 100.0% 100.0% 100.0% Buyer Consortium 74.3% Individual Investor 0.8% Total Institutional Investors 9.6% Public & Other Shareholders 9.9% RSUs & Options 5.4% Buyer Consortium 97.0% Individual Investor 0.1% Total Institutional Investors 1.4% Public & Other Shareholders 1.4%
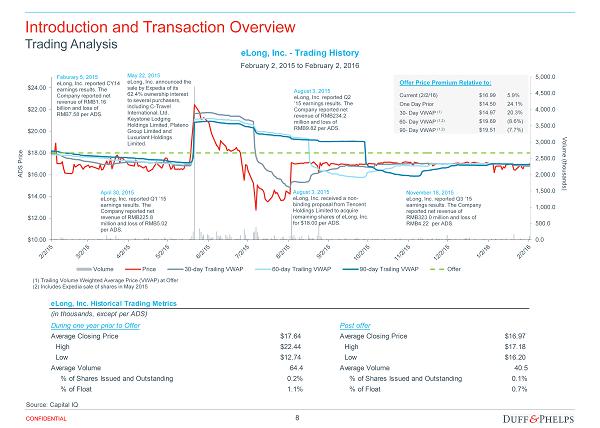
8 CONFIDENTIAL Introduction and Transaction Overview Trading Analysis Source: Capital IQ eLong, Inc. - Trading History February 2, 2015 to February 2, 2016 0.0 500.0 1,000.0 1,500.0 2,000.0 2,500.0 3,000.0 3,500.0 4,000.0 4,500.0 5,000.0 $10.00 $12.00 $14.00 $16.00 $18.00 $20.00 $22.00 $24.00 Volume (thousands) ADS Price Volume Price 30-day Trailing VWAP 60-day Trailing VWAP 90-day Trailing VWAP Offer (1) Trailing Volume Weighted Average Price (VWAP) at Offer (2) Includes Expedia sale of shares in May 2015 Current (2/2/16) Offer Price Premium Relative to: 5.9% 30 - Day VWAP (1) 20.3% (8.6%) (7.7%) 60 - Day VWAP (1,2) 90 - Day VWAP (1,2) One Day Prior 24.1% $16.99 $14.97 $19.69 $19.51 $14.50 August 3, 2015 eLong, Inc. received a non - binding proposal from Tencent Holdings Limited to acquire remaining shares of eLong, Inc. for $18.00 per ADS. Feburary 5, 2015 eLong, Inc. reported CY14 earnings results. The Company reported net revenue of RMB1.16 billion and loss of RMB7.58 per ADS. April 30, 2015 eLong, Inc. reported Q1 ’15 earnings results. The Company reported net revenue of RMB225.8 million and loss of RMB5.02 per ADS. August 3, 2015 eLong, Inc. reported Q2 ’15 earnings results. The Company reported net revenue of RMB234.2 million and loss of RMB9.82 per ADS. November 18 , 2015 eLong, Inc. reported Q3 ’15 earnings results. The Company reported net revenue of RMB323.0 million and loss of RMB4.22 per ADS. May 22, 2015 eLong, Inc. announced the sale by Expedia of its 62.4% ownership interest to several purchasers, including C - Travel International, Ltd. Keystone Lodging Holdings Limited, Plateno Group Limited and Luxuriant Holdings Limited. eLong, Inc. Historical Trading Metrics (in thousands, except per ADS) During one year prior to Offer Post offer Average Closing Price $17.64 Average Closing Price $16.97 High $22.44 High $17.18 Low $12.74 Low $16.20 Average Volume 64.4 Average Volume 40.5 % of Shares Issued and Outstanding 0.2% % of Shares Issued and Outstanding 0.1% % of Float 1.1% % of Float 0.7%
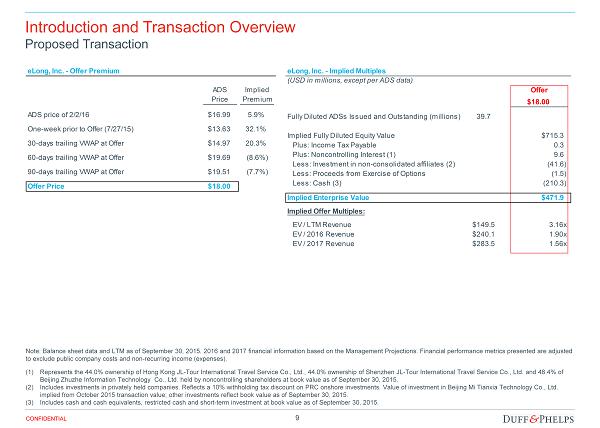
9 CONFIDENTIAL Introduction and Transaction Overview Proposed Transaction Note: Balance sheet data and LTM as of September 30, 2015. 2016 and 2017 financial information based on the Management Projections. Financial p erformance metrics presented are adjusted to exclude public company costs and non - recurring income (expenses). (1) Represents the 44.0% ownership of Hong Kong JL - Tour International Travel Service Co., Ltd., 44.0% ownership of Shenzhen JL - Tour International Travel Service Co., Ltd. and 48.4% of Beijing Zhuzhe Information Technology Co., Ltd. held by noncontrolling shareholders at book value as of September 30, 2015. (2) Includes investments in privately held companies. Reflects a 10% withholding tax discount on PRC onshore investments. Value o f i nvestment in Beijing Mi Tianxia Technology Co., Ltd. implied from October 2015 transaction value; other investments reflect book value as of September 30, 2015. (3) Includes cash and cash equivalents, restricted cash and short - term investment at book value as of September 30, 2015. eLong, Inc. - Offer Premium ADS Implied Price Premium ADS price of 2/2/16 $16.99 5.9% One-week prior to Offer (7/27/15) $13.63 32.1% 30-days trailing VWAP at Offer $14.97 20.3% 60-days trailing VWAP at Offer $19.69 (8.6%) 90-days trailing VWAP at Offer $19.51 (7.7%) Offer Price $18.00 eLong, Inc. - Implied Multiples (USD in millions, except per ADS data) Offer $18.00 Fully Diluted ADSs Issued and Outstanding (millions) 39.7 39.74 1.00 Implied Fully Diluted Equity Value $715.3 Plus: Income Tax Payable $0.3 0.3 Plus: Noncontrolling Interest (1) $9.6 9.6 Less: Investment in non-consolidated affiliates (2) ($41.6) (41.6) Less: Proceeds from Exercise of Options ($1.5) (1.5) Less: Cash (3) ($210.3) (210.3) Implied Enterprise Value $471.9 Implied Offer Multiples: EV / LTM Revenue $149.5 3.16x EV / 2016 Revenue $240.1 1.90x EV / 2017 Revenue $283.5 1.56x
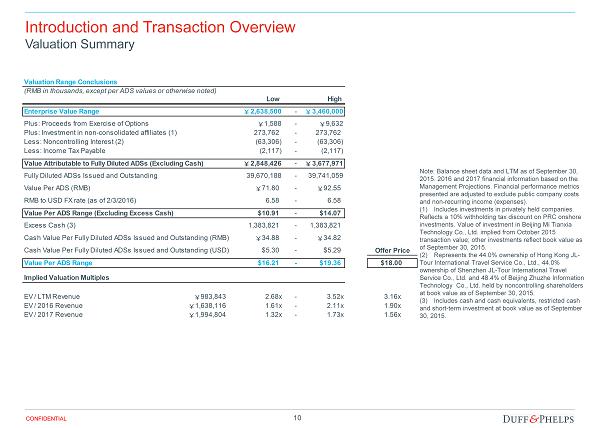
10 CONFIDENTIAL Introduction and Transaction Overview Valuation Summary Note: Balance sheet data and LTM as of September 30 , 2015 . 2016 and 2017 financial information based on the Management Projections. Financial performance metrics presented are adjusted to exclude public company costs and non - recurring income (expenses). (1) Includes investments in privately held companies. Reflects a 10% withholding tax discount on PRC onshore investments. Value of investment in Beijing Mi Tianxia Technology Co., Ltd. implied from October 2015 transaction value; other investments reflect book value as of September 30, 2015. (2) Represents the 44.0% ownership of Hong Kong JL - Tour International Travel Service Co., Ltd., 44.0% ownership of Shenzhen JL - Tour International Travel Service Co., Ltd. and 48.4% of Beijing Zhuzhe Information Technology Co., Ltd. held by noncontrolling shareholders at book value as of September 30, 2015. (3) Includes cash and cash equivalents, restricted cash and short - term investment at book value as of September 30, 2015. Valuation Range Conclusions (RMB in thousands, except per ADS values or otherwise noted) Low High Enterprise Value Range ¥ 2,638,500 - ¥ 3,460,000 Plus: Proceeds from Exercise of Options ¥ 1,588 - ¥ 9,632 Plus: Investment in non-consolidated affiliates (1) 273,762 - 273,762 Less: Noncontrolling Interest (2) (63,306) - (63,306) Less: Income Tax Payable (2,117) - (2,117) Value Attributable to Fully Diluted ADSs (Excluding Cash) ¥ 2,848,426 - ¥ 3,677,971 Fully Diluted ADSs Issued and Outstanding 39,670,188 - 39,741,059 Value Per ADS (RMB) ¥ 71.80 - ¥ 92.55 RMB to USD FX rate (as of 2/3/2016) 6.58 - 6.58 Value Per ADS Range (Excluding Excess Cash) $10.91 - $14.07 Excess Cash (3) 1,383,821 - 1,383,821 Cash Value Per Fully Diluted ADSs Issued and Outstanding (RMB) ¥ 34.88 - ¥ 34.82 Cash Value Per Fully Diluted ADSs Issued and Outstanding (USD) $5.30 - $5.29 Offer Price Value Per ADS Range $16.21 - $19.36 $18.00 Implied Valuation Multiples EV / LTM Revenue ¥ 983,843 2.68x - 3.52x 3.16x EV / 2016 Revenue ¥ 1,638,116 1.61x - 2.11x 1.90x EV / 2017 Revenue ¥ 1,994,804 1.32x - 1.73x 1.56x
Valuation Analysis Section 02

12 CONFIDENTIAL Valuation Analysis Financial Performance Historical and Projected Financial Performance (RMB in thousands) YTD YTD LTM Management Projections 2011A 2012A 2013A 2014A 9/30/2014 9/30/2015 9/30/2015 2015P 2016P 2017P 2018P 2019P 2020P 2021P 2022P 2023P 2024P Accommodation ¥ 447,877 ¥ 608,319 ¥ 858,229 ¥ 938,787 ¥ 728,727 ¥ 687,184 ¥ 897,244 ¥ 930,390 ¥ 1,661,635 ¥ 2,057,548 ¥ 2,502,633 ¥ 2,978,569 ¥ 3,546,438 ¥ 4,138,335 ¥ 4,765,147 ¥ 5,209,261 ¥ 5,373,256 Growth 35.8% 41.1% 9.4% 15.0% (5.7%) (5.9%) (0.9%) 78.6% 23.8% 21.6% 19.0% 19.1% 16.7% 15.1% 9.3% 3.1% Transportation Ticketing ¥ 125,095 ¥ 123,754 ¥ 134,994 ¥ 125,414 ¥ 97,227 ¥ 70,669 ¥ 98,856 ¥ 86,669 ¥ 60,668 ¥ 42,853 ¥ 37,356 ¥ 33,256 ¥ 29,930 ¥ 27,915 ¥ 27,563 ¥ 26,740 ¥ 25,351 Growth (1.1%) 9.1% (7.1%) (5.1%) (27.3%) (23.8%) (30.9%) (30.0%) (29.4%) (12.8%) (11.0%) (10.0%) (6.7%) (1.3%) (3.0%) (5.2%) Other ¥ 52,028 ¥ 65,136 ¥ 85,913 ¥ 99,874 ¥ 72,704 ¥ 25,084 ¥ 52,254 ¥ 29,104 ¥ 20,373 ¥ 21,731 ¥ 25,262 ¥ 29,459 ¥ 30,812 ¥ 32,353 ¥ 33,323 ¥ 34,323 ¥ 35,147 Growth 25.2% 31.9% 16.2% 16.6% (65.5%) (45.7%) (70.9%) (30.0%) 6.7% 16.3% 16.6% 4.6% 5.0% 3.0% 3.0% 2.4% Total Gross Revenue ¥ 624,999 ¥ 797,209 ¥ 1,079,137 ¥ 1,164,075 ¥ 898,658 ¥ 782,937 ¥ 1,048,354 ¥ 1,046,163 ¥ 1,742,677 ¥ 2,122,132 ¥ 2,565,251 ¥ 3,041,283 ¥ 3,607,180 ¥ 4,198,603 ¥ 4,826,033 ¥ 5,270,323 ¥ 5,433,754 Growth 27.6% 35.4% 7.9% 12.5% (12.9%) (11.1%) (10.1%) 66.6% 21.8% 20.9% 18.6% 18.6% 16.4% 14.9% 9.2% 3.1% Net Revenue ¥ 586,177 ¥ 744,244 ¥ 1,009,705 ¥ 1,086,153 ¥ 839,978 ¥ 737,668 ¥ 983,843 ¥ 983,393 ¥ 1,638,116 ¥ 1,994,804 ¥ 2,411,336 ¥ 2,858,806 ¥ 3,390,749 ¥ 3,946,686 ¥ 4,536,471 ¥ 4,954,104 ¥ 5,107,729 Growth 27.0% 35.7% 7.6% 12.2% (12.2%) (10.6%) (9.5%) 66.6% 21.8% 20.9% 18.6% 18.6% 16.4% 14.9% 9.2% 3.1% Gross Profit ¥ 431,313 ¥ 559,264 ¥ 775,740 ¥ 771,868 ¥ 639,022 ¥ 346,589 ¥ 479,434 ¥ 461,639 ¥ 1,029,880 ¥ 1,260,657 ¥ 1,525,174 ¥ 1,833,577 ¥ 2,205,021 ¥ 2,636,846 ¥ 3,162,967 ¥ 3,453,779 ¥ 3,565,451 Margin % 73.6% 75.1% 76.8% 71.1% 76.1% 47.0% 48.7% 46.9% 62.9% 63.2% 63.3% 64.1% 65.0% 66.8% 69.7% 69.7% 69.8% EBITDA ¥ 71,713 - ¥ 31,039 - ¥ 132,750 - ¥ 258,230 - ¥ 84,262- ¥ 749,327 - ¥ 923,295 - ¥ 1,054,645 - ¥ 433,552 - ¥ 303,837 - ¥ 146,343 ¥ 71,464 ¥ 353,282 ¥ 711,649 ¥ 1,181,447 ¥ 1,445,722 ¥ 1,550,997 Margin % 12.2% (4.2%) (13.1%) (23.8%) (10.0%) (101.6%) (93.8%) (107.2%) (26.5%) (15.2%) (6.1%) 2.5% 10.4% 18.0% 26.0% 29.2% 30.4% Growth NM NM NM NM NM NM NM NM NM NM NM 394.4% 101.4% 66.0% 22.4% 7.3% Capital Expenditures ¥ 23,961 ¥ 52,732 ¥ 47,056 ¥ 58,569 ¥ 43,927 ¥ 23,872 ¥ 38,515 ¥ 58,583 ¥ 60,950 ¥ 60,262 ¥ 59,632 ¥ 61,408 ¥ 64,501 ¥ 67,726 ¥ 71,112 ¥ 75,580 ¥ 80,335 % of Net Revenue 4.1% 7.1% 4.7% 5.4% 5.2% 3.2% 3.9% 6.0% 3.7% 3.0% 2.5% 2.1% 1.9% 1.7% 1.6% 1.5% 1.6% % of EBITDA 33.41% NM NM NM NM NM NM NM NM NM NM 85.9% 18.3% 9.5% 6.0% 5.2% 5.2% Note: Financial performance metrics presented are adjusted to exclude public company costs and non-recurring income (expenses). Source: Company filings, Company management
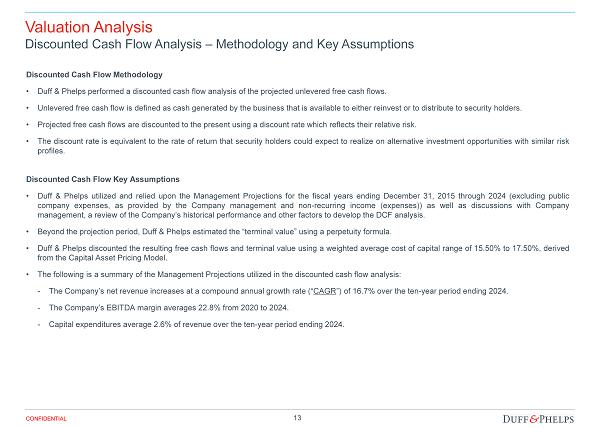
13 CONFIDENTIAL Valuation Analysis Discounted Cash Flow Analysis – Methodology and Key Assumptions Discounted Cash Flow Methodology • Duff & Phelps performed a discounted cash flow analysis of the projected unlevered free cash flows . • Unlevered free cash flow is defined as cash generated by the business that is available to either reinvest or to distribute to security holders . • Projected free cash flows are discounted to the present using a discount rate which reflects their relative risk . • The discount rate is equivalent to the rate of return that security holders could expect to realize on alternative investment opportunities with similar risk profiles . Discounted Cash Flow Key Assumptions • Duff & Phelps utilized and relied upon the Management Projections for the fiscal years ending December 31 , 2015 through 2024 (excluding public company expenses, as provided by the Company management and non - recurring income (expenses)) as well as discussions with Company management, a review of the Company’s historical performance and other factors to develop the DCF analysis . • Beyond the projection period, Duff & Phelps estimated the “terminal value” using a perpetuity formula . • Duff & Phelps discounted the resulting free cash flows and terminal value using a weighted average cost of capital range of 15 . 50 % to 17 . 50 % , derived from the Capital Asset Pricing Model . • The following is a summary of the Management Projections utilized in the discounted cash flow analysis : - The Company’s net revenue increases at a compound annual growth rate (“ CAGR ”) of 16 . 7 % over the ten - year period ending 2024 . - The Company’s EBITDA margin averages 22 . 8 % from 2020 to 2024 . - Capital expenditures average 2 . 6 % of revenue over the ten - year period ending 2024 .
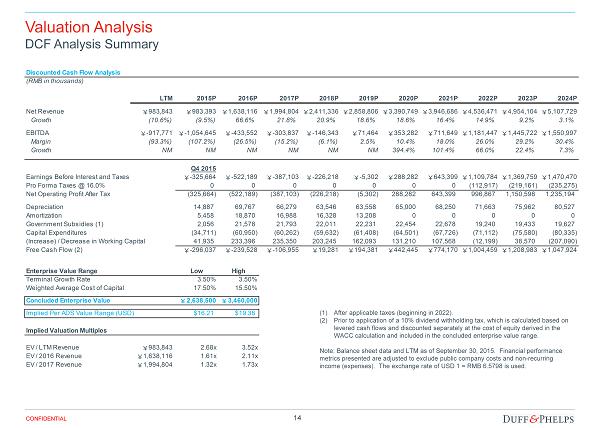
14 CONFIDENTIAL Discounted Cash Flow Analysis (RMB in thousands) LTM 2015P 2016P 2017P 2018P 2019P 2020P 2021P 2022P 2023P 2024P Net Revenue ¥ 983,843 ¥ 983,393 ¥ 1,638,116 ¥ 1,994,804 ¥ 2,411,336 ¥ 2,858,806 ¥ 3,390,749 ¥ 3,946,686 ¥ 4,536,471 ¥ 4,954,104 ¥ 5,107,729 Growth (10.6%) (9.5%) 66.6% 21.8% 20.9% 18.6% 18.6% 16.4% 14.9% 9.2% 3.1% EBITDA ¥ -917,771 ¥ -1,054,645 ¥ -433,552 ¥ -303,837 ¥ -146,343 ¥ 71,464 ¥ 353,282 ¥ 711,649 ¥ 1,181,447 ¥ 1,445,722 ¥ 1,550,997 Margin (93.3%) (107.2%) (26.5%) (15.2%) (6.1%) 2.5% 10.4% 18.0% 26.0% 29.2% 30.4% Growth NM NM NM NM NM NM 394.4% 101.4% 66.0% 22.4% 7.3% Q4 2015 Earnings Before Interest and Taxes ¥ -325,664 ¥ -522,189 ¥ -387,103 ¥ -226,218 ¥ -5,302 ¥ 288,282 ¥ 643,399 ¥ 1,109,784 ¥ 1,369,759 ¥ 1,470,470 Pro Forma Taxes @ 16.0% 0 0 0 0 0 0 0 (112,917) (219,161) (235,275) Net Operating Profit After Tax (325,664) (522,189) (387,103) (226,218) (5,302) 288,282 643,399 996,867 1,150,598 1,235,194 Depreciation 14,887 69,767 66,279 63,546 63,558 65,000 68,250 71,663 75,962 80,527 Amortization 5,458 18,870 16,988 16,328 13,208 0 0 0 0 0 Government Subsidies (1) 2,056 21,578 21,793 22,011 22,231 22,454 22,678 19,240 19,433 19,627 Capital Expenditures (34,711) (60,950) (60,262) (59,632) (61,408) (64,501) (67,726) (71,112) (75,580) (80,335) (Increase) / Decrease in Working Capital 41,935 233,396 235,350 203,245 162,093 131,210 107,568 (12,199) 38,570 (207,090) Free Cash Flow (2) ¥ -296,037 ¥ -239,528 ¥ -106,955 ¥ 19,281 ¥ 194,381 ¥ 442,445 ¥ 774,170 ¥ 1,004,459 ¥ 1,208,983 ¥ 1,047,924 Enterprise Value Range Low High Terminal Growth Rate 3.50% 3.50% Weighted Average Cost of Capital 17.50% 15.50% Concluded Enterprise Value ¥ 2,638,500 ¥ 3,460,000 Implied Per ADS Value Range (USD) $16.21 $19.36 Implied Valuation Multiples EV / LTM Revenue ¥ 983,843 2.68x 3.52x EV / 2016 Revenue ¥ 1,638,116 1.61x 2.11x EV / 2017 Revenue ¥ 1,994,804 1.32x 1.73x Valuation Analysis DCF Analysis Summary (1) After applicable taxes (beginning in 2022). (2) Prior to application of a 10% dividend withholding tax, which is calculated based on levered cash flows and discounted separately at the cost of equity derived in the WACC calculation and included in the concluded enterprise value range . Note: Balance sheet data and LTM as of September 30, 2015. Financial performance metrics presented are adjusted to exclude public company costs and non - recurring income (expenses). The exchange rate of USD 1 = RMB 6.5798 is used.

15 CONFIDENTIAL Valuation Analysis Selected Public Companies / M&A Transactions Analysis Methodology Selected Public Companies Analysis • Duff & Phelps selected ten publicly traded companies in the online travel agencies industry that were deemed relevant to its analysis . • Duff & Phelps analyzed the financial performance of each of the publicly traded companies . Duff & Phelps then analyzed the selected public companies’ trading multiples, including enterprise value to LTM and projected revenue , and enterprise value to LTM and projected EBITDA . • Due to the limited comparability of the selected public companies’ financial metrics relative to those of the Company and negative projected EBITDA and free cash flow for the Company, rather than applying a range of selected multiples from a review of the public companies, Duff & Phelps reviewed various valuation multiples for the Company implied by the valuation range determined from the DCF analysis in the context of the Company’s relative size, forecasted growth in revenue and profits, profit margins, capital spending, revenue mix, and other characteristics that we deemed relevant . Selected M&A Transactions Analysis • Duff & Phelps selected precedent transactions within the online travel agencies industry that it determined to be relevant to its analysis . Duff & Phelps computed the LTM revenue and EBITDA for each of the target companies (where publicly disclosed) . Duff & Phelps then calculated the implied enterprise value to LTM revenue and enterprise value to LTM EBITDA multiples for each transaction . • Due to the limited comparability of the target companies ’ financial metrics relative to those of the Company and negative EBITDA for the Company, Duff & Phelps did not select valuation multiples for the Company based on the Selected M&A Transactions Analysis . None of the companies utilized for comparative purposes in the following analysis are directly comparable to the Company, and none of the transactions utilized for comparative purposes in the following analysis are directly comparable to the Proposed Transaction . Duff & Phelps does not have access to non - public information of any of the companies used for comparative purposes . Accordingly, a complete valuation analysis of the Company and the Proposed Transaction cannot rely solely upon a quantitative review of the selected companies and selected transactions, and involves complex considerations and judgments concerning differences in financial and operating characteristics of such companies and targets, as well as other factors that could affect their value relative to that of the Company . Therefore, the Selected Public Companies / Selected M&A Transactions Analysis is subject to certain limitations .
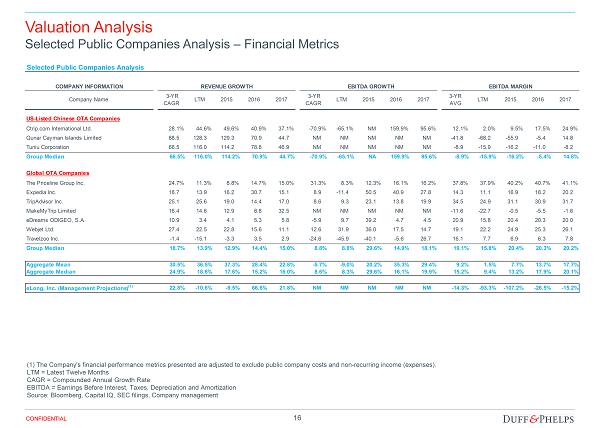
16 CONFIDENTIAL Valuation Analysis Selected Public Companies Analysis – Financial Metrics (1) The Company's financial performance metrics presented are adjusted to exclude public company costs and non - recurring income (expense s ). LTM = Latest Twelve Months CAGR = Compounded Annual Growth Rate EBITDA = Earnings Before Interest, Taxes, Depreciation and Amortization Source: Bloomberg, Capital IQ, SEC filings, Company management Selected Public Companies Analysis ($ in millions, except per share data) COMPANY INFORMATION REVENUE GROWTH EBITDA GROWTH EBITDA MARGIN Company Name 3-YR CAGR LTM 2015 2016 2017 3-YR CAGR LTM 2015 2016 2017 3-YR AVG LTM 2015 2016 2017 US-Listed Chinese OTA Companies Ctrip.com International Ltd. 28.1% 44.6% 49.6% 40.9% 37.1% -70.9% -65.1% NM 159.9% 95.6% 12.1% 2.0% 9.5% 17.5% 24.9% Qunar Cayman Islands Limited 88.5 128.3 129.3 70.9 44.7 NM NM NM NM NM -41.8 -68.2 -55.9 -5.4 14.8 Tuniu Corporation 66.5 116.0 114.2 78.8 46.9 NM NM NM NM NM -8.9 -15.9 -16.2 -11.0 -8.2 Group Median 66.5% 116.0% 114.2% 70.9% 44.7% -70.9% -65.1% NA 159.9% 95.6% -8.9% -15.9% -16.2% -5.4% 14.8% Global OTA Companies The Priceline Group Inc. 24.7% 11.3% 8.8% 14.7% 15.0% 31.3% 8.3% 12.3% 16.1% 16.2% 37.8% 37.9% 40.2% 40.7% 41.1% Expedia Inc. 18.7 13.9 16.2 30.7 15.1 8.9 -11.4 50.5 40.9 27.8 14.3 11.1 16.9 18.2 20.2 TripAdvisor Inc. 25.1 25.6 19.0 14.4 17.0 8.6 9.3 23.1 13.8 19.9 34.5 24.9 31.1 30.9 31.7 MakeMyTrip Limited 16.4 14.6 12.9 8.8 32.5 NM NM NM NM NM -11.6 -22.7 -0.5 -5.5 -1.6 eDreams ODIGEO, S.A. 10.9 3.4 4.1 5.3 5.8 -5.9 9.7 39.2 4.7 4.5 20.9 15.8 20.4 20.3 20.0 Webjet Ltd. 27.4 22.5 22.8 15.6 11.1 12.6 31.9 36.0 17.5 14.7 19.1 22.2 24.9 25.3 26.1 Travelzoo Inc. -1.4 -15.1 -3.3 3.5 2.9 -24.6 -45.9 -40.1 -5.6 26.7 16.1 7.7 6.9 6.3 7.8 Group Median 18.7% 13.9% 12.9% 14.4% 15.0% 8.8% 8.8% 29.6% 14.9% 18.1% 19.1% 15.8% 20.4% 20.3% 20.2% Aggregate Mean 30.5% 36.5% 37.3% 28.4% 22.8% -5.7% -9.0% 20.2% 35.3% 29.4% 9.2% 1.5% 7.7% 13.7% 17.7% Aggregate Median 24.9% 18.6% 17.6% 15.2% 16.0% 8.6% 8.3% 29.6% 16.1% 19.9% 15.2% 9.4% 13.2% 17.9% 20.1% eLong, Inc. (Management Projections) (1) 22.8% -10.6% -9.5% 66.6% 21.8% NM NM NM NM NM -14.3% -93.3% -107.2% -26.5% -15.2%

17 CONFIDENTIAL Valuation Analysis Selected Public Companies Analysis – Valuation Multiples Enterprise Value = (Market Capitalization) + (Debt + Preferred Stock + Non - Controlling Interest) – (Cash & Cash Equivalents ) – (Net Non - Operating Assets) EBITDA = Earnings Before Interest, Taxes, Depreciation and Amortization Source : Bloomberg, Capital IQ, SEC filings Selected Public Companies Analysis ($ in millions, except per share data) COMPANY INFORMATION MARKET DATA ENTERPRISE VALUE AS MULTIPLE OF Company Name HQ Exchange Stock Price on 2/02/16 % of 52- Wk High Enterprise Value LTM EBITDA 2015 EBITDA 2016 EBITDA 2017 EBITDA LTM Revenue 2015 Revenue 2016 Revenue 2017 Revenue US-Listed Chinese OTA Companies Ctrip.com International Ltd. China NasdaqGS $40.36 72.3% $18,795 NM NM 45.7x 23.4x 12.45x 11.26x 7.99x 5.83x Qunar Cayman Islands Limited China NasdaqGM 39.65 72.4 5,014 NM NM NM 22.4 9.71 8.19 4.79 3.31 Tuniu Corporation China NasdaqGM 12.04 58.1 888 NM NM NM NM 0.87 0.77 0.43 0.29 Group Median NA NA 45.7x 22.9x 9.71x 8.19x 4.79x 3.31x Global OTA Companies The Priceline Group Inc. United States NasdaqGS $1,066.79 72.6% $49,857 14.5x 13.5x 11.6x 10.0x 5.50x 5.43x 4.73x 4.11x Expedia Inc. United States NasdaqGS 98.71 71.9 16,538 23.5 14.6 10.4 8.1 2.61 2.47 1.89 1.64 TripAdvisor Inc. United States NasdaqGS 63.00 67.5 8,809 24.1 19.1 16.8 14.0 5.99 5.94 5.19 4.44 MakeMyTrip Limited India NasdaqGS 16.69 65.2 639 NM NM NM NM 4.48 4.32 3.97 3.00 eDreams ODIGEO, S.A. Luxembourg CATS 1.58 35.6 544 7.0 5.4 5.2 5.0 1.11 1.11 1.05 0.99 Webjet Ltd. Australia ASX 3.71 89.9 266 14.2 11.9 10.2 8.9 3.16 2.97 2.57 2.31 Travelzoo Inc. United States NasdaqGS 7.57 54.2 80 7.8 8.4 8.9 7.0 0.60 0.58 0.56 0.55 Group Median 14.4x 12.7x 10.3x 8.5x 3.16x 2.97x 2.57x 2.31x Aggregate Mean 15.2x 12.2x 15.5x 12.3x 4.65x 4.30x 3.32x 2.65x Aggregate Median 14.4x 12.7x 10.4x 9.4x 3.82x 3.64x 3.27x 2.65x

18 CONFIDENTIAL Valuation Analysis Selected M&A Transactions Analysis Source: Capital IQ, company filings, press releases Selected M&A Transactions Analysis ($ in millions) Announced Status Target Name Target Business Description Acquirer Name Enterprise Value LTM Revenue LTM EBITDA EBITDA Margin EV / EBITDA EV / Revenue 12/15/2015 Pending Ikyu Corporation (TSE:2450) Operates various sites that provide reservation services for hotels and restaurants, as well as a site for shopping in Japan Yahoo Japan Corporation (TSE:4689) $771.7 $59.6 $21.7 36.4% 35.6x 12.95x 11/20/2015 Pending AOT GROUP Ltd Provides travel services in the inbound, corporate/government, and leisure sectors throughout Australia, New Zealand, and the South Pacific Helloworld Limited (ASX:HLO) $70.3 $40.3 $10.3 25.6% 6.8x 1.74x 11/10/2015 Closed Mika Tur Seyahat Acenteligi ve Turizm Anonim Sirketi Operates an online travel portal Tatilbudur.com MCI Capital (WSE:MCI); Is Girisim Sermayesi Yatirim Ortakligi AS (IBSE:ISGSY) $19.7 $75.4 NA NA NA 0.26x 11/4/2015 Closed HomeAway, Inc. Operates an online vacation rental property marketplace that enables property owners and managers to market properties for rental to vacation travelers Expedia Inc. (NasdaqGS:EXPE) $3,347.8 $485.3 $61.4 12.6% 54.5x 6.90x 10/12/2015 Pending eTRAVELi Holding AB Owns and operates an online travel agency for flights 7Commerce GmbH $267.0 $77.3 NA NA NA 3.46x 9/17/2015 Pending Asiatravel.com Holdings Ltd (Catalist:5AM) Engages in the sale of tour packages, provision of Internet hotel reservation, and other promotion services worldwide Zhonghong Holding Co., Ltd. (SZSE:000979) $72.5 $62.0 NA NA NA 1.17x 8/18/2015 Closed VEGAS.com, LLC Owns and operates as a city destination travel website Remark Media, Inc. (NasdaqCM:MARK) $18.9 $47.0 $1.0 2.1% 19.5x 0.40x 5/22/2015 Closed eLong Inc. (NasdaqGS:LONG) Operates as a mobile and online travel service provider in China C-Travel International Limited; Keystone Lodging Holdings Limited; Plateno Group Limited; Luxuriant Holdings Limited $827.9 $169.7 NM NM NM 4.88x 2/12/2015 Closed Orbitz Worldwide, Inc. Operates as an online travel company worldwide Expedia Inc. (NasdaqGS:EXPE) $1,691.6 $932.0 $140.0 15.0% 12.1x 1.82x 1/23/2015 Closed Travelocity, Inc. Provides online travel services to leisure and business travelers in the United States and Canada Expedia Inc. (NasdaqGS:EXPE) $280.0 $397.3 NA NA NA 0.70x 7/6/2014 Closed Wotif.com Holdings Limited Provides online travel booking services in Australia, New Zealand, Asia, and internationally Expedia Inc. (NasdaqGS:EXPE) $521.0 $137.4 $59.9 43.6% 8.7x 3.79x 12/3/2013 Closed Stayz Pty Limited Operates a holiday rental Website that connects homeowners and property managers with travelers HomeAway Pty. Ltd. $182.7 $25.4 $11.5 45.3% 15.9x 7.18x 12/21/2012 Closed trivago GmbH Develops and provides an online platform for travelers which provides visitors with up-to-date content, including non-commercial travel information with European hotel database Expedia Inc. (NasdaqGS:EXPE) $940.3 $132.5 NA NA NA 7.10x 12/12/2012 Closed ZUJI Properties A.V.V. Operates as an online travel company in the Asia Pacific Webjet Ltd. (ASX:WEB) $25.0 $30.6 NA NA NA 0.82x 11/8/2012 Closed Kayak Software Corporation Provides online travel search services in the United States and internationally The Priceline Group Inc. (NasdaqGS:PCLN) $1,649.3 $282.8 $54.0 19.1% 30.6x 5.83x 6/18/2012 Closed e-tabinet.com, Inc. Operates an e-marketplace for travel-related products NCXX Group Inc. (JASDAQ:6634) $10.7 $0.7 NA NA NA 15.38x 5/21/2012 Closed Thomas Cook (India) Limited (BSE:500413) Provides travel and travel related financial services in India and internationally Fairbridge Capital Private Limited $186.1 $68.7 $15.5 22.5% 12.0x 2.71x Mean 21.7x 4.53x Median 15.9x 3.46x
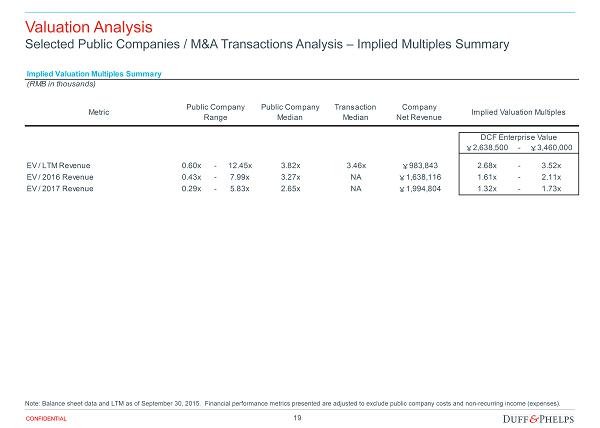
19 CONFIDENTIAL Valuation Analysis Selected Public Companies / M&A Transactions Analysis – Implied Multiples Summary Note: Balance sheet data and LTM as of September 30, 2015. Financial performance metrics presented are adjusted to exclude p ubl ic company costs and non - recurring income (expenses). Implied Valuation Multiples Summary (RMB in thousands) Metric Public Company Median Transaction Median Company Net Revenue Implied Valuation Multiples DCF Enterprise Value ¥ 2,638,500 - ¥ 3,460,000 EV / LTM Revenue 0.60x - 12.45x 3.82x 3.46x ¥ 983,843 2.68x - 3.52x EV / 2016 Revenue 0.43x - 7.99x 3.27x NA ¥ 1,638,116 1.61x - 2.11x EV / 2017 Revenue 0.29x - 5.83x 2.65x NA ¥ 1,994,804 1.32x - 1.73x Public Company Range

Assumptions, Qualifications, and Limiting Conditions Appendix 01

21 CONFIDENTIAL Assumptions, Qualifications, and Limiting Conditions If issued, our Opinion letter will include assumptions, qualifications and limiting conditions similar to the following . This is not meant to be a complete list of the assumptions, qualifications and limiting conditions which will be included in our Opinion letter, if rendered . Assumptions and Reliance – In performing its analyses with respect to the Proposed Transaction, Duff & Phelps, with the Company’s and the Special Committee’s consent and without independent verification : • Relied upon the accuracy, completeness, and fair presentation of all information, data, advice, opinions and representations obt ained from public sources or provided to it from private sources, including Company management; • Relied upon the fact that the Special Committee, the Board of Directors and the Company have been advised by counsel as to al l l egal matters with respect to the Proposed Transaction, including whether all procedures required by law to be taken in connection with the Prop ose d Transaction have been duly, validly and timely taken; • Assumed that any estimates, evaluations, forecasts and projections including, without limitation, the Management Projections, fu rnished to Duff & Phelps were reasonably prepared and based upon the best currently available information and good faith judgment of the person furnis hin g the same, and Duff & Phelps expresses no view or opinion with respect to such estimates, evaluations, forecasts or projections or their underlying as sumptions; • Assumed that the information relating to the Company and the Proposed Transaction provided to Duff & Phelps and representatio ns made by Company management regarding the Company and the Proposed Transaction are accurate in all material respects, did not and does not omi t t o state a material fact in respect of the Company and the Proposed Transaction necessary to make the information not misleading in light of the circu mst ances under which the information was provided; • Assumed that the representations and warranties made by all parties in the Merger Agreement and in the Management Representat ion Letter are true and correct and that each party to the Merger Agreement will fully and duly perform all covenants, undertakings and obligations r equ ired to be performed by such party; • Assumed that the final versions of all documents reviewed by Duff & Phelps in draft form, including the Merger Agreement, con for m in all material respects to the drafts reviewed; • Assumed that there has been no material change in the assets, liabilities, financial condition, results of operations, busine ss, or prospects of the Company since the date of the most recent financial statements and other information made available to Duff & Phelps; • Assumed that all of the conditions required to implement the Proposed Transaction will be satisfied and that the Proposed Tra nsa ction will be completed in accordance with the Merger Agreement without any amendments thereto or any waivers of any terms or conditions thereof, and in a manner that complies in all respects with all applicable laws; and • Assumed that all governmental, regulatory or other consents and approvals necessary for the consummation of the Proposed Tran sac tion will be obtained without any undue delay, limitation, restriction or condition that would have a material effect on the Company or the contemp lat ed benefits expected to be derived in the Proposed Transaction. To the extent that any of the foregoing assumptions or any of the facts on which the Opinion is based prove to be untrue in any material respect, the Opinion cannot and should not be relied upon for any purpose . Furthermore, in Duff & Phelps’ analysis and in connection with the preparation of the Opinion, Duff & Phelps has made numerous assumptions with respect to industry performance, general business, market and economic conditions and other matters, many of which are beyond the control of any party involved in the Proposed Transaction and as to which Duff & Phelps does not express any view or opinion in the Opinion, including as to the reasonableness of such assumptions .
22 CONFIDENTIAL Assumptions, Qualifications, and Limiting Conditions Qualifications – If issued, our Opinion will be qualified by the following: • Duff & Phelps has prepared the Opinion effective as of the date thereof . The Opinion is necessarily based upon upon the information made available to Duff & Phelps as of the date hereof and market, economic, financial and other conditions as they exist and can be evaluated as of the date thereof , and Duff & Phelps disclaims any undertaking or obligation to (i) advise any person of any change in any fact or matter affecting the Opinion which may come or be brought to the attention of Duff & Phelps after the date thereof or (ii) update, revise or reaffirm the Opinion after the date thereof . • Duff & Phelps did not evaluate the Company’s solvency or conduct an independent appraisal or physical inspection of any specific assets or liabilities (contingent or otherwise) of the Company, nor was Duff & Phelps provided with any such appraisal or evaluation other than the contents of the Management Representation Letter . Duff & Phelps did not estimate, and expresses no opinion regarding, the liquidation value of any entity or business . • Duff & Phelps has not been requested to, and did not, (i) initiate any discussions with, or solicit any indications of interest from, third parties with respect to the Proposed Transaction, the assets, businesses or operations of the Company, or any alternatives to the Proposed Transaction, (ii) negotiate the terms of the Proposed Transaction, and therefore, Duff & Phelps has assumed that such terms are the most beneficial terms, from the Company’s perspective, that could, under the circumstances, reasonably be negotiated among the parties to the Merger Agreement and the Proposed Transaction, or (iii) advise the Special Committee or any other party with respect to alternatives to the Proposed Transaction . • Duff & Phelps did not undertake an independent analysis of any potential or actual litigation, regulatory action, possible unasserted claims or other contingent liabilities, to which the Company is or may be a party or is or may be subject, or of any governmental investigation of any possible unasserted claims or other contingent liabilities to which the Company is or may be a party or is or may be subject . • Duff & Phelps is not expressing any opinion as to the market price or value of the Shares or ADSs (or anything else) after the announcement or the consummation of the Proposed Transaction (or any other time) . The Opinion should not be construed as a valuation opinion, a credit rating, a solvency opinion, an analysis of the Company’s creditworthiness , tax advice, or accounting advice . Duff & Phelps has not made, and assumes no responsibility to make, any representation, or render any opinion, as to any legal matter . Duff & Phelps expressly disclaims any responsibility or liability in this regard . • In rendering the Opinion, Duff & Phelps is not expressing any opinion with respect to the amount or nature or any other aspect of any compensation payable to or to be received by any of the Company’s officers, directors, or employees, or any class of such persons, relative to the Merger Consideration, or with respect to the fairness of any such compensation . In addition, this Opinion does not address the fairness to, or any other consideration of, the holders of any class of securities, creditors or other constituencies of the Company, other than the holders of the Shares (other than the Excluded Shares and the Dissenting Shares) and ADSs (other than ADSs representing the Excluded Shares) .

23 CONFIDENTIAL Assumptions, Qualifications, and Limiting Conditions Limiting Conditions – If issued, the use of our Opinion will be strictly limited and will state: • The Opinion is furnished solely for the use and benefit of the Special Committee in connection with its consideration of the Proposed Transaction and is not intended to, and does not, confer any rights or remedies upon any other person, and is not intended to be used, and may not be used, by any other person or for any other purpose, without Duff & Phelps’ prior written consent . • The Opinion (i) does not address the merits of the underlying business decision to enter into the Proposed Transaction versus any alternative strategy or transaction ; (ii) does not address any transaction related to the Proposed Transaction ; (iii) is not a recommendation as to how the Special Committee, the Board of Directors, the Company or any other person including security holders of the Company as to how such person should vote or act with respect to any matters relating to the Proposed Transaction, or whether to proceed with the Proposed Transaction or any related transaction, and (iv) does not indicate that the Merger Consideration is the best possibly attainable under any circumstances ; instead, it merely states whether the Merger Consideration is within a range suggested by certain financial analyses . The decision as to whether to proceed with the Proposed Transaction or any related transaction may depend on an assessment of factors unrelated to the financial analysis on which the Opinion is based . • The Opinion should not be construed as creating any fiduciary duty on the part of Duff & Phelps to any party . • The Opinion is solely that of Duff & Phelps, and Duff & Phelps’ liability in connection with the Opinion shall be limited in accordance with the terms set forth in the engagement letter among Duff & Phelps, Duff & Phelps Securities, LLC (“DPS ”), the Company, and the Special Committee dated August 20 , 2015 (the “ Engagement Letter ”) . • The Opinion is confidential, and its use and disclosure is strictly limited in accordance with the terms set forth in the Engagement Letter .
Summary of Premiums Paid Appendix 02

25 CONFIDENTIAL Summary of Premiums Paid Note: Excludes negative premiums . Source: Capital IQ Premiums Paid Analysis - Going Private Transactions Transactions announced, closed, or effective from January 2012 to January 2016 Premium as a % of Number of Deals One-Day Prior to Announcement Date One-Week Prior to Announcement Date One-Month Prior to Announcement Date One-Day Prior as a % of 52-Week High Overall Mean 396 36.9 37.7 41.7 71.1 Overall Median 23.9 26.6 27.9 78.3 Chinese Companies Mean 89 36.6 36.4 41.9 65.7 Chinese Companies Median 23.4 25.8 28.2 68.3 US-Listed Chinese Companies Mean 79 36.8 36.5 43.3 65.7 US-Listed Chinese Companies Median 23.0 25.8 28.2 66.7 eLong, Inc. 24.1 32.1 10.2 53.2 Premiums Paid Analysis - Tranvel Agencies and Internet Retail Change of Control Transactions Transactions announced, closed, or effective from January 2012 to January 2016 Premium as a % of Number of Deals One-Day Prior to Announcement Date One-Week Prior to Announcement Date One-Month Prior to Announcement Date One-Day Prior as a % of 52-Week High Overall Industry Mean 39 24.1 36.0 39.4 35.5 Overall Industry Median 20.8 29.3 28.8 20.0 Chinese Companies Mean 5 19.9 33.4 40.2 52.6 Chinese Companies Median 15.3 14.9 28.8 55.5 eLong, Inc. 24.1 32.1 10.2 53.2